Sunrise Manor, NV Map & Demographics
Sunrise Manor Map
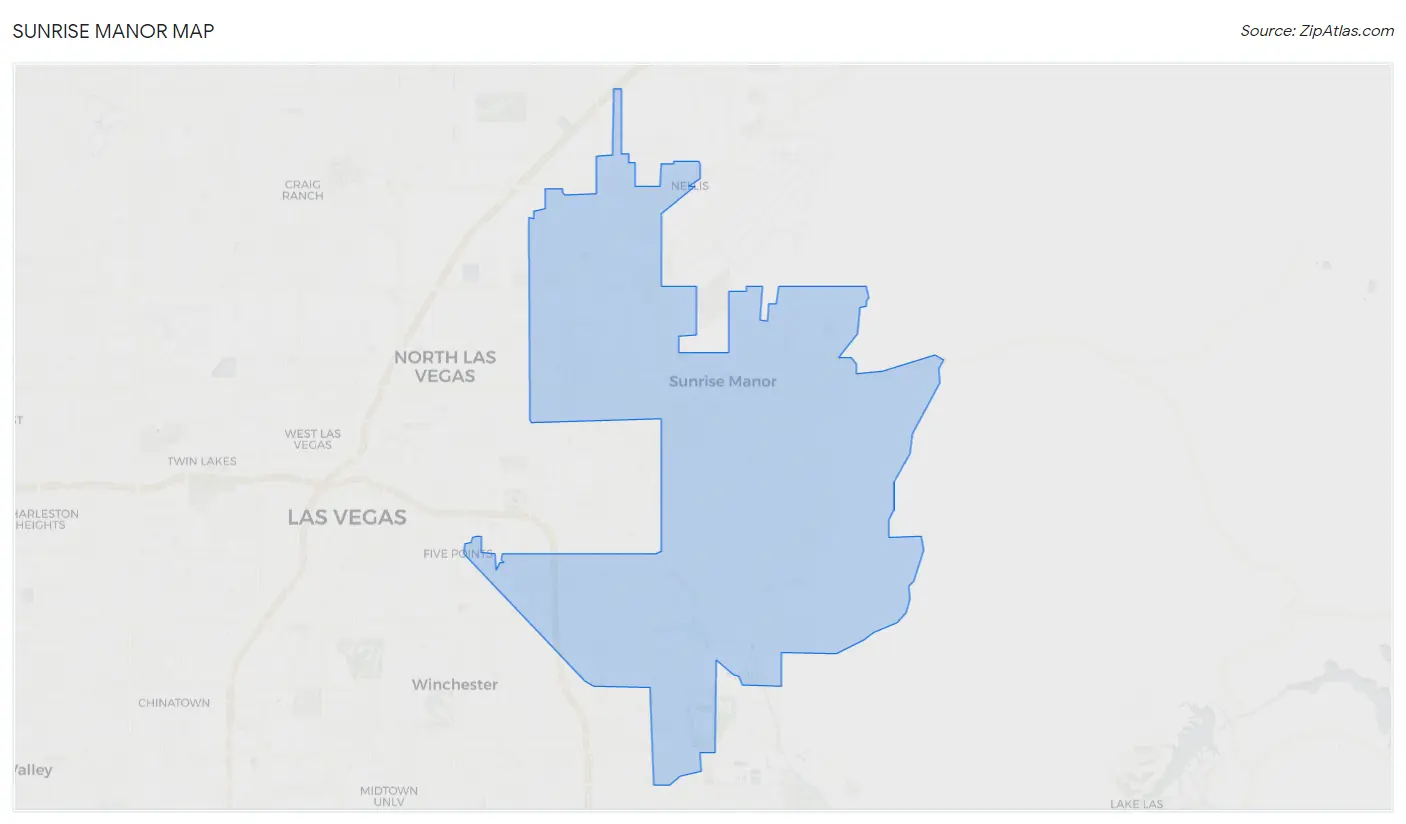
Sunrise Manor Overview
$22,600
PER CAPITA INCOME
$59,634
AVG FAMILY INCOME
$52,476
AVG HOUSEHOLD INCOME
19.3%
WAGE / INCOME GAP [ % ]
80.7¢/ $1
WAGE / INCOME GAP [ $ ]
$11,662
FAMILY INCOME DEFICIT
0.44
INEQUALITY / GINI INDEX
198,325
TOTAL POPULATION
96,602
MALE POPULATION
101,723
FEMALE POPULATION
94.97
MALES / 100 FEMALES
105.30
FEMALES / 100 MALES
33.4
MEDIAN AGE
3.7
AVG FAMILY SIZE
3.1
AVG HOUSEHOLD SIZE
91,596
LABOR FORCE [ PEOPLE ]
61.3%
PERCENT IN LABOR FORCE
9.1%
UNEMPLOYMENT RATE
Income in Sunrise Manor
Income Overview in Sunrise Manor
Per Capita Income in Sunrise Manor is $22,600, while median incomes of families and households are $59,634 and $52,476 respectively.
| Characteristic | Number | Measure |
| Per Capita Income | 198,325 | $22,600 |
| Median Family Income | 44,301 | $59,634 |
| Mean Family Income | 44,301 | $72,344 |
| Median Household Income | 64,271 | $52,476 |
| Mean Household Income | 64,271 | $65,617 |
| Income Deficit | 44,301 | $11,662 |
| Wage / Income Gap (%) | 198,325 | 19.33% |
| Wage / Income Gap ($) | 198,325 | 80.67¢ per $1 |
| Gini / Inequality Index | 198,325 | 0.44 |
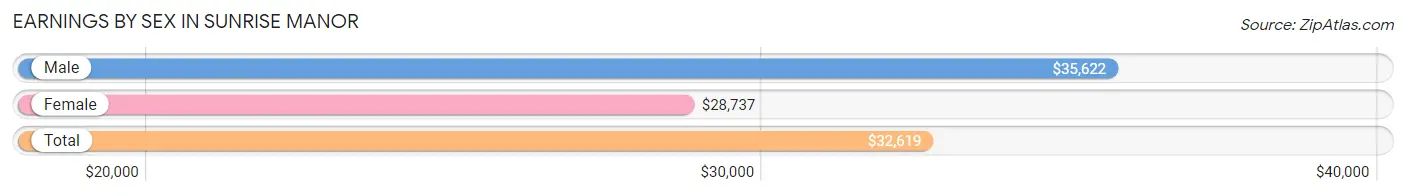
Earnings by Sex in Sunrise Manor
Average Earnings in Sunrise Manor are $32,619, $35,622 for men and $28,737 for women, a difference of 19.3%.
| Sex | Number | Average Earnings |
| Male | 48,789 (52.9%) | $35,622 |
| Female | 43,513 (47.1%) | $28,737 |
| Total | 92,302 (100.0%) | $32,619 |
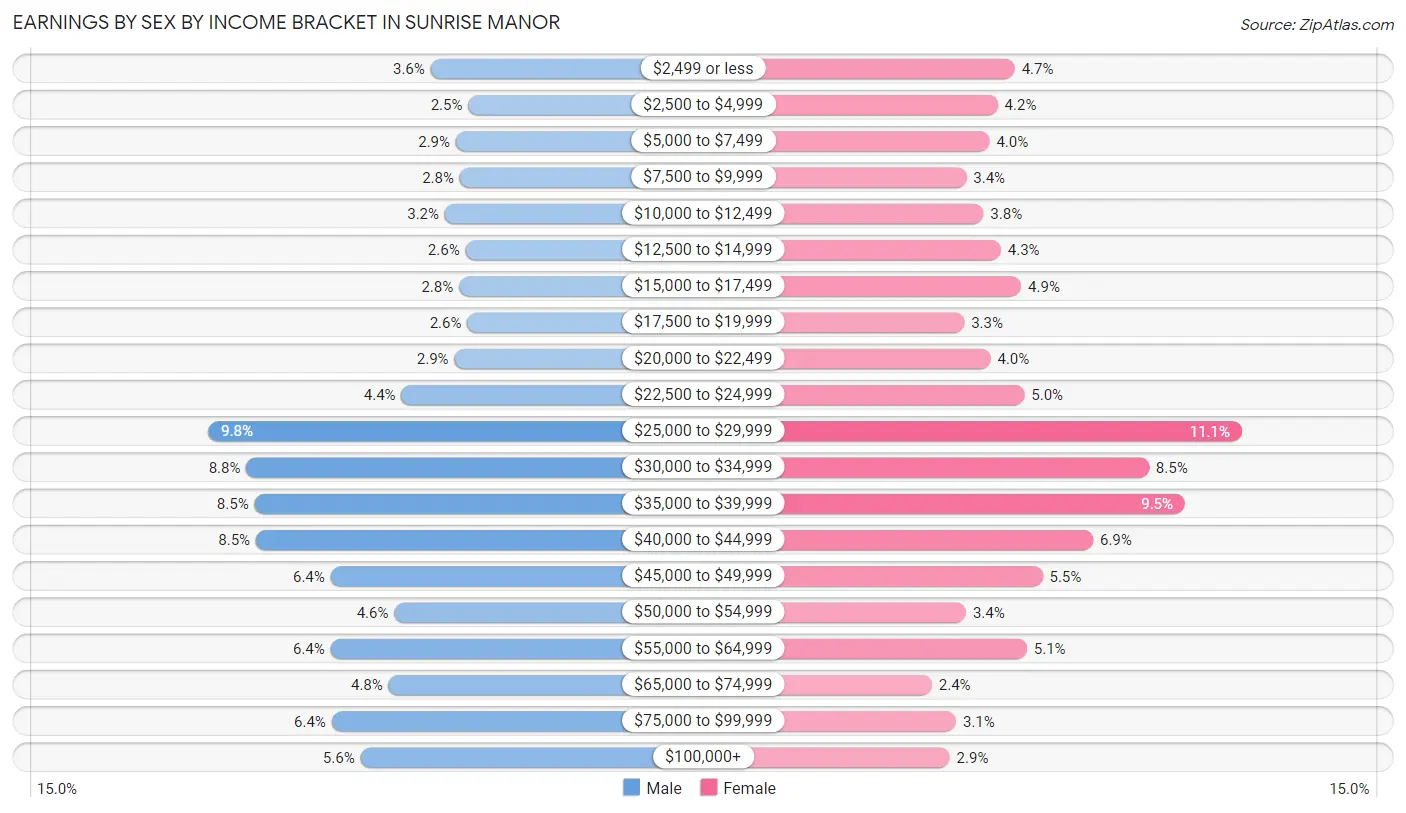
Earnings by Sex by Income Bracket in Sunrise Manor
The most common earnings brackets in Sunrise Manor are $25,000 to $29,999 for men (4,801 | 9.8%) and $25,000 to $29,999 for women (4,829 | 11.1%).
| Income | Male | Female |
| $2,499 or less | 1,752 (3.6%) | 2,052 (4.7%) |
| $2,500 to $4,999 | 1,234 (2.5%) | 1,846 (4.2%) |
| $5,000 to $7,499 | 1,406 (2.9%) | 1,745 (4.0%) |
| $7,500 to $9,999 | 1,350 (2.8%) | 1,460 (3.4%) |
| $10,000 to $12,499 | 1,555 (3.2%) | 1,669 (3.8%) |
| $12,500 to $14,999 | 1,273 (2.6%) | 1,886 (4.3%) |
| $15,000 to $17,499 | 1,361 (2.8%) | 2,130 (4.9%) |
| $17,500 to $19,999 | 1,247 (2.6%) | 1,436 (3.3%) |
| $20,000 to $22,499 | 1,426 (2.9%) | 1,759 (4.0%) |
| $22,500 to $24,999 | 2,151 (4.4%) | 2,173 (5.0%) |
| $25,000 to $29,999 | 4,801 (9.8%) | 4,829 (11.1%) |
| $30,000 to $34,999 | 4,278 (8.8%) | 3,695 (8.5%) |
| $35,000 to $39,999 | 4,167 (8.5%) | 4,135 (9.5%) |
| $40,000 to $44,999 | 4,148 (8.5%) | 3,011 (6.9%) |
| $45,000 to $49,999 | 3,121 (6.4%) | 2,394 (5.5%) |
| $50,000 to $54,999 | 2,249 (4.6%) | 1,457 (3.4%) |
| $55,000 to $64,999 | 3,122 (6.4%) | 2,200 (5.1%) |
| $65,000 to $74,999 | 2,325 (4.8%) | 1,040 (2.4%) |
| $75,000 to $99,999 | 3,108 (6.4%) | 1,337 (3.1%) |
| $100,000+ | 2,715 (5.6%) | 1,259 (2.9%) |
| Total | 48,789 (100.0%) | 43,513 (100.0%) |
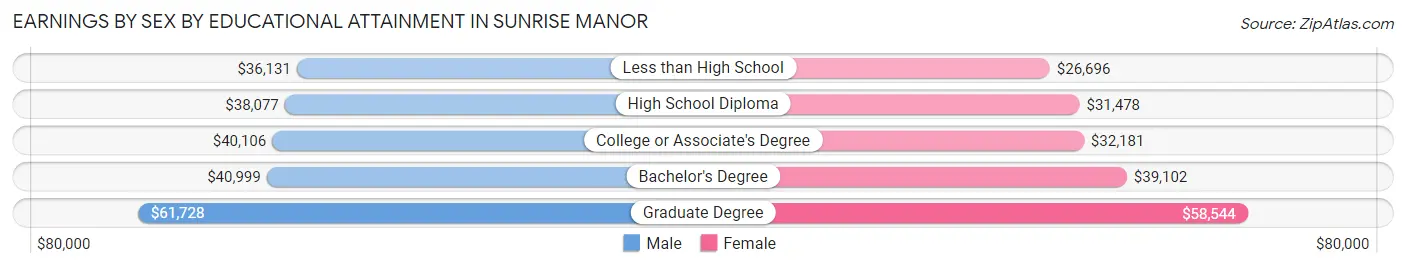
Earnings by Sex by Educational Attainment in Sunrise Manor
Average earnings in Sunrise Manor are $38,340 for men and $31,332 for women, a difference of 18.3%. Men with an educational attainment of graduate degree enjoy the highest average annual earnings of $61,728, while those with less than high school education earn the least with $36,131. Women with an educational attainment of graduate degree earn the most with the average annual earnings of $58,544, while those with less than high school education have the smallest earnings of $26,696.
| Educational Attainment | Male Income | Female Income |
| Less than High School | $36,131 | $26,696 |
| High School Diploma | $38,077 | $31,478 |
| College or Associate's Degree | $40,106 | $32,181 |
| Bachelor's Degree | $40,999 | $39,102 |
| Graduate Degree | $61,728 | $58,544 |
| Total | $38,340 | $31,332 |
Family Income in Sunrise Manor
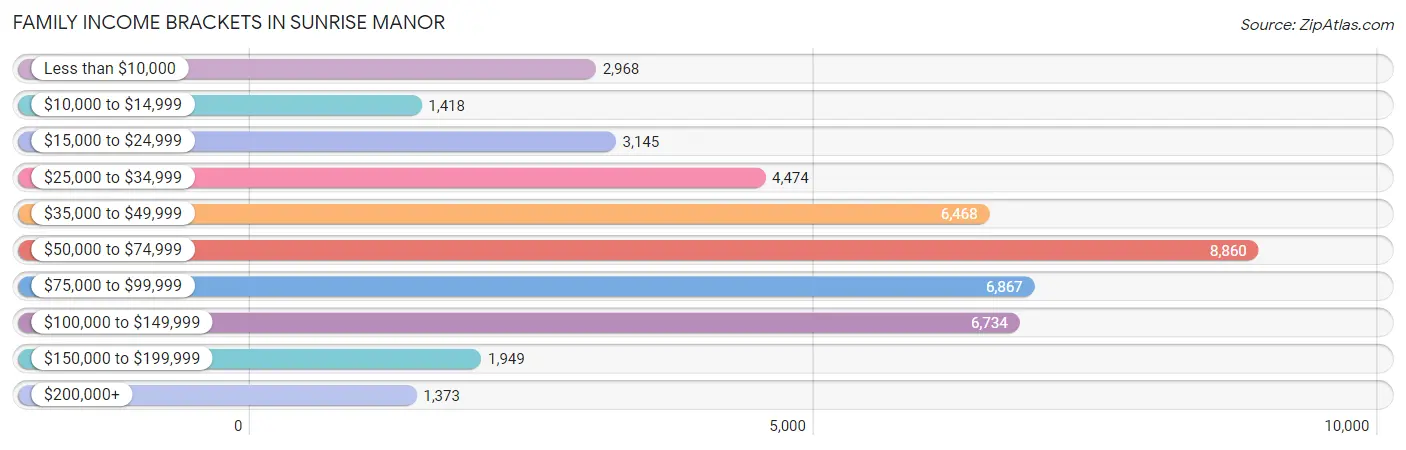
Family Income Brackets in Sunrise Manor
According to the Sunrise Manor family income data, there are 8,860 families falling into the $50,000 to $74,999 income range, which is the most common income bracket and makes up 20.0% of all families. Conversely, the $200,000+ income bracket is the least frequent group with only 1,373 families (3.1%) belonging to this category.
| Income Bracket | # Families | % Families |
| Less than $10,000 | 2,968 | 6.7% |
| $10,000 to $14,999 | 1,418 | 3.2% |
| $15,000 to $24,999 | 3,145 | 7.1% |
| $25,000 to $34,999 | 4,474 | 10.1% |
| $35,000 to $49,999 | 6,468 | 14.6% |
| $50,000 to $74,999 | 8,860 | 20.0% |
| $75,000 to $99,999 | 6,867 | 15.5% |
| $100,000 to $149,999 | 6,734 | 15.2% |
| $150,000 to $199,999 | 1,949 | 4.4% |
| $200,000+ | 1,373 | 3.1% |
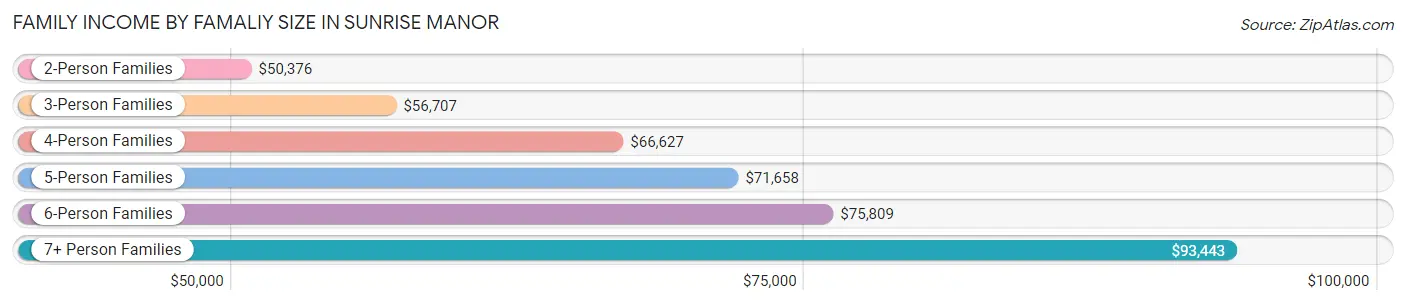
Family Income by Famaliy Size in Sunrise Manor
7+ person families (1,830 | 4.1%) account for the highest median family income in Sunrise Manor with $93,443 per family, while 2-person families (16,342 | 36.9%) have the highest median income of $25,188 per family member.
| Income Bracket | # Families | Median Income |
| 2-Person Families | 16,342 (36.9%) | $50,376 |
| 3-Person Families | 9,403 (21.2%) | $56,707 |
| 4-Person Families | 8,927 (20.2%) | $66,627 |
| 5-Person Families | 5,047 (11.4%) | $71,658 |
| 6-Person Families | 2,752 (6.2%) | $75,809 |
| 7+ Person Families | 1,830 (4.1%) | $93,443 |
| Total | 44,301 (100.0%) | $59,634 |
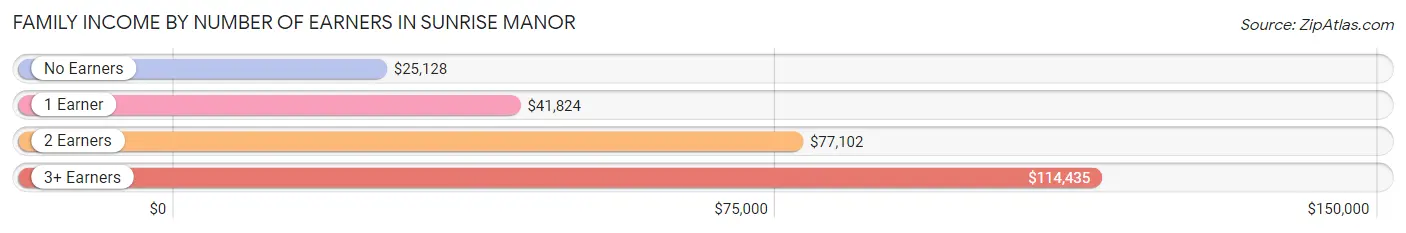
Family Income by Number of Earners in Sunrise Manor
The median family income in Sunrise Manor is $59,634, with families comprising 3+ earners (6,269) having the highest median family income of $114,435, while families with no earners (7,075) have the lowest median family income of $25,128, accounting for 14.1% and 16.0% of families, respectively.
| Number of Earners | # Families | Median Income |
| No Earners | 7,075 (16.0%) | $25,128 |
| 1 Earner | 16,217 (36.6%) | $41,824 |
| 2 Earners | 14,740 (33.3%) | $77,102 |
| 3+ Earners | 6,269 (14.1%) | $114,435 |
| Total | 44,301 (100.0%) | $59,634 |
Household Income in Sunrise Manor
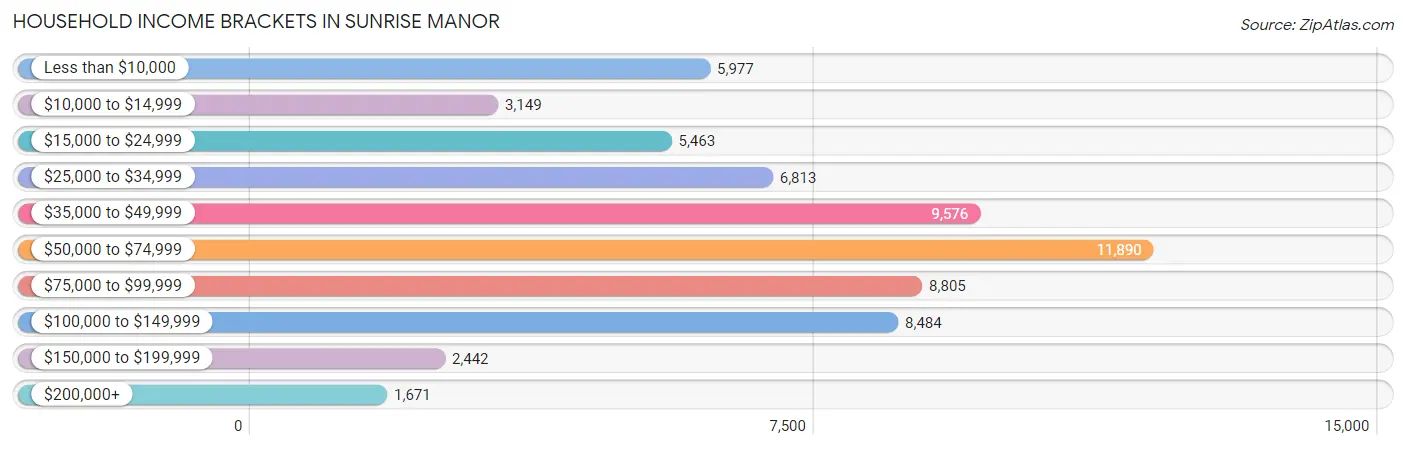
Household Income Brackets in Sunrise Manor
With 11,890 households falling in the category, the $50,000 to $74,999 income range is the most frequent in Sunrise Manor, accounting for 18.5% of all households. In contrast, only 1,671 households (2.6%) fall into the $200,000+ income bracket, making it the least populous group.
| Income Bracket | # Households | % Households |
| Less than $10,000 | 5,977 | 9.3% |
| $10,000 to $14,999 | 3,149 | 4.9% |
| $15,000 to $24,999 | 5,463 | 8.5% |
| $25,000 to $34,999 | 6,813 | 10.6% |
| $35,000 to $49,999 | 9,576 | 14.9% |
| $50,000 to $74,999 | 11,890 | 18.5% |
| $75,000 to $99,999 | 8,805 | 13.7% |
| $100,000 to $149,999 | 8,484 | 13.2% |
| $150,000 to $199,999 | 2,442 | 3.8% |
| $200,000+ | 1,671 | 2.6% |
Household Income by Householder Age in Sunrise Manor
The median household income in Sunrise Manor is $52,476, with the highest median household income of $60,975 found in the 45 to 64 years age bracket for the primary householder. A total of 24,283 households (37.8%) fall into this category. Meanwhile, the 65+ years age bracket for the primary householder has the lowest median household income of $42,692, with 13,552 households (21.1%) in this group.
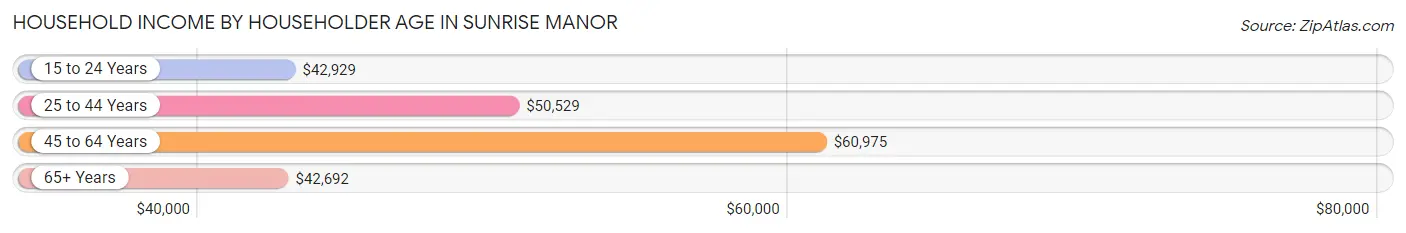
| Income Bracket | # Households | Median Income |
| 15 to 24 Years | 2,828 (4.4%) | $42,929 |
| 25 to 44 Years | 23,608 (36.7%) | $50,529 |
| 45 to 64 Years | 24,283 (37.8%) | $60,975 |
| 65+ Years | 13,552 (21.1%) | $42,692 |
| Total | 64,271 (100.0%) | $52,476 |
Poverty in Sunrise Manor
Income Below Poverty by Sex and Age in Sunrise Manor
With 19.8% poverty level for males and 23.8% for females among the residents of Sunrise Manor, 6 to 11 year old males and 15 year old females are the most vulnerable to poverty, with 2,738 males (32.1%) and 508 females (38.8%) in their respective age groups living below the poverty level.
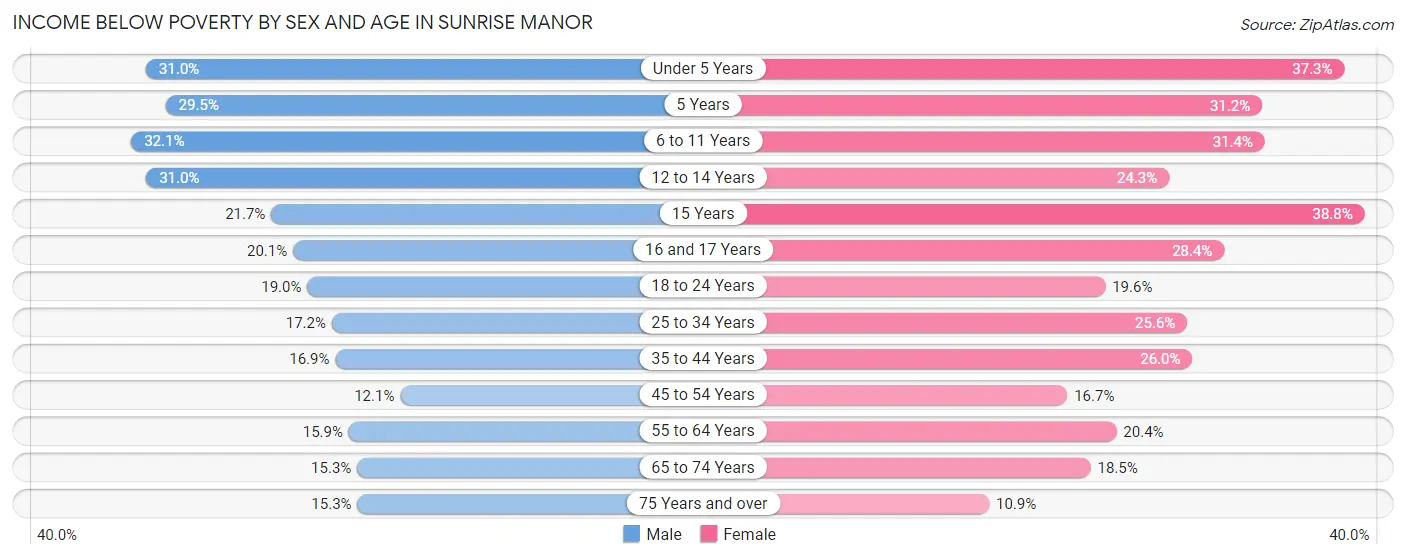
| Age Bracket | Male | Female |
| Under 5 Years | 2,057 (31.0%) | 2,620 (37.3%) |
| 5 Years | 513 (29.5%) | 376 (31.2%) |
| 6 to 11 Years | 2,738 (32.1%) | 3,034 (31.4%) |
| 12 to 14 Years | 1,566 (31.0%) | 1,313 (24.3%) |
| 15 Years | 361 (21.7%) | 508 (38.8%) |
| 16 and 17 Years | 634 (20.1%) | 795 (28.4%) |
| 18 to 24 Years | 1,868 (19.0%) | 2,050 (19.6%) |
| 25 to 34 Years | 2,370 (17.2%) | 3,696 (25.6%) |
| 35 to 44 Years | 2,098 (16.9%) | 3,435 (26.0%) |
| 45 to 54 Years | 1,430 (12.1%) | 2,087 (16.7%) |
| 55 to 64 Years | 1,729 (15.9%) | 2,296 (20.4%) |
| 65 to 74 Years | 1,091 (15.3%) | 1,364 (18.5%) |
| 75 Years and over | 579 (15.3%) | 510 (10.9%) |
| Total | 19,034 (19.8%) | 24,084 (23.8%) |
Income Above Poverty by Sex and Age in Sunrise Manor
According to the poverty statistics in Sunrise Manor, males aged 45 to 54 years and females aged 75 years and over are the age groups that are most secure financially, with 87.9% of males and 89.1% of females in these age groups living above the poverty line.
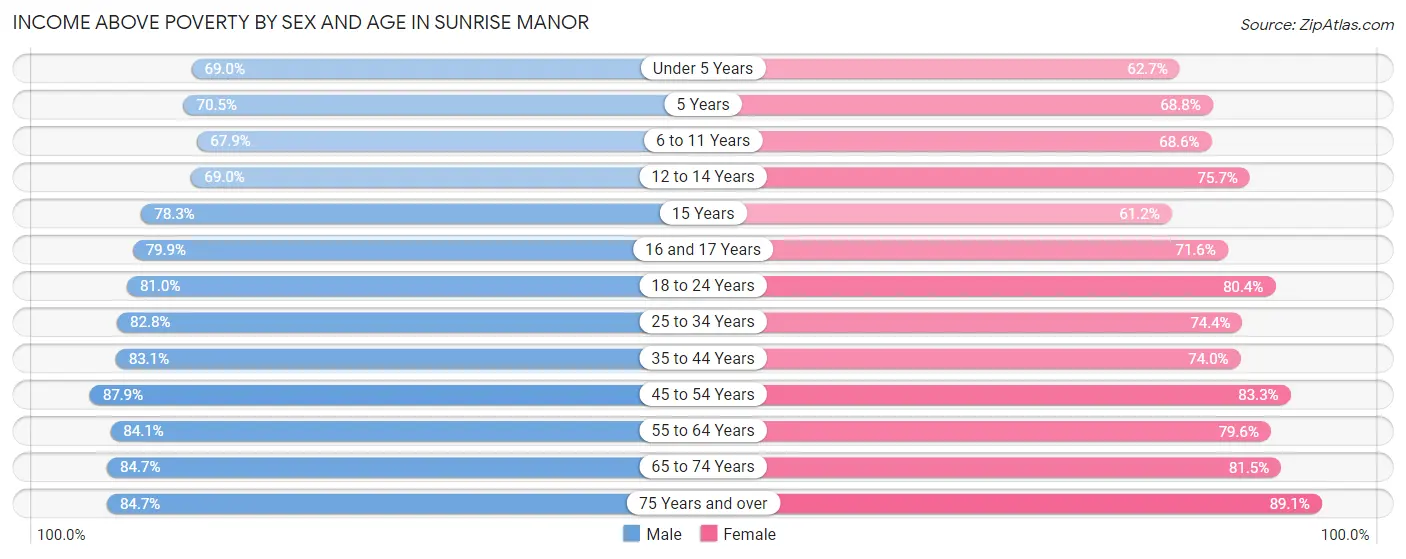
| Age Bracket | Male | Female |
| Under 5 Years | 4,581 (69.0%) | 4,403 (62.7%) |
| 5 Years | 1,224 (70.5%) | 829 (68.8%) |
| 6 to 11 Years | 5,796 (67.9%) | 6,627 (68.6%) |
| 12 to 14 Years | 3,491 (69.0%) | 4,090 (75.7%) |
| 15 Years | 1,303 (78.3%) | 801 (61.2%) |
| 16 and 17 Years | 2,525 (79.9%) | 2,005 (71.6%) |
| 18 to 24 Years | 7,958 (81.0%) | 8,430 (80.4%) |
| 25 to 34 Years | 11,417 (82.8%) | 10,719 (74.4%) |
| 35 to 44 Years | 10,295 (83.1%) | 9,764 (74.0%) |
| 45 to 54 Years | 10,380 (87.9%) | 10,377 (83.3%) |
| 55 to 64 Years | 9,124 (84.1%) | 8,966 (79.6%) |
| 65 to 74 Years | 6,036 (84.7%) | 6,019 (81.5%) |
| 75 Years and over | 3,209 (84.7%) | 4,154 (89.1%) |
| Total | 77,339 (80.2%) | 77,184 (76.2%) |
Income Below Poverty Among Married-Couple Families in Sunrise Manor
The poverty statistics for married-couple families in Sunrise Manor show that 10.1% or 2,506 of the total 24,870 families live below the poverty line. Families with 5 or more children have the highest poverty rate of 43.2%, comprising of 101 families. On the other hand, families with no children have the lowest poverty rate of 5.7%, which includes 738 families.
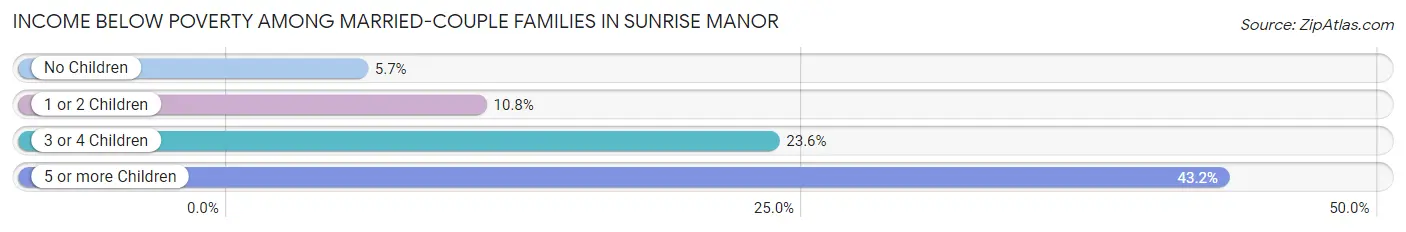
| Children | Above Poverty | Below Poverty |
| No Children | 12,317 (94.4%) | 738 (5.7%) |
| 1 or 2 Children | 7,429 (89.2%) | 901 (10.8%) |
| 3 or 4 Children | 2,485 (76.4%) | 766 (23.6%) |
| 5 or more Children | 133 (56.8%) | 101 (43.2%) |
| Total | 22,364 (89.9%) | 2,506 (10.1%) |
Income Below Poverty Among Single-Parent Households in Sunrise Manor
According to the poverty data in Sunrise Manor, 18.0% or 1,084 single-father households and 33.5% or 4,497 single-mother households are living below the poverty line. Among single-father households, those with 5 or more children have the highest poverty rate, with 35 households (51.5%) experiencing poverty. Likewise, among single-mother households, those with 5 or more children have the highest poverty rate, with 356 households (61.2%) falling below the poverty line.
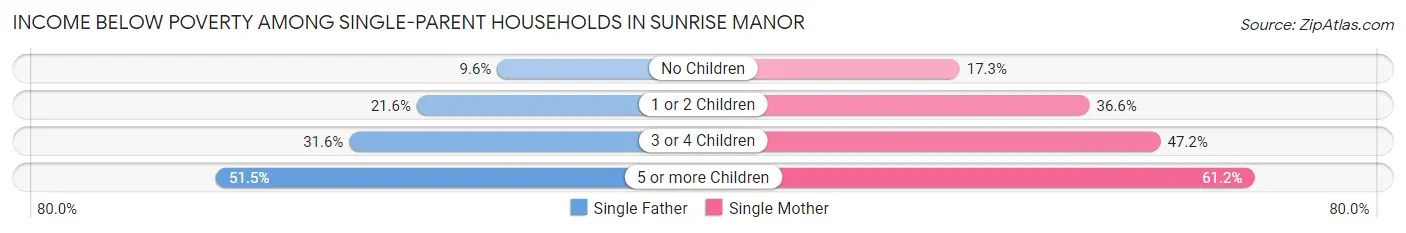
| Children | Single Father | Single Mother |
| No Children | 248 (9.6%) | 693 (17.3%) |
| 1 or 2 Children | 559 (21.6%) | 2,503 (36.6%) |
| 3 or 4 Children | 242 (31.6%) | 945 (47.2%) |
| 5 or more Children | 35 (51.5%) | 356 (61.2%) |
| Total | 1,084 (18.0%) | 4,497 (33.5%) |
Income Below Poverty Among Married-Couple vs Single-Parent Households in Sunrise Manor
The poverty data for Sunrise Manor shows that 2,506 of the married-couple family households (10.1%) and 5,581 of the single-parent households (28.7%) are living below the poverty level. Within the married-couple family households, those with 5 or more children have the highest poverty rate, with 101 households (43.2%) falling below the poverty line. Among the single-parent households, those with 5 or more children have the highest poverty rate, with 391 household (60.2%) living below poverty.
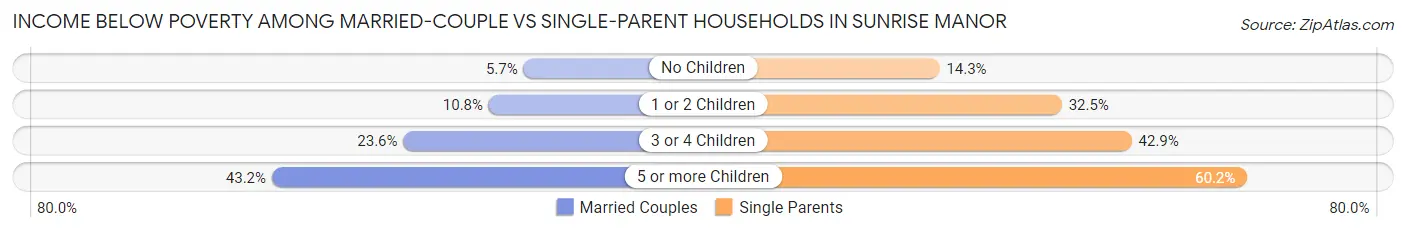
| Children | Married-Couple Families | Single-Parent Households |
| No Children | 738 (5.7%) | 941 (14.3%) |
| 1 or 2 Children | 901 (10.8%) | 3,062 (32.5%) |
| 3 or 4 Children | 766 (23.6%) | 1,187 (42.9%) |
| 5 or more Children | 101 (43.2%) | 391 (60.2%) |
| Total | 2,506 (10.1%) | 5,581 (28.7%) |
Race in Sunrise Manor
The most populous races in Sunrise Manor are Hispanic or Latino (109,864 | 55.4%), White / Caucasian (76,616 | 38.6%), and Some other Race (48,021 | 24.2%).
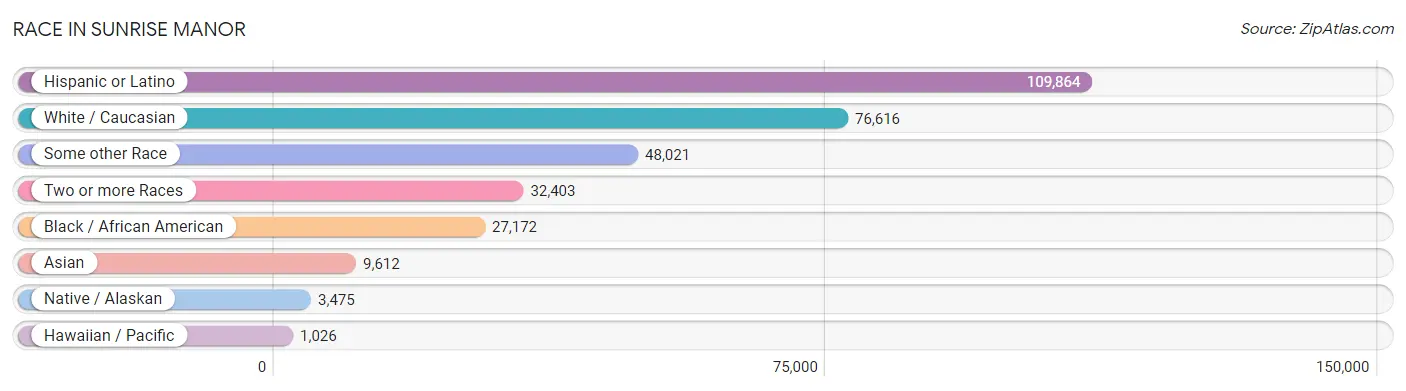
| Race | # Population | % Population |
| Asian | 9,612 | 4.9% |
| Black / African American | 27,172 | 13.7% |
| Hawaiian / Pacific | 1,026 | 0.5% |
| Hispanic or Latino | 109,864 | 55.4% |
| Native / Alaskan | 3,475 | 1.8% |
| White / Caucasian | 76,616 | 38.6% |
| Two or more Races | 32,403 | 16.3% |
| Some other Race | 48,021 | 24.2% |
| Total | 198,325 | 100.0% |
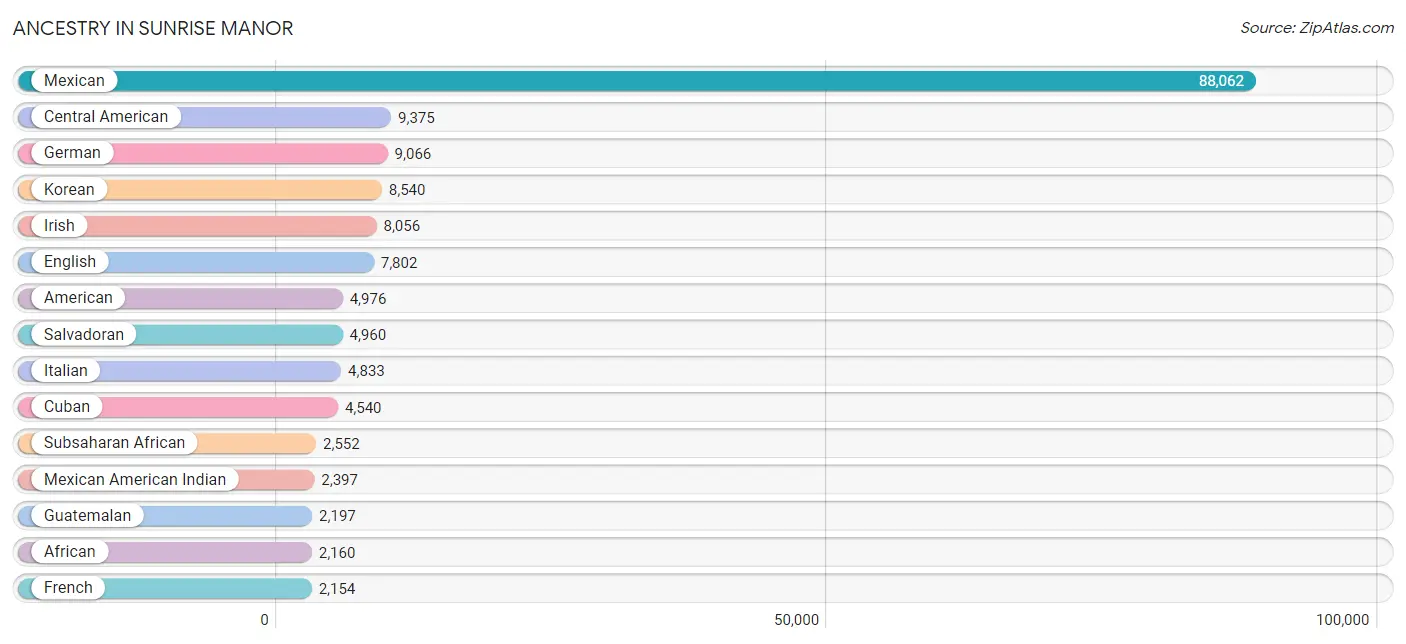
Ancestry in Sunrise Manor
The most populous ancestries reported in Sunrise Manor are Mexican (88,062 | 44.4%), Central American (9,375 | 4.7%), German (9,066 | 4.6%), Korean (8,540 | 4.3%), and Irish (8,056 | 4.1%), together accounting for 62.1% of all Sunrise Manor residents.
| Ancestry | # Population | % Population |
| Afghan | 114 | 0.1% |
| African | 2,160 | 1.1% |
| Alaska Native | 14 | 0.0% |
| American | 4,976 | 2.5% |
| Apache | 482 | 0.2% |
| Arab | 758 | 0.4% |
| Argentinean | 155 | 0.1% |
| Armenian | 197 | 0.1% |
| Assyrian / Chaldean / Syriac | 43 | 0.0% |
| Australian | 28 | 0.0% |
| Austrian | 104 | 0.1% |
| Bangladeshi | 8 | 0.0% |
| Basque | 62 | 0.0% |
| Belgian | 32 | 0.0% |
| Belizean | 121 | 0.1% |
| Bermudan | 15 | 0.0% |
| Bhutanese | 908 | 0.5% |
| Blackfeet | 193 | 0.1% |
| Bolivian | 21 | 0.0% |
| Brazilian | 142 | 0.1% |
| British | 407 | 0.2% |
| Bulgarian | 4 | 0.0% |
| Burmese | 305 | 0.2% |
| Canadian | 93 | 0.1% |
| Cape Verdean | 24 | 0.0% |
| Celtic | 85 | 0.0% |
| Central American | 9,375 | 4.7% |
| Central American Indian | 637 | 0.3% |
| Cherokee | 690 | 0.4% |
| Chilean | 31 | 0.0% |
| Chippewa | 28 | 0.0% |
| Choctaw | 203 | 0.1% |
| Colombian | 493 | 0.3% |
| Colville | 114 | 0.1% |
| Comanche | 51 | 0.0% |
| Costa Rican | 101 | 0.1% |
| Creek | 153 | 0.1% |
| Croatian | 69 | 0.0% |
| Cuban | 4,540 | 2.3% |
| Czech | 152 | 0.1% |
| Czechoslovakian | 79 | 0.0% |
| Danish | 402 | 0.2% |
| Dominican | 457 | 0.2% |
| Dutch | 591 | 0.3% |
| Eastern European | 87 | 0.0% |
| Ecuadorian | 144 | 0.1% |
| Egyptian | 36 | 0.0% |
| English | 7,802 | 3.9% |
| Estonian | 23 | 0.0% |
| Ethiopian | 119 | 0.1% |
| European | 1,117 | 0.6% |
| Filipino | 14 | 0.0% |
| Finnish | 101 | 0.1% |
| French | 2,154 | 1.1% |
| French American Indian | 5 | 0.0% |
| French Canadian | 791 | 0.4% |
| German | 9,066 | 4.6% |
| German Russian | 15 | 0.0% |
| Greek | 374 | 0.2% |
| Guamanian / Chamorro | 518 | 0.3% |
| Guatemalan | 2,197 | 1.1% |
| Guyanese | 21 | 0.0% |
| Honduran | 780 | 0.4% |
| Hopi | 90 | 0.1% |
| Hungarian | 530 | 0.3% |
| Icelander | 15 | 0.0% |
| Indian (Asian) | 1,107 | 0.6% |
| Inupiat | 7 | 0.0% |
| Iranian | 39 | 0.0% |
| Iraqi | 156 | 0.1% |
| Irish | 8,056 | 4.1% |
| Iroquois | 40 | 0.0% |
| Israeli | 29 | 0.0% |
| Italian | 4,833 | 2.4% |
| Jamaican | 243 | 0.1% |
| Japanese | 343 | 0.2% |
| Jordanian | 17 | 0.0% |
| Korean | 8,540 | 4.3% |
| Laotian | 32 | 0.0% |
| Lebanese | 78 | 0.0% |
| Lithuanian | 62 | 0.0% |
| Luxembourger | 27 | 0.0% |
| Malaysian | 81 | 0.0% |
| Maltese | 6 | 0.0% |
| Menominee | 8 | 0.0% |
| Mexican | 88,062 | 44.4% |
| Mexican American Indian | 2,397 | 1.2% |
| Native Hawaiian | 1,231 | 0.6% |
| Navajo | 379 | 0.2% |
| Nicaraguan | 941 | 0.5% |
| Nigerian | 222 | 0.1% |
| Northern European | 94 | 0.1% |
| Norwegian | 995 | 0.5% |
| Osage | 12 | 0.0% |
| Paiute | 102 | 0.1% |
| Pakistani | 885 | 0.4% |
| Palestinian | 8 | 0.0% |
| Panamanian | 396 | 0.2% |
| Peruvian | 324 | 0.2% |
| Polish | 1,383 | 0.7% |
| Portuguese | 754 | 0.4% |
| Potawatomi | 35 | 0.0% |
| Pueblo | 23 | 0.0% |
| Puerto Rican | 1,941 | 1.0% |
| Romanian | 111 | 0.1% |
| Russian | 363 | 0.2% |
| Salvadoran | 4,960 | 2.5% |
| Samoan | 217 | 0.1% |
| Scandinavian | 238 | 0.1% |
| Scotch-Irish | 438 | 0.2% |
| Scottish | 1,454 | 0.7% |
| Serbian | 96 | 0.1% |
| Shoshone | 43 | 0.0% |
| Sioux | 98 | 0.1% |
| Slavic | 24 | 0.0% |
| Slovak | 65 | 0.0% |
| Slovene | 24 | 0.0% |
| South African | 3 | 0.0% |
| South American | 1,360 | 0.7% |
| South American Indian | 12 | 0.0% |
| Spaniard | 992 | 0.5% |
| Spanish | 442 | 0.2% |
| Spanish American | 15 | 0.0% |
| Sri Lankan | 631 | 0.3% |
| Subsaharan African | 2,552 | 1.3% |
| Swedish | 709 | 0.4% |
| Swiss | 219 | 0.1% |
| Syrian | 24 | 0.0% |
| Thai | 776 | 0.4% |
| Tongan | 5 | 0.0% |
| Trinidadian and Tobagonian | 10 | 0.0% |
| Turkish | 21 | 0.0% |
| Ugandan | 4 | 0.0% |
| Ukrainian | 144 | 0.1% |
| Uruguayan | 16 | 0.0% |
| Ute | 44 | 0.0% |
| Venezuelan | 176 | 0.1% |
| Welsh | 401 | 0.2% |
| West Indian | 48 | 0.0% |
| Yugoslavian | 12 | 0.0% |
| Yuman | 5 | 0.0% |
| Yup'ik | 49 | 0.0% | View All 142 Rows |
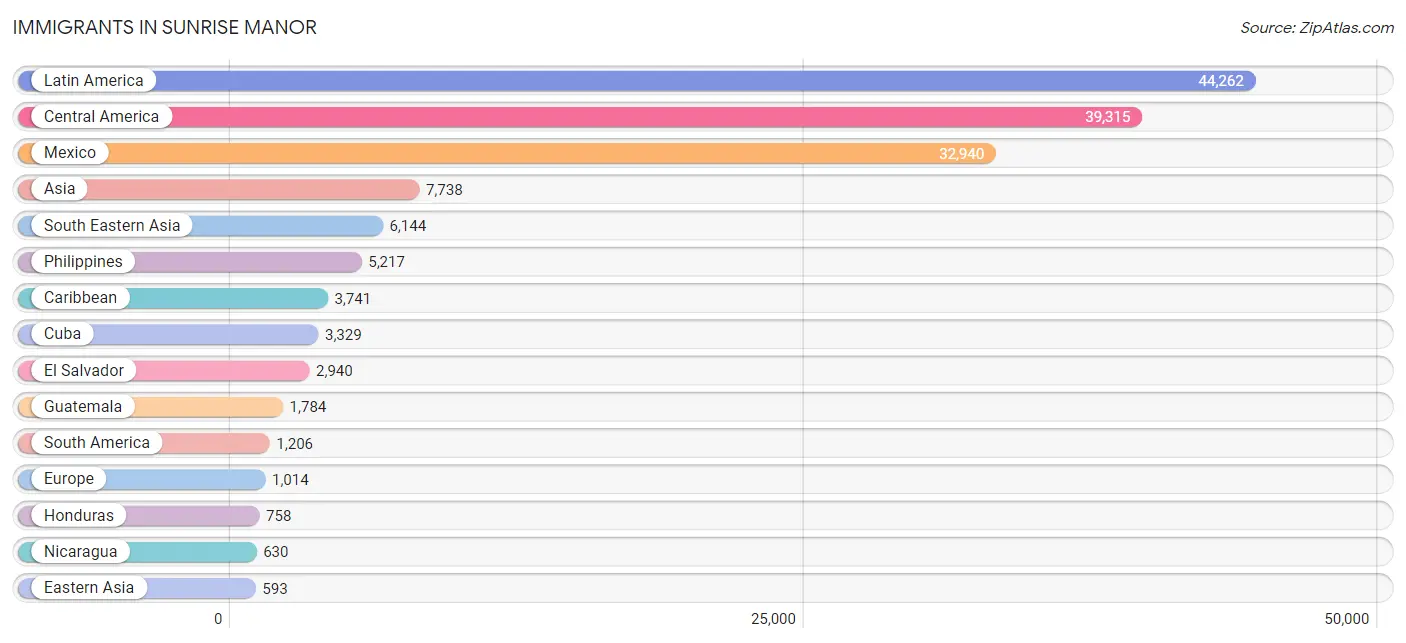
Immigrants in Sunrise Manor
The most numerous immigrant groups reported in Sunrise Manor came from Latin America (44,262 | 22.3%), Central America (39,315 | 19.8%), Mexico (32,940 | 16.6%), Asia (7,738 | 3.9%), and South Eastern Asia (6,144 | 3.1%), together accounting for 65.8% of all Sunrise Manor residents.
| Immigration Origin | # Population | % Population |
| Afghanistan | 92 | 0.1% |
| Africa | 397 | 0.2% |
| Argentina | 38 | 0.0% |
| Armenia | 13 | 0.0% |
| Asia | 7,738 | 3.9% |
| Australia | 9 | 0.0% |
| Austria | 59 | 0.0% |
| Belgium | 12 | 0.0% |
| Belize | 27 | 0.0% |
| Bolivia | 21 | 0.0% |
| Bosnia and Herzegovina | 16 | 0.0% |
| Brazil | 170 | 0.1% |
| Bulgaria | 4 | 0.0% |
| Cambodia | 169 | 0.1% |
| Canada | 314 | 0.2% |
| Caribbean | 3,741 | 1.9% |
| Central America | 39,315 | 19.8% |
| Chile | 31 | 0.0% |
| China | 231 | 0.1% |
| Colombia | 394 | 0.2% |
| Costa Rica | 83 | 0.0% |
| Croatia | 6 | 0.0% |
| Cuba | 3,329 | 1.7% |
| Czechoslovakia | 3 | 0.0% |
| Denmark | 4 | 0.0% |
| Dominican Republic | 298 | 0.2% |
| Eastern Africa | 231 | 0.1% |
| Eastern Asia | 593 | 0.3% |
| Eastern Europe | 279 | 0.1% |
| Ecuador | 20 | 0.0% |
| El Salvador | 2,940 | 1.5% |
| England | 99 | 0.1% |
| Ethiopia | 145 | 0.1% |
| Europe | 1,014 | 0.5% |
| Fiji | 38 | 0.0% |
| France | 12 | 0.0% |
| Germany | 226 | 0.1% |
| Greece | 23 | 0.0% |
| Guatemala | 1,784 | 0.9% |
| Guyana | 10 | 0.0% |
| Haiti | 9 | 0.0% |
| Honduras | 758 | 0.4% |
| Hong Kong | 69 | 0.0% |
| Hungary | 4 | 0.0% |
| India | 200 | 0.1% |
| Indonesia | 6 | 0.0% |
| Iran | 39 | 0.0% |
| Iraq | 240 | 0.1% |
| Ireland | 7 | 0.0% |
| Israel | 8 | 0.0% |
| Italy | 18 | 0.0% |
| Jamaica | 67 | 0.0% |
| Japan | 221 | 0.1% |
| Jordan | 17 | 0.0% |
| Kazakhstan | 9 | 0.0% |
| Korea | 141 | 0.1% |
| Laos | 116 | 0.1% |
| Latin America | 44,262 | 22.3% |
| Lebanon | 11 | 0.0% |
| Liberia | 36 | 0.0% |
| Mexico | 32,940 | 16.6% |
| Netherlands | 45 | 0.0% |
| Nicaragua | 630 | 0.3% |
| Nigeria | 30 | 0.0% |
| Northern Africa | 19 | 0.0% |
| Northern Europe | 284 | 0.1% |
| Oceania | 99 | 0.1% |
| Pakistan | 80 | 0.0% |
| Panama | 140 | 0.1% |
| Peru | 279 | 0.1% |
| Philippines | 5,217 | 2.6% |
| Poland | 146 | 0.1% |
| Portugal | 19 | 0.0% |
| Romania | 61 | 0.0% |
| Russia | 16 | 0.0% |
| Scotland | 126 | 0.1% |
| Senegal | 22 | 0.0% |
| Sierra Leone | 26 | 0.0% |
| South Africa | 3 | 0.0% |
| South America | 1,206 | 0.6% |
| South Central Asia | 434 | 0.2% |
| South Eastern Asia | 6,144 | 3.1% |
| Southern Europe | 87 | 0.0% |
| Spain | 21 | 0.0% |
| Sri Lanka | 14 | 0.0% |
| Sudan | 7 | 0.0% |
| Switzerland | 10 | 0.0% |
| Syria | 220 | 0.1% |
| Taiwan | 30 | 0.0% |
| Thailand | 421 | 0.2% |
| Trinidad and Tobago | 11 | 0.0% |
| Turkey | 21 | 0.0% |
| Uganda | 64 | 0.0% |
| Ukraine | 6 | 0.0% |
| Uruguay | 16 | 0.0% |
| Venezuela | 197 | 0.1% |
| Vietnam | 215 | 0.1% |
| West Indies | 27 | 0.0% |
| Western Africa | 138 | 0.1% |
| Western Asia | 567 | 0.3% |
| Western Europe | 364 | 0.2% |
| Yemen | 37 | 0.0% | View All 102 Rows |
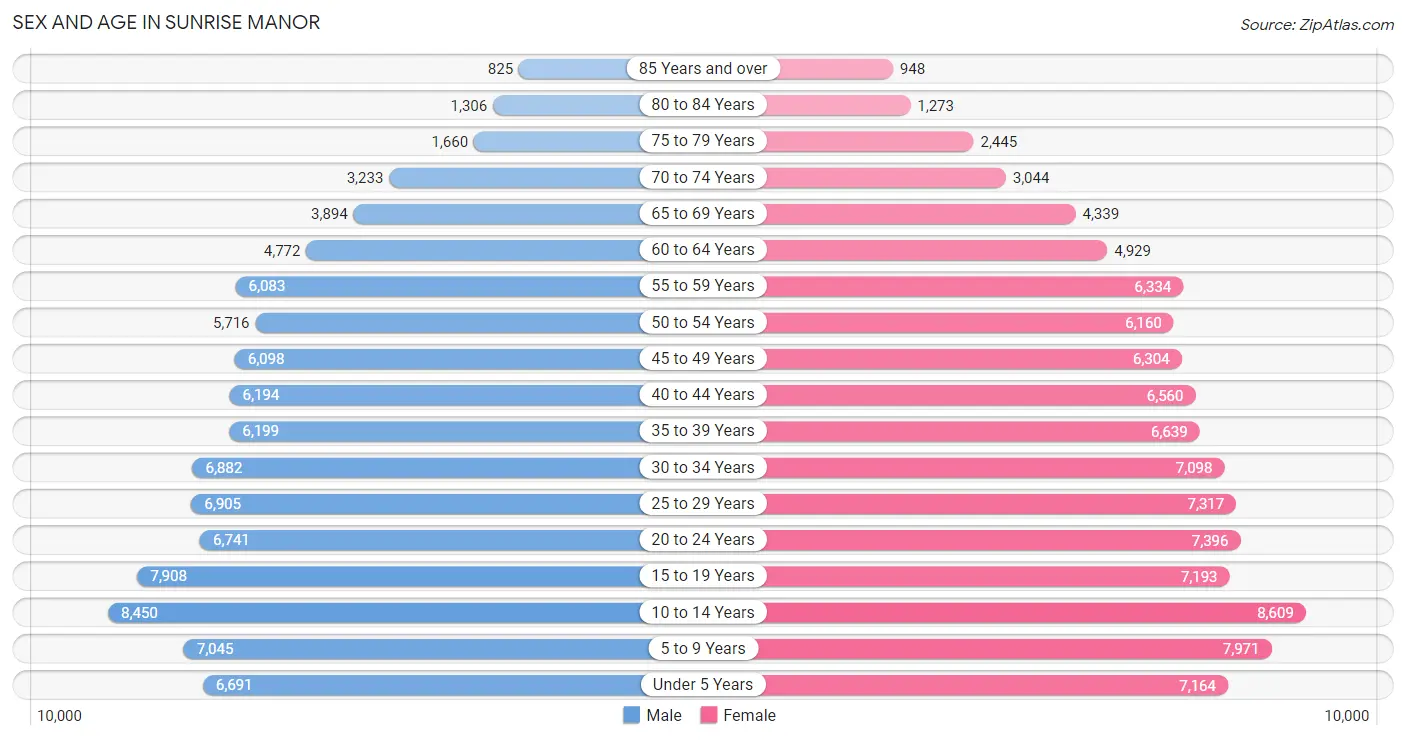
Sex and Age in Sunrise Manor
Sex and Age in Sunrise Manor
The most populous age groups in Sunrise Manor are 10 to 14 Years (8,450 | 8.7%) for men and 10 to 14 Years (8,609 | 8.5%) for women.
| Age Bracket | Male | Female |
| Under 5 Years | 6,691 (6.9%) | 7,164 (7.0%) |
| 5 to 9 Years | 7,045 (7.3%) | 7,971 (7.8%) |
| 10 to 14 Years | 8,450 (8.7%) | 8,609 (8.5%) |
| 15 to 19 Years | 7,908 (8.2%) | 7,193 (7.1%) |
| 20 to 24 Years | 6,741 (7.0%) | 7,396 (7.3%) |
| 25 to 29 Years | 6,905 (7.1%) | 7,317 (7.2%) |
| 30 to 34 Years | 6,882 (7.1%) | 7,098 (7.0%) |
| 35 to 39 Years | 6,199 (6.4%) | 6,639 (6.5%) |
| 40 to 44 Years | 6,194 (6.4%) | 6,560 (6.5%) |
| 45 to 49 Years | 6,098 (6.3%) | 6,304 (6.2%) |
| 50 to 54 Years | 5,716 (5.9%) | 6,160 (6.1%) |
| 55 to 59 Years | 6,083 (6.3%) | 6,334 (6.2%) |
| 60 to 64 Years | 4,772 (4.9%) | 4,929 (4.9%) |
| 65 to 69 Years | 3,894 (4.0%) | 4,339 (4.3%) |
| 70 to 74 Years | 3,233 (3.4%) | 3,044 (3.0%) |
| 75 to 79 Years | 1,660 (1.7%) | 2,445 (2.4%) |
| 80 to 84 Years | 1,306 (1.3%) | 1,273 (1.3%) |
| 85 Years and over | 825 (0.9%) | 948 (0.9%) |
| Total | 96,602 (100.0%) | 101,723 (100.0%) |
Families and Households in Sunrise Manor
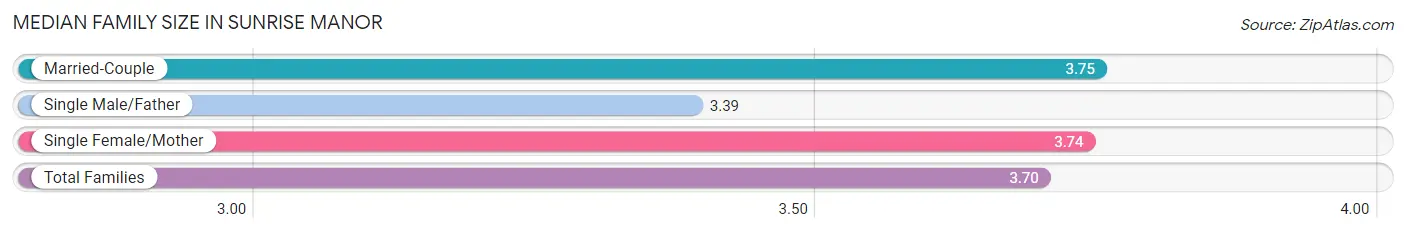
Median Family Size in Sunrise Manor
The median family size in Sunrise Manor is 3.70 persons per family, with married-couple families (24,870 | 56.1%) accounting for the largest median family size of 3.75 persons per family. On the other hand, single male/father families (6,012 | 13.6%) represent the smallest median family size with 3.39 persons per family.
| Family Type | # Families | Family Size |
| Married-Couple | 24,870 (56.1%) | 3.75 |
| Single Male/Father | 6,012 (13.6%) | 3.39 |
| Single Female/Mother | 13,419 (30.3%) | 3.74 |
| Total Families | 44,301 (100.0%) | 3.70 |
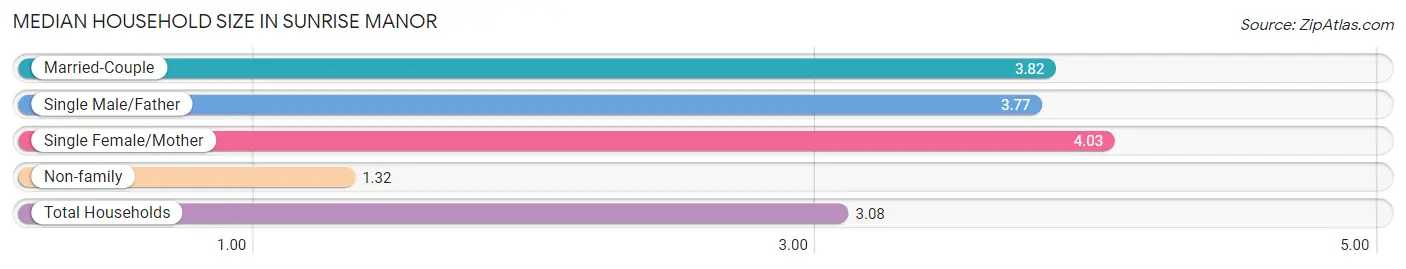
Median Household Size in Sunrise Manor
The median household size in Sunrise Manor is 3.08 persons per household, with single female/mother households (13,419 | 20.9%) accounting for the largest median household size of 4.03 persons per household. non-family households (19,970 | 31.1%) represent the smallest median household size with 1.32 persons per household.
| Household Type | # Households | Household Size |
| Married-Couple | 24,870 (38.7%) | 3.82 |
| Single Male/Father | 6,012 (9.3%) | 3.77 |
| Single Female/Mother | 13,419 (20.9%) | 4.03 |
| Non-family | 19,970 (31.1%) | 1.32 |
| Total Households | 64,271 (100.0%) | 3.08 |
Household Size by Marriage Status in Sunrise Manor
Out of a total of 64,271 households in Sunrise Manor, 44,301 (68.9%) are family households, while 19,970 (31.1%) are nonfamily households. The most numerous type of family households are 2-person households, comprising 14,340, and the most common type of nonfamily households are 1-person households, comprising 15,575.
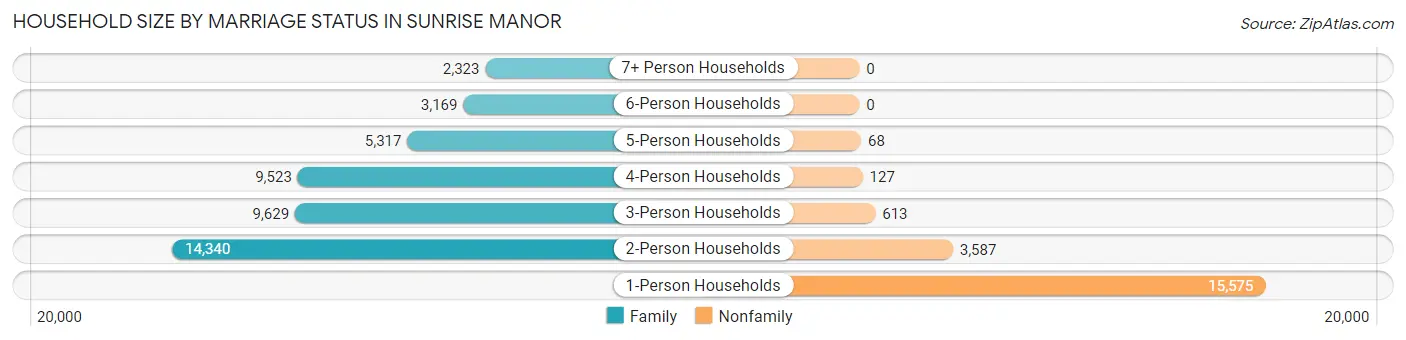
| Household Size | Family Households | Nonfamily Households |
| 1-Person Households | - | 15,575 (24.2%) |
| 2-Person Households | 14,340 (22.3%) | 3,587 (5.6%) |
| 3-Person Households | 9,629 (15.0%) | 613 (0.9%) |
| 4-Person Households | 9,523 (14.8%) | 127 (0.2%) |
| 5-Person Households | 5,317 (8.3%) | 68 (0.1%) |
| 6-Person Households | 3,169 (4.9%) | 0 (0.0%) |
| 7+ Person Households | 2,323 (3.6%) | 0 (0.0%) |
| Total | 44,301 (68.9%) | 19,970 (31.1%) |
Female Fertility in Sunrise Manor
Fertility by Age in Sunrise Manor
Average fertility rate in Sunrise Manor is 61.0 births per 1,000 women. Women in the age bracket of 20 to 34 years have the highest fertility rate with 103.0 births per 1,000 women. Women in the age bracket of 20 to 34 years acount for 73.3% of all women with births.
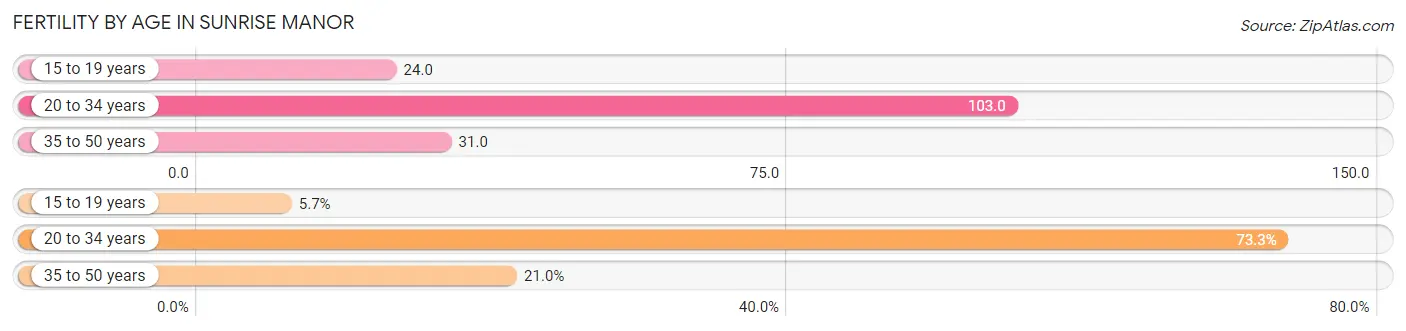
| Age Bracket | Women with Births | Births / 1,000 Women |
| 15 to 19 years | 174 (5.7%) | 24.0 |
| 20 to 34 years | 2,241 (73.3%) | 103.0 |
| 35 to 50 years | 641 (21.0%) | 31.0 |
| Total | 3,056 (100.0%) | 61.0 |
Fertility by Age by Marriage Status in Sunrise Manor
44.2% of women with births (3,056) in Sunrise Manor are married. The highest percentage of unmarried women with births falls into 15 to 19 years age bracket with 100.0% of them unmarried at the time of birth, while the lowest percentage of unmarried women with births belong to 35 to 50 years age bracket with 34.6% of them unmarried.
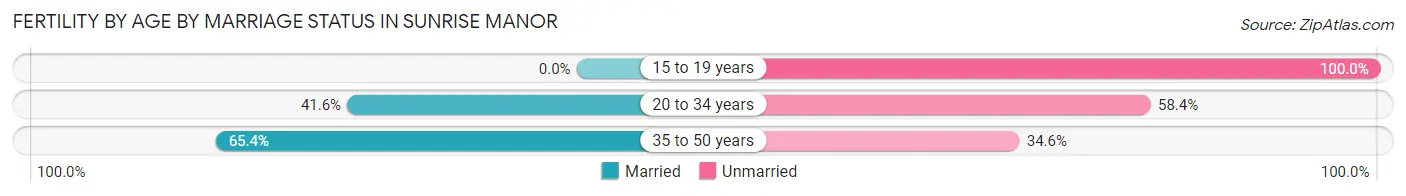
| Age Bracket | Married | Unmarried |
| 15 to 19 years | 0 (0.0%) | 174 (100.0%) |
| 20 to 34 years | 932 (41.6%) | 1,309 (58.4%) |
| 35 to 50 years | 419 (65.4%) | 222 (34.6%) |
| Total | 1,351 (44.2%) | 1,705 (55.8%) |
Fertility by Education in Sunrise Manor
Average fertility rate in Sunrise Manor is 61.0 births per 1,000 women. Women with the education attainment of graduate degree have the highest fertility rate of 101.0 births per 1,000 women, while women with the education attainment of college or associate's degree have the lowest fertility at 57.0 births per 1,000 women. Women with the education attainment of less than high school represent 33.0% of all women with births.
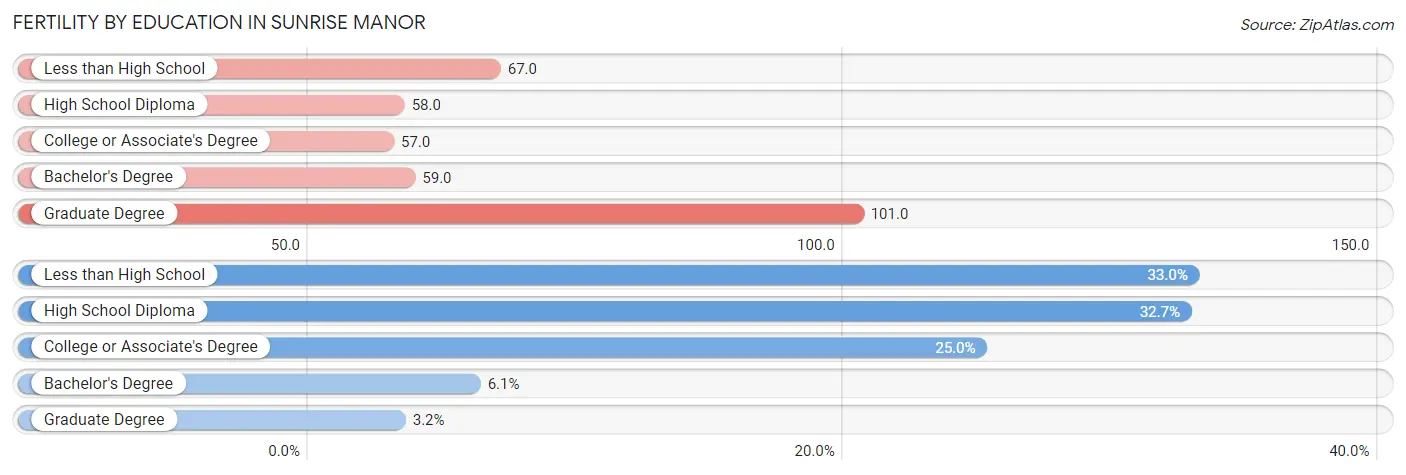
| Educational Attainment | Women with Births | Births / 1,000 Women |
| Less than High School | 1,008 (33.0%) | 67.0 |
| High School Diploma | 999 (32.7%) | 58.0 |
| College or Associate's Degree | 765 (25.0%) | 57.0 |
| Bachelor's Degree | 185 (6.0%) | 59.0 |
| Graduate Degree | 99 (3.2%) | 101.0 |
| Total | 3,056 (100.0%) | 61.0 |
Fertility by Education by Marriage Status in Sunrise Manor
55.8% of women with births in Sunrise Manor are unmarried. Women with the educational attainment of bachelor's degree are most likely to be married with 100.0% of them married at childbirth, while women with the educational attainment of high school diploma are least likely to be married with 65.1% of them unmarried at childbirth.
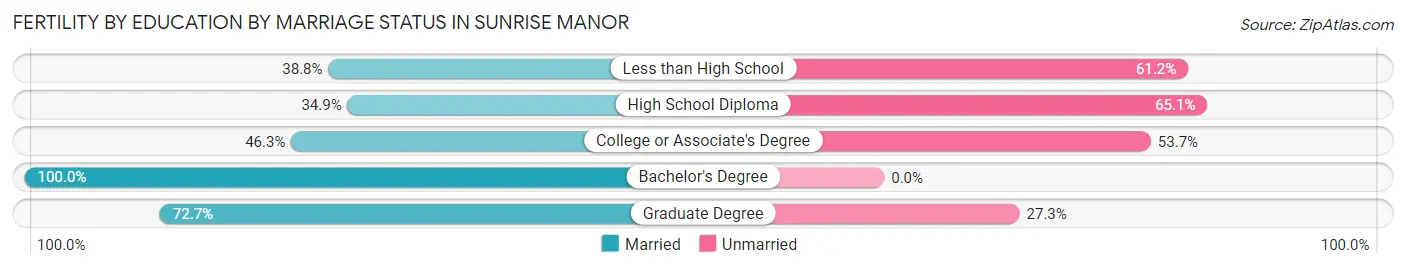
| Educational Attainment | Married | Unmarried |
| Less than High School | 391 (38.8%) | 617 (61.2%) |
| High School Diploma | 349 (34.9%) | 650 (65.1%) |
| College or Associate's Degree | 354 (46.3%) | 411 (53.7%) |
| Bachelor's Degree | 185 (100.0%) | 0 (0.0%) |
| Graduate Degree | 72 (72.7%) | 27 (27.3%) |
| Total | 1,351 (44.2%) | 1,705 (55.8%) |
Employment Characteristics in Sunrise Manor
Employment by Class of Employer in Sunrise Manor
Among the 80,929 employed individuals in Sunrise Manor, private company employees (63,779 | 78.8%), local government employees (4,683 | 5.8%), and self-employed (not incorporated) (4,193 | 5.2%) make up the most common classes of employment.
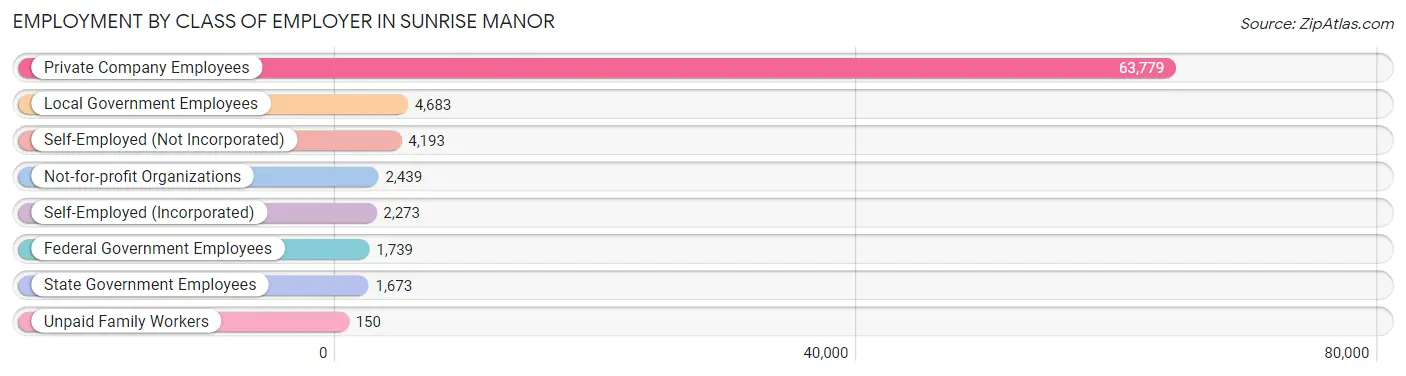
| Employer Class | # Employees | % Employees |
| Private Company Employees | 63,779 | 78.8% |
| Self-Employed (Incorporated) | 2,273 | 2.8% |
| Self-Employed (Not Incorporated) | 4,193 | 5.2% |
| Not-for-profit Organizations | 2,439 | 3.0% |
| Local Government Employees | 4,683 | 5.8% |
| State Government Employees | 1,673 | 2.1% |
| Federal Government Employees | 1,739 | 2.1% |
| Unpaid Family Workers | 150 | 0.2% |
| Total | 80,929 | 100.0% |
Employment Status by Age in Sunrise Manor
According to the labor force statistics for Sunrise Manor, out of the total population over 16 years of age (149,422), 61.3% or 91,596 individuals are in the labor force, with 9.1% or 8,335 of them unemployed. The age group with the highest labor force participation rate is 20 to 24 years, with 77.7% or 10,984 individuals in the labor force. Within the labor force, the 16 to 19 years age range has the highest percentage of unemployed individuals, with 20.1% or 795 of them being unemployed.
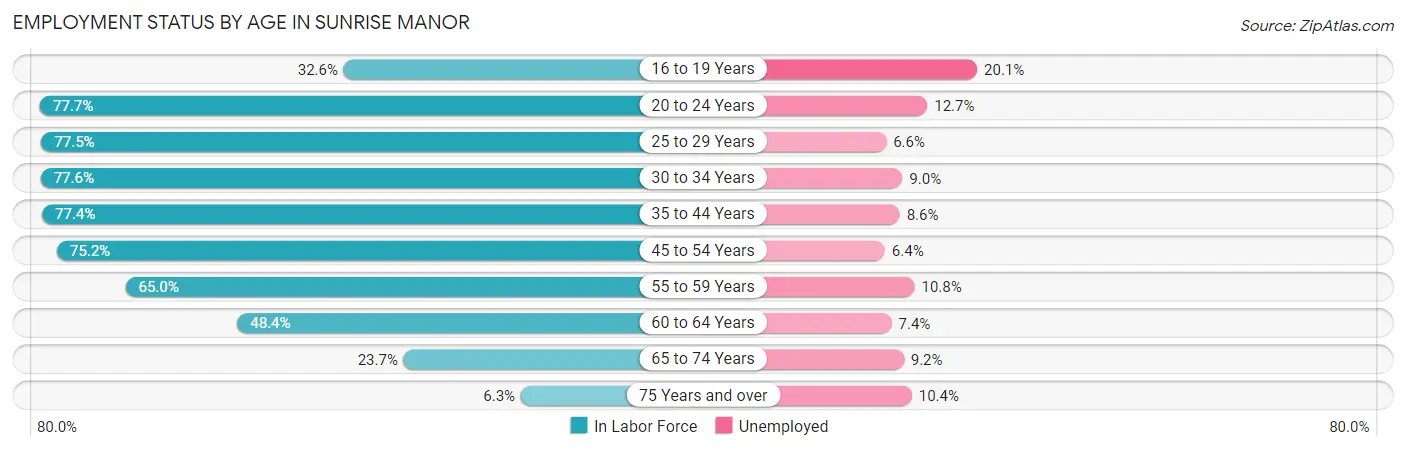
| Age Bracket | In Labor Force | Unemployed |
| 16 to 19 Years | 3,954 (32.6%) | 795 (20.1%) |
| 20 to 24 Years | 10,984 (77.7%) | 1,395 (12.7%) |
| 25 to 29 Years | 11,022 (77.5%) | 727 (6.6%) |
| 30 to 34 Years | 10,848 (77.6%) | 976 (9.0%) |
| 35 to 44 Years | 19,808 (77.4%) | 1,703 (8.6%) |
| 45 to 54 Years | 18,257 (75.2%) | 1,168 (6.4%) |
| 55 to 59 Years | 8,071 (65.0%) | 872 (10.8%) |
| 60 to 64 Years | 4,695 (48.4%) | 347 (7.4%) |
| 65 to 74 Years | 3,439 (23.7%) | 316 (9.2%) |
| 75 Years and over | 533 (6.3%) | 55 (10.4%) |
| Total | 91,596 (61.3%) | 8,335 (9.1%) |
Employment Status by Educational Attainment in Sunrise Manor
According to labor force statistics for Sunrise Manor, 72.6% of individuals (72,738) out of the total population between 25 and 64 years of age (100,190) are in the labor force, with 8.0% or 5,819 of them being unemployed. The group with the highest labor force participation rate are those with the educational attainment of bachelor's degree or higher, with 79.0% or 7,648 individuals in the labor force. Within the labor force, individuals with college / associate degree education have the highest percentage of unemployment, with 10.2% or 2,148 of them being unemployed.
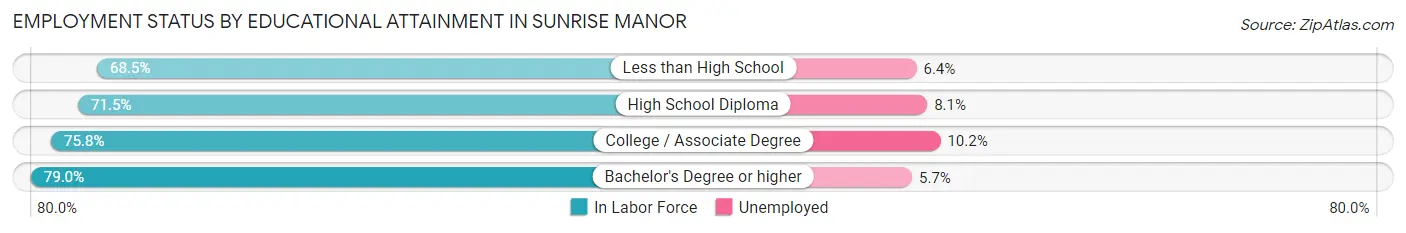
| Educational Attainment | In Labor Force | Unemployed |
| Less than High School | 19,612 (68.5%) | 1,832 (6.4%) |
| High School Diploma | 24,382 (71.5%) | 2,762 (8.1%) |
| College / Associate Degree | 21,056 (75.8%) | 2,833 (10.2%) |
| Bachelor's Degree or higher | 7,648 (79.0%) | 552 (5.7%) |
| Total | 72,738 (72.6%) | 8,015 (8.0%) |
Employment Occupations by Sex in Sunrise Manor
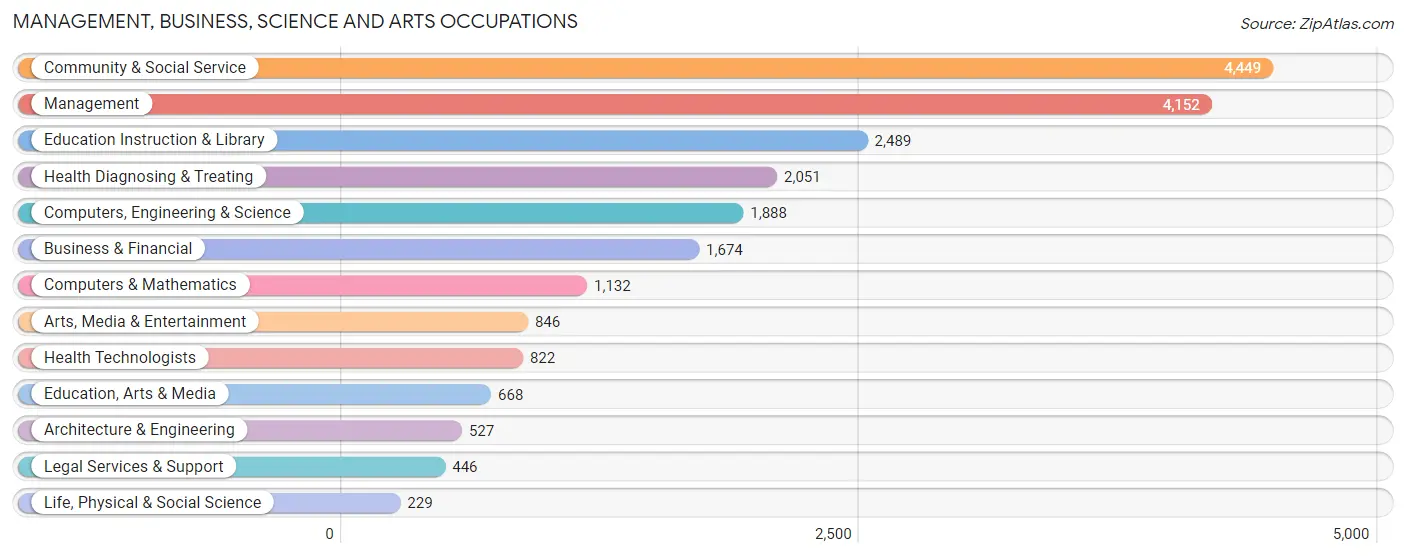
Management, Business, Science and Arts Occupations
The most common Management, Business, Science and Arts occupations in Sunrise Manor are Community & Social Service (4,449 | 5.4%), Management (4,152 | 5.0%), Education Instruction & Library (2,489 | 3.0%), Health Diagnosing & Treating (2,051 | 2.5%), and Computers, Engineering & Science (1,888 | 2.3%).
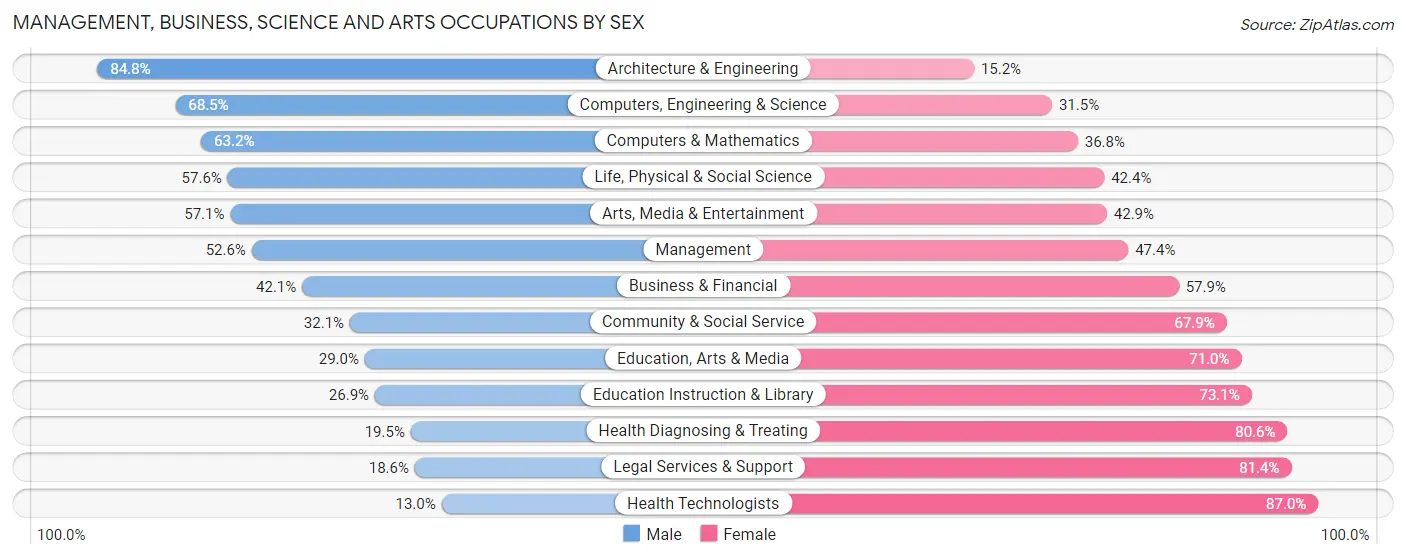
Management, Business, Science and Arts Occupations by Sex
Within the Management, Business, Science and Arts occupations in Sunrise Manor, the most male-oriented occupations are Architecture & Engineering (84.8%), Computers, Engineering & Science (68.5%), and Computers & Mathematics (63.2%), while the most female-oriented occupations are Health Technologists (87.0%), Legal Services & Support (81.4%), and Health Diagnosing & Treating (80.5%).
| Occupation | Male | Female |
| Management | 2,185 (52.6%) | 1,967 (47.4%) |
| Business & Financial | 705 (42.1%) | 969 (57.9%) |
| Computers, Engineering & Science | 1,294 (68.5%) | 594 (31.5%) |
| Computers & Mathematics | 715 (63.2%) | 417 (36.8%) |
| Architecture & Engineering | 447 (84.8%) | 80 (15.2%) |
| Life, Physical & Social Science | 132 (57.6%) | 97 (42.4%) |
| Community & Social Service | 1,430 (32.1%) | 3,019 (67.9%) |
| Education, Arts & Media | 194 (29.0%) | 474 (71.0%) |
| Legal Services & Support | 83 (18.6%) | 363 (81.4%) |
| Education Instruction & Library | 670 (26.9%) | 1,819 (73.1%) |
| Arts, Media & Entertainment | 483 (57.1%) | 363 (42.9%) |
| Health Diagnosing & Treating | 399 (19.5%) | 1,652 (80.5%) |
| Health Technologists | 107 (13.0%) | 715 (87.0%) |
| Total (Category) | 6,013 (42.3%) | 8,201 (57.7%) |
| Total (Overall) | 44,020 (53.0%) | 38,967 (47.0%) |
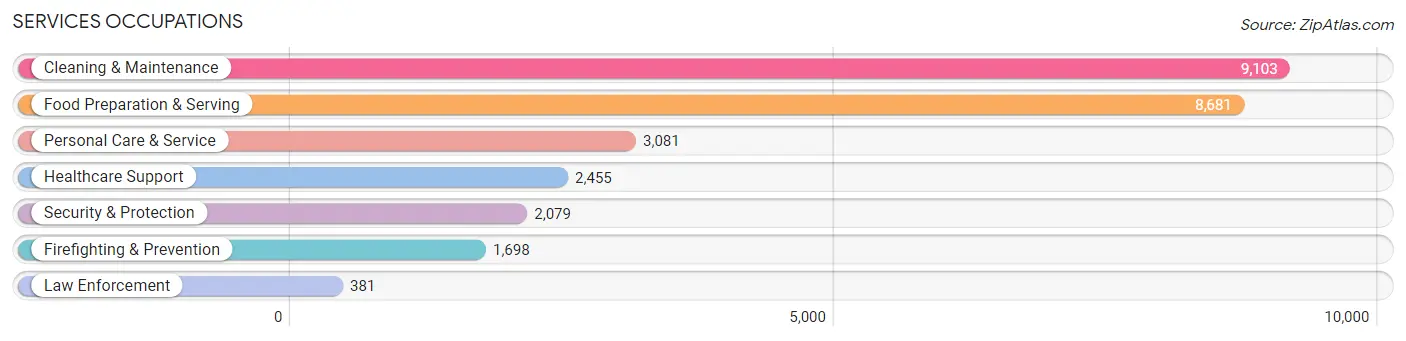
Services Occupations
The most common Services occupations in Sunrise Manor are Cleaning & Maintenance (9,103 | 11.0%), Food Preparation & Serving (8,681 | 10.5%), Personal Care & Service (3,081 | 3.7%), Healthcare Support (2,455 | 3.0%), and Security & Protection (2,079 | 2.5%).
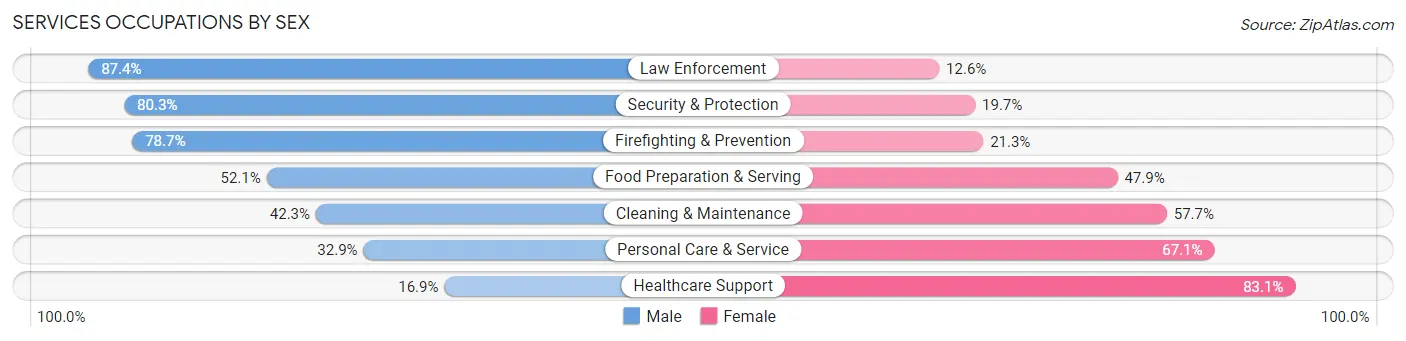
Services Occupations by Sex
Within the Services occupations in Sunrise Manor, the most male-oriented occupations are Law Enforcement (87.4%), Security & Protection (80.3%), and Firefighting & Prevention (78.7%), while the most female-oriented occupations are Healthcare Support (83.1%), Personal Care & Service (67.1%), and Cleaning & Maintenance (57.7%).
| Occupation | Male | Female |
| Healthcare Support | 415 (16.9%) | 2,040 (83.1%) |
| Security & Protection | 1,669 (80.3%) | 410 (19.7%) |
| Firefighting & Prevention | 1,336 (78.7%) | 362 (21.3%) |
| Law Enforcement | 333 (87.4%) | 48 (12.6%) |
| Food Preparation & Serving | 4,522 (52.1%) | 4,159 (47.9%) |
| Cleaning & Maintenance | 3,852 (42.3%) | 5,251 (57.7%) |
| Personal Care & Service | 1,014 (32.9%) | 2,067 (67.1%) |
| Total (Category) | 11,472 (45.2%) | 13,927 (54.8%) |
| Total (Overall) | 44,020 (53.0%) | 38,967 (47.0%) |
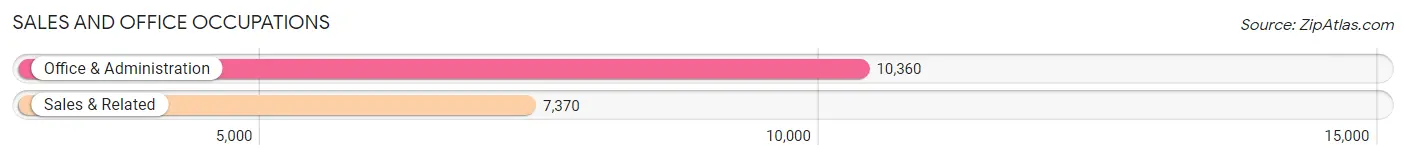
Sales and Office Occupations
The most common Sales and Office occupations in Sunrise Manor are Office & Administration (10,360 | 12.5%), and Sales & Related (7,370 | 8.9%).
Sales and Office Occupations by Sex
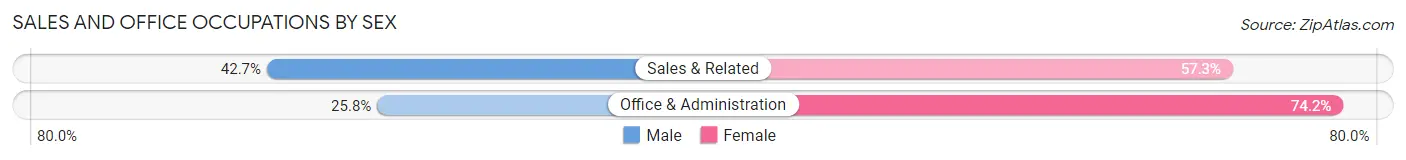
| Occupation | Male | Female |
| Sales & Related | 3,149 (42.7%) | 4,221 (57.3%) |
| Office & Administration | 2,669 (25.8%) | 7,691 (74.2%) |
| Total (Category) | 5,818 (32.8%) | 11,912 (67.2%) |
| Total (Overall) | 44,020 (53.0%) | 38,967 (47.0%) |
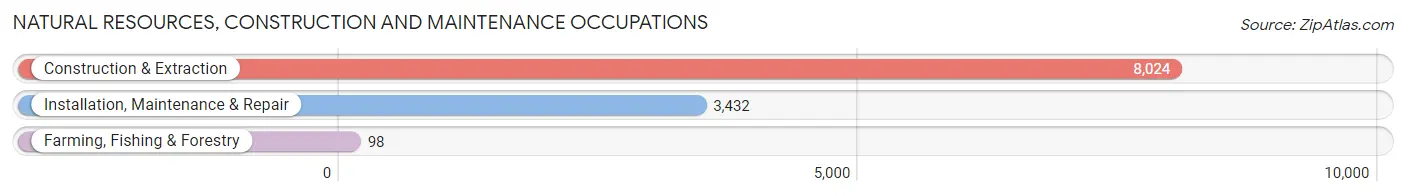
Natural Resources, Construction and Maintenance Occupations
The most common Natural Resources, Construction and Maintenance occupations in Sunrise Manor are Construction & Extraction (8,024 | 9.7%), Installation, Maintenance & Repair (3,432 | 4.1%), and Farming, Fishing & Forestry (98 | 0.1%).
Natural Resources, Construction and Maintenance Occupations by Sex
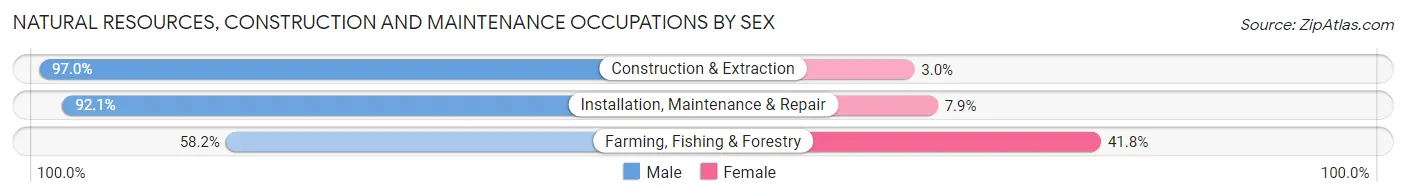
| Occupation | Male | Female |
| Farming, Fishing & Forestry | 57 (58.2%) | 41 (41.8%) |
| Construction & Extraction | 7,783 (97.0%) | 241 (3.0%) |
| Installation, Maintenance & Repair | 3,162 (92.1%) | 270 (7.9%) |
| Total (Category) | 11,002 (95.2%) | 552 (4.8%) |
| Total (Overall) | 44,020 (53.0%) | 38,967 (47.0%) |
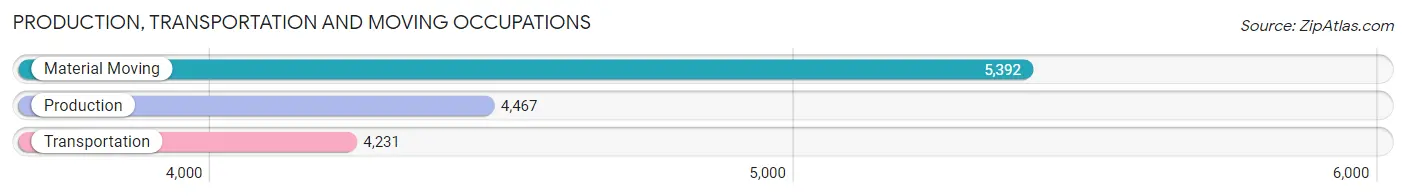
Production, Transportation and Moving Occupations
The most common Production, Transportation and Moving occupations in Sunrise Manor are Material Moving (5,392 | 6.5%), Production (4,467 | 5.4%), and Transportation (4,231 | 5.1%).
Production, Transportation and Moving Occupations by Sex
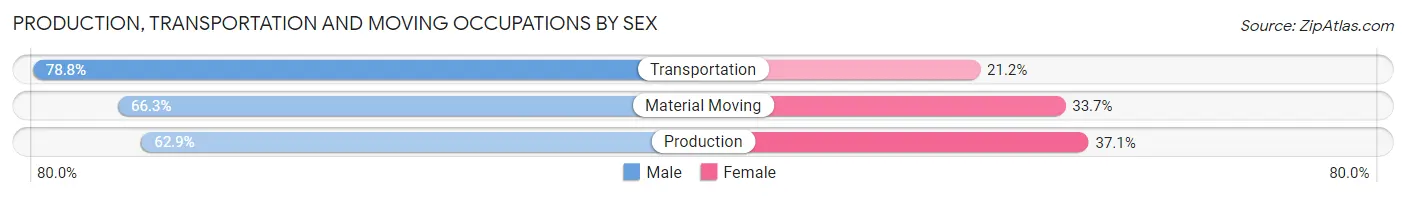
| Occupation | Male | Female |
| Production | 2,808 (62.9%) | 1,659 (37.1%) |
| Transportation | 3,333 (78.8%) | 898 (21.2%) |
| Material Moving | 3,574 (66.3%) | 1,818 (33.7%) |
| Total (Category) | 9,715 (69.0%) | 4,375 (31.0%) |
| Total (Overall) | 44,020 (53.0%) | 38,967 (47.0%) |
Employment Industries by Sex in Sunrise Manor
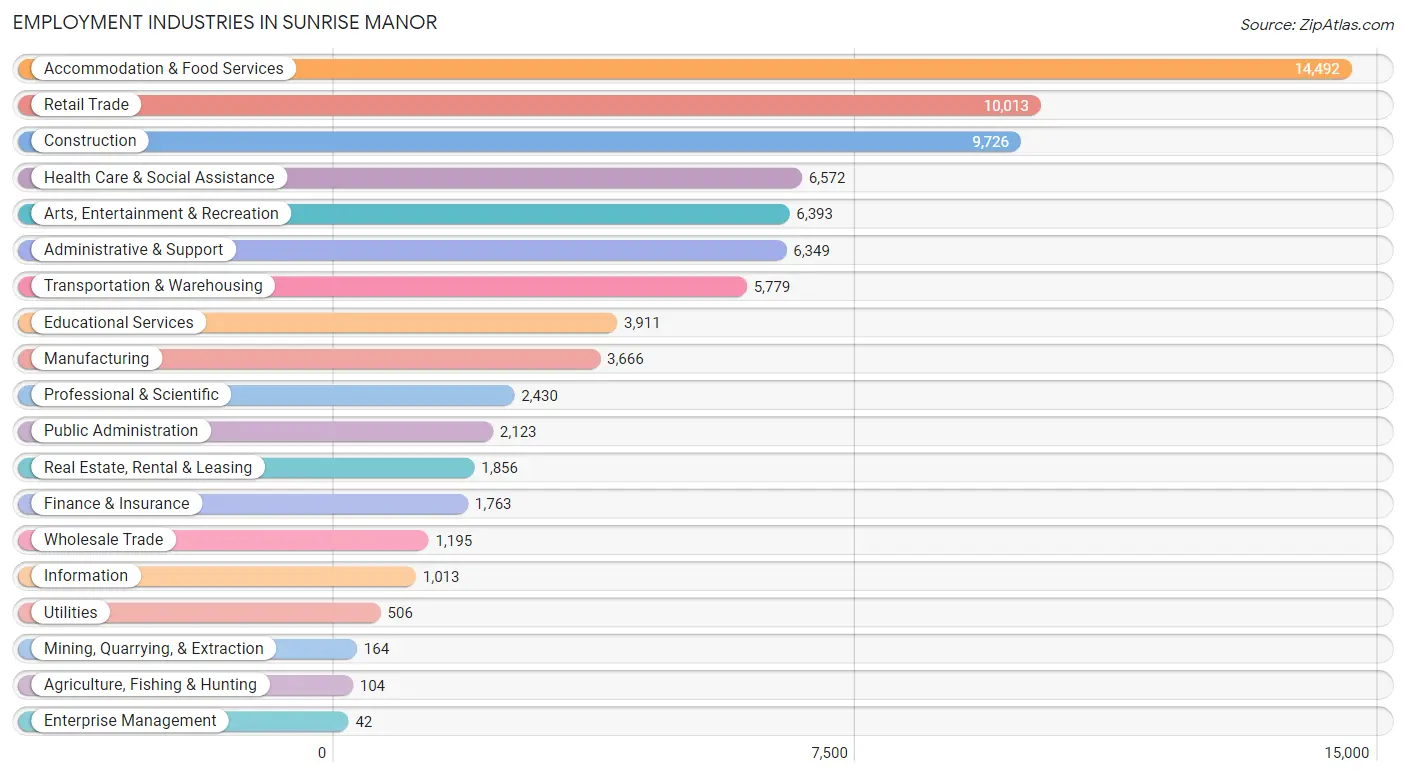
Employment Industries in Sunrise Manor
The major employment industries in Sunrise Manor include Accommodation & Food Services (14,492 | 17.5%), Retail Trade (10,013 | 12.1%), Construction (9,726 | 11.7%), Health Care & Social Assistance (6,572 | 7.9%), and Arts, Entertainment & Recreation (6,393 | 7.7%).
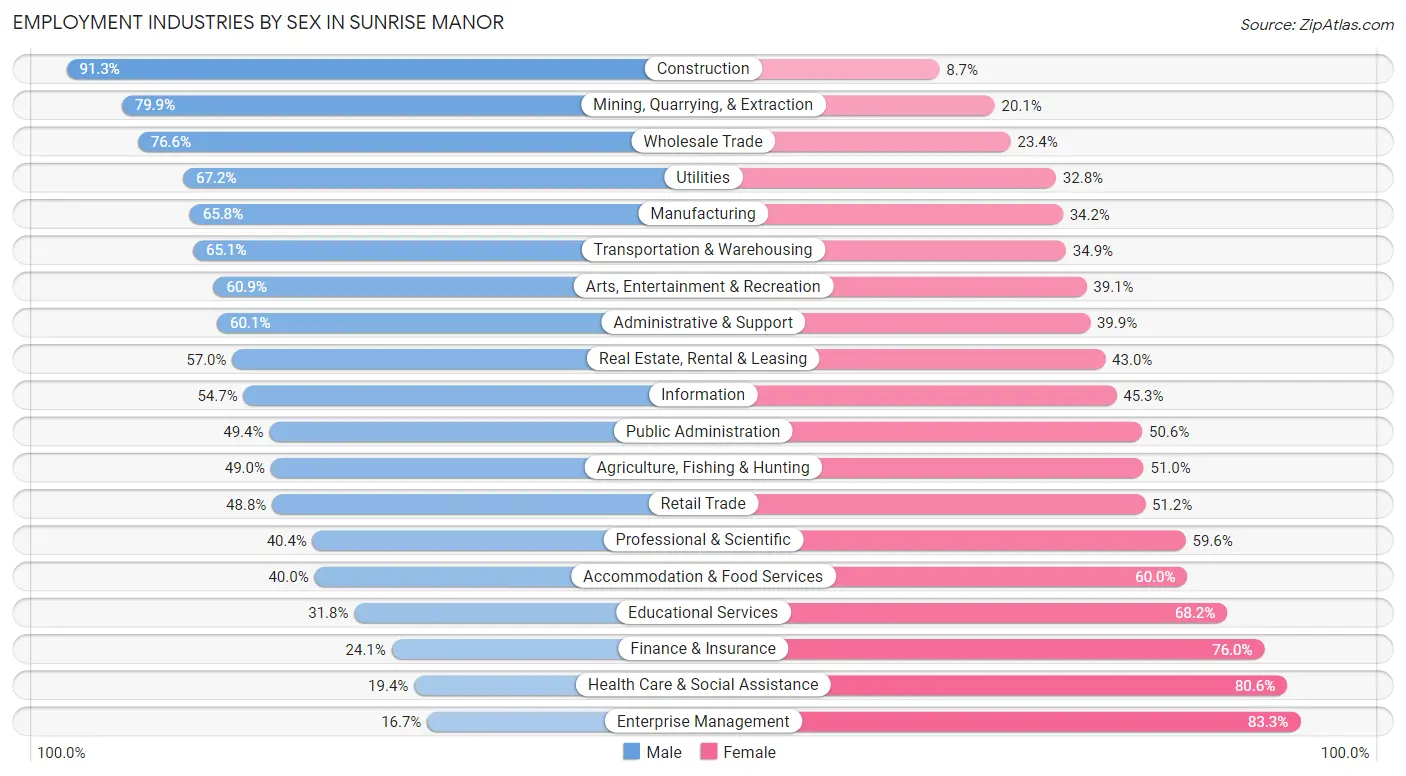
Employment Industries by Sex in Sunrise Manor
The Sunrise Manor industries that see more men than women are Construction (91.3%), Mining, Quarrying, & Extraction (79.9%), and Wholesale Trade (76.6%), whereas the industries that tend to have a higher number of women are Enterprise Management (83.3%), Health Care & Social Assistance (80.6%), and Finance & Insurance (75.9%).
| Industry | Male | Female |
| Agriculture, Fishing & Hunting | 51 (49.0%) | 53 (51.0%) |
| Mining, Quarrying, & Extraction | 131 (79.9%) | 33 (20.1%) |
| Construction | 8,883 (91.3%) | 843 (8.7%) |
| Manufacturing | 2,412 (65.8%) | 1,254 (34.2%) |
| Wholesale Trade | 915 (76.6%) | 280 (23.4%) |
| Retail Trade | 4,882 (48.8%) | 5,131 (51.2%) |
| Transportation & Warehousing | 3,764 (65.1%) | 2,015 (34.9%) |
| Utilities | 340 (67.2%) | 166 (32.8%) |
| Information | 554 (54.7%) | 459 (45.3%) |
| Finance & Insurance | 424 (24.0%) | 1,339 (75.9%) |
| Real Estate, Rental & Leasing | 1,058 (57.0%) | 798 (43.0%) |
| Professional & Scientific | 981 (40.4%) | 1,449 (59.6%) |
| Enterprise Management | 7 (16.7%) | 35 (83.3%) |
| Administrative & Support | 3,818 (60.1%) | 2,531 (39.9%) |
| Educational Services | 1,242 (31.8%) | 2,669 (68.2%) |
| Health Care & Social Assistance | 1,273 (19.4%) | 5,299 (80.6%) |
| Arts, Entertainment & Recreation | 3,893 (60.9%) | 2,500 (39.1%) |
| Accommodation & Food Services | 5,797 (40.0%) | 8,695 (60.0%) |
| Public Administration | 1,048 (49.4%) | 1,075 (50.6%) |
| Total | 44,020 (53.0%) | 38,967 (47.0%) |
Education in Sunrise Manor
School Enrollment in Sunrise Manor
The most common levels of schooling among the 50,274 students in Sunrise Manor are high school (12,859 | 25.6%), middle school (12,738 | 25.3%), and elementary school (11,838 | 23.5%).
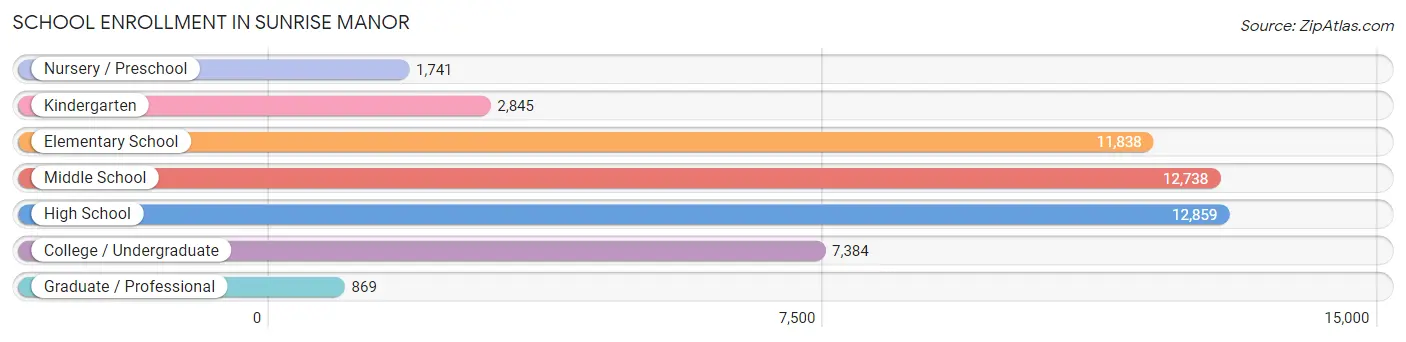
| School Level | # Students | % Students |
| Nursery / Preschool | 1,741 | 3.5% |
| Kindergarten | 2,845 | 5.7% |
| Elementary School | 11,838 | 23.5% |
| Middle School | 12,738 | 25.3% |
| High School | 12,859 | 25.6% |
| College / Undergraduate | 7,384 | 14.7% |
| Graduate / Professional | 869 | 1.7% |
| Total | 50,274 | 100.0% |
School Enrollment by Age by Funding Source in Sunrise Manor
Out of a total of 50,274 students who are enrolled in schools in Sunrise Manor, 3,117 (6.2%) attend a private institution, while the remaining 47,157 (93.8%) are enrolled in public schools. The age group of 35 years and over has the highest likelihood of being enrolled in private schools, with 640 (29.6% in the age bracket) enrolled. Conversely, the age group of 15 to 17 year olds has the lowest likelihood of being enrolled in a private school, with 8,346 (98.6% in the age bracket) attending a public institution.
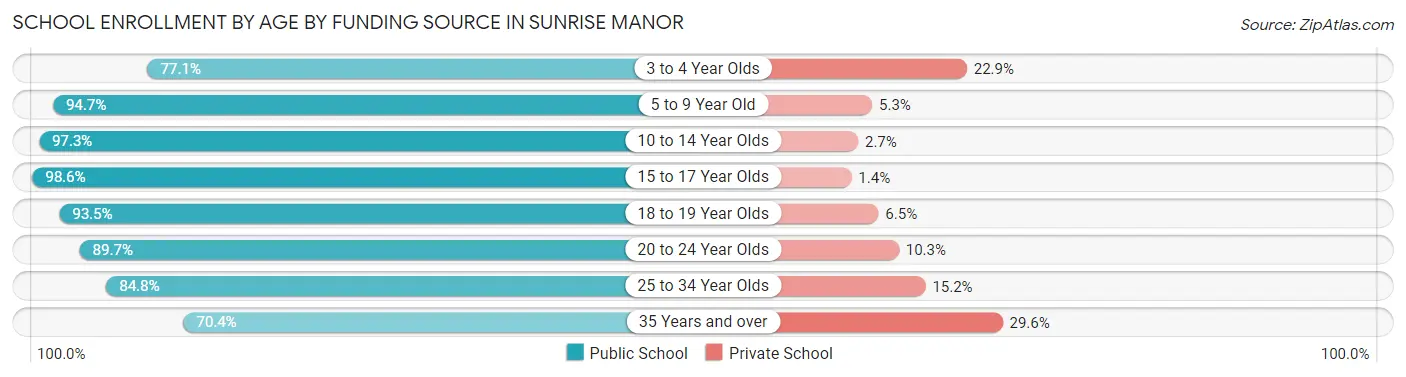
| Age Bracket | Public School | Private School |
| 3 to 4 Year Olds | 1,203 (77.1%) | 358 (22.9%) |
| 5 to 9 Year Old | 12,847 (94.7%) | 717 (5.3%) |
| 10 to 14 Year Olds | 15,992 (97.3%) | 440 (2.7%) |
| 15 to 17 Year Olds | 8,346 (98.6%) | 122 (1.4%) |
| 18 to 19 Year Olds | 2,862 (93.5%) | 198 (6.5%) |
| 20 to 24 Year Olds | 2,660 (89.7%) | 304 (10.3%) |
| 25 to 34 Year Olds | 1,748 (84.8%) | 314 (15.2%) |
| 35 Years and over | 1,523 (70.4%) | 640 (29.6%) |
| Total | 47,157 (93.8%) | 3,117 (6.2%) |
Educational Attainment by Field of Study in Sunrise Manor
Business (3,407 | 24.1%), education (1,975 | 14.0%), science & technology (1,566 | 11.1%), arts & humanities (1,165 | 8.3%), and social sciences (1,016 | 7.2%) are the most common fields of study among 14,116 individuals in Sunrise Manor who have obtained a bachelor's degree or higher.
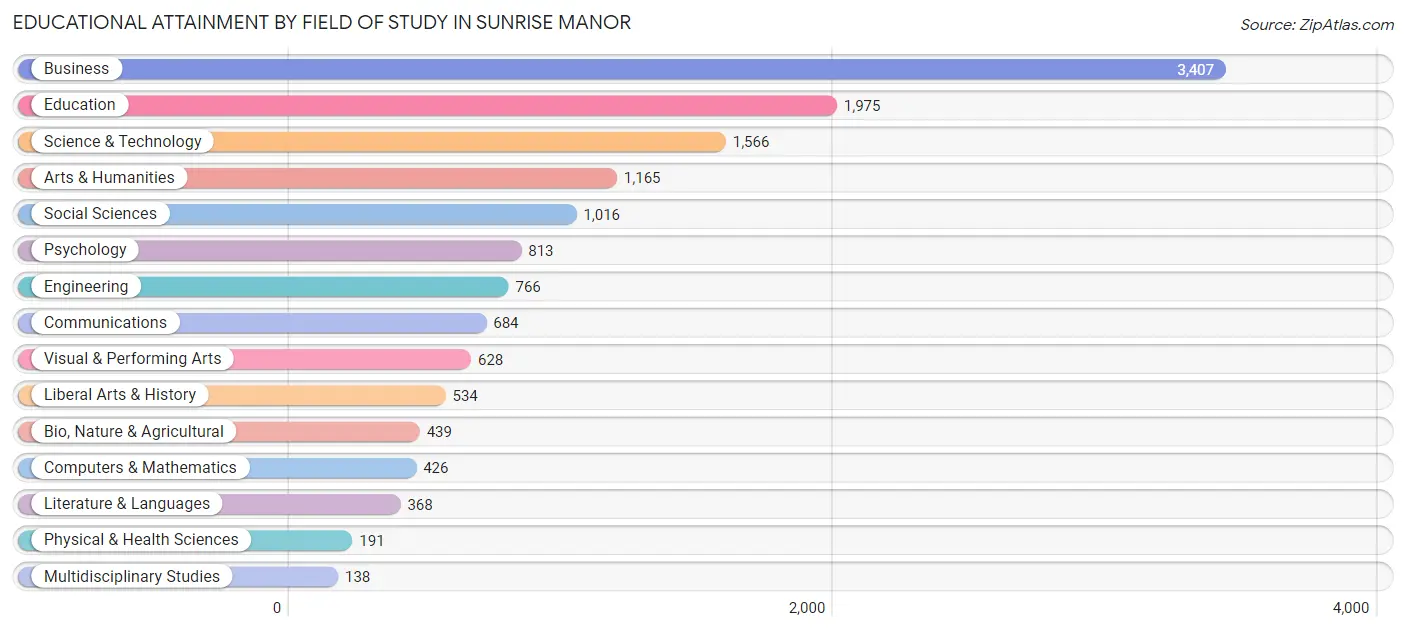
| Field of Study | # Graduates | % Graduates |
| Computers & Mathematics | 426 | 3.0% |
| Bio, Nature & Agricultural | 439 | 3.1% |
| Physical & Health Sciences | 191 | 1.3% |
| Psychology | 813 | 5.8% |
| Social Sciences | 1,016 | 7.2% |
| Engineering | 766 | 5.4% |
| Multidisciplinary Studies | 138 | 1.0% |
| Science & Technology | 1,566 | 11.1% |
| Business | 3,407 | 24.1% |
| Education | 1,975 | 14.0% |
| Literature & Languages | 368 | 2.6% |
| Liberal Arts & History | 534 | 3.8% |
| Visual & Performing Arts | 628 | 4.4% |
| Communications | 684 | 4.9% |
| Arts & Humanities | 1,165 | 8.3% |
| Total | 14,116 | 100.0% |
Transportation & Commute in Sunrise Manor
Vehicle Availability by Sex in Sunrise Manor
The most prevalent vehicle ownership categories in Sunrise Manor are males with 2 vehicles (16,185, accounting for 37.4%) and females with 2 vehicles (11,823, making up 43.0%).
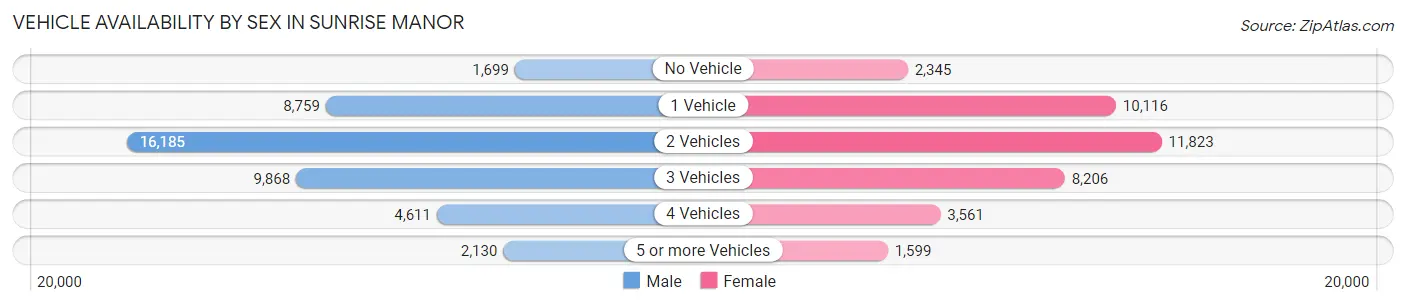
| Vehicles Available | Male | Female |
| No Vehicle | 1,699 (3.9%) | 2,345 (6.2%) |
| 1 Vehicle | 8,759 (20.3%) | 10,116 (26.9%) |
| 2 Vehicles | 16,185 (37.4%) | 11,823 (31.4%) |
| 3 Vehicles | 9,868 (22.8%) | 8,206 (21.8%) |
| 4 Vehicles | 4,611 (10.7%) | 3,561 (9.5%) |
| 5 or more Vehicles | 2,130 (4.9%) | 1,599 (4.3%) |
| Total | 43,252 (100.0%) | 37,650 (100.0%) |
Commute Time in Sunrise Manor
The most frequently occuring commute durations in Sunrise Manor are 30 to 34 minutes (20,600 commuters, 26.5%), 20 to 24 minutes (12,804 commuters, 16.5%), and 25 to 29 minutes (8,338 commuters, 10.7%).
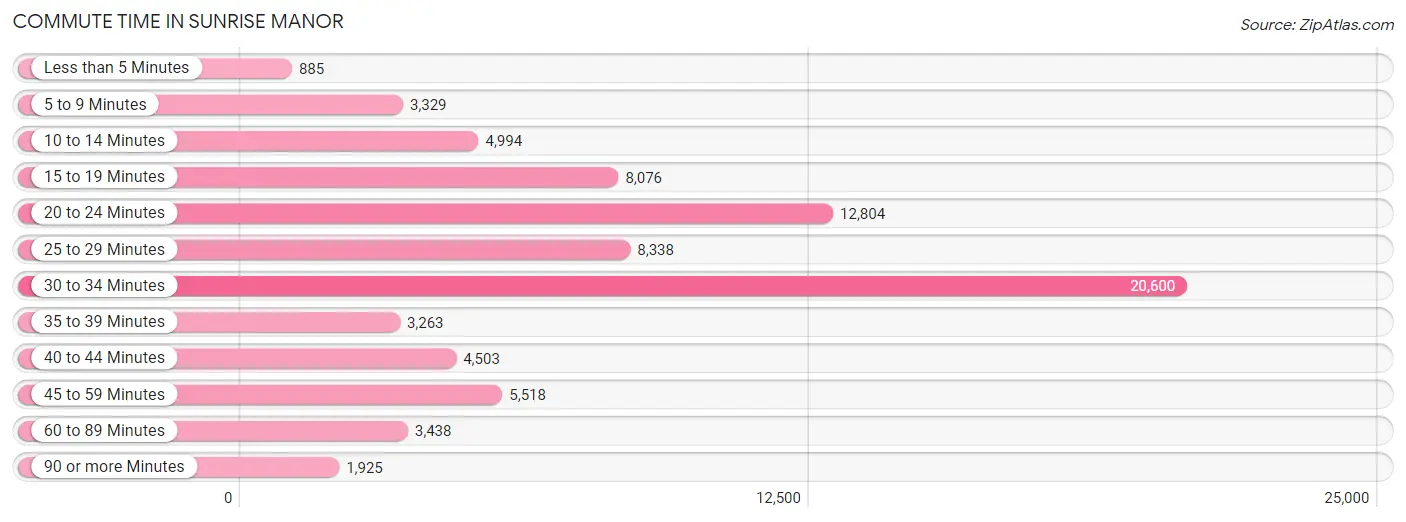
| Commute Time | # Commuters | % Commuters |
| Less than 5 Minutes | 885 | 1.1% |
| 5 to 9 Minutes | 3,329 | 4.3% |
| 10 to 14 Minutes | 4,994 | 6.4% |
| 15 to 19 Minutes | 8,076 | 10.4% |
| 20 to 24 Minutes | 12,804 | 16.5% |
| 25 to 29 Minutes | 8,338 | 10.7% |
| 30 to 34 Minutes | 20,600 | 26.5% |
| 35 to 39 Minutes | 3,263 | 4.2% |
| 40 to 44 Minutes | 4,503 | 5.8% |
| 45 to 59 Minutes | 5,518 | 7.1% |
| 60 to 89 Minutes | 3,438 | 4.4% |
| 90 or more Minutes | 1,925 | 2.5% |
Commute Time by Sex in Sunrise Manor
The most common commute times in Sunrise Manor are 30 to 34 minutes (11,927 commuters, 28.4%) for males and 30 to 34 minutes (8,673 commuters, 24.3%) for females.
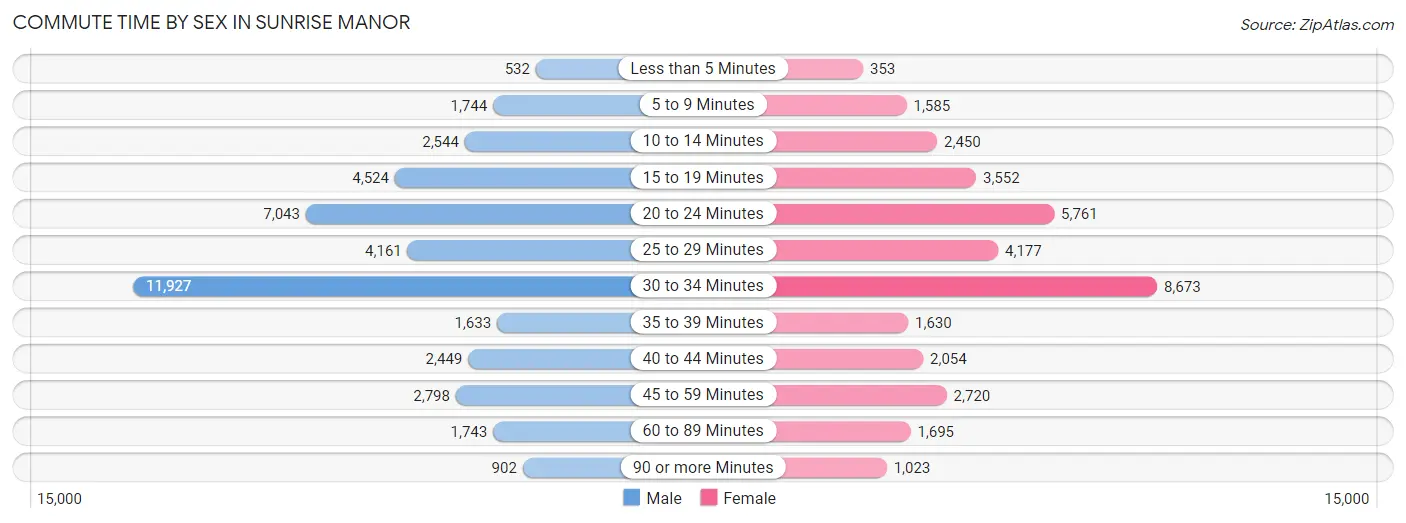
| Commute Time | Male | Female |
| Less than 5 Minutes | 532 (1.3%) | 353 (1.0%) |
| 5 to 9 Minutes | 1,744 (4.2%) | 1,585 (4.4%) |
| 10 to 14 Minutes | 2,544 (6.1%) | 2,450 (6.9%) |
| 15 to 19 Minutes | 4,524 (10.8%) | 3,552 (10.0%) |
| 20 to 24 Minutes | 7,043 (16.8%) | 5,761 (16.2%) |
| 25 to 29 Minutes | 4,161 (9.9%) | 4,177 (11.7%) |
| 30 to 34 Minutes | 11,927 (28.4%) | 8,673 (24.3%) |
| 35 to 39 Minutes | 1,633 (3.9%) | 1,630 (4.6%) |
| 40 to 44 Minutes | 2,449 (5.8%) | 2,054 (5.8%) |
| 45 to 59 Minutes | 2,798 (6.7%) | 2,720 (7.6%) |
| 60 to 89 Minutes | 1,743 (4.2%) | 1,695 (4.8%) |
| 90 or more Minutes | 902 (2.1%) | 1,023 (2.9%) |
Time of Departure to Work by Sex in Sunrise Manor
The most frequent times of departure to work in Sunrise Manor are 12:00 AM to 4:59 AM (5,343, 12.7%) for males and 7:00 AM to 7:29 AM (4,372, 12.3%) for females.
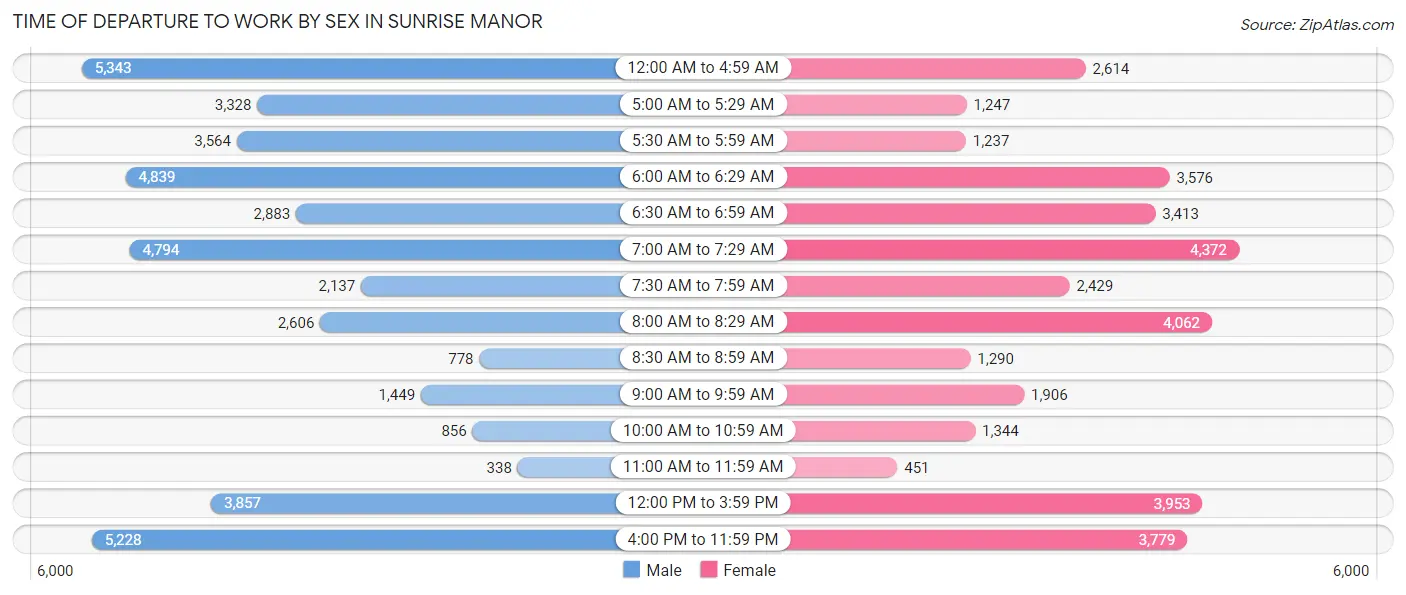
| Time of Departure | Male | Female |
| 12:00 AM to 4:59 AM | 5,343 (12.7%) | 2,614 (7.3%) |
| 5:00 AM to 5:29 AM | 3,328 (7.9%) | 1,247 (3.5%) |
| 5:30 AM to 5:59 AM | 3,564 (8.5%) | 1,237 (3.5%) |
| 6:00 AM to 6:29 AM | 4,839 (11.5%) | 3,576 (10.0%) |
| 6:30 AM to 6:59 AM | 2,883 (6.9%) | 3,413 (9.6%) |
| 7:00 AM to 7:29 AM | 4,794 (11.4%) | 4,372 (12.3%) |
| 7:30 AM to 7:59 AM | 2,137 (5.1%) | 2,429 (6.8%) |
| 8:00 AM to 8:29 AM | 2,606 (6.2%) | 4,062 (11.4%) |
| 8:30 AM to 8:59 AM | 778 (1.8%) | 1,290 (3.6%) |
| 9:00 AM to 9:59 AM | 1,449 (3.5%) | 1,906 (5.3%) |
| 10:00 AM to 10:59 AM | 856 (2.0%) | 1,344 (3.8%) |
| 11:00 AM to 11:59 AM | 338 (0.8%) | 451 (1.3%) |
| 12:00 PM to 3:59 PM | 3,857 (9.2%) | 3,953 (11.1%) |
| 4:00 PM to 11:59 PM | 5,228 (12.4%) | 3,779 (10.6%) |
| Total | 42,000 (100.0%) | 35,673 (100.0%) |
Housing Occupancy in Sunrise Manor
Occupancy by Ownership in Sunrise Manor
Of the total 64,271 dwellings in Sunrise Manor, owner-occupied units account for 32,923 (51.2%), while renter-occupied units make up 31,348 (48.8%).
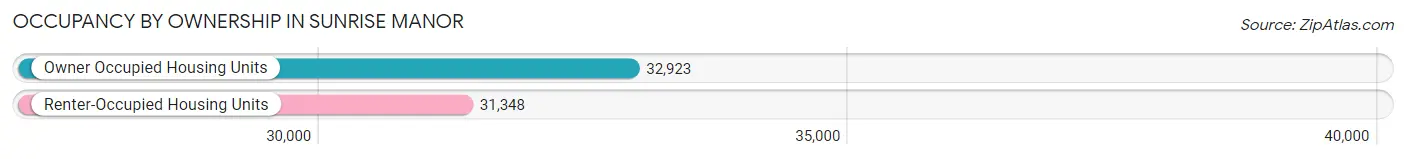
| Occupancy | # Housing Units | % Housing Units |
| Owner Occupied Housing Units | 32,923 | 51.2% |
| Renter-Occupied Housing Units | 31,348 | 48.8% |
| Total Occupied Housing Units | 64,271 | 100.0% |
Occupancy by Household Size in Sunrise Manor
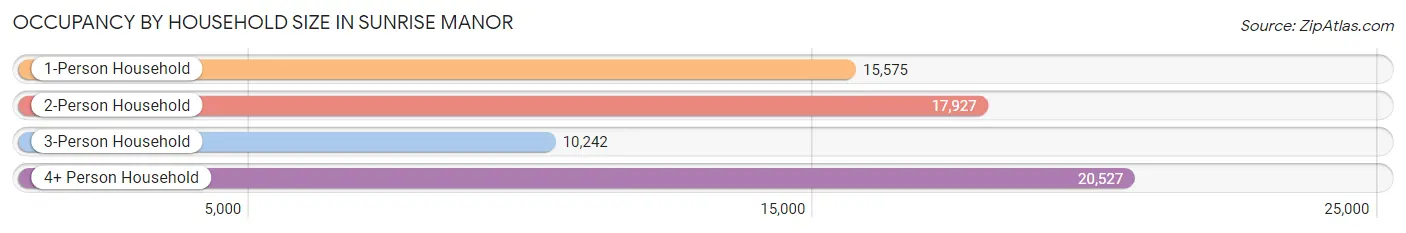
| Household Size | # Housing Units | % Housing Units |
| 1-Person Household | 15,575 | 24.2% |
| 2-Person Household | 17,927 | 27.9% |
| 3-Person Household | 10,242 | 15.9% |
| 4+ Person Household | 20,527 | 31.9% |
| Total Housing Units | 64,271 | 100.0% |
Occupancy by Ownership by Household Size in Sunrise Manor
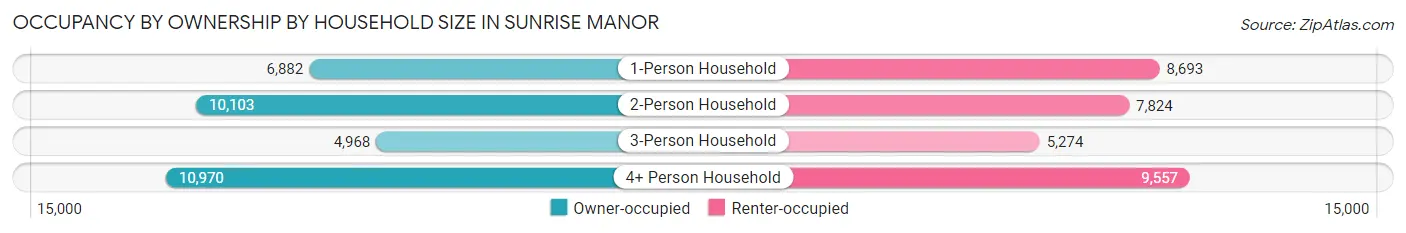
| Household Size | Owner-occupied | Renter-occupied |
| 1-Person Household | 6,882 (44.2%) | 8,693 (55.8%) |
| 2-Person Household | 10,103 (56.4%) | 7,824 (43.6%) |
| 3-Person Household | 4,968 (48.5%) | 5,274 (51.5%) |
| 4+ Person Household | 10,970 (53.4%) | 9,557 (46.6%) |
| Total Housing Units | 32,923 (51.2%) | 31,348 (48.8%) |
Occupancy by Educational Attainment in Sunrise Manor
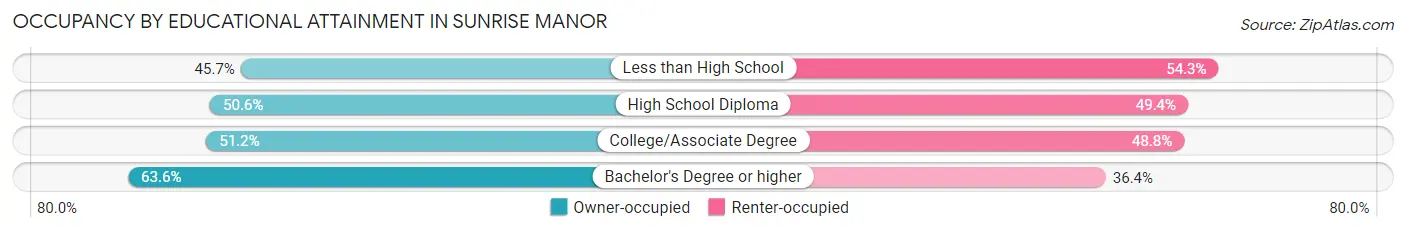
| Household Size | Owner-occupied | Renter-occupied |
| Less than High School | 6,952 (45.7%) | 8,250 (54.3%) |
| High School Diploma | 10,018 (50.6%) | 9,794 (49.4%) |
| College/Associate Degree | 10,918 (51.2%) | 10,419 (48.8%) |
| Bachelor's Degree or higher | 5,035 (63.6%) | 2,885 (36.4%) |
Occupancy by Age of Householder in Sunrise Manor
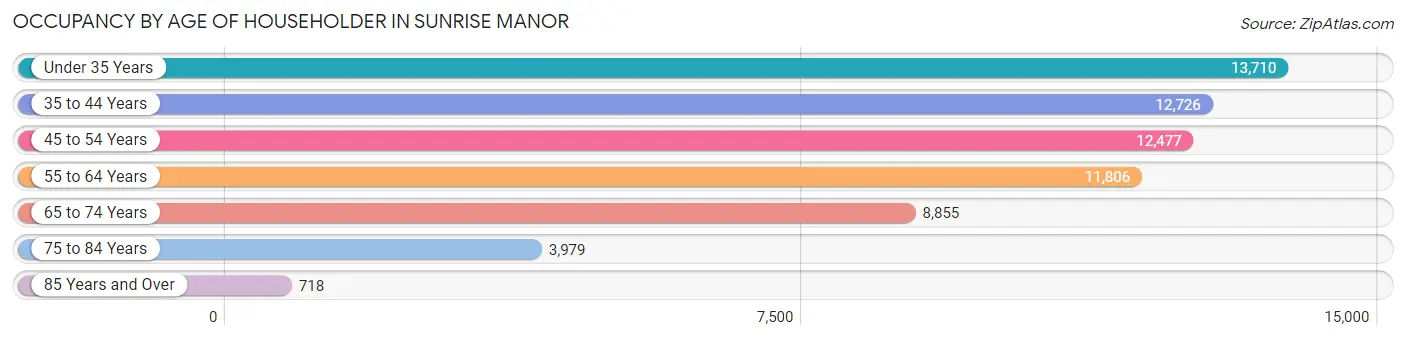
| Age Bracket | # Households | % Households |
| Under 35 Years | 13,710 | 21.3% |
| 35 to 44 Years | 12,726 | 19.8% |
| 45 to 54 Years | 12,477 | 19.4% |
| 55 to 64 Years | 11,806 | 18.4% |
| 65 to 74 Years | 8,855 | 13.8% |
| 75 to 84 Years | 3,979 | 6.2% |
| 85 Years and Over | 718 | 1.1% |
| Total | 64,271 | 100.0% |
Housing Finances in Sunrise Manor
Median Income by Occupancy in Sunrise Manor
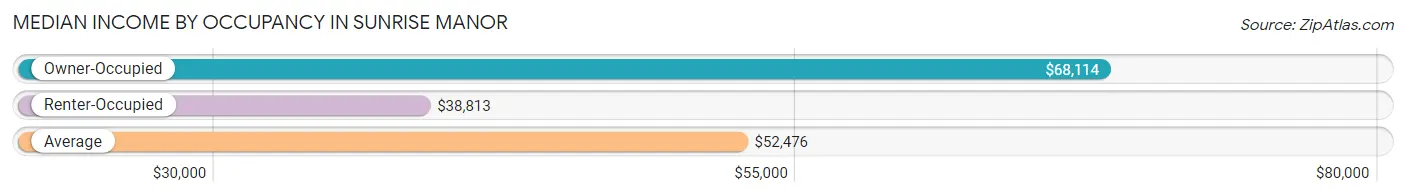
| Occupancy Type | # Households | Median Income |
| Owner-Occupied | 32,923 (51.2%) | $68,114 |
| Renter-Occupied | 31,348 (48.8%) | $38,813 |
| Average | 64,271 (100.0%) | $52,476 |
Occupancy by Householder Income Bracket in Sunrise Manor
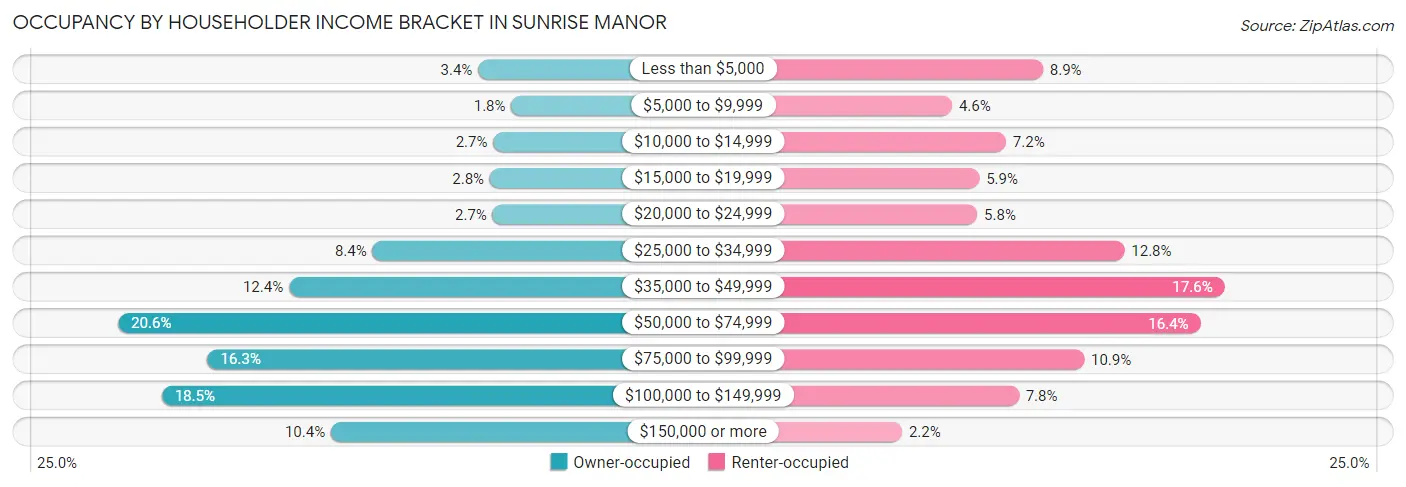
| Income Bracket | Owner-occupied | Renter-occupied |
| Less than $5,000 | 1,120 (3.4%) | 2,796 (8.9%) |
| $5,000 to $9,999 | 599 (1.8%) | 1,438 (4.6%) |
| $10,000 to $14,999 | 881 (2.7%) | 2,244 (7.2%) |
| $15,000 to $19,999 | 935 (2.8%) | 1,846 (5.9%) |
| $20,000 to $24,999 | 892 (2.7%) | 1,815 (5.8%) |
| $25,000 to $34,999 | 2,777 (8.4%) | 4,014 (12.8%) |
| $35,000 to $49,999 | 4,085 (12.4%) | 5,508 (17.6%) |
| $50,000 to $74,999 | 6,765 (20.5%) | 5,148 (16.4%) |
| $75,000 to $99,999 | 5,363 (16.3%) | 3,412 (10.9%) |
| $100,000 to $149,999 | 6,080 (18.5%) | 2,435 (7.8%) |
| $150,000 or more | 3,426 (10.4%) | 692 (2.2%) |
| Total | 32,923 (100.0%) | 31,348 (100.0%) |
Monthly Housing Cost Tiers in Sunrise Manor
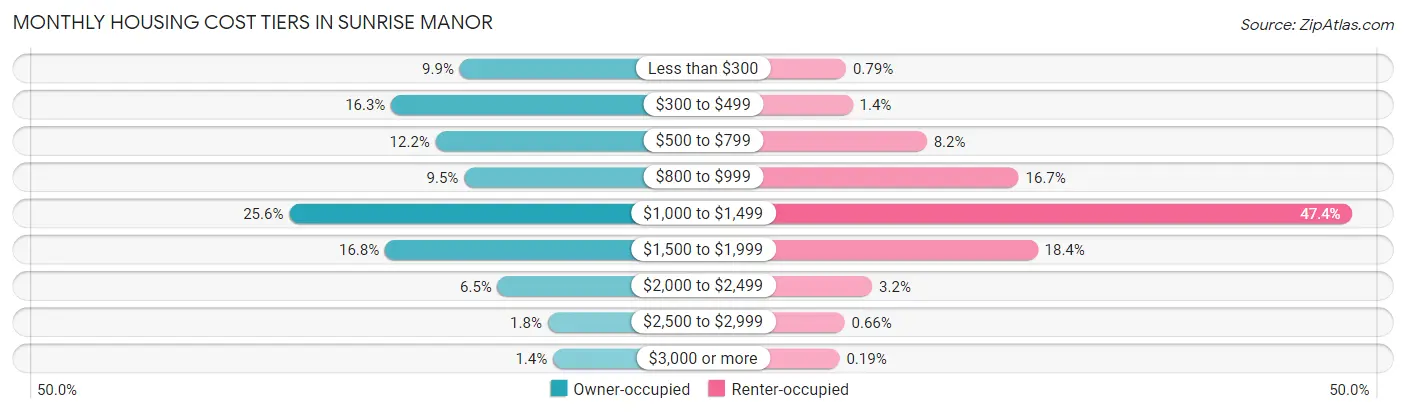
| Monthly Cost | Owner-occupied | Renter-occupied |
| Less than $300 | 3,274 (9.9%) | 249 (0.8%) |
| $300 to $499 | 5,351 (16.3%) | 438 (1.4%) |
| $500 to $799 | 4,004 (12.2%) | 2,578 (8.2%) |
| $800 to $999 | 3,137 (9.5%) | 5,228 (16.7%) |
| $1,000 to $1,499 | 8,442 (25.6%) | 14,863 (47.4%) |
| $1,500 to $1,999 | 5,539 (16.8%) | 5,777 (18.4%) |
| $2,000 to $2,499 | 2,125 (6.5%) | 1,002 (3.2%) |
| $2,500 to $2,999 | 606 (1.8%) | 208 (0.7%) |
| $3,000 or more | 445 (1.3%) | 60 (0.2%) |
| Total | 32,923 (100.0%) | 31,348 (100.0%) |
Physical Housing Characteristics in Sunrise Manor
Housing Structures in Sunrise Manor
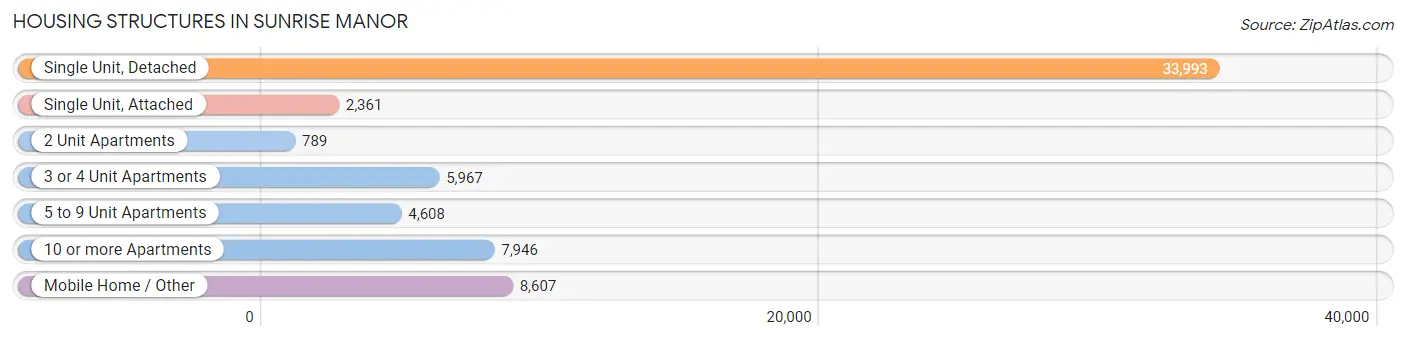
| Structure Type | # Housing Units | % Housing Units |
| Single Unit, Detached | 33,993 | 52.9% |
| Single Unit, Attached | 2,361 | 3.7% |
| 2 Unit Apartments | 789 | 1.2% |
| 3 or 4 Unit Apartments | 5,967 | 9.3% |
| 5 to 9 Unit Apartments | 4,608 | 7.2% |
| 10 or more Apartments | 7,946 | 12.4% |
| Mobile Home / Other | 8,607 | 13.4% |
| Total | 64,271 | 100.0% |
Housing Structures by Occupancy in Sunrise Manor
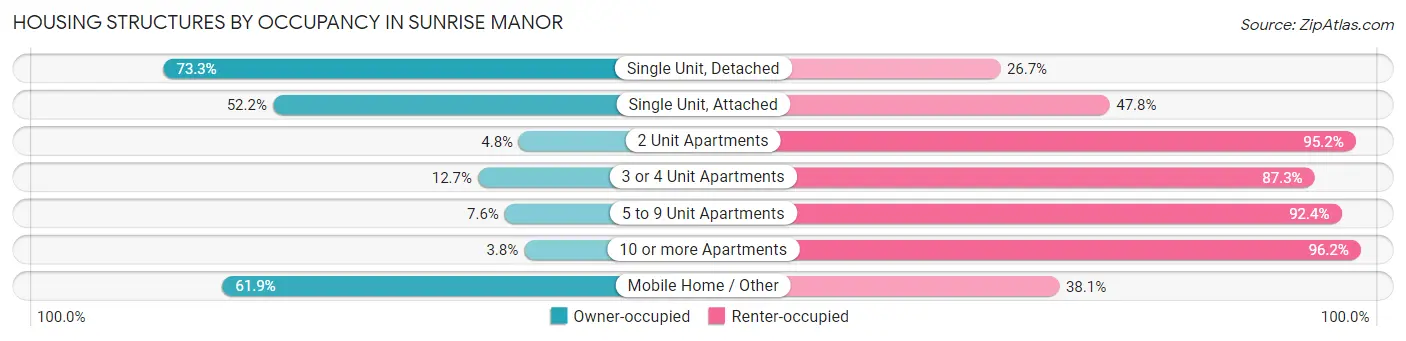
| Structure Type | Owner-occupied | Renter-occupied |
| Single Unit, Detached | 24,910 (73.3%) | 9,083 (26.7%) |
| Single Unit, Attached | 1,233 (52.2%) | 1,128 (47.8%) |
| 2 Unit Apartments | 38 (4.8%) | 751 (95.2%) |
| 3 or 4 Unit Apartments | 760 (12.7%) | 5,207 (87.3%) |
| 5 to 9 Unit Apartments | 349 (7.6%) | 4,259 (92.4%) |
| 10 or more Apartments | 304 (3.8%) | 7,642 (96.2%) |
| Mobile Home / Other | 5,329 (61.9%) | 3,278 (38.1%) |
| Total | 32,923 (51.2%) | 31,348 (48.8%) |
Housing Structures by Number of Rooms in Sunrise Manor
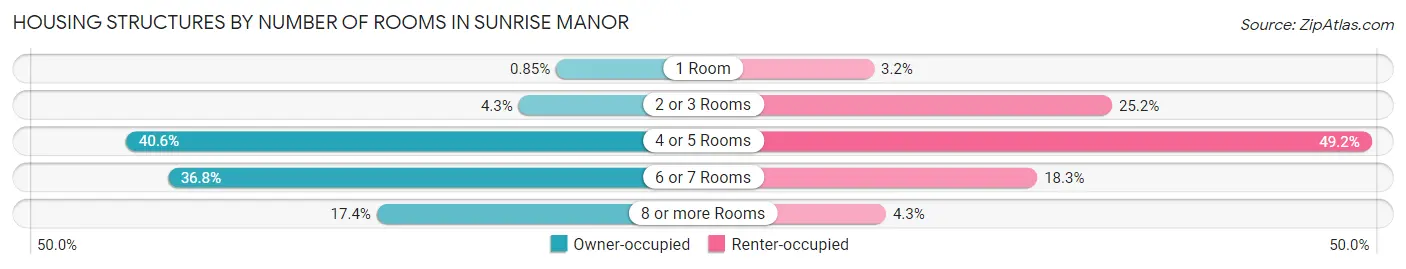
| Number of Rooms | Owner-occupied | Renter-occupied |
| 1 Room | 279 (0.9%) | 992 (3.2%) |
| 2 or 3 Rooms | 1,423 (4.3%) | 7,889 (25.2%) |
| 4 or 5 Rooms | 13,378 (40.6%) | 15,410 (49.2%) |
| 6 or 7 Rooms | 12,102 (36.8%) | 5,721 (18.2%) |
| 8 or more Rooms | 5,741 (17.4%) | 1,336 (4.3%) |
| Total | 32,923 (100.0%) | 31,348 (100.0%) |
Housing Structure by Heating Type in Sunrise Manor
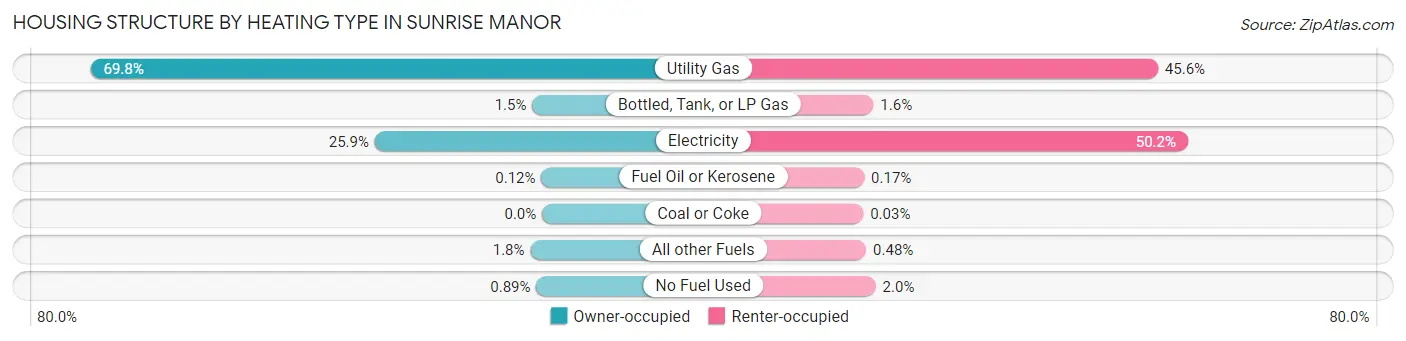
| Heating Type | Owner-occupied | Renter-occupied |
| Utility Gas | 22,984 (69.8%) | 14,287 (45.6%) |
| Bottled, Tank, or LP Gas | 496 (1.5%) | 501 (1.6%) |
| Electricity | 8,514 (25.9%) | 15,737 (50.2%) |
| Fuel Oil or Kerosene | 40 (0.1%) | 53 (0.2%) |
| Coal or Coke | 0 (0.0%) | 9 (0.0%) |
| All other Fuels | 596 (1.8%) | 151 (0.5%) |
| No Fuel Used | 293 (0.9%) | 610 (1.9%) |
| Total | 32,923 (100.0%) | 31,348 (100.0%) |
Household Vehicle Usage in Sunrise Manor
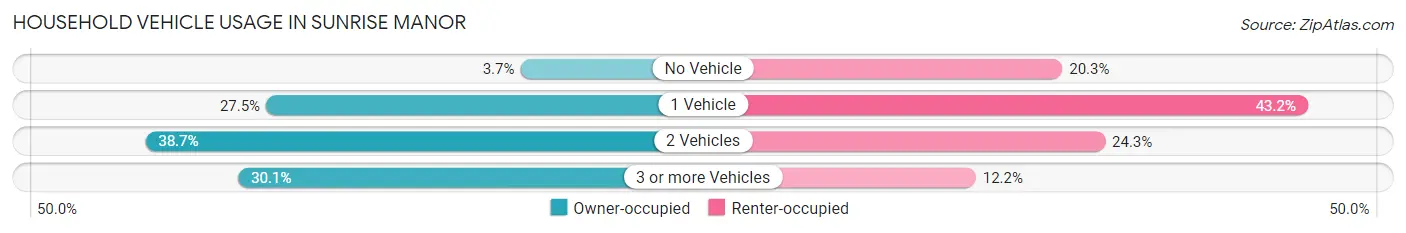
| Vehicles per Household | Owner-occupied | Renter-occupied |
| No Vehicle | 1,229 (3.7%) | 6,360 (20.3%) |
| 1 Vehicle | 9,044 (27.5%) | 13,543 (43.2%) |
| 2 Vehicles | 12,751 (38.7%) | 7,613 (24.3%) |
| 3 or more Vehicles | 9,899 (30.1%) | 3,832 (12.2%) |
| Total | 32,923 (100.0%) | 31,348 (100.0%) |
Real Estate & Mortgages in Sunrise Manor
Real Estate and Mortgage Overview in Sunrise Manor
| Characteristic | Without Mortgage | With Mortgage |
| Housing Units | 13,502 | 19,421 |
| Median Property Value | $212,000 | $284,800 |
| Median Household Income | $54,925 | $2,393 |
| Monthly Housing Costs | $432 | $445 |
| Real Estate Taxes | $740 | $942 |
Property Value by Mortgage Status in Sunrise Manor
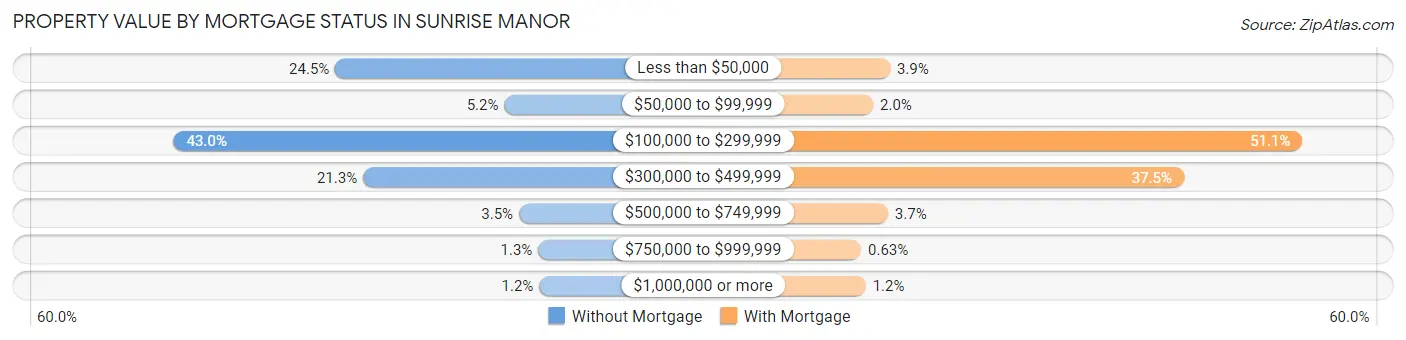
| Property Value | Without Mortgage | With Mortgage |
| Less than $50,000 | 3,310 (24.5%) | 764 (3.9%) |
| $50,000 to $99,999 | 700 (5.2%) | 390 (2.0%) |
| $100,000 to $299,999 | 5,803 (43.0%) | 9,916 (51.1%) |
| $300,000 to $499,999 | 2,880 (21.3%) | 7,285 (37.5%) |
| $500,000 to $749,999 | 472 (3.5%) | 718 (3.7%) |
| $750,000 to $999,999 | 177 (1.3%) | 122 (0.6%) |
| $1,000,000 or more | 160 (1.2%) | 226 (1.2%) |
| Total | 13,502 (100.0%) | 19,421 (100.0%) |
Household Income by Mortgage Status in Sunrise Manor
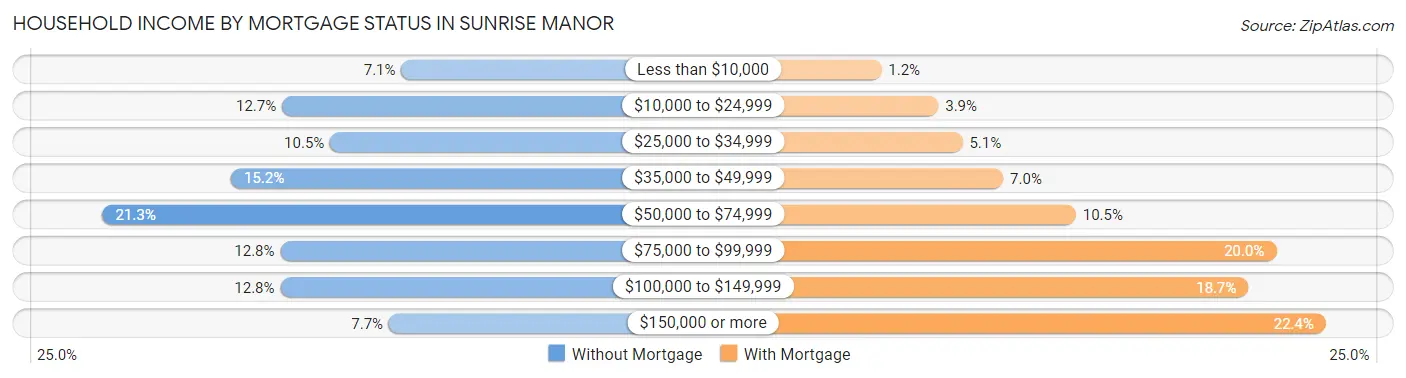
| Household Income | Without Mortgage | With Mortgage |
| Less than $10,000 | 953 (7.1%) | 238 (1.2%) |
| $10,000 to $24,999 | 1,720 (12.7%) | 766 (3.9%) |
| $25,000 to $34,999 | 1,411 (10.4%) | 988 (5.1%) |
| $35,000 to $49,999 | 2,048 (15.2%) | 1,366 (7.0%) |
| $50,000 to $74,999 | 2,875 (21.3%) | 2,037 (10.5%) |
| $75,000 to $99,999 | 1,731 (12.8%) | 3,890 (20.0%) |
| $100,000 to $149,999 | 1,731 (12.8%) | 3,632 (18.7%) |
| $150,000 or more | 1,033 (7.6%) | 4,349 (22.4%) |
| Total | 13,502 (100.0%) | 19,421 (100.0%) |
Property Value to Household Income Ratio in Sunrise Manor
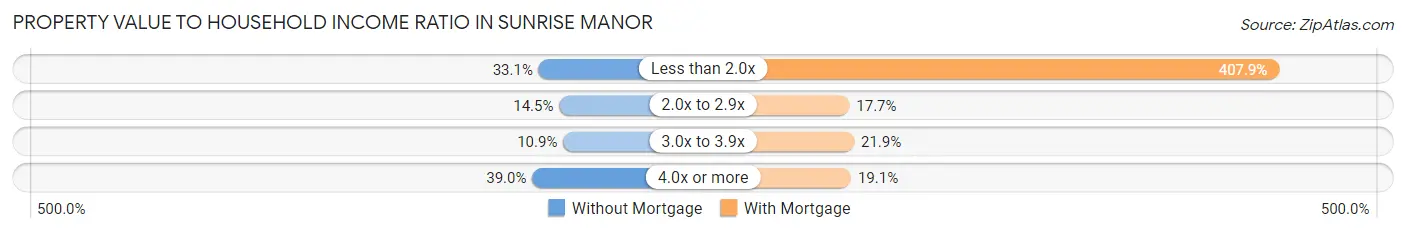
| Value-to-Income Ratio | Without Mortgage | With Mortgage |
| Less than 2.0x | 4,474 (33.1%) | 79,226 (407.9%) |
| 2.0x to 2.9x | 1,952 (14.5%) | 3,430 (17.7%) |
| 3.0x to 3.9x | 1,471 (10.9%) | 4,252 (21.9%) |
| 4.0x or more | 5,260 (39.0%) | 3,711 (19.1%) |
| Total | 13,502 (100.0%) | 19,421 (100.0%) |
Real Estate Taxes by Mortgage Status in Sunrise Manor
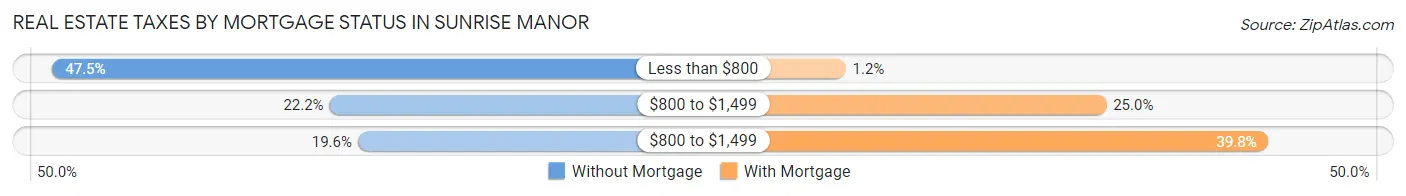
| Property Taxes | Without Mortgage | With Mortgage |
| Less than $800 | 6,409 (47.5%) | 223 (1.1%) |
| $800 to $1,499 | 2,992 (22.2%) | 4,846 (24.9%) |
| $800 to $1,499 | 2,643 (19.6%) | 7,725 (39.8%) |
| Total | 13,502 (100.0%) | 19,421 (100.0%) |
Health & Disability in Sunrise Manor
Health Insurance Coverage by Age in Sunrise Manor
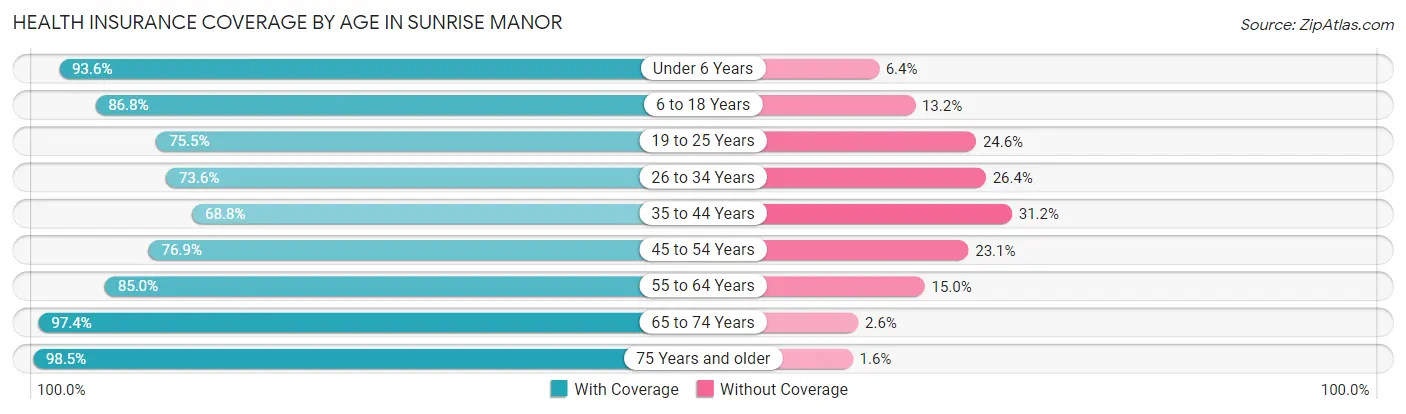
| Age Bracket | With Coverage | Without Coverage |
| Under 6 Years | 15,719 (93.6%) | 1,078 (6.4%) |
| 6 to 18 Years | 35,698 (86.8%) | 5,420 (13.2%) |
| 19 to 25 Years | 15,532 (75.4%) | 5,054 (24.5%) |
| 26 to 34 Years | 18,140 (73.6%) | 6,497 (26.4%) |
| 35 to 44 Years | 17,565 (68.8%) | 7,981 (31.2%) |
| 45 to 54 Years | 18,645 (76.9%) | 5,608 (23.1%) |
| 55 to 64 Years | 18,804 (85.0%) | 3,311 (15.0%) |
| 65 to 74 Years | 14,136 (97.4%) | 374 (2.6%) |
| 75 Years and older | 8,321 (98.5%) | 131 (1.5%) |
| Total | 162,560 (82.1%) | 35,454 (17.9%) |
Health Insurance Coverage by Citizenship Status in Sunrise Manor
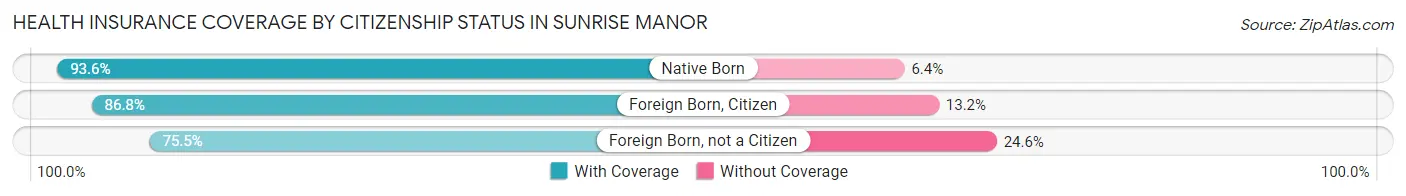
| Citizenship Status | With Coverage | Without Coverage |
| Native Born | 15,719 (93.6%) | 1,078 (6.4%) |
| Foreign Born, Citizen | 35,698 (86.8%) | 5,420 (13.2%) |
| Foreign Born, not a Citizen | 15,532 (75.4%) | 5,054 (24.5%) |
Health Insurance Coverage by Household Income in Sunrise Manor
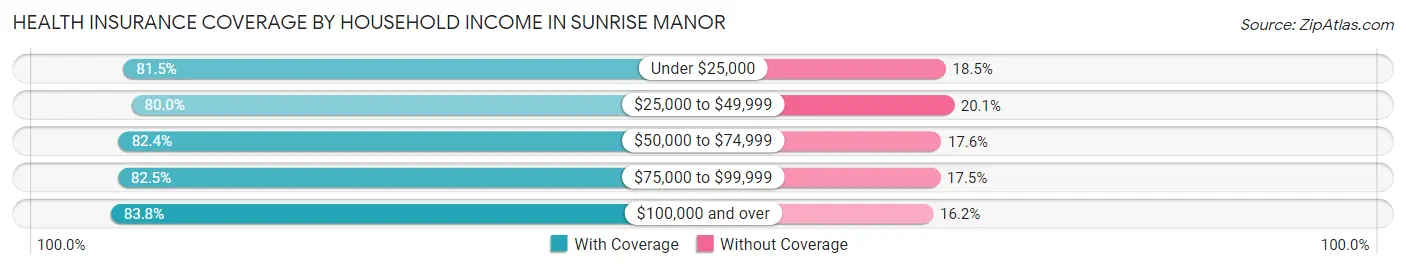
| Household Income | With Coverage | Without Coverage |
| Under $25,000 | 25,548 (81.5%) | 5,806 (18.5%) |
| $25,000 to $49,999 | 35,247 (79.9%) | 8,838 (20.1%) |
| $50,000 to $74,999 | 32,069 (82.4%) | 6,868 (17.6%) |
| $75,000 to $99,999 | 26,457 (82.5%) | 5,603 (17.5%) |
| $100,000 and over | 43,102 (83.8%) | 8,313 (16.2%) |
Public vs Private Health Insurance Coverage by Age in Sunrise Manor
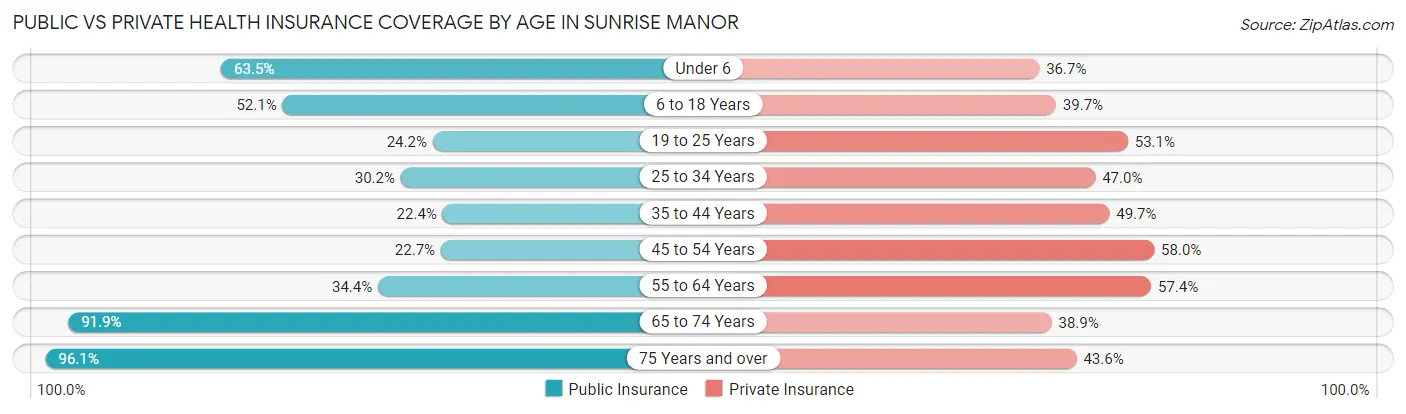
| Age Bracket | Public Insurance | Private Insurance |
| Under 6 | 10,668 (63.5%) | 6,156 (36.6%) |
| 6 to 18 Years | 21,433 (52.1%) | 16,340 (39.7%) |
| 19 to 25 Years | 4,990 (24.2%) | 10,930 (53.1%) |
| 25 to 34 Years | 7,434 (30.2%) | 11,589 (47.0%) |
| 35 to 44 Years | 5,723 (22.4%) | 12,684 (49.6%) |
| 45 to 54 Years | 5,512 (22.7%) | 14,061 (58.0%) |
| 55 to 64 Years | 7,607 (34.4%) | 12,696 (57.4%) |
| 65 to 74 Years | 13,335 (91.9%) | 5,649 (38.9%) |
| 75 Years and over | 8,123 (96.1%) | 3,682 (43.6%) |
| Total | 84,825 (42.8%) | 93,787 (47.4%) |
Disability Status by Sex by Age in Sunrise Manor
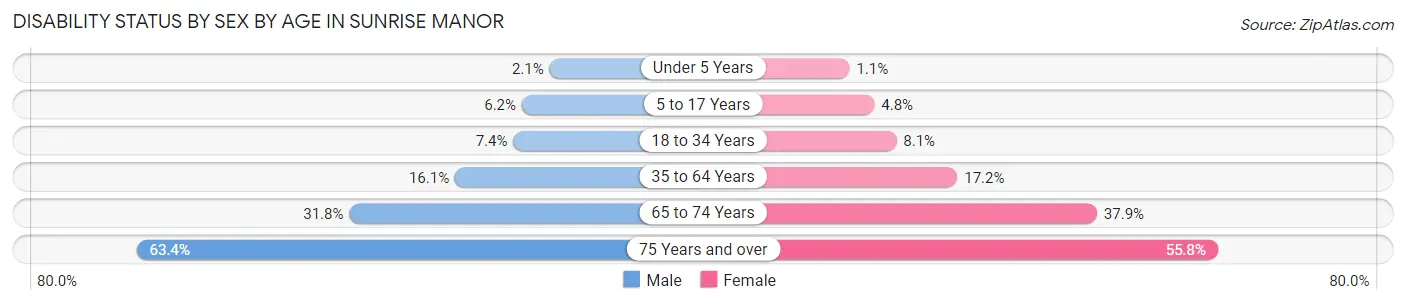
| Age Bracket | Male | Female |
| Under 5 Years | 137 (2.1%) | 82 (1.1%) |
| 5 to 17 Years | 1,251 (6.2%) | 999 (4.8%) |
| 18 to 34 Years | 1,741 (7.4%) | 2,014 (8.1%) |
| 35 to 64 Years | 5,632 (16.1%) | 6,332 (17.2%) |
| 65 to 74 Years | 2,266 (31.8%) | 2,797 (37.9%) |
| 75 Years and over | 2,400 (63.4%) | 2,604 (55.8%) |
Disability Class by Sex by Age in Sunrise Manor
Disability Class: Hearing Difficulty
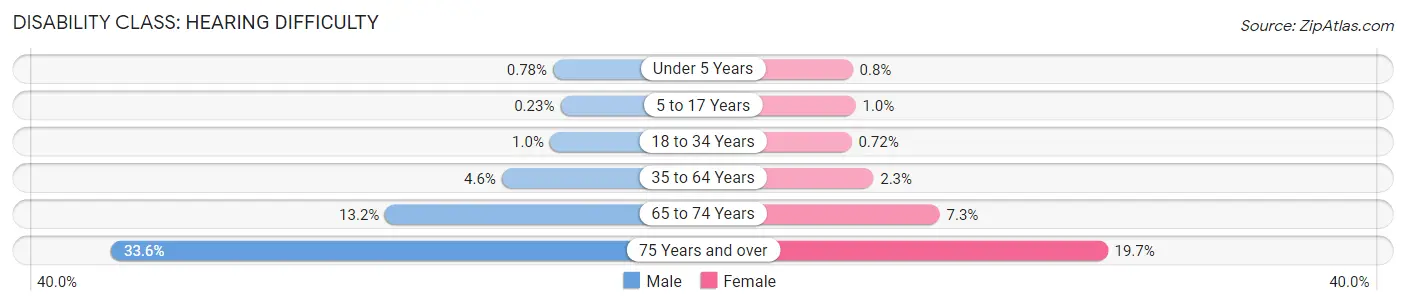
| Age Bracket | Male | Female |
| Under 5 Years | 52 (0.8%) | 57 (0.8%) |
| 5 to 17 Years | 46 (0.2%) | 211 (1.0%) |
| 18 to 34 Years | 237 (1.0%) | 178 (0.7%) |
| 35 to 64 Years | 1,602 (4.6%) | 862 (2.3%) |
| 65 to 74 Years | 943 (13.2%) | 536 (7.3%) |
| 75 Years and over | 1,272 (33.6%) | 920 (19.7%) |
Disability Class: Vision Difficulty
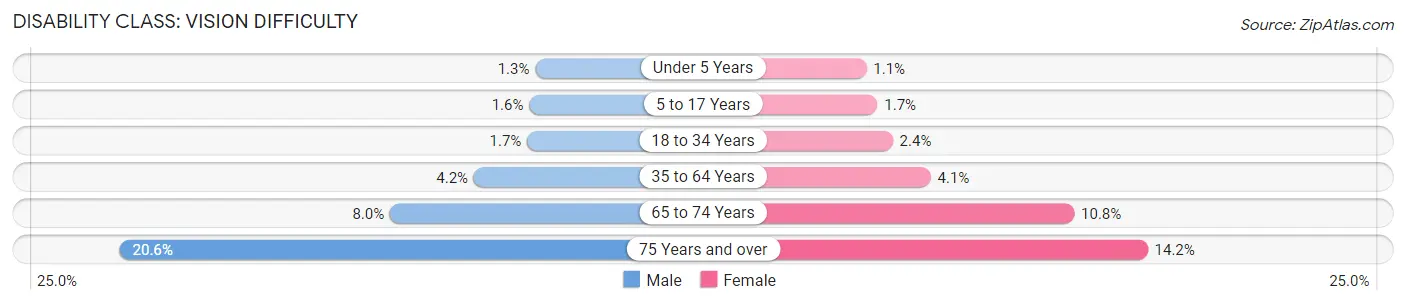
| Age Bracket | Male | Female |
| Under 5 Years | 87 (1.3%) | 82 (1.1%) |
| 5 to 17 Years | 321 (1.6%) | 342 (1.7%) |
| 18 to 34 Years | 395 (1.7%) | 586 (2.4%) |
| 35 to 64 Years | 1,452 (4.2%) | 1,520 (4.1%) |
| 65 to 74 Years | 573 (8.0%) | 796 (10.8%) |
| 75 Years and over | 780 (20.6%) | 662 (14.2%) |
Disability Class: Cognitive Difficulty
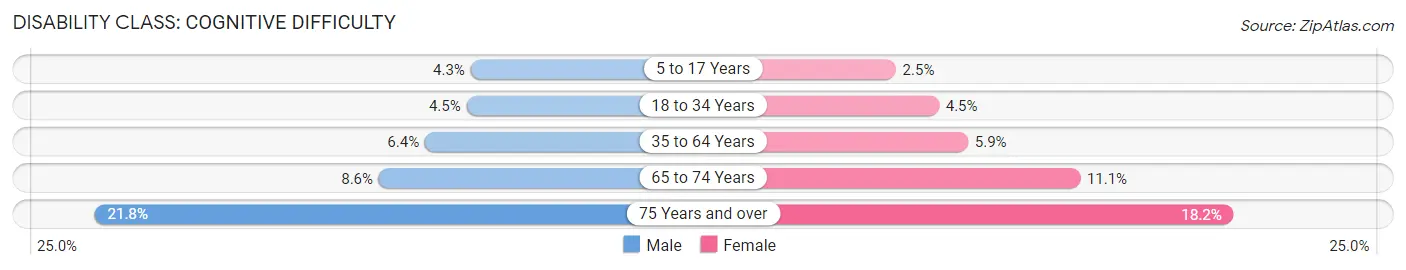
| Age Bracket | Male | Female |
| 5 to 17 Years | 873 (4.3%) | 518 (2.5%) |
| 18 to 34 Years | 1,053 (4.5%) | 1,118 (4.5%) |
| 35 to 64 Years | 2,246 (6.4%) | 2,161 (5.9%) |
| 65 to 74 Years | 610 (8.6%) | 816 (11.1%) |
| 75 Years and over | 824 (21.7%) | 848 (18.2%) |
Disability Class: Ambulatory Difficulty
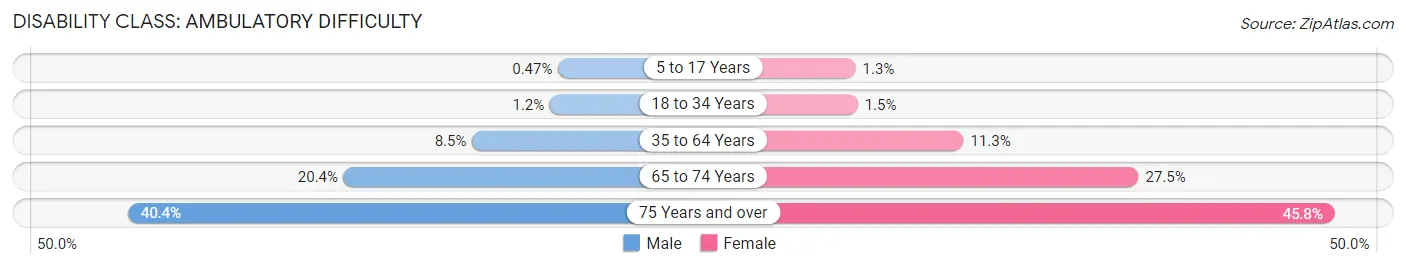
| Age Bracket | Male | Female |
| 5 to 17 Years | 96 (0.5%) | 265 (1.3%) |
| 18 to 34 Years | 289 (1.2%) | 367 (1.5%) |
| 35 to 64 Years | 2,958 (8.5%) | 4,172 (11.3%) |
| 65 to 74 Years | 1,452 (20.4%) | 2,033 (27.5%) |
| 75 Years and over | 1,531 (40.4%) | 2,134 (45.8%) |
Disability Class: Self-Care Difficulty
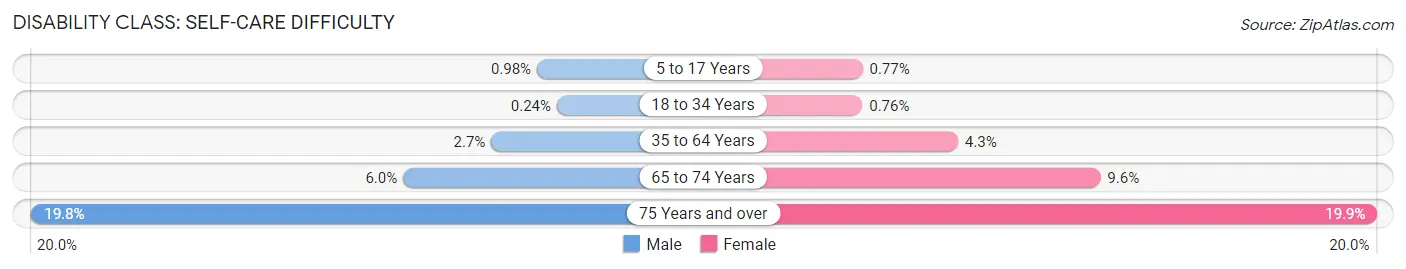
| Age Bracket | Male | Female |
| 5 to 17 Years | 199 (1.0%) | 160 (0.8%) |
| 18 to 34 Years | 56 (0.2%) | 190 (0.8%) |
| 35 to 64 Years | 937 (2.7%) | 1,591 (4.3%) |
| 65 to 74 Years | 424 (5.9%) | 709 (9.6%) |
| 75 Years and over | 748 (19.8%) | 927 (19.9%) |
Technology Access in Sunrise Manor
Computing Device Access in Sunrise Manor
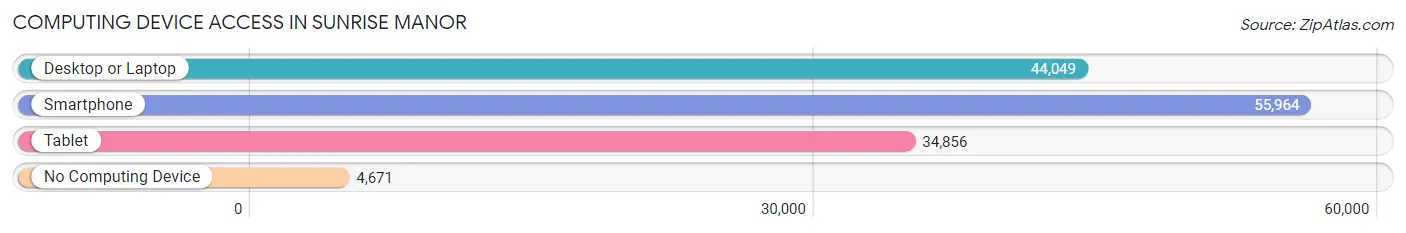
| Device Type | # Households | % Households |
| Desktop or Laptop | 44,049 | 68.5% |
| Smartphone | 55,964 | 87.1% |
| Tablet | 34,856 | 54.2% |
| No Computing Device | 4,671 | 7.3% |
| Total | 64,271 | 100.0% |
Internet Access in Sunrise Manor
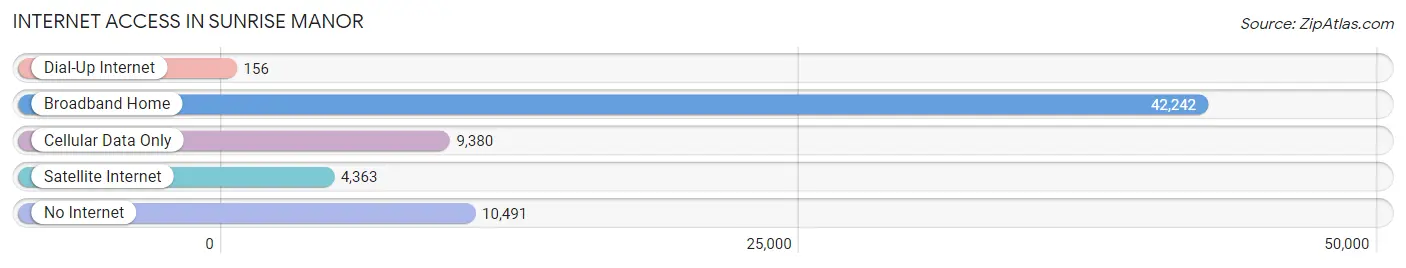
| Internet Type | # Households | % Households |
| Dial-Up Internet | 156 | 0.2% |
| Broadband Home | 42,242 | 65.7% |
| Cellular Data Only | 9,380 | 14.6% |
| Satellite Internet | 4,363 | 6.8% |
| No Internet | 10,491 | 16.3% |
| Total | 64,271 | 100.0% |
Sunrise Manor Summary
Sunrise Manor is a census-designated place (CDP) located in Clark County, Nevada, United States. The population was 189,372 at the 2010 census, making it the most populous unincorporated community in Nevada. It is located in the Las Vegas–Paradise metropolitan area.
History
Sunrise Manor was first settled in the 1950s as a residential area for workers in the nearby Las Vegas Strip. The area was originally known as Sunrise Acres, and was annexed by the City of Las Vegas in 1957. In the late 1960s, the area was renamed Sunrise Manor, and the City of Las Vegas began to develop the area as a residential community.
In the 1970s, the area experienced rapid growth as the Las Vegas Strip began to expand. The population of Sunrise Manor increased from 8,000 in 1970 to over 100,000 by the end of the decade.
Geography
Sunrise Manor is located in the Las Vegas Valley, approximately 8 miles east of the Las Vegas Strip. The CDP has a total area of 33.3 square miles, of which 33.2 square miles is land and 0.1 square miles is water.
The terrain of Sunrise Manor is mostly flat, with some hills in the northern and western parts of the CDP. The highest point in Sunrise Manor is the summit of Sunrise Mountain, which has an elevation of 3,817 feet.
Economy
Sunrise Manor is home to a variety of businesses, including retail stores, restaurants, and hotels. The area is also home to several casinos, including the Stratosphere Casino, the Sahara Hotel and Casino, and the Silverton Casino.
The economy of Sunrise Manor is largely driven by tourism and the hospitality industry. The area is home to several major hotels, including the Stratosphere Hotel and Casino, the Sahara Hotel and Casino, and the Silverton Casino.
Demographics
As of the 2010 census, there were 189,372 people, 68,945 households, and 47,945 families residing in the CDP. The population density was 5,711.3 people per square mile. There were 75,945 housing units at an average density of 2,288.3 per square mile.
The racial makeup of the CDP was 63.2% White, 8.3% African American, 0.7% Native American, 5.2% Asian, 0.5% Pacific Islander, 16.2% from other races, and 5.1% from two or more races. Hispanic or Latino of any race were 33.2% of the population.
The median income for a household in the CDP was $41,945, and the median income for a family was $48,945. Males had a median income of $35,945 versus $27,945 for females. The per capita income for the CDP was $20,945. About 11.2% of families and 14.3% of the population were below the poverty line, including 19.2% of those under age 18 and 8.3% of those age 65 or over.
Common Questions
What is Per Capita Income in Sunrise Manor?
Per Capita income in Sunrise Manor is $22,600.
What is the Median Family Income in Sunrise Manor?
Median Family Income in Sunrise Manor is $59,634.
What is the Median Household income in Sunrise Manor?
Median Household Income in Sunrise Manor is $52,476.
What is Income or Wage Gap in Sunrise Manor?
Income or Wage Gap in Sunrise Manor is 19.3%.
Women in Sunrise Manor earn 80.7 cents for every dollar earned by a man.
What is Family Income Deficit in Sunrise Manor?
Family Income Deficit in Sunrise Manor is $11,662.
Families that are below poverty line in Sunrise Manor earn $11,662 less on average than the poverty threshold level.
What is Inequality or Gini Index in Sunrise Manor?
Inequality or Gini Index in Sunrise Manor is 0.44.
What is the Total Population of Sunrise Manor?
Total Population of Sunrise Manor is 198,325.
What is the Total Male Population of Sunrise Manor?
Total Male Population of Sunrise Manor is 96,602.
What is the Total Female Population of Sunrise Manor?
Total Female Population of Sunrise Manor is 101,723.
What is the Ratio of Males per 100 Females in Sunrise Manor?
There are 94.97 Males per 100 Females in Sunrise Manor.
What is the Ratio of Females per 100 Males in Sunrise Manor?
There are 105.30 Females per 100 Males in Sunrise Manor.
What is the Median Population Age in Sunrise Manor?
Median Population Age in Sunrise Manor is 33.4 Years.
What is the Average Family Size in Sunrise Manor
Average Family Size in Sunrise Manor is 3.7 People.
What is the Average Household Size in Sunrise Manor
Average Household Size in Sunrise Manor is 3.1 People.
How Large is the Labor Force in Sunrise Manor?
There are 91,596 People in the Labor Forcein in Sunrise Manor.
What is the Percentage of People in the Labor Force in Sunrise Manor?
61.3% of People are in the Labor Force in Sunrise Manor.
What is the Unemployment Rate in Sunrise Manor?
Unemployment Rate in Sunrise Manor is 9.1%.