Lafayette, LA Map & Demographics
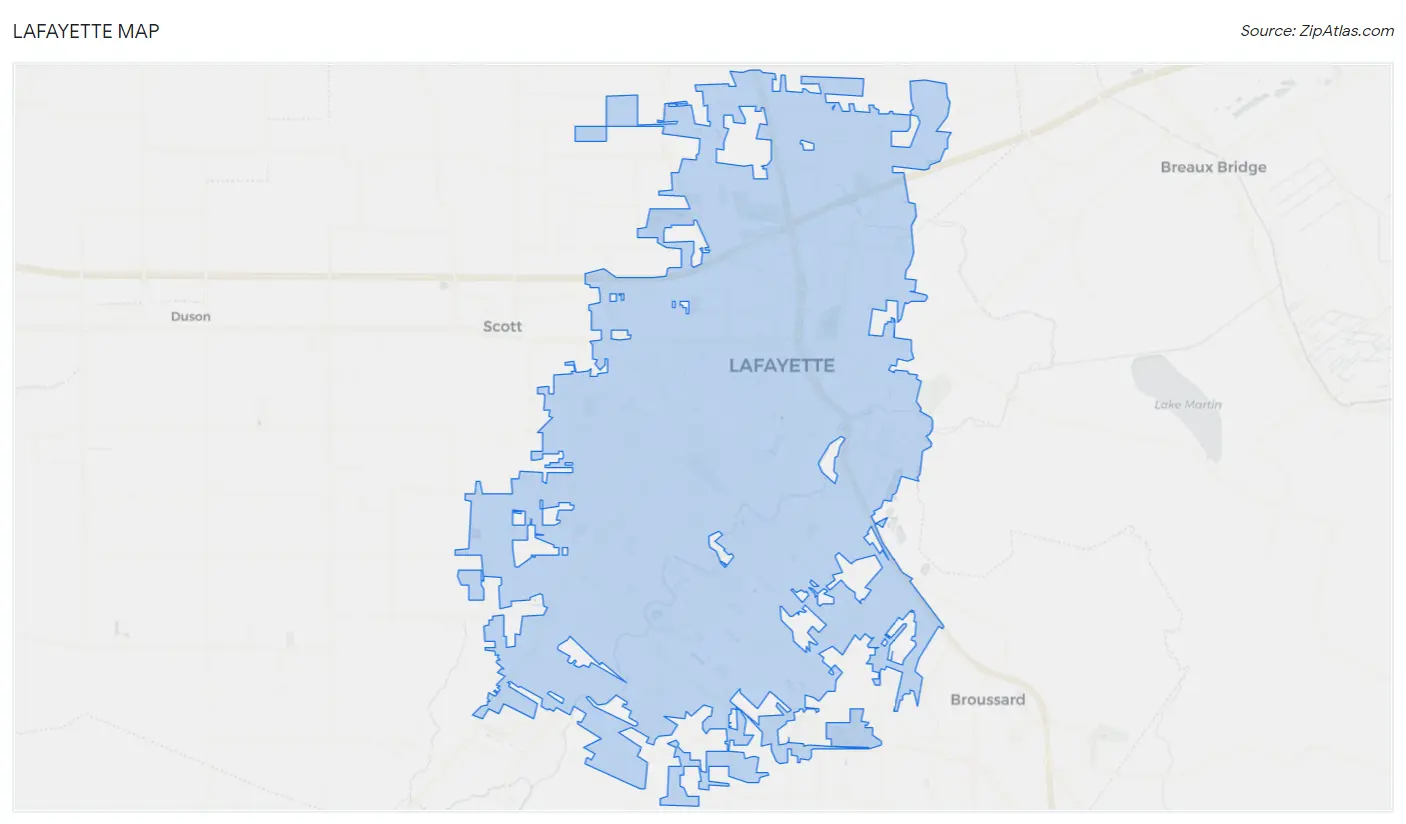
Lafayette Map
Lafayette Overview
$37,651
PER CAPITA INCOME
$85,173
AVG FAMILY INCOME
$58,850
AVG HOUSEHOLD INCOME
39.4%
WAGE / INCOME GAP [ % ]
60.6¢/ $1
WAGE / INCOME GAP [ $ ]
$11,645
FAMILY INCOME DEFICIT
0.51
INEQUALITY / GINI INDEX
121,706
TOTAL POPULATION
59,489
MALE POPULATION
62,217
FEMALE POPULATION
95.62
MALES / 100 FEMALES
104.59
FEMALES / 100 MALES
36.9
MEDIAN AGE
3.0
AVG FAMILY SIZE
2.3
AVG HOUSEHOLD SIZE
62,053
LABOR FORCE [ PEOPLE ]
62.9%
PERCENT IN LABOR FORCE
6.1%
UNEMPLOYMENT RATE
Lafayette Area Codes
Income in Lafayette
Income Overview in Lafayette
Per Capita Income in Lafayette is $37,651, while median incomes of families and households are $85,173 and $58,850 respectively.
| Characteristic | Number | Measure |
| Per Capita Income | 121,706 | $37,651 |
| Median Family Income | 29,581 | $85,173 |
| Mean Family Income | 29,581 | $112,452 |
| Median Household Income | 51,472 | $58,850 |
| Mean Household Income | 51,472 | $88,102 |
| Income Deficit | 29,581 | $11,645 |
| Wage / Income Gap (%) | 121,706 | 39.39% |
| Wage / Income Gap ($) | 121,706 | 60.61¢ per $1 |
| Gini / Inequality Index | 121,706 | 0.51 |
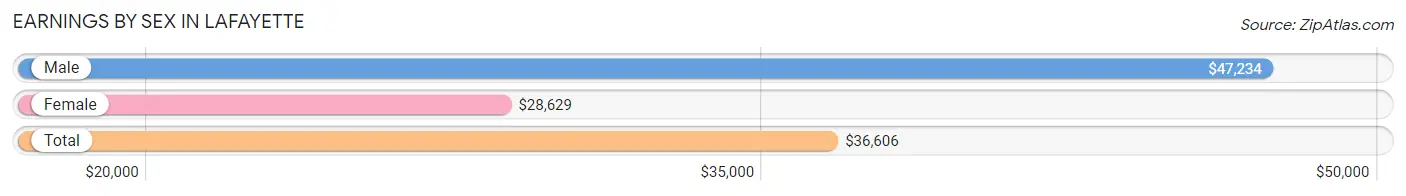
Earnings by Sex in Lafayette
Average Earnings in Lafayette are $36,606, $47,234 for men and $28,629 for women, a difference of 39.4%.
| Sex | Number | Average Earnings |
| Male | 33,945 (52.5%) | $47,234 |
| Female | 30,671 (47.5%) | $28,629 |
| Total | 64,616 (100.0%) | $36,606 |
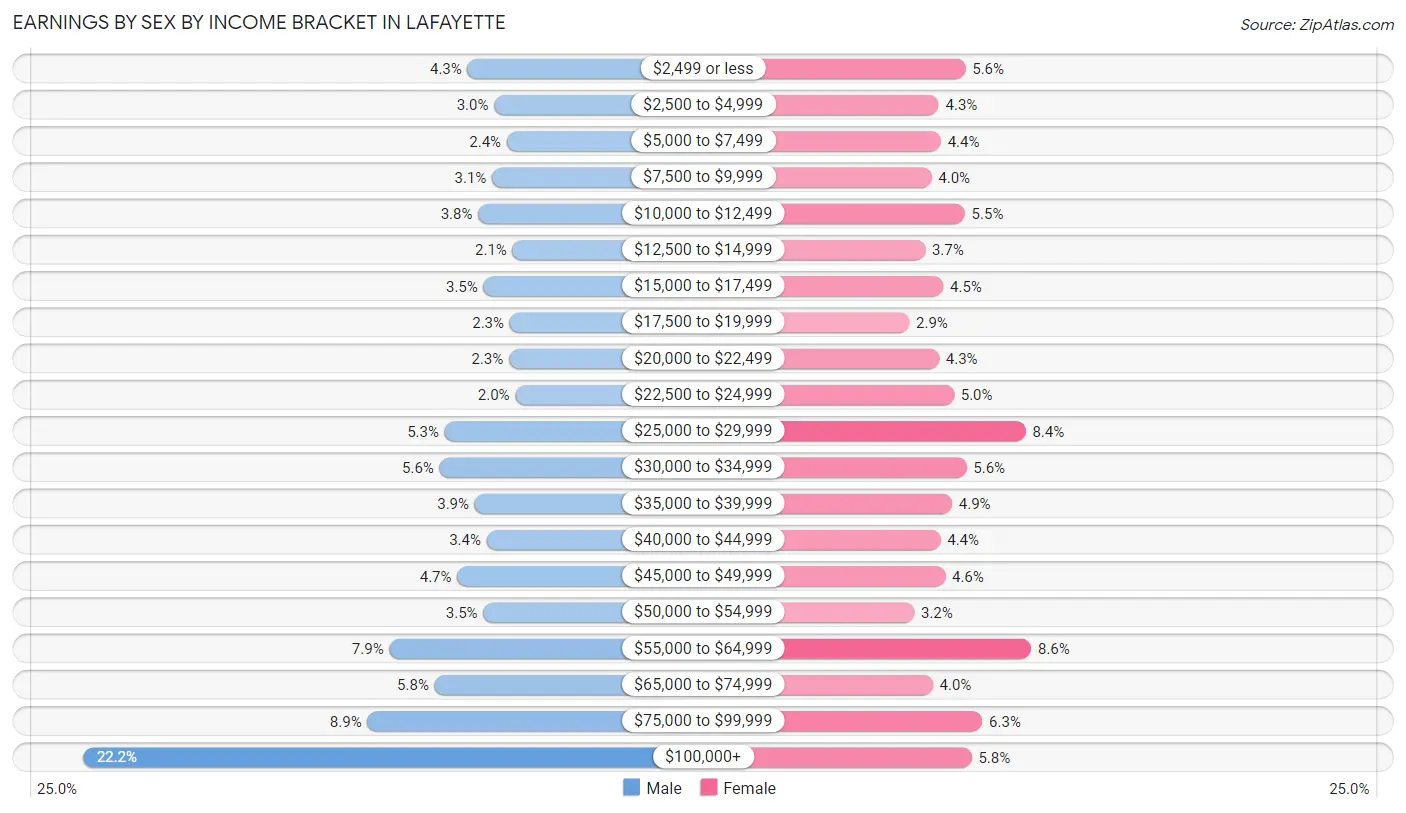
Earnings by Sex by Income Bracket in Lafayette
The most common earnings brackets in Lafayette are $100,000+ for men (7,545 | 22.2%) and $55,000 to $64,999 for women (2,648 | 8.6%).
| Income | Male | Female |
| $2,499 or less | 1,443 (4.3%) | 1,703 (5.6%) |
| $2,500 to $4,999 | 1,019 (3.0%) | 1,320 (4.3%) |
| $5,000 to $7,499 | 817 (2.4%) | 1,350 (4.4%) |
| $7,500 to $9,999 | 1,053 (3.1%) | 1,215 (4.0%) |
| $10,000 to $12,499 | 1,274 (3.7%) | 1,693 (5.5%) |
| $12,500 to $14,999 | 726 (2.1%) | 1,122 (3.7%) |
| $15,000 to $17,499 | 1,189 (3.5%) | 1,383 (4.5%) |
| $17,500 to $19,999 | 772 (2.3%) | 896 (2.9%) |
| $20,000 to $22,499 | 785 (2.3%) | 1,323 (4.3%) |
| $22,500 to $24,999 | 682 (2.0%) | 1,536 (5.0%) |
| $25,000 to $29,999 | 1,807 (5.3%) | 2,566 (8.4%) |
| $30,000 to $34,999 | 1,889 (5.6%) | 1,717 (5.6%) |
| $35,000 to $39,999 | 1,327 (3.9%) | 1,510 (4.9%) |
| $40,000 to $44,999 | 1,136 (3.4%) | 1,343 (4.4%) |
| $45,000 to $49,999 | 1,607 (4.7%) | 1,410 (4.6%) |
| $50,000 to $54,999 | 1,190 (3.5%) | 966 (3.2%) |
| $55,000 to $64,999 | 2,686 (7.9%) | 2,648 (8.6%) |
| $65,000 to $74,999 | 1,965 (5.8%) | 1,233 (4.0%) |
| $75,000 to $99,999 | 3,033 (8.9%) | 1,945 (6.3%) |
| $100,000+ | 7,545 (22.2%) | 1,792 (5.8%) |
| Total | 33,945 (100.0%) | 30,671 (100.0%) |
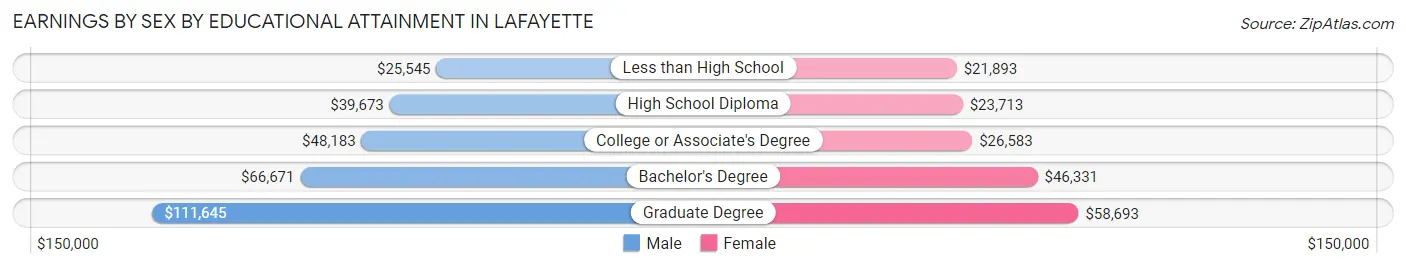
Earnings by Sex by Educational Attainment in Lafayette
Average earnings in Lafayette are $56,389 for men and $34,403 for women, a difference of 39.0%. Men with an educational attainment of graduate degree enjoy the highest average annual earnings of $111,645, while those with less than high school education earn the least with $25,545. Women with an educational attainment of graduate degree earn the most with the average annual earnings of $58,693, while those with less than high school education have the smallest earnings of $21,893.
| Educational Attainment | Male Income | Female Income |
| Less than High School | $25,545 | $21,893 |
| High School Diploma | $39,673 | $23,713 |
| College or Associate's Degree | $48,183 | $26,583 |
| Bachelor's Degree | $66,671 | $46,331 |
| Graduate Degree | $111,645 | $58,693 |
| Total | $56,389 | $34,403 |
Family Income in Lafayette
Family Income Brackets in Lafayette
According to the Lafayette family income data, there are 5,650 families falling into the $100,000 to $149,999 income range, which is the most common income bracket and makes up 19.1% of all families. Conversely, the $10,000 to $14,999 income bracket is the least frequent group with only 917 families (3.1%) belonging to this category.
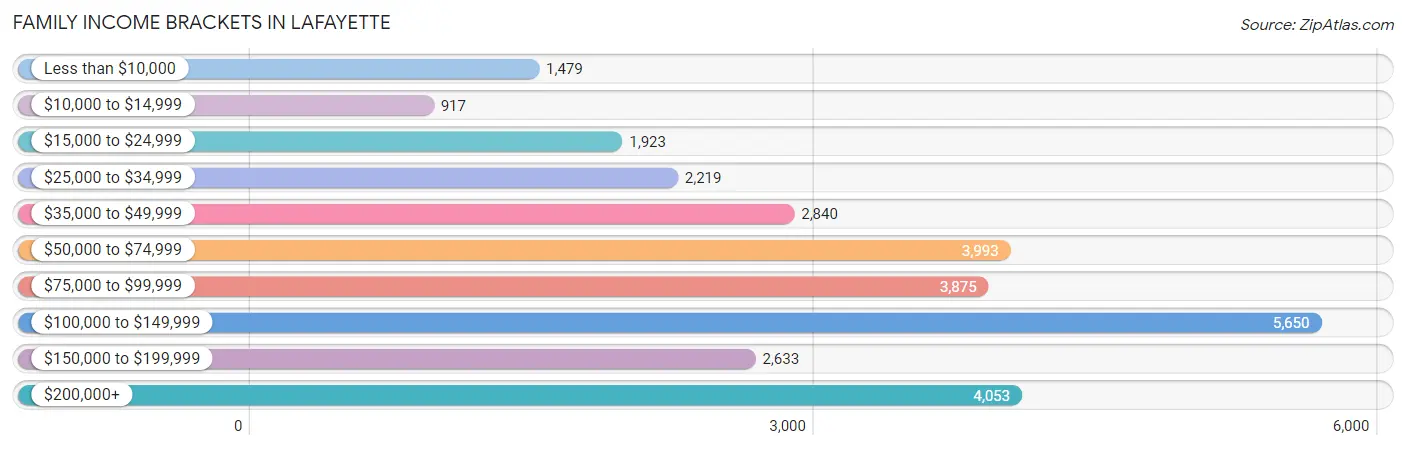
| Income Bracket | # Families | % Families |
| Less than $10,000 | 1,479 | 5.0% |
| $10,000 to $14,999 | 917 | 3.1% |
| $15,000 to $24,999 | 1,923 | 6.5% |
| $25,000 to $34,999 | 2,219 | 7.5% |
| $35,000 to $49,999 | 2,840 | 9.6% |
| $50,000 to $74,999 | 3,993 | 13.5% |
| $75,000 to $99,999 | 3,875 | 13.1% |
| $100,000 to $149,999 | 5,650 | 19.1% |
| $150,000 to $199,999 | 2,633 | 8.9% |
| $200,000+ | 4,053 | 13.7% |
Family Income by Famaliy Size in Lafayette
7+ person families (489 | 1.7%) account for the highest median family income in Lafayette with $110,458 per family, while 2-person families (15,561 | 52.6%) have the highest median income of $38,042 per family member.
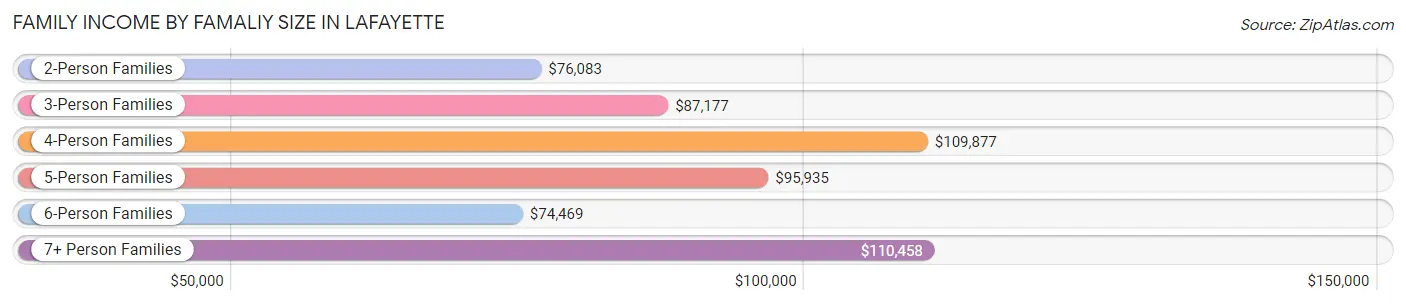
| Income Bracket | # Families | Median Income |
| 2-Person Families | 15,561 (52.6%) | $76,083 |
| 3-Person Families | 5,910 (20.0%) | $87,177 |
| 4-Person Families | 4,607 (15.6%) | $109,877 |
| 5-Person Families | 2,207 (7.5%) | $95,935 |
| 6-Person Families | 807 (2.7%) | $74,469 |
| 7+ Person Families | 489 (1.7%) | $110,458 |
| Total | 29,581 (100.0%) | $85,173 |
Family Income by Number of Earners in Lafayette
The median family income in Lafayette is $85,173, with families comprising 3+ earners (2,164) having the highest median family income of $126,131, while families with no earners (4,584) have the lowest median family income of $32,245, accounting for 7.3% and 15.5% of families, respectively.
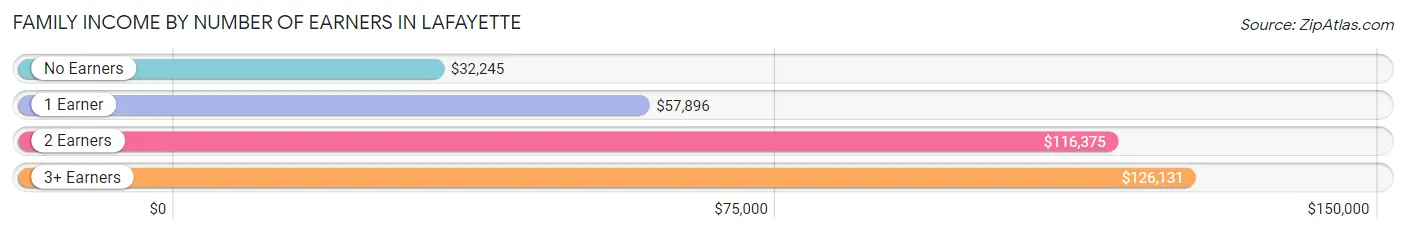
| Number of Earners | # Families | Median Income |
| No Earners | 4,584 (15.5%) | $32,245 |
| 1 Earner | 10,966 (37.1%) | $57,896 |
| 2 Earners | 11,867 (40.1%) | $116,375 |
| 3+ Earners | 2,164 (7.3%) | $126,131 |
| Total | 29,581 (100.0%) | $85,173 |
Household Income in Lafayette
Household Income Brackets in Lafayette
With 7,618 households falling in the category, the $50,000 to $74,999 income range is the most frequent in Lafayette, accounting for 14.8% of all households. In contrast, only 3,088 households (6.0%) fall into the $150,000 to $199,999 income bracket, making it the least populous group.
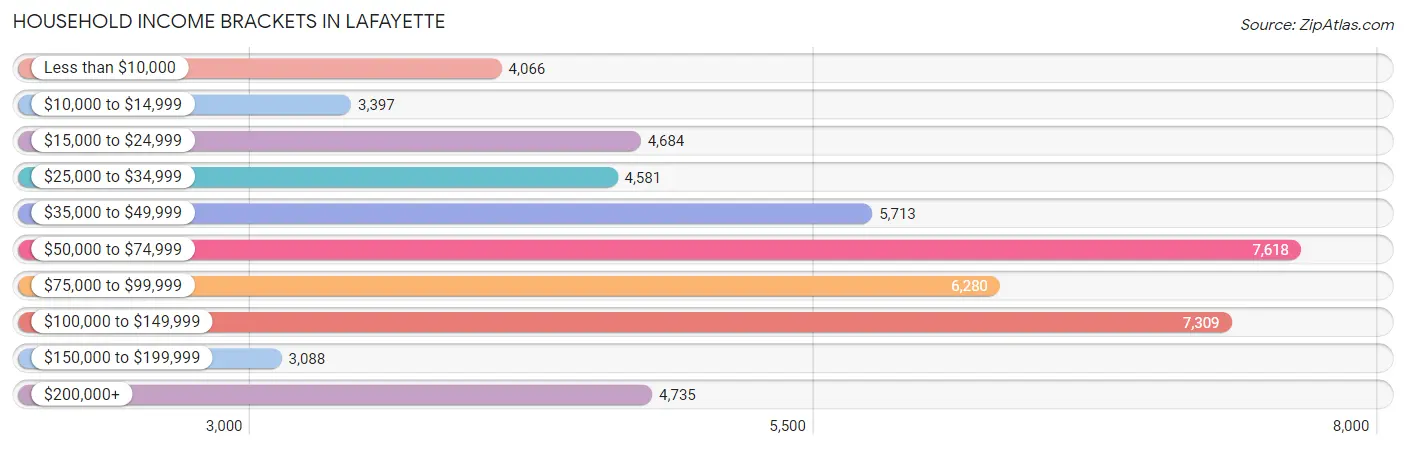
| Income Bracket | # Households | % Households |
| Less than $10,000 | 4,066 | 7.9% |
| $10,000 to $14,999 | 3,397 | 6.6% |
| $15,000 to $24,999 | 4,684 | 9.1% |
| $25,000 to $34,999 | 4,581 | 8.9% |
| $35,000 to $49,999 | 5,713 | 11.1% |
| $50,000 to $74,999 | 7,618 | 14.8% |
| $75,000 to $99,999 | 6,280 | 12.2% |
| $100,000 to $149,999 | 7,309 | 14.2% |
| $150,000 to $199,999 | 3,088 | 6.0% |
| $200,000+ | 4,735 | 9.2% |
Household Income by Householder Age in Lafayette
The median household income in Lafayette is $58,850, with the highest median household income of $72,813 found in the 45 to 64 years age bracket for the primary householder. A total of 16,982 households (33.0%) fall into this category. Meanwhile, the 15 to 24 years age bracket for the primary householder has the lowest median household income of $28,750, with 2,705 households (5.3%) in this group.
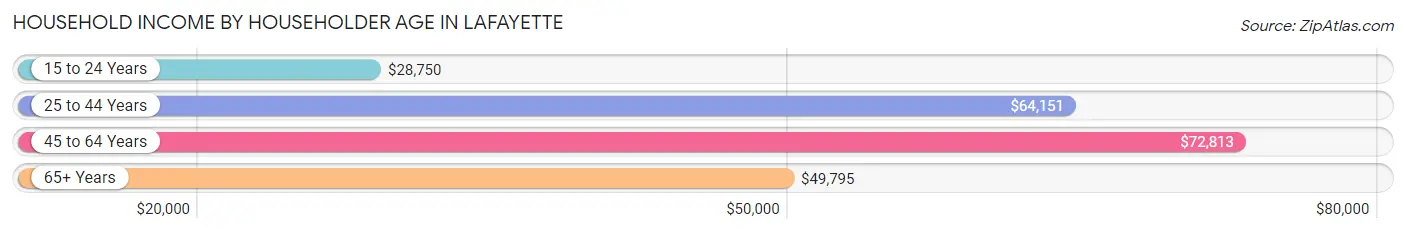
| Income Bracket | # Households | Median Income |
| 15 to 24 Years | 2,705 (5.3%) | $28,750 |
| 25 to 44 Years | 18,530 (36.0%) | $64,151 |
| 45 to 64 Years | 16,982 (33.0%) | $72,813 |
| 65+ Years | 13,255 (25.8%) | $49,795 |
| Total | 51,472 (100.0%) | $58,850 |
Poverty in Lafayette
Income Below Poverty by Sex and Age in Lafayette
With 17.3% poverty level for males and 21.0% for females among the residents of Lafayette, 12 to 14 year old males and 15 year old females are the most vulnerable to poverty, with 985 males (44.2%) and 408 females (37.1%) in their respective age groups living below the poverty level.
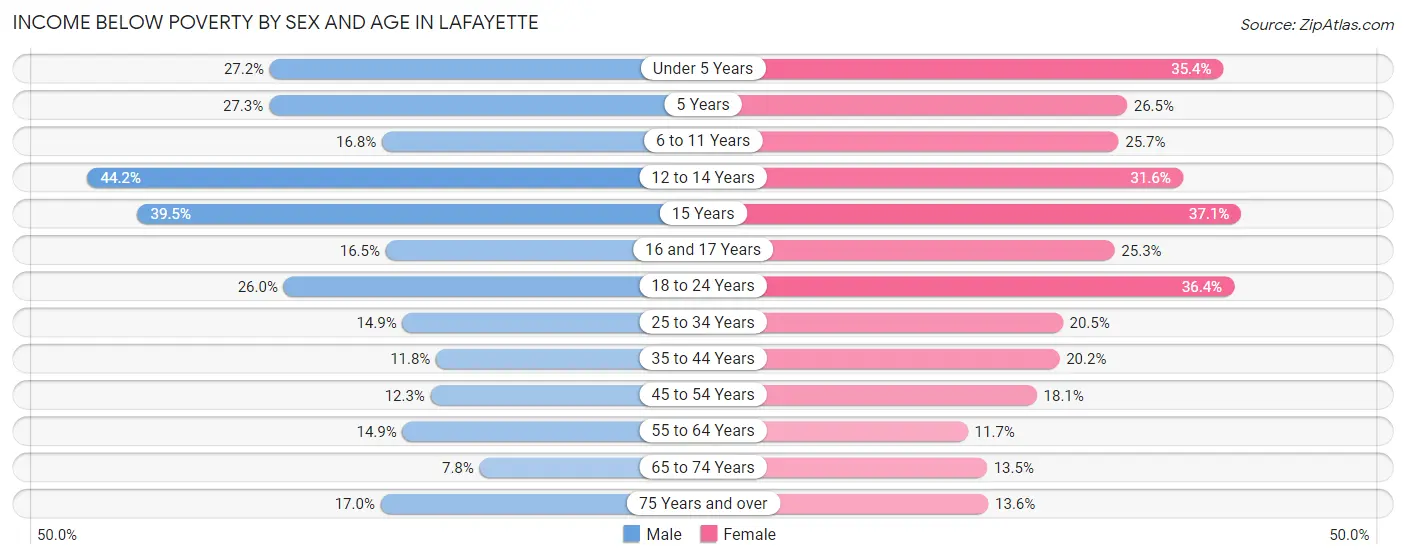
| Age Bracket | Male | Female |
| Under 5 Years | 983 (27.2%) | 1,166 (35.4%) |
| 5 Years | 219 (27.3%) | 192 (26.5%) |
| 6 to 11 Years | 647 (16.8%) | 1,073 (25.7%) |
| 12 to 14 Years | 985 (44.2%) | 680 (31.6%) |
| 15 Years | 358 (39.5%) | 408 (37.1%) |
| 16 and 17 Years | 215 (16.5%) | 355 (25.3%) |
| 18 to 24 Years | 1,396 (26.0%) | 1,792 (36.4%) |
| 25 to 34 Years | 1,475 (14.9%) | 1,789 (20.5%) |
| 35 to 44 Years | 887 (11.8%) | 1,534 (20.2%) |
| 45 to 54 Years | 691 (12.3%) | 1,269 (18.1%) |
| 55 to 64 Years | 1,071 (14.9%) | 1,005 (11.7%) |
| 65 to 74 Years | 462 (7.8%) | 888 (13.5%) |
| 75 Years and over | 525 (17.0%) | 561 (13.6%) |
| Total | 9,914 (17.3%) | 12,712 (21.0%) |
Income Above Poverty by Sex and Age in Lafayette
According to the poverty statistics in Lafayette, males aged 65 to 74 years and females aged 55 to 64 years are the age groups that are most secure financially, with 92.2% of males and 88.3% of females in these age groups living above the poverty line.
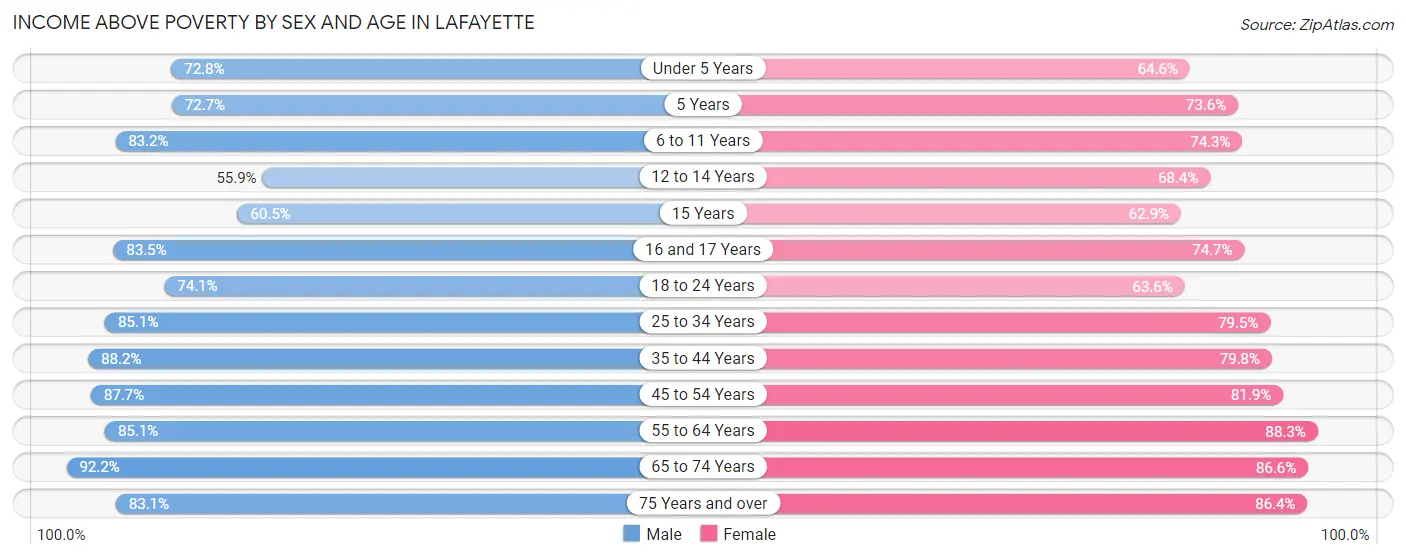
| Age Bracket | Male | Female |
| Under 5 Years | 2,627 (72.8%) | 2,128 (64.6%) |
| 5 Years | 583 (72.7%) | 534 (73.6%) |
| 6 to 11 Years | 3,200 (83.2%) | 3,109 (74.3%) |
| 12 to 14 Years | 1,246 (55.8%) | 1,470 (68.4%) |
| 15 Years | 548 (60.5%) | 693 (62.9%) |
| 16 and 17 Years | 1,090 (83.5%) | 1,048 (74.7%) |
| 18 to 24 Years | 3,984 (74.1%) | 3,133 (63.6%) |
| 25 to 34 Years | 8,403 (85.1%) | 6,940 (79.5%) |
| 35 to 44 Years | 6,631 (88.2%) | 6,066 (79.8%) |
| 45 to 54 Years | 4,923 (87.7%) | 5,751 (81.9%) |
| 55 to 64 Years | 6,107 (85.1%) | 7,598 (88.3%) |
| 65 to 74 Years | 5,483 (92.2%) | 5,712 (86.6%) |
| 75 Years and over | 2,573 (83.1%) | 3,570 (86.4%) |
| Total | 47,398 (82.7%) | 47,752 (79.0%) |
Income Below Poverty Among Married-Couple Families in Lafayette
The poverty statistics for married-couple families in Lafayette show that 4.1% or 840 of the total 20,638 families live below the poverty line. Families with 3 or 4 children have the highest poverty rate of 9.2%, comprising of 171 families. On the other hand, families with no children have the lowest poverty rate of 3.2%, which includes 424 families.
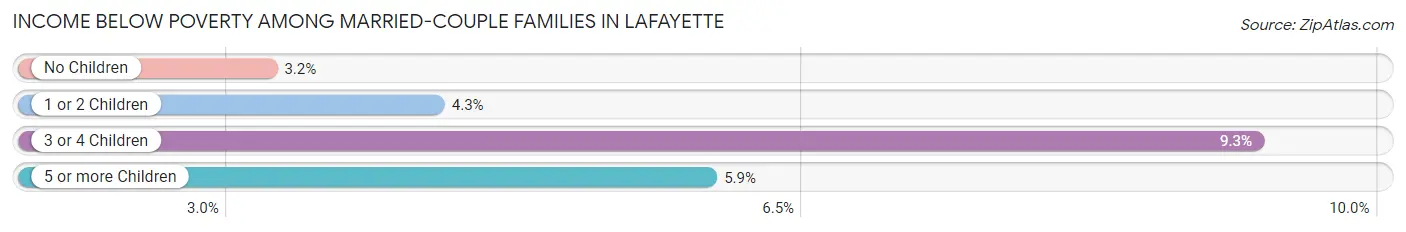
| Children | Above Poverty | Below Poverty |
| No Children | 12,676 (96.8%) | 424 (3.2%) |
| 1 or 2 Children | 5,285 (95.7%) | 235 (4.3%) |
| 3 or 4 Children | 1,678 (90.7%) | 171 (9.2%) |
| 5 or more Children | 159 (94.1%) | 10 (5.9%) |
| Total | 19,798 (95.9%) | 840 (4.1%) |
Income Below Poverty Among Single-Parent Households in Lafayette
According to the poverty data in Lafayette, 13.8% or 270 single-father households and 40.4% or 2,824 single-mother households are living below the poverty line. Among single-father households, those with 1 or 2 children have the highest poverty rate, with 237 households (34.1%) experiencing poverty. Likewise, among single-mother households, those with 3 or 4 children have the highest poverty rate, with 620 households (83.2%) falling below the poverty line.
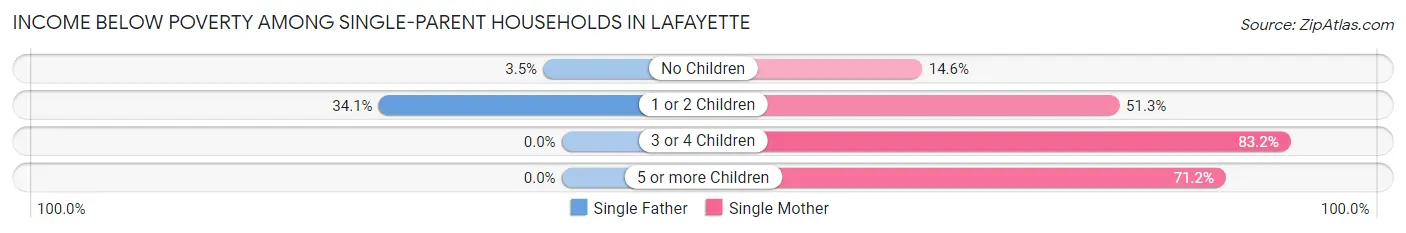
| Children | Single Father | Single Mother |
| No Children | 33 (3.5%) | 417 (14.5%) |
| 1 or 2 Children | 237 (34.1%) | 1,587 (51.3%) |
| 3 or 4 Children | 0 (0.0%) | 620 (83.2%) |
| 5 or more Children | 0 (0.0%) | 200 (71.2%) |
| Total | 270 (13.8%) | 2,824 (40.4%) |
Income Below Poverty Among Married-Couple vs Single-Parent Households in Lafayette
The poverty data for Lafayette shows that 840 of the married-couple family households (4.1%) and 3,094 of the single-parent households (34.6%) are living below the poverty level. Within the married-couple family households, those with 3 or 4 children have the highest poverty rate, with 171 households (9.2%) falling below the poverty line. Among the single-parent households, those with 5 or more children have the highest poverty rate, with 200 household (71.2%) living below poverty.
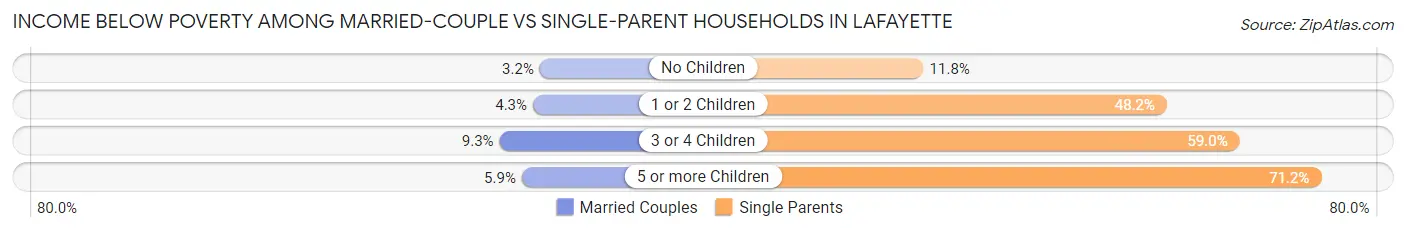
| Children | Married-Couple Families | Single-Parent Households |
| No Children | 424 (3.2%) | 450 (11.8%) |
| 1 or 2 Children | 235 (4.3%) | 1,824 (48.1%) |
| 3 or 4 Children | 171 (9.2%) | 620 (59.0%) |
| 5 or more Children | 10 (5.9%) | 200 (71.2%) |
| Total | 840 (4.1%) | 3,094 (34.6%) |
Race in Lafayette
The most populous races in Lafayette are White / Caucasian (74,251 | 61.0%), Black / African American (35,489 | 29.2%), and Two or more Races (7,678 | 6.3%).
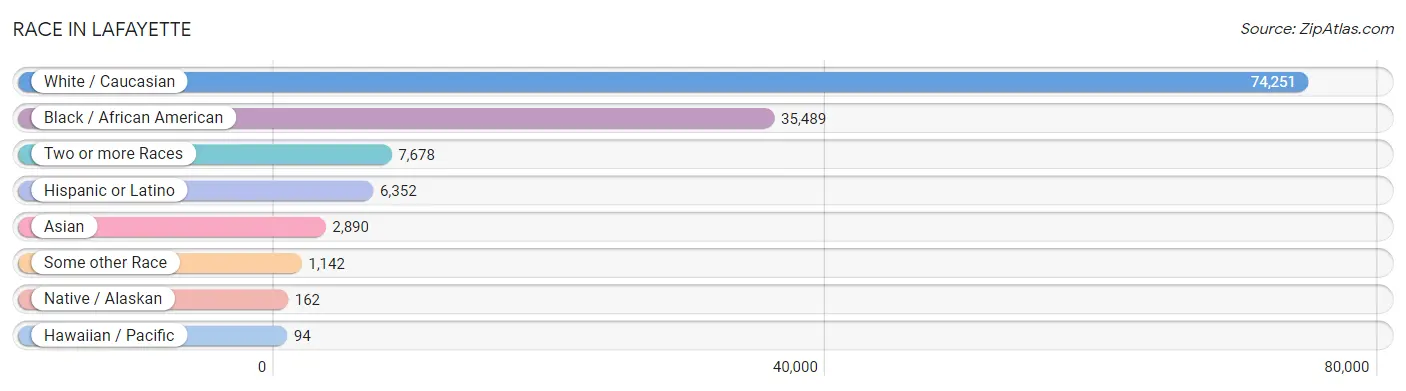
| Race | # Population | % Population |
| Asian | 2,890 | 2.4% |
| Black / African American | 35,489 | 29.2% |
| Hawaiian / Pacific | 94 | 0.1% |
| Hispanic or Latino | 6,352 | 5.2% |
| Native / Alaskan | 162 | 0.1% |
| White / Caucasian | 74,251 | 61.0% |
| Two or more Races | 7,678 | 6.3% |
| Some other Race | 1,142 | 0.9% |
| Total | 121,706 | 100.0% |
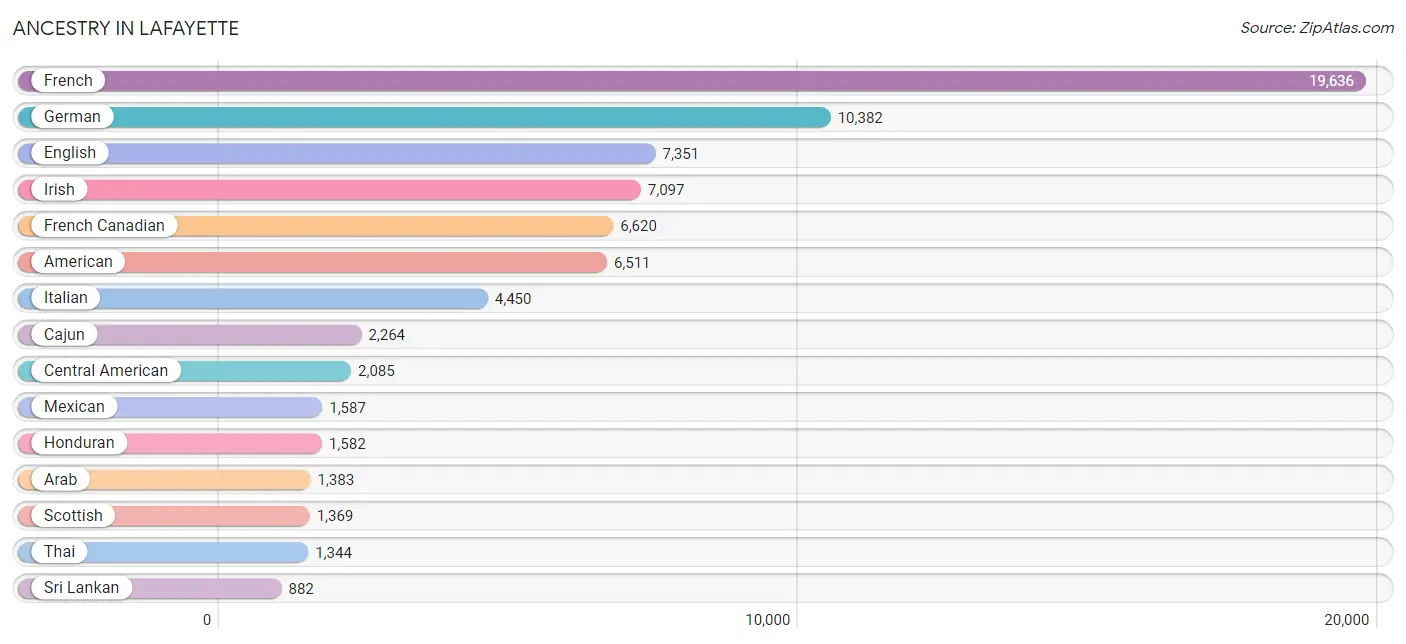
Ancestry in Lafayette
The most populous ancestries reported in Lafayette are French (19,636 | 16.1%), German (10,382 | 8.5%), English (7,351 | 6.0%), Irish (7,097 | 5.8%), and French Canadian (6,620 | 5.4%), together accounting for 42.0% of all Lafayette residents.
| Ancestry | # Population | % Population |
| African | 397 | 0.3% |
| American | 6,511 | 5.3% |
| Apache | 11 | 0.0% |
| Arab | 1,383 | 1.1% |
| Argentinean | 19 | 0.0% |
| Australian | 19 | 0.0% |
| Austrian | 41 | 0.0% |
| Basque | 5 | 0.0% |
| Belgian | 90 | 0.1% |
| Belizean | 1 | 0.0% |
| Bhutanese | 160 | 0.1% |
| Bolivian | 10 | 0.0% |
| Brazilian | 32 | 0.0% |
| British | 495 | 0.4% |
| Bulgarian | 22 | 0.0% |
| Burmese | 150 | 0.1% |
| Cajun | 2,264 | 1.9% |
| Canadian | 165 | 0.1% |
| Celtic | 9 | 0.0% |
| Central American | 2,085 | 1.7% |
| Cherokee | 115 | 0.1% |
| Chilean | 3 | 0.0% |
| Chinese | 2 | 0.0% |
| Choctaw | 44 | 0.0% |
| Colombian | 22 | 0.0% |
| Creek | 6 | 0.0% |
| Croatian | 59 | 0.1% |
| Cuban | 247 | 0.2% |
| Czech | 32 | 0.0% |
| Czechoslovakian | 6 | 0.0% |
| Danish | 124 | 0.1% |
| Dominican | 89 | 0.1% |
| Dutch | 500 | 0.4% |
| Eastern European | 198 | 0.2% |
| Ecuadorian | 248 | 0.2% |
| Egyptian | 42 | 0.0% |
| English | 7,351 | 6.0% |
| Ethiopian | 124 | 0.1% |
| European | 849 | 0.7% |
| Filipino | 14 | 0.0% |
| Finnish | 21 | 0.0% |
| French | 19,636 | 16.1% |
| French Canadian | 6,620 | 5.4% |
| German | 10,382 | 8.5% |
| Greek | 91 | 0.1% |
| Guatemalan | 319 | 0.3% |
| Haitian | 63 | 0.1% |
| Honduran | 1,582 | 1.3% |
| Houma | 35 | 0.0% |
| Hungarian | 26 | 0.0% |
| Indian (Asian) | 533 | 0.4% |
| Indonesian | 17 | 0.0% |
| Iranian | 49 | 0.0% |
| Iraqi | 135 | 0.1% |
| Irish | 7,097 | 5.8% |
| Iroquois | 24 | 0.0% |
| Italian | 4,450 | 3.7% |
| Jamaican | 75 | 0.1% |
| Jordanian | 28 | 0.0% |
| Korean | 362 | 0.3% |
| Laotian | 58 | 0.1% |
| Lebanese | 738 | 0.6% |
| Lithuanian | 66 | 0.1% |
| Luxembourger | 7 | 0.0% |
| Malaysian | 135 | 0.1% |
| Maltese | 10 | 0.0% |
| Mexican | 1,587 | 1.3% |
| Mongolian | 9 | 0.0% |
| Navajo | 44 | 0.0% |
| Nicaraguan | 15 | 0.0% |
| Nigerian | 158 | 0.1% |
| Northern European | 53 | 0.0% |
| Norwegian | 157 | 0.1% |
| Pakistani | 15 | 0.0% |
| Palestinian | 44 | 0.0% |
| Panamanian | 37 | 0.0% |
| Peruvian | 53 | 0.0% |
| Polish | 533 | 0.4% |
| Portuguese | 167 | 0.1% |
| Potawatomi | 6 | 0.0% |
| Puerto Rican | 338 | 0.3% |
| Romanian | 223 | 0.2% |
| Russian | 201 | 0.2% |
| Salvadoran | 132 | 0.1% |
| Samoan | 94 | 0.1% |
| Scandinavian | 127 | 0.1% |
| Scotch-Irish | 881 | 0.7% |
| Scottish | 1,369 | 1.1% |
| Sioux | 14 | 0.0% |
| Slavic | 1 | 0.0% |
| Slovak | 22 | 0.0% |
| Slovene | 6 | 0.0% |
| South African | 11 | 0.0% |
| South American | 778 | 0.6% |
| South American Indian | 9 | 0.0% |
| Spaniard | 323 | 0.3% |
| Spanish | 601 | 0.5% |
| Spanish American | 59 | 0.1% |
| Sri Lankan | 882 | 0.7% |
| Subsaharan African | 743 | 0.6% |
| Swedish | 350 | 0.3% |
| Swiss | 43 | 0.0% |
| Syrian | 39 | 0.0% |
| Thai | 1,344 | 1.1% |
| Trinidadian and Tobagonian | 24 | 0.0% |
| Ugandan | 1 | 0.0% |
| Ukrainian | 119 | 0.1% |
| Venezuelan | 423 | 0.4% |
| Vietnamese | 27 | 0.0% |
| Welsh | 361 | 0.3% |
| West Indian | 14 | 0.0% |
| Yugoslavian | 46 | 0.0% | View All 112 Rows |
Immigrants in Lafayette
The most numerous immigrant groups reported in Lafayette came from Asia (2,893 | 2.4%), Latin America (2,812 | 2.3%), Central America (1,791 | 1.5%), Honduras (1,186 | 1.0%), and South Central Asia (1,155 | 0.9%), together accounting for 8.1% of all Lafayette residents.
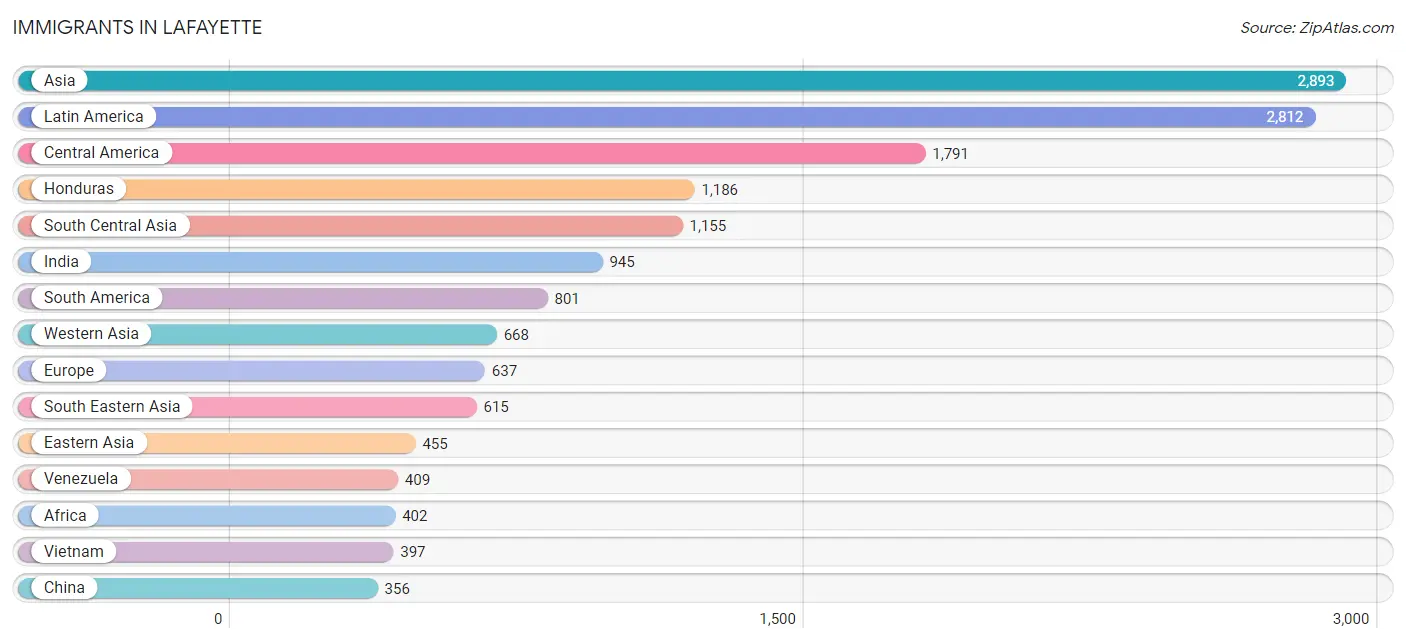
| Immigration Origin | # Population | % Population |
| Africa | 402 | 0.3% |
| Argentina | 19 | 0.0% |
| Asia | 2,893 | 2.4% |
| Australia | 19 | 0.0% |
| Bangladesh | 74 | 0.1% |
| Belarus | 19 | 0.0% |
| Belize | 2 | 0.0% |
| Bolivia | 8 | 0.0% |
| Brazil | 82 | 0.1% |
| Bulgaria | 10 | 0.0% |
| Canada | 143 | 0.1% |
| Caribbean | 220 | 0.2% |
| Central America | 1,791 | 1.5% |
| Chile | 3 | 0.0% |
| China | 356 | 0.3% |
| Colombia | 22 | 0.0% |
| Cuba | 120 | 0.1% |
| Dominican Republic | 24 | 0.0% |
| Eastern Africa | 132 | 0.1% |
| Eastern Asia | 455 | 0.4% |
| Eastern Europe | 318 | 0.3% |
| Ecuador | 248 | 0.2% |
| El Salvador | 31 | 0.0% |
| England | 25 | 0.0% |
| Ethiopia | 124 | 0.1% |
| Europe | 637 | 0.5% |
| France | 46 | 0.0% |
| Germany | 56 | 0.1% |
| Guatemala | 150 | 0.1% |
| Haiti | 22 | 0.0% |
| Honduras | 1,186 | 1.0% |
| Hong Kong | 19 | 0.0% |
| India | 945 | 0.8% |
| Indonesia | 20 | 0.0% |
| Iran | 44 | 0.0% |
| Iraq | 75 | 0.1% |
| Ireland | 106 | 0.1% |
| Israel | 114 | 0.1% |
| Jamaica | 17 | 0.0% |
| Japan | 28 | 0.0% |
| Jordan | 183 | 0.2% |
| Korea | 71 | 0.1% |
| Kuwait | 71 | 0.1% |
| Laos | 25 | 0.0% |
| Latin America | 2,812 | 2.3% |
| Lebanon | 84 | 0.1% |
| Malaysia | 12 | 0.0% |
| Mexico | 340 | 0.3% |
| Nepal | 73 | 0.1% |
| Netherlands | 9 | 0.0% |
| Nicaragua | 6 | 0.0% |
| Nigeria | 185 | 0.2% |
| Northern Europe | 198 | 0.2% |
| Oceania | 113 | 0.1% |
| Pakistan | 19 | 0.0% |
| Peru | 10 | 0.0% |
| Philippines | 144 | 0.1% |
| Poland | 30 | 0.0% |
| Romania | 154 | 0.1% |
| Russia | 10 | 0.0% |
| South Africa | 32 | 0.0% |
| South America | 801 | 0.7% |
| South Central Asia | 1,155 | 0.9% |
| South Eastern Asia | 615 | 0.5% |
| Southern Europe | 10 | 0.0% |
| Sweden | 26 | 0.0% |
| Taiwan | 21 | 0.0% |
| Trinidad and Tobago | 37 | 0.0% |
| Uganda | 1 | 0.0% |
| Ukraine | 95 | 0.1% |
| Venezuela | 409 | 0.3% |
| Vietnam | 397 | 0.3% |
| Western Africa | 205 | 0.2% |
| Western Asia | 668 | 0.5% |
| Western Europe | 111 | 0.1% | View All 75 Rows |
Sex and Age in Lafayette
Sex and Age in Lafayette
The most populous age groups in Lafayette are 25 to 29 Years (5,366 | 9.0%) for men and 35 to 39 Years (4,713 | 7.6%) for women.
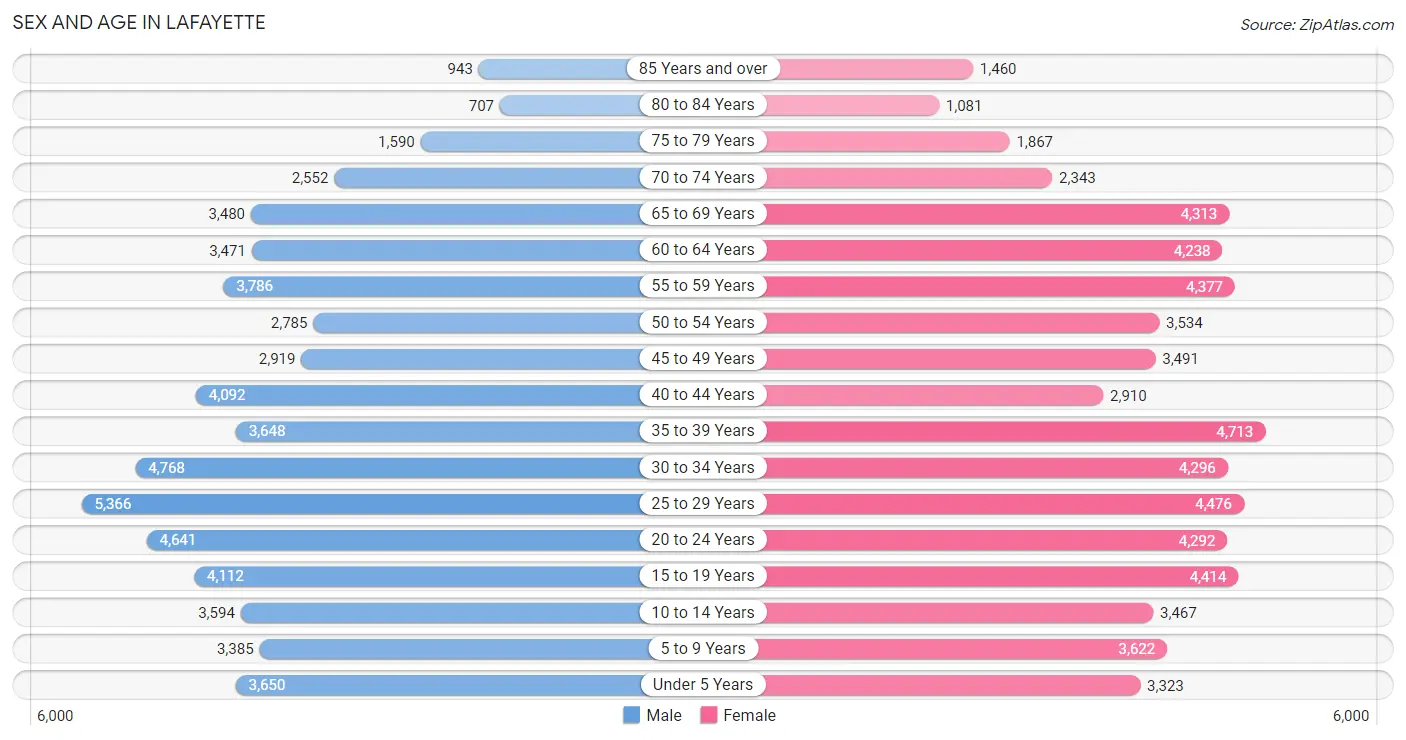
| Age Bracket | Male | Female |
| Under 5 Years | 3,650 (6.1%) | 3,323 (5.3%) |
| 5 to 9 Years | 3,385 (5.7%) | 3,622 (5.8%) |
| 10 to 14 Years | 3,594 (6.0%) | 3,467 (5.6%) |
| 15 to 19 Years | 4,112 (6.9%) | 4,414 (7.1%) |
| 20 to 24 Years | 4,641 (7.8%) | 4,292 (6.9%) |
| 25 to 29 Years | 5,366 (9.0%) | 4,476 (7.2%) |
| 30 to 34 Years | 4,768 (8.0%) | 4,296 (6.9%) |
| 35 to 39 Years | 3,648 (6.1%) | 4,713 (7.6%) |
| 40 to 44 Years | 4,092 (6.9%) | 2,910 (4.7%) |
| 45 to 49 Years | 2,919 (4.9%) | 3,491 (5.6%) |
| 50 to 54 Years | 2,785 (4.7%) | 3,534 (5.7%) |
| 55 to 59 Years | 3,786 (6.4%) | 4,377 (7.0%) |
| 60 to 64 Years | 3,471 (5.8%) | 4,238 (6.8%) |
| 65 to 69 Years | 3,480 (5.9%) | 4,313 (6.9%) |
| 70 to 74 Years | 2,552 (4.3%) | 2,343 (3.8%) |
| 75 to 79 Years | 1,590 (2.7%) | 1,867 (3.0%) |
| 80 to 84 Years | 707 (1.2%) | 1,081 (1.7%) |
| 85 Years and over | 943 (1.6%) | 1,460 (2.4%) |
| Total | 59,489 (100.0%) | 62,217 (100.0%) |
Families and Households in Lafayette
Median Family Size in Lafayette
The median family size in Lafayette is 2.98 persons per family, with single female/mother families (6,985 | 23.6%) accounting for the largest median family size of 3.13 persons per family. On the other hand, single male/father families (1,958 | 6.6%) represent the smallest median family size with 2.93 persons per family.
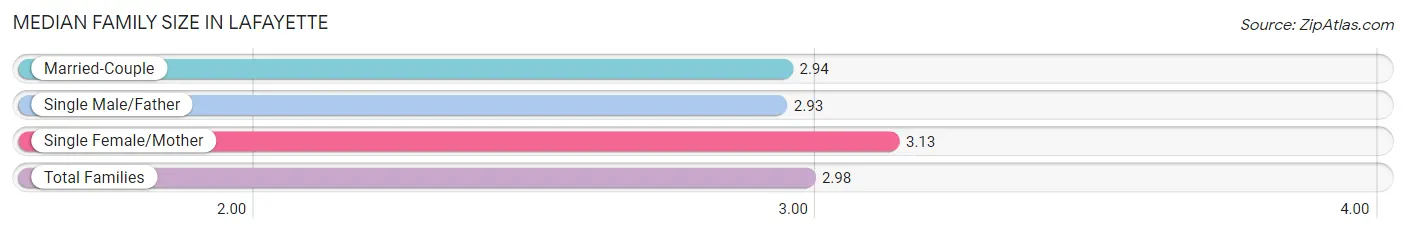
| Family Type | # Families | Family Size |
| Married-Couple | 20,638 (69.8%) | 2.94 |
| Single Male/Father | 1,958 (6.6%) | 2.93 |
| Single Female/Mother | 6,985 (23.6%) | 3.13 |
| Total Families | 29,581 (100.0%) | 2.98 |
Median Household Size in Lafayette
The median household size in Lafayette is 2.28 persons per household, with single female/mother households (6,985 | 13.6%) accounting for the largest median household size of 3.25 persons per household. non-family households (21,891 | 42.5%) represent the smallest median household size with 1.27 persons per household.
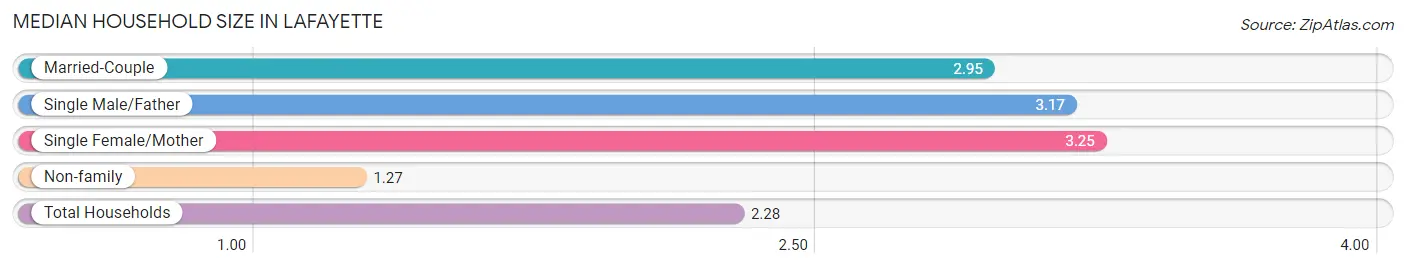
| Household Type | # Households | Household Size |
| Married-Couple | 20,638 (40.1%) | 2.95 |
| Single Male/Father | 1,958 (3.8%) | 3.17 |
| Single Female/Mother | 6,985 (13.6%) | 3.25 |
| Non-family | 21,891 (42.5%) | 1.27 |
| Total Households | 51,472 (100.0%) | 2.28 |
Household Size by Marriage Status in Lafayette
Out of a total of 51,472 households in Lafayette, 29,581 (57.5%) are family households, while 21,891 (42.5%) are nonfamily households. The most numerous type of family households are 2-person households, comprising 14,937, and the most common type of nonfamily households are 1-person households, comprising 17,529.
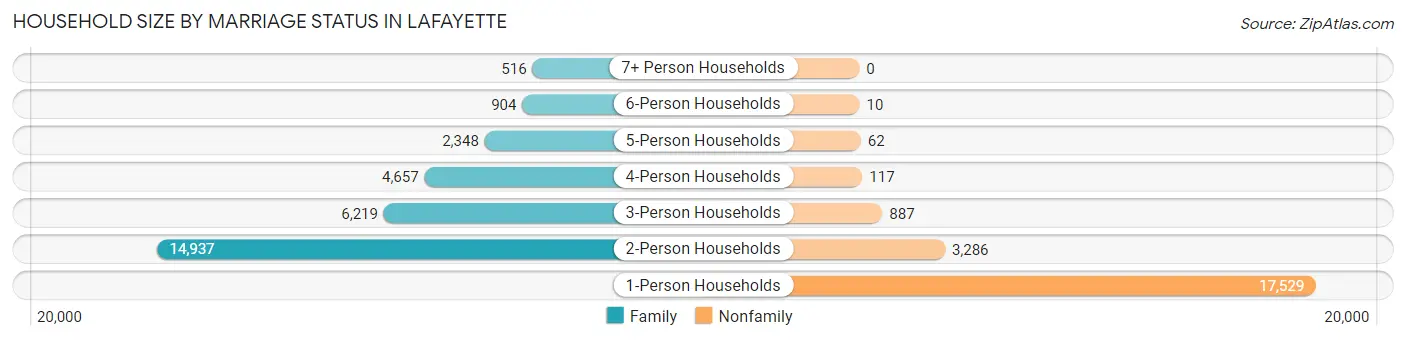
| Household Size | Family Households | Nonfamily Households |
| 1-Person Households | - | 17,529 (34.1%) |
| 2-Person Households | 14,937 (29.0%) | 3,286 (6.4%) |
| 3-Person Households | 6,219 (12.1%) | 887 (1.7%) |
| 4-Person Households | 4,657 (9.0%) | 117 (0.2%) |
| 5-Person Households | 2,348 (4.6%) | 62 (0.1%) |
| 6-Person Households | 904 (1.8%) | 10 (0.0%) |
| 7+ Person Households | 516 (1.0%) | 0 (0.0%) |
| Total | 29,581 (57.5%) | 21,891 (42.5%) |
Female Fertility in Lafayette
Fertility by Age in Lafayette
Average fertility rate in Lafayette is 48.0 births per 1,000 women. Women in the age bracket of 20 to 34 years have the highest fertility rate with 83.0 births per 1,000 women. Women in the age bracket of 20 to 34 years acount for 78.0% of all women with births.
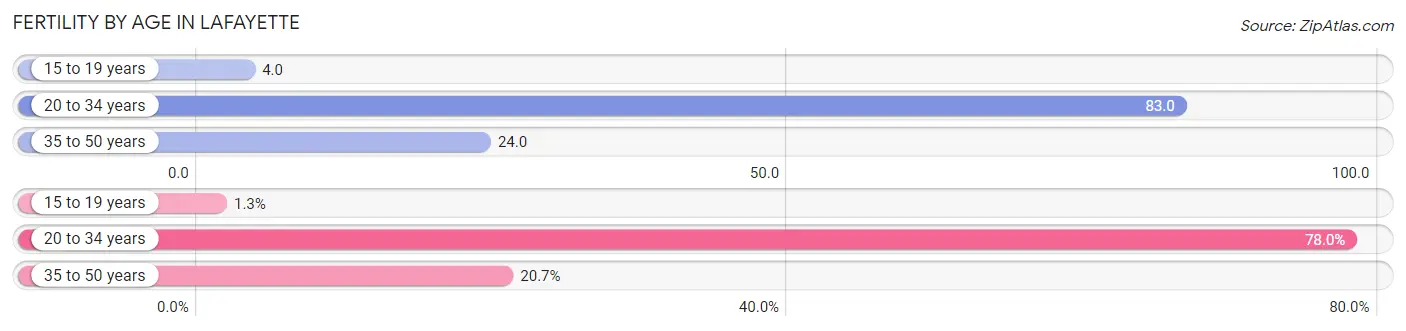
| Age Bracket | Women with Births | Births / 1,000 Women |
| 15 to 19 years | 18 (1.3%) | 4.0 |
| 20 to 34 years | 1,088 (78.0%) | 83.0 |
| 35 to 50 years | 289 (20.7%) | 24.0 |
| Total | 1,395 (100.0%) | 48.0 |
Fertility by Age by Marriage Status in Lafayette
56.3% of women with births (1,395) in Lafayette are married. The highest percentage of unmarried women with births falls into 15 to 19 years age bracket with 100.0% of them unmarried at the time of birth, while the lowest percentage of unmarried women with births belong to 35 to 50 years age bracket with 14.9% of them unmarried.
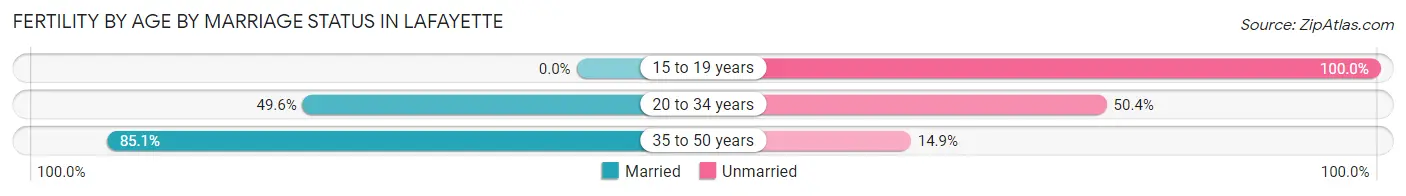
| Age Bracket | Married | Unmarried |
| 15 to 19 years | 0 (0.0%) | 18 (100.0%) |
| 20 to 34 years | 540 (49.6%) | 548 (50.4%) |
| 35 to 50 years | 246 (85.1%) | 43 (14.9%) |
| Total | 785 (56.3%) | 610 (43.7%) |
Fertility by Education in Lafayette
Average fertility rate in Lafayette is 48.0 births per 1,000 women. Women with the education attainment of bachelor's degree have the highest fertility rate of 70.0 births per 1,000 women, while women with the education attainment of less than high school have the lowest fertility at 24.0 births per 1,000 women. Women with the education attainment of college or associate's degree represent 36.6% of all women with births.
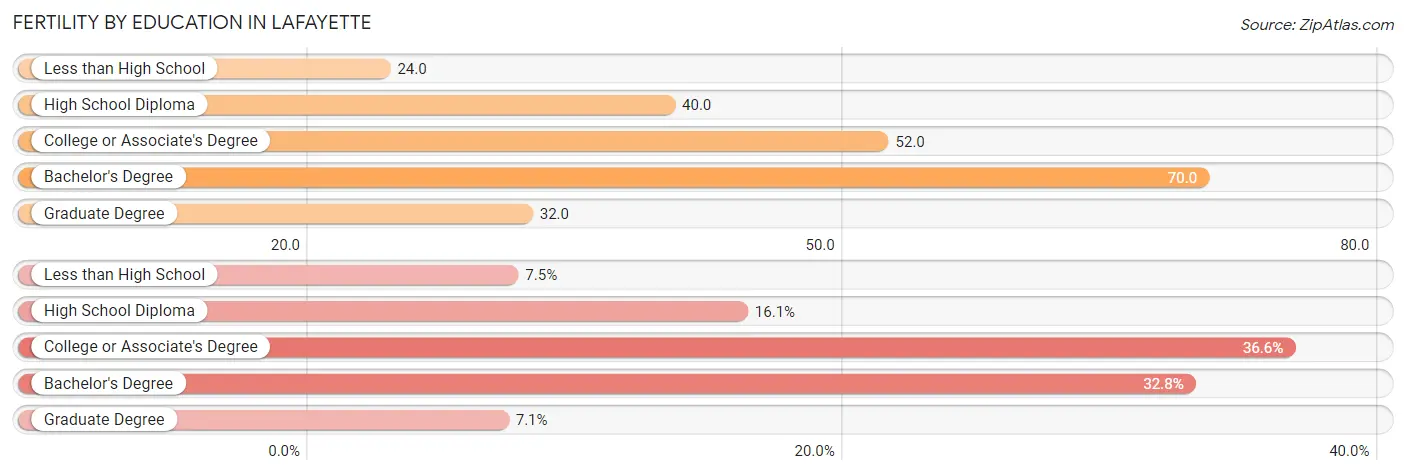
| Educational Attainment | Women with Births | Births / 1,000 Women |
| Less than High School | 104 (7.5%) | 24.0 |
| High School Diploma | 224 (16.1%) | 40.0 |
| College or Associate's Degree | 510 (36.6%) | 52.0 |
| Bachelor's Degree | 458 (32.8%) | 70.0 |
| Graduate Degree | 99 (7.1%) | 32.0 |
| Total | 1,395 (100.0%) | 48.0 |
Fertility by Education by Marriage Status in Lafayette
43.7% of women with births in Lafayette are unmarried. Women with the educational attainment of graduate degree are most likely to be married with 100.0% of them married at childbirth, while women with the educational attainment of less than high school are least likely to be married with 87.5% of them unmarried at childbirth.
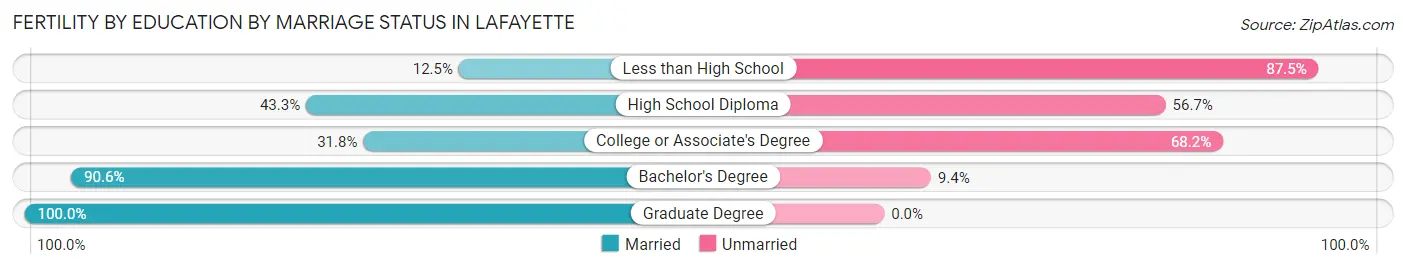
| Educational Attainment | Married | Unmarried |
| Less than High School | 13 (12.5%) | 91 (87.5%) |
| High School Diploma | 97 (43.3%) | 127 (56.7%) |
| College or Associate's Degree | 162 (31.8%) | 348 (68.2%) |
| Bachelor's Degree | 415 (90.6%) | 43 (9.4%) |
| Graduate Degree | 99 (100.0%) | 0 (0.0%) |
| Total | 785 (56.3%) | 610 (43.7%) |
Employment Characteristics in Lafayette
Employment by Class of Employer in Lafayette
Among the 57,649 employed individuals in Lafayette, private company employees (37,868 | 65.7%), self-employed (not incorporated) (5,675 | 9.8%), and local government employees (3,907 | 6.8%) make up the most common classes of employment.
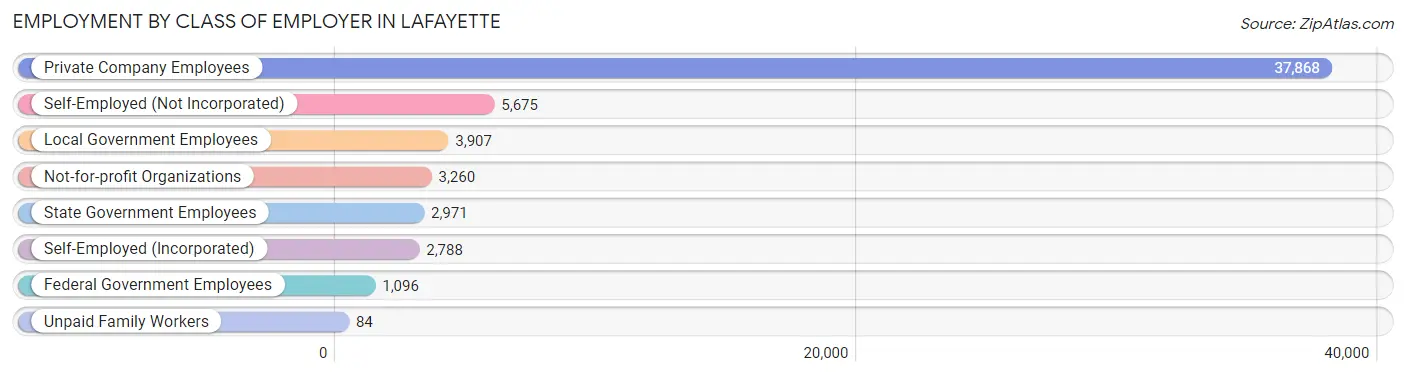
| Employer Class | # Employees | % Employees |
| Private Company Employees | 37,868 | 65.7% |
| Self-Employed (Incorporated) | 2,788 | 4.8% |
| Self-Employed (Not Incorporated) | 5,675 | 9.8% |
| Not-for-profit Organizations | 3,260 | 5.7% |
| Local Government Employees | 3,907 | 6.8% |
| State Government Employees | 2,971 | 5.1% |
| Federal Government Employees | 1,096 | 1.9% |
| Unpaid Family Workers | 84 | 0.2% |
| Total | 57,649 | 100.0% |
Employment Status by Age in Lafayette
According to the labor force statistics for Lafayette, out of the total population over 16 years of age (98,653), 62.9% or 62,053 individuals are in the labor force, with 6.1% or 3,785 of them unemployed. The age group with the highest labor force participation rate is 30 to 34 years, with 83.5% or 7,568 individuals in the labor force. Within the labor force, the 16 to 19 years age range has the highest percentage of unemployed individuals, with 17.2% or 401 of them being unemployed.
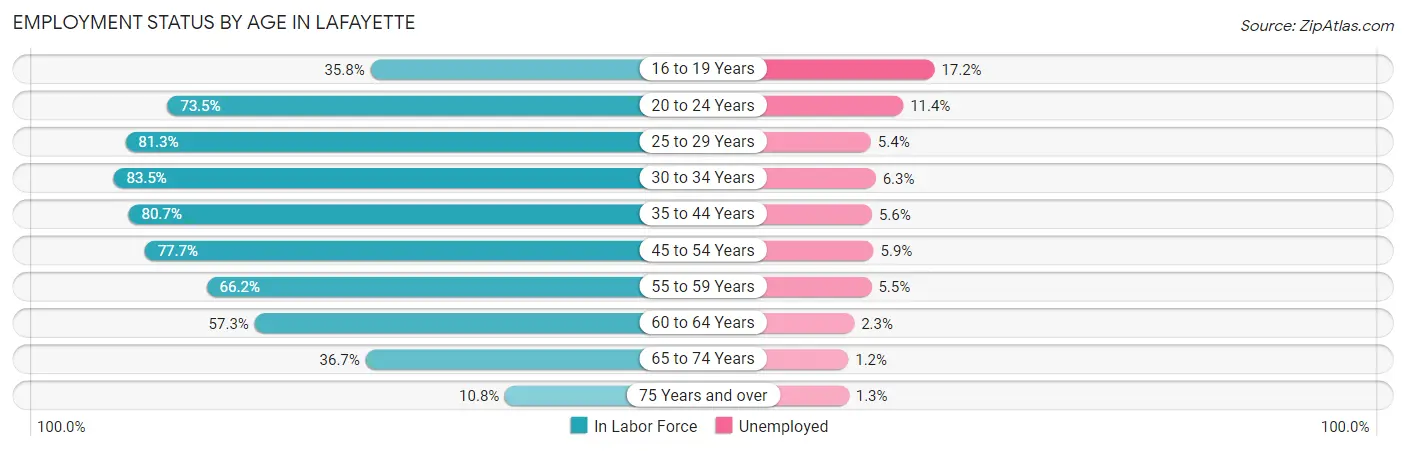
| Age Bracket | In Labor Force | Unemployed |
| 16 to 19 Years | 2,332 (35.8%) | 401 (17.2%) |
| 20 to 24 Years | 6,566 (73.5%) | 749 (11.4%) |
| 25 to 29 Years | 8,002 (81.3%) | 432 (5.4%) |
| 30 to 34 Years | 7,568 (83.5%) | 477 (6.3%) |
| 35 to 44 Years | 12,398 (80.7%) | 694 (5.6%) |
| 45 to 54 Years | 9,890 (77.7%) | 584 (5.9%) |
| 55 to 59 Years | 5,404 (66.2%) | 297 (5.5%) |
| 60 to 64 Years | 4,417 (57.3%) | 102 (2.3%) |
| 65 to 74 Years | 4,656 (36.7%) | 56 (1.2%) |
| 75 Years and over | 826 (10.8%) | 11 (1.3%) |
| Total | 62,053 (62.9%) | 3,785 (6.1%) |
Employment Status by Educational Attainment in Lafayette
According to labor force statistics for Lafayette, 75.8% of individuals (47,655) out of the total population between 25 and 64 years of age (62,870) are in the labor force, with 5.4% or 2,573 of them being unemployed. The group with the highest labor force participation rate are those with the educational attainment of bachelor's degree or higher, with 85.2% or 21,980 individuals in the labor force. Within the labor force, individuals with less than high school education have the highest percentage of unemployment, with 12.3% or 319 of them being unemployed.
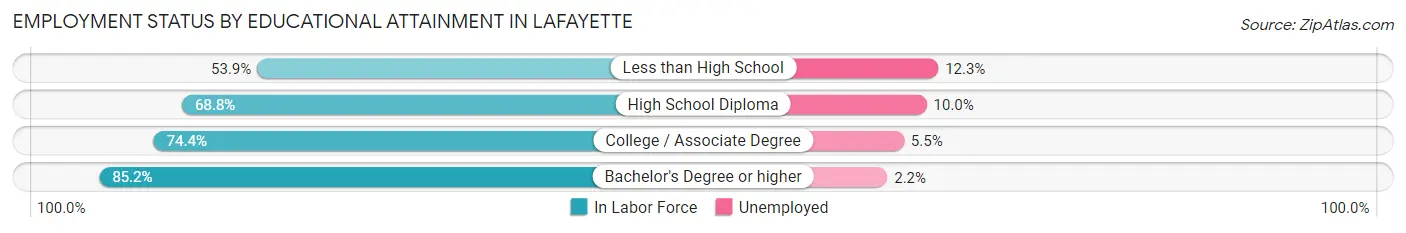
| Educational Attainment | In Labor Force | Unemployed |
| Less than High School | 2,594 (53.9%) | 592 (12.3%) |
| High School Diploma | 11,066 (68.8%) | 1,608 (10.0%) |
| College / Associate Degree | 12,035 (74.4%) | 890 (5.5%) |
| Bachelor's Degree or higher | 21,980 (85.2%) | 568 (2.2%) |
| Total | 47,655 (75.8%) | 3,395 (5.4%) |
Employment Occupations by Sex in Lafayette
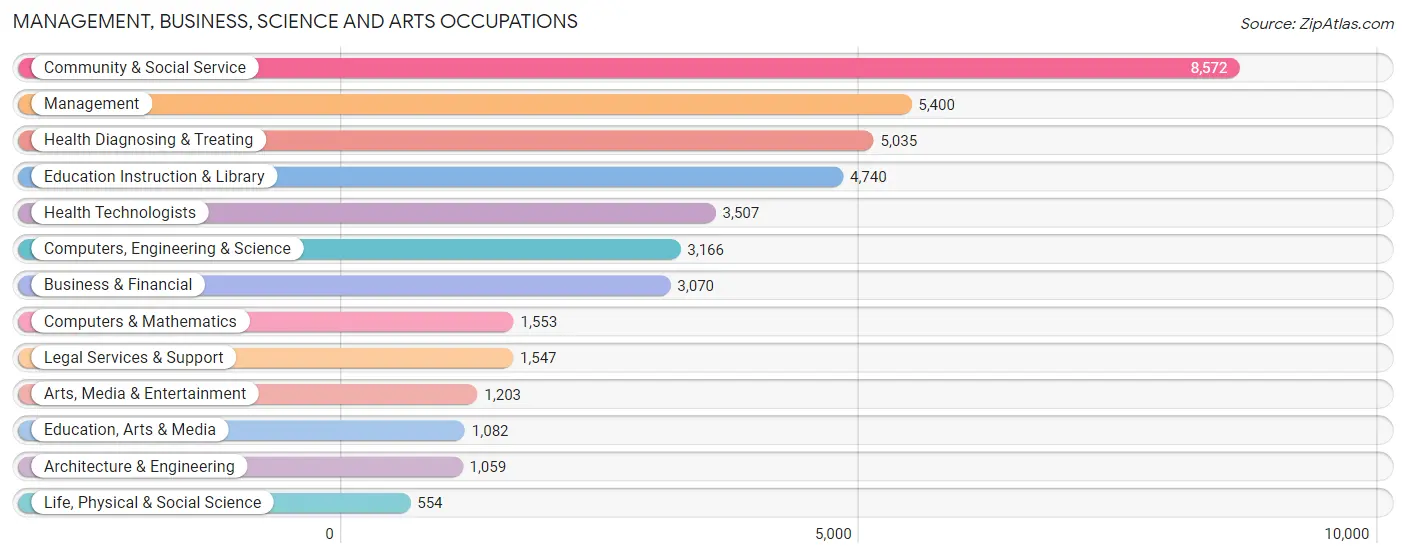
Management, Business, Science and Arts Occupations
The most common Management, Business, Science and Arts occupations in Lafayette are Community & Social Service (8,572 | 14.8%), Management (5,400 | 9.3%), Health Diagnosing & Treating (5,035 | 8.7%), Education Instruction & Library (4,740 | 8.2%), and Health Technologists (3,507 | 6.0%).
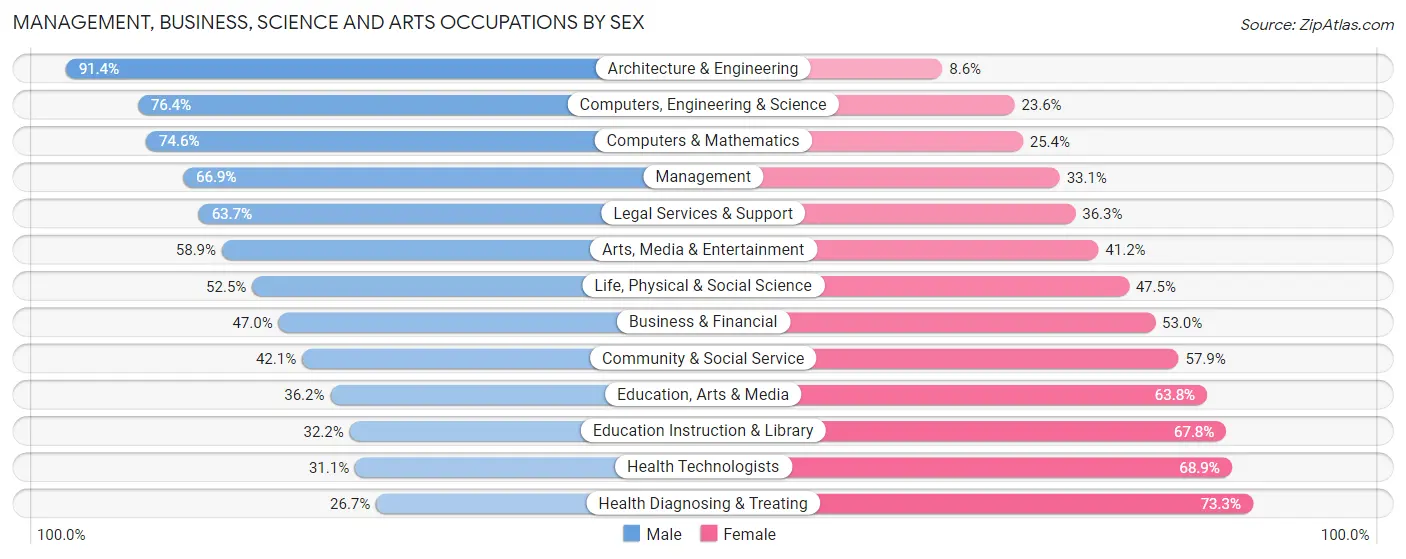
Management, Business, Science and Arts Occupations by Sex
Within the Management, Business, Science and Arts occupations in Lafayette, the most male-oriented occupations are Architecture & Engineering (91.4%), Computers, Engineering & Science (76.4%), and Computers & Mathematics (74.6%), while the most female-oriented occupations are Health Diagnosing & Treating (73.3%), Health Technologists (68.9%), and Education Instruction & Library (67.8%).
| Occupation | Male | Female |
| Management | 3,614 (66.9%) | 1,786 (33.1%) |
| Business & Financial | 1,444 (47.0%) | 1,626 (53.0%) |
| Computers, Engineering & Science | 2,418 (76.4%) | 748 (23.6%) |
| Computers & Mathematics | 1,159 (74.6%) | 394 (25.4%) |
| Architecture & Engineering | 968 (91.4%) | 91 (8.6%) |
| Life, Physical & Social Science | 291 (52.5%) | 263 (47.5%) |
| Community & Social Service | 3,612 (42.1%) | 4,960 (57.9%) |
| Education, Arts & Media | 392 (36.2%) | 690 (63.8%) |
| Legal Services & Support | 985 (63.7%) | 562 (36.3%) |
| Education Instruction & Library | 1,527 (32.2%) | 3,213 (67.8%) |
| Arts, Media & Entertainment | 708 (58.9%) | 495 (41.1%) |
| Health Diagnosing & Treating | 1,343 (26.7%) | 3,692 (73.3%) |
| Health Technologists | 1,090 (31.1%) | 2,417 (68.9%) |
| Total (Category) | 12,431 (49.2%) | 12,812 (50.7%) |
| Total (Overall) | 30,343 (52.2%) | 27,738 (47.8%) |
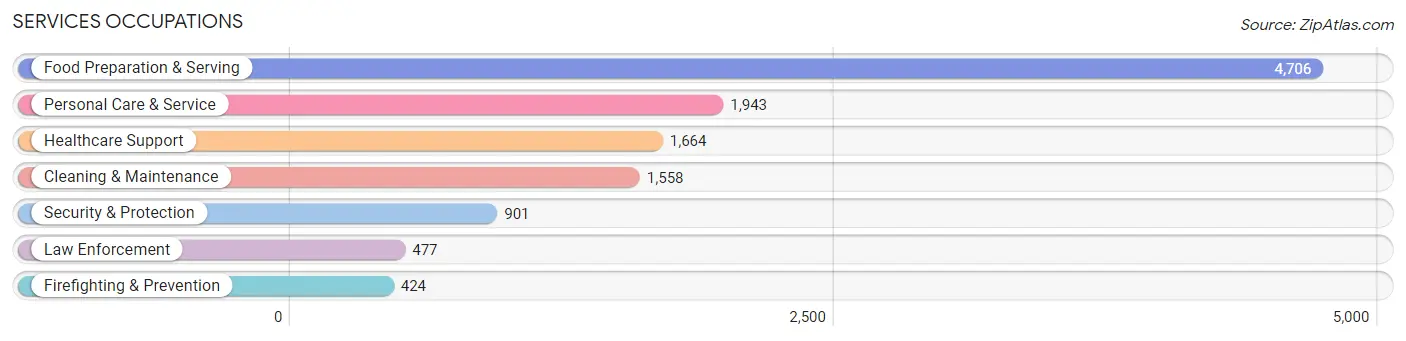
Services Occupations
The most common Services occupations in Lafayette are Food Preparation & Serving (4,706 | 8.1%), Personal Care & Service (1,943 | 3.4%), Healthcare Support (1,664 | 2.9%), Cleaning & Maintenance (1,558 | 2.7%), and Security & Protection (901 | 1.5%).
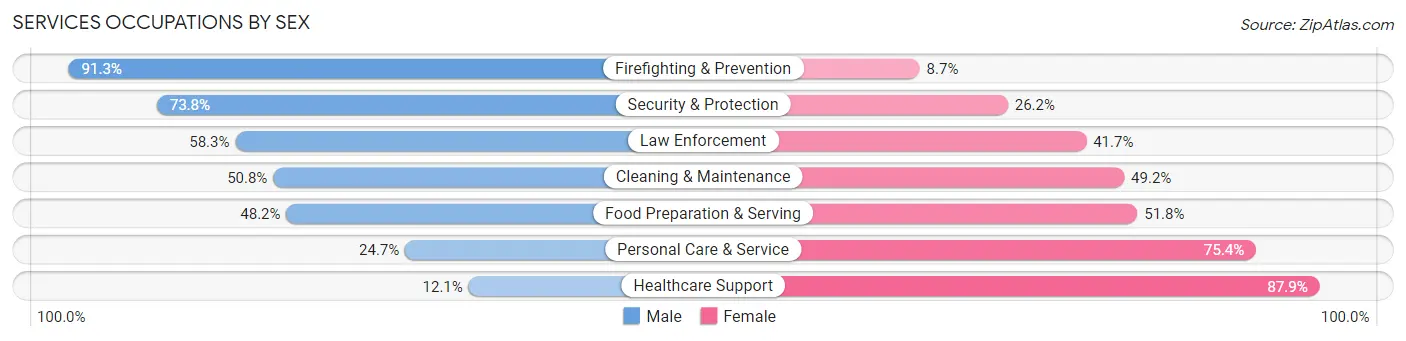
Services Occupations by Sex
Within the Services occupations in Lafayette, the most male-oriented occupations are Firefighting & Prevention (91.3%), Security & Protection (73.8%), and Law Enforcement (58.3%), while the most female-oriented occupations are Healthcare Support (87.9%), Personal Care & Service (75.3%), and Food Preparation & Serving (51.8%).
| Occupation | Male | Female |
| Healthcare Support | 201 (12.1%) | 1,463 (87.9%) |
| Security & Protection | 665 (73.8%) | 236 (26.2%) |
| Firefighting & Prevention | 387 (91.3%) | 37 (8.7%) |
| Law Enforcement | 278 (58.3%) | 199 (41.7%) |
| Food Preparation & Serving | 2,267 (48.2%) | 2,439 (51.8%) |
| Cleaning & Maintenance | 791 (50.8%) | 767 (49.2%) |
| Personal Care & Service | 479 (24.6%) | 1,464 (75.3%) |
| Total (Category) | 4,403 (40.9%) | 6,369 (59.1%) |
| Total (Overall) | 30,343 (52.2%) | 27,738 (47.8%) |
Sales and Office Occupations
The most common Sales and Office occupations in Lafayette are Sales & Related (8,447 | 14.5%), and Office & Administration (5,243 | 9.0%).

Sales and Office Occupations by Sex
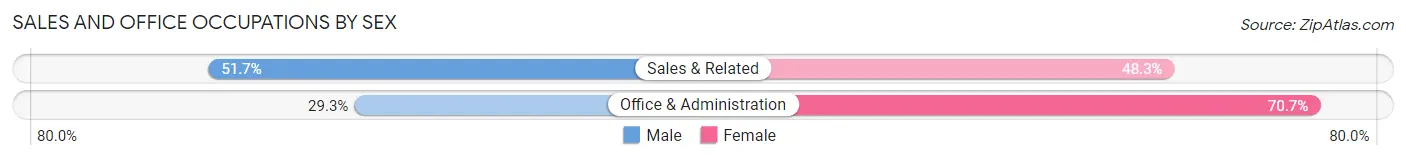
| Occupation | Male | Female |
| Sales & Related | 4,369 (51.7%) | 4,078 (48.3%) |
| Office & Administration | 1,536 (29.3%) | 3,707 (70.7%) |
| Total (Category) | 5,905 (43.1%) | 7,785 (56.9%) |
| Total (Overall) | 30,343 (52.2%) | 27,738 (47.8%) |
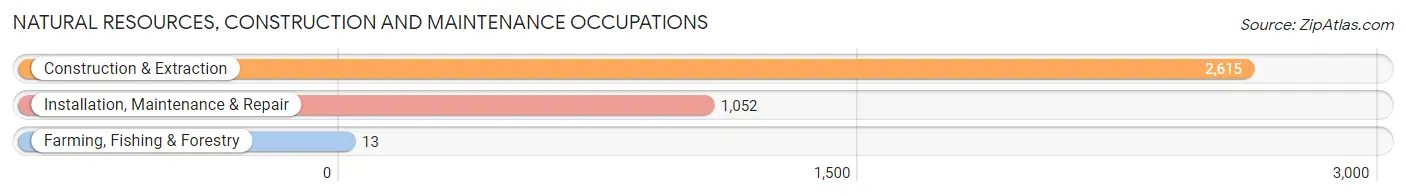
Natural Resources, Construction and Maintenance Occupations
The most common Natural Resources, Construction and Maintenance occupations in Lafayette are Construction & Extraction (2,615 | 4.5%), Installation, Maintenance & Repair (1,052 | 1.8%), and Farming, Fishing & Forestry (13 | 0.0%).
Natural Resources, Construction and Maintenance Occupations by Sex
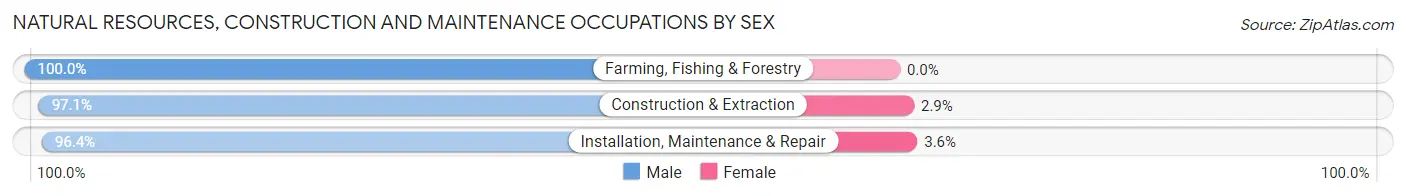
| Occupation | Male | Female |
| Farming, Fishing & Forestry | 13 (100.0%) | 0 (0.0%) |
| Construction & Extraction | 2,538 (97.1%) | 77 (2.9%) |
| Installation, Maintenance & Repair | 1,014 (96.4%) | 38 (3.6%) |
| Total (Category) | 3,565 (96.9%) | 115 (3.1%) |
| Total (Overall) | 30,343 (52.2%) | 27,738 (47.8%) |
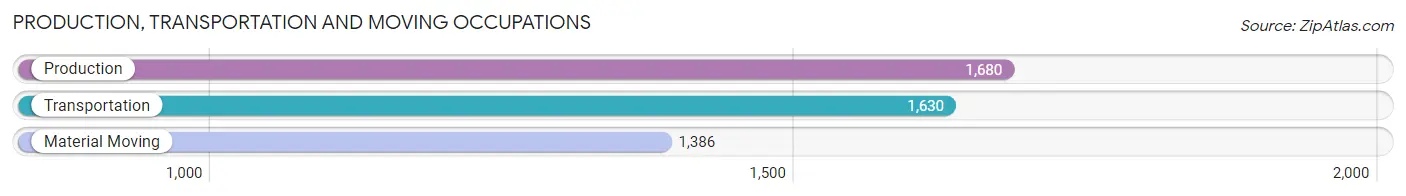
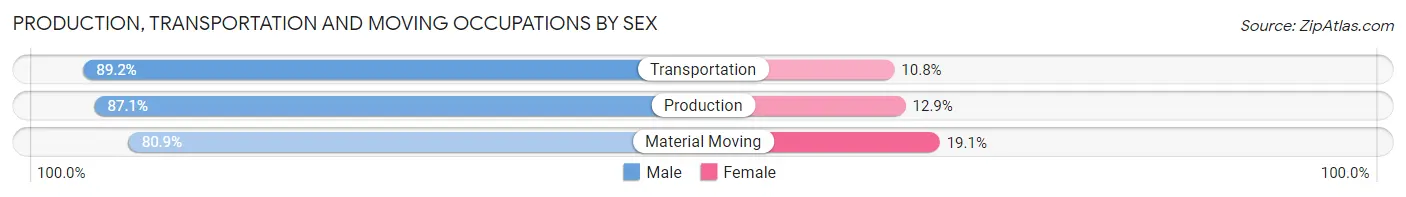
Production, Transportation and Moving Occupations
The most common Production, Transportation and Moving occupations in Lafayette are Production (1,680 | 2.9%), Transportation (1,630 | 2.8%), and Material Moving (1,386 | 2.4%).
Production, Transportation and Moving Occupations by Sex
| Occupation | Male | Female |
| Production | 1,464 (87.1%) | 216 (12.9%) |
| Transportation | 1,454 (89.2%) | 176 (10.8%) |
| Material Moving | 1,121 (80.9%) | 265 (19.1%) |
| Total (Category) | 4,039 (86.0%) | 657 (14.0%) |
| Total (Overall) | 30,343 (52.2%) | 27,738 (47.8%) |
Employment Industries by Sex in Lafayette
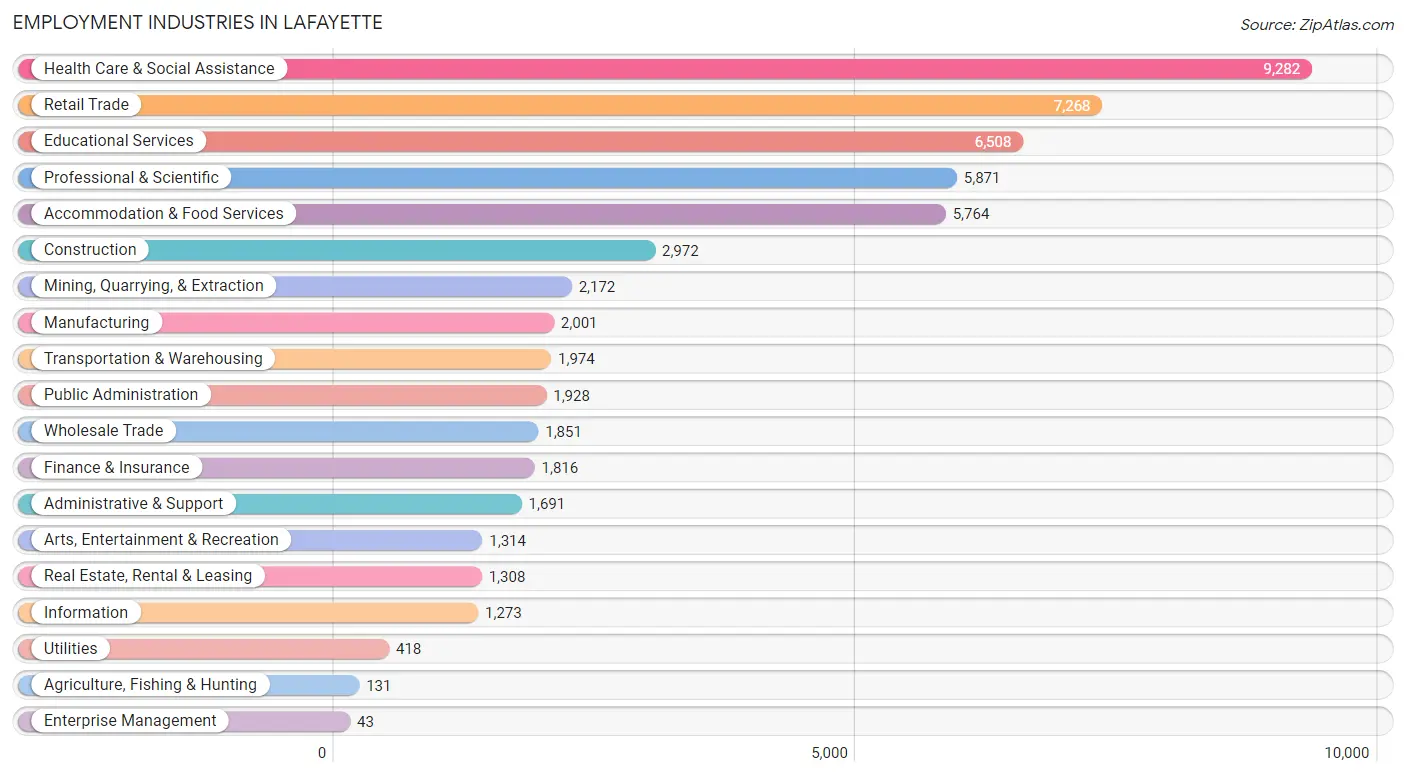
Employment Industries in Lafayette
The major employment industries in Lafayette include Health Care & Social Assistance (9,282 | 16.0%), Retail Trade (7,268 | 12.5%), Educational Services (6,508 | 11.2%), Professional & Scientific (5,871 | 10.1%), and Accommodation & Food Services (5,764 | 9.9%).
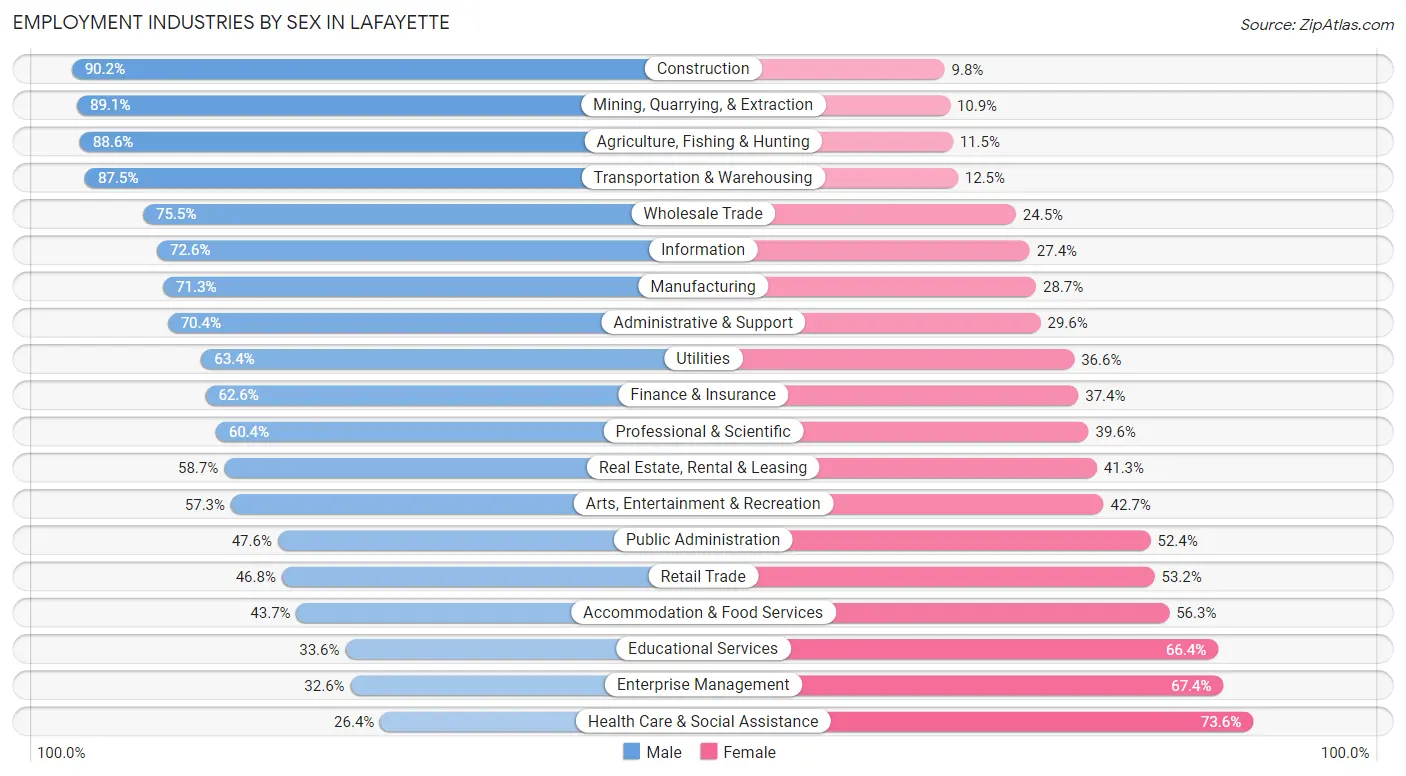
Employment Industries by Sex in Lafayette
The Lafayette industries that see more men than women are Construction (90.2%), Mining, Quarrying, & Extraction (89.1%), and Agriculture, Fishing & Hunting (88.5%), whereas the industries that tend to have a higher number of women are Health Care & Social Assistance (73.6%), Enterprise Management (67.4%), and Educational Services (66.4%).
| Industry | Male | Female |
| Agriculture, Fishing & Hunting | 116 (88.5%) | 15 (11.5%) |
| Mining, Quarrying, & Extraction | 1,936 (89.1%) | 236 (10.9%) |
| Construction | 2,682 (90.2%) | 290 (9.8%) |
| Manufacturing | 1,427 (71.3%) | 574 (28.7%) |
| Wholesale Trade | 1,397 (75.5%) | 454 (24.5%) |
| Retail Trade | 3,400 (46.8%) | 3,868 (53.2%) |
| Transportation & Warehousing | 1,727 (87.5%) | 247 (12.5%) |
| Utilities | 265 (63.4%) | 153 (36.6%) |
| Information | 924 (72.6%) | 349 (27.4%) |
| Finance & Insurance | 1,136 (62.6%) | 680 (37.4%) |
| Real Estate, Rental & Leasing | 768 (58.7%) | 540 (41.3%) |
| Professional & Scientific | 3,547 (60.4%) | 2,324 (39.6%) |
| Enterprise Management | 14 (32.6%) | 29 (67.4%) |
| Administrative & Support | 1,190 (70.4%) | 501 (29.6%) |
| Educational Services | 2,188 (33.6%) | 4,320 (66.4%) |
| Health Care & Social Assistance | 2,450 (26.4%) | 6,832 (73.6%) |
| Arts, Entertainment & Recreation | 753 (57.3%) | 561 (42.7%) |
| Accommodation & Food Services | 2,521 (43.7%) | 3,243 (56.3%) |
| Public Administration | 918 (47.6%) | 1,010 (52.4%) |
| Total | 30,343 (52.2%) | 27,738 (47.8%) |
Education in Lafayette
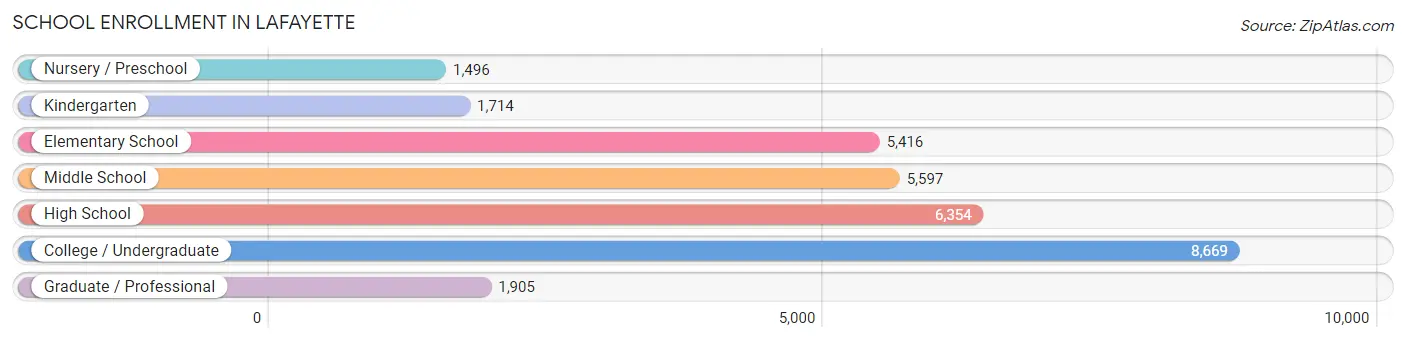
School Enrollment in Lafayette
The most common levels of schooling among the 31,151 students in Lafayette are college / undergraduate (8,669 | 27.8%), high school (6,354 | 20.4%), and middle school (5,597 | 18.0%).
| School Level | # Students | % Students |
| Nursery / Preschool | 1,496 | 4.8% |
| Kindergarten | 1,714 | 5.5% |
| Elementary School | 5,416 | 17.4% |
| Middle School | 5,597 | 18.0% |
| High School | 6,354 | 20.4% |
| College / Undergraduate | 8,669 | 27.8% |
| Graduate / Professional | 1,905 | 6.1% |
| Total | 31,151 | 100.0% |
School Enrollment by Age by Funding Source in Lafayette
Out of a total of 31,151 students who are enrolled in schools in Lafayette, 6,386 (20.5%) attend a private institution, while the remaining 24,765 (79.5%) are enrolled in public schools. The age group of 3 to 4 year olds has the highest likelihood of being enrolled in private schools, with 459 (38.3% in the age bracket) enrolled. Conversely, the age group of 20 to 24 year olds has the lowest likelihood of being enrolled in a private school, with 4,385 (96.9% in the age bracket) attending a public institution.
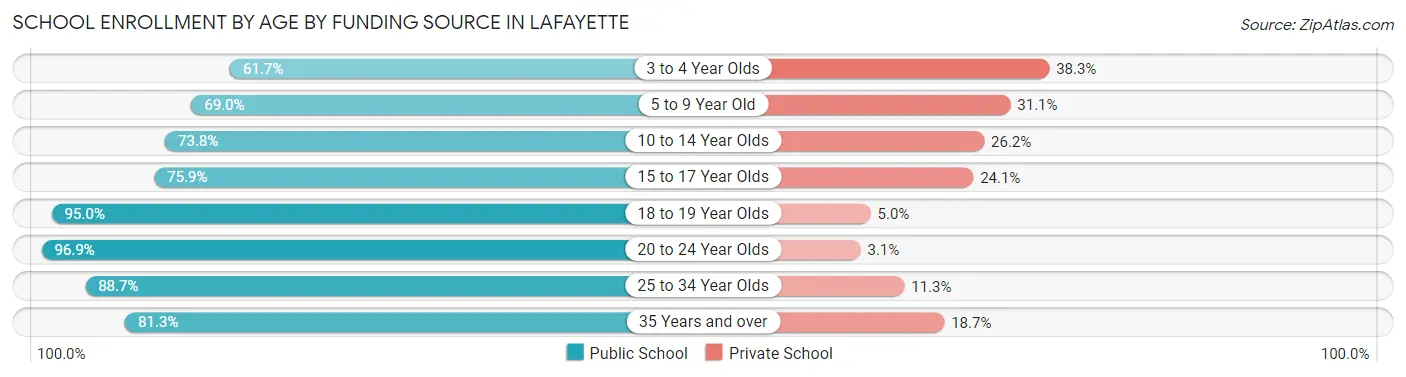
| Age Bracket | Public School | Private School |
| 3 to 4 Year Olds | 740 (61.7%) | 459 (38.3%) |
| 5 to 9 Year Old | 4,732 (69.0%) | 2,131 (31.0%) |
| 10 to 14 Year Olds | 5,191 (73.8%) | 1,839 (26.2%) |
| 15 to 17 Year Olds | 3,530 (75.9%) | 1,123 (24.1%) |
| 18 to 19 Year Olds | 2,861 (95.0%) | 151 (5.0%) |
| 20 to 24 Year Olds | 4,385 (96.9%) | 142 (3.1%) |
| 25 to 34 Year Olds | 2,185 (88.7%) | 278 (11.3%) |
| 35 Years and over | 1,141 (81.3%) | 263 (18.7%) |
| Total | 24,765 (79.5%) | 6,386 (20.5%) |
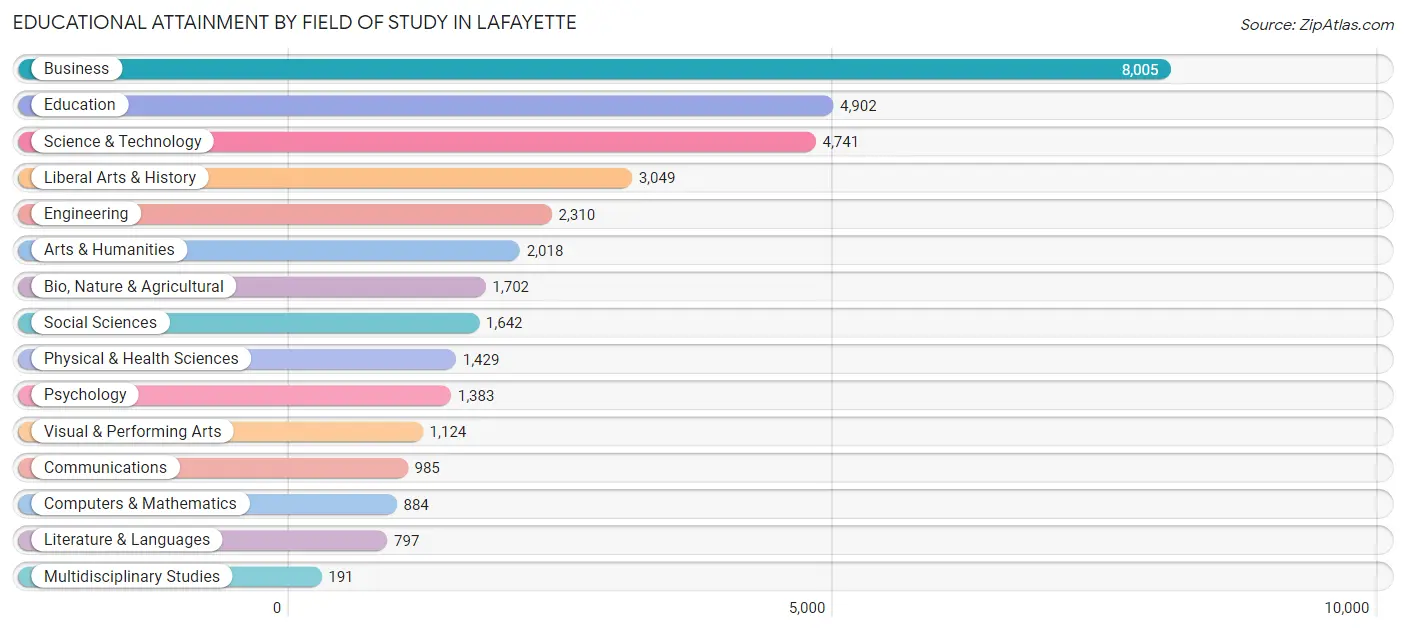
Educational Attainment by Field of Study in Lafayette
Business (8,005 | 22.8%), education (4,902 | 13.9%), science & technology (4,741 | 13.5%), liberal arts & history (3,049 | 8.7%), and engineering (2,310 | 6.6%) are the most common fields of study among 35,162 individuals in Lafayette who have obtained a bachelor's degree or higher.
| Field of Study | # Graduates | % Graduates |
| Computers & Mathematics | 884 | 2.5% |
| Bio, Nature & Agricultural | 1,702 | 4.8% |
| Physical & Health Sciences | 1,429 | 4.1% |
| Psychology | 1,383 | 3.9% |
| Social Sciences | 1,642 | 4.7% |
| Engineering | 2,310 | 6.6% |
| Multidisciplinary Studies | 191 | 0.5% |
| Science & Technology | 4,741 | 13.5% |
| Business | 8,005 | 22.8% |
| Education | 4,902 | 13.9% |
| Literature & Languages | 797 | 2.3% |
| Liberal Arts & History | 3,049 | 8.7% |
| Visual & Performing Arts | 1,124 | 3.2% |
| Communications | 985 | 2.8% |
| Arts & Humanities | 2,018 | 5.7% |
| Total | 35,162 | 100.0% |
Transportation & Commute in Lafayette
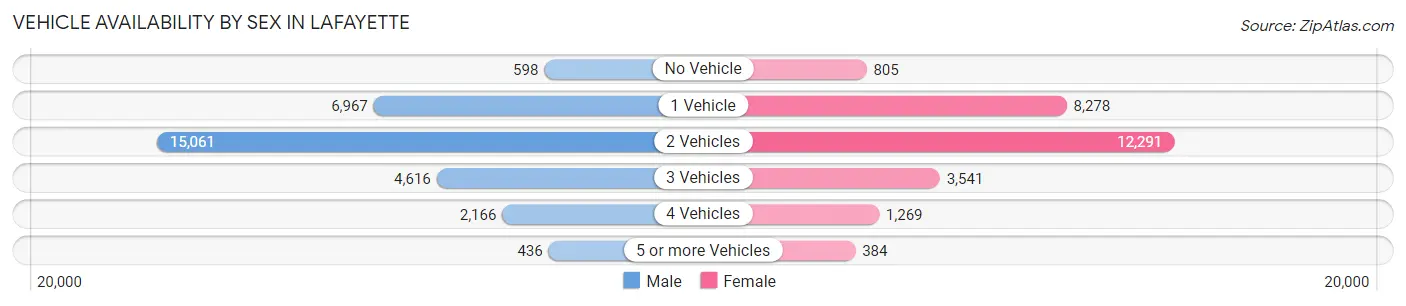
Vehicle Availability by Sex in Lafayette
The most prevalent vehicle ownership categories in Lafayette are males with 2 vehicles (15,061, accounting for 50.5%) and females with 2 vehicles (12,291, making up 56.7%).
| Vehicles Available | Male | Female |
| No Vehicle | 598 (2.0%) | 805 (3.0%) |
| 1 Vehicle | 6,967 (23.3%) | 8,278 (31.2%) |
| 2 Vehicles | 15,061 (50.5%) | 12,291 (46.3%) |
| 3 Vehicles | 4,616 (15.5%) | 3,541 (13.3%) |
| 4 Vehicles | 2,166 (7.3%) | 1,269 (4.8%) |
| 5 or more Vehicles | 436 (1.5%) | 384 (1.5%) |
| Total | 29,844 (100.0%) | 26,568 (100.0%) |
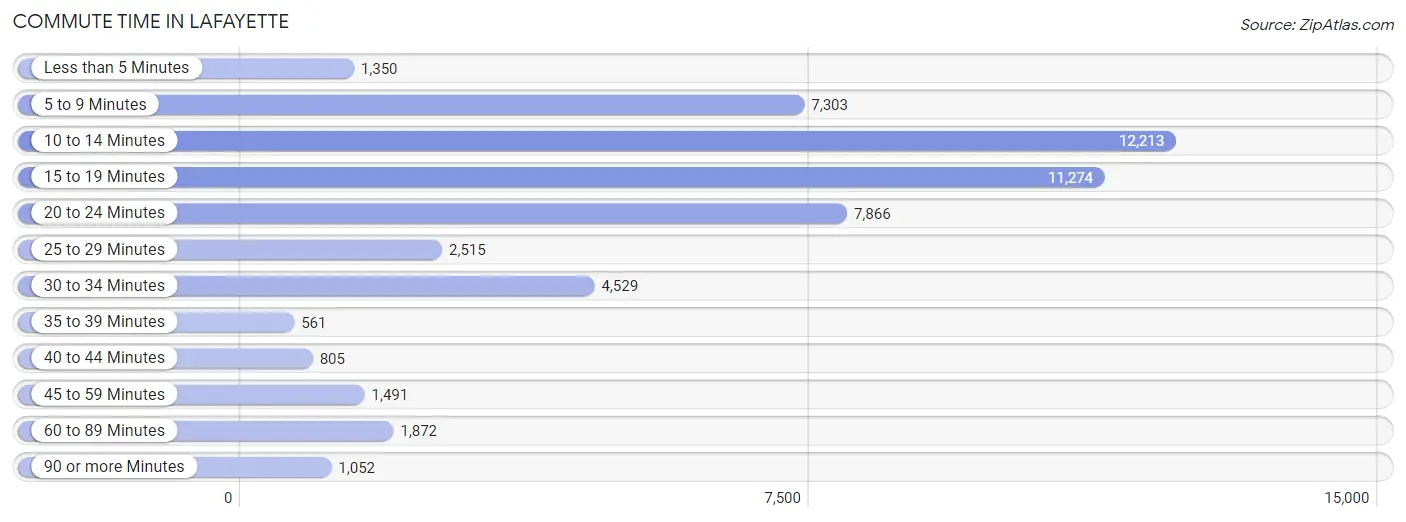
Commute Time in Lafayette
The most frequently occuring commute durations in Lafayette are 10 to 14 minutes (12,213 commuters, 23.1%), 15 to 19 minutes (11,274 commuters, 21.3%), and 20 to 24 minutes (7,866 commuters, 14.9%).
| Commute Time | # Commuters | % Commuters |
| Less than 5 Minutes | 1,350 | 2.6% |
| 5 to 9 Minutes | 7,303 | 13.8% |
| 10 to 14 Minutes | 12,213 | 23.1% |
| 15 to 19 Minutes | 11,274 | 21.3% |
| 20 to 24 Minutes | 7,866 | 14.9% |
| 25 to 29 Minutes | 2,515 | 4.8% |
| 30 to 34 Minutes | 4,529 | 8.6% |
| 35 to 39 Minutes | 561 | 1.1% |
| 40 to 44 Minutes | 805 | 1.5% |
| 45 to 59 Minutes | 1,491 | 2.8% |
| 60 to 89 Minutes | 1,872 | 3.5% |
| 90 or more Minutes | 1,052 | 2.0% |
Commute Time by Sex in Lafayette
The most common commute times in Lafayette are 10 to 14 minutes (6,069 commuters, 21.5%) for males and 10 to 14 minutes (6,144 commuters, 25.0%) for females.
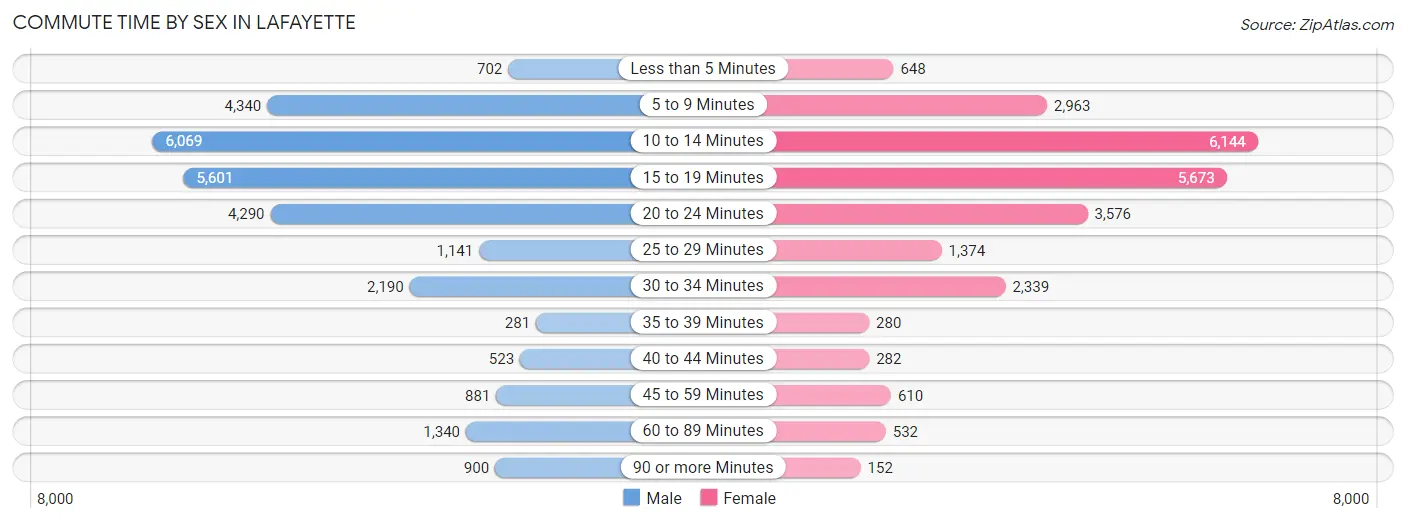
| Commute Time | Male | Female |
| Less than 5 Minutes | 702 (2.5%) | 648 (2.6%) |
| 5 to 9 Minutes | 4,340 (15.4%) | 2,963 (12.1%) |
| 10 to 14 Minutes | 6,069 (21.5%) | 6,144 (25.0%) |
| 15 to 19 Minutes | 5,601 (19.8%) | 5,673 (23.1%) |
| 20 to 24 Minutes | 4,290 (15.2%) | 3,576 (14.5%) |
| 25 to 29 Minutes | 1,141 (4.0%) | 1,374 (5.6%) |
| 30 to 34 Minutes | 2,190 (7.7%) | 2,339 (9.5%) |
| 35 to 39 Minutes | 281 (1.0%) | 280 (1.1%) |
| 40 to 44 Minutes | 523 (1.8%) | 282 (1.1%) |
| 45 to 59 Minutes | 881 (3.1%) | 610 (2.5%) |
| 60 to 89 Minutes | 1,340 (4.7%) | 532 (2.2%) |
| 90 or more Minutes | 900 (3.2%) | 152 (0.6%) |
Time of Departure to Work by Sex in Lafayette
The most frequent times of departure to work in Lafayette are 7:00 AM to 7:29 AM (5,578, 19.7%) for males and 7:00 AM to 7:29 AM (4,300, 17.5%) for females.
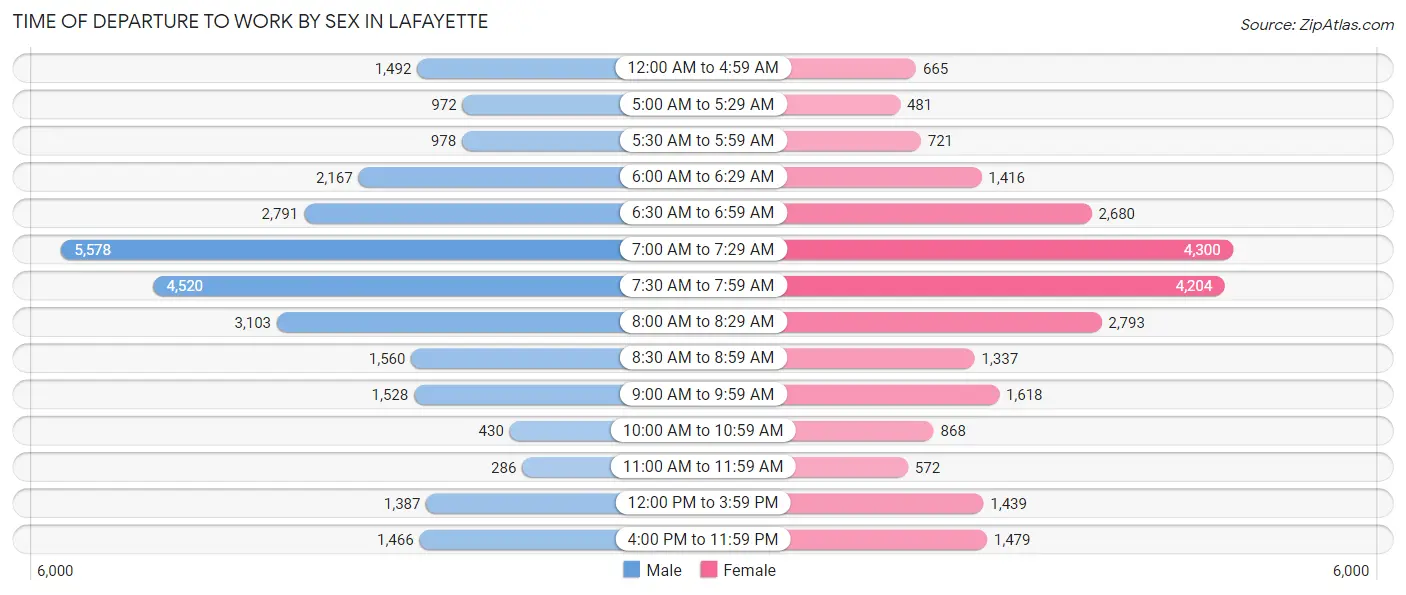
| Time of Departure | Male | Female |
| 12:00 AM to 4:59 AM | 1,492 (5.3%) | 665 (2.7%) |
| 5:00 AM to 5:29 AM | 972 (3.4%) | 481 (2.0%) |
| 5:30 AM to 5:59 AM | 978 (3.5%) | 721 (2.9%) |
| 6:00 AM to 6:29 AM | 2,167 (7.7%) | 1,416 (5.8%) |
| 6:30 AM to 6:59 AM | 2,791 (9.9%) | 2,680 (10.9%) |
| 7:00 AM to 7:29 AM | 5,578 (19.7%) | 4,300 (17.5%) |
| 7:30 AM to 7:59 AM | 4,520 (16.0%) | 4,204 (17.1%) |
| 8:00 AM to 8:29 AM | 3,103 (11.0%) | 2,793 (11.4%) |
| 8:30 AM to 8:59 AM | 1,560 (5.5%) | 1,337 (5.4%) |
| 9:00 AM to 9:59 AM | 1,528 (5.4%) | 1,618 (6.6%) |
| 10:00 AM to 10:59 AM | 430 (1.5%) | 868 (3.5%) |
| 11:00 AM to 11:59 AM | 286 (1.0%) | 572 (2.3%) |
| 12:00 PM to 3:59 PM | 1,387 (4.9%) | 1,439 (5.9%) |
| 4:00 PM to 11:59 PM | 1,466 (5.2%) | 1,479 (6.0%) |
| Total | 28,258 (100.0%) | 24,573 (100.0%) |
Housing Occupancy in Lafayette
Occupancy by Ownership in Lafayette
Of the total 51,472 dwellings in Lafayette, owner-occupied units account for 28,957 (56.3%), while renter-occupied units make up 22,515 (43.7%).
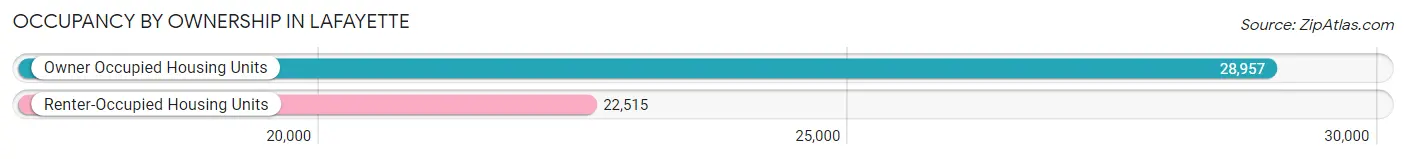
| Occupancy | # Housing Units | % Housing Units |
| Owner Occupied Housing Units | 28,957 | 56.3% |
| Renter-Occupied Housing Units | 22,515 | 43.7% |
| Total Occupied Housing Units | 51,472 | 100.0% |
Occupancy by Household Size in Lafayette
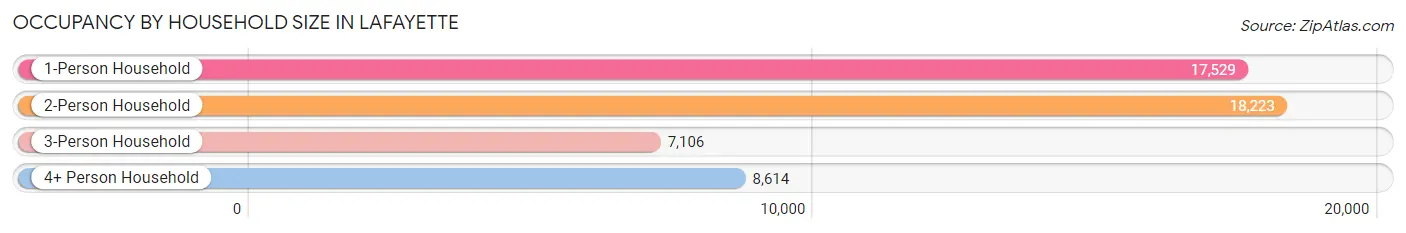
| Household Size | # Housing Units | % Housing Units |
| 1-Person Household | 17,529 | 34.1% |
| 2-Person Household | 18,223 | 35.4% |
| 3-Person Household | 7,106 | 13.8% |
| 4+ Person Household | 8,614 | 16.7% |
| Total Housing Units | 51,472 | 100.0% |
Occupancy by Ownership by Household Size in Lafayette
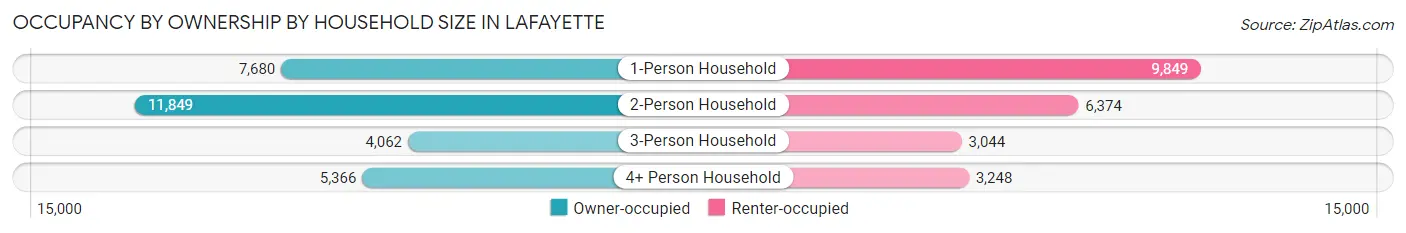
| Household Size | Owner-occupied | Renter-occupied |
| 1-Person Household | 7,680 (43.8%) | 9,849 (56.2%) |
| 2-Person Household | 11,849 (65.0%) | 6,374 (35.0%) |
| 3-Person Household | 4,062 (57.2%) | 3,044 (42.8%) |
| 4+ Person Household | 5,366 (62.3%) | 3,248 (37.7%) |
| Total Housing Units | 28,957 (56.3%) | 22,515 (43.7%) |
Occupancy by Educational Attainment in Lafayette
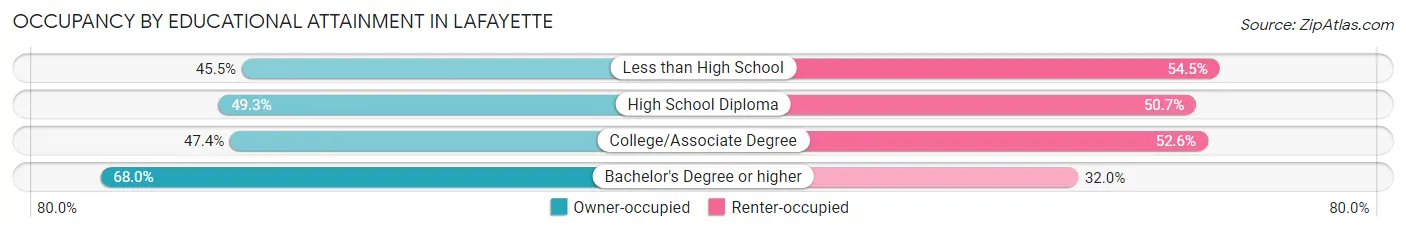
| Household Size | Owner-occupied | Renter-occupied |
| Less than High School | 1,967 (45.5%) | 2,353 (54.5%) |
| High School Diploma | 5,917 (49.3%) | 6,091 (50.7%) |
| College/Associate Degree | 6,499 (47.4%) | 7,208 (52.6%) |
| Bachelor's Degree or higher | 14,574 (68.0%) | 6,863 (32.0%) |
Occupancy by Age of Householder in Lafayette
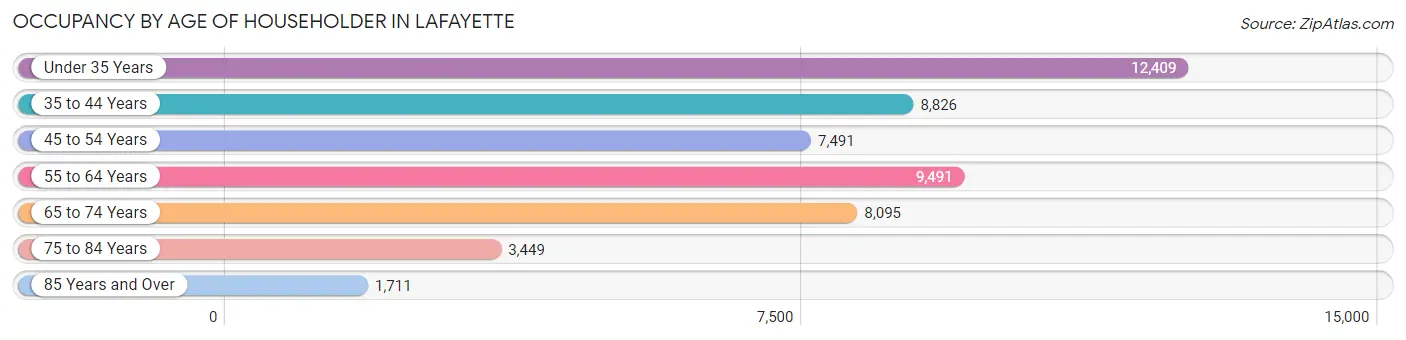
| Age Bracket | # Households | % Households |
| Under 35 Years | 12,409 | 24.1% |
| 35 to 44 Years | 8,826 | 17.2% |
| 45 to 54 Years | 7,491 | 14.5% |
| 55 to 64 Years | 9,491 | 18.4% |
| 65 to 74 Years | 8,095 | 15.7% |
| 75 to 84 Years | 3,449 | 6.7% |
| 85 Years and Over | 1,711 | 3.3% |
| Total | 51,472 | 100.0% |
Housing Finances in Lafayette
Median Income by Occupancy in Lafayette
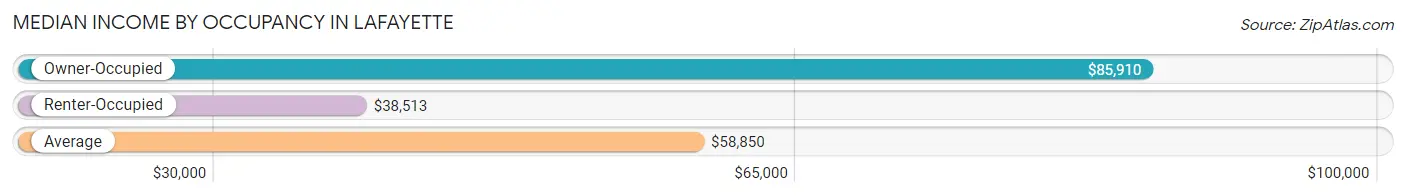
| Occupancy Type | # Households | Median Income |
| Owner-Occupied | 28,957 (56.3%) | $85,910 |
| Renter-Occupied | 22,515 (43.7%) | $38,513 |
| Average | 51,472 (100.0%) | $58,850 |
Occupancy by Householder Income Bracket in Lafayette
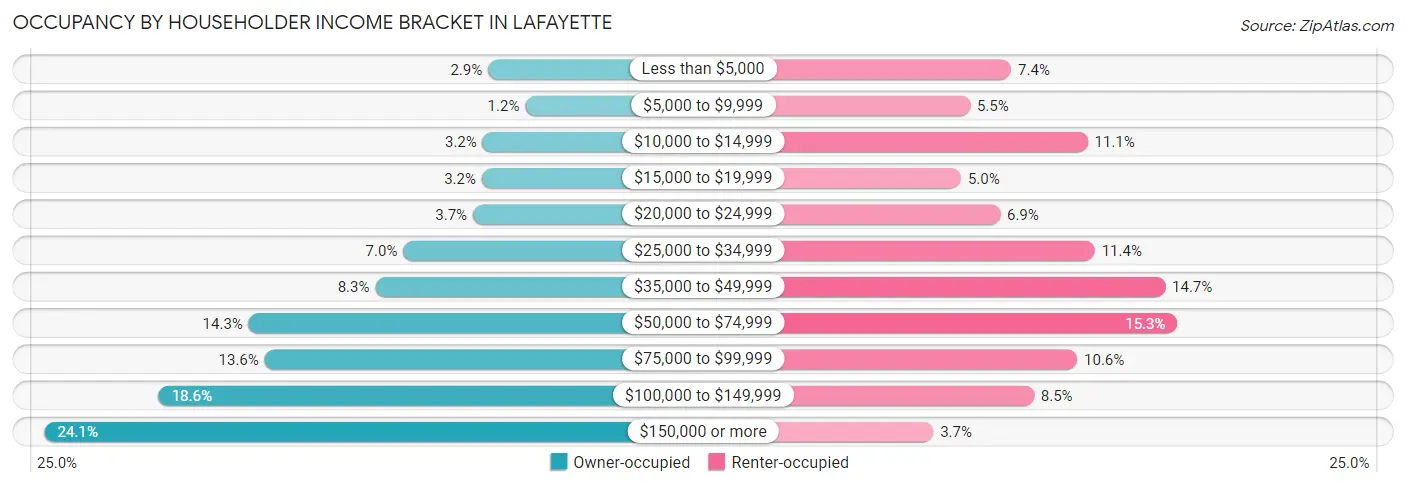
| Income Bracket | Owner-occupied | Renter-occupied |
| Less than $5,000 | 848 (2.9%) | 1,669 (7.4%) |
| $5,000 to $9,999 | 337 (1.2%) | 1,228 (5.4%) |
| $10,000 to $14,999 | 925 (3.2%) | 2,487 (11.1%) |
| $15,000 to $19,999 | 934 (3.2%) | 1,130 (5.0%) |
| $20,000 to $24,999 | 1,058 (3.6%) | 1,548 (6.9%) |
| $25,000 to $34,999 | 2,018 (7.0%) | 2,564 (11.4%) |
| $35,000 to $49,999 | 2,402 (8.3%) | 3,319 (14.7%) |
| $50,000 to $74,999 | 4,150 (14.3%) | 3,449 (15.3%) |
| $75,000 to $99,999 | 3,930 (13.6%) | 2,375 (10.5%) |
| $100,000 to $149,999 | 5,390 (18.6%) | 1,912 (8.5%) |
| $150,000 or more | 6,965 (24.0%) | 834 (3.7%) |
| Total | 28,957 (100.0%) | 22,515 (100.0%) |
Monthly Housing Cost Tiers in Lafayette
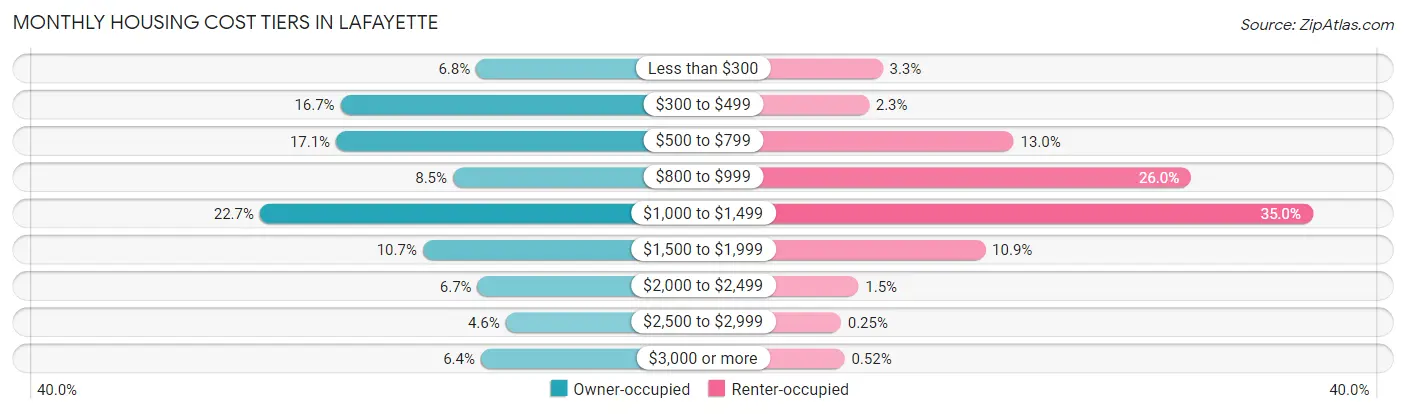
| Monthly Cost | Owner-occupied | Renter-occupied |
| Less than $300 | 1,954 (6.8%) | 748 (3.3%) |
| $300 to $499 | 4,847 (16.7%) | 520 (2.3%) |
| $500 to $799 | 4,944 (17.1%) | 2,921 (13.0%) |
| $800 to $999 | 2,449 (8.5%) | 5,862 (26.0%) |
| $1,000 to $1,499 | 6,567 (22.7%) | 7,883 (35.0%) |
| $1,500 to $1,999 | 3,092 (10.7%) | 2,449 (10.9%) |
| $2,000 to $2,499 | 1,925 (6.7%) | 347 (1.5%) |
| $2,500 to $2,999 | 1,327 (4.6%) | 57 (0.3%) |
| $3,000 or more | 1,852 (6.4%) | 117 (0.5%) |
| Total | 28,957 (100.0%) | 22,515 (100.0%) |
Physical Housing Characteristics in Lafayette
Housing Structures in Lafayette
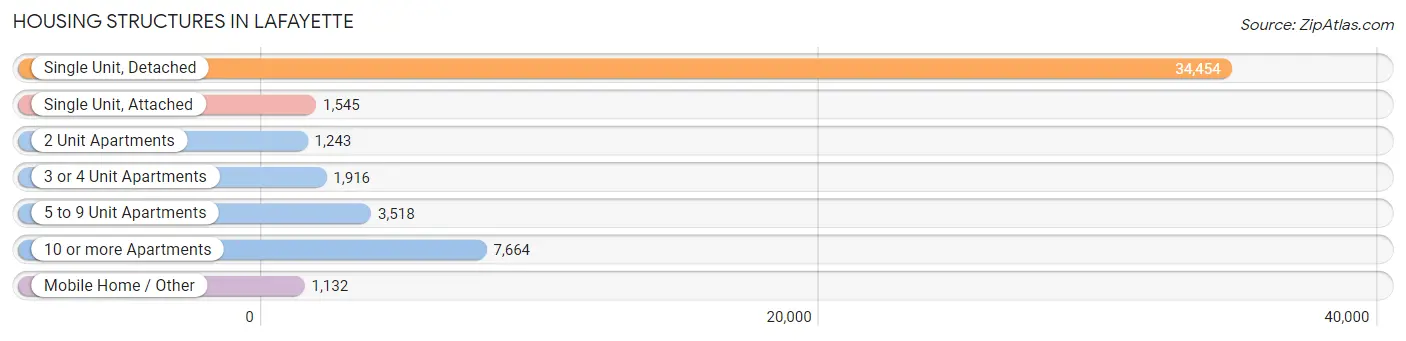
| Structure Type | # Housing Units | % Housing Units |
| Single Unit, Detached | 34,454 | 66.9% |
| Single Unit, Attached | 1,545 | 3.0% |
| 2 Unit Apartments | 1,243 | 2.4% |
| 3 or 4 Unit Apartments | 1,916 | 3.7% |
| 5 to 9 Unit Apartments | 3,518 | 6.8% |
| 10 or more Apartments | 7,664 | 14.9% |
| Mobile Home / Other | 1,132 | 2.2% |
| Total | 51,472 | 100.0% |
Housing Structures by Occupancy in Lafayette
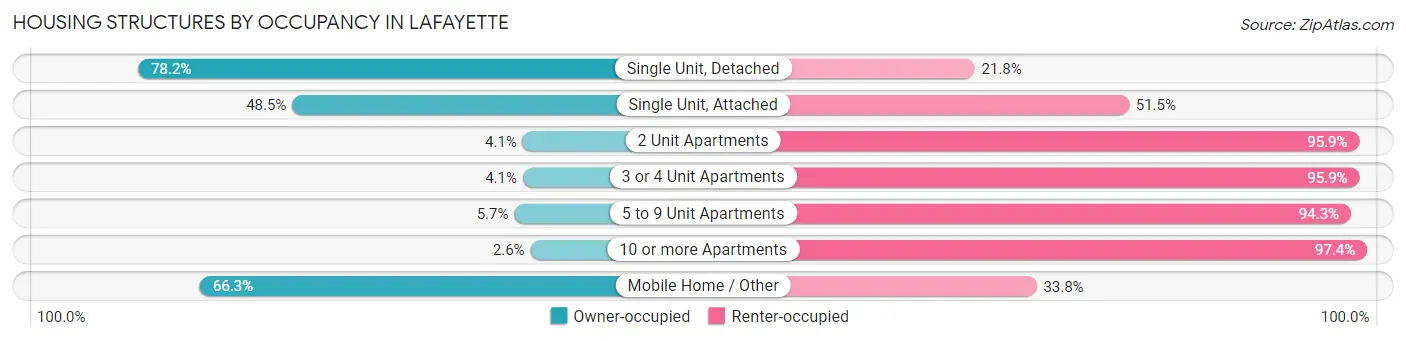
| Structure Type | Owner-occupied | Renter-occupied |
| Single Unit, Detached | 26,928 (78.2%) | 7,526 (21.8%) |
| Single Unit, Attached | 749 (48.5%) | 796 (51.5%) |
| 2 Unit Apartments | 51 (4.1%) | 1,192 (95.9%) |
| 3 or 4 Unit Apartments | 78 (4.1%) | 1,838 (95.9%) |
| 5 to 9 Unit Apartments | 201 (5.7%) | 3,317 (94.3%) |
| 10 or more Apartments | 200 (2.6%) | 7,464 (97.4%) |
| Mobile Home / Other | 750 (66.2%) | 382 (33.8%) |
| Total | 28,957 (56.3%) | 22,515 (43.7%) |
Housing Structures by Number of Rooms in Lafayette
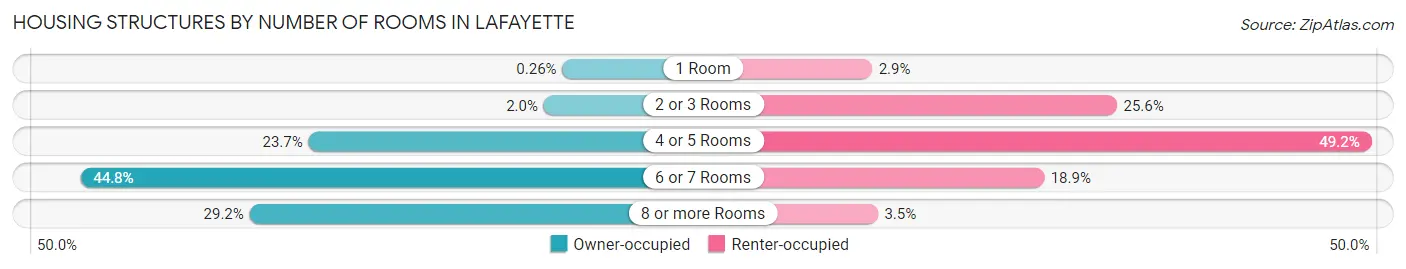
| Number of Rooms | Owner-occupied | Renter-occupied |
| 1 Room | 74 (0.3%) | 661 (2.9%) |
| 2 or 3 Rooms | 573 (2.0%) | 5,759 (25.6%) |
| 4 or 5 Rooms | 6,873 (23.7%) | 11,068 (49.2%) |
| 6 or 7 Rooms | 12,985 (44.8%) | 4,245 (18.9%) |
| 8 or more Rooms | 8,452 (29.2%) | 782 (3.5%) |
| Total | 28,957 (100.0%) | 22,515 (100.0%) |
Housing Structure by Heating Type in Lafayette
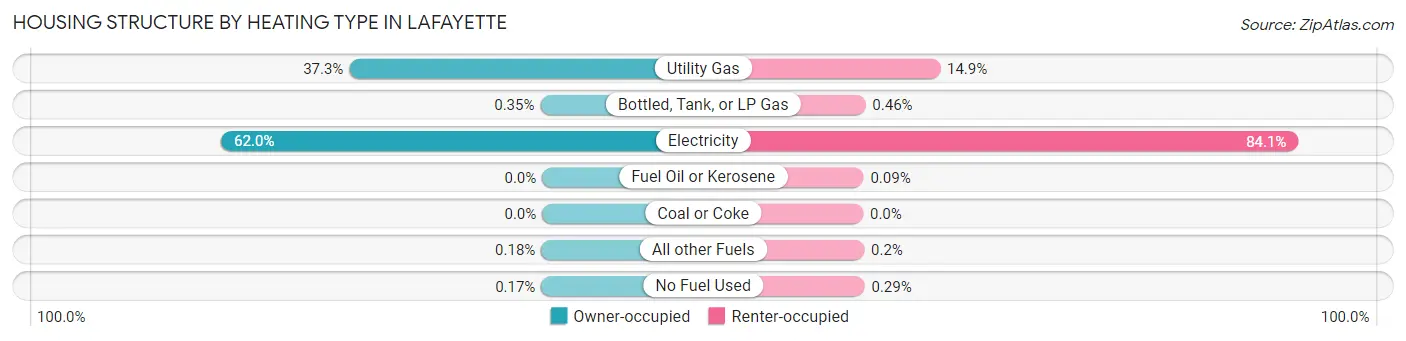
| Heating Type | Owner-occupied | Renter-occupied |
| Utility Gas | 10,794 (37.3%) | 3,350 (14.9%) |
| Bottled, Tank, or LP Gas | 102 (0.4%) | 103 (0.5%) |
| Electricity | 17,962 (62.0%) | 18,931 (84.1%) |
| Fuel Oil or Kerosene | 0 (0.0%) | 20 (0.1%) |
| Coal or Coke | 0 (0.0%) | 0 (0.0%) |
| All other Fuels | 51 (0.2%) | 46 (0.2%) |
| No Fuel Used | 48 (0.2%) | 65 (0.3%) |
| Total | 28,957 (100.0%) | 22,515 (100.0%) |
Household Vehicle Usage in Lafayette
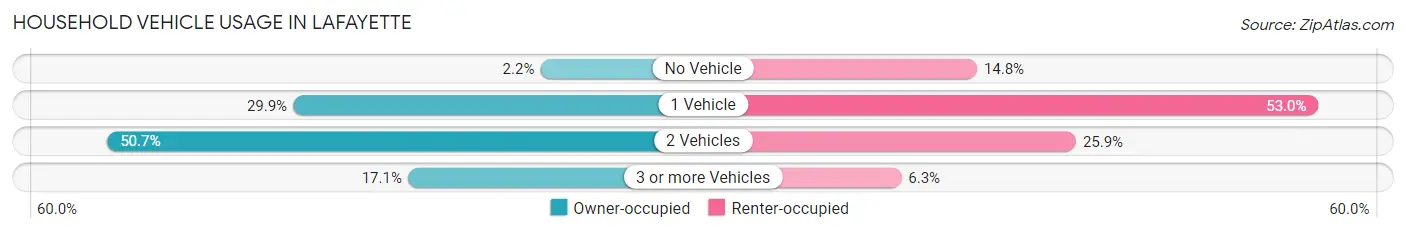
| Vehicles per Household | Owner-occupied | Renter-occupied |
| No Vehicle | 650 (2.2%) | 3,329 (14.8%) |
| 1 Vehicle | 8,669 (29.9%) | 11,937 (53.0%) |
| 2 Vehicles | 14,692 (50.7%) | 5,827 (25.9%) |
| 3 or more Vehicles | 4,946 (17.1%) | 1,422 (6.3%) |
| Total | 28,957 (100.0%) | 22,515 (100.0%) |
Real Estate & Mortgages in Lafayette
Real Estate and Mortgage Overview in Lafayette
| Characteristic | Without Mortgage | With Mortgage |
| Housing Units | 13,083 | 15,874 |
| Median Property Value | $218,800 | $245,200 |
| Median Household Income | $64,983 | $4,572 |
| Monthly Housing Costs | $495 | $1,793 |
| Real Estate Taxes | $1,162 | $809 |
Property Value by Mortgage Status in Lafayette
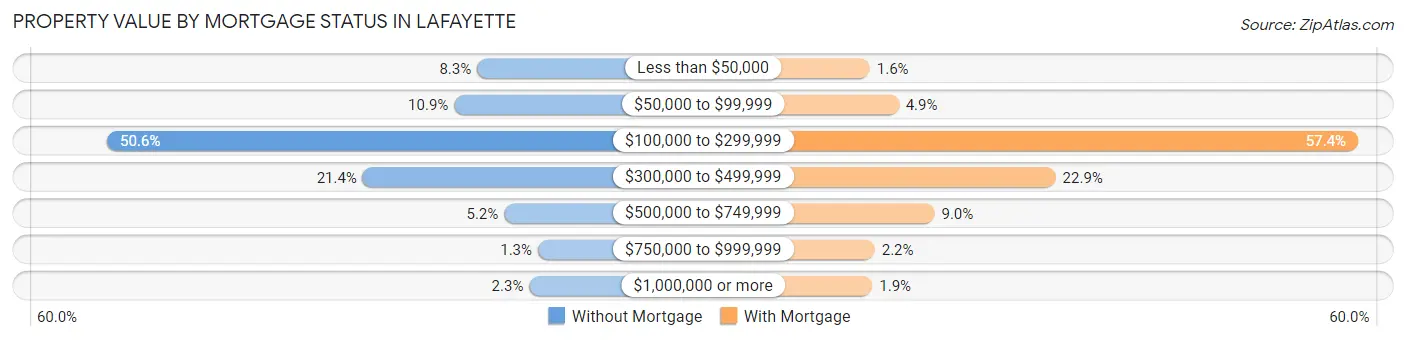
| Property Value | Without Mortgage | With Mortgage |
| Less than $50,000 | 1,085 (8.3%) | 259 (1.6%) |
| $50,000 to $99,999 | 1,428 (10.9%) | 782 (4.9%) |
| $100,000 to $299,999 | 6,616 (50.6%) | 9,114 (57.4%) |
| $300,000 to $499,999 | 2,794 (21.4%) | 3,630 (22.9%) |
| $500,000 to $749,999 | 680 (5.2%) | 1,434 (9.0%) |
| $750,000 to $999,999 | 175 (1.3%) | 350 (2.2%) |
| $1,000,000 or more | 305 (2.3%) | 305 (1.9%) |
| Total | 13,083 (100.0%) | 15,874 (100.0%) |
Household Income by Mortgage Status in Lafayette
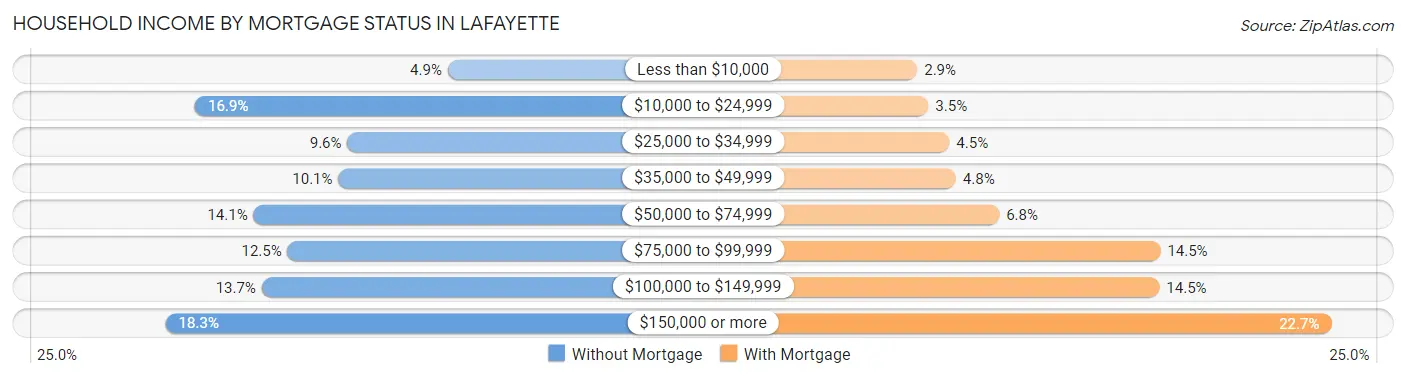
| Household Income | Without Mortgage | With Mortgage |
| Less than $10,000 | 634 (4.9%) | 467 (2.9%) |
| $10,000 to $24,999 | 2,208 (16.9%) | 551 (3.5%) |
| $25,000 to $34,999 | 1,260 (9.6%) | 709 (4.5%) |
| $35,000 to $49,999 | 1,316 (10.1%) | 758 (4.8%) |
| $50,000 to $74,999 | 1,845 (14.1%) | 1,086 (6.8%) |
| $75,000 to $99,999 | 1,633 (12.5%) | 2,305 (14.5%) |
| $100,000 to $149,999 | 1,794 (13.7%) | 2,297 (14.5%) |
| $150,000 or more | 2,393 (18.3%) | 3,596 (22.7%) |
| Total | 13,083 (100.0%) | 15,874 (100.0%) |
Property Value to Household Income Ratio in Lafayette
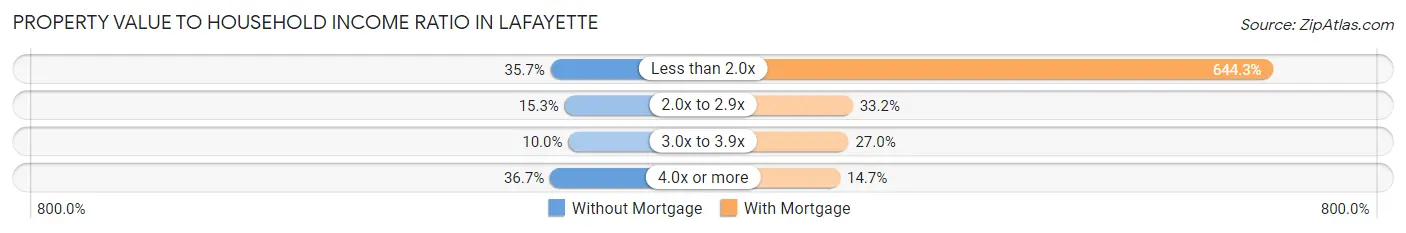
| Value-to-Income Ratio | Without Mortgage | With Mortgage |
| Less than 2.0x | 4,668 (35.7%) | 102,283 (644.3%) |
| 2.0x to 2.9x | 2,001 (15.3%) | 5,263 (33.2%) |
| 3.0x to 3.9x | 1,313 (10.0%) | 4,279 (27.0%) |
| 4.0x or more | 4,800 (36.7%) | 2,327 (14.7%) |
| Total | 13,083 (100.0%) | 15,874 (100.0%) |
Real Estate Taxes by Mortgage Status in Lafayette
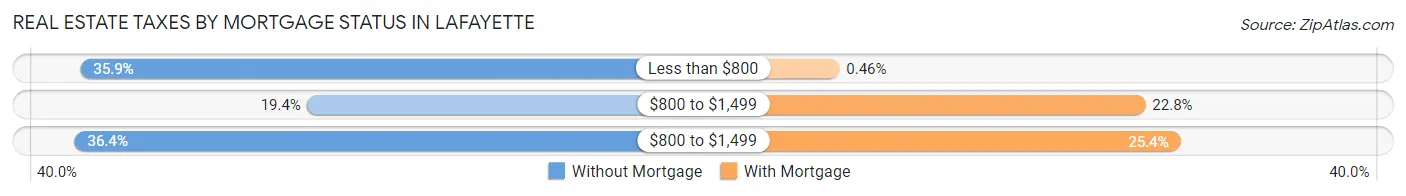
| Property Taxes | Without Mortgage | With Mortgage |
| Less than $800 | 4,700 (35.9%) | 73 (0.5%) |
| $800 to $1,499 | 2,537 (19.4%) | 3,623 (22.8%) |
| $800 to $1,499 | 4,756 (36.3%) | 4,031 (25.4%) |
| Total | 13,083 (100.0%) | 15,874 (100.0%) |
Health & Disability in Lafayette
Health Insurance Coverage by Age in Lafayette
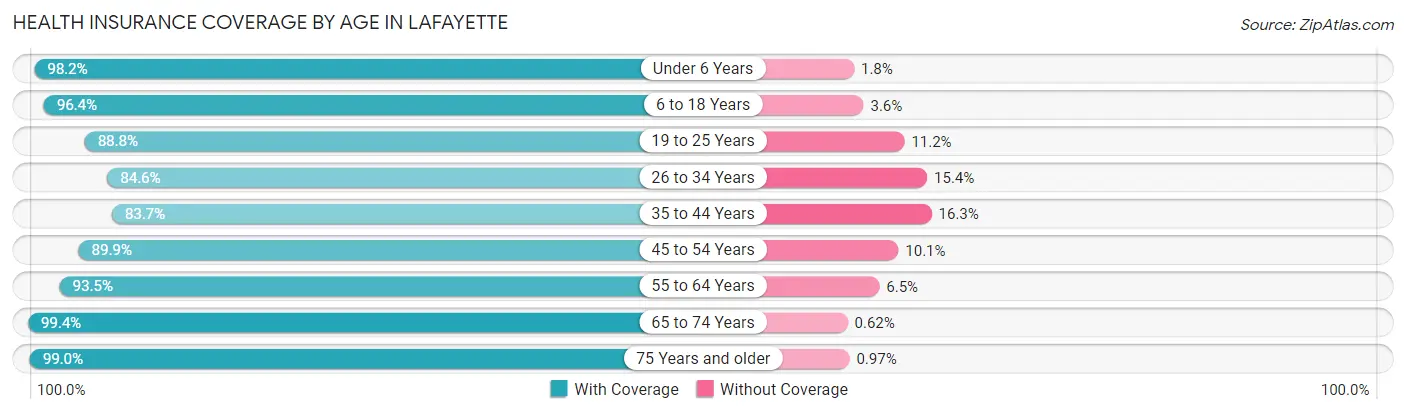
| Age Bracket | With Coverage | Without Coverage |
| Under 6 Years | 8,346 (98.2%) | 155 (1.8%) |
| 6 to 18 Years | 18,117 (96.4%) | 674 (3.6%) |
| 19 to 25 Years | 11,390 (88.8%) | 1,439 (11.2%) |
| 26 to 34 Years | 14,197 (84.6%) | 2,592 (15.4%) |
| 35 to 44 Years | 12,591 (83.7%) | 2,449 (16.3%) |
| 45 to 54 Years | 11,360 (89.9%) | 1,274 (10.1%) |
| 55 to 64 Years | 14,737 (93.5%) | 1,032 (6.5%) |
| 65 to 74 Years | 12,467 (99.4%) | 78 (0.6%) |
| 75 Years and older | 7,159 (99.0%) | 70 (1.0%) |
| Total | 110,364 (91.9%) | 9,763 (8.1%) |
Health Insurance Coverage by Citizenship Status in Lafayette
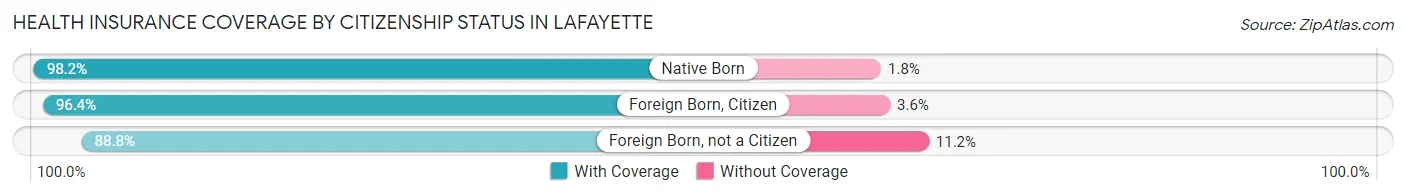
| Citizenship Status | With Coverage | Without Coverage |
| Native Born | 8,346 (98.2%) | 155 (1.8%) |
| Foreign Born, Citizen | 18,117 (96.4%) | 674 (3.6%) |
| Foreign Born, not a Citizen | 11,390 (88.8%) | 1,439 (11.2%) |
Health Insurance Coverage by Household Income in Lafayette
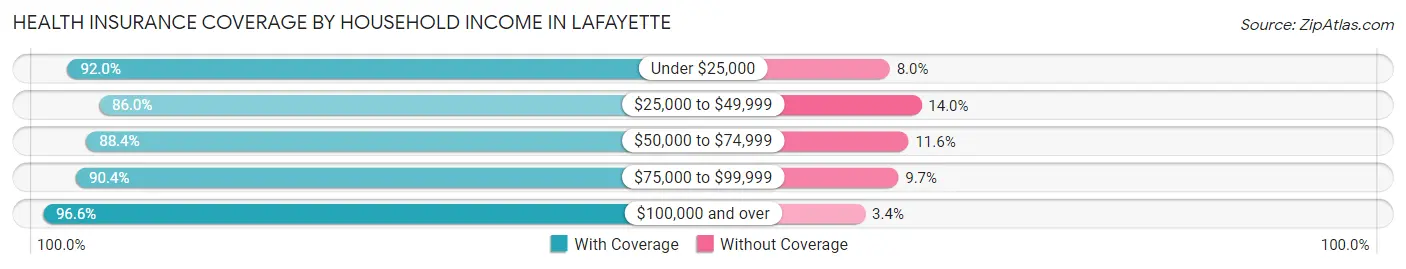
| Household Income | With Coverage | Without Coverage |
| Under $25,000 | 20,184 (92.0%) | 1,764 (8.0%) |
| $25,000 to $49,999 | 17,930 (86.0%) | 2,912 (14.0%) |
| $50,000 to $74,999 | 15,138 (88.4%) | 1,979 (11.6%) |
| $75,000 to $99,999 | 13,882 (90.3%) | 1,483 (9.7%) |
| $100,000 and over | 40,699 (96.6%) | 1,451 (3.4%) |
Public vs Private Health Insurance Coverage by Age in Lafayette
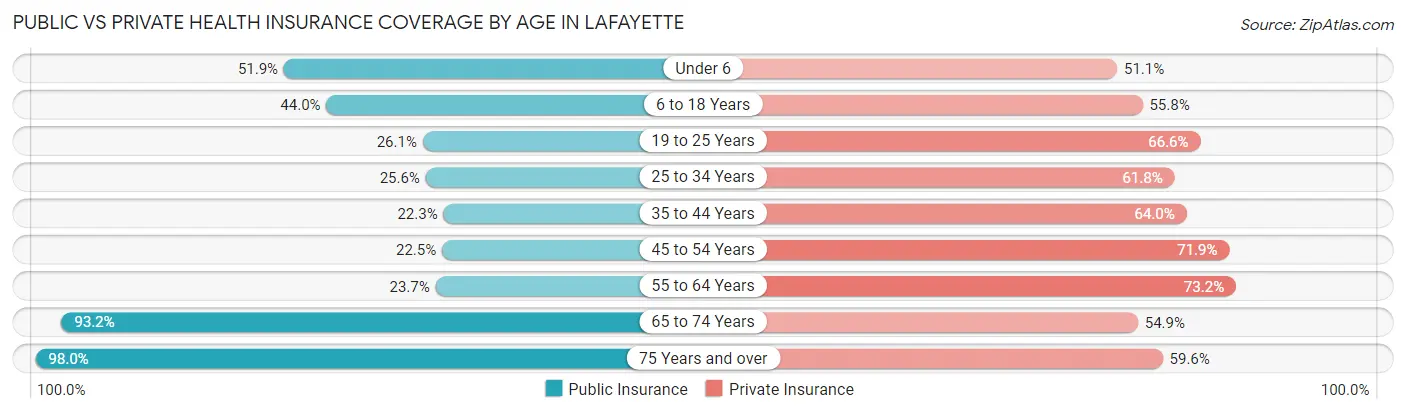
| Age Bracket | Public Insurance | Private Insurance |
| Under 6 | 4,409 (51.9%) | 4,343 (51.1%) |
| 6 to 18 Years | 8,265 (44.0%) | 10,487 (55.8%) |
| 19 to 25 Years | 3,349 (26.1%) | 8,538 (66.5%) |
| 25 to 34 Years | 4,290 (25.6%) | 10,373 (61.8%) |
| 35 to 44 Years | 3,347 (22.3%) | 9,625 (64.0%) |
| 45 to 54 Years | 2,845 (22.5%) | 9,086 (71.9%) |
| 55 to 64 Years | 3,741 (23.7%) | 11,537 (73.2%) |
| 65 to 74 Years | 11,688 (93.2%) | 6,892 (54.9%) |
| 75 Years and over | 7,084 (98.0%) | 4,305 (59.6%) |
| Total | 49,018 (40.8%) | 75,186 (62.6%) |
Disability Status by Sex by Age in Lafayette
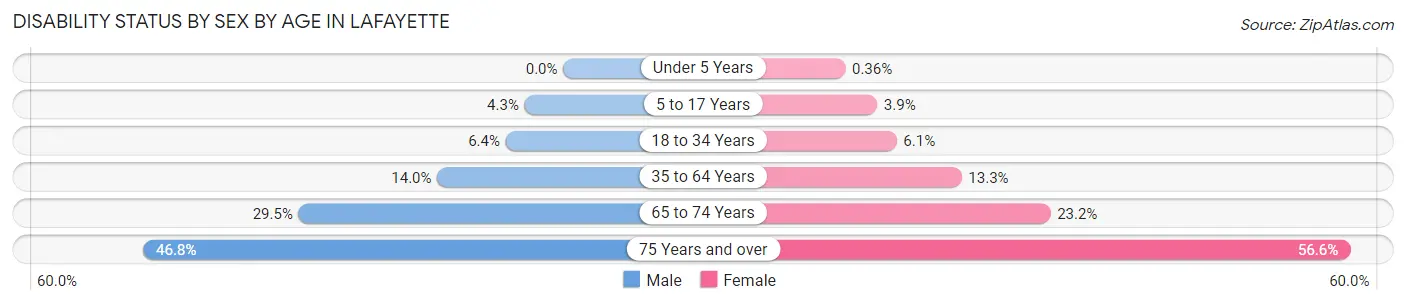
| Age Bracket | Male | Female |
| Under 5 Years | 0 (0.0%) | 12 (0.4%) |
| 5 to 17 Years | 395 (4.3%) | 375 (3.9%) |
| 18 to 34 Years | 1,042 (6.4%) | 907 (6.1%) |
| 35 to 64 Years | 2,837 (14.0%) | 3,094 (13.3%) |
| 65 to 74 Years | 1,752 (29.5%) | 1,532 (23.2%) |
| 75 Years and over | 1,450 (46.8%) | 2,338 (56.6%) |
Disability Class by Sex by Age in Lafayette
Disability Class: Hearing Difficulty
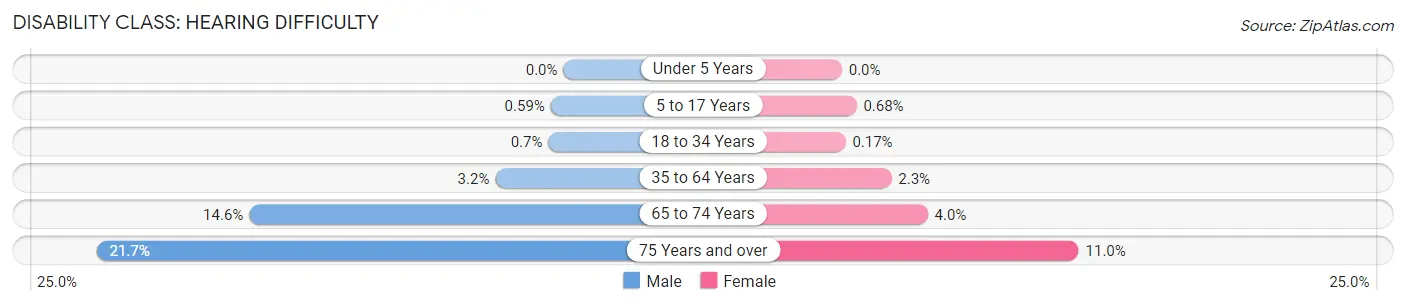
| Age Bracket | Male | Female |
| Under 5 Years | 0 (0.0%) | 0 (0.0%) |
| 5 to 17 Years | 54 (0.6%) | 65 (0.7%) |
| 18 to 34 Years | 114 (0.7%) | 26 (0.2%) |
| 35 to 64 Years | 639 (3.2%) | 533 (2.3%) |
| 65 to 74 Years | 867 (14.6%) | 263 (4.0%) |
| 75 Years and over | 671 (21.7%) | 454 (11.0%) |
Disability Class: Vision Difficulty
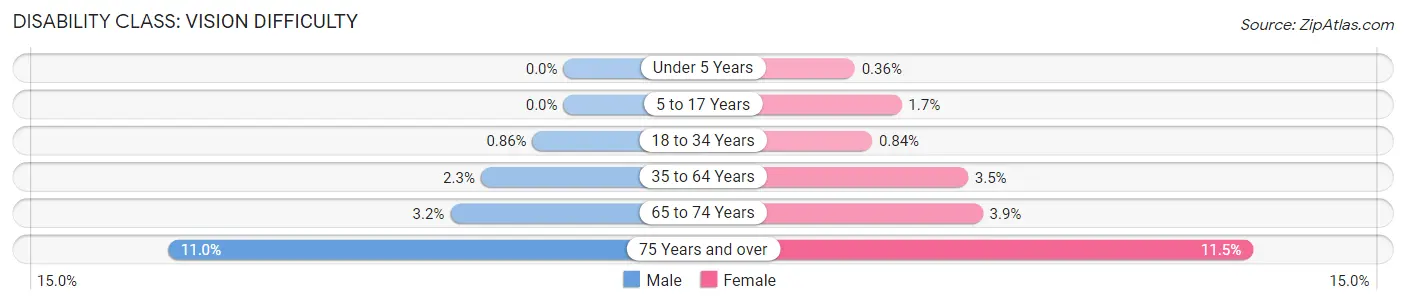
| Age Bracket | Male | Female |
| Under 5 Years | 0 (0.0%) | 12 (0.4%) |
| 5 to 17 Years | 0 (0.0%) | 159 (1.7%) |
| 18 to 34 Years | 139 (0.9%) | 126 (0.8%) |
| 35 to 64 Years | 465 (2.3%) | 815 (3.5%) |
| 65 to 74 Years | 187 (3.2%) | 259 (3.9%) |
| 75 Years and over | 341 (11.0%) | 473 (11.5%) |
Disability Class: Cognitive Difficulty
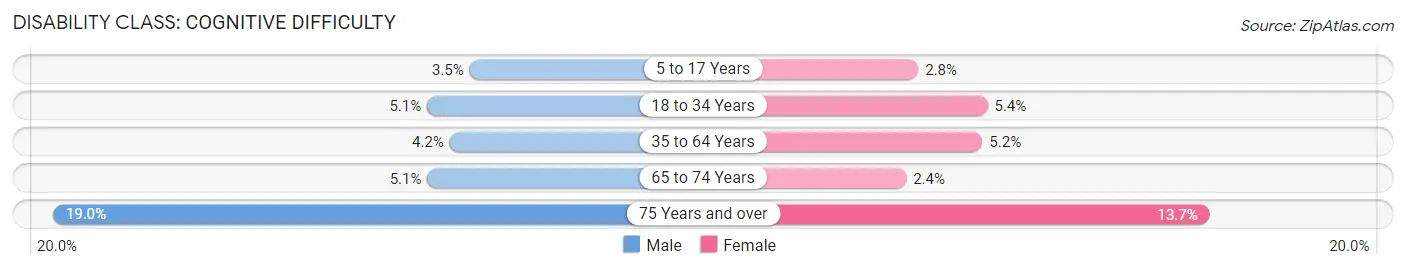
| Age Bracket | Male | Female |
| 5 to 17 Years | 320 (3.5%) | 272 (2.8%) |
| 18 to 34 Years | 822 (5.1%) | 807 (5.4%) |
| 35 to 64 Years | 854 (4.2%) | 1,212 (5.2%) |
| 65 to 74 Years | 300 (5.1%) | 158 (2.4%) |
| 75 Years and over | 587 (19.0%) | 564 (13.7%) |
Disability Class: Ambulatory Difficulty
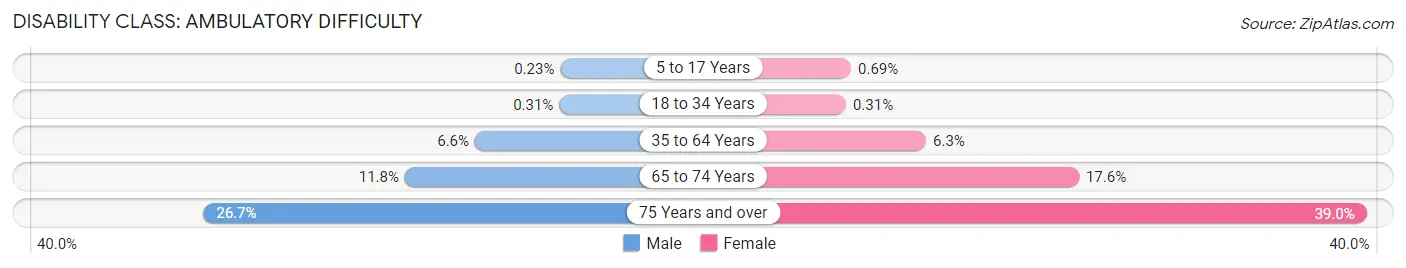
| Age Bracket | Male | Female |
| 5 to 17 Years | 21 (0.2%) | 66 (0.7%) |
| 18 to 34 Years | 50 (0.3%) | 46 (0.3%) |
| 35 to 64 Years | 1,328 (6.6%) | 1,453 (6.3%) |
| 65 to 74 Years | 700 (11.8%) | 1,162 (17.6%) |
| 75 Years and over | 828 (26.7%) | 1,610 (39.0%) |
Disability Class: Self-Care Difficulty
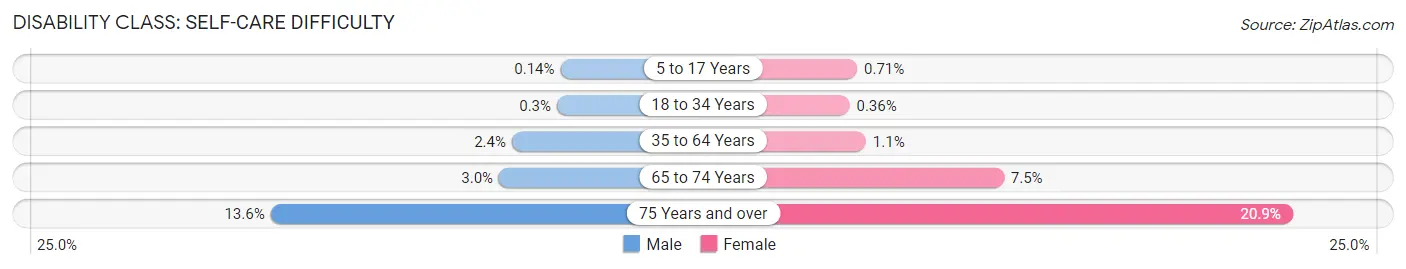
| Age Bracket | Male | Female |
| 5 to 17 Years | 13 (0.1%) | 68 (0.7%) |
| 18 to 34 Years | 49 (0.3%) | 54 (0.4%) |
| 35 to 64 Years | 483 (2.4%) | 261 (1.1%) |
| 65 to 74 Years | 178 (3.0%) | 496 (7.5%) |
| 75 Years and over | 421 (13.6%) | 864 (20.9%) |
Technology Access in Lafayette
Computing Device Access in Lafayette
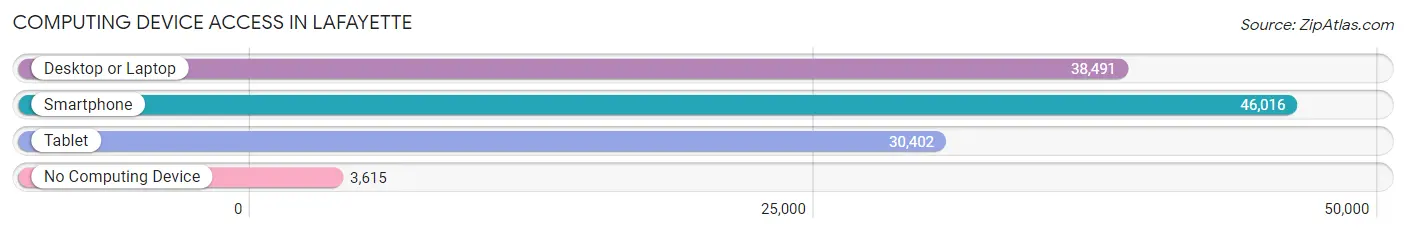
| Device Type | # Households | % Households |
| Desktop or Laptop | 38,491 | 74.8% |
| Smartphone | 46,016 | 89.4% |
| Tablet | 30,402 | 59.1% |
| No Computing Device | 3,615 | 7.0% |
| Total | 51,472 | 100.0% |
Internet Access in Lafayette
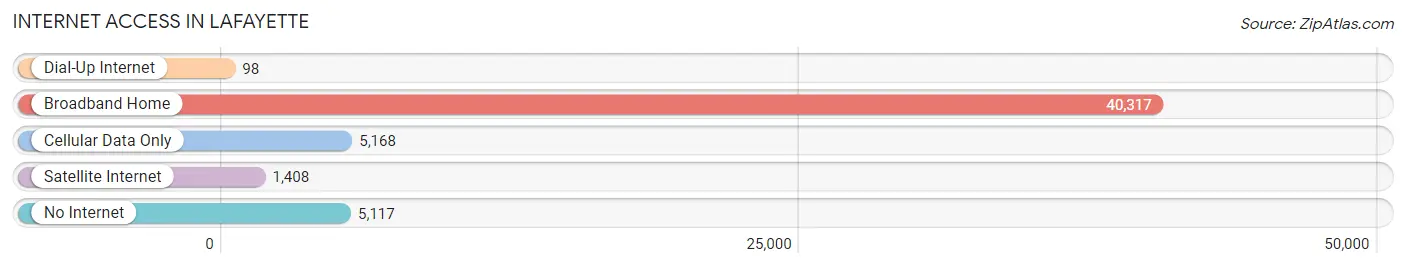
| Internet Type | # Households | % Households |
| Dial-Up Internet | 98 | 0.2% |
| Broadband Home | 40,317 | 78.3% |
| Cellular Data Only | 5,168 | 10.0% |
| Satellite Internet | 1,408 | 2.7% |
| No Internet | 5,117 | 9.9% |
| Total | 51,472 | 100.0% |
Lafayette Summary
Lafayette, Louisiana is a city located in the southern United States, in the state of Louisiana. It is the fourth-largest city in the state, and the parish seat of Lafayette Parish. The city is located on the Vermilion River, and is the center of the Lafayette metropolitan area, which includes the parishes of Lafayette, Acadia, Iberia, St. Martin, St. Landry, and Vermilion. The city is known for its vibrant culture, Cajun and Creole cuisine, and its music and festivals.
History
The area that is now Lafayette was first settled by Native Americans in the late 1600s. The first Europeans to settle in the area were French colonists, who arrived in the early 1700s. The area was part of the French colony of Louisiana, and was known as Vermilionville. The city was founded in 1821, and was named after the Marquis de Lafayette, a French military hero who fought in the American Revolutionary War.
In the early 1800s, the area was a major center for the sugar cane industry, and the city grew rapidly. By the mid-1800s, the city had become a major port, and was a center for the cotton and lumber industries. The city was also a major center for the oil industry, and was home to several oil refineries.
In the late 1800s, the city was a major center for the railroad industry, and was home to several major railroads. The city was also a major center for the shipping industry, and was home to several major shipping companies.
In the early 1900s, the city was a major center for the oil industry, and was home to several major oil companies. The city was also a major center for the chemical industry, and was home to several major chemical companies.
In the mid-1900s, the city was a major center for the aerospace industry, and was home to several major aerospace companies. The city was also a major center for the medical industry, and was home to several major medical companies.
Geography
Lafayette is located in the southern part of the state of Louisiana, in the Gulf Coastal Plain region. The city is located on the Vermilion River, and is the center of the Lafayette metropolitan area, which includes the parishes of Lafayette, Acadia, Iberia, St. Martin, St. Landry, and Vermilion. The city is located about 50 miles west of Baton Rouge, and about 100 miles west of New Orleans.
The city has a total area of 44.3 square miles, of which 43.7 square miles is land and 0.6 square miles is water. The city is located at an elevation of 33 feet above sea level.
Economy
Lafayette has a diversified economy, with a mix of industries including oil and gas, manufacturing, healthcare, education, and tourism. The city is home to several major oil and gas companies, including Chevron, ExxonMobil, and Shell. The city is also home to several major manufacturing companies, including Cajun Industries, CITGO Petroleum, and Halliburton.
The city is home to several major healthcare companies, including Lafayette General Health, Ochsner Health System, and Our Lady of Lourdes Regional Medical Center. The city is also home to several major educational institutions, including the University of Louisiana at Lafayette, South Louisiana Community College, and the University of Louisiana at Monroe.
The city is also a major tourist destination, and is home to several major attractions, including the Acadian Village, the Lafayette Science Museum, and the Vermilionville Living History Museum.
Demographics
As of the 2010 census, the city had a population of 120,623. The racial makeup of the city was 57.2% White, 33.3% African American, 0.5% Native American, 2.2% Asian, 0.1% Pacific Islander, 4.3% from other races, and 2.4% from two or more races. Hispanic or Latino of any race were 8.2% of the population.
The median income for a household in the city was $37,837, and the median income for a family was $45,945. The per capita income for the city was $20,945. About 17.2% of the population was below the poverty line.
Common Questions
What is Per Capita Income in Lafayette?
Per Capita income in Lafayette is $37,651.
What is the Median Family Income in Lafayette?
Median Family Income in Lafayette is $85,173.
What is the Median Household income in Lafayette?
Median Household Income in Lafayette is $58,850.
What is Income or Wage Gap in Lafayette?
Income or Wage Gap in Lafayette is 39.4%.
Women in Lafayette earn 60.6 cents for every dollar earned by a man.
What is Family Income Deficit in Lafayette?
Family Income Deficit in Lafayette is $11,645.
Families that are below poverty line in Lafayette earn $11,645 less on average than the poverty threshold level.
What is Inequality or Gini Index in Lafayette?
Inequality or Gini Index in Lafayette is 0.51.
What is the Total Population of Lafayette?
Total Population of Lafayette is 121,706.
What is the Total Male Population of Lafayette?
Total Male Population of Lafayette is 59,489.
What is the Total Female Population of Lafayette?
Total Female Population of Lafayette is 62,217.
What is the Ratio of Males per 100 Females in Lafayette?
There are 95.62 Males per 100 Females in Lafayette.
What is the Ratio of Females per 100 Males in Lafayette?
There are 104.59 Females per 100 Males in Lafayette.
What is the Median Population Age in Lafayette?
Median Population Age in Lafayette is 36.9 Years.
What is the Average Family Size in Lafayette
Average Family Size in Lafayette is 3.0 People.
What is the Average Household Size in Lafayette
Average Household Size in Lafayette is 2.3 People.
How Large is the Labor Force in Lafayette?
There are 62,053 People in the Labor Forcein in Lafayette.
What is the Percentage of People in the Labor Force in Lafayette?
62.9% of People are in the Labor Force in Lafayette.
What is the Unemployment Rate in Lafayette?
Unemployment Rate in Lafayette is 6.1%.