Detroit, MI Map & Demographics
Detroit Map
Detroit Overview
$22,861
PER CAPITA INCOME
$46,424
AVG FAMILY INCOME
$37,761
AVG HOUSEHOLD INCOME
12.8%
WAGE / INCOME GAP [ % ]
87.2¢/ $1
WAGE / INCOME GAP [ $ ]
$12,695
FAMILY INCOME DEFICIT
0.51
INEQUALITY / GINI INDEX
636,787
TOTAL POPULATION
302,874
MALE POPULATION
333,913
FEMALE POPULATION
90.70
MALES / 100 FEMALES
110.25
FEMALES / 100 MALES
35.0
MEDIAN AGE
3.6
AVG FAMILY SIZE
2.5
AVG HOUSEHOLD SIZE
272,226
LABOR FORCE [ PEOPLE ]
54.8%
PERCENT IN LABOR FORCE
14.7%
UNEMPLOYMENT RATE
Detroit Zip Codes
Income in Detroit
Income Overview in Detroit
Per Capita Income in Detroit is $22,861, while median incomes of families and households are $46,424 and $37,761 respectively.
| Characteristic | Number | Measure |
| Per Capita Income | 636,787 | $22,861 |
| Median Family Income | 128,127 | $46,424 |
| Mean Family Income | 128,127 | $63,611 |
| Median Household Income | 249,518 | $37,761 |
| Mean Household Income | 249,518 | $54,054 |
| Income Deficit | 128,127 | $12,695 |
| Wage / Income Gap (%) | 636,787 | 12.83% |
| Wage / Income Gap ($) | 636,787 | 87.17¢ per $1 |
| Gini / Inequality Index | 636,787 | 0.51 |
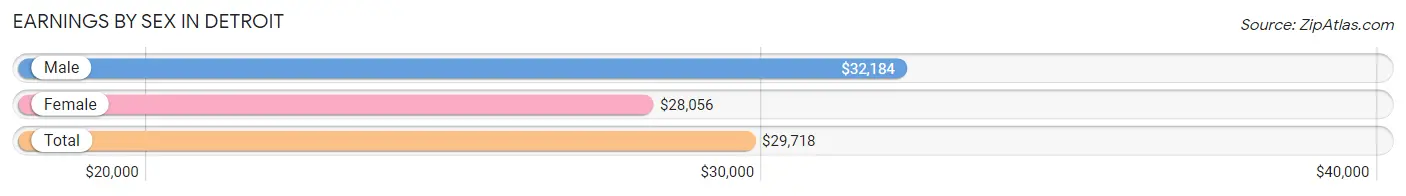
Earnings by Sex in Detroit
Average Earnings in Detroit are $29,718, $32,184 for men and $28,056 for women, a difference of 12.8%.
| Sex | Number | Average Earnings |
| Male | 128,120 (47.1%) | $32,184 |
| Female | 143,826 (52.9%) | $28,056 |
| Total | 271,946 (100.0%) | $29,718 |
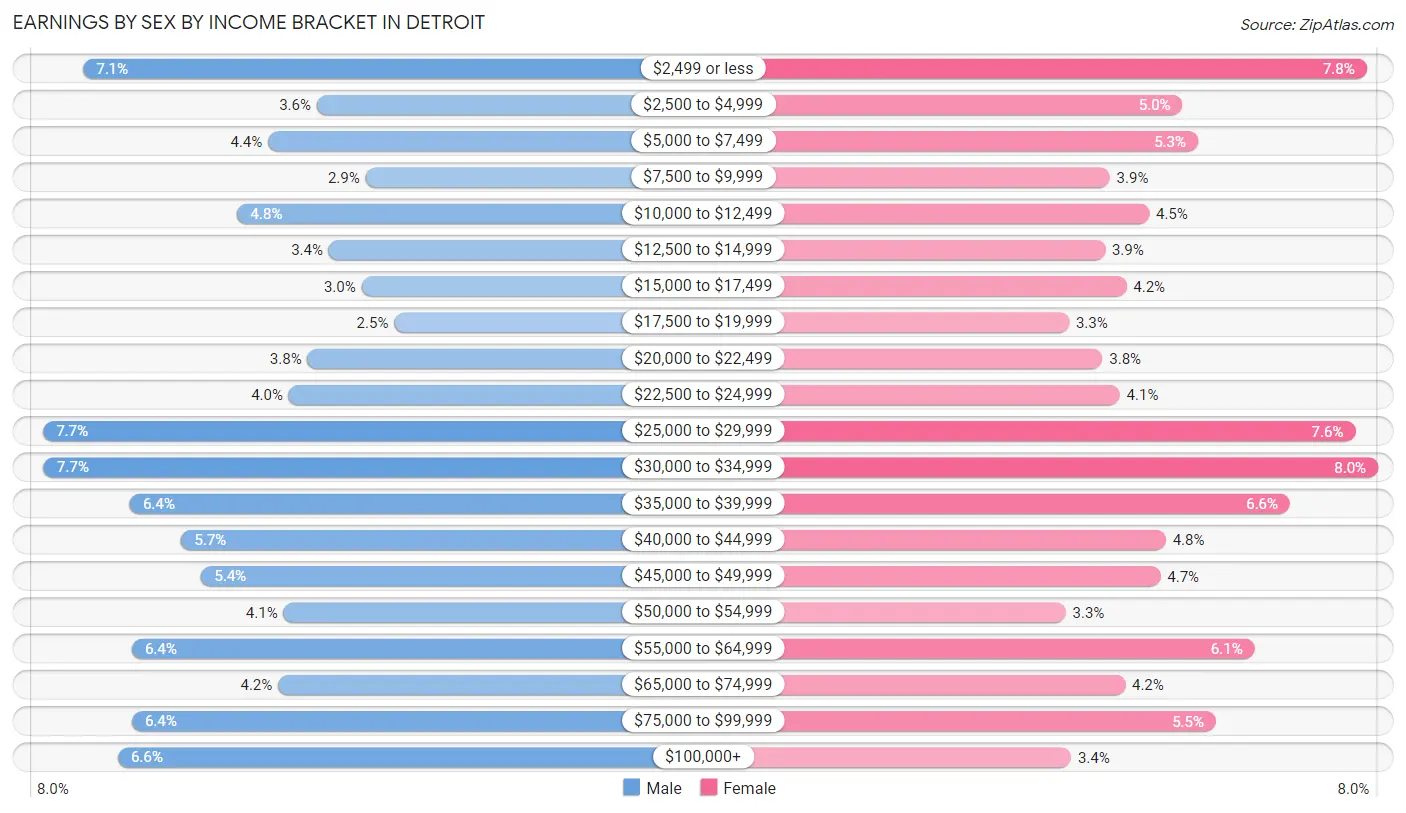
Earnings by Sex by Income Bracket in Detroit
The most common earnings brackets in Detroit are $25,000 to $29,999 for men (9,892 | 7.7%) and $30,000 to $34,999 for women (11,445 | 8.0%).
| Income | Male | Female |
| $2,499 or less | 9,124 (7.1%) | 11,198 (7.8%) |
| $2,500 to $4,999 | 4,640 (3.6%) | 7,231 (5.0%) |
| $5,000 to $7,499 | 5,568 (4.3%) | 7,570 (5.3%) |
| $7,500 to $9,999 | 3,698 (2.9%) | 5,662 (3.9%) |
| $10,000 to $12,499 | 6,164 (4.8%) | 6,509 (4.5%) |
| $12,500 to $14,999 | 4,410 (3.4%) | 5,570 (3.9%) |
| $15,000 to $17,499 | 3,785 (2.9%) | 6,025 (4.2%) |
| $17,500 to $19,999 | 3,148 (2.5%) | 4,786 (3.3%) |
| $20,000 to $22,499 | 4,823 (3.8%) | 5,505 (3.8%) |
| $22,500 to $24,999 | 5,170 (4.0%) | 5,880 (4.1%) |
| $25,000 to $29,999 | 9,892 (7.7%) | 10,959 (7.6%) |
| $30,000 to $34,999 | 9,880 (7.7%) | 11,445 (8.0%) |
| $35,000 to $39,999 | 8,227 (6.4%) | 9,551 (6.6%) |
| $40,000 to $44,999 | 7,240 (5.7%) | 6,880 (4.8%) |
| $45,000 to $49,999 | 6,855 (5.3%) | 6,767 (4.7%) |
| $50,000 to $54,999 | 5,284 (4.1%) | 4,723 (3.3%) |
| $55,000 to $64,999 | 8,182 (6.4%) | 8,791 (6.1%) |
| $65,000 to $74,999 | 5,387 (4.2%) | 5,991 (4.2%) |
| $75,000 to $99,999 | 8,188 (6.4%) | 7,954 (5.5%) |
| $100,000+ | 8,455 (6.6%) | 4,829 (3.4%) |
| Total | 128,120 (100.0%) | 143,826 (100.0%) |
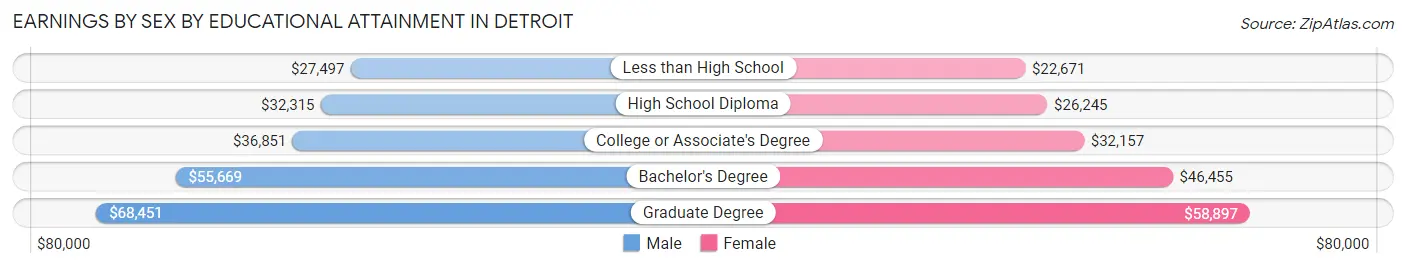
Earnings by Sex by Educational Attainment in Detroit
Average earnings in Detroit are $35,702 for men and $32,130 for women, a difference of 10.0%. Men with an educational attainment of graduate degree enjoy the highest average annual earnings of $68,451, while those with less than high school education earn the least with $27,497. Women with an educational attainment of graduate degree earn the most with the average annual earnings of $58,897, while those with less than high school education have the smallest earnings of $22,671.
| Educational Attainment | Male Income | Female Income |
| Less than High School | $27,497 | $22,671 |
| High School Diploma | $32,315 | $26,245 |
| College or Associate's Degree | $36,851 | $32,157 |
| Bachelor's Degree | $55,669 | $46,455 |
| Graduate Degree | $68,451 | $58,897 |
| Total | $35,702 | $32,130 |
Family Income in Detroit
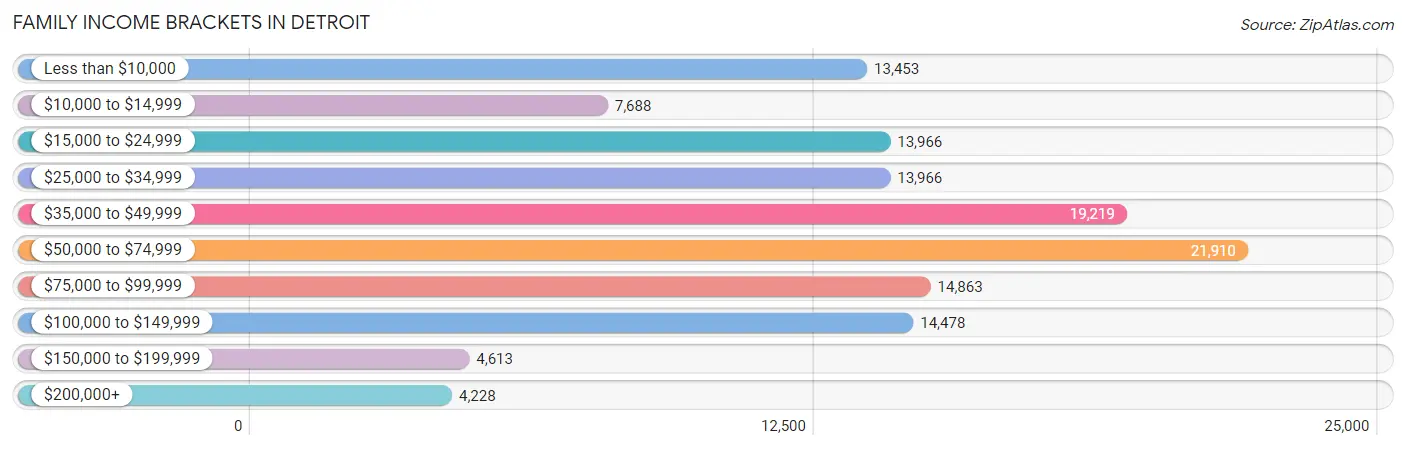
Family Income Brackets in Detroit
According to the Detroit family income data, there are 21,910 families falling into the $50,000 to $74,999 income range, which is the most common income bracket and makes up 17.1% of all families. Conversely, the $200,000+ income bracket is the least frequent group with only 4,228 families (3.3%) belonging to this category.
| Income Bracket | # Families | % Families |
| Less than $10,000 | 13,453 | 10.5% |
| $10,000 to $14,999 | 7,688 | 6.0% |
| $15,000 to $24,999 | 13,966 | 10.9% |
| $25,000 to $34,999 | 13,966 | 10.9% |
| $35,000 to $49,999 | 19,219 | 15.0% |
| $50,000 to $74,999 | 21,910 | 17.1% |
| $75,000 to $99,999 | 14,863 | 11.6% |
| $100,000 to $149,999 | 14,478 | 11.3% |
| $150,000 to $199,999 | 4,613 | 3.6% |
| $200,000+ | 4,228 | 3.3% |
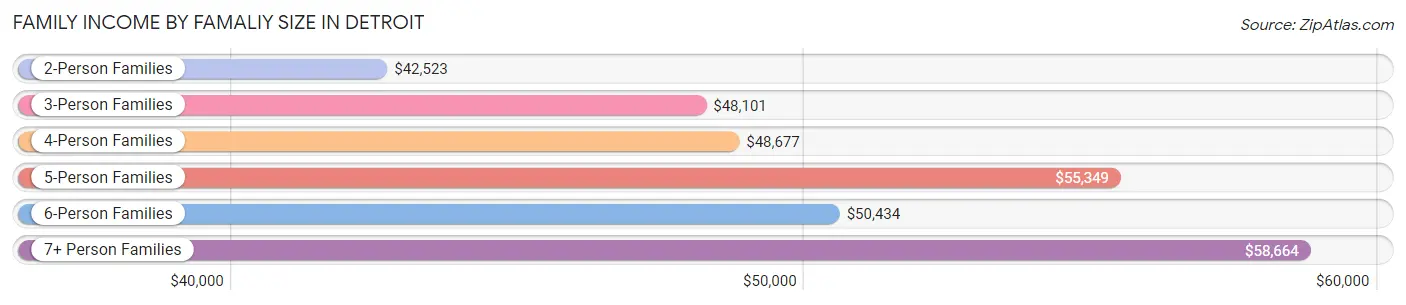
Family Income by Famaliy Size in Detroit
7+ person families (4,535 | 3.5%) account for the highest median family income in Detroit with $58,664 per family, while 2-person families (56,375 | 44.0%) have the highest median income of $21,262 per family member.
| Income Bracket | # Families | Median Income |
| 2-Person Families | 56,375 (44.0%) | $42,523 |
| 3-Person Families | 31,293 (24.4%) | $48,101 |
| 4-Person Families | 19,668 (15.3%) | $48,677 |
| 5-Person Families | 10,341 (8.1%) | $55,349 |
| 6-Person Families | 5,915 (4.6%) | $50,434 |
| 7+ Person Families | 4,535 (3.5%) | $58,664 |
| Total | 128,127 (100.0%) | $46,424 |
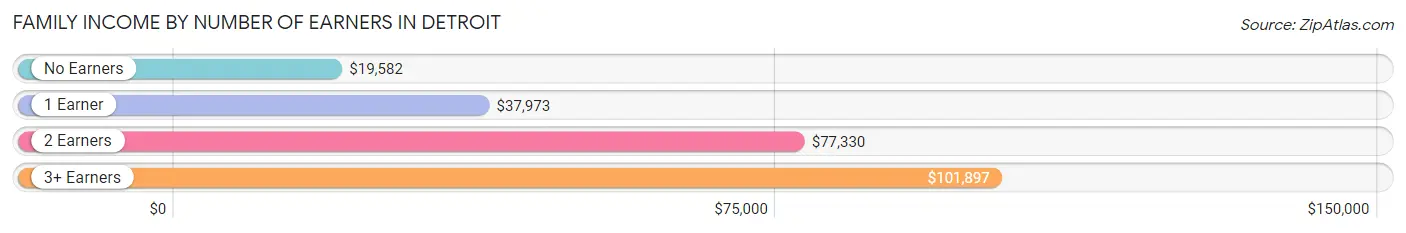
Family Income by Number of Earners in Detroit
The median family income in Detroit is $46,424, with families comprising 3+ earners (10,621) having the highest median family income of $101,897, while families with no earners (26,572) have the lowest median family income of $19,582, accounting for 8.3% and 20.7% of families, respectively.
| Number of Earners | # Families | Median Income |
| No Earners | 26,572 (20.7%) | $19,582 |
| 1 Earner | 56,117 (43.8%) | $37,973 |
| 2 Earners | 34,817 (27.2%) | $77,330 |
| 3+ Earners | 10,621 (8.3%) | $101,897 |
| Total | 128,127 (100.0%) | $46,424 |
Household Income in Detroit
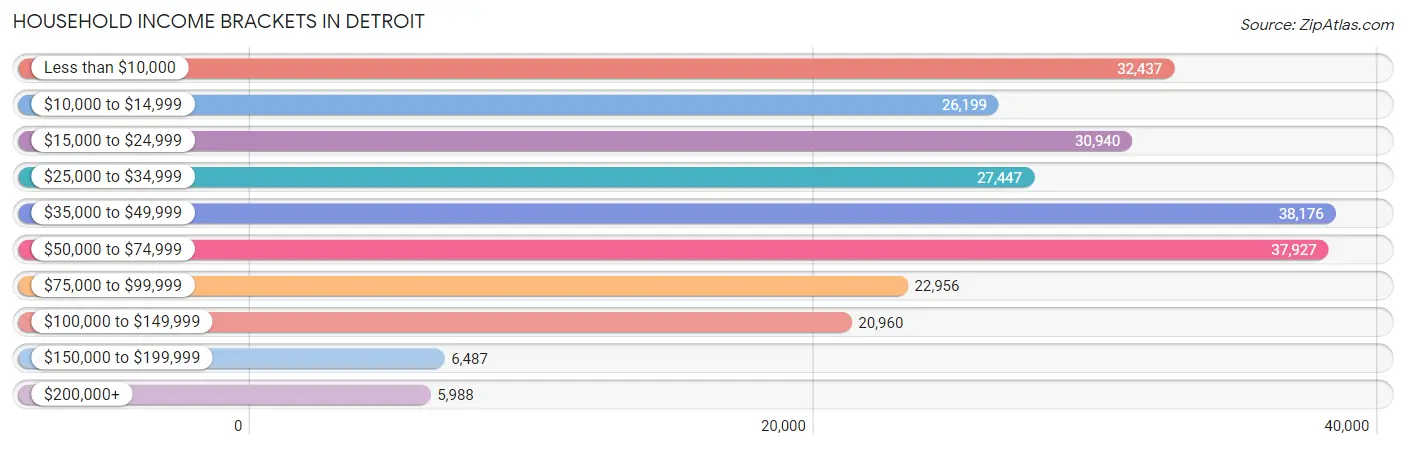
Household Income Brackets in Detroit
With 38,176 households falling in the category, the $35,000 to $49,999 income range is the most frequent in Detroit, accounting for 15.3% of all households. In contrast, only 5,988 households (2.4%) fall into the $200,000+ income bracket, making it the least populous group.
| Income Bracket | # Households | % Households |
| Less than $10,000 | 32,437 | 13.0% |
| $10,000 to $14,999 | 26,199 | 10.5% |
| $15,000 to $24,999 | 30,940 | 12.4% |
| $25,000 to $34,999 | 27,447 | 11.0% |
| $35,000 to $49,999 | 38,176 | 15.3% |
| $50,000 to $74,999 | 37,927 | 15.2% |
| $75,000 to $99,999 | 22,956 | 9.2% |
| $100,000 to $149,999 | 20,960 | 8.4% |
| $150,000 to $199,999 | 6,487 | 2.6% |
| $200,000+ | 5,988 | 2.4% |
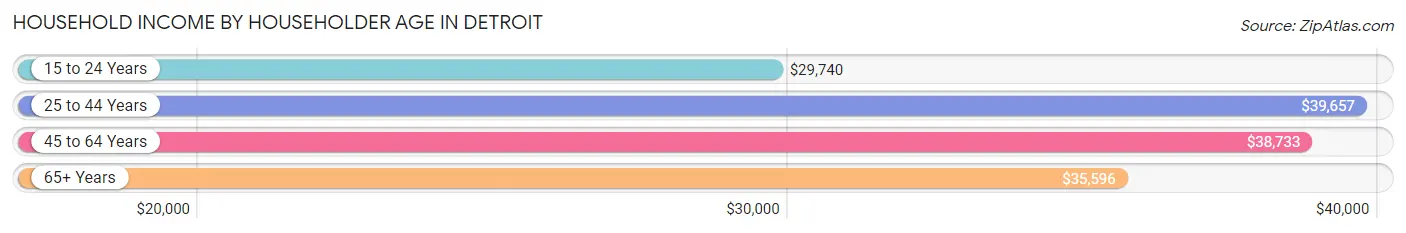
Household Income by Householder Age in Detroit
The median household income in Detroit is $37,761, with the highest median household income of $39,657 found in the 25 to 44 years age bracket for the primary householder. A total of 84,872 households (34.0%) fall into this category. Meanwhile, the 15 to 24 years age bracket for the primary householder has the lowest median household income of $29,740, with 8,563 households (3.4%) in this group.
| Income Bracket | # Households | Median Income |
| 15 to 24 Years | 8,563 (3.4%) | $29,740 |
| 25 to 44 Years | 84,872 (34.0%) | $39,657 |
| 45 to 64 Years | 91,891 (36.8%) | $38,733 |
| 65+ Years | 64,192 (25.7%) | $35,596 |
| Total | 249,518 (100.0%) | $37,761 |
Poverty in Detroit
Income Below Poverty by Sex and Age in Detroit
With 30.4% poverty level for males and 32.5% for females among the residents of Detroit, under 5 year old males and 6 to 11 year old females are the most vulnerable to poverty, with 10,439 males (46.9%) and 11,741 females (49.0%) in their respective age groups living below the poverty level.
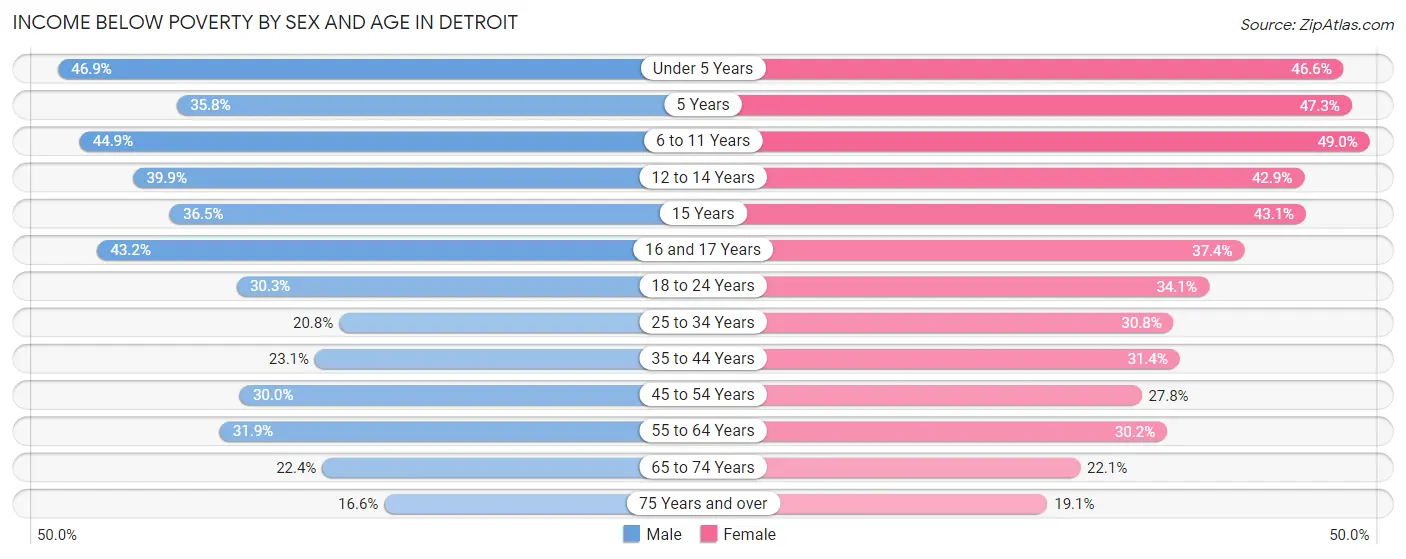
| Age Bracket | Male | Female |
| Under 5 Years | 10,439 (46.9%) | 9,739 (46.6%) |
| 5 Years | 1,466 (35.8%) | 2,237 (47.3%) |
| 6 to 11 Years | 11,734 (44.9%) | 11,741 (49.0%) |
| 12 to 14 Years | 5,375 (39.9%) | 5,942 (42.9%) |
| 15 Years | 1,647 (36.5%) | 1,680 (43.1%) |
| 16 and 17 Years | 3,290 (43.2%) | 3,322 (37.4%) |
| 18 to 24 Years | 9,015 (30.3%) | 10,192 (34.1%) |
| 25 to 34 Years | 9,474 (20.8%) | 15,983 (30.8%) |
| 35 to 44 Years | 7,912 (23.1%) | 12,455 (31.4%) |
| 45 to 54 Years | 10,834 (30.0%) | 10,924 (27.8%) |
| 55 to 64 Years | 11,514 (31.9%) | 11,948 (30.2%) |
| 65 to 74 Years | 5,357 (22.4%) | 6,749 (22.1%) |
| 75 Years and over | 2,177 (16.6%) | 4,228 (19.1%) |
| Total | 90,234 (30.4%) | 107,140 (32.5%) |
Income Above Poverty by Sex and Age in Detroit
According to the poverty statistics in Detroit, males aged 75 years and over and females aged 75 years and over are the age groups that are most secure financially, with 83.4% of males and 80.9% of females in these age groups living above the poverty line.
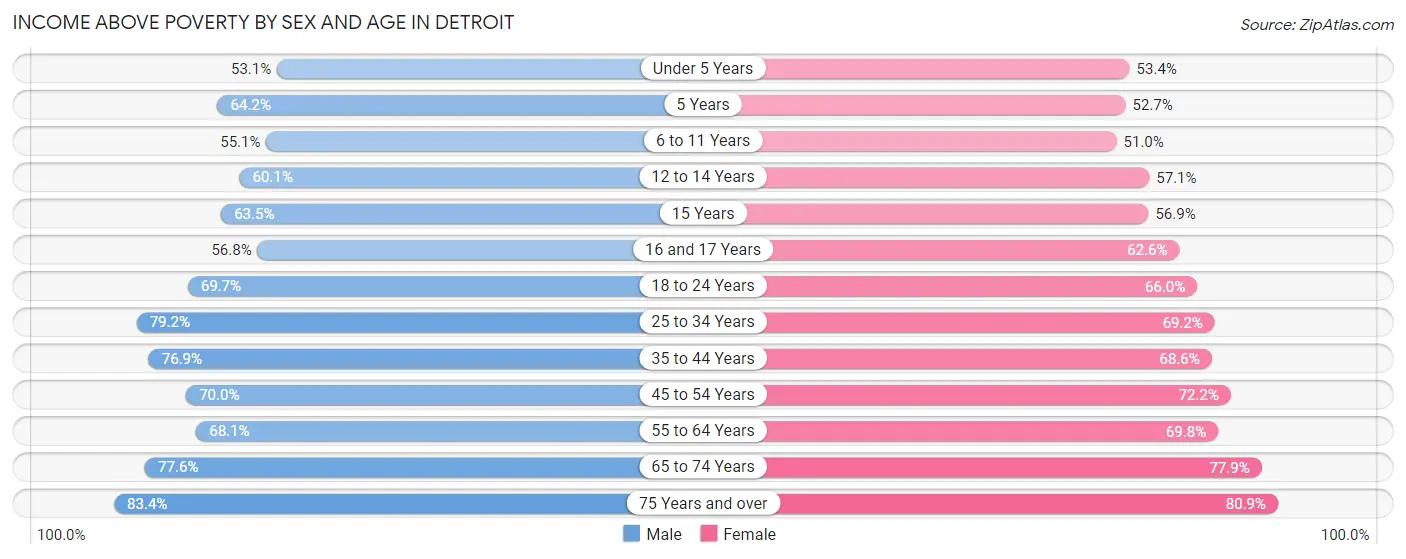
| Age Bracket | Male | Female |
| Under 5 Years | 11,836 (53.1%) | 11,175 (53.4%) |
| 5 Years | 2,625 (64.2%) | 2,490 (52.7%) |
| 6 to 11 Years | 14,417 (55.1%) | 12,225 (51.0%) |
| 12 to 14 Years | 8,100 (60.1%) | 7,905 (57.1%) |
| 15 Years | 2,865 (63.5%) | 2,221 (56.9%) |
| 16 and 17 Years | 4,321 (56.8%) | 5,570 (62.6%) |
| 18 to 24 Years | 20,752 (69.7%) | 19,737 (65.9%) |
| 25 to 34 Years | 36,036 (79.2%) | 35,925 (69.2%) |
| 35 to 44 Years | 26,394 (76.9%) | 27,256 (68.6%) |
| 45 to 54 Years | 25,269 (70.0%) | 28,363 (72.2%) |
| 55 to 64 Years | 24,609 (68.1%) | 27,638 (69.8%) |
| 65 to 74 Years | 18,579 (77.6%) | 23,770 (77.9%) |
| 75 Years and over | 10,914 (83.4%) | 17,946 (80.9%) |
| Total | 206,717 (69.6%) | 222,221 (67.5%) |
Income Below Poverty Among Married-Couple Families in Detroit
The poverty statistics for married-couple families in Detroit show that 14.4% or 6,783 of the total 47,099 families live below the poverty line. Families with 5 or more children have the highest poverty rate of 45.2%, comprising of 373 families. On the other hand, families with no children have the lowest poverty rate of 9.3%, which includes 2,443 families.
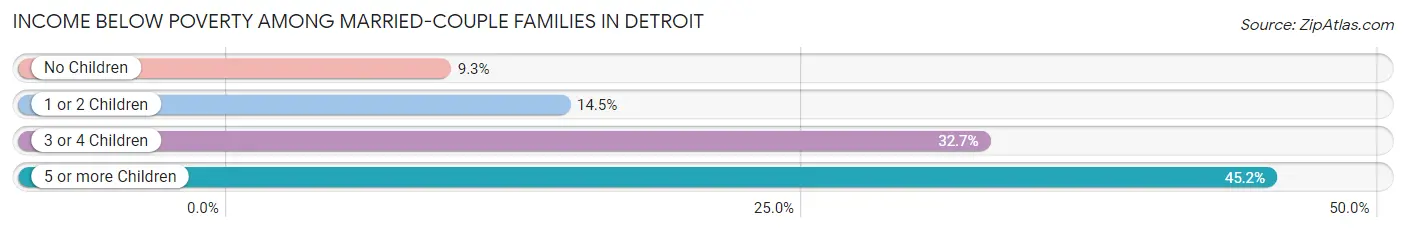
| Children | Above Poverty | Below Poverty |
| No Children | 23,939 (90.7%) | 2,443 (9.3%) |
| 1 or 2 Children | 11,908 (85.6%) | 2,012 (14.4%) |
| 3 or 4 Children | 4,017 (67.3%) | 1,955 (32.7%) |
| 5 or more Children | 452 (54.8%) | 373 (45.2%) |
| Total | 40,316 (85.6%) | 6,783 (14.4%) |
Income Below Poverty Among Single-Parent Households in Detroit
According to the poverty data in Detroit, 25.7% or 4,270 single-father households and 36.2% or 23,336 single-mother households are living below the poverty line. Among single-father households, those with 3 or 4 children have the highest poverty rate, with 742 households (64.9%) experiencing poverty. Likewise, among single-mother households, those with 5 or more children have the highest poverty rate, with 1,217 households (76.1%) falling below the poverty line.
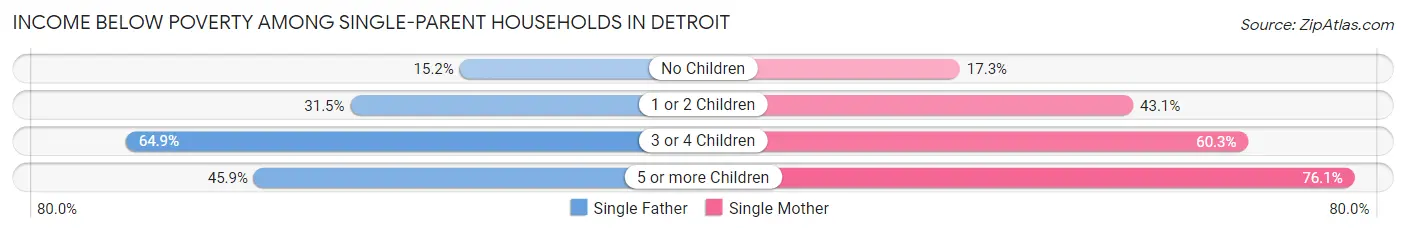
| Children | Single Father | Single Mother |
| No Children | 1,296 (15.2%) | 4,239 (17.3%) |
| 1 or 2 Children | 2,094 (31.5%) | 13,130 (43.1%) |
| 3 or 4 Children | 742 (64.9%) | 4,750 (60.3%) |
| 5 or more Children | 138 (45.9%) | 1,217 (76.1%) |
| Total | 4,270 (25.7%) | 23,336 (36.2%) |
Income Below Poverty Among Married-Couple vs Single-Parent Households in Detroit
The poverty data for Detroit shows that 6,783 of the married-couple family households (14.4%) and 27,606 of the single-parent households (34.1%) are living below the poverty level. Within the married-couple family households, those with 5 or more children have the highest poverty rate, with 373 households (45.2%) falling below the poverty line. Among the single-parent households, those with 5 or more children have the highest poverty rate, with 1,355 household (71.3%) living below poverty.
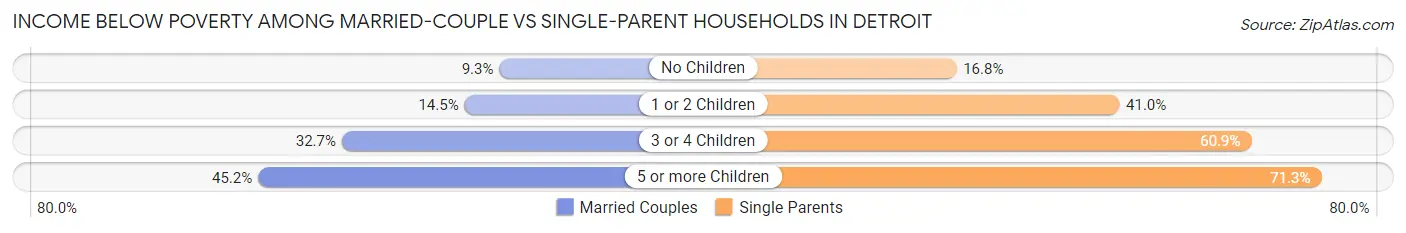
| Children | Married-Couple Families | Single-Parent Households |
| No Children | 2,443 (9.3%) | 5,535 (16.8%) |
| 1 or 2 Children | 2,012 (14.4%) | 15,224 (41.0%) |
| 3 or 4 Children | 1,955 (32.7%) | 5,492 (60.9%) |
| 5 or more Children | 373 (45.2%) | 1,355 (71.3%) |
| Total | 6,783 (14.4%) | 27,606 (34.1%) |
Race in Detroit
The most populous races in Detroit are Black / African American (495,533 | 77.8%), White / Caucasian (77,788 | 12.2%), and Hispanic or Latino (48,054 | 7.5%).
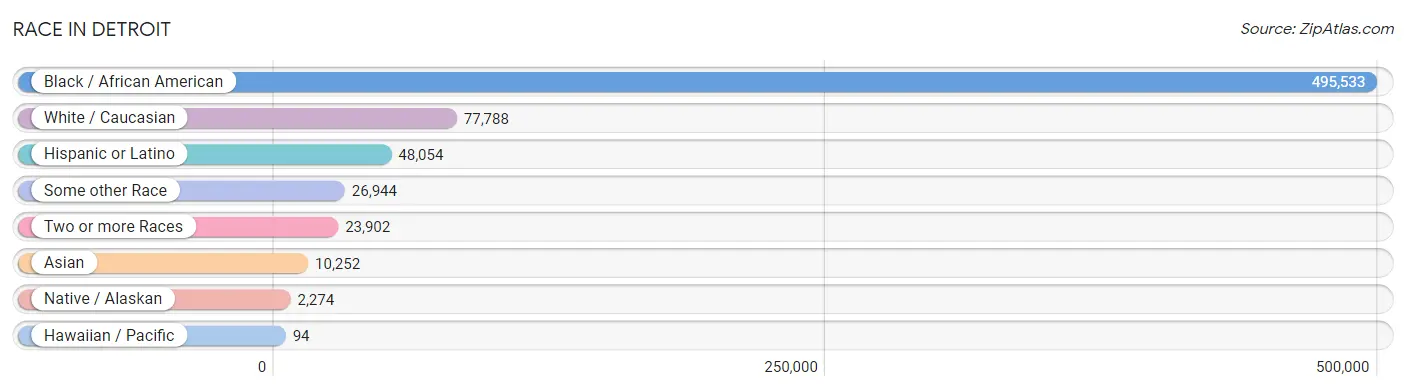
| Race | # Population | % Population |
| Asian | 10,252 | 1.6% |
| Black / African American | 495,533 | 77.8% |
| Hawaiian / Pacific | 94 | 0.0% |
| Hispanic or Latino | 48,054 | 7.5% |
| Native / Alaskan | 2,274 | 0.4% |
| White / Caucasian | 77,788 | 12.2% |
| Two or more Races | 23,902 | 3.7% |
| Some other Race | 26,944 | 4.2% |
| Total | 636,787 | 100.0% |
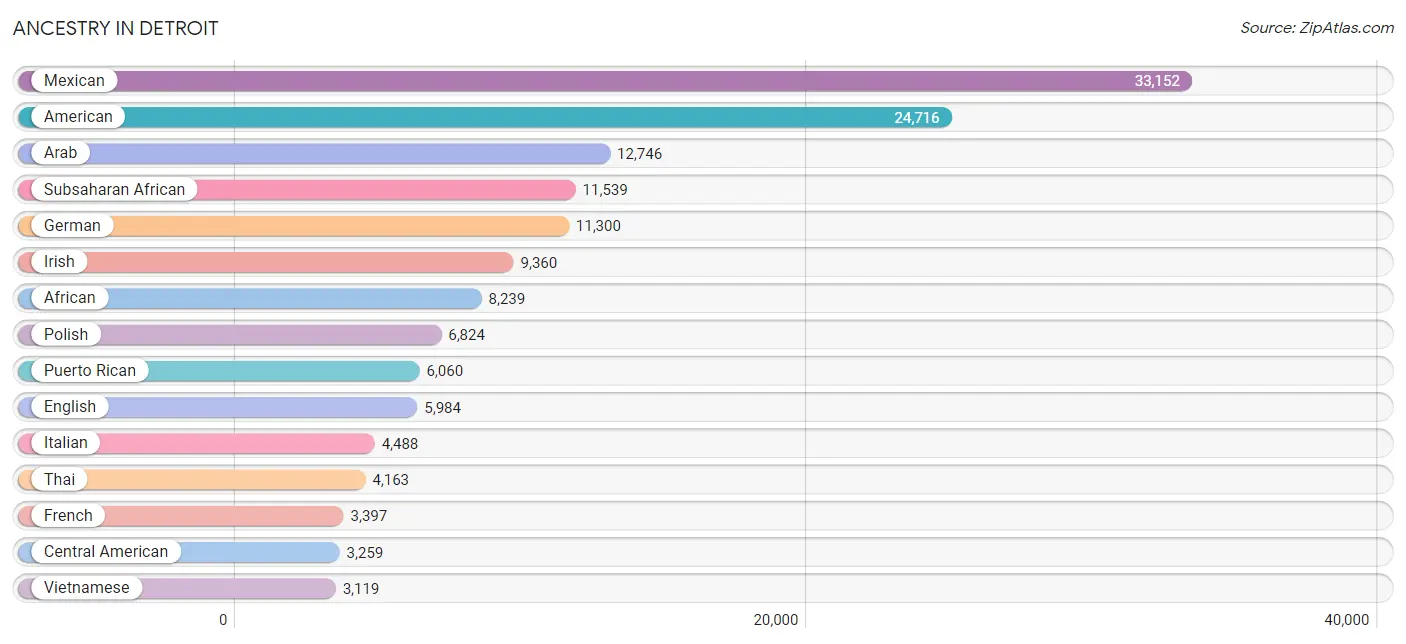
Ancestry in Detroit
The most populous ancestries reported in Detroit are Mexican (33,152 | 5.2%), American (24,716 | 3.9%), Arab (12,746 | 2.0%), Subsaharan African (11,539 | 1.8%), and German (11,300 | 1.8%), together accounting for 14.7% of all Detroit residents.
| Ancestry | # Population | % Population |
| Afghan | 28 | 0.0% |
| African | 8,239 | 1.3% |
| Albanian | 148 | 0.0% |
| Alsatian | 14 | 0.0% |
| American | 24,716 | 3.9% |
| Apache | 49 | 0.0% |
| Arab | 12,746 | 2.0% |
| Argentinean | 69 | 0.0% |
| Armenian | 110 | 0.0% |
| Assyrian / Chaldean / Syriac | 56 | 0.0% |
| Australian | 125 | 0.0% |
| Austrian | 294 | 0.1% |
| Bahamian | 315 | 0.1% |
| Bangladeshi | 244 | 0.0% |
| Barbadian | 53 | 0.0% |
| Belgian | 249 | 0.0% |
| Belizean | 31 | 0.0% |
| Bermudan | 21 | 0.0% |
| Bhutanese | 267 | 0.0% |
| Blackfeet | 558 | 0.1% |
| Brazilian | 104 | 0.0% |
| British | 613 | 0.1% |
| British West Indian | 37 | 0.0% |
| Bulgarian | 19 | 0.0% |
| Burmese | 670 | 0.1% |
| Canadian | 531 | 0.1% |
| Cape Verdean | 42 | 0.0% |
| Central American | 3,259 | 0.5% |
| Central American Indian | 93 | 0.0% |
| Cherokee | 1,355 | 0.2% |
| Chilean | 12 | 0.0% |
| Chinese | 13 | 0.0% |
| Chippewa | 755 | 0.1% |
| Choctaw | 325 | 0.1% |
| Colombian | 228 | 0.0% |
| Costa Rican | 28 | 0.0% |
| Cree | 6 | 0.0% |
| Creek | 77 | 0.0% |
| Croatian | 132 | 0.0% |
| Cuban | 908 | 0.1% |
| Czech | 323 | 0.1% |
| Czechoslovakian | 52 | 0.0% |
| Danish | 189 | 0.0% |
| Delaware | 2 | 0.0% |
| Dominican | 1,378 | 0.2% |
| Dutch | 1,726 | 0.3% |
| Eastern European | 201 | 0.0% |
| Ecuadorian | 55 | 0.0% |
| Egyptian | 86 | 0.0% |
| English | 5,984 | 0.9% |
| Estonian | 6 | 0.0% |
| Ethiopian | 397 | 0.1% |
| European | 1,407 | 0.2% |
| Filipino | 68 | 0.0% |
| Finnish | 505 | 0.1% |
| French | 3,397 | 0.5% |
| French American Indian | 190 | 0.0% |
| French Canadian | 932 | 0.2% |
| German | 11,300 | 1.8% |
| Ghanaian | 103 | 0.0% |
| Greek | 356 | 0.1% |
| Guamanian / Chamorro | 109 | 0.0% |
| Guatemalan | 1,172 | 0.2% |
| Guyanese | 98 | 0.0% |
| Haitian | 690 | 0.1% |
| Honduran | 1,059 | 0.2% |
| Houma | 15 | 0.0% |
| Hungarian | 894 | 0.1% |
| Icelander | 2 | 0.0% |
| Indian (Asian) | 1,040 | 0.2% |
| Indonesian | 53 | 0.0% |
| Iranian | 71 | 0.0% |
| Iraqi | 1,137 | 0.2% |
| Irish | 9,360 | 1.5% |
| Iroquois | 208 | 0.0% |
| Israeli | 103 | 0.0% |
| Italian | 4,488 | 0.7% |
| Jamaican | 1,520 | 0.2% |
| Japanese | 44 | 0.0% |
| Jordanian | 20 | 0.0% |
| Kenyan | 22 | 0.0% |
| Korean | 1,059 | 0.2% |
| Laotian | 17 | 0.0% |
| Lebanese | 1,075 | 0.2% |
| Liberian | 101 | 0.0% |
| Lithuanian | 255 | 0.0% |
| Lumbee | 33 | 0.0% |
| Luxembourger | 5 | 0.0% |
| Macedonian | 53 | 0.0% |
| Maltese | 221 | 0.0% |
| Menominee | 13 | 0.0% |
| Mexican | 33,152 | 5.2% |
| Mexican American Indian | 554 | 0.1% |
| Mongolian | 3 | 0.0% |
| Moroccan | 937 | 0.2% |
| Native Hawaiian | 420 | 0.1% |
| Navajo | 102 | 0.0% |
| New Zealander | 17 | 0.0% |
| Nicaraguan | 10 | 0.0% |
| Nigerian | 1,776 | 0.3% |
| Northern European | 54 | 0.0% |
| Norwegian | 649 | 0.1% |
| Ottawa | 88 | 0.0% |
| Pakistani | 30 | 0.0% |
| Palestinian | 90 | 0.0% |
| Panamanian | 33 | 0.0% |
| Paraguayan | 15 | 0.0% |
| Pennsylvania German | 18 | 0.0% |
| Peruvian | 35 | 0.0% |
| Polish | 6,824 | 1.1% |
| Portuguese | 80 | 0.0% |
| Potawatomi | 247 | 0.0% |
| Puerto Rican | 6,060 | 0.9% |
| Romanian | 221 | 0.0% |
| Russian | 629 | 0.1% |
| Salvadoran | 957 | 0.2% |
| Samoan | 55 | 0.0% |
| Scandinavian | 195 | 0.0% |
| Scotch-Irish | 535 | 0.1% |
| Scottish | 1,880 | 0.3% |
| Seminole | 21 | 0.0% |
| Senegalese | 66 | 0.0% |
| Serbian | 94 | 0.0% |
| Sierra Leonean | 7 | 0.0% |
| Sioux | 22 | 0.0% |
| Slavic | 66 | 0.0% |
| Slovak | 133 | 0.0% |
| Slovene | 95 | 0.0% |
| Somali | 83 | 0.0% |
| South African | 168 | 0.0% |
| South American | 715 | 0.1% |
| South American Indian | 26 | 0.0% |
| Spaniard | 191 | 0.0% |
| Spanish | 429 | 0.1% |
| Sri Lankan | 608 | 0.1% |
| Subsaharan African | 11,539 | 1.8% |
| Sudanese | 86 | 0.0% |
| Swedish | 1,084 | 0.2% |
| Swiss | 119 | 0.0% |
| Syrian | 857 | 0.1% |
| Thai | 4,163 | 0.6% |
| Trinidadian and Tobagonian | 114 | 0.0% |
| Turkish | 76 | 0.0% |
| Ukrainian | 409 | 0.1% |
| Uruguayan | 65 | 0.0% |
| Venezuelan | 225 | 0.0% |
| Vietnamese | 3,119 | 0.5% |
| Welsh | 317 | 0.1% |
| West Indian | 80 | 0.0% |
| Yaqui | 10 | 0.0% |
| Yugoslavian | 99 | 0.0% |
| Zimbabwean | 13 | 0.0% | View All 152 Rows |
Immigrants in Detroit
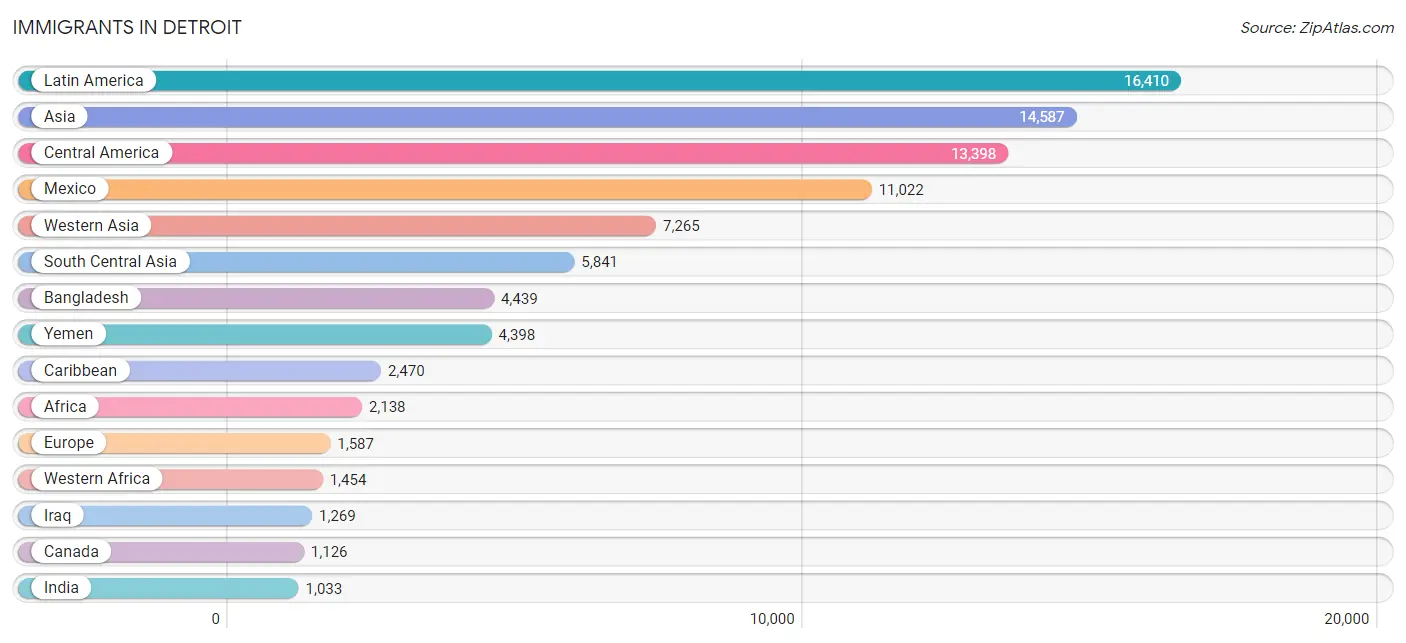
The most numerous immigrant groups reported in Detroit came from Latin America (16,410 | 2.6%), Asia (14,587 | 2.3%), Central America (13,398 | 2.1%), Mexico (11,022 | 1.7%), and Western Asia (7,265 | 1.1%), together accounting for 9.8% of all Detroit residents.
| Immigration Origin | # Population | % Population |
| Africa | 2,138 | 0.3% |
| Albania | 61 | 0.0% |
| Argentina | 22 | 0.0% |
| Asia | 14,587 | 2.3% |
| Australia | 19 | 0.0% |
| Austria | 11 | 0.0% |
| Bahamas | 201 | 0.0% |
| Bangladesh | 4,439 | 0.7% |
| Barbados | 8 | 0.0% |
| Belarus | 28 | 0.0% |
| Belgium | 3 | 0.0% |
| Belize | 22 | 0.0% |
| Brazil | 105 | 0.0% |
| Bulgaria | 22 | 0.0% |
| Cambodia | 2 | 0.0% |
| Cameroon | 16 | 0.0% |
| Canada | 1,126 | 0.2% |
| Caribbean | 2,470 | 0.4% |
| Central America | 13,398 | 2.1% |
| Chile | 36 | 0.0% |
| China | 419 | 0.1% |
| Colombia | 170 | 0.0% |
| Costa Rica | 19 | 0.0% |
| Cuba | 393 | 0.1% |
| Czechoslovakia | 6 | 0.0% |
| Denmark | 10 | 0.0% |
| Dominican Republic | 669 | 0.1% |
| Eastern Africa | 433 | 0.1% |
| Eastern Asia | 766 | 0.1% |
| Eastern Europe | 759 | 0.1% |
| Ecuador | 49 | 0.0% |
| Egypt | 16 | 0.0% |
| El Salvador | 816 | 0.1% |
| England | 95 | 0.0% |
| Eritrea | 161 | 0.0% |
| Ethiopia | 138 | 0.0% |
| Europe | 1,587 | 0.3% |
| Fiji | 3 | 0.0% |
| France | 88 | 0.0% |
| Germany | 254 | 0.0% |
| Ghana | 88 | 0.0% |
| Greece | 14 | 0.0% |
| Grenada | 6 | 0.0% |
| Guatemala | 674 | 0.1% |
| Haiti | 132 | 0.0% |
| Honduras | 734 | 0.1% |
| Hong Kong | 35 | 0.0% |
| Hungary | 20 | 0.0% |
| India | 1,033 | 0.2% |
| Indonesia | 17 | 0.0% |
| Iran | 103 | 0.0% |
| Iraq | 1,269 | 0.2% |
| Ireland | 18 | 0.0% |
| Israel | 9 | 0.0% |
| Italy | 55 | 0.0% |
| Jamaica | 844 | 0.1% |
| Japan | 82 | 0.0% |
| Jordan | 174 | 0.0% |
| Kenya | 48 | 0.0% |
| Korea | 265 | 0.0% |
| Kuwait | 87 | 0.0% |
| Laos | 51 | 0.0% |
| Latin America | 16,410 | 2.6% |
| Lebanon | 408 | 0.1% |
| Liberia | 131 | 0.0% |
| Lithuania | 5 | 0.0% |
| Malaysia | 15 | 0.0% |
| Mexico | 11,022 | 1.7% |
| Middle Africa | 16 | 0.0% |
| Morocco | 73 | 0.0% |
| Nepal | 15 | 0.0% |
| Netherlands | 21 | 0.0% |
| Nicaragua | 26 | 0.0% |
| Nigeria | 1,005 | 0.2% |
| Northern Africa | 153 | 0.0% |
| Northern Europe | 203 | 0.0% |
| Oceania | 62 | 0.0% |
| Pakistan | 178 | 0.0% |
| Panama | 60 | 0.0% |
| Peru | 21 | 0.0% |
| Philippines | 294 | 0.1% |
| Poland | 220 | 0.0% |
| Portugal | 13 | 0.0% |
| Romania | 154 | 0.0% |
| Russia | 51 | 0.0% |
| Saudi Arabia | 65 | 0.0% |
| Senegal | 64 | 0.0% |
| Sierra Leone | 7 | 0.0% |
| Somalia | 30 | 0.0% |
| South Africa | 29 | 0.0% |
| South America | 542 | 0.1% |
| South Central Asia | 5,841 | 0.9% |
| South Eastern Asia | 679 | 0.1% |
| Southern Europe | 132 | 0.0% |
| Spain | 24 | 0.0% |
| Sri Lanka | 58 | 0.0% |
| St. Vincent and the Grenadines | 22 | 0.0% |
| Sudan | 54 | 0.0% |
| Syria | 749 | 0.1% |
| Taiwan | 104 | 0.0% |
| Thailand | 21 | 0.0% |
| Trinidad and Tobago | 195 | 0.0% |
| Turkey | 58 | 0.0% |
| Uganda | 15 | 0.0% |
| Ukraine | 171 | 0.0% |
| Uruguay | 41 | 0.0% |
| Uzbekistan | 15 | 0.0% |
| Venezuela | 71 | 0.0% |
| Vietnam | 244 | 0.0% |
| Western Africa | 1,454 | 0.2% |
| Western Asia | 7,265 | 1.1% |
| Western Europe | 377 | 0.1% |
| Yemen | 4,398 | 0.7% |
| Zimbabwe | 13 | 0.0% | View All 114 Rows |
Sex and Age in Detroit
Sex and Age in Detroit
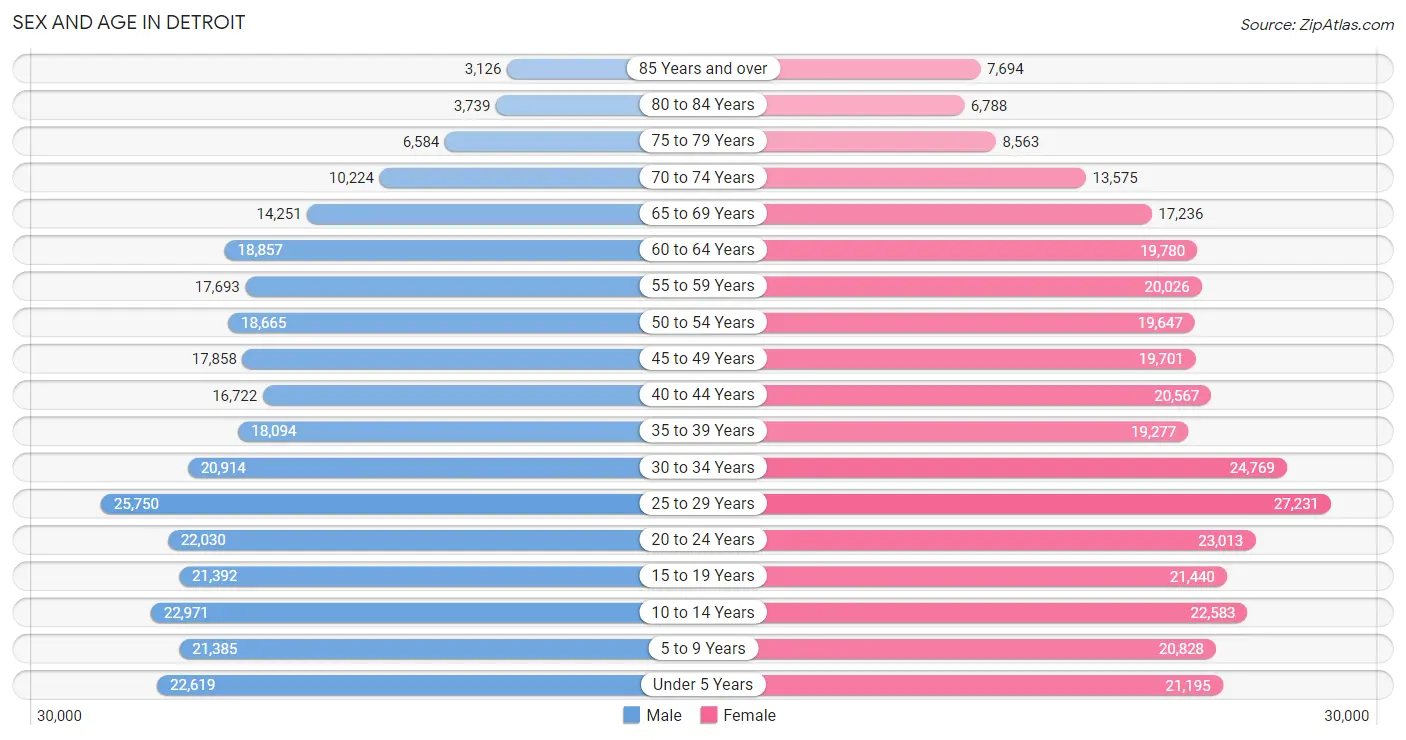
The most populous age groups in Detroit are 25 to 29 Years (25,750 | 8.5%) for men and 25 to 29 Years (27,231 | 8.2%) for women.
| Age Bracket | Male | Female |
| Under 5 Years | 22,619 (7.5%) | 21,195 (6.4%) |
| 5 to 9 Years | 21,385 (7.1%) | 20,828 (6.2%) |
| 10 to 14 Years | 22,971 (7.6%) | 22,583 (6.8%) |
| 15 to 19 Years | 21,392 (7.1%) | 21,440 (6.4%) |
| 20 to 24 Years | 22,030 (7.3%) | 23,013 (6.9%) |
| 25 to 29 Years | 25,750 (8.5%) | 27,231 (8.2%) |
| 30 to 34 Years | 20,914 (6.9%) | 24,769 (7.4%) |
| 35 to 39 Years | 18,094 (6.0%) | 19,277 (5.8%) |
| 40 to 44 Years | 16,722 (5.5%) | 20,567 (6.2%) |
| 45 to 49 Years | 17,858 (5.9%) | 19,701 (5.9%) |
| 50 to 54 Years | 18,665 (6.2%) | 19,647 (5.9%) |
| 55 to 59 Years | 17,693 (5.8%) | 20,026 (6.0%) |
| 60 to 64 Years | 18,857 (6.2%) | 19,780 (5.9%) |
| 65 to 69 Years | 14,251 (4.7%) | 17,236 (5.2%) |
| 70 to 74 Years | 10,224 (3.4%) | 13,575 (4.1%) |
| 75 to 79 Years | 6,584 (2.2%) | 8,563 (2.6%) |
| 80 to 84 Years | 3,739 (1.2%) | 6,788 (2.0%) |
| 85 Years and over | 3,126 (1.0%) | 7,694 (2.3%) |
| Total | 302,874 (100.0%) | 333,913 (100.0%) |
Families and Households in Detroit
Median Family Size in Detroit
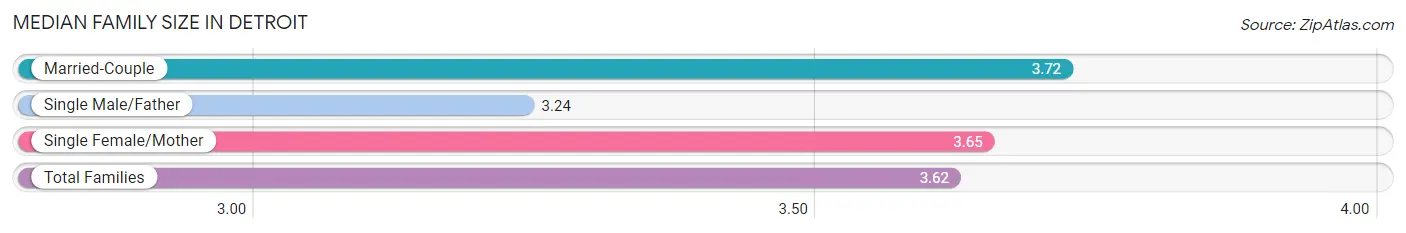
The median family size in Detroit is 3.62 persons per family, with married-couple families (47,099 | 36.8%) accounting for the largest median family size of 3.72 persons per family. On the other hand, single male/father families (16,635 | 13.0%) represent the smallest median family size with 3.24 persons per family.
| Family Type | # Families | Family Size |
| Married-Couple | 47,099 (36.8%) | 3.72 |
| Single Male/Father | 16,635 (13.0%) | 3.24 |
| Single Female/Mother | 64,393 (50.3%) | 3.65 |
| Total Families | 128,127 (100.0%) | 3.62 |
Median Household Size in Detroit
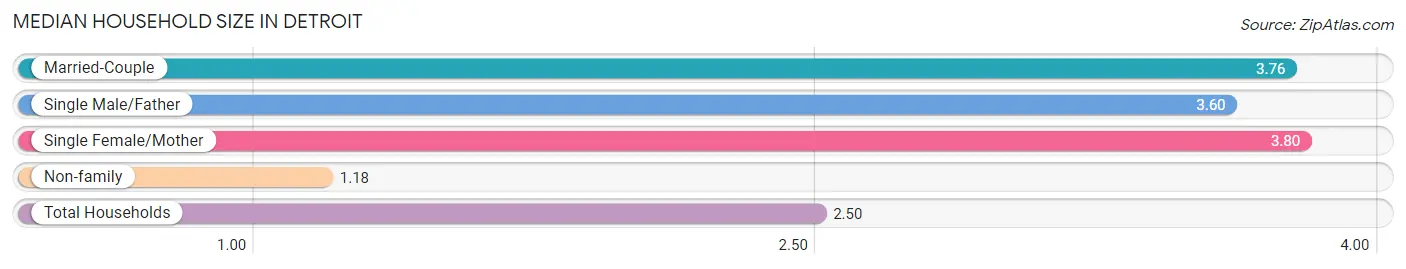
The median household size in Detroit is 2.50 persons per household, with single female/mother households (64,393 | 25.8%) accounting for the largest median household size of 3.8 persons per household. non-family households (121,391 | 48.6%) represent the smallest median household size with 1.18 persons per household.
| Household Type | # Households | Household Size |
| Married-Couple | 47,099 (18.9%) | 3.76 |
| Single Male/Father | 16,635 (6.7%) | 3.60 |
| Single Female/Mother | 64,393 (25.8%) | 3.80 |
| Non-family | 121,391 (48.6%) | 1.18 |
| Total Households | 249,518 (100.0%) | 2.50 |
Household Size by Marriage Status in Detroit
Out of a total of 249,518 households in Detroit, 128,127 (51.3%) are family households, while 121,391 (48.6%) are nonfamily households. The most numerous type of family households are 2-person households, comprising 50,761, and the most common type of nonfamily households are 1-person households, comprising 106,173.
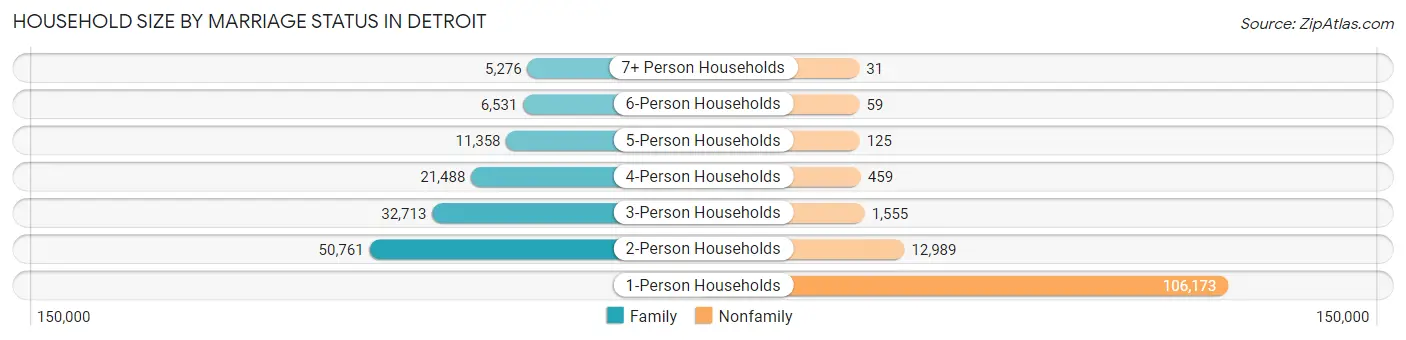
| Household Size | Family Households | Nonfamily Households |
| 1-Person Households | - | 106,173 (42.5%) |
| 2-Person Households | 50,761 (20.3%) | 12,989 (5.2%) |
| 3-Person Households | 32,713 (13.1%) | 1,555 (0.6%) |
| 4-Person Households | 21,488 (8.6%) | 459 (0.2%) |
| 5-Person Households | 11,358 (4.5%) | 125 (0.1%) |
| 6-Person Households | 6,531 (2.6%) | 59 (0.0%) |
| 7+ Person Households | 5,276 (2.1%) | 31 (0.0%) |
| Total | 128,127 (51.3%) | 121,391 (48.6%) |
Female Fertility in Detroit
Fertility by Age in Detroit
Average fertility rate in Detroit is 61.0 births per 1,000 women. Women in the age bracket of 20 to 34 years have the highest fertility rate with 95.0 births per 1,000 women. Women in the age bracket of 20 to 34 years acount for 73.0% of all women with births.
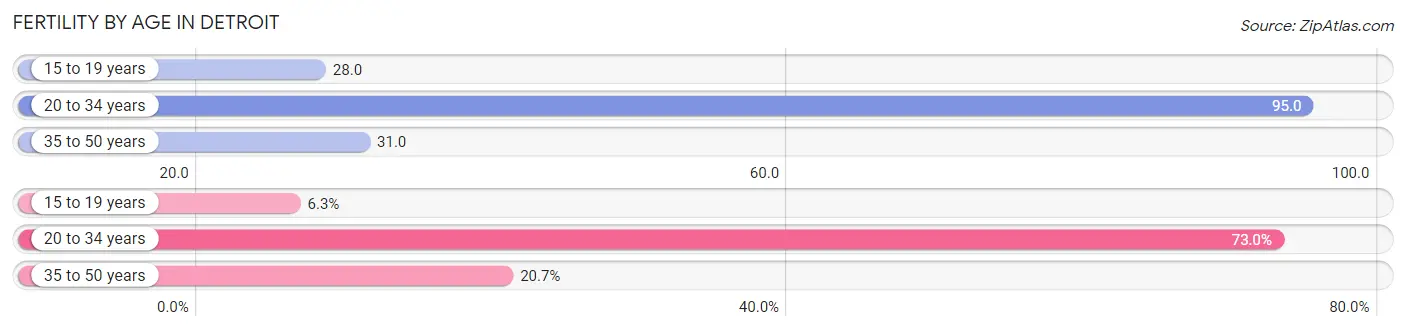
| Age Bracket | Women with Births | Births / 1,000 Women |
| 15 to 19 years | 611 (6.3%) | 28.0 |
| 20 to 34 years | 7,101 (73.0%) | 95.0 |
| 35 to 50 years | 2,014 (20.7%) | 31.0 |
| Total | 9,726 (100.0%) | 61.0 |
Fertility by Age by Marriage Status in Detroit
27.3% of women with births (9,726) in Detroit are married. The highest percentage of unmarried women with births falls into 15 to 19 years age bracket with 86.3% of them unmarried at the time of birth, while the lowest percentage of unmarried women with births belong to 35 to 50 years age bracket with 58.5% of them unmarried.
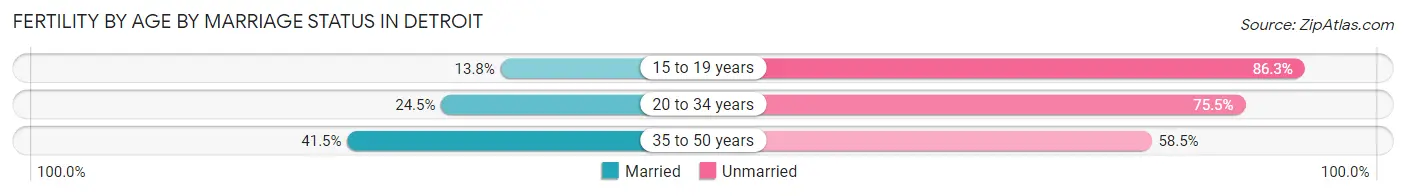
| Age Bracket | Married | Unmarried |
| 15 to 19 years | 84 (13.8%) | 527 (86.3%) |
| 20 to 34 years | 1,740 (24.5%) | 5,361 (75.5%) |
| 35 to 50 years | 836 (41.5%) | 1,178 (58.5%) |
| Total | 2,655 (27.3%) | 7,071 (72.7%) |
Fertility by Education in Detroit
Average fertility rate in Detroit is 61.0 births per 1,000 women. Women with the education attainment of high school diploma have the highest fertility rate of 74.0 births per 1,000 women, while women with the education attainment of graduate degree have the lowest fertility at 42.0 births per 1,000 women. Women with the education attainment of high school diploma represent 36.9% of all women with births.
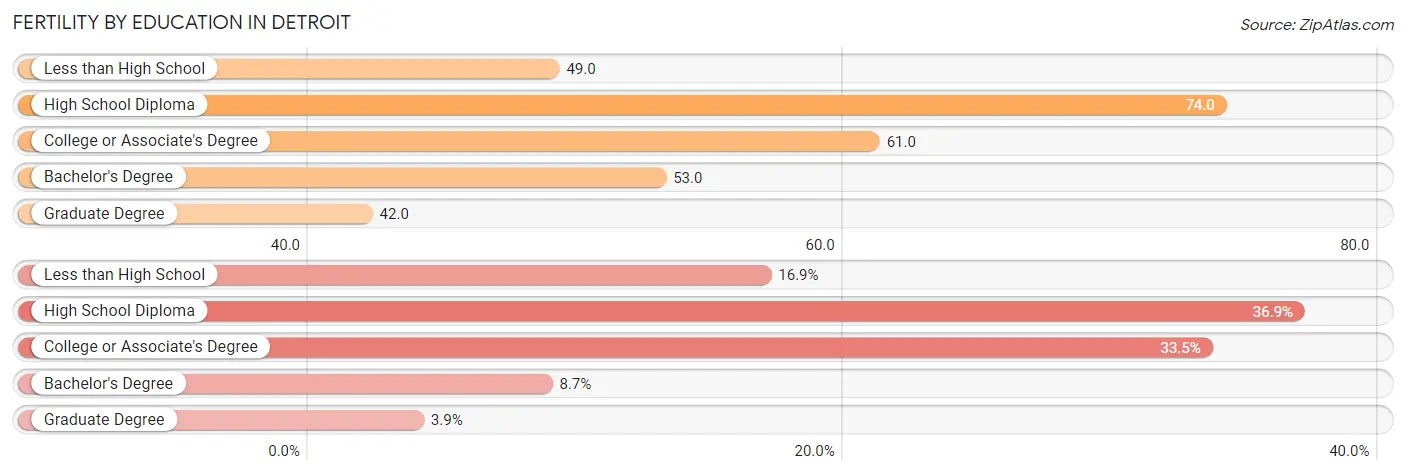
| Educational Attainment | Women with Births | Births / 1,000 Women |
| Less than High School | 1,648 (16.9%) | 49.0 |
| High School Diploma | 3,592 (36.9%) | 74.0 |
| College or Associate's Degree | 3,255 (33.5%) | 61.0 |
| Bachelor's Degree | 850 (8.7%) | 53.0 |
| Graduate Degree | 381 (3.9%) | 42.0 |
| Total | 9,726 (100.0%) | 61.0 |
Fertility by Education by Marriage Status in Detroit
72.7% of women with births in Detroit are unmarried. Women with the educational attainment of graduate degree are most likely to be married with 74.5% of them married at childbirth, while women with the educational attainment of less than high school are least likely to be married with 79.7% of them unmarried at childbirth.
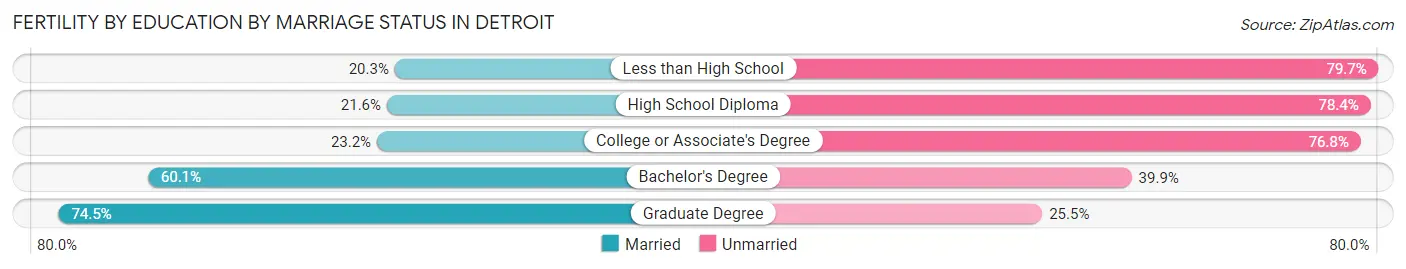
| Educational Attainment | Married | Unmarried |
| Less than High School | 335 (20.3%) | 1,313 (79.7%) |
| High School Diploma | 776 (21.6%) | 2,816 (78.4%) |
| College or Associate's Degree | 755 (23.2%) | 2,500 (76.8%) |
| Bachelor's Degree | 511 (60.1%) | 339 (39.9%) |
| Graduate Degree | 284 (74.5%) | 97 (25.5%) |
| Total | 2,655 (27.3%) | 7,071 (72.7%) |
Employment Characteristics in Detroit
Employment by Class of Employer in Detroit
Among the 224,797 employed individuals in Detroit, private company employees (162,043 | 72.1%), not-for-profit organizations (22,653 | 10.1%), and local government employees (11,828 | 5.3%) make up the most common classes of employment.
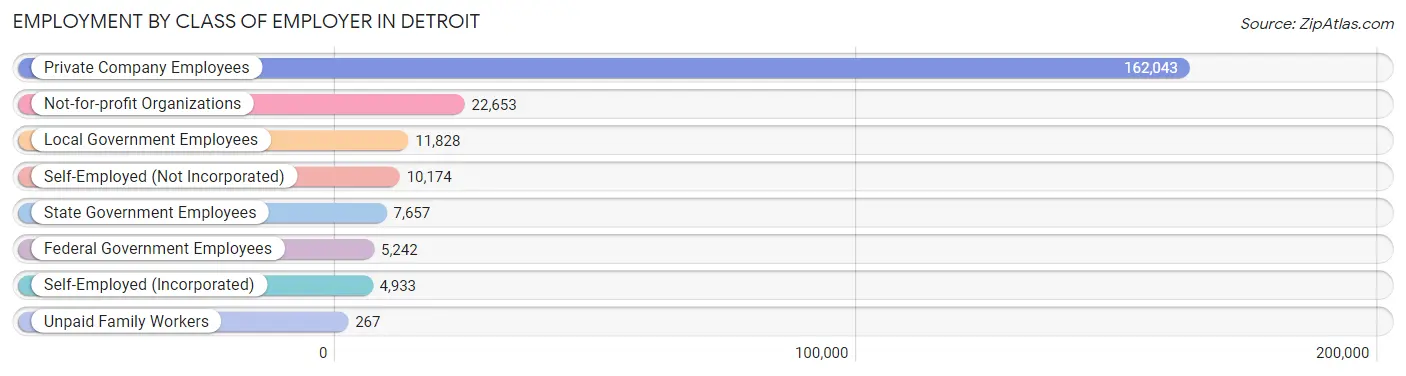
| Employer Class | # Employees | % Employees |
| Private Company Employees | 162,043 | 72.1% |
| Self-Employed (Incorporated) | 4,933 | 2.2% |
| Self-Employed (Not Incorporated) | 10,174 | 4.5% |
| Not-for-profit Organizations | 22,653 | 10.1% |
| Local Government Employees | 11,828 | 5.3% |
| State Government Employees | 7,657 | 3.4% |
| Federal Government Employees | 5,242 | 2.3% |
| Unpaid Family Workers | 267 | 0.1% |
| Total | 224,797 | 100.0% |
Employment Status by Age in Detroit
According to the labor force statistics for Detroit, out of the total population over 16 years of age (496,762), 54.8% or 272,226 individuals are in the labor force, with 14.7% or 40,017 of them unemployed. The age group with the highest labor force participation rate is 25 to 29 years, with 76.5% or 40,530 individuals in the labor force. Within the labor force, the 16 to 19 years age range has the highest percentage of unemployed individuals, with 30.3% or 3,866 of them being unemployed.
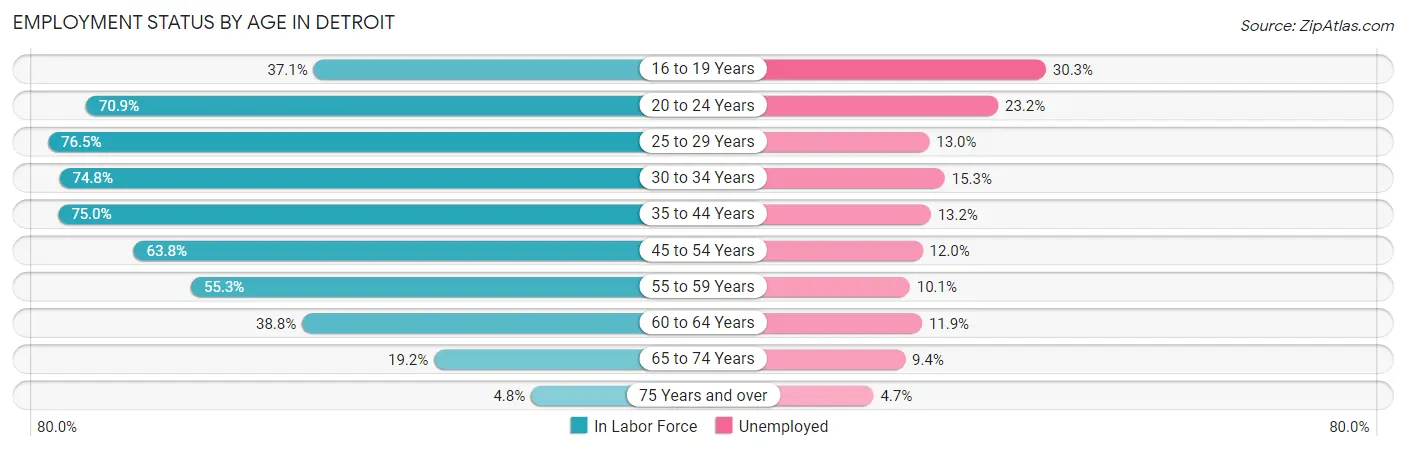
| Age Bracket | In Labor Force | Unemployed |
| 16 to 19 Years | 12,758 (37.1%) | 3,866 (30.3%) |
| 20 to 24 Years | 31,935 (70.9%) | 7,409 (23.2%) |
| 25 to 29 Years | 40,530 (76.5%) | 5,269 (13.0%) |
| 30 to 34 Years | 34,171 (74.8%) | 5,228 (15.3%) |
| 35 to 44 Years | 55,995 (75.0%) | 7,391 (13.2%) |
| 45 to 54 Years | 48,406 (63.8%) | 5,809 (12.0%) |
| 55 to 59 Years | 20,859 (55.3%) | 2,107 (10.1%) |
| 60 to 64 Years | 14,991 (38.8%) | 1,784 (11.9%) |
| 65 to 74 Years | 10,615 (19.2%) | 998 (9.4%) |
| 75 Years and over | 1,752 (4.8%) | 82 (4.7%) |
| Total | 272,226 (54.8%) | 40,017 (14.7%) |
Employment Status by Educational Attainment in Detroit
According to labor force statistics for Detroit, 66.0% of individuals (214,864) out of the total population between 25 and 64 years of age (325,551) are in the labor force, with 12.8% or 27,503 of them being unemployed. The group with the highest labor force participation rate are those with the educational attainment of bachelor's degree or higher, with 82.9% or 45,660 individuals in the labor force. Within the labor force, individuals with less than high school education have the highest percentage of unemployment, with 21.6% or 5,256 of them being unemployed.
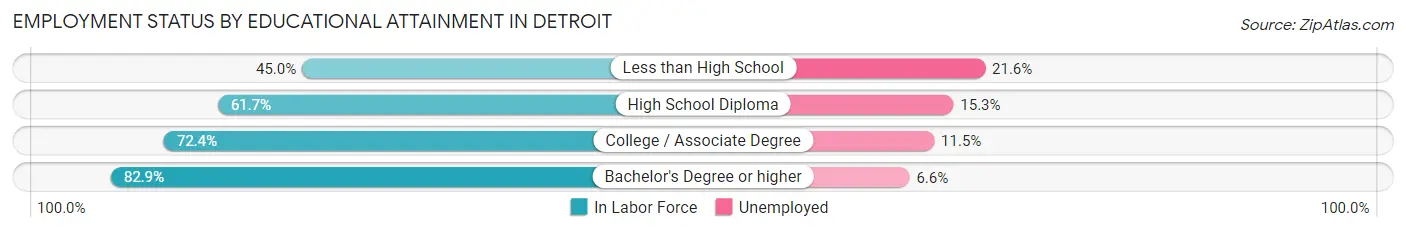
| Educational Attainment | In Labor Force | Unemployed |
| Less than High School | 24,332 (45.0%) | 11,679 (21.6%) |
| High School Diploma | 67,359 (61.7%) | 16,703 (15.3%) |
| College / Associate Degree | 77,635 (72.4%) | 12,331 (11.5%) |
| Bachelor's Degree or higher | 45,660 (82.9%) | 3,635 (6.6%) |
| Total | 214,864 (66.0%) | 41,671 (12.8%) |
Employment Occupations by Sex in Detroit
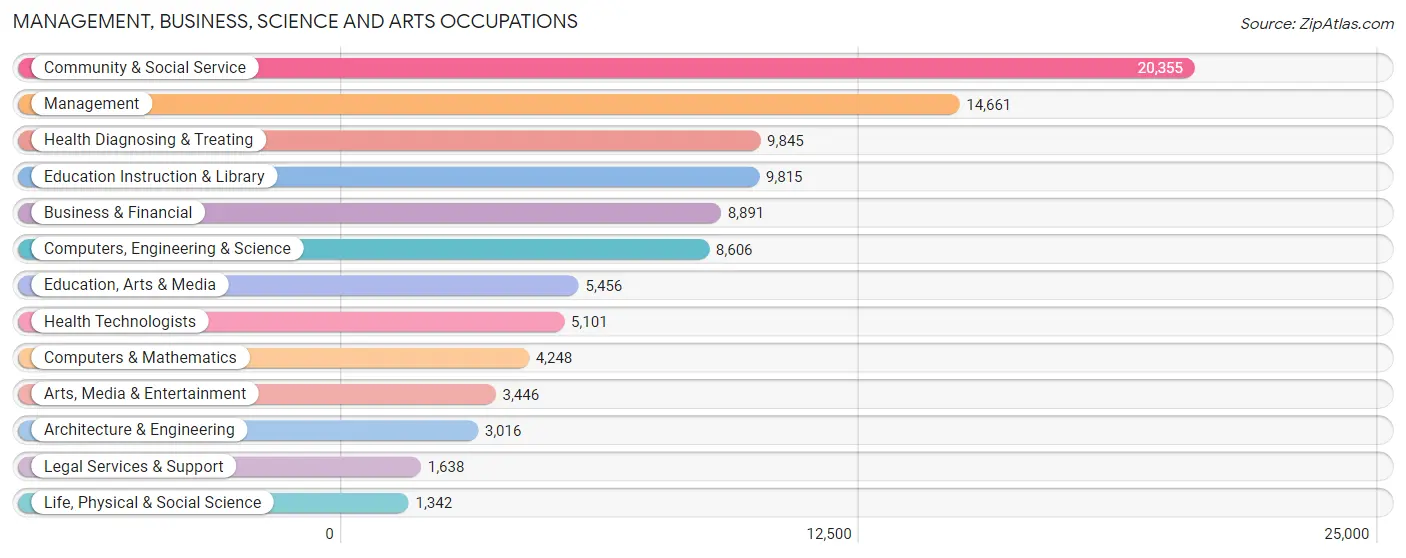
Management, Business, Science and Arts Occupations
The most common Management, Business, Science and Arts occupations in Detroit are Community & Social Service (20,355 | 8.8%), Management (14,661 | 6.3%), Health Diagnosing & Treating (9,845 | 4.2%), Education Instruction & Library (9,815 | 4.2%), and Business & Financial (8,891 | 3.8%).
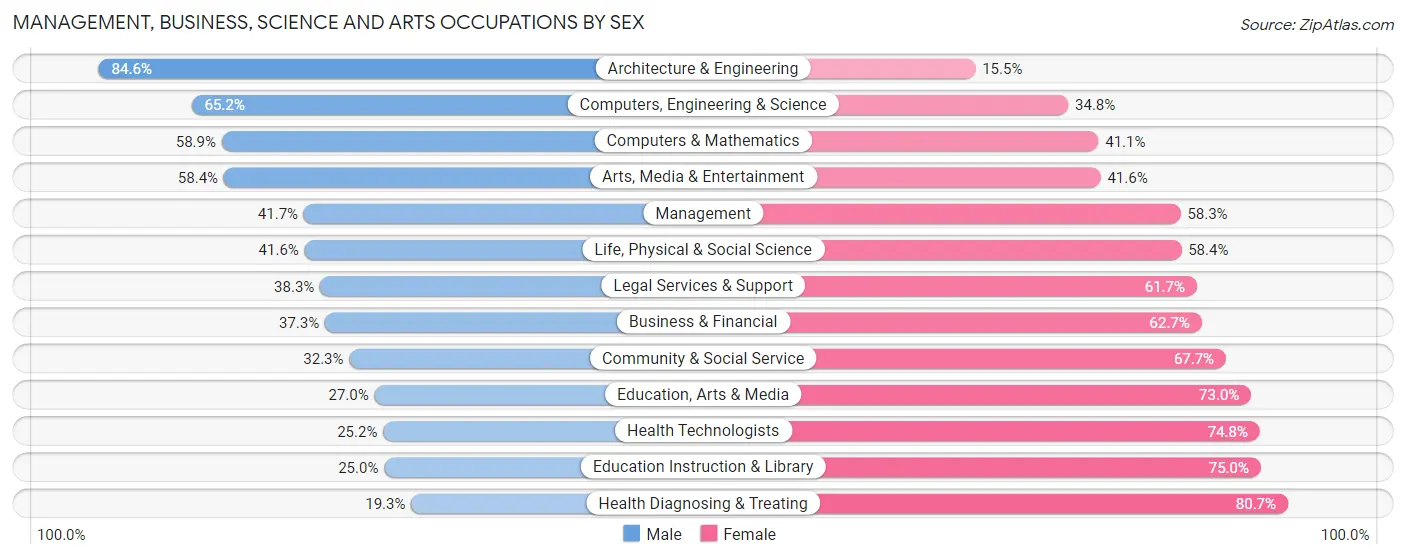
Management, Business, Science and Arts Occupations by Sex
Within the Management, Business, Science and Arts occupations in Detroit, the most male-oriented occupations are Architecture & Engineering (84.6%), Computers, Engineering & Science (65.2%), and Computers & Mathematics (58.9%), while the most female-oriented occupations are Health Diagnosing & Treating (80.7%), Education Instruction & Library (75.0%), and Health Technologists (74.8%).
| Occupation | Male | Female |
| Management | 6,120 (41.7%) | 8,541 (58.3%) |
| Business & Financial | 3,319 (37.3%) | 5,572 (62.7%) |
| Computers, Engineering & Science | 5,609 (65.2%) | 2,997 (34.8%) |
| Computers & Mathematics | 2,501 (58.9%) | 1,747 (41.1%) |
| Architecture & Engineering | 2,550 (84.6%) | 466 (15.4%) |
| Life, Physical & Social Science | 558 (41.6%) | 784 (58.4%) |
| Community & Social Service | 6,566 (32.3%) | 13,789 (67.7%) |
| Education, Arts & Media | 1,473 (27.0%) | 3,983 (73.0%) |
| Legal Services & Support | 628 (38.3%) | 1,010 (61.7%) |
| Education Instruction & Library | 2,452 (25.0%) | 7,363 (75.0%) |
| Arts, Media & Entertainment | 2,013 (58.4%) | 1,433 (41.6%) |
| Health Diagnosing & Treating | 1,904 (19.3%) | 7,941 (80.7%) |
| Health Technologists | 1,285 (25.2%) | 3,816 (74.8%) |
| Total (Category) | 23,518 (37.7%) | 38,840 (62.3%) |
| Total (Overall) | 108,698 (46.9%) | 123,306 (53.1%) |
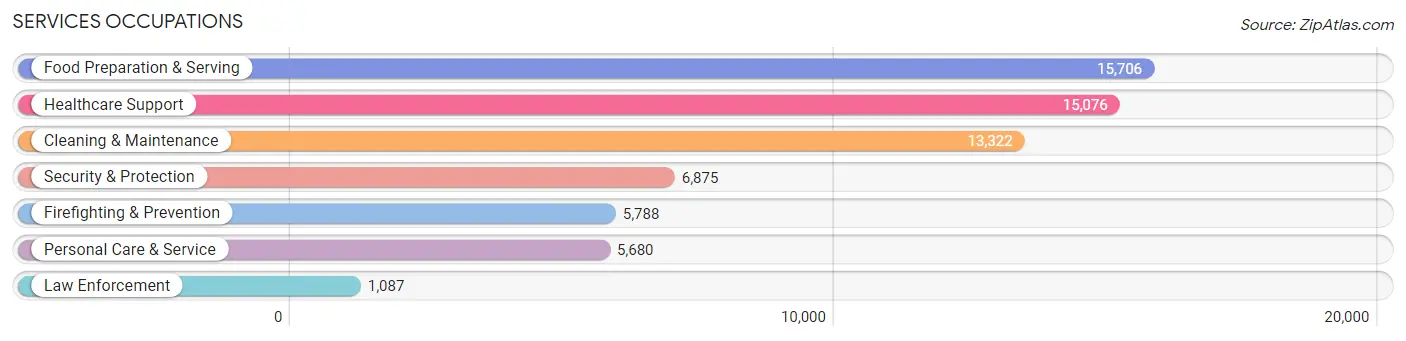
Services Occupations
The most common Services occupations in Detroit are Food Preparation & Serving (15,706 | 6.8%), Healthcare Support (15,076 | 6.5%), Cleaning & Maintenance (13,322 | 5.7%), Security & Protection (6,875 | 3.0%), and Firefighting & Prevention (5,788 | 2.5%).
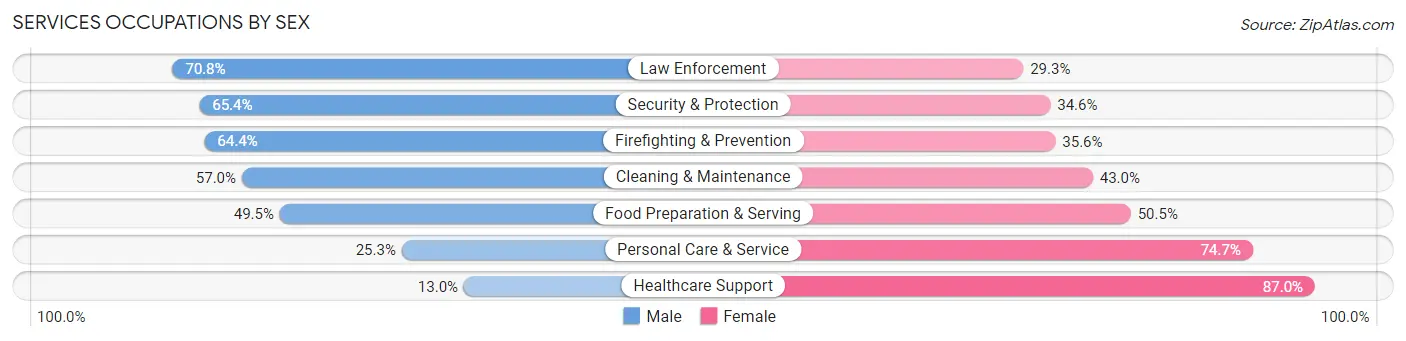
Services Occupations by Sex
Within the Services occupations in Detroit, the most male-oriented occupations are Law Enforcement (70.8%), Security & Protection (65.4%), and Firefighting & Prevention (64.4%), while the most female-oriented occupations are Healthcare Support (87.0%), Personal Care & Service (74.7%), and Food Preparation & Serving (50.5%).
| Occupation | Male | Female |
| Healthcare Support | 1,961 (13.0%) | 13,115 (87.0%) |
| Security & Protection | 4,496 (65.4%) | 2,379 (34.6%) |
| Firefighting & Prevention | 3,727 (64.4%) | 2,061 (35.6%) |
| Law Enforcement | 769 (70.8%) | 318 (29.2%) |
| Food Preparation & Serving | 7,769 (49.5%) | 7,937 (50.5%) |
| Cleaning & Maintenance | 7,591 (57.0%) | 5,731 (43.0%) |
| Personal Care & Service | 1,438 (25.3%) | 4,242 (74.7%) |
| Total (Category) | 23,255 (41.0%) | 33,404 (59.0%) |
| Total (Overall) | 108,698 (46.9%) | 123,306 (53.1%) |
Sales and Office Occupations
The most common Sales and Office occupations in Detroit are Office & Administration (27,069 | 11.7%), and Sales & Related (18,552 | 8.0%).

Sales and Office Occupations by Sex
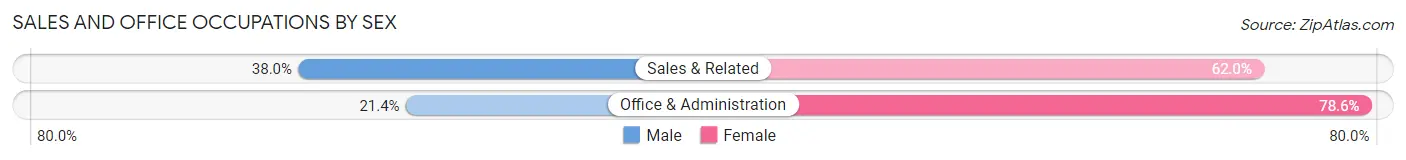
| Occupation | Male | Female |
| Sales & Related | 7,043 (38.0%) | 11,509 (62.0%) |
| Office & Administration | 5,796 (21.4%) | 21,273 (78.6%) |
| Total (Category) | 12,839 (28.1%) | 32,782 (71.9%) |
| Total (Overall) | 108,698 (46.9%) | 123,306 (53.1%) |
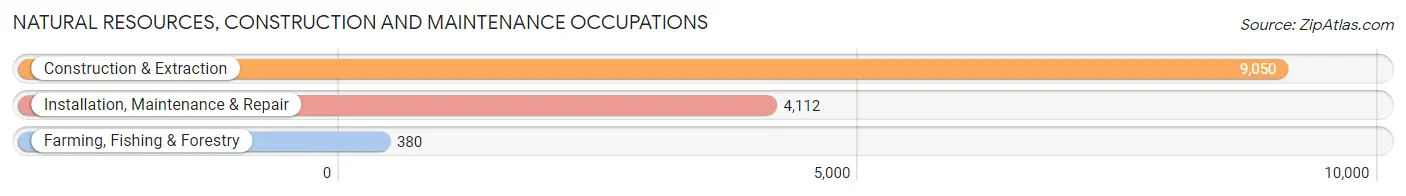
Natural Resources, Construction and Maintenance Occupations
The most common Natural Resources, Construction and Maintenance occupations in Detroit are Construction & Extraction (9,050 | 3.9%), Installation, Maintenance & Repair (4,112 | 1.8%), and Farming, Fishing & Forestry (380 | 0.2%).
Natural Resources, Construction and Maintenance Occupations by Sex
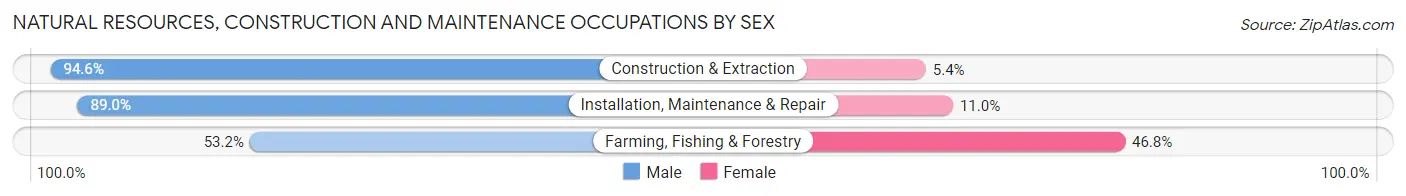
| Occupation | Male | Female |
| Farming, Fishing & Forestry | 202 (53.2%) | 178 (46.8%) |
| Construction & Extraction | 8,561 (94.6%) | 489 (5.4%) |
| Installation, Maintenance & Repair | 3,658 (89.0%) | 454 (11.0%) |
| Total (Category) | 12,421 (91.7%) | 1,121 (8.3%) |
| Total (Overall) | 108,698 (46.9%) | 123,306 (53.1%) |
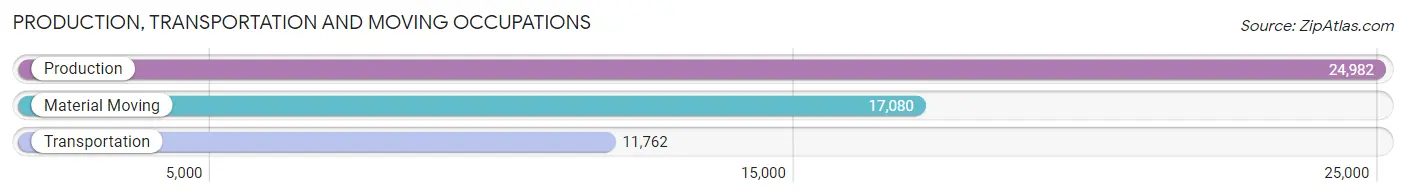
Production, Transportation and Moving Occupations
The most common Production, Transportation and Moving occupations in Detroit are Production (24,982 | 10.8%), Material Moving (17,080 | 7.4%), and Transportation (11,762 | 5.1%).
Production, Transportation and Moving Occupations by Sex
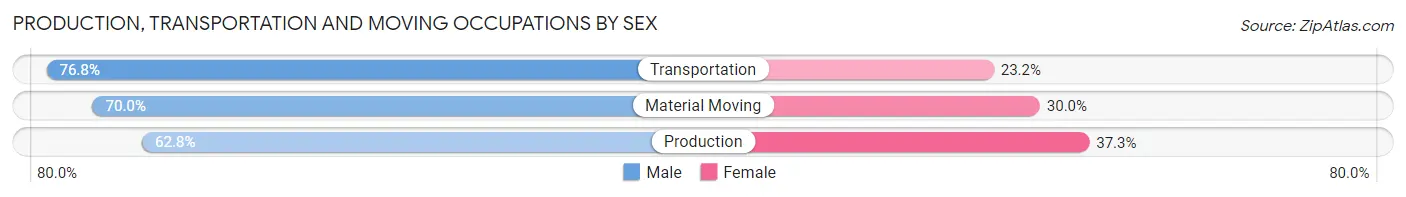
| Occupation | Male | Female |
| Production | 15,677 (62.7%) | 9,305 (37.2%) |
| Transportation | 9,030 (76.8%) | 2,732 (23.2%) |
| Material Moving | 11,958 (70.0%) | 5,122 (30.0%) |
| Total (Category) | 36,665 (68.1%) | 17,159 (31.9%) |
| Total (Overall) | 108,698 (46.9%) | 123,306 (53.1%) |
Employment Industries by Sex in Detroit
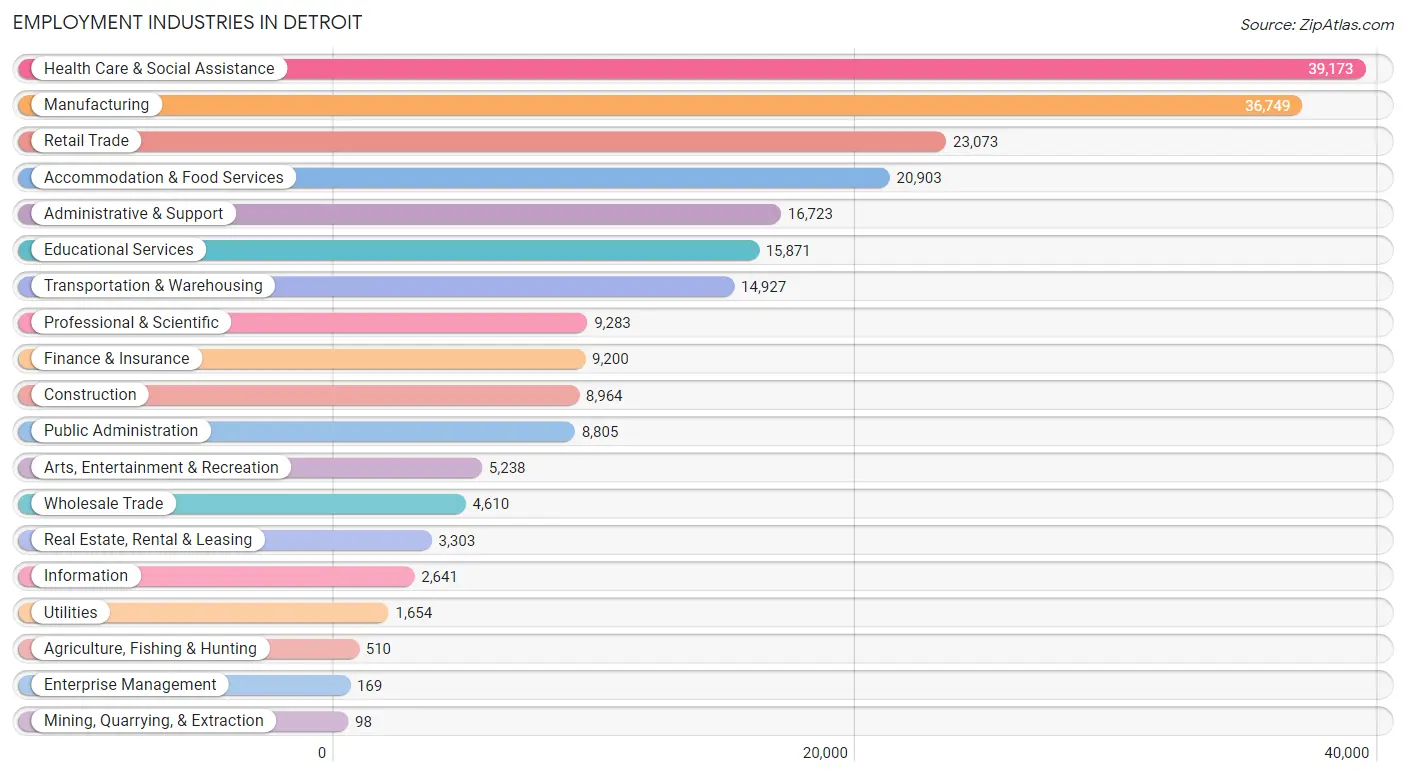
Employment Industries in Detroit
The major employment industries in Detroit include Health Care & Social Assistance (39,173 | 16.9%), Manufacturing (36,749 | 15.8%), Retail Trade (23,073 | 10.0%), Accommodation & Food Services (20,903 | 9.0%), and Administrative & Support (16,723 | 7.2%).
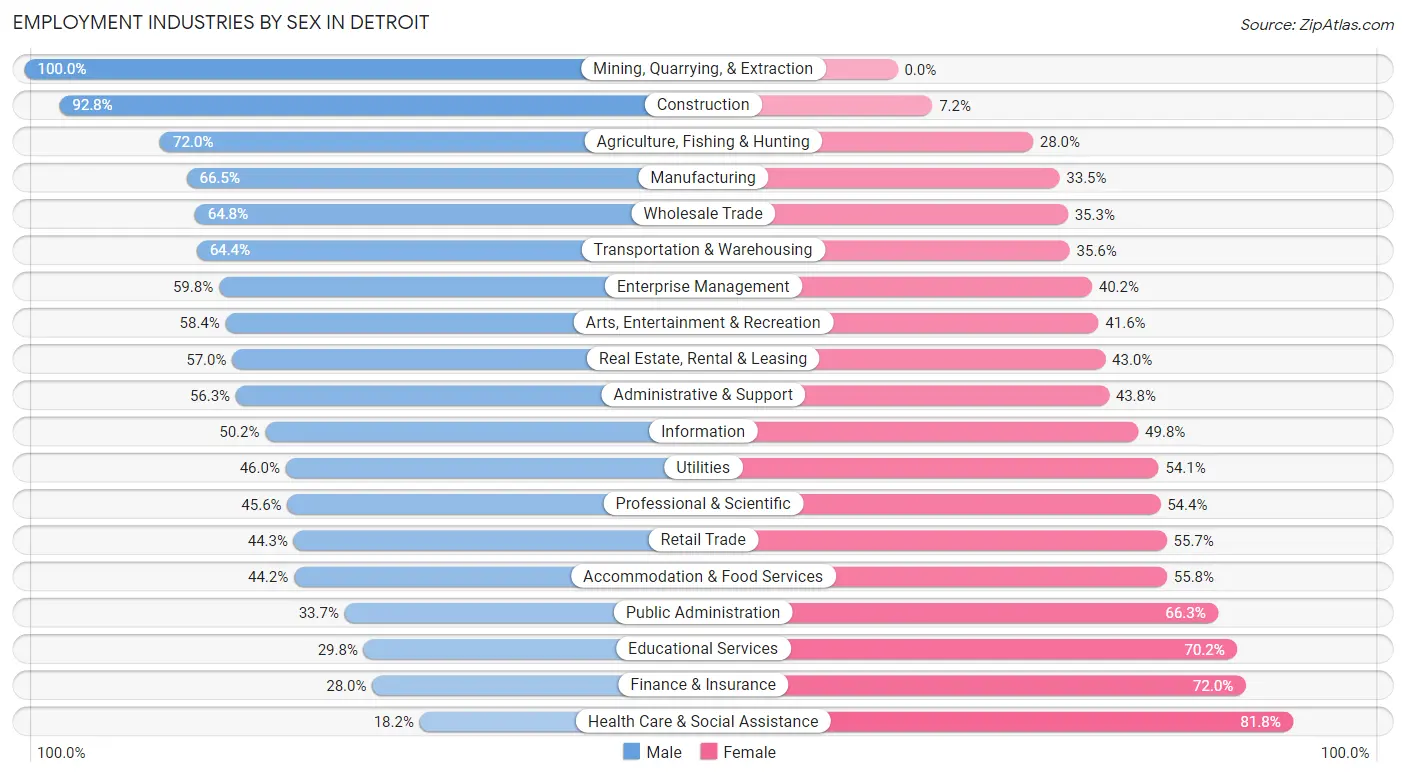
Employment Industries by Sex in Detroit
The Detroit industries that see more men than women are Mining, Quarrying, & Extraction (100.0%), Construction (92.8%), and Agriculture, Fishing & Hunting (72.0%), whereas the industries that tend to have a higher number of women are Health Care & Social Assistance (81.8%), Finance & Insurance (72.0%), and Educational Services (70.2%).
| Industry | Male | Female |
| Agriculture, Fishing & Hunting | 367 (72.0%) | 143 (28.0%) |
| Mining, Quarrying, & Extraction | 98 (100.0%) | 0 (0.0%) |
| Construction | 8,319 (92.8%) | 645 (7.2%) |
| Manufacturing | 24,431 (66.5%) | 12,318 (33.5%) |
| Wholesale Trade | 2,985 (64.7%) | 1,625 (35.2%) |
| Retail Trade | 10,216 (44.3%) | 12,857 (55.7%) |
| Transportation & Warehousing | 9,607 (64.4%) | 5,320 (35.6%) |
| Utilities | 760 (46.0%) | 894 (54.0%) |
| Information | 1,325 (50.2%) | 1,316 (49.8%) |
| Finance & Insurance | 2,579 (28.0%) | 6,621 (72.0%) |
| Real Estate, Rental & Leasing | 1,883 (57.0%) | 1,420 (43.0%) |
| Professional & Scientific | 4,233 (45.6%) | 5,050 (54.4%) |
| Enterprise Management | 101 (59.8%) | 68 (40.2%) |
| Administrative & Support | 9,407 (56.2%) | 7,316 (43.8%) |
| Educational Services | 4,729 (29.8%) | 11,142 (70.2%) |
| Health Care & Social Assistance | 7,133 (18.2%) | 32,040 (81.8%) |
| Arts, Entertainment & Recreation | 3,059 (58.4%) | 2,179 (41.6%) |
| Accommodation & Food Services | 9,245 (44.2%) | 11,658 (55.8%) |
| Public Administration | 2,971 (33.7%) | 5,834 (66.3%) |
| Total | 108,698 (46.9%) | 123,306 (53.1%) |
Education in Detroit
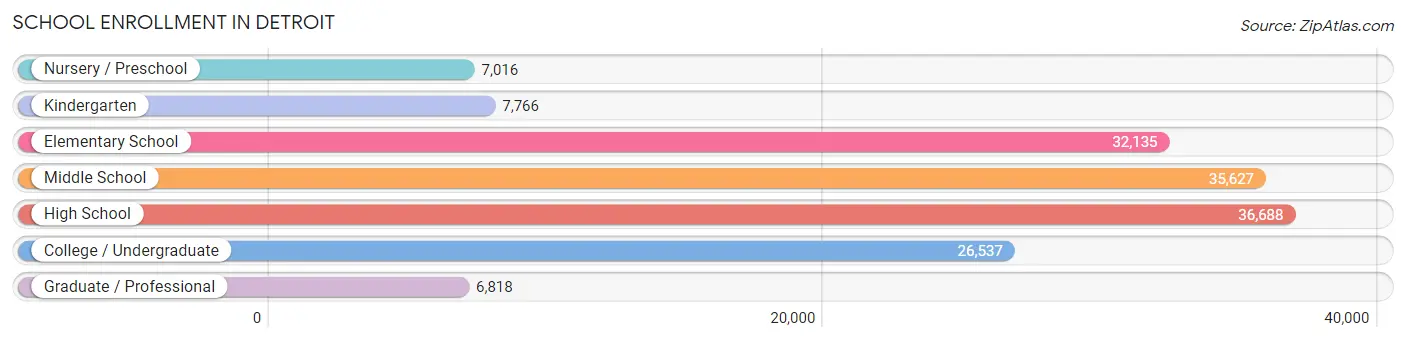
School Enrollment in Detroit
The most common levels of schooling among the 152,587 students in Detroit are high school (36,688 | 24.0%), middle school (35,627 | 23.4%), and elementary school (32,135 | 21.1%).
| School Level | # Students | % Students |
| Nursery / Preschool | 7,016 | 4.6% |
| Kindergarten | 7,766 | 5.1% |
| Elementary School | 32,135 | 21.1% |
| Middle School | 35,627 | 23.4% |
| High School | 36,688 | 24.0% |
| College / Undergraduate | 26,537 | 17.4% |
| Graduate / Professional | 6,818 | 4.5% |
| Total | 152,587 | 100.0% |
School Enrollment by Age by Funding Source in Detroit
Out of a total of 152,587 students who are enrolled in schools in Detroit, 15,716 (10.3%) attend a private institution, while the remaining 136,871 (89.7%) are enrolled in public schools. The age group of 35 years and over has the highest likelihood of being enrolled in private schools, with 1,827 (23.9% in the age bracket) enrolled. Conversely, the age group of 15 to 17 year olds has the lowest likelihood of being enrolled in a private school, with 22,821 (95.0% in the age bracket) attending a public institution.
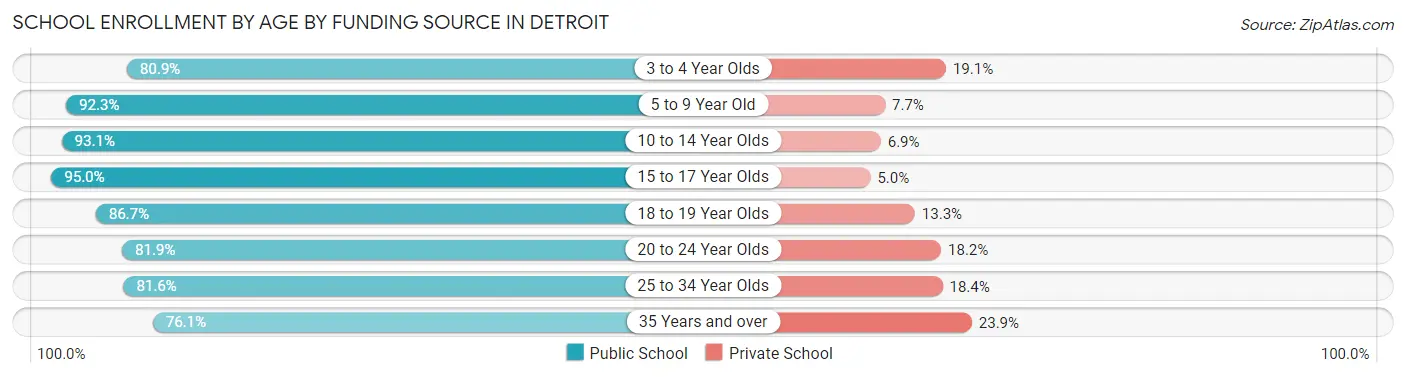
| Age Bracket | Public School | Private School |
| 3 to 4 Year Olds | 5,042 (80.9%) | 1,187 (19.1%) |
| 5 to 9 Year Old | 34,984 (92.3%) | 2,925 (7.7%) |
| 10 to 14 Year Olds | 40,389 (93.1%) | 2,996 (6.9%) |
| 15 to 17 Year Olds | 22,821 (95.0%) | 1,198 (5.0%) |
| 18 to 19 Year Olds | 9,239 (86.7%) | 1,414 (13.3%) |
| 20 to 24 Year Olds | 10,862 (81.9%) | 2,409 (18.1%) |
| 25 to 34 Year Olds | 7,726 (81.6%) | 1,745 (18.4%) |
| 35 Years and over | 5,823 (76.1%) | 1,827 (23.9%) |
| Total | 136,871 (89.7%) | 15,716 (10.3%) |
Educational Attainment by Field of Study in Detroit
Business (14,195 | 18.7%), education (7,719 | 10.2%), arts & humanities (7,552 | 10.0%), science & technology (6,497 | 8.6%), and social sciences (5,565 | 7.3%) are the most common fields of study among 75,886 individuals in Detroit who have obtained a bachelor's degree or higher.
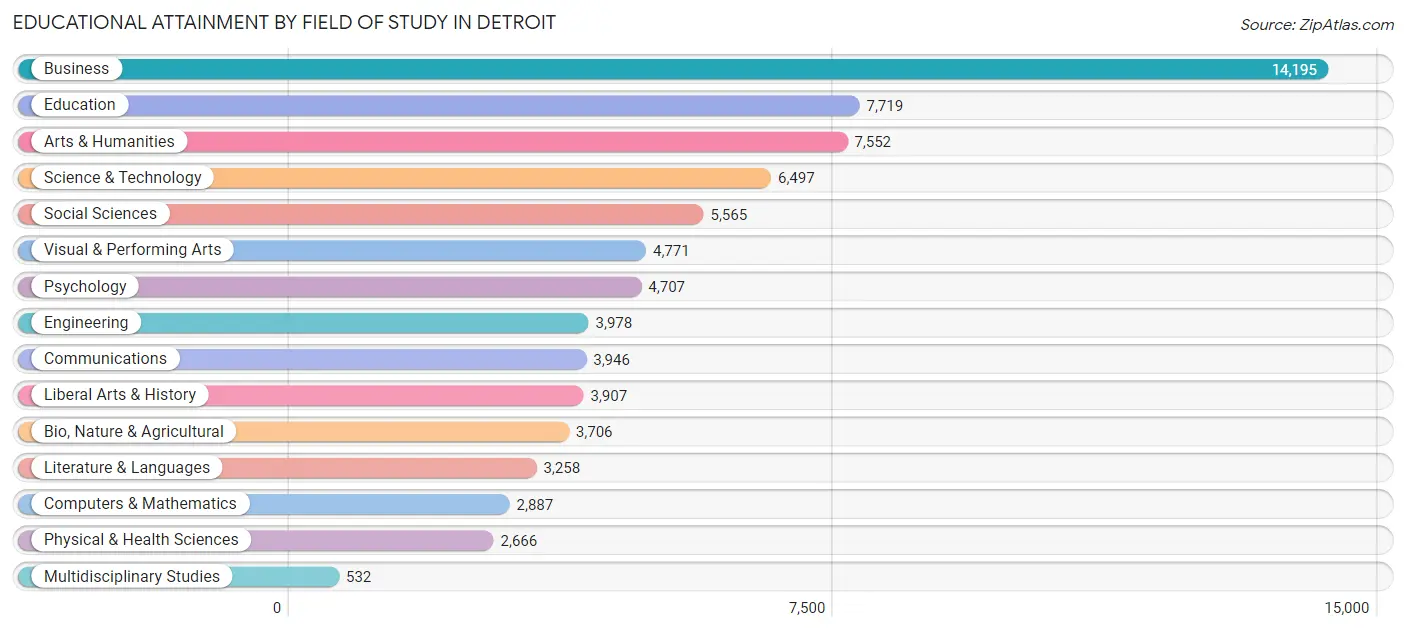
| Field of Study | # Graduates | % Graduates |
| Computers & Mathematics | 2,887 | 3.8% |
| Bio, Nature & Agricultural | 3,706 | 4.9% |
| Physical & Health Sciences | 2,666 | 3.5% |
| Psychology | 4,707 | 6.2% |
| Social Sciences | 5,565 | 7.3% |
| Engineering | 3,978 | 5.2% |
| Multidisciplinary Studies | 532 | 0.7% |
| Science & Technology | 6,497 | 8.6% |
| Business | 14,195 | 18.7% |
| Education | 7,719 | 10.2% |
| Literature & Languages | 3,258 | 4.3% |
| Liberal Arts & History | 3,907 | 5.1% |
| Visual & Performing Arts | 4,771 | 6.3% |
| Communications | 3,946 | 5.2% |
| Arts & Humanities | 7,552 | 10.0% |
| Total | 75,886 | 100.0% |
Transportation & Commute in Detroit
Vehicle Availability by Sex in Detroit
The most prevalent vehicle ownership categories in Detroit are males with 1 vehicle (37,830, accounting for 35.9%) and females with 1 vehicle (49,198, making up 32.2%).
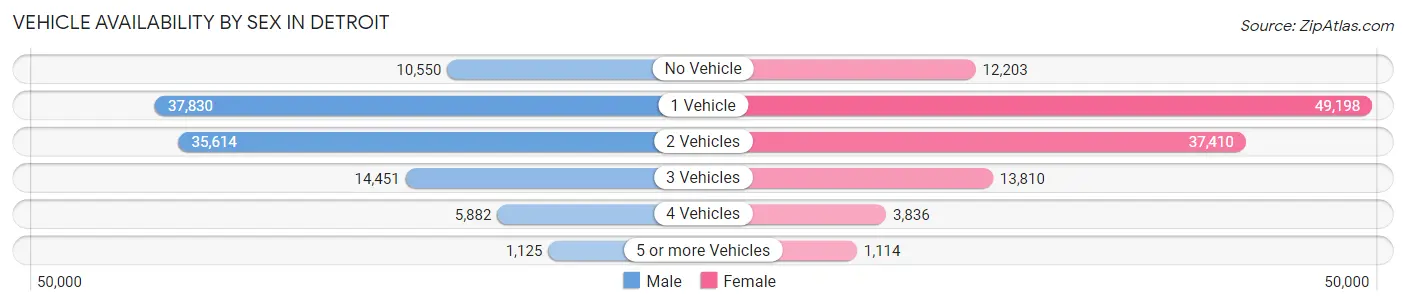
| Vehicles Available | Male | Female |
| No Vehicle | 10,550 (10.0%) | 12,203 (10.4%) |
| 1 Vehicle | 37,830 (35.9%) | 49,198 (41.8%) |
| 2 Vehicles | 35,614 (33.8%) | 37,410 (31.8%) |
| 3 Vehicles | 14,451 (13.7%) | 13,810 (11.7%) |
| 4 Vehicles | 5,882 (5.6%) | 3,836 (3.3%) |
| 5 or more Vehicles | 1,125 (1.1%) | 1,114 (0.9%) |
| Total | 105,452 (100.0%) | 117,571 (100.0%) |
Commute Time in Detroit
The most frequently occuring commute durations in Detroit are 20 to 24 minutes (40,472 commuters, 19.7%), 15 to 19 minutes (35,900 commuters, 17.5%), and 30 to 34 minutes (35,472 commuters, 17.3%).
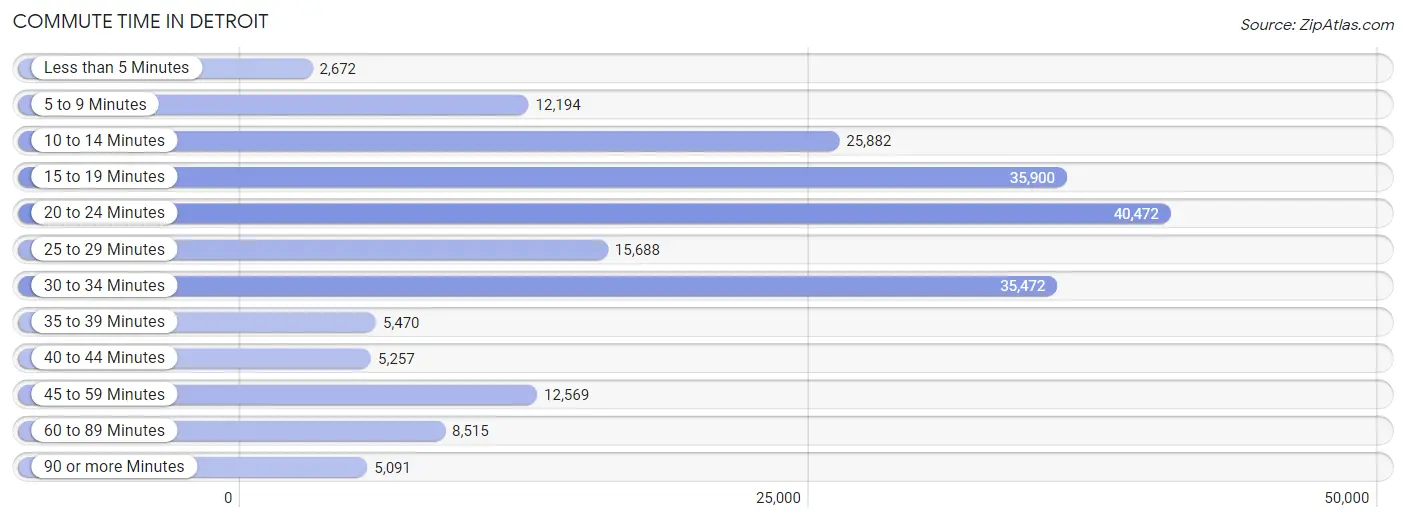
| Commute Time | # Commuters | % Commuters |
| Less than 5 Minutes | 2,672 | 1.3% |
| 5 to 9 Minutes | 12,194 | 5.9% |
| 10 to 14 Minutes | 25,882 | 12.6% |
| 15 to 19 Minutes | 35,900 | 17.5% |
| 20 to 24 Minutes | 40,472 | 19.7% |
| 25 to 29 Minutes | 15,688 | 7.6% |
| 30 to 34 Minutes | 35,472 | 17.3% |
| 35 to 39 Minutes | 5,470 | 2.7% |
| 40 to 44 Minutes | 5,257 | 2.6% |
| 45 to 59 Minutes | 12,569 | 6.1% |
| 60 to 89 Minutes | 8,515 | 4.2% |
| 90 or more Minutes | 5,091 | 2.5% |
Commute Time by Sex in Detroit
The most common commute times in Detroit are 20 to 24 minutes (19,885 commuters, 20.3%) for males and 20 to 24 minutes (20,587 commuters, 19.2%) for females.
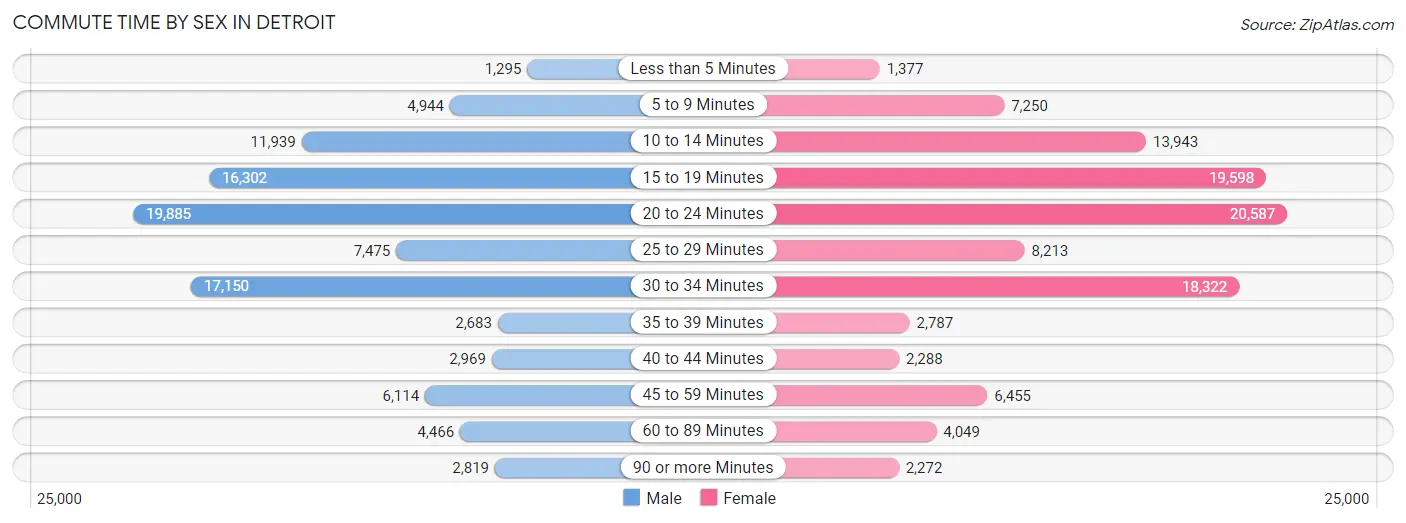
| Commute Time | Male | Female |
| Less than 5 Minutes | 1,295 (1.3%) | 1,377 (1.3%) |
| 5 to 9 Minutes | 4,944 (5.0%) | 7,250 (6.8%) |
| 10 to 14 Minutes | 11,939 (12.2%) | 13,943 (13.0%) |
| 15 to 19 Minutes | 16,302 (16.6%) | 19,598 (18.3%) |
| 20 to 24 Minutes | 19,885 (20.3%) | 20,587 (19.2%) |
| 25 to 29 Minutes | 7,475 (7.6%) | 8,213 (7.7%) |
| 30 to 34 Minutes | 17,150 (17.5%) | 18,322 (17.1%) |
| 35 to 39 Minutes | 2,683 (2.7%) | 2,787 (2.6%) |
| 40 to 44 Minutes | 2,969 (3.0%) | 2,288 (2.1%) |
| 45 to 59 Minutes | 6,114 (6.2%) | 6,455 (6.0%) |
| 60 to 89 Minutes | 4,466 (4.6%) | 4,049 (3.8%) |
| 90 or more Minutes | 2,819 (2.9%) | 2,272 (2.1%) |
Time of Departure to Work by Sex in Detroit
The most frequent times of departure to work in Detroit are 12:00 PM to 3:59 PM (14,476, 14.8%) for males and 7:00 AM to 7:29 AM (13,222, 12.3%) for females.
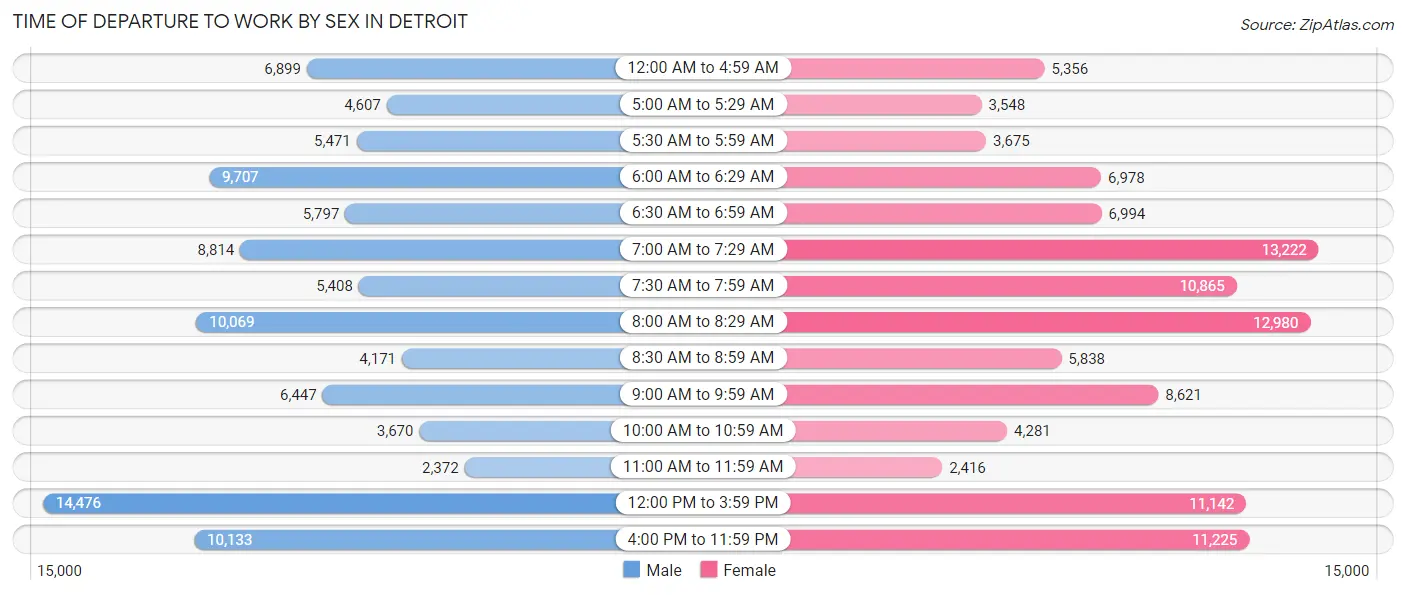
| Time of Departure | Male | Female |
| 12:00 AM to 4:59 AM | 6,899 (7.0%) | 5,356 (5.0%) |
| 5:00 AM to 5:29 AM | 4,607 (4.7%) | 3,548 (3.3%) |
| 5:30 AM to 5:59 AM | 5,471 (5.6%) | 3,675 (3.4%) |
| 6:00 AM to 6:29 AM | 9,707 (9.9%) | 6,978 (6.5%) |
| 6:30 AM to 6:59 AM | 5,797 (5.9%) | 6,994 (6.5%) |
| 7:00 AM to 7:29 AM | 8,814 (9.0%) | 13,222 (12.3%) |
| 7:30 AM to 7:59 AM | 5,408 (5.5%) | 10,865 (10.1%) |
| 8:00 AM to 8:29 AM | 10,069 (10.3%) | 12,980 (12.1%) |
| 8:30 AM to 8:59 AM | 4,171 (4.3%) | 5,838 (5.4%) |
| 9:00 AM to 9:59 AM | 6,447 (6.6%) | 8,621 (8.1%) |
| 10:00 AM to 10:59 AM | 3,670 (3.7%) | 4,281 (4.0%) |
| 11:00 AM to 11:59 AM | 2,372 (2.4%) | 2,416 (2.2%) |
| 12:00 PM to 3:59 PM | 14,476 (14.8%) | 11,142 (10.4%) |
| 4:00 PM to 11:59 PM | 10,133 (10.3%) | 11,225 (10.5%) |
| Total | 98,041 (100.0%) | 107,141 (100.0%) |
Housing Occupancy in Detroit
Occupancy by Ownership in Detroit
Of the total 249,518 dwellings in Detroit, owner-occupied units account for 121,734 (48.8%), while renter-occupied units make up 127,784 (51.2%).
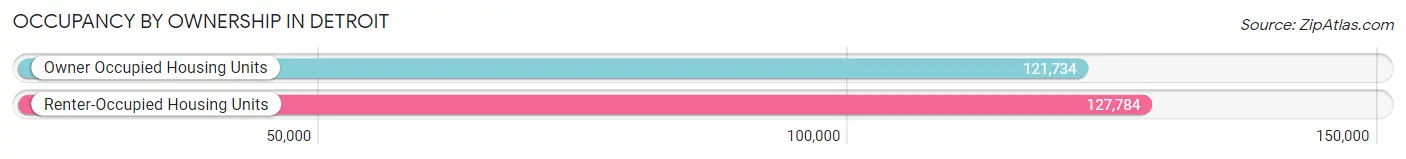
| Occupancy | # Housing Units | % Housing Units |
| Owner Occupied Housing Units | 121,734 | 48.8% |
| Renter-Occupied Housing Units | 127,784 | 51.2% |
| Total Occupied Housing Units | 249,518 | 100.0% |
Occupancy by Household Size in Detroit
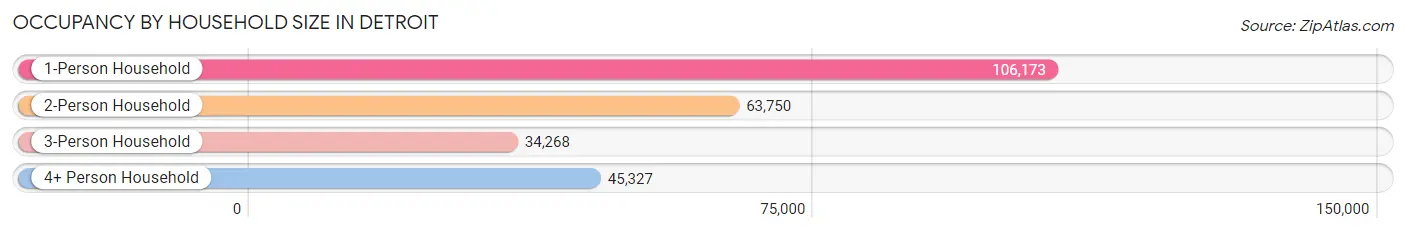
| Household Size | # Housing Units | % Housing Units |
| 1-Person Household | 106,173 | 42.5% |
| 2-Person Household | 63,750 | 25.6% |
| 3-Person Household | 34,268 | 13.7% |
| 4+ Person Household | 45,327 | 18.2% |
| Total Housing Units | 249,518 | 100.0% |
Occupancy by Ownership by Household Size in Detroit
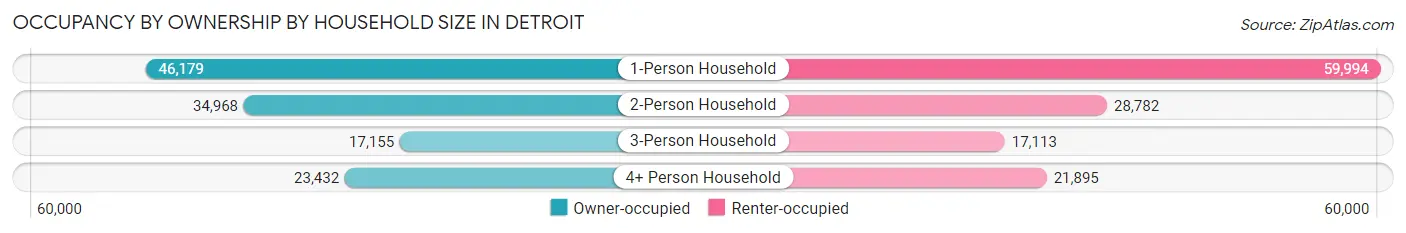
| Household Size | Owner-occupied | Renter-occupied |
| 1-Person Household | 46,179 (43.5%) | 59,994 (56.5%) |
| 2-Person Household | 34,968 (54.8%) | 28,782 (45.2%) |
| 3-Person Household | 17,155 (50.1%) | 17,113 (49.9%) |
| 4+ Person Household | 23,432 (51.7%) | 21,895 (48.3%) |
| Total Housing Units | 121,734 (48.8%) | 127,784 (51.2%) |
Occupancy by Educational Attainment in Detroit
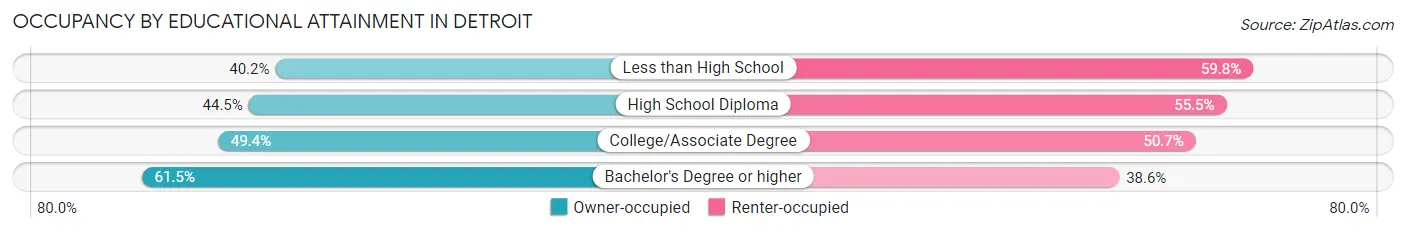
| Household Size | Owner-occupied | Renter-occupied |
| Less than High School | 15,152 (40.2%) | 22,498 (59.8%) |
| High School Diploma | 33,419 (44.5%) | 41,728 (55.5%) |
| College/Associate Degree | 44,251 (49.3%) | 45,419 (50.6%) |
| Bachelor's Degree or higher | 28,912 (61.5%) | 18,139 (38.6%) |
Occupancy by Age of Householder in Detroit
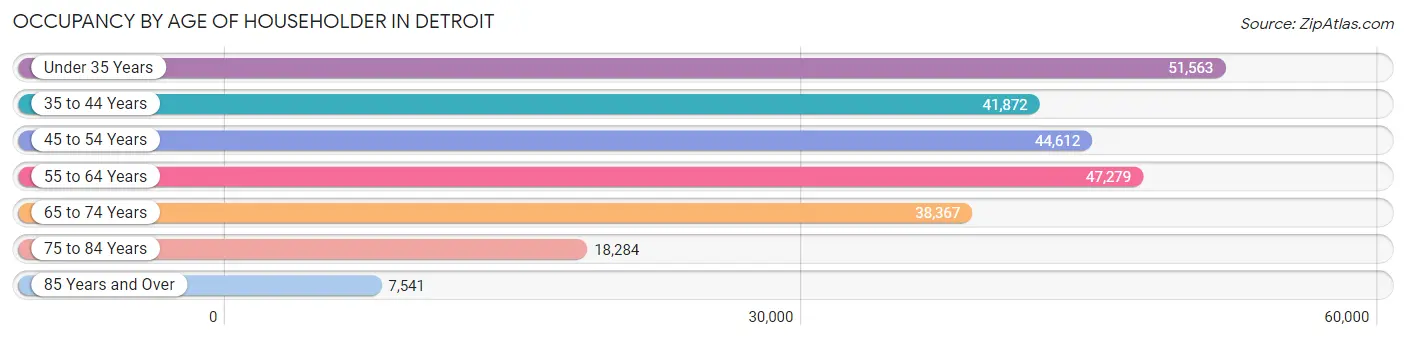
| Age Bracket | # Households | % Households |
| Under 35 Years | 51,563 | 20.7% |
| 35 to 44 Years | 41,872 | 16.8% |
| 45 to 54 Years | 44,612 | 17.9% |
| 55 to 64 Years | 47,279 | 19.0% |
| 65 to 74 Years | 38,367 | 15.4% |
| 75 to 84 Years | 18,284 | 7.3% |
| 85 Years and Over | 7,541 | 3.0% |
| Total | 249,518 | 100.0% |
Housing Finances in Detroit
Median Income by Occupancy in Detroit
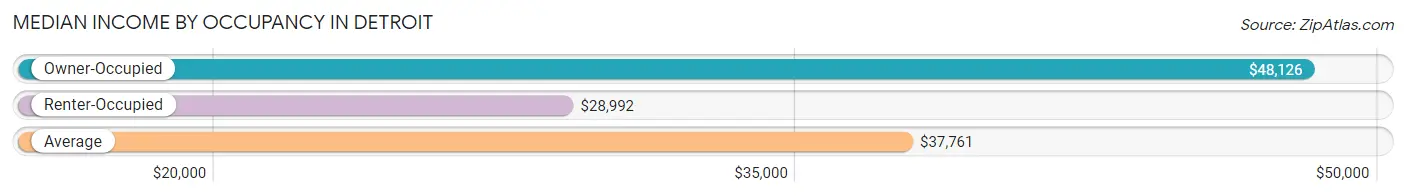
| Occupancy Type | # Households | Median Income |
| Owner-Occupied | 121,734 (48.8%) | $48,126 |
| Renter-Occupied | 127,784 (51.2%) | $28,992 |
| Average | 249,518 (100.0%) | $37,761 |
Occupancy by Householder Income Bracket in Detroit
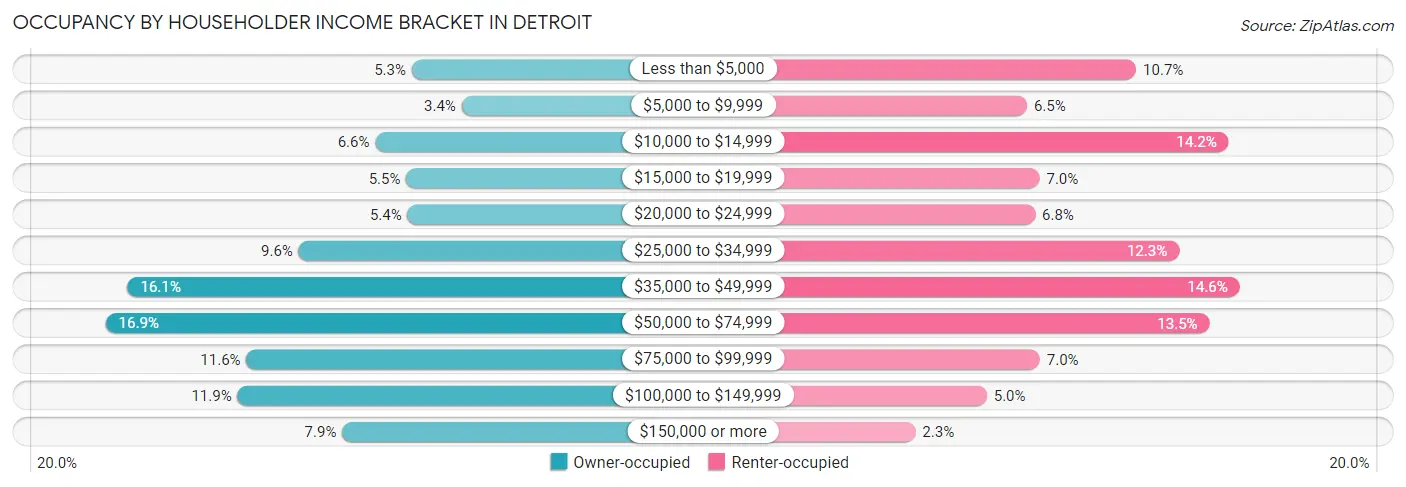
| Income Bracket | Owner-occupied | Renter-occupied |
| Less than $5,000 | 6,387 (5.2%) | 13,659 (10.7%) |
| $5,000 to $9,999 | 4,084 (3.4%) | 8,342 (6.5%) |
| $10,000 to $14,999 | 8,078 (6.6%) | 18,162 (14.2%) |
| $15,000 to $19,999 | 6,647 (5.5%) | 8,958 (7.0%) |
| $20,000 to $24,999 | 6,588 (5.4%) | 8,742 (6.8%) |
| $25,000 to $34,999 | 11,633 (9.6%) | 15,738 (12.3%) |
| $35,000 to $49,999 | 19,574 (16.1%) | 18,690 (14.6%) |
| $50,000 to $74,999 | 20,590 (16.9%) | 17,221 (13.5%) |
| $75,000 to $99,999 | 14,059 (11.6%) | 8,976 (7.0%) |
| $100,000 to $149,999 | 14,472 (11.9%) | 6,387 (5.0%) |
| $150,000 or more | 9,622 (7.9%) | 2,909 (2.3%) |
| Total | 121,734 (100.0%) | 127,784 (100.0%) |
Monthly Housing Cost Tiers in Detroit
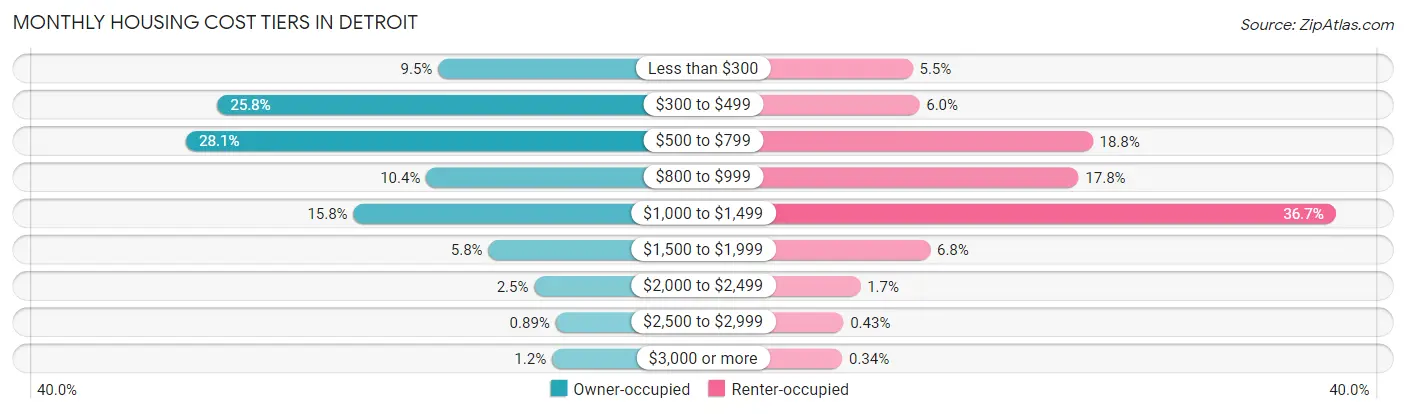
| Monthly Cost | Owner-occupied | Renter-occupied |
| Less than $300 | 11,618 (9.5%) | 7,071 (5.5%) |
| $300 to $499 | 31,410 (25.8%) | 7,708 (6.0%) |
| $500 to $799 | 34,212 (28.1%) | 24,012 (18.8%) |
| $800 to $999 | 12,684 (10.4%) | 22,678 (17.7%) |
| $1,000 to $1,499 | 19,212 (15.8%) | 46,876 (36.7%) |
| $1,500 to $1,999 | 7,112 (5.8%) | 8,720 (6.8%) |
| $2,000 to $2,499 | 2,998 (2.5%) | 2,141 (1.7%) |
| $2,500 to $2,999 | 1,081 (0.9%) | 544 (0.4%) |
| $3,000 or more | 1,407 (1.2%) | 432 (0.3%) |
| Total | 121,734 (100.0%) | 127,784 (100.0%) |
Physical Housing Characteristics in Detroit
Housing Structures in Detroit

| Structure Type | # Housing Units | % Housing Units |
| Single Unit, Detached | 166,250 | 66.6% |
| Single Unit, Attached | 17,065 | 6.8% |
| 2 Unit Apartments | 12,839 | 5.1% |
| 3 or 4 Unit Apartments | 5,702 | 2.3% |
| 5 to 9 Unit Apartments | 6,006 | 2.4% |
| 10 or more Apartments | 40,467 | 16.2% |
| Mobile Home / Other | 1,189 | 0.5% |
| Total | 249,518 | 100.0% |
Housing Structures by Occupancy in Detroit
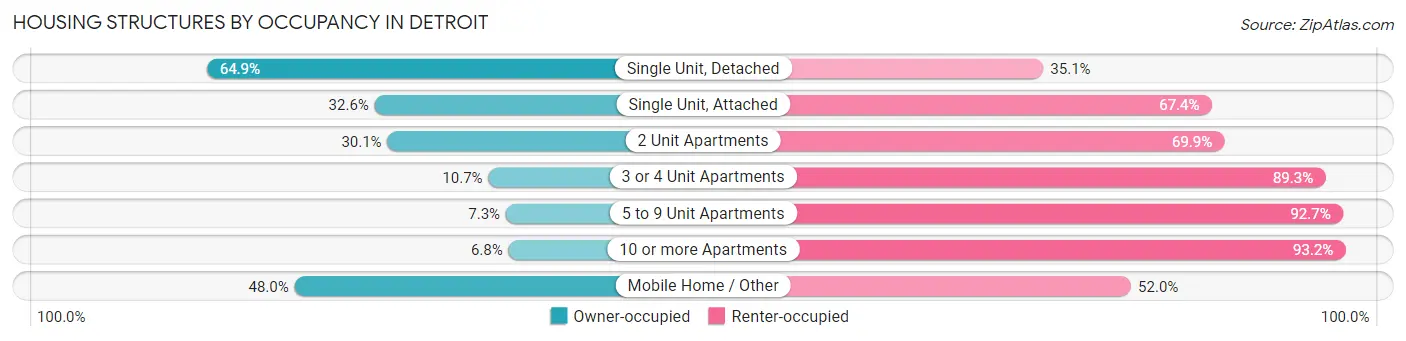
| Structure Type | Owner-occupied | Renter-occupied |
| Single Unit, Detached | 107,919 (64.9%) | 58,331 (35.1%) |
| Single Unit, Attached | 5,564 (32.6%) | 11,501 (67.4%) |
| 2 Unit Apartments | 3,870 (30.1%) | 8,969 (69.9%) |
| 3 or 4 Unit Apartments | 610 (10.7%) | 5,092 (89.3%) |
| 5 to 9 Unit Apartments | 440 (7.3%) | 5,566 (92.7%) |
| 10 or more Apartments | 2,760 (6.8%) | 37,707 (93.2%) |
| Mobile Home / Other | 571 (48.0%) | 618 (52.0%) |
| Total | 121,734 (48.8%) | 127,784 (51.2%) |
Housing Structures by Number of Rooms in Detroit
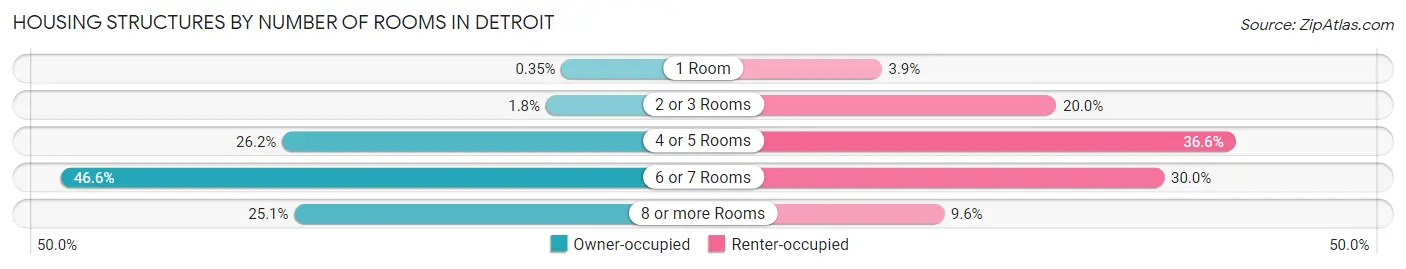
| Number of Rooms | Owner-occupied | Renter-occupied |
| 1 Room | 429 (0.4%) | 4,920 (3.8%) |
| 2 or 3 Rooms | 2,175 (1.8%) | 25,545 (20.0%) |
| 4 or 5 Rooms | 31,874 (26.2%) | 46,738 (36.6%) |
| 6 or 7 Rooms | 56,766 (46.6%) | 38,304 (30.0%) |
| 8 or more Rooms | 30,490 (25.1%) | 12,277 (9.6%) |
| Total | 121,734 (100.0%) | 127,784 (100.0%) |
Housing Structure by Heating Type in Detroit
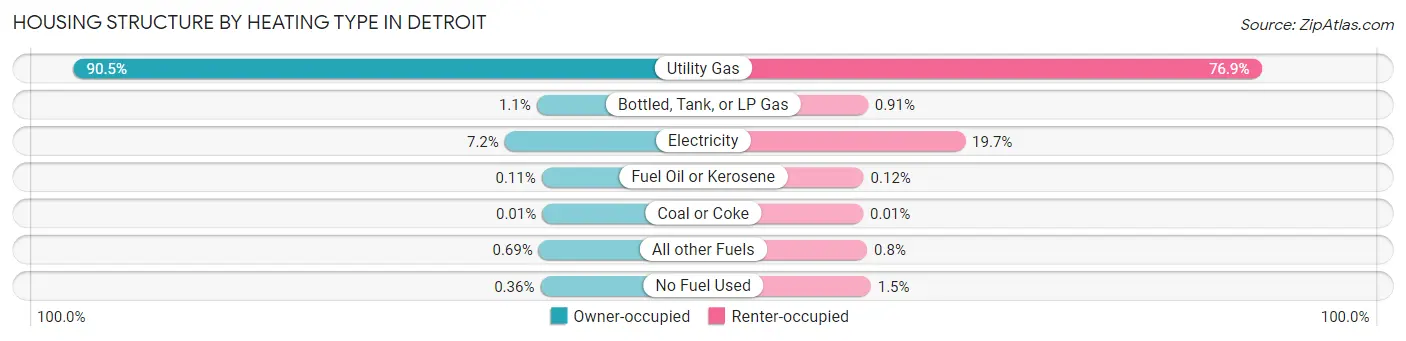
| Heating Type | Owner-occupied | Renter-occupied |
| Utility Gas | 110,189 (90.5%) | 98,313 (76.9%) |
| Bottled, Tank, or LP Gas | 1,298 (1.1%) | 1,163 (0.9%) |
| Electricity | 8,819 (7.2%) | 25,207 (19.7%) |
| Fuel Oil or Kerosene | 135 (0.1%) | 147 (0.1%) |
| Coal or Coke | 9 (0.0%) | 15 (0.0%) |
| All other Fuels | 842 (0.7%) | 1,019 (0.8%) |
| No Fuel Used | 442 (0.4%) | 1,920 (1.5%) |
| Total | 121,734 (100.0%) | 127,784 (100.0%) |
Household Vehicle Usage in Detroit
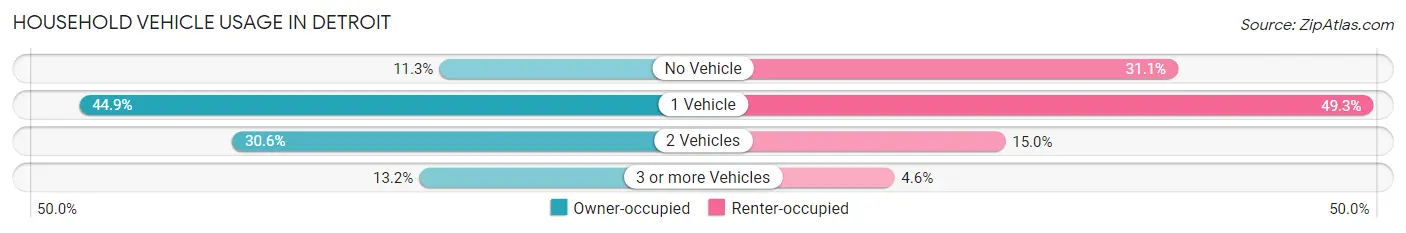
| Vehicles per Household | Owner-occupied | Renter-occupied |
| No Vehicle | 13,752 (11.3%) | 39,721 (31.1%) |
| 1 Vehicle | 54,655 (44.9%) | 63,027 (49.3%) |
| 2 Vehicles | 37,282 (30.6%) | 19,132 (15.0%) |
| 3 or more Vehicles | 16,045 (13.2%) | 5,904 (4.6%) |
| Total | 121,734 (100.0%) | 127,784 (100.0%) |
Real Estate & Mortgages in Detroit
Real Estate and Mortgage Overview in Detroit
| Characteristic | Without Mortgage | With Mortgage |
| Housing Units | 82,084 | 39,650 |
| Median Property Value | $57,000 | $96,600 |
| Median Household Income | $42,315 | $5,256 |
| Monthly Housing Costs | $494 | $1,334 |
| Real Estate Taxes | $1,275 | $2,373 |
Property Value by Mortgage Status in Detroit
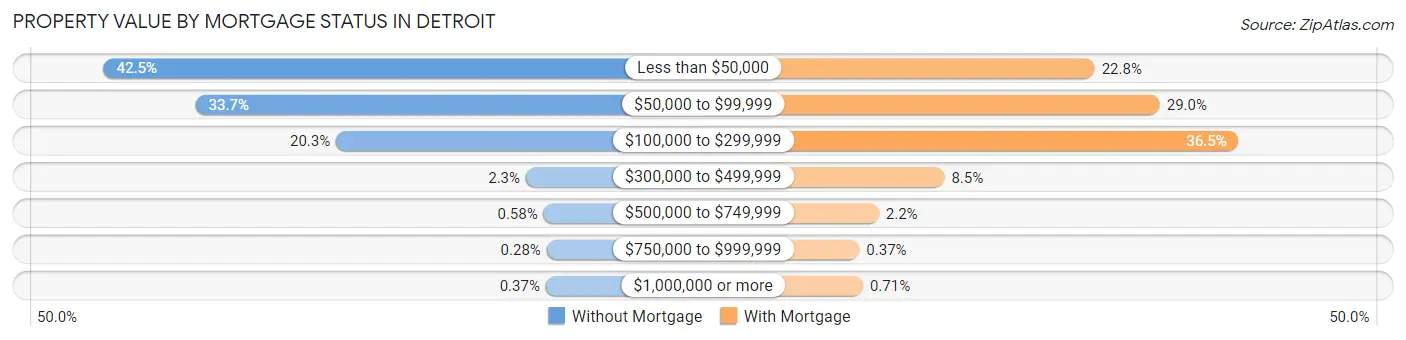
| Property Value | Without Mortgage | With Mortgage |
| Less than $50,000 | 34,861 (42.5%) | 9,032 (22.8%) |
| $50,000 to $99,999 | 27,671 (33.7%) | 11,492 (29.0%) |
| $100,000 to $299,999 | 16,693 (20.3%) | 14,461 (36.5%) |
| $300,000 to $499,999 | 1,854 (2.3%) | 3,360 (8.5%) |
| $500,000 to $749,999 | 474 (0.6%) | 879 (2.2%) |
| $750,000 to $999,999 | 229 (0.3%) | 145 (0.4%) |
| $1,000,000 or more | 302 (0.4%) | 281 (0.7%) |
| Total | 82,084 (100.0%) | 39,650 (100.0%) |
Household Income by Mortgage Status in Detroit
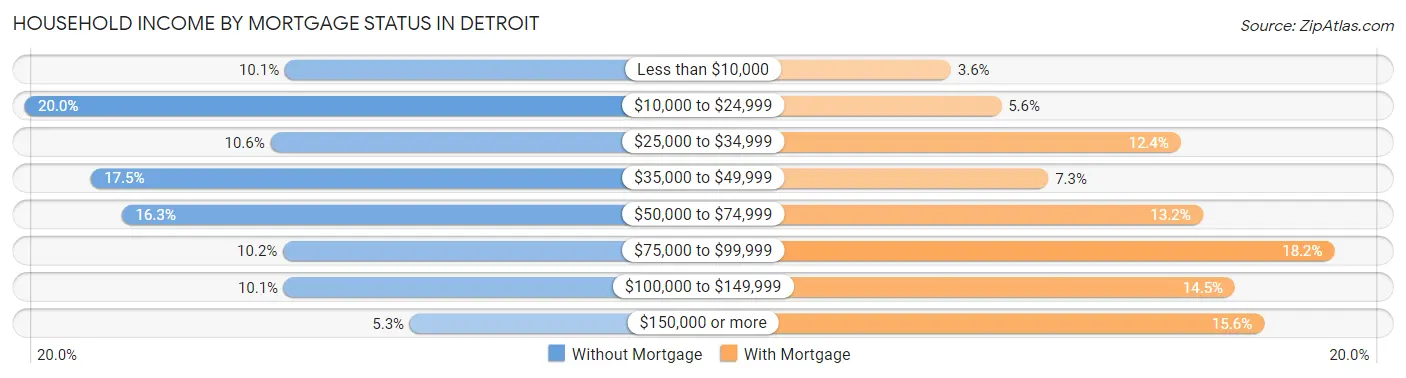
| Household Income | Without Mortgage | With Mortgage |
| Less than $10,000 | 8,271 (10.1%) | 1,441 (3.6%) |
| $10,000 to $24,999 | 16,400 (20.0%) | 2,200 (5.6%) |
| $25,000 to $34,999 | 8,724 (10.6%) | 4,913 (12.4%) |
| $35,000 to $49,999 | 14,334 (17.5%) | 2,909 (7.3%) |
| $50,000 to $74,999 | 13,356 (16.3%) | 5,240 (13.2%) |
| $75,000 to $99,999 | 8,329 (10.2%) | 7,234 (18.2%) |
| $100,000 to $149,999 | 8,304 (10.1%) | 5,730 (14.4%) |
| $150,000 or more | 4,366 (5.3%) | 6,168 (15.6%) |
| Total | 82,084 (100.0%) | 39,650 (100.0%) |
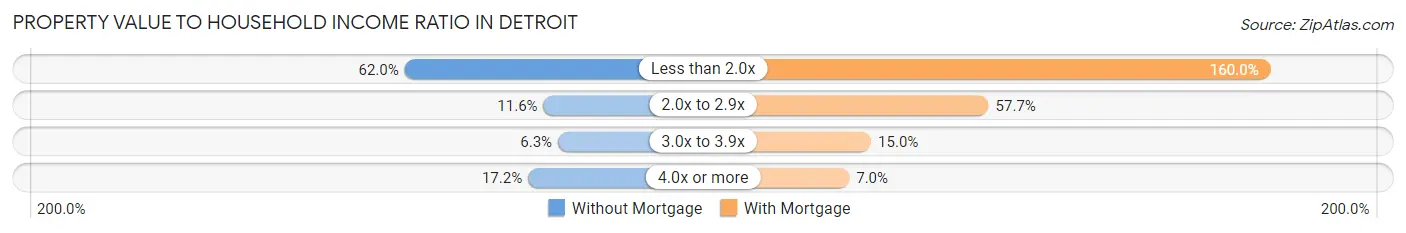
Property Value to Household Income Ratio in Detroit
| Value-to-Income Ratio | Without Mortgage | With Mortgage |
| Less than 2.0x | 50,882 (62.0%) | 63,444 (160.0%) |
| 2.0x to 2.9x | 9,484 (11.6%) | 22,860 (57.7%) |
| 3.0x to 3.9x | 5,161 (6.3%) | 5,935 (15.0%) |
| 4.0x or more | 14,085 (17.2%) | 2,792 (7.0%) |
| Total | 82,084 (100.0%) | 39,650 (100.0%) |
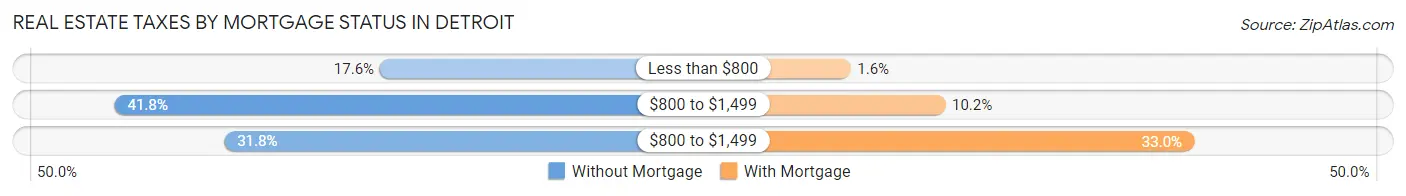
Real Estate Taxes by Mortgage Status in Detroit
| Property Taxes | Without Mortgage | With Mortgage |
| Less than $800 | 14,404 (17.5%) | 626 (1.6%) |
| $800 to $1,499 | 34,296 (41.8%) | 4,056 (10.2%) |
| $800 to $1,499 | 26,077 (31.8%) | 13,063 (33.0%) |
| Total | 82,084 (100.0%) | 39,650 (100.0%) |
Health & Disability in Detroit
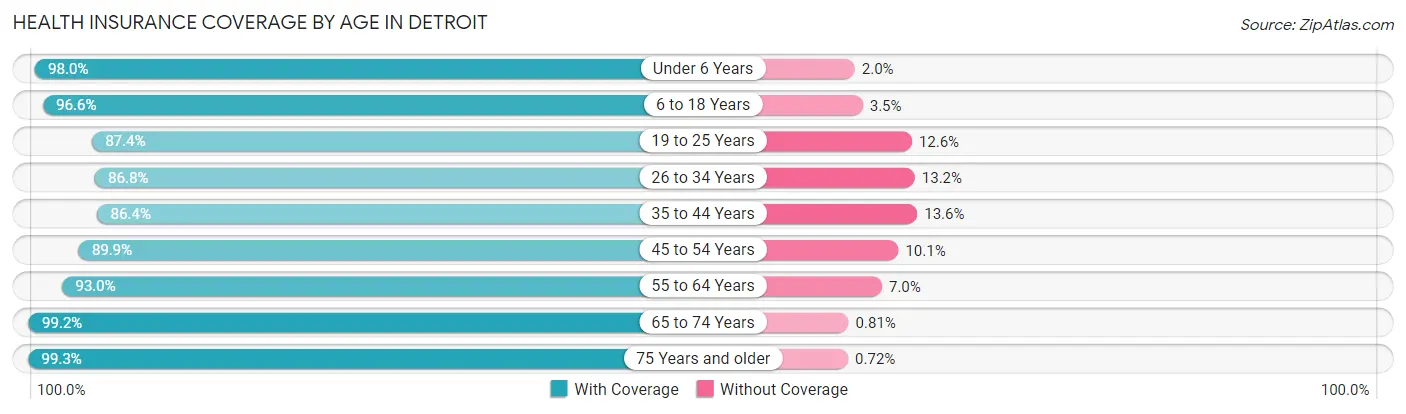
Health Insurance Coverage by Age in Detroit
| Age Bracket | With Coverage | Without Coverage |
| Under 6 Years | 51,760 (98.0%) | 1,040 (2.0%) |
| 6 to 18 Years | 108,417 (96.6%) | 3,871 (3.5%) |
| 19 to 25 Years | 56,336 (87.4%) | 8,139 (12.6%) |
| 26 to 34 Years | 75,611 (86.8%) | 11,459 (13.2%) |
| 35 to 44 Years | 63,941 (86.4%) | 10,070 (13.6%) |
| 45 to 54 Years | 67,739 (89.9%) | 7,622 (10.1%) |
| 55 to 64 Years | 70,379 (93.0%) | 5,330 (7.0%) |
| 65 to 74 Years | 54,012 (99.2%) | 443 (0.8%) |
| 75 Years and older | 35,011 (99.3%) | 254 (0.7%) |
| Total | 583,206 (92.4%) | 48,228 (7.6%) |
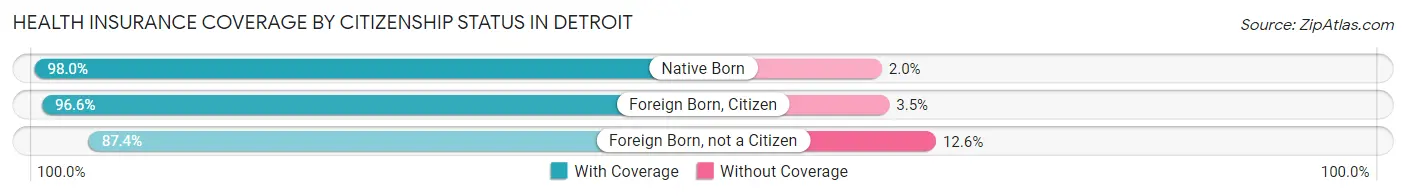
Health Insurance Coverage by Citizenship Status in Detroit
| Citizenship Status | With Coverage | Without Coverage |
| Native Born | 51,760 (98.0%) | 1,040 (2.0%) |
| Foreign Born, Citizen | 108,417 (96.6%) | 3,871 (3.5%) |
| Foreign Born, not a Citizen | 56,336 (87.4%) | 8,139 (12.6%) |
Health Insurance Coverage by Household Income in Detroit
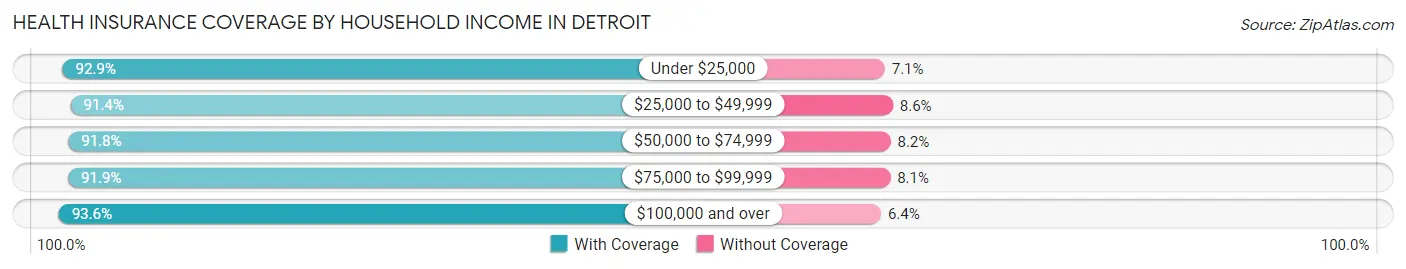
| Household Income | With Coverage | Without Coverage |
| Under $25,000 | 165,293 (92.9%) | 12,679 (7.1%) |
| $25,000 to $49,999 | 141,195 (91.4%) | 13,341 (8.6%) |
| $50,000 to $74,999 | 96,690 (91.8%) | 8,632 (8.2%) |
| $75,000 to $99,999 | 66,374 (91.9%) | 5,880 (8.1%) |
| $100,000 and over | 106,966 (93.6%) | 7,314 (6.4%) |
Public vs Private Health Insurance Coverage by Age in Detroit
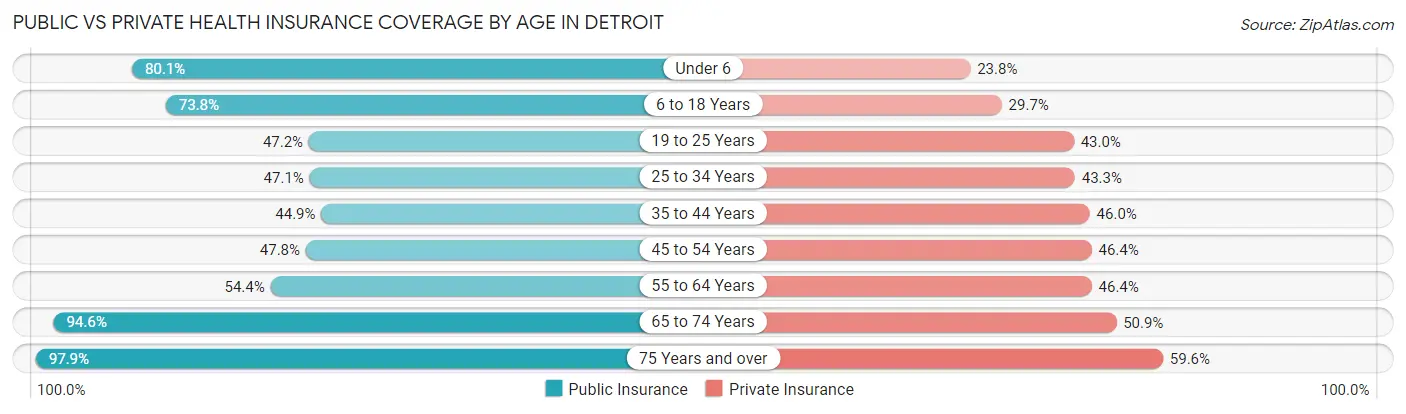
| Age Bracket | Public Insurance | Private Insurance |
| Under 6 | 42,278 (80.1%) | 12,586 (23.8%) |
| 6 to 18 Years | 82,842 (73.8%) | 33,321 (29.7%) |
| 19 to 25 Years | 30,447 (47.2%) | 27,749 (43.0%) |
| 25 to 34 Years | 41,003 (47.1%) | 37,662 (43.2%) |
| 35 to 44 Years | 33,245 (44.9%) | 34,049 (46.0%) |
| 45 to 54 Years | 36,017 (47.8%) | 34,934 (46.4%) |
| 55 to 64 Years | 41,145 (54.3%) | 35,107 (46.4%) |
| 65 to 74 Years | 51,529 (94.6%) | 27,736 (50.9%) |
| 75 Years and over | 34,527 (97.9%) | 21,016 (59.6%) |
| Total | 393,033 (62.2%) | 264,160 (41.8%) |
Disability Status by Sex by Age in Detroit
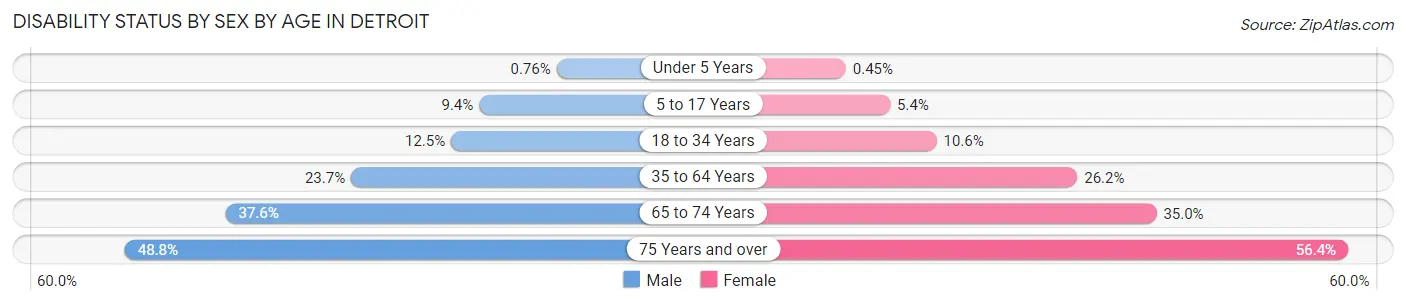
| Age Bracket | Male | Female |
| Under 5 Years | 171 (0.8%) | 96 (0.4%) |
| 5 to 17 Years | 5,299 (9.4%) | 3,027 (5.4%) |
| 18 to 34 Years | 9,580 (12.5%) | 8,810 (10.5%) |
| 35 to 64 Years | 25,185 (23.6%) | 31,102 (26.2%) |
| 65 to 74 Years | 9,005 (37.6%) | 10,695 (35.0%) |
| 75 Years and over | 6,393 (48.8%) | 12,498 (56.4%) |
Disability Class by Sex by Age in Detroit
Disability Class: Hearing Difficulty
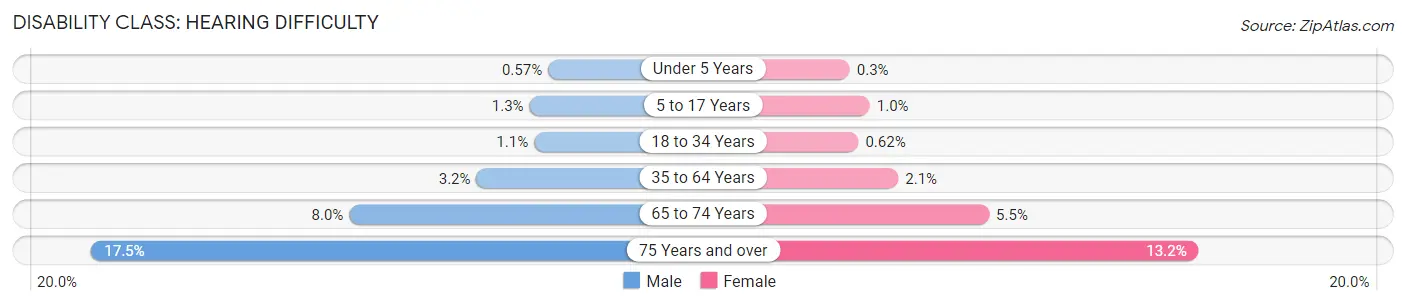
| Age Bracket | Male | Female |
| Under 5 Years | 129 (0.6%) | 63 (0.3%) |
| 5 to 17 Years | 713 (1.3%) | 584 (1.0%) |
| 18 to 34 Years | 837 (1.1%) | 516 (0.6%) |
| 35 to 64 Years | 3,444 (3.2%) | 2,492 (2.1%) |
| 65 to 74 Years | 1,902 (8.0%) | 1,670 (5.5%) |
| 75 Years and over | 2,293 (17.5%) | 2,936 (13.2%) |
Disability Class: Vision Difficulty

| Age Bracket | Male | Female |
| Under 5 Years | 42 (0.2%) | 59 (0.3%) |
| 5 to 17 Years | 709 (1.3%) | 1,023 (1.8%) |
| 18 to 34 Years | 1,694 (2.2%) | 1,908 (2.3%) |
| 35 to 64 Years | 4,941 (4.6%) | 5,843 (4.9%) |
| 65 to 74 Years | 2,227 (9.3%) | 2,261 (7.4%) |
| 75 Years and over | 1,560 (11.9%) | 2,692 (12.1%) |
Disability Class: Cognitive Difficulty
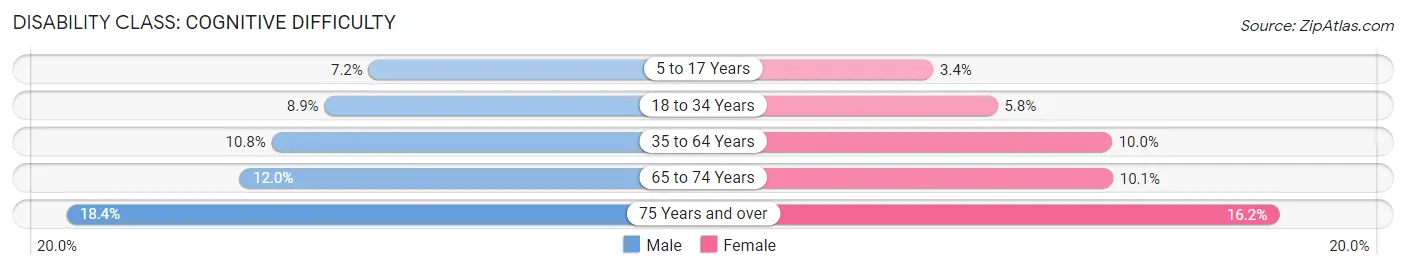
| Age Bracket | Male | Female |
| 5 to 17 Years | 4,083 (7.2%) | 1,904 (3.4%) |
| 18 to 34 Years | 6,796 (8.9%) | 4,826 (5.8%) |
| 35 to 64 Years | 11,534 (10.8%) | 11,877 (10.0%) |
| 65 to 74 Years | 2,872 (12.0%) | 3,071 (10.1%) |
| 75 Years and over | 2,413 (18.4%) | 3,599 (16.2%) |
Disability Class: Ambulatory Difficulty
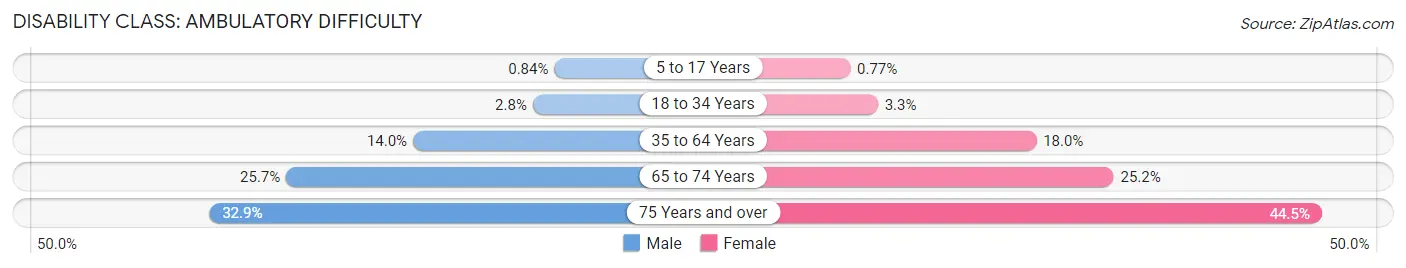
| Age Bracket | Male | Female |
| 5 to 17 Years | 476 (0.8%) | 432 (0.8%) |
| 18 to 34 Years | 2,179 (2.8%) | 2,778 (3.3%) |
| 35 to 64 Years | 14,868 (14.0%) | 21,393 (18.0%) |
| 65 to 74 Years | 6,159 (25.7%) | 7,697 (25.2%) |
| 75 Years and over | 4,302 (32.9%) | 9,876 (44.5%) |
Disability Class: Self-Care Difficulty
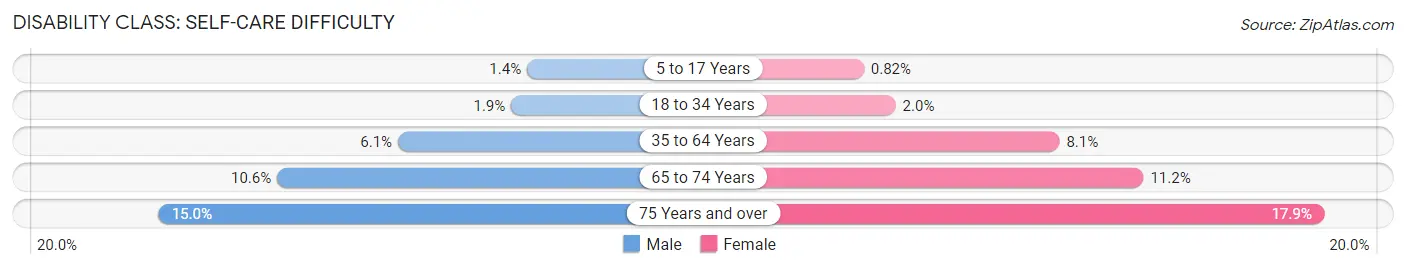
| Age Bracket | Male | Female |
| 5 to 17 Years | 761 (1.3%) | 461 (0.8%) |
| 18 to 34 Years | 1,487 (1.9%) | 1,667 (2.0%) |
| 35 to 64 Years | 6,539 (6.1%) | 9,583 (8.1%) |
| 65 to 74 Years | 2,545 (10.6%) | 3,417 (11.2%) |
| 75 Years and over | 1,966 (15.0%) | 3,967 (17.9%) |
Technology Access in Detroit
Computing Device Access in Detroit
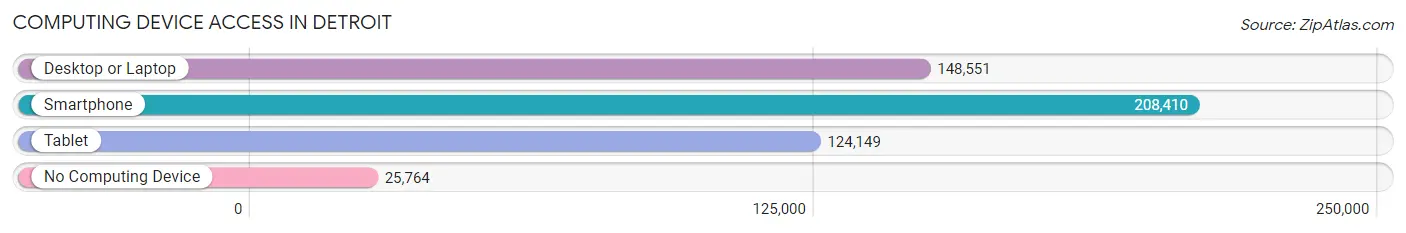
| Device Type | # Households | % Households |
| Desktop or Laptop | 148,551 | 59.5% |
| Smartphone | 208,410 | 83.5% |
| Tablet | 124,149 | 49.8% |
| No Computing Device | 25,764 | 10.3% |
| Total | 249,518 | 100.0% |
Internet Access in Detroit
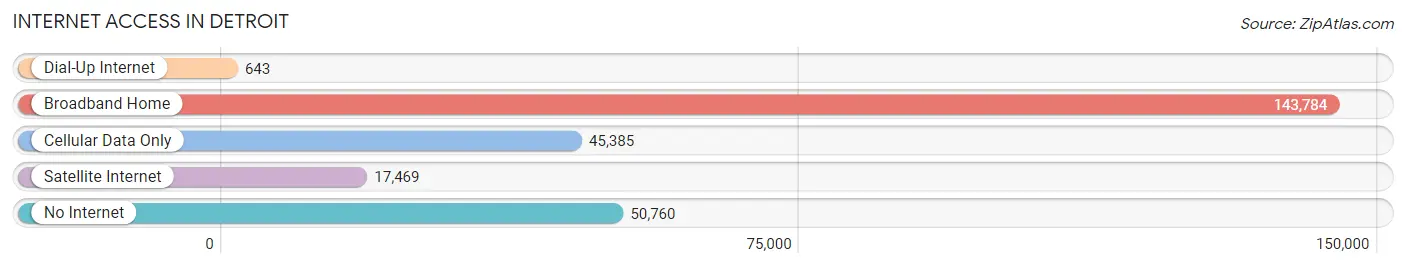
| Internet Type | # Households | % Households |
| Dial-Up Internet | 643 | 0.3% |
| Broadband Home | 143,784 | 57.6% |
| Cellular Data Only | 45,385 | 18.2% |
| Satellite Internet | 17,469 | 7.0% |
| No Internet | 50,760 | 20.3% |
| Total | 249,518 | 100.0% |
Detroit Summary
Detroit, Michigan is a major city located in the Midwestern United States. It is the largest city in the state of Michigan and the second-largest city in the Midwest, behind Chicago. Detroit is located on the Detroit River, which connects it to the Canadian city of Windsor, Ontario. Detroit is a major port city and is home to the Detroit-Windsor Tunnel, the only underwater international border crossing in North America.
History
The area that is now Detroit was first settled by the French in 1701, when Antoine de la Mothe Cadillac founded the city of Fort Pontchartrain du Detroit. The city was captured by the British in 1760 during the French and Indian War, and was ceded to the United States in 1783 after the American Revolution. Detroit was incorporated as a city in 1806, and it quickly became an important center of trade and industry.
In the 19th century, Detroit was a major hub of the Underground Railroad, a network of secret routes and safe houses used by African-American slaves to escape to freedom in the northern United States and Canada. During the American Civil War, Detroit was a major center of the Union war effort, and it was the site of the first meeting of the Republican Party in 1854.
In the 20th century, Detroit became a major center of the automotive industry, with the city becoming home to the “Big Three” automakers: Ford, General Motors, and Chrysler. Detroit was also a major center of the music industry, with Motown Records becoming one of the most successful record labels in the world.
Geography
Detroit is located in southeastern Michigan, on the Detroit River, which connects it to the Canadian city of Windsor, Ontario. The city is situated on the Detroit Plateau, a flat plain that rises from the river and is surrounded by hills and bluffs. Detroit covers an area of 138.8 square miles, and it is the largest city in Michigan.
The city is divided into several distinct neighborhoods, including Downtown, Midtown, Corktown, and the East Side. Detroit is also home to several parks and green spaces, including Belle Isle Park, the Detroit RiverWalk, and the Detroit Zoo.
Economy
Detroit is a major center of industry and commerce. The city is home to the “Big Three” automakers: Ford, General Motors, and Chrysler. Detroit is also a major center of the music industry, with Motown Records becoming one of the most successful record labels in the world.
In addition to the automotive and music industries, Detroit is also home to a number of other major industries, including finance, healthcare, and technology. The city is also home to several major universities, including the University of Michigan, Wayne State University, and the University of Detroit Mercy.
Demographics
As of the 2010 census, Detroit had a population of 713,777. The city is racially diverse, with the largest racial groups being African-American (82.7%), White (10.6%), and Hispanic or Latino (3.7%). The city is also home to a large number of immigrants, with the largest immigrant groups being from Mexico (14.3%), India (2.2%), and Iraq (1.2%).
Detroit is a major center of culture and the arts, with a number of museums, galleries, and theaters. The city is also home to several professional sports teams, including the Detroit Lions (NFL), Detroit Tigers (MLB), Detroit Red Wings (NHL), and Detroit Pistons (NBA).
Common Questions
What is Per Capita Income in Detroit?
Per Capita income in Detroit is $22,861.
What is the Median Family Income in Detroit?
Median Family Income in Detroit is $46,424.
What is the Median Household income in Detroit?
Median Household Income in Detroit is $37,761.
What is Income or Wage Gap in Detroit?
Income or Wage Gap in Detroit is 12.8%.
Women in Detroit earn 87.2 cents for every dollar earned by a man.
What is Family Income Deficit in Detroit?
Family Income Deficit in Detroit is $12,695.
Families that are below poverty line in Detroit earn $12,695 less on average than the poverty threshold level.
What is Inequality or Gini Index in Detroit?
Inequality or Gini Index in Detroit is 0.51.
What is the Total Population of Detroit?
Total Population of Detroit is 636,787.
What is the Total Male Population of Detroit?
Total Male Population of Detroit is 302,874.
What is the Total Female Population of Detroit?
Total Female Population of Detroit is 333,913.
What is the Ratio of Males per 100 Females in Detroit?
There are 90.70 Males per 100 Females in Detroit.
What is the Ratio of Females per 100 Males in Detroit?
There are 110.25 Females per 100 Males in Detroit.
What is the Median Population Age in Detroit?
Median Population Age in Detroit is 35.0 Years.
What is the Average Family Size in Detroit
Average Family Size in Detroit is 3.6 People.
What is the Average Household Size in Detroit
Average Household Size in Detroit is 2.5 People.
How Large is the Labor Force in Detroit?
There are 272,226 People in the Labor Forcein in Detroit.
What is the Percentage of People in the Labor Force in Detroit?
54.8% of People are in the Labor Force in Detroit.
What is the Unemployment Rate in Detroit?
Unemployment Rate in Detroit is 14.7%.