Cities with the Largest Lebanese Community in Kansas
RELATED REPORTS & OPTIONS
Lebanese
Kansas
Compare Cities
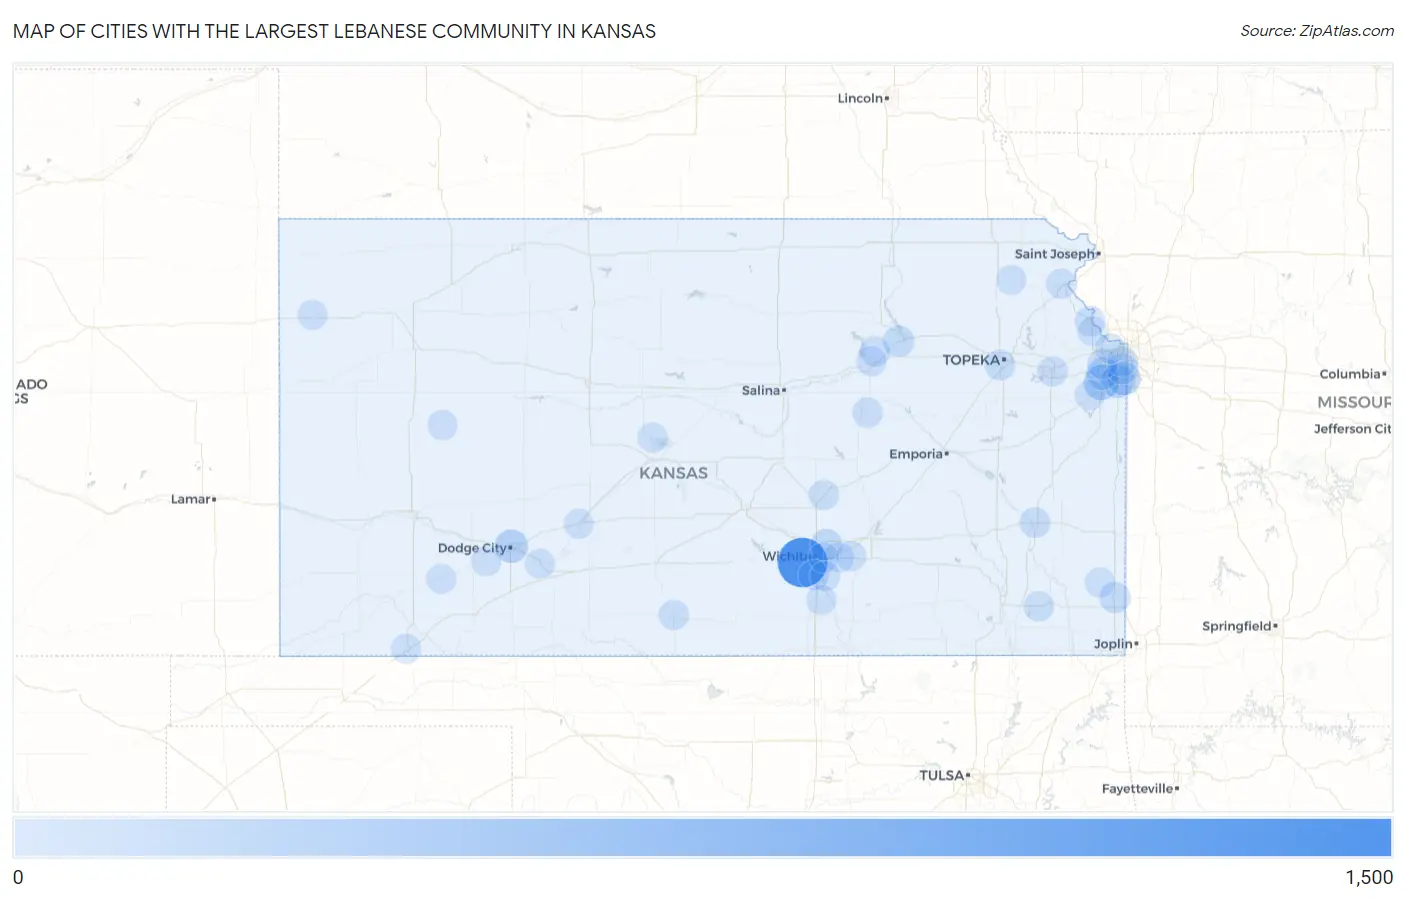
Map of Cities with the Largest Lebanese Community in Kansas
0
1,500
Cities with the Largest Lebanese Community in Kansas
| City | Lebanese | vs State | vs National | |
| 1. | Wichita | 1,339 | 3,396(39.43%)#1 | 546,795(0.24%)#27 |
| 2. | Olathe | 324 | 3,396(9.54%)#2 | 546,795(0.06%)#217 |
| 3. | Overland Park | 221 | 3,396(6.51%)#3 | 546,795(0.04%)#362 |
| 4. | Dodge City | 213 | 3,396(6.27%)#4 | 546,795(0.04%)#374 |
| 5. | Leawood | 201 | 3,396(5.92%)#5 | 546,795(0.04%)#396 |
| 6. | Lenexa | 148 | 3,396(4.36%)#6 | 546,795(0.03%)#567 |
| 7. | Bel Aire | 118 | 3,396(3.47%)#7 | 546,795(0.02%)#727 |
| 8. | Manhattan | 86 | 3,396(2.53%)#8 | 546,795(0.02%)#1,004 |
| 9. | Prairie Village | 73 | 3,396(2.15%)#9 | 546,795(0.01%)#1,151 |
| 10. | Pittsburg | 70 | 3,396(2.06%)#10 | 546,795(0.01%)#1,192 |
| 11. | Topeka | 42 | 3,396(1.24%)#11 | 546,795(0.01%)#1,782 |
| 12. | Iola | 35 | 3,396(1.03%)#12 | 546,795(0.01%)#2,022 |
| 13. | Lawrence | 30 | 3,396(0.88%)#13 | 546,795(0.01%)#2,173 |
| 14. | Fort Riley | 26 | 3,396(0.77%)#14 | 546,795(0.00%)#2,384 |
| 15. | Andover | 25 | 3,396(0.74%)#15 | 546,795(0.00%)#2,426 |
| 16. | Herington | 25 | 3,396(0.74%)#16 | 546,795(0.00%)#2,446 |
| 17. | Haysville | 22 | 3,396(0.65%)#17 | 546,795(0.00%)#2,610 |
| 18. | Shawnee | 21 | 3,396(0.62%)#18 | 546,795(0.00%)#2,645 |
| 19. | Atchison | 21 | 3,396(0.62%)#19 | 546,795(0.00%)#2,669 |
| 20. | Leavenworth | 19 | 3,396(0.56%)#20 | 546,795(0.00%)#2,795 |
| 21. | Roeland Park | 15 | 3,396(0.44%)#21 | 546,795(0.00%)#3,149 |
| 22. | Medicine Lodge | 14 | 3,396(0.41%)#22 | 546,795(0.00%)#3,264 |
| 23. | Parsons | 13 | 3,396(0.38%)#23 | 546,795(0.00%)#3,310 |
| 24. | Walton | 13 | 3,396(0.38%)#24 | 546,795(0.00%)#3,370 |
| 25. | Eastborough | 12 | 3,396(0.35%)#25 | 546,795(0.00%)#3,486 |
| 26. | Girard | 11 | 3,396(0.32%)#26 | 546,795(0.00%)#3,568 |
| 27. | Belle Plaine | 11 | 3,396(0.32%)#27 | 546,795(0.00%)#3,586 |
| 28. | Junction City | 10 | 3,396(0.29%)#28 | 546,795(0.00%)#3,626 |
| 29. | Derby | 9 | 3,396(0.27%)#29 | 546,795(0.00%)#3,766 |
| 30. | Gardner | 9 | 3,396(0.27%)#30 | 546,795(0.00%)#3,770 |
| 31. | Augusta | 9 | 3,396(0.27%)#31 | 546,795(0.00%)#3,804 |
| 32. | Lansing | 8 | 3,396(0.24%)#32 | 546,795(0.00%)#3,928 |
| 33. | Hoisington | 7 | 3,396(0.21%)#33 | 546,795(0.00%)#4,150 |
| 34. | Liberal | 5 | 3,396(0.15%)#34 | 546,795(0.00%)#4,361 |
| 35. | Kansas City | 4 | 3,396(0.12%)#35 | 546,795(0.00%)#4,489 |
| 36. | Goodland | 3 | 3,396(0.09%)#36 | 546,795(0.00%)#4,664 |
| 37. | Healy | 2 | 3,396(0.06%)#37 | 546,795(0.00%)#4,947 |
| 38. | Whiting | 2 | 3,396(0.06%)#38 | 546,795(0.00%)#4,956 |
| 39. | Kinsley | 1 | 3,396(0.03%)#39 | 546,795(0.00%)#4,993 |
| 40. | Copeland | 1 | 3,396(0.03%)#40 | 546,795(0.00%)#5,032 |
| 41. | Ford | 1 | 3,396(0.03%)#41 | 546,795(0.00%)#5,065 |
| 42. | Ensign | 1 | 3,396(0.03%)#42 | 546,795(0.00%)#5,079 |
Common Questions
What are the Top 10 Cities with the Largest Lebanese Community in Kansas?
Top 10 Cities with the Largest Lebanese Community in Kansas are:
#1
1,339
#2
324
#3
221
#4
213
#5
201
#6
148
#7
118
#8
86
#9
73
#10
70
What city has the Largest Lebanese Community in Kansas?
Wichita has the Largest Lebanese Community in Kansas with 1,339.
What is the Total Lebanese Population in the State of Kansas?
Total Lebanese Population in Kansas is 3,396.
What is the Total Lebanese Population in the United States?
Total Lebanese Population in the United States is 546,795.