Charleston, WV Map & Demographics
Charleston Map
Charleston Overview
$44,639
PER CAPITA INCOME
$87,108
AVG FAMILY INCOME
$58,902
AVG HOUSEHOLD INCOME
8.1%
WAGE / INCOME GAP [ % ]
91.9¢/ $1
WAGE / INCOME GAP [ $ ]
$12,939
FAMILY INCOME DEFICIT
0.56
INEQUALITY / GINI INDEX
48,415
TOTAL POPULATION
23,862
MALE POPULATION
24,553
FEMALE POPULATION
97.19
MALES / 100 FEMALES
102.90
FEMALES / 100 MALES
42.2
MEDIAN AGE
2.9
AVG FAMILY SIZE
2.1
AVG HOUSEHOLD SIZE
23,264
LABOR FORCE [ PEOPLE ]
57.0%
PERCENT IN LABOR FORCE
5.8%
UNEMPLOYMENT RATE
Income in Charleston
Income Overview in Charleston
Per Capita Income in Charleston is $44,639, while median incomes of families and households are $87,108 and $58,902 respectively.
| Characteristic | Number | Measure |
| Per Capita Income | 48,415 | $44,639 |
| Median Family Income | 11,599 | $87,108 |
| Mean Family Income | 11,599 | $130,241 |
| Median Household Income | 21,746 | $58,902 |
| Mean Household Income | 21,746 | $96,887 |
| Income Deficit | 11,599 | $12,939 |
| Wage / Income Gap (%) | 48,415 | 8.05% |
| Wage / Income Gap ($) | 48,415 | 91.95¢ per $1 |
| Gini / Inequality Index | 48,415 | 0.56 |
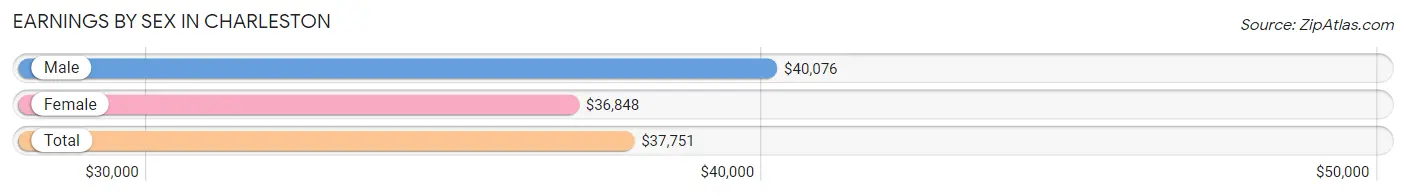
Earnings by Sex in Charleston
Average Earnings in Charleston are $37,751, $40,076 for men and $36,848 for women, a difference of 8.1%.
| Sex | Number | Average Earnings |
| Male | 12,259 (49.9%) | $40,076 |
| Female | 12,320 (50.1%) | $36,848 |
| Total | 24,579 (100.0%) | $37,751 |
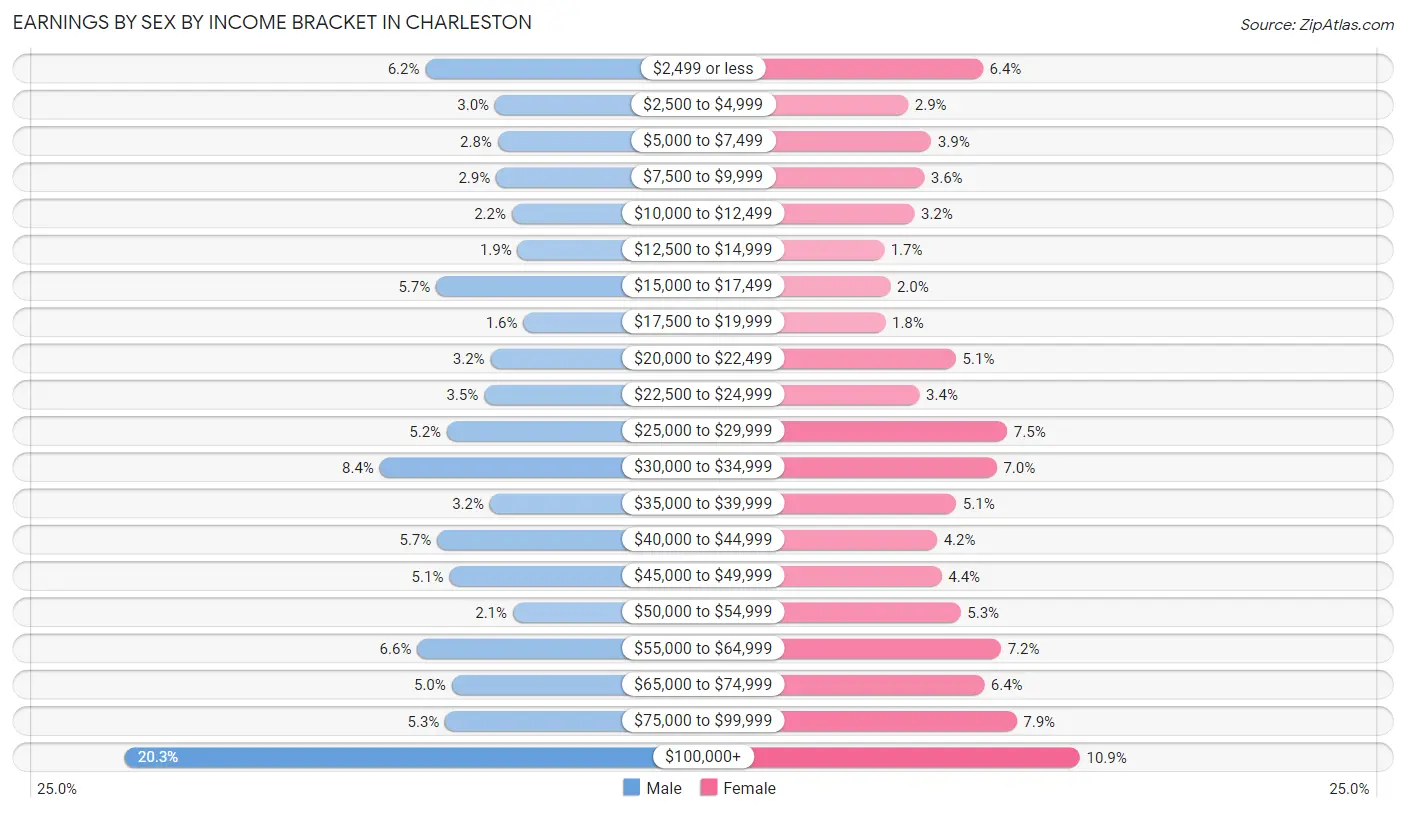
Earnings by Sex by Income Bracket in Charleston
The most common earnings brackets in Charleston are $100,000+ for men (2,488 | 20.3%) and $100,000+ for women (1,343 | 10.9%).
| Income | Male | Female |
| $2,499 or less | 764 (6.2%) | 783 (6.4%) |
| $2,500 to $4,999 | 364 (3.0%) | 352 (2.9%) |
| $5,000 to $7,499 | 348 (2.8%) | 485 (3.9%) |
| $7,500 to $9,999 | 358 (2.9%) | 445 (3.6%) |
| $10,000 to $12,499 | 267 (2.2%) | 388 (3.2%) |
| $12,500 to $14,999 | 234 (1.9%) | 213 (1.7%) |
| $15,000 to $17,499 | 703 (5.7%) | 249 (2.0%) |
| $17,500 to $19,999 | 201 (1.6%) | 221 (1.8%) |
| $20,000 to $22,499 | 390 (3.2%) | 628 (5.1%) |
| $22,500 to $24,999 | 427 (3.5%) | 418 (3.4%) |
| $25,000 to $29,999 | 640 (5.2%) | 924 (7.5%) |
| $30,000 to $34,999 | 1,026 (8.4%) | 864 (7.0%) |
| $35,000 to $39,999 | 393 (3.2%) | 630 (5.1%) |
| $40,000 to $44,999 | 696 (5.7%) | 519 (4.2%) |
| $45,000 to $49,999 | 626 (5.1%) | 546 (4.4%) |
| $50,000 to $54,999 | 261 (2.1%) | 655 (5.3%) |
| $55,000 to $64,999 | 810 (6.6%) | 888 (7.2%) |
| $65,000 to $74,999 | 613 (5.0%) | 791 (6.4%) |
| $75,000 to $99,999 | 650 (5.3%) | 978 (7.9%) |
| $100,000+ | 2,488 (20.3%) | 1,343 (10.9%) |
| Total | 12,259 (100.0%) | 12,320 (100.0%) |
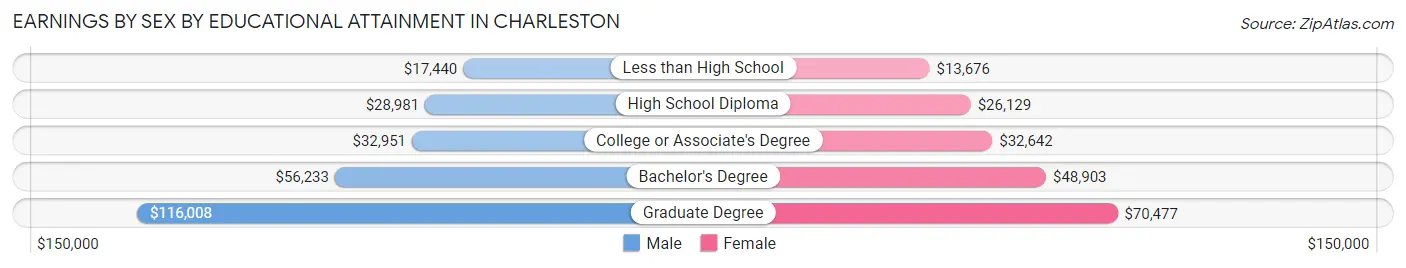
Earnings by Sex by Educational Attainment in Charleston
Average earnings in Charleston are $45,469 for men and $42,224 for women, a difference of 7.1%. Men with an educational attainment of graduate degree enjoy the highest average annual earnings of $116,008, while those with less than high school education earn the least with $17,440. Women with an educational attainment of graduate degree earn the most with the average annual earnings of $70,477, while those with less than high school education have the smallest earnings of $13,676.
| Educational Attainment | Male Income | Female Income |
| Less than High School | $17,440 | $13,676 |
| High School Diploma | $28,981 | $26,129 |
| College or Associate's Degree | $32,951 | $32,642 |
| Bachelor's Degree | $56,233 | $48,903 |
| Graduate Degree | $116,008 | $70,477 |
| Total | $45,469 | $42,224 |
Family Income in Charleston
Family Income Brackets in Charleston
According to the Charleston family income data, there are 2,007 families falling into the $100,000 to $149,999 income range, which is the most common income bracket and makes up 17.3% of all families. Conversely, the $10,000 to $14,999 income bracket is the least frequent group with only 325 families (2.8%) belonging to this category.
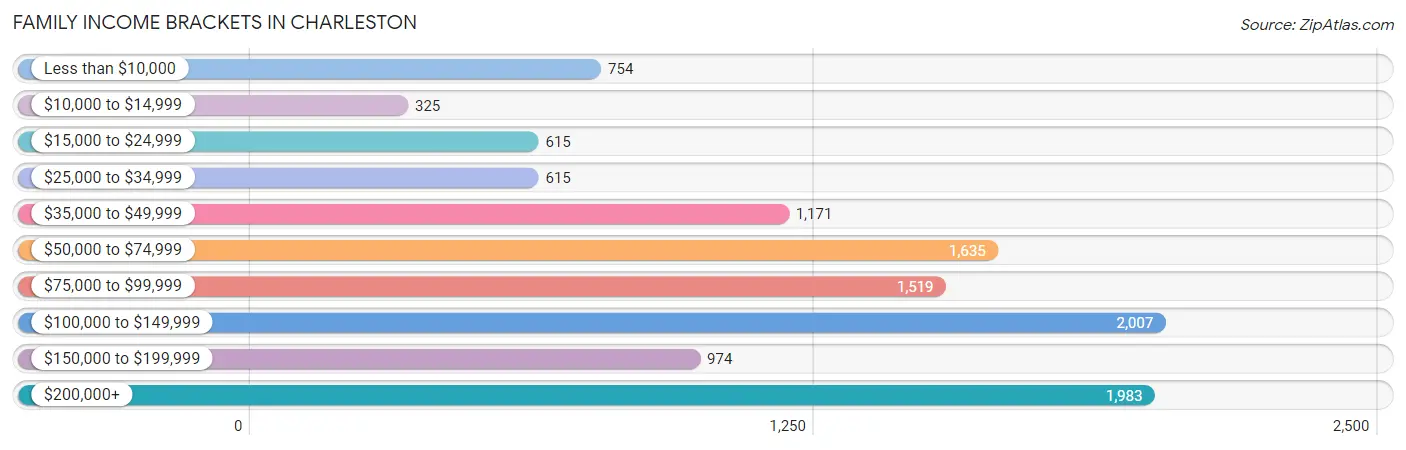
| Income Bracket | # Families | % Families |
| Less than $10,000 | 754 | 6.5% |
| $10,000 to $14,999 | 325 | 2.8% |
| $15,000 to $24,999 | 615 | 5.3% |
| $25,000 to $34,999 | 615 | 5.3% |
| $35,000 to $49,999 | 1,171 | 10.1% |
| $50,000 to $74,999 | 1,635 | 14.1% |
| $75,000 to $99,999 | 1,519 | 13.1% |
| $100,000 to $149,999 | 2,007 | 17.3% |
| $150,000 to $199,999 | 974 | 8.4% |
| $200,000+ | 1,983 | 17.1% |
Family Income by Famaliy Size in Charleston
5-person families (360 | 3.1%) account for the highest median family income in Charleston with $126,591 per family, while 2-person families (6,971 | 60.1%) have the highest median income of $40,768 per family member.
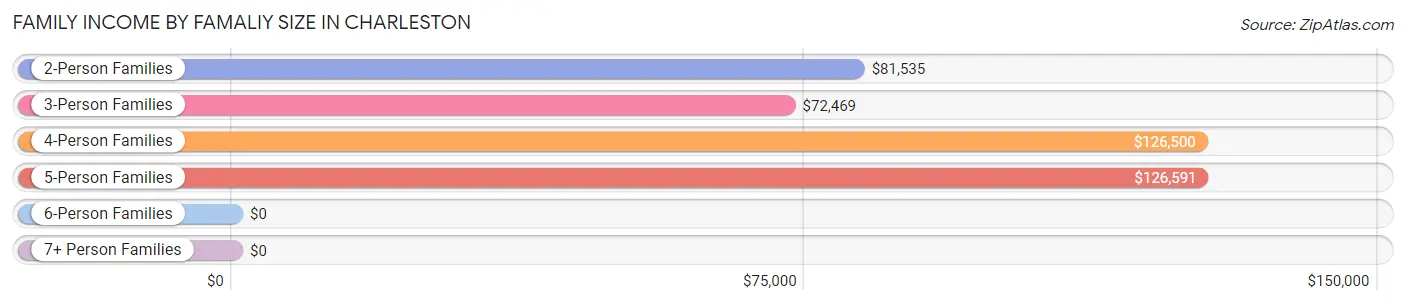
| Income Bracket | # Families | Median Income |
| 2-Person Families | 6,971 (60.1%) | $81,535 |
| 3-Person Families | 2,585 (22.3%) | $72,469 |
| 4-Person Families | 1,398 (12.0%) | $126,500 |
| 5-Person Families | 360 (3.1%) | $126,591 |
| 6-Person Families | 122 (1.1%) | $0 |
| 7+ Person Families | 163 (1.4%) | $0 |
| Total | 11,599 (100.0%) | $87,108 |
Family Income by Number of Earners in Charleston
The median family income in Charleston is $87,108, with families comprising 3+ earners (870) having the highest median family income of $156,286, while families with no earners (2,449) have the lowest median family income of $54,591, accounting for 7.5% and 21.1% of families, respectively.
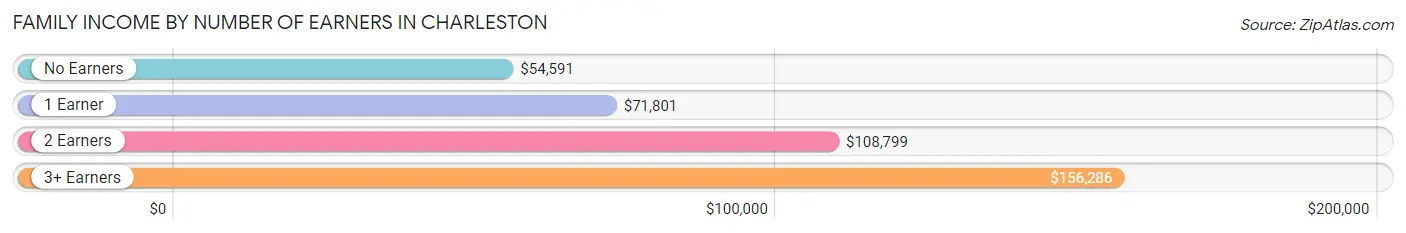
| Number of Earners | # Families | Median Income |
| No Earners | 2,449 (21.1%) | $54,591 |
| 1 Earner | 3,815 (32.9%) | $71,801 |
| 2 Earners | 4,465 (38.5%) | $108,799 |
| 3+ Earners | 870 (7.5%) | $156,286 |
| Total | 11,599 (100.0%) | $87,108 |
Household Income in Charleston
Household Income Brackets in Charleston
With 3,371 households falling in the category, the $50,000 to $74,999 income range is the most frequent in Charleston, accounting for 15.5% of all households. In contrast, only 1,087 households (5.0%) fall into the $150,000 to $199,999 income bracket, making it the least populous group.
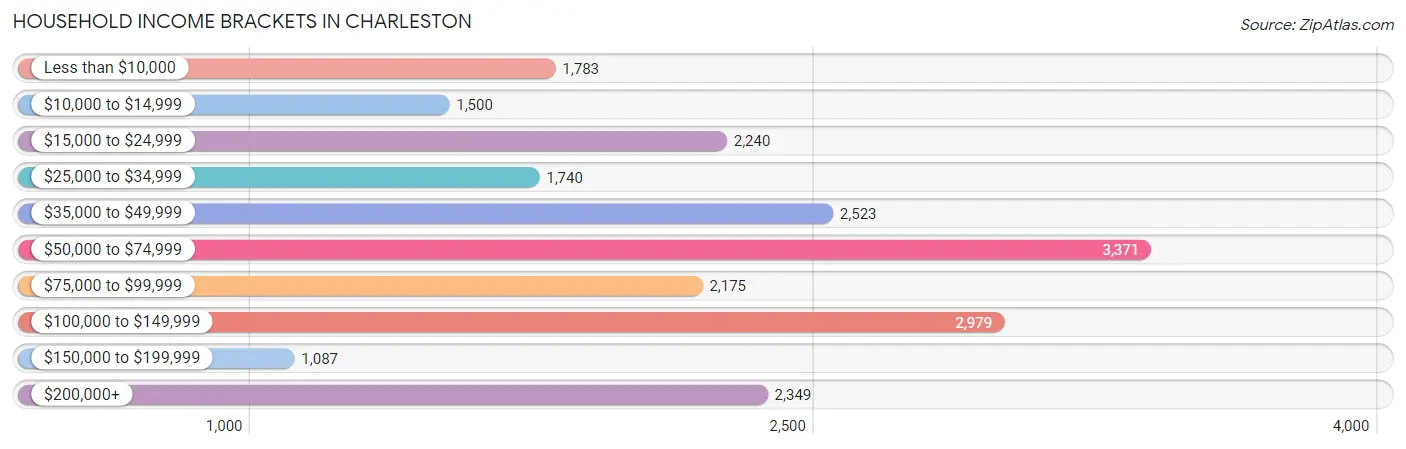
| Income Bracket | # Households | % Households |
| Less than $10,000 | 1,783 | 8.2% |
| $10,000 to $14,999 | 1,500 | 6.9% |
| $15,000 to $24,999 | 2,240 | 10.3% |
| $25,000 to $34,999 | 1,740 | 8.0% |
| $35,000 to $49,999 | 2,523 | 11.6% |
| $50,000 to $74,999 | 3,371 | 15.5% |
| $75,000 to $99,999 | 2,175 | 10.0% |
| $100,000 to $149,999 | 2,979 | 13.7% |
| $150,000 to $199,999 | 1,087 | 5.0% |
| $200,000+ | 2,349 | 10.8% |
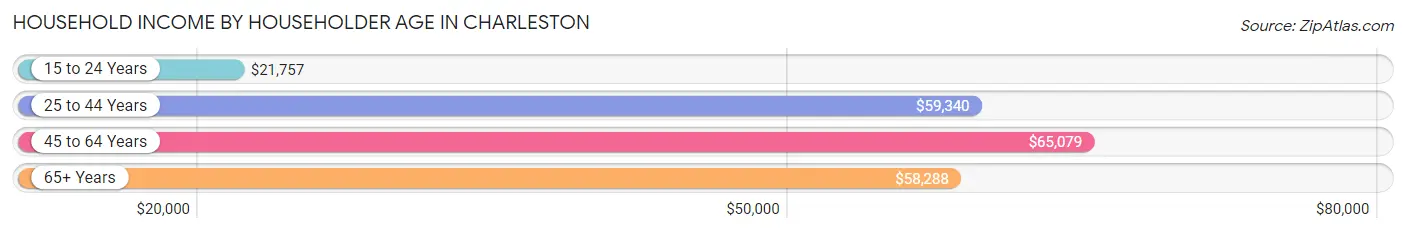
Household Income by Householder Age in Charleston
The median household income in Charleston is $58,902, with the highest median household income of $65,079 found in the 45 to 64 years age bracket for the primary householder. A total of 8,165 households (37.6%) fall into this category. Meanwhile, the 15 to 24 years age bracket for the primary householder has the lowest median household income of $21,757, with 754 households (3.5%) in this group.
| Income Bracket | # Households | Median Income |
| 15 to 24 Years | 754 (3.5%) | $21,757 |
| 25 to 44 Years | 6,326 (29.1%) | $59,340 |
| 45 to 64 Years | 8,165 (37.6%) | $65,079 |
| 65+ Years | 6,501 (29.9%) | $58,288 |
| Total | 21,746 (100.0%) | $58,902 |
Poverty in Charleston
Income Below Poverty by Sex and Age in Charleston
With 17.2% poverty level for males and 16.9% for females among the residents of Charleston, 5 year old males and under 5 year old females are the most vulnerable to poverty, with 110 males (40.3%) and 270 females (22.2%) in their respective age groups living below the poverty level.
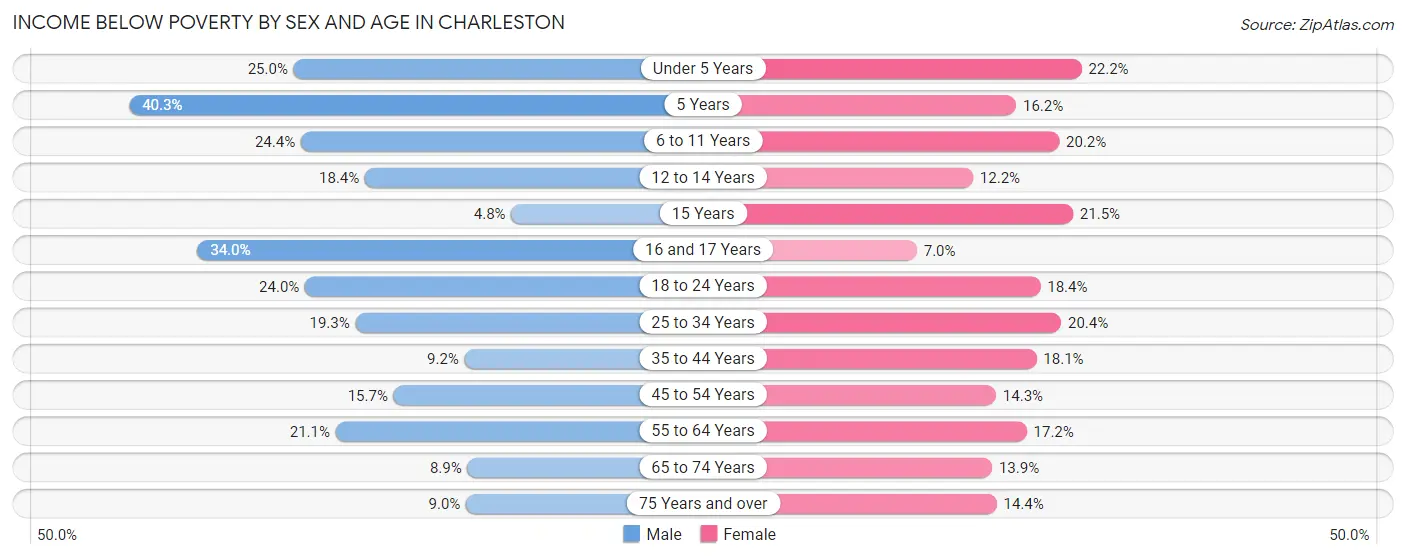
| Age Bracket | Male | Female |
| Under 5 Years | 261 (25.0%) | 270 (22.2%) |
| 5 Years | 110 (40.3%) | 27 (16.2%) |
| 6 to 11 Years | 387 (24.3%) | 268 (20.2%) |
| 12 to 14 Years | 136 (18.4%) | 60 (12.2%) |
| 15 Years | 16 (4.8%) | 62 (21.4%) |
| 16 and 17 Years | 196 (34.0%) | 45 (7.0%) |
| 18 to 24 Years | 459 (24.0%) | 273 (18.4%) |
| 25 to 34 Years | 502 (19.3%) | 735 (20.3%) |
| 35 to 44 Years | 275 (9.2%) | 528 (18.1%) |
| 45 to 54 Years | 451 (15.7%) | 423 (14.3%) |
| 55 to 64 Years | 718 (21.1%) | 620 (17.2%) |
| 65 to 74 Years | 242 (8.9%) | 389 (13.9%) |
| 75 Years and over | 150 (9.0%) | 343 (14.4%) |
| Total | 3,903 (17.2%) | 4,043 (16.9%) |
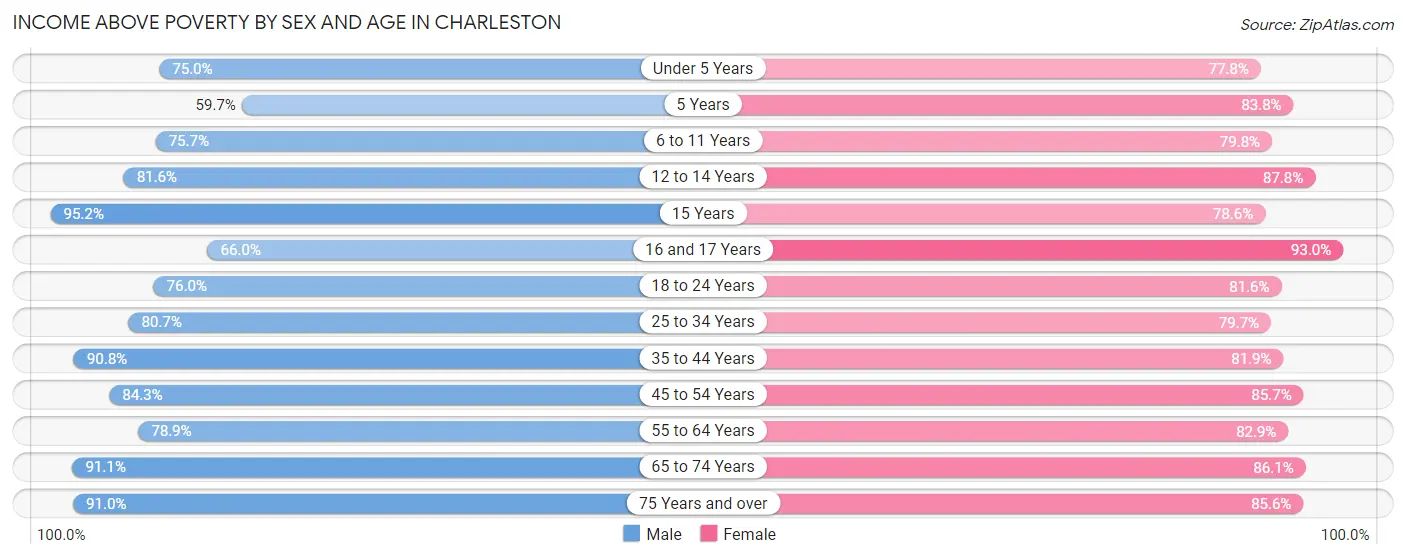
Income Above Poverty by Sex and Age in Charleston
According to the poverty statistics in Charleston, males aged 15 years and females aged 16 and 17 years are the age groups that are most secure financially, with 95.2% of males and 93.0% of females in these age groups living above the poverty line.
| Age Bracket | Male | Female |
| Under 5 Years | 782 (75.0%) | 944 (77.8%) |
| 5 Years | 163 (59.7%) | 140 (83.8%) |
| 6 to 11 Years | 1,202 (75.6%) | 1,061 (79.8%) |
| 12 to 14 Years | 603 (81.6%) | 433 (87.8%) |
| 15 Years | 316 (95.2%) | 227 (78.5%) |
| 16 and 17 Years | 381 (66.0%) | 602 (93.0%) |
| 18 to 24 Years | 1,457 (76.0%) | 1,209 (81.6%) |
| 25 to 34 Years | 2,101 (80.7%) | 2,877 (79.6%) |
| 35 to 44 Years | 2,728 (90.8%) | 2,395 (81.9%) |
| 45 to 54 Years | 2,414 (84.3%) | 2,535 (85.7%) |
| 55 to 64 Years | 2,682 (78.9%) | 2,996 (82.9%) |
| 65 to 74 Years | 2,481 (91.1%) | 2,402 (86.1%) |
| 75 Years and over | 1,513 (91.0%) | 2,045 (85.6%) |
| Total | 18,823 (82.8%) | 19,866 (83.1%) |
Income Below Poverty Among Married-Couple Families in Charleston
The poverty statistics for married-couple families in Charleston show that 5.3% or 432 of the total 8,127 families live below the poverty line. Families with 5 or more children have the highest poverty rate of 47.3%, comprising of 26 families. On the other hand, families with no children have the lowest poverty rate of 4.5%, which includes 249 families.
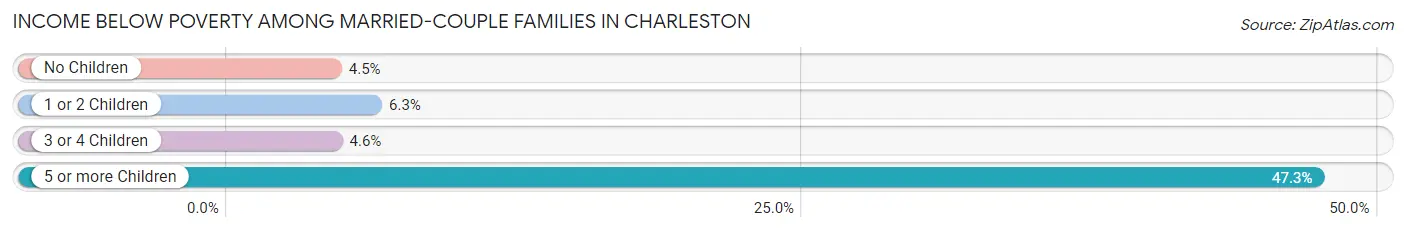
| Children | Above Poverty | Below Poverty |
| No Children | 5,259 (95.5%) | 249 (4.5%) |
| 1 or 2 Children | 2,197 (93.7%) | 147 (6.3%) |
| 3 or 4 Children | 210 (95.5%) | 10 (4.5%) |
| 5 or more Children | 29 (52.7%) | 26 (47.3%) |
| Total | 7,695 (94.7%) | 432 (5.3%) |
Income Below Poverty Among Single-Parent Households in Charleston
According to the poverty data in Charleston, 13.2% or 110 single-father households and 32.0% or 844 single-mother households are living below the poverty line. Among single-father households, those with no children have the highest poverty rate, with 83 households (21.2%) experiencing poverty. Likewise, among single-mother households, those with 5 or more children have the highest poverty rate, with 29 households (63.0%) falling below the poverty line.
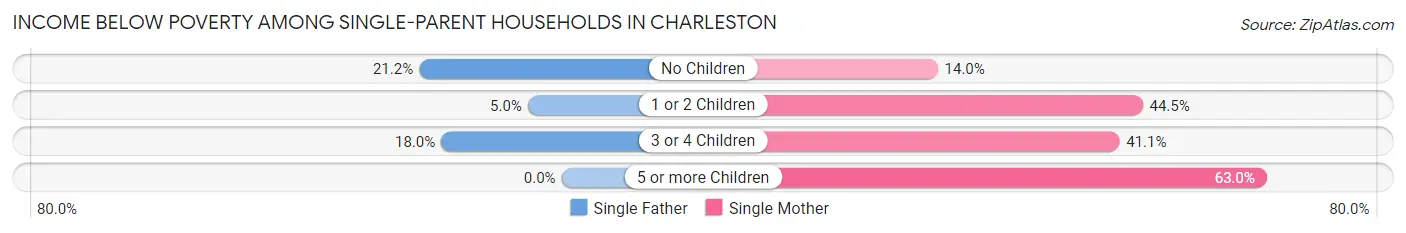
| Children | Single Father | Single Mother |
| No Children | 83 (21.2%) | 154 (14.0%) |
| 1 or 2 Children | 20 (5.0%) | 615 (44.5%) |
| 3 or 4 Children | 7 (17.9%) | 46 (41.1%) |
| 5 or more Children | 0 (0.0%) | 29 (63.0%) |
| Total | 110 (13.2%) | 844 (32.0%) |
Income Below Poverty Among Married-Couple vs Single-Parent Households in Charleston
The poverty data for Charleston shows that 432 of the married-couple family households (5.3%) and 954 of the single-parent households (27.5%) are living below the poverty level. Within the married-couple family households, those with 5 or more children have the highest poverty rate, with 26 households (47.3%) falling below the poverty line. Among the single-parent households, those with 5 or more children have the highest poverty rate, with 29 household (56.9%) living below poverty.
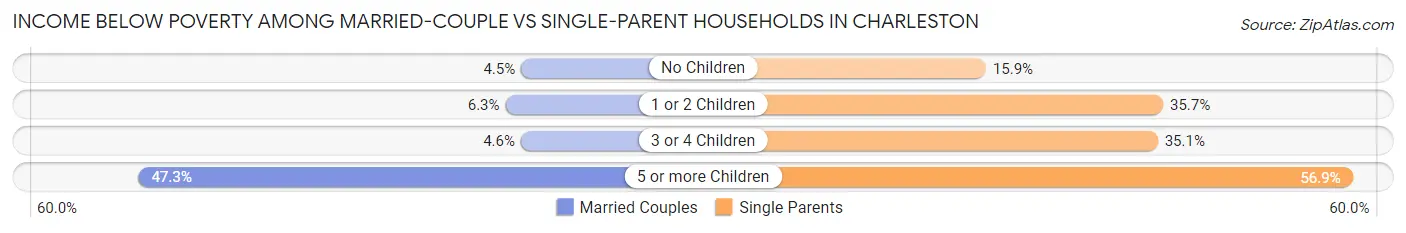
| Children | Married-Couple Families | Single-Parent Households |
| No Children | 249 (4.5%) | 237 (15.9%) |
| 1 or 2 Children | 147 (6.3%) | 635 (35.7%) |
| 3 or 4 Children | 10 (4.5%) | 53 (35.1%) |
| 5 or more Children | 26 (47.3%) | 29 (56.9%) |
| Total | 432 (5.3%) | 954 (27.5%) |
Race in Charleston
The most populous races in Charleston are White / Caucasian (37,647 | 77.8%), Black / African American (6,257 | 12.9%), and Two or more Races (3,116 | 6.4%).
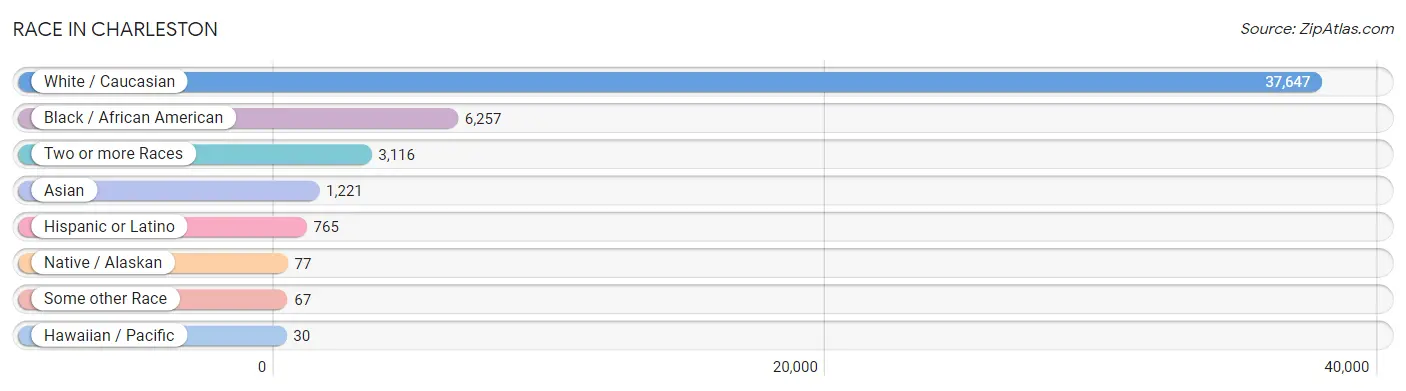
| Race | # Population | % Population |
| Asian | 1,221 | 2.5% |
| Black / African American | 6,257 | 12.9% |
| Hawaiian / Pacific | 30 | 0.1% |
| Hispanic or Latino | 765 | 1.6% |
| Native / Alaskan | 77 | 0.2% |
| White / Caucasian | 37,647 | 77.8% |
| Two or more Races | 3,116 | 6.4% |
| Some other Race | 67 | 0.1% |
| Total | 48,415 | 100.0% |
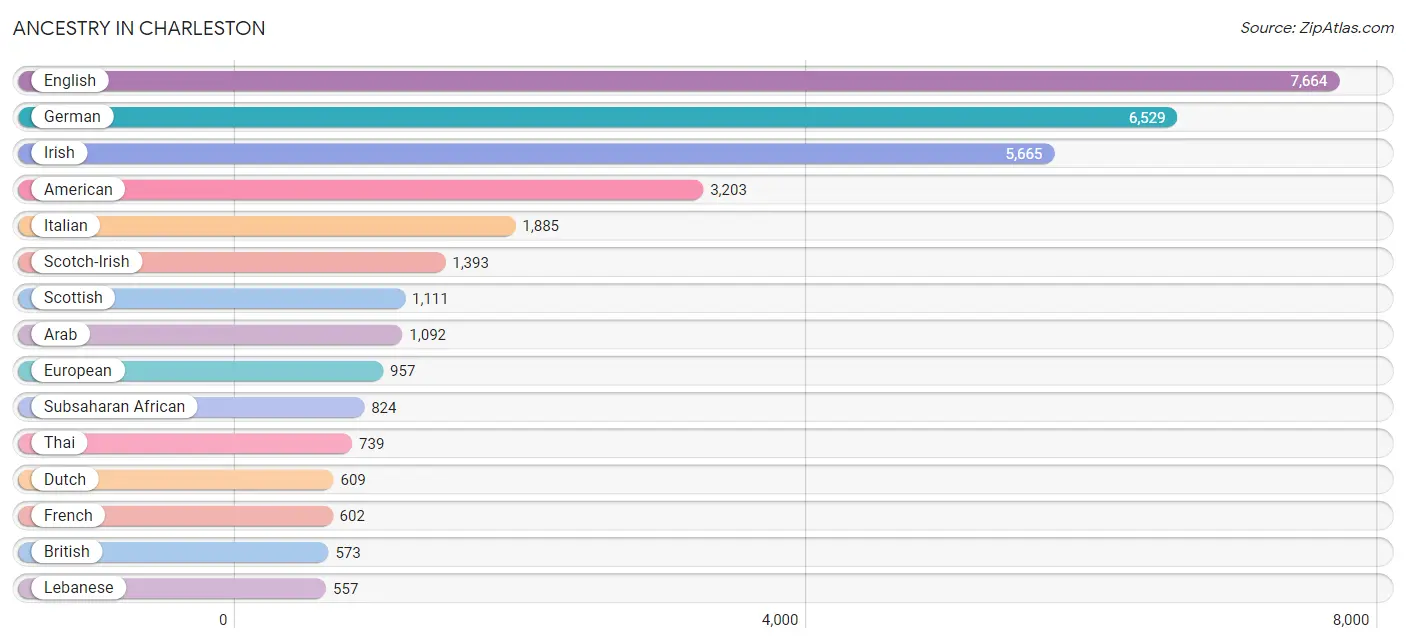
Ancestry in Charleston
The most populous ancestries reported in Charleston are English (7,664 | 15.8%), German (6,529 | 13.5%), Irish (5,665 | 11.7%), American (3,203 | 6.6%), and Italian (1,885 | 3.9%), together accounting for 51.5% of all Charleston residents.
| Ancestry | # Population | % Population |
| African | 412 | 0.9% |
| American | 3,203 | 6.6% |
| Arab | 1,092 | 2.3% |
| Argentinean | 27 | 0.1% |
| Armenian | 38 | 0.1% |
| Austrian | 45 | 0.1% |
| Belgian | 57 | 0.1% |
| Bhutanese | 43 | 0.1% |
| Blackfeet | 48 | 0.1% |
| Brazilian | 22 | 0.1% |
| British | 573 | 1.2% |
| Bulgarian | 7 | 0.0% |
| Burmese | 81 | 0.2% |
| Cajun | 10 | 0.0% |
| Canadian | 85 | 0.2% |
| Central American | 227 | 0.5% |
| Cherokee | 134 | 0.3% |
| Chippewa | 7 | 0.0% |
| Colombian | 19 | 0.0% |
| Costa Rican | 10 | 0.0% |
| Croatian | 32 | 0.1% |
| Cuban | 69 | 0.1% |
| Cypriot | 28 | 0.1% |
| Czech | 238 | 0.5% |
| Danish | 97 | 0.2% |
| Dominican | 31 | 0.1% |
| Dutch | 609 | 1.3% |
| Eastern European | 133 | 0.3% |
| Egyptian | 18 | 0.0% |
| English | 7,664 | 15.8% |
| Estonian | 16 | 0.0% |
| Ethiopian | 71 | 0.2% |
| European | 957 | 2.0% |
| Finnish | 6 | 0.0% |
| French | 602 | 1.2% |
| French American Indian | 6 | 0.0% |
| French Canadian | 40 | 0.1% |
| German | 6,529 | 13.5% |
| Ghanaian | 12 | 0.0% |
| Greek | 383 | 0.8% |
| Guatemalan | 57 | 0.1% |
| Guyanese | 124 | 0.3% |
| Haitian | 12 | 0.0% |
| Honduran | 22 | 0.1% |
| Hungarian | 266 | 0.5% |
| Indian (Asian) | 155 | 0.3% |
| Inupiat | 9 | 0.0% |
| Iranian | 81 | 0.2% |
| Irish | 5,665 | 11.7% |
| Italian | 1,885 | 3.9% |
| Jamaican | 183 | 0.4% |
| Jordanian | 33 | 0.1% |
| Korean | 275 | 0.6% |
| Lebanese | 557 | 1.1% |
| Lithuanian | 6 | 0.0% |
| Luxembourger | 10 | 0.0% |
| Mexican | 162 | 0.3% |
| Mexican American Indian | 7 | 0.0% |
| Native Hawaiian | 30 | 0.1% |
| Nigerian | 143 | 0.3% |
| Northern European | 60 | 0.1% |
| Norwegian | 244 | 0.5% |
| Pakistani | 26 | 0.1% |
| Panamanian | 126 | 0.3% |
| Pennsylvania German | 37 | 0.1% |
| Polish | 544 | 1.1% |
| Portuguese | 32 | 0.1% |
| Puerto Rican | 85 | 0.2% |
| Romanian | 65 | 0.1% |
| Russian | 87 | 0.2% |
| Salvadoran | 12 | 0.0% |
| Scandinavian | 126 | 0.3% |
| Scotch-Irish | 1,393 | 2.9% |
| Scottish | 1,111 | 2.3% |
| Sioux | 3 | 0.0% |
| Slavic | 22 | 0.1% |
| Slovak | 185 | 0.4% |
| South American | 46 | 0.1% |
| Spaniard | 11 | 0.0% |
| Spanish | 61 | 0.1% |
| Sri Lankan | 78 | 0.2% |
| Subsaharan African | 824 | 1.7% |
| Sudanese | 186 | 0.4% |
| Swedish | 278 | 0.6% |
| Swiss | 48 | 0.1% |
| Syrian | 430 | 0.9% |
| Thai | 739 | 1.5% |
| Ukrainian | 10 | 0.0% |
| Welsh | 390 | 0.8% | View All 89 Rows |
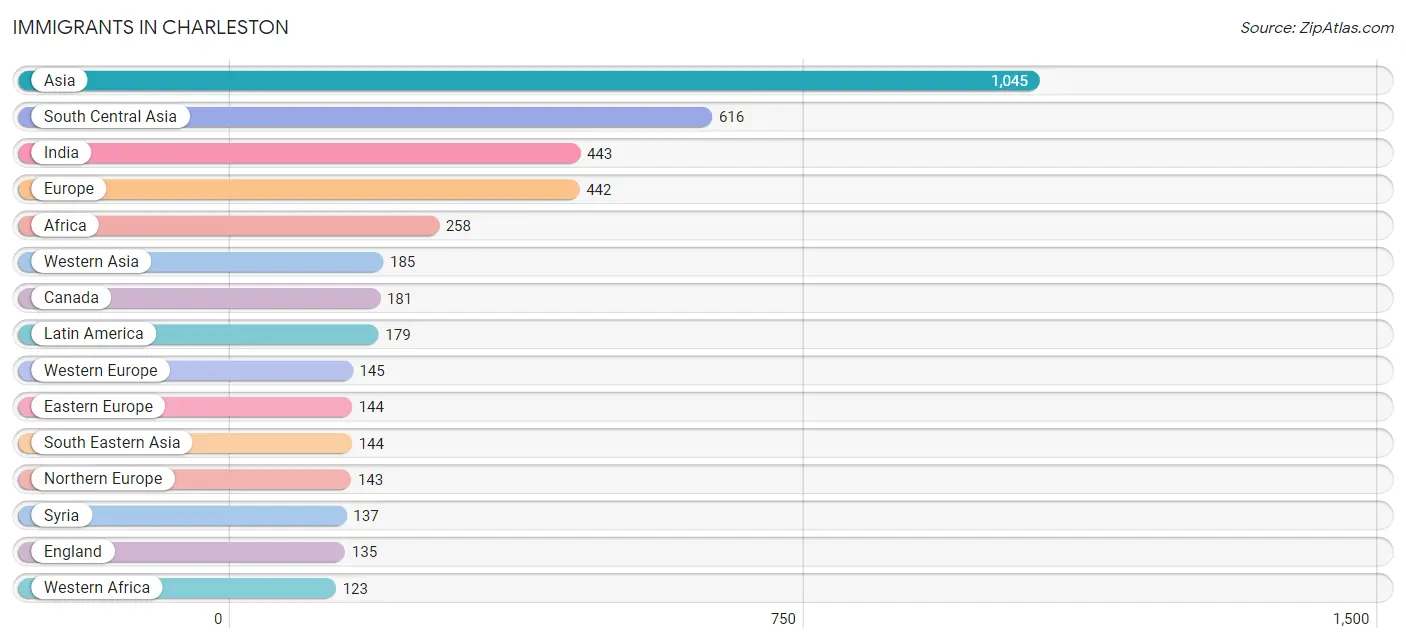
Immigrants in Charleston
The most numerous immigrant groups reported in Charleston came from Asia (1,045 | 2.2%), South Central Asia (616 | 1.3%), India (443 | 0.9%), Europe (442 | 0.9%), and Africa (258 | 0.5%), together accounting for 5.8% of all Charleston residents.
| Immigration Origin | # Population | % Population |
| Africa | 258 | 0.5% |
| Argentina | 8 | 0.0% |
| Asia | 1,045 | 2.2% |
| Australia | 11 | 0.0% |
| Bangladesh | 46 | 0.1% |
| Belarus | 97 | 0.2% |
| Bulgaria | 7 | 0.0% |
| Canada | 181 | 0.4% |
| Caribbean | 32 | 0.1% |
| Central America | 118 | 0.2% |
| China | 34 | 0.1% |
| Colombia | 10 | 0.0% |
| Croatia | 6 | 0.0% |
| Dominican Republic | 10 | 0.0% |
| Eastern Africa | 36 | 0.1% |
| Eastern Asia | 100 | 0.2% |
| Eastern Europe | 144 | 0.3% |
| England | 135 | 0.3% |
| Ethiopia | 36 | 0.1% |
| Europe | 442 | 0.9% |
| France | 10 | 0.0% |
| Germany | 96 | 0.2% |
| Guatemala | 57 | 0.1% |
| Guyana | 11 | 0.0% |
| Honduras | 21 | 0.0% |
| India | 443 | 0.9% |
| Iran | 32 | 0.1% |
| Italy | 10 | 0.0% |
| Jamaica | 22 | 0.1% |
| Japan | 36 | 0.1% |
| Jordan | 27 | 0.1% |
| Korea | 30 | 0.1% |
| Latin America | 179 | 0.4% |
| Lebanon | 21 | 0.0% |
| Mexico | 40 | 0.1% |
| Nepal | 23 | 0.1% |
| Netherlands | 39 | 0.1% |
| Nigeria | 93 | 0.2% |
| Northern Africa | 91 | 0.2% |
| Northern Europe | 143 | 0.3% |
| Oceania | 11 | 0.0% |
| Pakistan | 30 | 0.1% |
| Philippines | 98 | 0.2% |
| Romania | 4 | 0.0% |
| Russia | 14 | 0.0% |
| South Africa | 8 | 0.0% |
| South America | 29 | 0.1% |
| South Central Asia | 616 | 1.3% |
| South Eastern Asia | 144 | 0.3% |
| Southern Europe | 10 | 0.0% |
| Sri Lanka | 42 | 0.1% |
| Sudan | 86 | 0.2% |
| Syria | 137 | 0.3% |
| Taiwan | 23 | 0.1% |
| Thailand | 7 | 0.0% |
| Vietnam | 32 | 0.1% |
| Western Africa | 123 | 0.3% |
| Western Asia | 185 | 0.4% |
| Western Europe | 145 | 0.3% | View All 59 Rows |
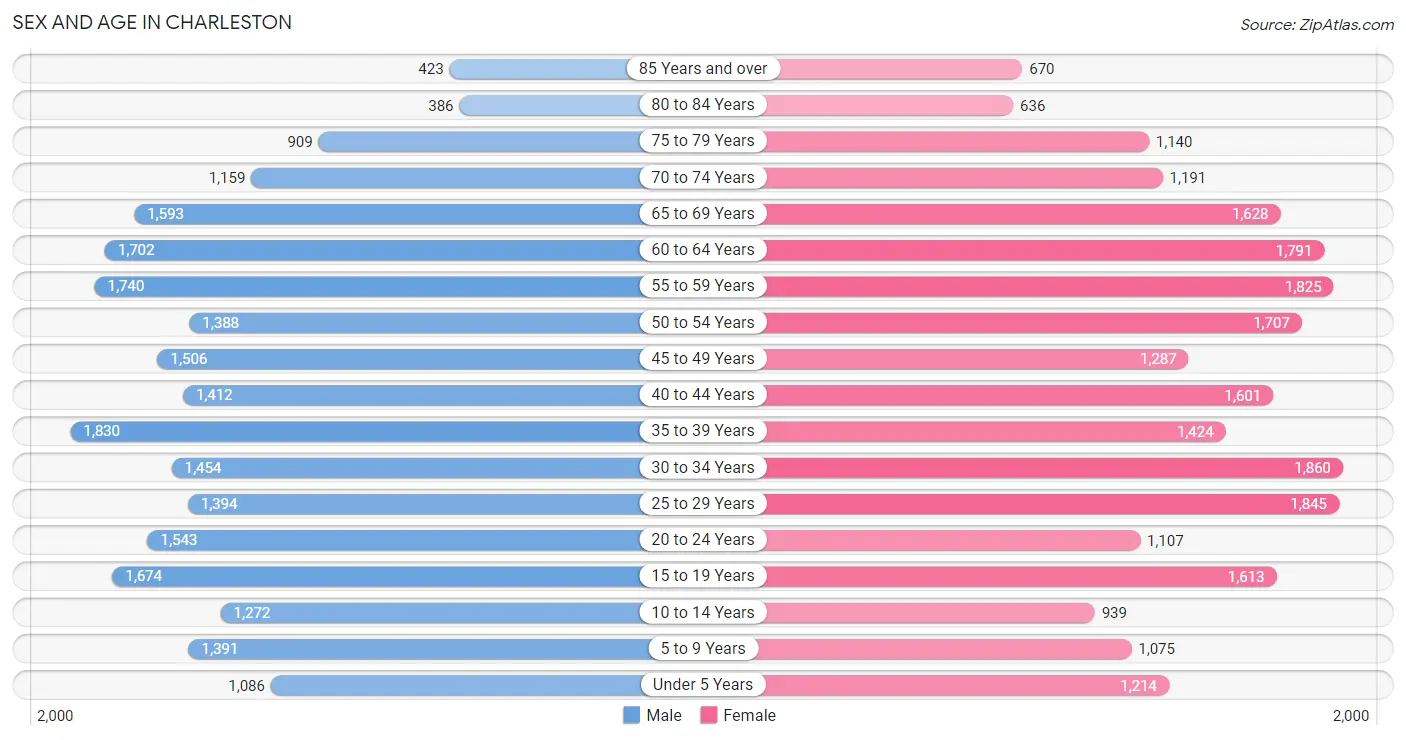
Sex and Age in Charleston
Sex and Age in Charleston
The most populous age groups in Charleston are 35 to 39 Years (1,830 | 7.7%) for men and 30 to 34 Years (1,860 | 7.6%) for women.
| Age Bracket | Male | Female |
| Under 5 Years | 1,086 (4.5%) | 1,214 (4.9%) |
| 5 to 9 Years | 1,391 (5.8%) | 1,075 (4.4%) |
| 10 to 14 Years | 1,272 (5.3%) | 939 (3.8%) |
| 15 to 19 Years | 1,674 (7.0%) | 1,613 (6.6%) |
| 20 to 24 Years | 1,543 (6.5%) | 1,107 (4.5%) |
| 25 to 29 Years | 1,394 (5.8%) | 1,845 (7.5%) |
| 30 to 34 Years | 1,454 (6.1%) | 1,860 (7.6%) |
| 35 to 39 Years | 1,830 (7.7%) | 1,424 (5.8%) |
| 40 to 44 Years | 1,412 (5.9%) | 1,601 (6.5%) |
| 45 to 49 Years | 1,506 (6.3%) | 1,287 (5.2%) |
| 50 to 54 Years | 1,388 (5.8%) | 1,707 (7.0%) |
| 55 to 59 Years | 1,740 (7.3%) | 1,825 (7.4%) |
| 60 to 64 Years | 1,702 (7.1%) | 1,791 (7.3%) |
| 65 to 69 Years | 1,593 (6.7%) | 1,628 (6.6%) |
| 70 to 74 Years | 1,159 (4.9%) | 1,191 (4.9%) |
| 75 to 79 Years | 909 (3.8%) | 1,140 (4.6%) |
| 80 to 84 Years | 386 (1.6%) | 636 (2.6%) |
| 85 Years and over | 423 (1.8%) | 670 (2.7%) |
| Total | 23,862 (100.0%) | 24,553 (100.0%) |
Families and Households in Charleston
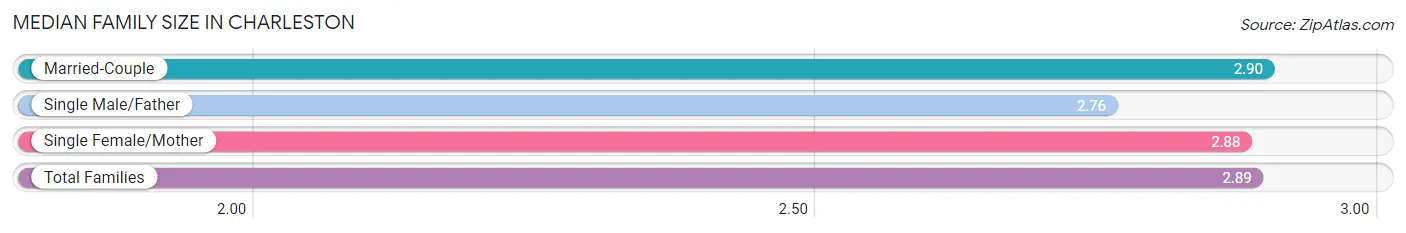
Median Family Size in Charleston
The median family size in Charleston is 2.89 persons per family, with married-couple families (8,127 | 70.1%) accounting for the largest median family size of 2.9 persons per family. On the other hand, single male/father families (833 | 7.2%) represent the smallest median family size with 2.76 persons per family.
| Family Type | # Families | Family Size |
| Married-Couple | 8,127 (70.1%) | 2.90 |
| Single Male/Father | 833 (7.2%) | 2.76 |
| Single Female/Mother | 2,639 (22.8%) | 2.88 |
| Total Families | 11,599 (100.0%) | 2.89 |
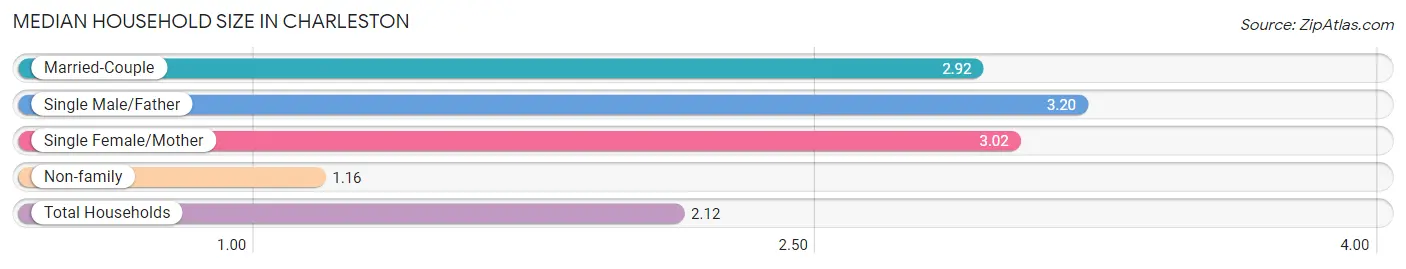
Median Household Size in Charleston
The median household size in Charleston is 2.12 persons per household, with single male/father households (833 | 3.8%) accounting for the largest median household size of 3.2 persons per household. non-family households (10,147 | 46.7%) represent the smallest median household size with 1.16 persons per household.
| Household Type | # Households | Household Size |
| Married-Couple | 8,127 (37.4%) | 2.92 |
| Single Male/Father | 833 (3.8%) | 3.20 |
| Single Female/Mother | 2,639 (12.1%) | 3.02 |
| Non-family | 10,147 (46.7%) | 1.16 |
| Total Households | 21,746 (100.0%) | 2.12 |
Household Size by Marriage Status in Charleston
Out of a total of 21,746 households in Charleston, 11,599 (53.3%) are family households, while 10,147 (46.7%) are nonfamily households. The most numerous type of family households are 2-person households, comprising 6,608, and the most common type of nonfamily households are 1-person households, comprising 8,833.
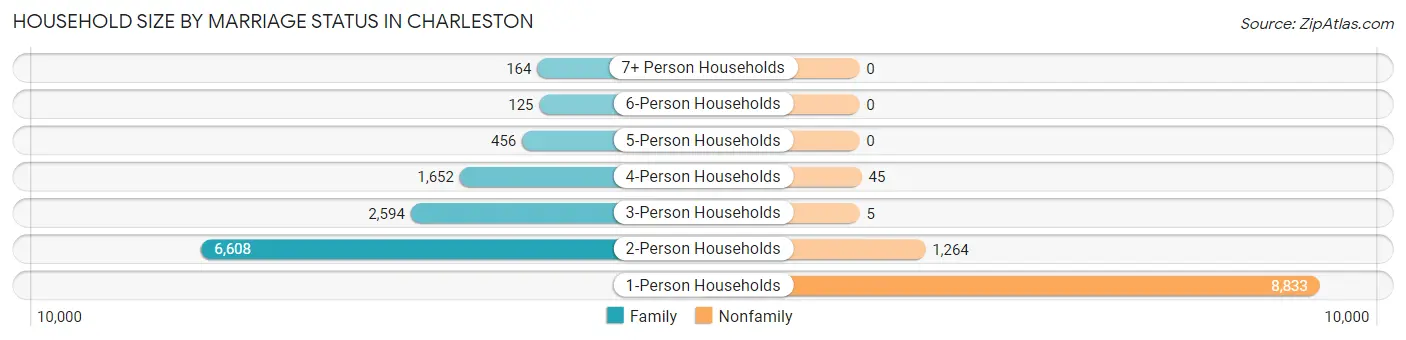
| Household Size | Family Households | Nonfamily Households |
| 1-Person Households | - | 8,833 (40.6%) |
| 2-Person Households | 6,608 (30.4%) | 1,264 (5.8%) |
| 3-Person Households | 2,594 (11.9%) | 5 (0.0%) |
| 4-Person Households | 1,652 (7.6%) | 45 (0.2%) |
| 5-Person Households | 456 (2.1%) | 0 (0.0%) |
| 6-Person Households | 125 (0.6%) | 0 (0.0%) |
| 7+ Person Households | 164 (0.7%) | 0 (0.0%) |
| Total | 11,599 (53.3%) | 10,147 (46.7%) |
Female Fertility in Charleston
Fertility by Age in Charleston
Average fertility rate in Charleston is 31.0 births per 1,000 women. Women in the age bracket of 15 to 19 years have the highest fertility rate with 40.0 births per 1,000 women. Women in the age bracket of 20 to 34 years acount for 50.9% of all women with births.
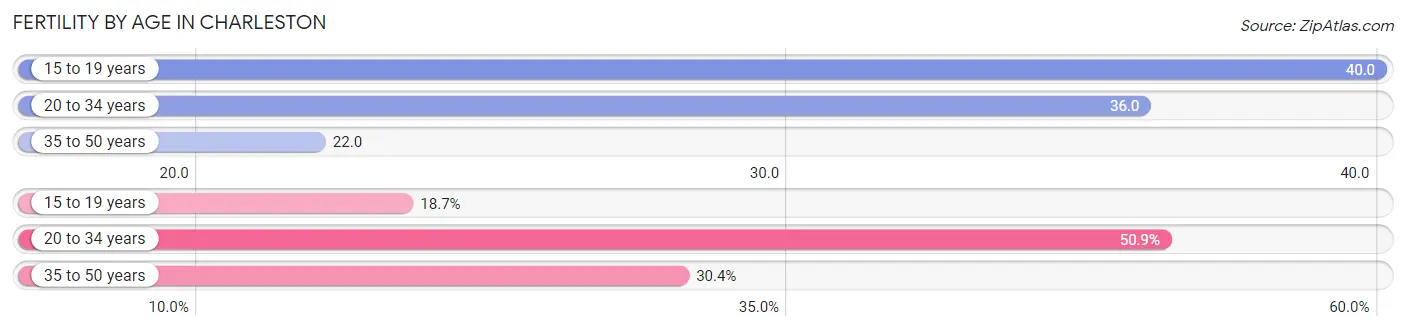
| Age Bracket | Women with Births | Births / 1,000 Women |
| 15 to 19 years | 64 (18.7%) | 40.0 |
| 20 to 34 years | 174 (50.9%) | 36.0 |
| 35 to 50 years | 104 (30.4%) | 22.0 |
| Total | 342 (100.0%) | 31.0 |
Fertility by Age by Marriage Status in Charleston
54.4% of women with births (342) in Charleston are married. The highest percentage of unmarried women with births falls into 20 to 34 years age bracket with 52.9% of them unmarried at the time of birth, while the lowest percentage of unmarried women with births belong to 35 to 50 years age bracket with 36.5% of them unmarried.
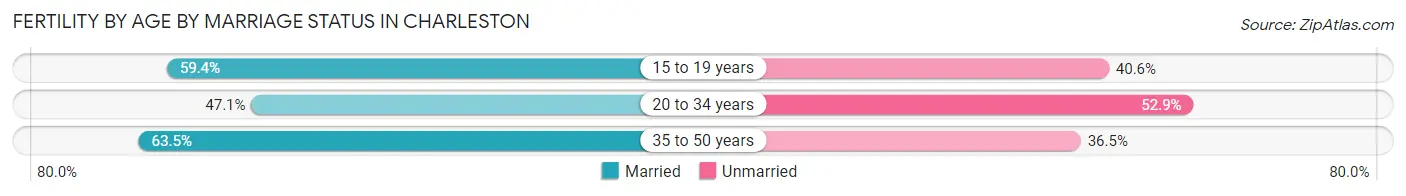
| Age Bracket | Married | Unmarried |
| 15 to 19 years | 38 (59.4%) | 26 (40.6%) |
| 20 to 34 years | 82 (47.1%) | 92 (52.9%) |
| 35 to 50 years | 66 (63.5%) | 38 (36.5%) |
| Total | 186 (54.4%) | 156 (45.6%) |
Fertility by Education in Charleston
Average fertility rate in Charleston is 31.0 births per 1,000 women. Women with the education attainment of high school diploma have the highest fertility rate of 79.0 births per 1,000 women, while women with the education attainment of less than high school have the lowest fertility at 9.0 births per 1,000 women. Women with the education attainment of high school diploma represent 50.3% of all women with births.
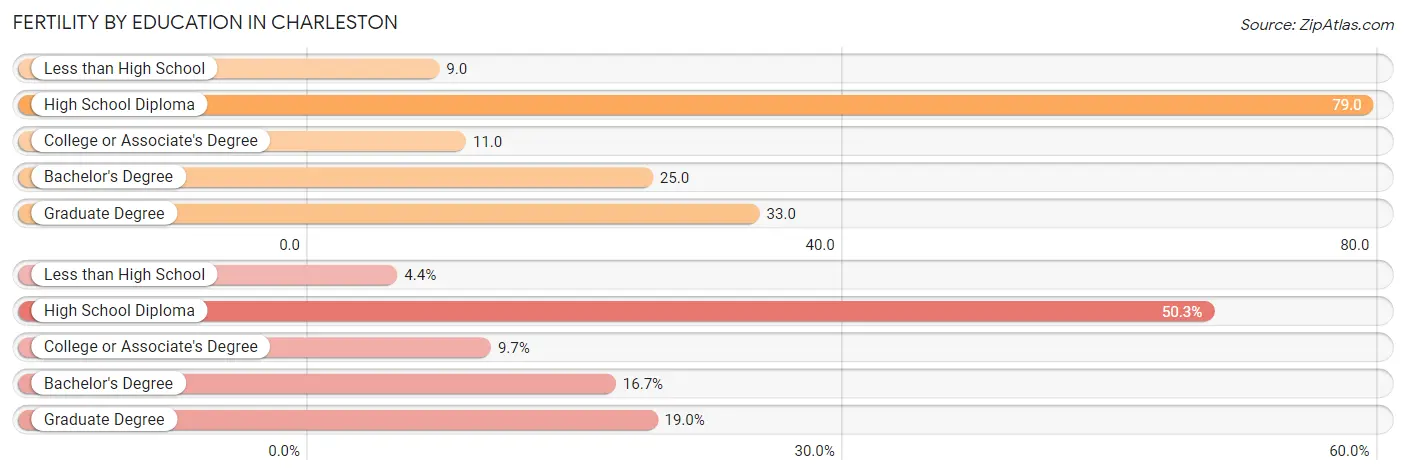
| Educational Attainment | Women with Births | Births / 1,000 Women |
| Less than High School | 15 (4.4%) | 9.0 |
| High School Diploma | 172 (50.3%) | 79.0 |
| College or Associate's Degree | 33 (9.7%) | 11.0 |
| Bachelor's Degree | 57 (16.7%) | 25.0 |
| Graduate Degree | 65 (19.0%) | 33.0 |
| Total | 342 (100.0%) | 31.0 |
Fertility by Education by Marriage Status in Charleston
45.6% of women with births in Charleston are unmarried. Women with the educational attainment of graduate degree are most likely to be married with 100.0% of them married at childbirth, while women with the educational attainment of less than high school are least likely to be married with 100.0% of them unmarried at childbirth.
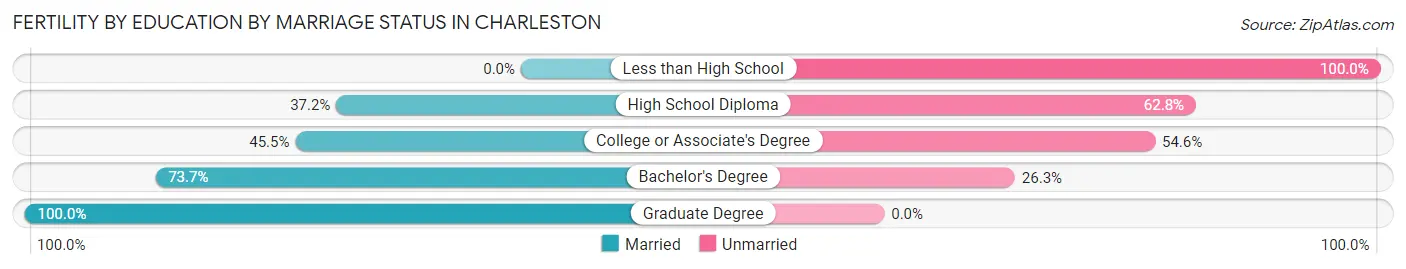
| Educational Attainment | Married | Unmarried |
| Less than High School | 0 (0.0%) | 15 (100.0%) |
| High School Diploma | 64 (37.2%) | 108 (62.8%) |
| College or Associate's Degree | 15 (45.5%) | 18 (54.5%) |
| Bachelor's Degree | 42 (73.7%) | 15 (26.3%) |
| Graduate Degree | 65 (100.0%) | 0 (0.0%) |
| Total | 186 (54.4%) | 156 (45.6%) |
Employment Characteristics in Charleston
Employment by Class of Employer in Charleston
Among the 21,688 employed individuals in Charleston, private company employees (12,584 | 58.0%), state government employees (2,615 | 12.1%), and not-for-profit organizations (2,526 | 11.7%) make up the most common classes of employment.
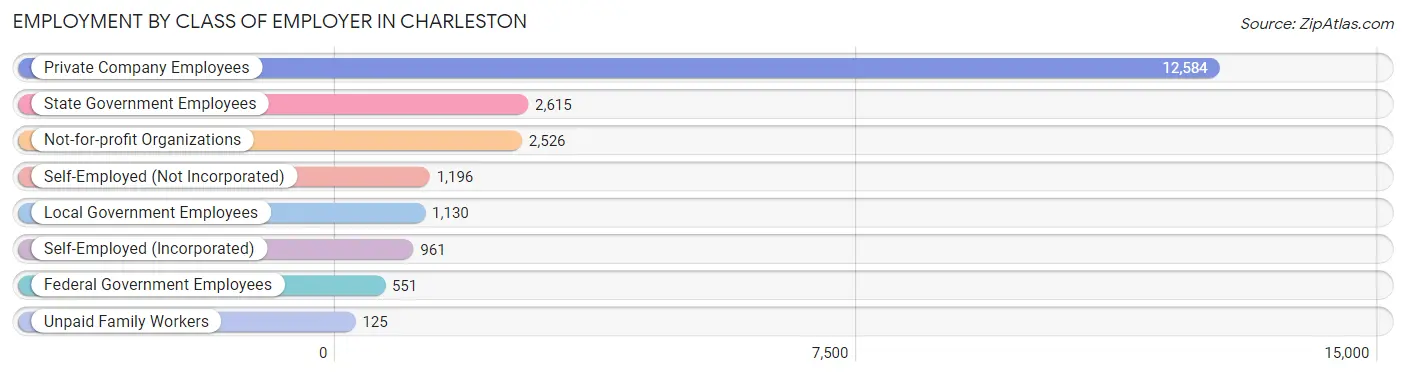
| Employer Class | # Employees | % Employees |
| Private Company Employees | 12,584 | 58.0% |
| Self-Employed (Incorporated) | 961 | 4.4% |
| Self-Employed (Not Incorporated) | 1,196 | 5.5% |
| Not-for-profit Organizations | 2,526 | 11.7% |
| Local Government Employees | 1,130 | 5.2% |
| State Government Employees | 2,615 | 12.1% |
| Federal Government Employees | 551 | 2.5% |
| Unpaid Family Workers | 125 | 0.6% |
| Total | 21,688 | 100.0% |
Employment Status by Age in Charleston
According to the labor force statistics for Charleston, out of the total population over 16 years of age (40,814), 57.0% or 23,264 individuals are in the labor force, with 5.8% or 1,349 of them unemployed. The age group with the highest labor force participation rate is 25 to 29 years, with 82.6% or 2,675 individuals in the labor force. Within the labor force, the 16 to 19 years age range has the highest percentage of unemployed individuals, with 28.1% or 255 of them being unemployed.
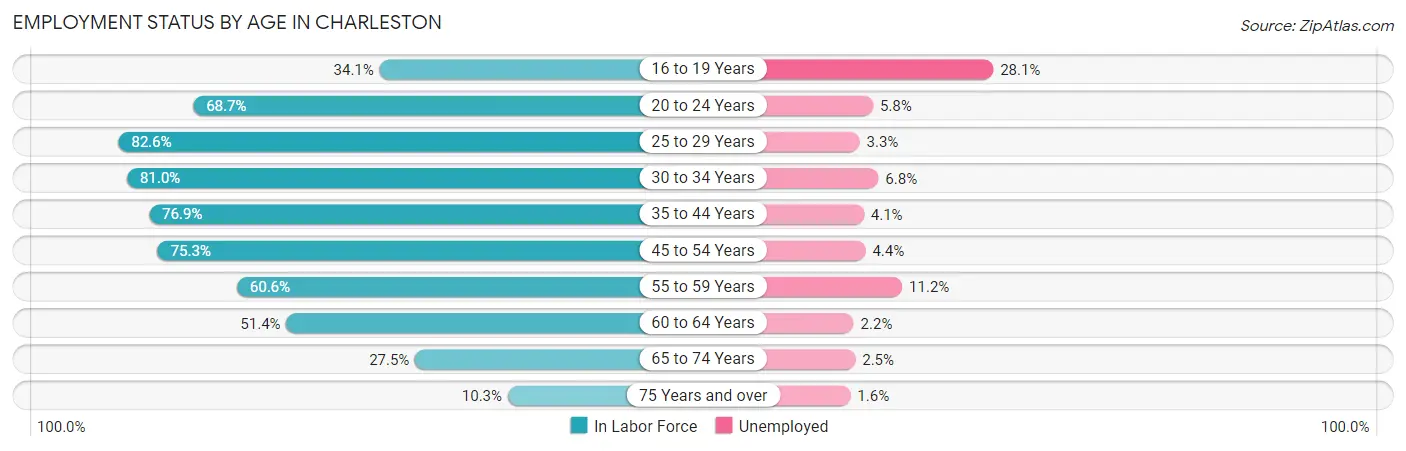
| Age Bracket | In Labor Force | Unemployed |
| 16 to 19 Years | 908 (34.1%) | 255 (28.1%) |
| 20 to 24 Years | 1,821 (68.7%) | 106 (5.8%) |
| 25 to 29 Years | 2,675 (82.6%) | 88 (3.3%) |
| 30 to 34 Years | 2,684 (81.0%) | 183 (6.8%) |
| 35 to 44 Years | 4,819 (76.9%) | 198 (4.1%) |
| 45 to 54 Years | 4,434 (75.3%) | 195 (4.4%) |
| 55 to 59 Years | 2,160 (60.6%) | 242 (11.2%) |
| 60 to 64 Years | 1,795 (51.4%) | 39 (2.2%) |
| 65 to 74 Years | 1,532 (27.5%) | 38 (2.5%) |
| 75 Years and over | 429 (10.3%) | 7 (1.6%) |
| Total | 23,264 (57.0%) | 1,349 (5.8%) |
Employment Status by Educational Attainment in Charleston
According to labor force statistics for Charleston, 72.1% of individuals (18,577) out of the total population between 25 and 64 years of age (25,766) are in the labor force, with 5.1% or 947 of them being unemployed. The group with the highest labor force participation rate are those with the educational attainment of bachelor's degree or higher, with 85.8% or 9,412 individuals in the labor force. Within the labor force, individuals with less than high school education have the highest percentage of unemployment, with 10.1% or 67 of them being unemployed.
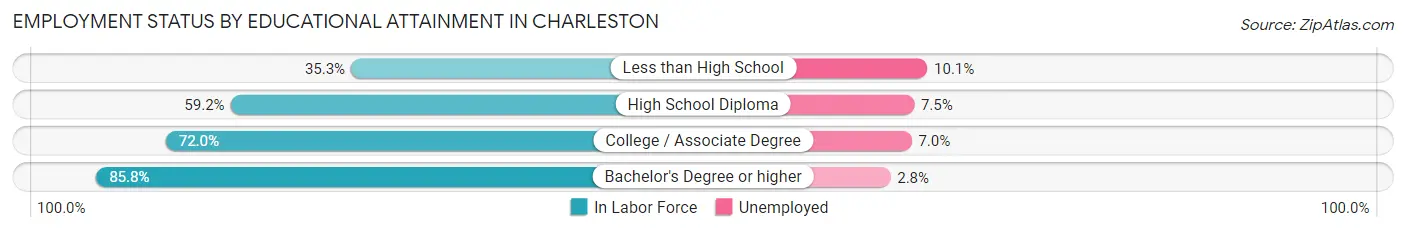
| Educational Attainment | In Labor Force | Unemployed |
| Less than High School | 660 (35.3%) | 189 (10.1%) |
| High School Diploma | 3,750 (59.2%) | 475 (7.5%) |
| College / Associate Degree | 4,745 (72.0%) | 461 (7.0%) |
| Bachelor's Degree or higher | 9,412 (85.8%) | 307 (2.8%) |
| Total | 18,577 (72.1%) | 1,314 (5.1%) |
Employment Occupations by Sex in Charleston
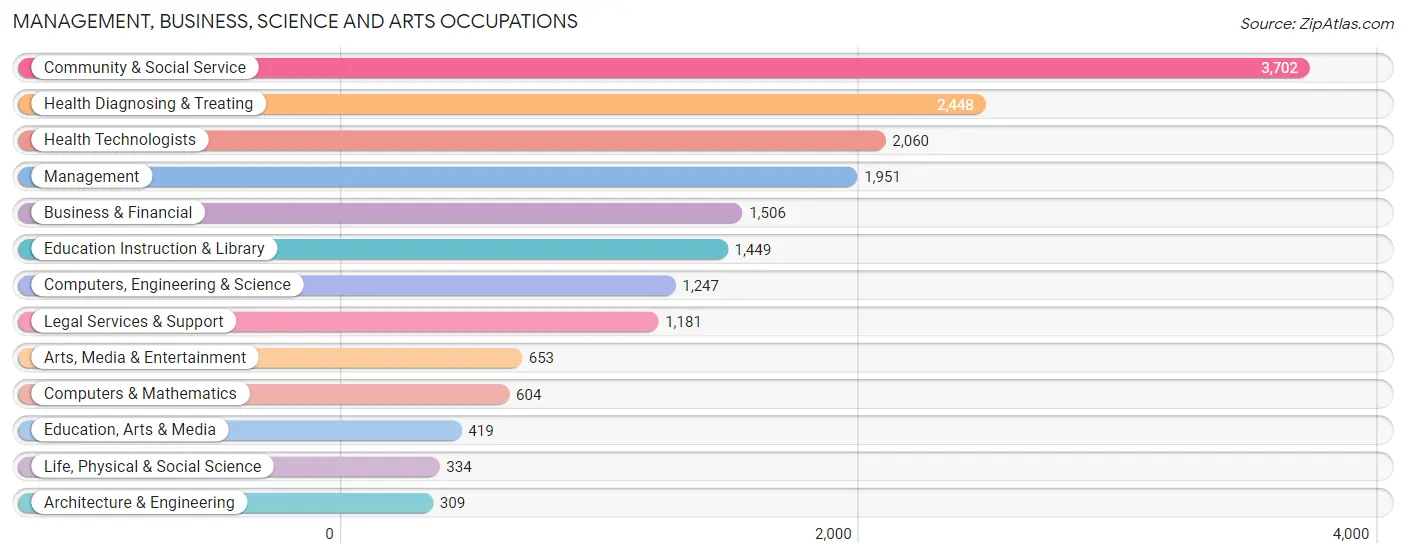
Management, Business, Science and Arts Occupations
The most common Management, Business, Science and Arts occupations in Charleston are Community & Social Service (3,702 | 17.0%), Health Diagnosing & Treating (2,448 | 11.3%), Health Technologists (2,060 | 9.5%), Management (1,951 | 9.0%), and Business & Financial (1,506 | 6.9%).
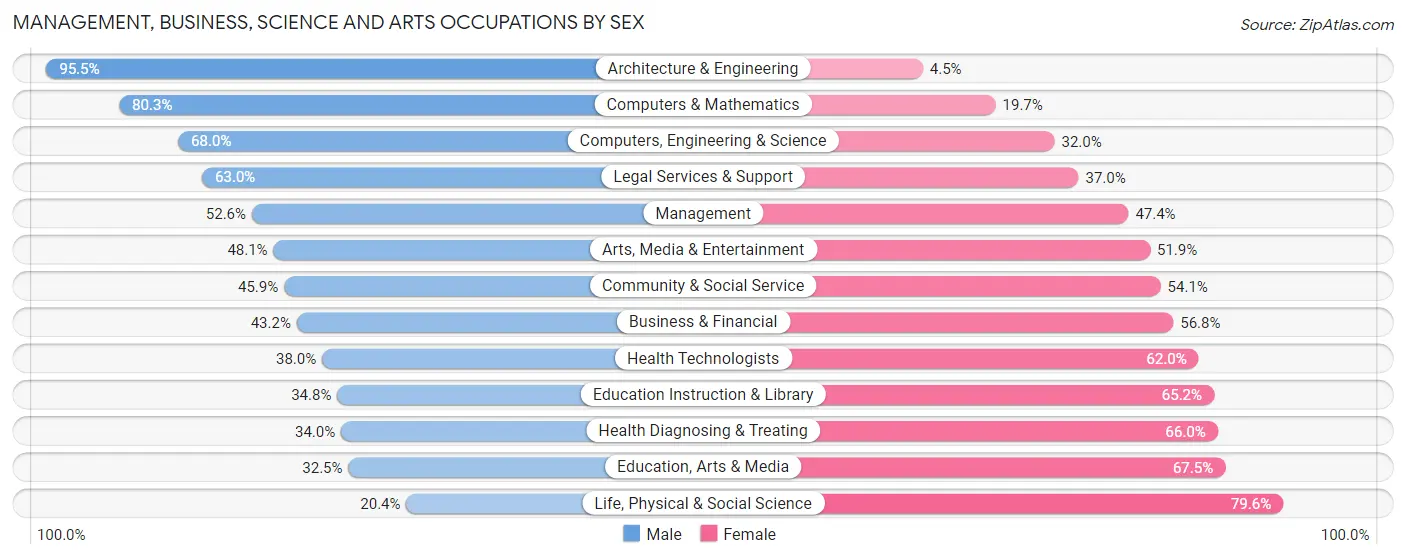
Management, Business, Science and Arts Occupations by Sex
Within the Management, Business, Science and Arts occupations in Charleston, the most male-oriented occupations are Architecture & Engineering (95.5%), Computers & Mathematics (80.3%), and Computers, Engineering & Science (68.0%), while the most female-oriented occupations are Life, Physical & Social Science (79.6%), Education, Arts & Media (67.5%), and Health Diagnosing & Treating (66.0%).
| Occupation | Male | Female |
| Management | 1,026 (52.6%) | 925 (47.4%) |
| Business & Financial | 651 (43.2%) | 855 (56.8%) |
| Computers, Engineering & Science | 848 (68.0%) | 399 (32.0%) |
| Computers & Mathematics | 485 (80.3%) | 119 (19.7%) |
| Architecture & Engineering | 295 (95.5%) | 14 (4.5%) |
| Life, Physical & Social Science | 68 (20.4%) | 266 (79.6%) |
| Community & Social Service | 1,698 (45.9%) | 2,004 (54.1%) |
| Education, Arts & Media | 136 (32.5%) | 283 (67.5%) |
| Legal Services & Support | 744 (63.0%) | 437 (37.0%) |
| Education Instruction & Library | 504 (34.8%) | 945 (65.2%) |
| Arts, Media & Entertainment | 314 (48.1%) | 339 (51.9%) |
| Health Diagnosing & Treating | 832 (34.0%) | 1,616 (66.0%) |
| Health Technologists | 782 (38.0%) | 1,278 (62.0%) |
| Total (Category) | 5,055 (46.6%) | 5,799 (53.4%) |
| Total (Overall) | 10,750 (49.4%) | 11,010 (50.6%) |
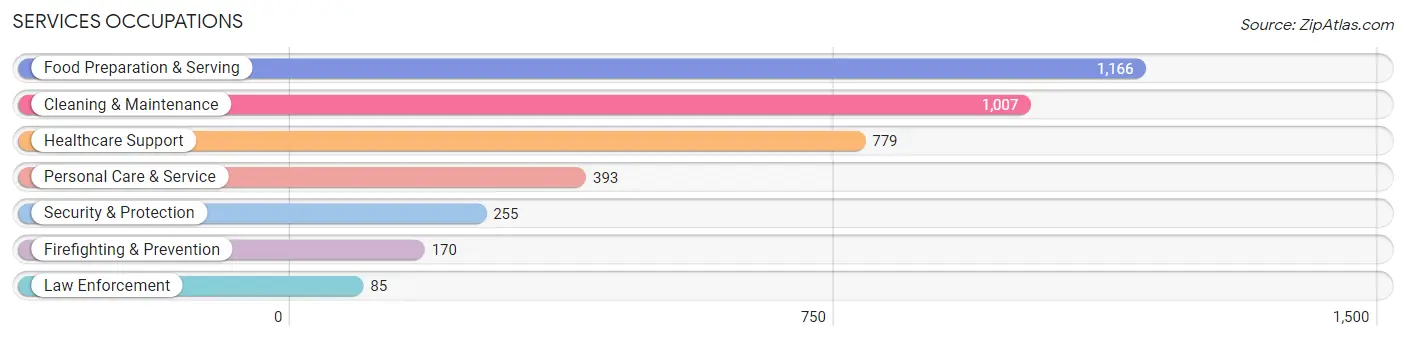
Services Occupations
The most common Services occupations in Charleston are Food Preparation & Serving (1,166 | 5.4%), Cleaning & Maintenance (1,007 | 4.6%), Healthcare Support (779 | 3.6%), Personal Care & Service (393 | 1.8%), and Security & Protection (255 | 1.2%).
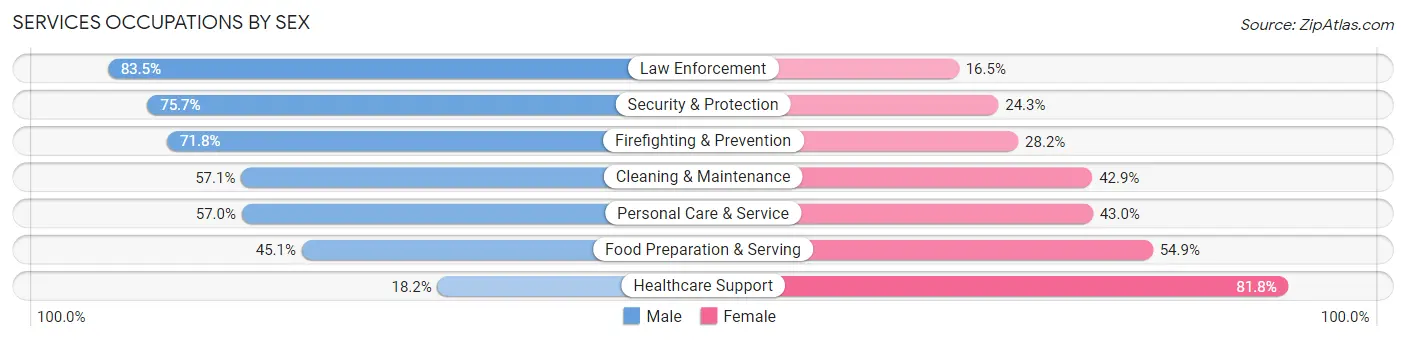
Services Occupations by Sex
Within the Services occupations in Charleston, the most male-oriented occupations are Law Enforcement (83.5%), Security & Protection (75.7%), and Firefighting & Prevention (71.8%), while the most female-oriented occupations are Healthcare Support (81.8%), Food Preparation & Serving (54.9%), and Personal Care & Service (43.0%).
| Occupation | Male | Female |
| Healthcare Support | 142 (18.2%) | 637 (81.8%) |
| Security & Protection | 193 (75.7%) | 62 (24.3%) |
| Firefighting & Prevention | 122 (71.8%) | 48 (28.2%) |
| Law Enforcement | 71 (83.5%) | 14 (16.5%) |
| Food Preparation & Serving | 526 (45.1%) | 640 (54.9%) |
| Cleaning & Maintenance | 575 (57.1%) | 432 (42.9%) |
| Personal Care & Service | 224 (57.0%) | 169 (43.0%) |
| Total (Category) | 1,660 (46.1%) | 1,940 (53.9%) |
| Total (Overall) | 10,750 (49.4%) | 11,010 (50.6%) |
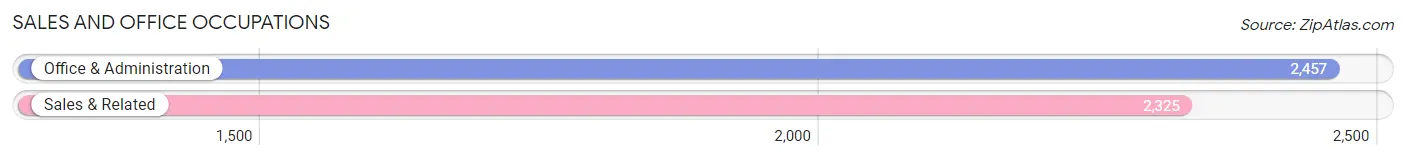
Sales and Office Occupations
The most common Sales and Office occupations in Charleston are Office & Administration (2,457 | 11.3%), and Sales & Related (2,325 | 10.7%).
Sales and Office Occupations by Sex
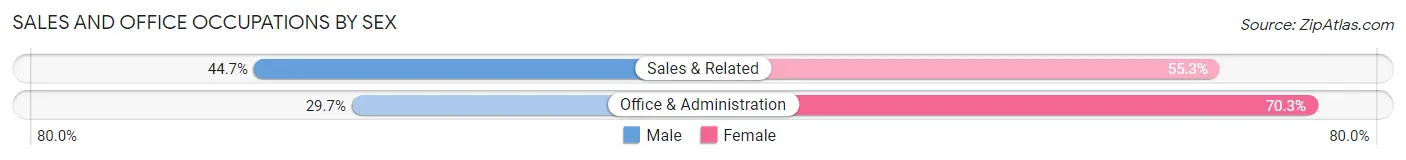
| Occupation | Male | Female |
| Sales & Related | 1,040 (44.7%) | 1,285 (55.3%) |
| Office & Administration | 729 (29.7%) | 1,728 (70.3%) |
| Total (Category) | 1,769 (37.0%) | 3,013 (63.0%) |
| Total (Overall) | 10,750 (49.4%) | 11,010 (50.6%) |
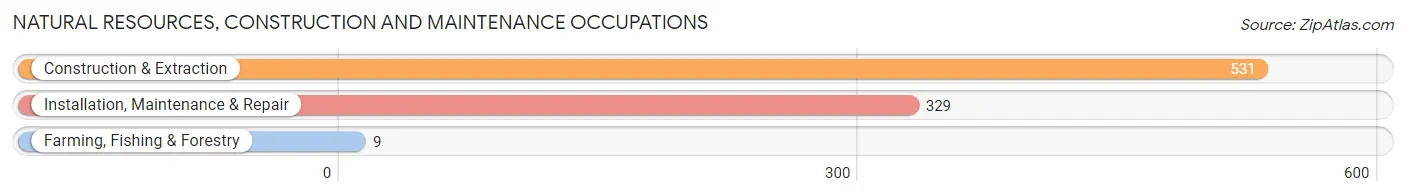
Natural Resources, Construction and Maintenance Occupations
The most common Natural Resources, Construction and Maintenance occupations in Charleston are Construction & Extraction (531 | 2.4%), Installation, Maintenance & Repair (329 | 1.5%), and Farming, Fishing & Forestry (9 | 0.0%).
Natural Resources, Construction and Maintenance Occupations by Sex
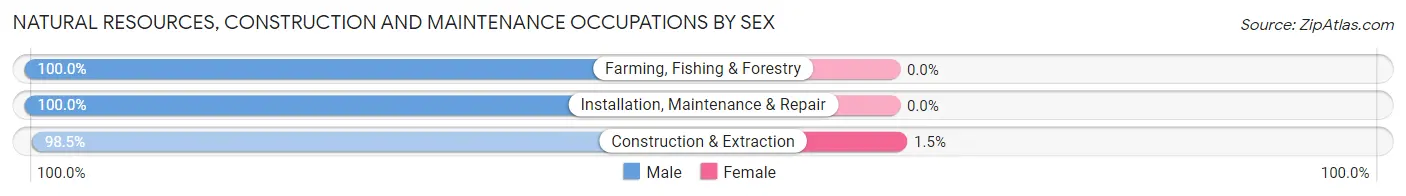
| Occupation | Male | Female |
| Farming, Fishing & Forestry | 9 (100.0%) | 0 (0.0%) |
| Construction & Extraction | 523 (98.5%) | 8 (1.5%) |
| Installation, Maintenance & Repair | 329 (100.0%) | 0 (0.0%) |
| Total (Category) | 861 (99.1%) | 8 (0.9%) |
| Total (Overall) | 10,750 (49.4%) | 11,010 (50.6%) |
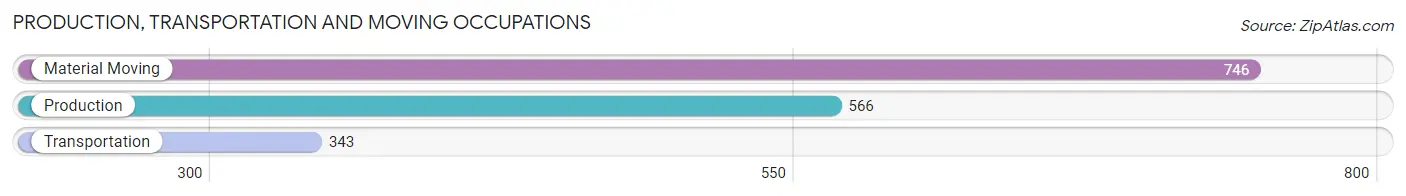
Production, Transportation and Moving Occupations
The most common Production, Transportation and Moving occupations in Charleston are Material Moving (746 | 3.4%), Production (566 | 2.6%), and Transportation (343 | 1.6%).
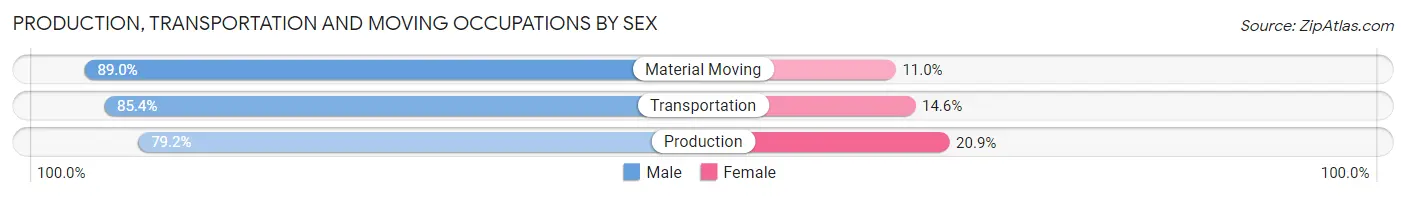
Production, Transportation and Moving Occupations by Sex
| Occupation | Male | Female |
| Production | 448 (79.1%) | 118 (20.8%) |
| Transportation | 293 (85.4%) | 50 (14.6%) |
| Material Moving | 664 (89.0%) | 82 (11.0%) |
| Total (Category) | 1,405 (84.9%) | 250 (15.1%) |
| Total (Overall) | 10,750 (49.4%) | 11,010 (50.6%) |
Employment Industries by Sex in Charleston
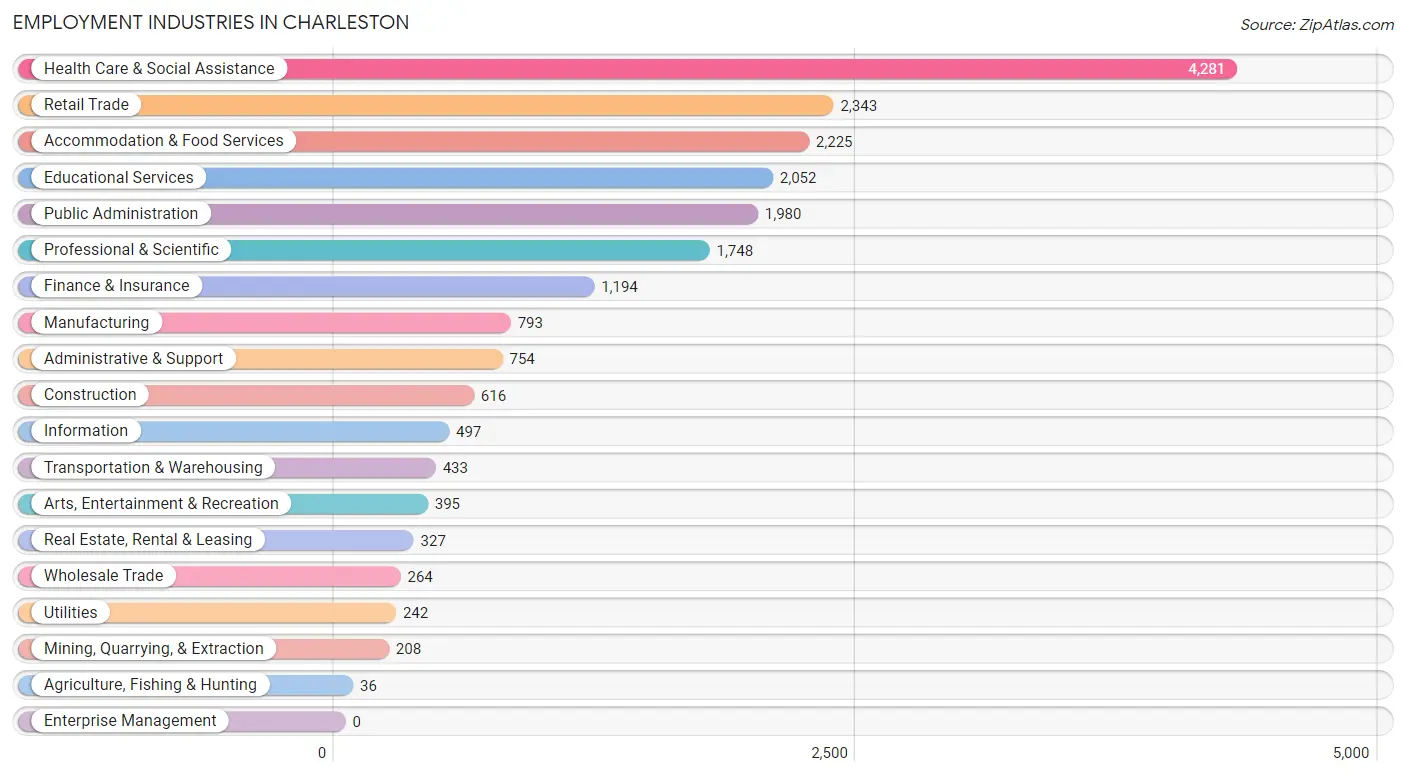
Employment Industries in Charleston
The major employment industries in Charleston include Health Care & Social Assistance (4,281 | 19.7%), Retail Trade (2,343 | 10.8%), Accommodation & Food Services (2,225 | 10.2%), Educational Services (2,052 | 9.4%), and Public Administration (1,980 | 9.1%).
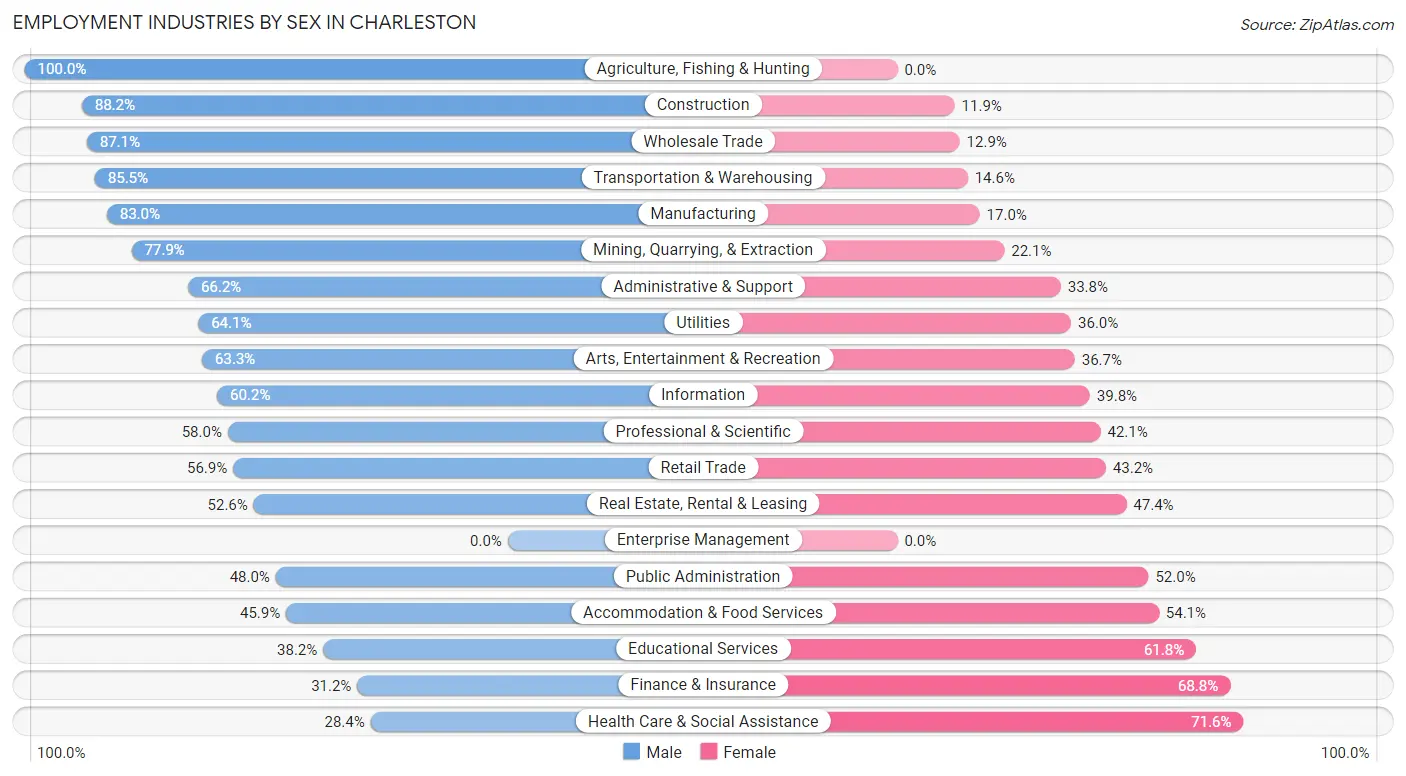
Employment Industries by Sex in Charleston
The Charleston industries that see more men than women are Agriculture, Fishing & Hunting (100.0%), Construction (88.1%), and Wholesale Trade (87.1%), whereas the industries that tend to have a higher number of women are Health Care & Social Assistance (71.6%), Finance & Insurance (68.8%), and Educational Services (61.8%).
| Industry | Male | Female |
| Agriculture, Fishing & Hunting | 36 (100.0%) | 0 (0.0%) |
| Mining, Quarrying, & Extraction | 162 (77.9%) | 46 (22.1%) |
| Construction | 543 (88.1%) | 73 (11.8%) |
| Manufacturing | 658 (83.0%) | 135 (17.0%) |
| Wholesale Trade | 230 (87.1%) | 34 (12.9%) |
| Retail Trade | 1,332 (56.9%) | 1,011 (43.1%) |
| Transportation & Warehousing | 370 (85.5%) | 63 (14.5%) |
| Utilities | 155 (64.0%) | 87 (35.9%) |
| Information | 299 (60.2%) | 198 (39.8%) |
| Finance & Insurance | 372 (31.2%) | 822 (68.8%) |
| Real Estate, Rental & Leasing | 172 (52.6%) | 155 (47.4%) |
| Professional & Scientific | 1,013 (58.0%) | 735 (42.0%) |
| Enterprise Management | 0 (0.0%) | 0 (0.0%) |
| Administrative & Support | 499 (66.2%) | 255 (33.8%) |
| Educational Services | 784 (38.2%) | 1,268 (61.8%) |
| Health Care & Social Assistance | 1,216 (28.4%) | 3,065 (71.6%) |
| Arts, Entertainment & Recreation | 250 (63.3%) | 145 (36.7%) |
| Accommodation & Food Services | 1,021 (45.9%) | 1,204 (54.1%) |
| Public Administration | 951 (48.0%) | 1,029 (52.0%) |
| Total | 10,750 (49.4%) | 11,010 (50.6%) |
Education in Charleston
School Enrollment in Charleston
The most common levels of schooling among the 9,468 students in Charleston are high school (2,618 | 27.7%), elementary school (1,824 | 19.3%), and middle school (1,711 | 18.1%).
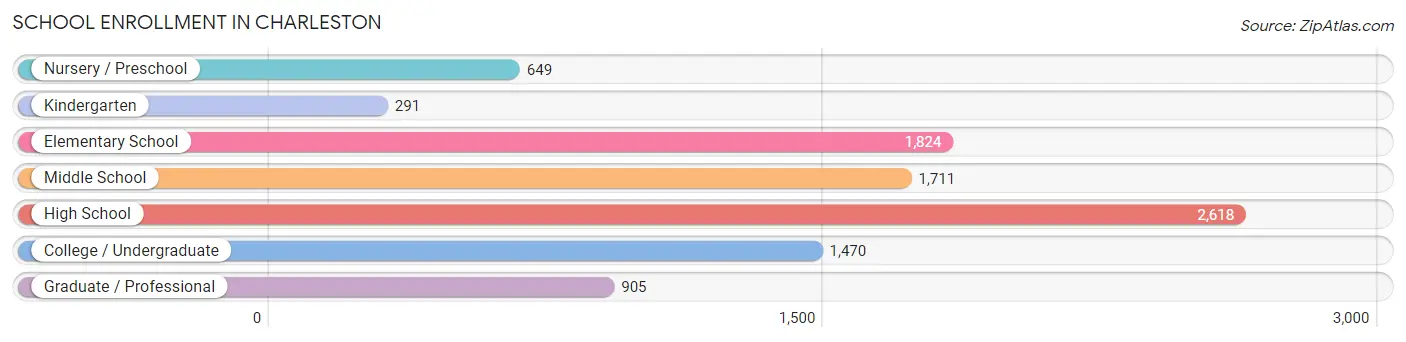
| School Level | # Students | % Students |
| Nursery / Preschool | 649 | 6.9% |
| Kindergarten | 291 | 3.1% |
| Elementary School | 1,824 | 19.3% |
| Middle School | 1,711 | 18.1% |
| High School | 2,618 | 27.7% |
| College / Undergraduate | 1,470 | 15.5% |
| Graduate / Professional | 905 | 9.6% |
| Total | 9,468 | 100.0% |
School Enrollment by Age by Funding Source in Charleston
Out of a total of 9,468 students who are enrolled in schools in Charleston, 1,875 (19.8%) attend a private institution, while the remaining 7,593 (80.2%) are enrolled in public schools. The age group of 20 to 24 year olds has the highest likelihood of being enrolled in private schools, with 287 (44.9% in the age bracket) enrolled. Conversely, the age group of 15 to 17 year olds has the lowest likelihood of being enrolled in a private school, with 1,706 (95.7% in the age bracket) attending a public institution.
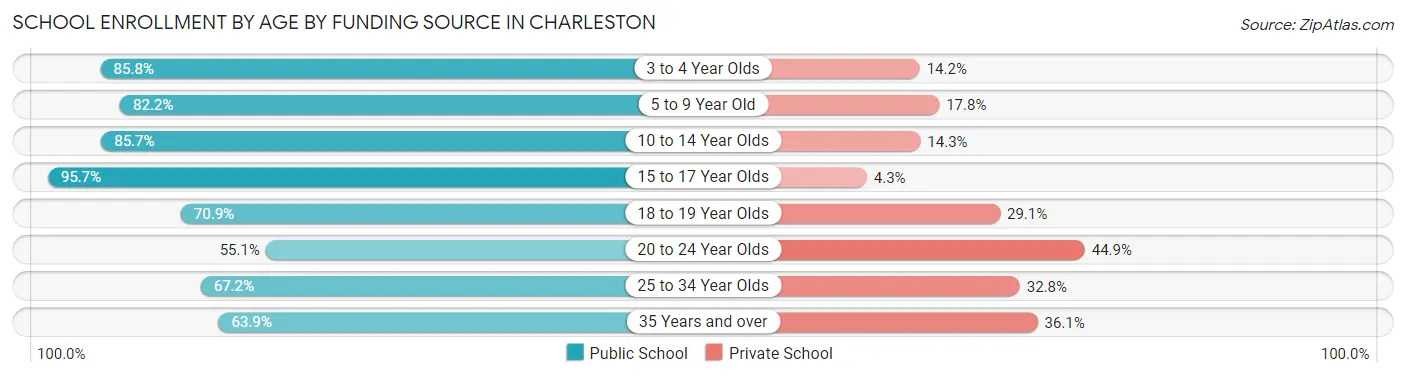
| Age Bracket | Public School | Private School |
| 3 to 4 Year Olds | 321 (85.8%) | 53 (14.2%) |
| 5 to 9 Year Old | 1,847 (82.2%) | 400 (17.8%) |
| 10 to 14 Year Olds | 1,752 (85.7%) | 292 (14.3%) |
| 15 to 17 Year Olds | 1,706 (95.7%) | 77 (4.3%) |
| 18 to 19 Year Olds | 684 (70.9%) | 281 (29.1%) |
| 20 to 24 Year Olds | 352 (55.1%) | 287 (44.9%) |
| 25 to 34 Year Olds | 477 (67.2%) | 233 (32.8%) |
| 35 Years and over | 451 (63.9%) | 255 (36.1%) |
| Total | 7,593 (80.2%) | 1,875 (19.8%) |
Educational Attainment by Field of Study in Charleston
Business (2,859 | 17.0%), science & technology (2,098 | 12.4%), education (2,004 | 11.9%), social sciences (1,347 | 8.0%), and communications (1,320 | 7.8%) are the most common fields of study among 16,851 individuals in Charleston who have obtained a bachelor's degree or higher.
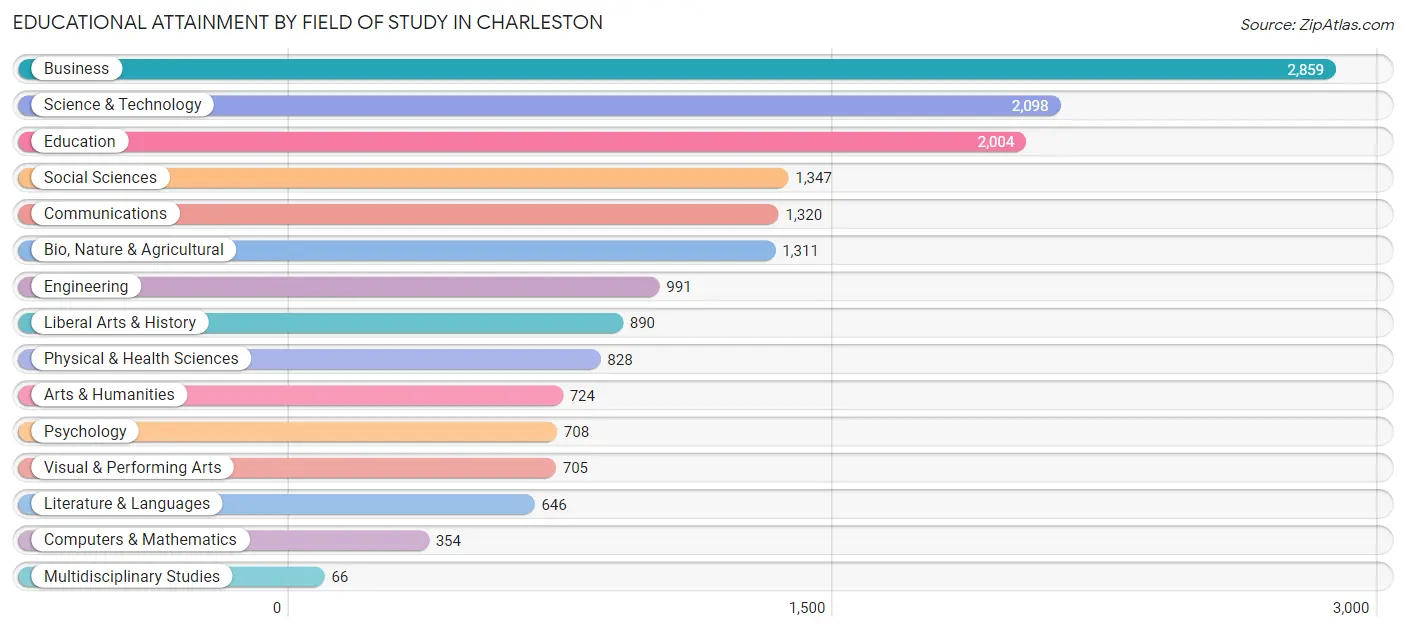
| Field of Study | # Graduates | % Graduates |
| Computers & Mathematics | 354 | 2.1% |
| Bio, Nature & Agricultural | 1,311 | 7.8% |
| Physical & Health Sciences | 828 | 4.9% |
| Psychology | 708 | 4.2% |
| Social Sciences | 1,347 | 8.0% |
| Engineering | 991 | 5.9% |
| Multidisciplinary Studies | 66 | 0.4% |
| Science & Technology | 2,098 | 12.4% |
| Business | 2,859 | 17.0% |
| Education | 2,004 | 11.9% |
| Literature & Languages | 646 | 3.8% |
| Liberal Arts & History | 890 | 5.3% |
| Visual & Performing Arts | 705 | 4.2% |
| Communications | 1,320 | 7.8% |
| Arts & Humanities | 724 | 4.3% |
| Total | 16,851 | 100.0% |
Transportation & Commute in Charleston
Vehicle Availability by Sex in Charleston
The most prevalent vehicle ownership categories in Charleston are males with 2 vehicles (4,747, accounting for 44.6%) and females with 2 vehicles (4,542, making up 44.2%).
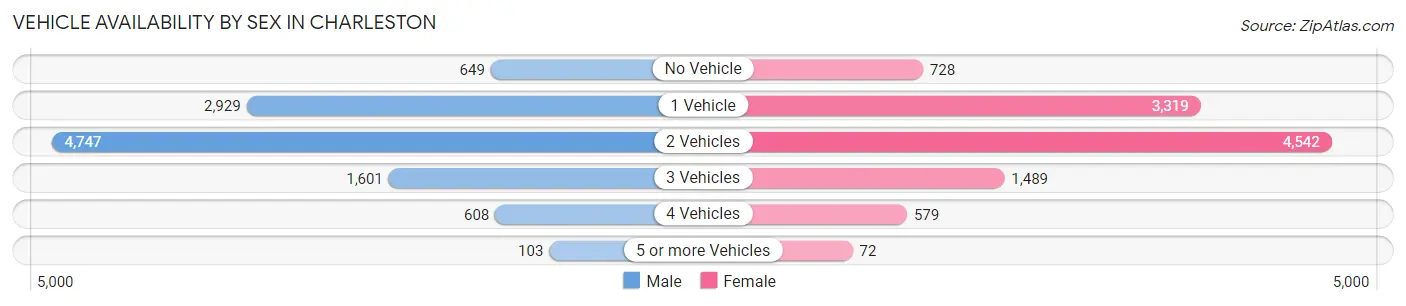
| Vehicles Available | Male | Female |
| No Vehicle | 649 (6.1%) | 728 (6.8%) |
| 1 Vehicle | 2,929 (27.5%) | 3,319 (30.9%) |
| 2 Vehicles | 4,747 (44.6%) | 4,542 (42.3%) |
| 3 Vehicles | 1,601 (15.0%) | 1,489 (13.9%) |
| 4 Vehicles | 608 (5.7%) | 579 (5.4%) |
| 5 or more Vehicles | 103 (1.0%) | 72 (0.7%) |
| Total | 10,637 (100.0%) | 10,729 (100.0%) |
Commute Time in Charleston
The most frequently occuring commute durations in Charleston are 10 to 14 minutes (5,343 commuters, 26.8%), 15 to 19 minutes (4,560 commuters, 22.9%), and 5 to 9 minutes (3,606 commuters, 18.1%).
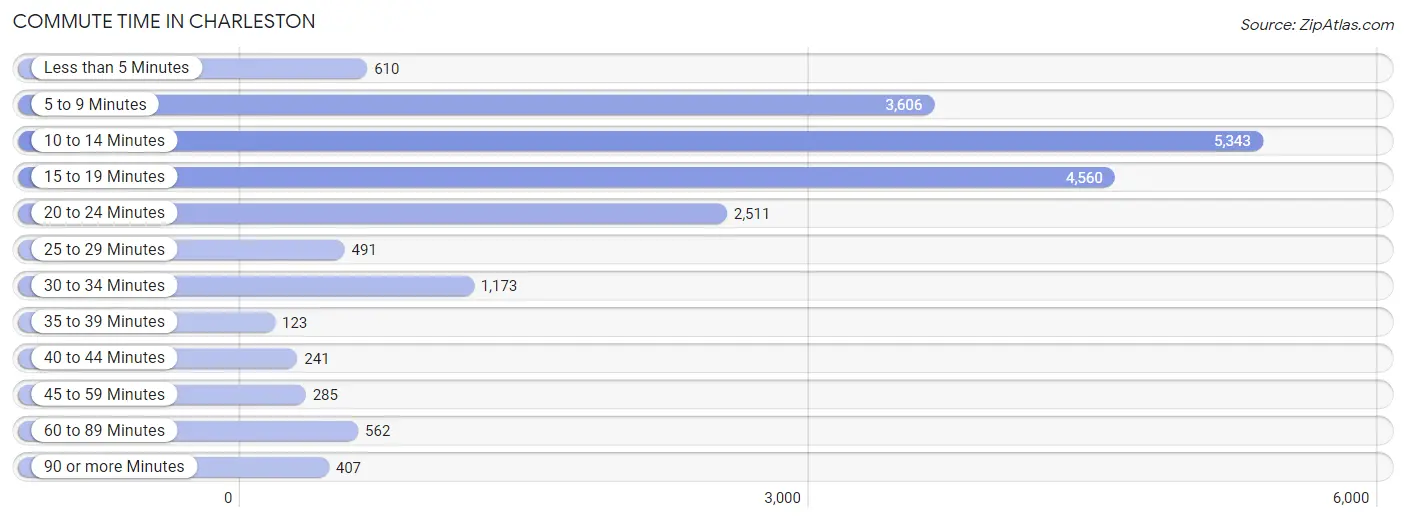
| Commute Time | # Commuters | % Commuters |
| Less than 5 Minutes | 610 | 3.1% |
| 5 to 9 Minutes | 3,606 | 18.1% |
| 10 to 14 Minutes | 5,343 | 26.8% |
| 15 to 19 Minutes | 4,560 | 22.9% |
| 20 to 24 Minutes | 2,511 | 12.6% |
| 25 to 29 Minutes | 491 | 2.5% |
| 30 to 34 Minutes | 1,173 | 5.9% |
| 35 to 39 Minutes | 123 | 0.6% |
| 40 to 44 Minutes | 241 | 1.2% |
| 45 to 59 Minutes | 285 | 1.4% |
| 60 to 89 Minutes | 562 | 2.8% |
| 90 or more Minutes | 407 | 2.0% |
Commute Time by Sex in Charleston
The most common commute times in Charleston are 10 to 14 minutes (2,507 commuters, 24.8%) for males and 10 to 14 minutes (2,836 commuters, 28.9%) for females.
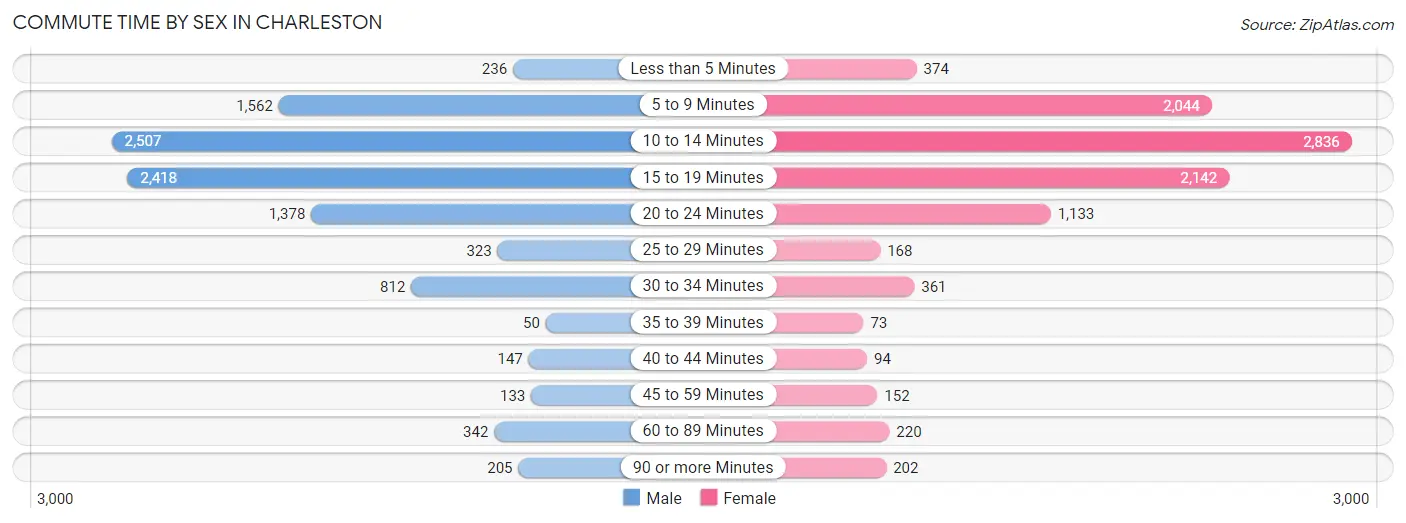
| Commute Time | Male | Female |
| Less than 5 Minutes | 236 (2.3%) | 374 (3.8%) |
| 5 to 9 Minutes | 1,562 (15.4%) | 2,044 (20.9%) |
| 10 to 14 Minutes | 2,507 (24.8%) | 2,836 (28.9%) |
| 15 to 19 Minutes | 2,418 (23.9%) | 2,142 (21.9%) |
| 20 to 24 Minutes | 1,378 (13.6%) | 1,133 (11.6%) |
| 25 to 29 Minutes | 323 (3.2%) | 168 (1.7%) |
| 30 to 34 Minutes | 812 (8.0%) | 361 (3.7%) |
| 35 to 39 Minutes | 50 (0.5%) | 73 (0.7%) |
| 40 to 44 Minutes | 147 (1.5%) | 94 (1.0%) |
| 45 to 59 Minutes | 133 (1.3%) | 152 (1.5%) |
| 60 to 89 Minutes | 342 (3.4%) | 220 (2.2%) |
| 90 or more Minutes | 205 (2.0%) | 202 (2.1%) |
Time of Departure to Work by Sex in Charleston
The most frequent times of departure to work in Charleston are 8:00 AM to 8:29 AM (1,730, 17.1%) for males and 7:30 AM to 7:59 AM (1,983, 20.2%) for females.
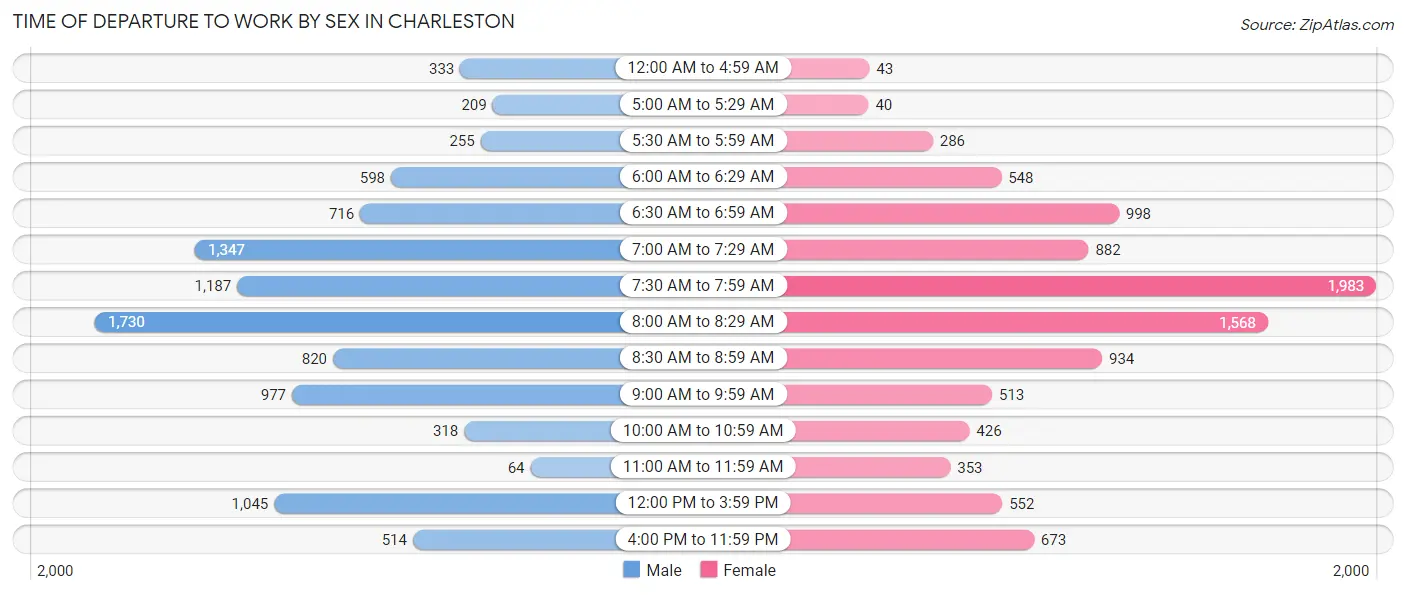
| Time of Departure | Male | Female |
| 12:00 AM to 4:59 AM | 333 (3.3%) | 43 (0.4%) |
| 5:00 AM to 5:29 AM | 209 (2.1%) | 40 (0.4%) |
| 5:30 AM to 5:59 AM | 255 (2.5%) | 286 (2.9%) |
| 6:00 AM to 6:29 AM | 598 (5.9%) | 548 (5.6%) |
| 6:30 AM to 6:59 AM | 716 (7.1%) | 998 (10.2%) |
| 7:00 AM to 7:29 AM | 1,347 (13.3%) | 882 (9.0%) |
| 7:30 AM to 7:59 AM | 1,187 (11.7%) | 1,983 (20.2%) |
| 8:00 AM to 8:29 AM | 1,730 (17.1%) | 1,568 (16.0%) |
| 8:30 AM to 8:59 AM | 820 (8.1%) | 934 (9.5%) |
| 9:00 AM to 9:59 AM | 977 (9.7%) | 513 (5.2%) |
| 10:00 AM to 10:59 AM | 318 (3.1%) | 426 (4.3%) |
| 11:00 AM to 11:59 AM | 64 (0.6%) | 353 (3.6%) |
| 12:00 PM to 3:59 PM | 1,045 (10.3%) | 552 (5.6%) |
| 4:00 PM to 11:59 PM | 514 (5.1%) | 673 (6.9%) |
| Total | 10,113 (100.0%) | 9,799 (100.0%) |
Housing Occupancy in Charleston
Occupancy by Ownership in Charleston
Of the total 21,746 dwellings in Charleston, owner-occupied units account for 13,217 (60.8%), while renter-occupied units make up 8,529 (39.2%).
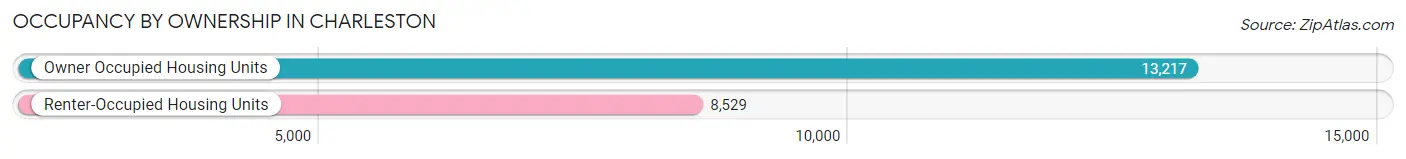
| Occupancy | # Housing Units | % Housing Units |
| Owner Occupied Housing Units | 13,217 | 60.8% |
| Renter-Occupied Housing Units | 8,529 | 39.2% |
| Total Occupied Housing Units | 21,746 | 100.0% |
Occupancy by Household Size in Charleston
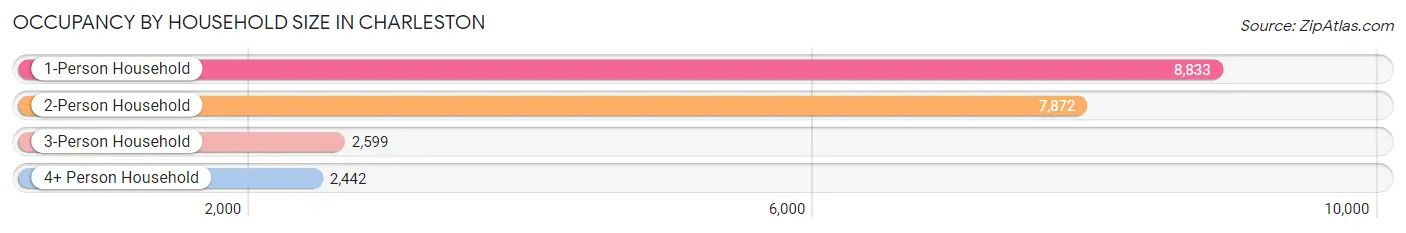
| Household Size | # Housing Units | % Housing Units |
| 1-Person Household | 8,833 | 40.6% |
| 2-Person Household | 7,872 | 36.2% |
| 3-Person Household | 2,599 | 11.9% |
| 4+ Person Household | 2,442 | 11.2% |
| Total Housing Units | 21,746 | 100.0% |
Occupancy by Ownership by Household Size in Charleston
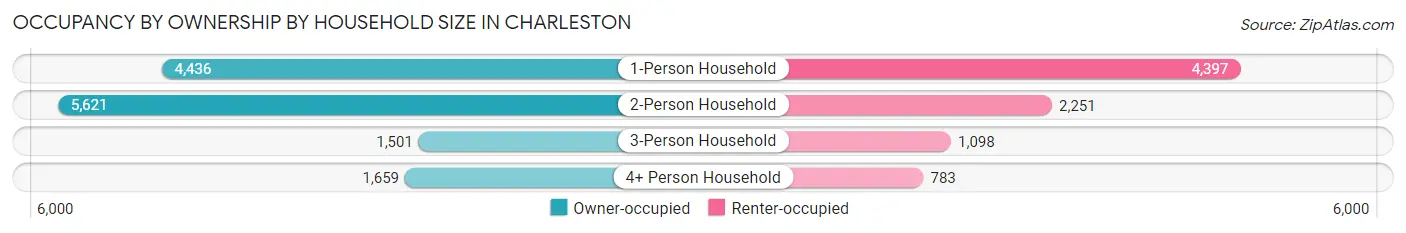
| Household Size | Owner-occupied | Renter-occupied |
| 1-Person Household | 4,436 (50.2%) | 4,397 (49.8%) |
| 2-Person Household | 5,621 (71.4%) | 2,251 (28.6%) |
| 3-Person Household | 1,501 (57.8%) | 1,098 (42.2%) |
| 4+ Person Household | 1,659 (67.9%) | 783 (32.1%) |
| Total Housing Units | 13,217 (60.8%) | 8,529 (39.2%) |
Occupancy by Educational Attainment in Charleston
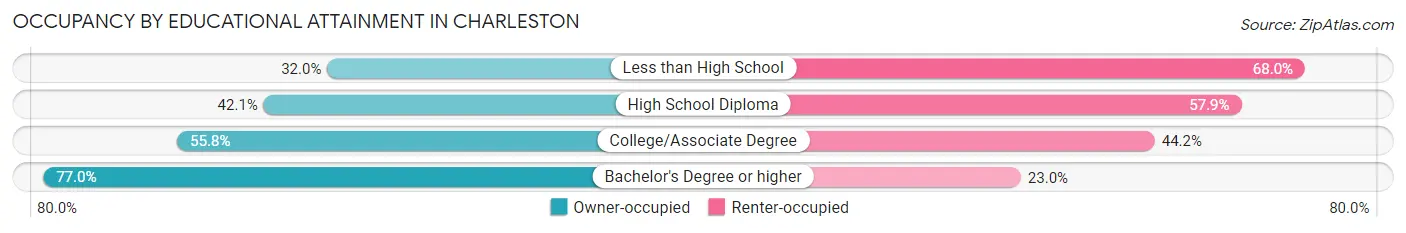
| Household Size | Owner-occupied | Renter-occupied |
| Less than High School | 440 (32.0%) | 935 (68.0%) |
| High School Diploma | 2,137 (42.1%) | 2,941 (57.9%) |
| College/Associate Degree | 3,000 (55.8%) | 2,376 (44.2%) |
| Bachelor's Degree or higher | 7,640 (77.0%) | 2,277 (23.0%) |
Occupancy by Age of Householder in Charleston
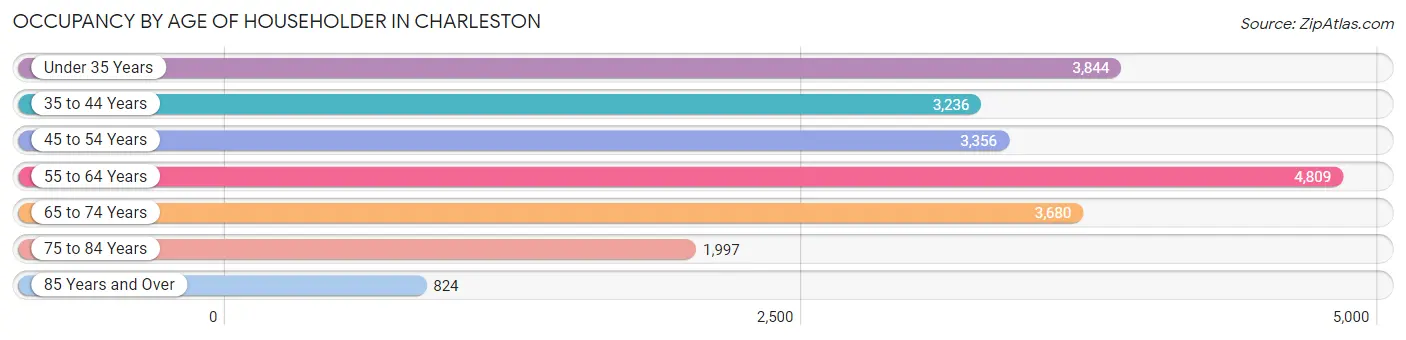
| Age Bracket | # Households | % Households |
| Under 35 Years | 3,844 | 17.7% |
| 35 to 44 Years | 3,236 | 14.9% |
| 45 to 54 Years | 3,356 | 15.4% |
| 55 to 64 Years | 4,809 | 22.1% |
| 65 to 74 Years | 3,680 | 16.9% |
| 75 to 84 Years | 1,997 | 9.2% |
| 85 Years and Over | 824 | 3.8% |
| Total | 21,746 | 100.0% |
Housing Finances in Charleston
Median Income by Occupancy in Charleston
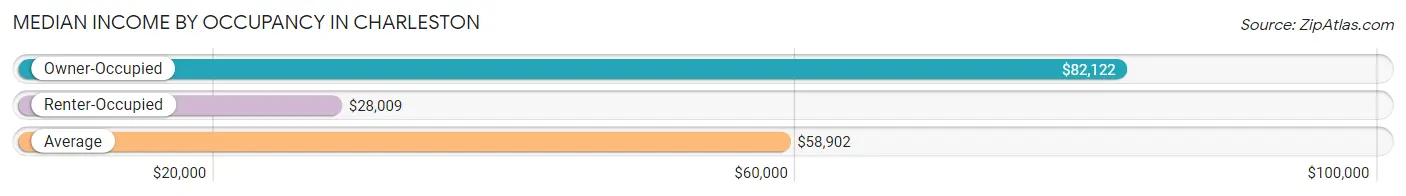
| Occupancy Type | # Households | Median Income |
| Owner-Occupied | 13,217 (60.8%) | $82,122 |
| Renter-Occupied | 8,529 (39.2%) | $28,009 |
| Average | 21,746 (100.0%) | $58,902 |
Occupancy by Householder Income Bracket in Charleston
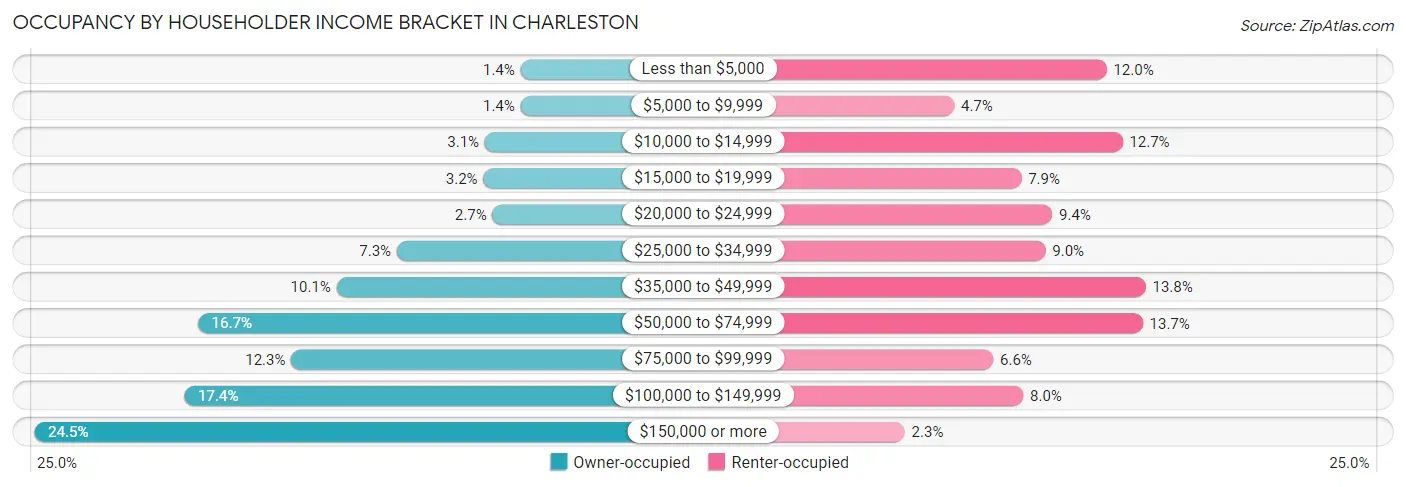
| Income Bracket | Owner-occupied | Renter-occupied |
| Less than $5,000 | 183 (1.4%) | 1,019 (11.9%) |
| $5,000 to $9,999 | 182 (1.4%) | 400 (4.7%) |
| $10,000 to $14,999 | 407 (3.1%) | 1,084 (12.7%) |
| $15,000 to $19,999 | 416 (3.2%) | 673 (7.9%) |
| $20,000 to $24,999 | 360 (2.7%) | 798 (9.4%) |
| $25,000 to $34,999 | 961 (7.3%) | 771 (9.0%) |
| $35,000 to $49,999 | 1,340 (10.1%) | 1,178 (13.8%) |
| $50,000 to $74,999 | 2,209 (16.7%) | 1,166 (13.7%) |
| $75,000 to $99,999 | 1,626 (12.3%) | 559 (6.6%) |
| $100,000 to $149,999 | 2,295 (17.4%) | 681 (8.0%) |
| $150,000 or more | 3,238 (24.5%) | 200 (2.3%) |
| Total | 13,217 (100.0%) | 8,529 (100.0%) |
Monthly Housing Cost Tiers in Charleston
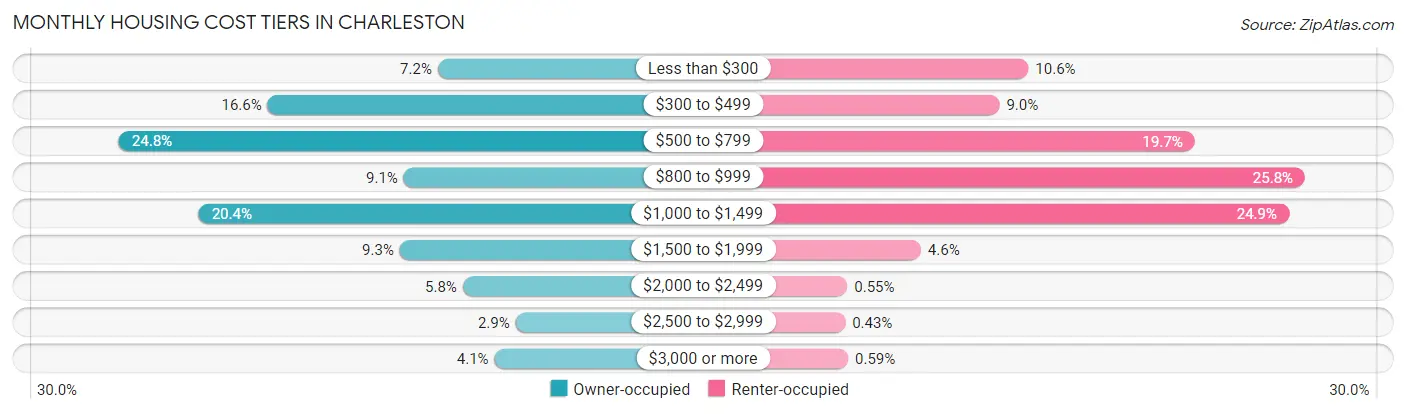
| Monthly Cost | Owner-occupied | Renter-occupied |
| Less than $300 | 949 (7.2%) | 900 (10.5%) |
| $300 to $499 | 2,191 (16.6%) | 763 (8.9%) |
| $500 to $799 | 3,276 (24.8%) | 1,683 (19.7%) |
| $800 to $999 | 1,198 (9.1%) | 2,202 (25.8%) |
| $1,000 to $1,499 | 2,694 (20.4%) | 2,126 (24.9%) |
| $1,500 to $1,999 | 1,227 (9.3%) | 393 (4.6%) |
| $2,000 to $2,499 | 767 (5.8%) | 47 (0.5%) |
| $2,500 to $2,999 | 380 (2.9%) | 37 (0.4%) |
| $3,000 or more | 535 (4.1%) | 50 (0.6%) |
| Total | 13,217 (100.0%) | 8,529 (100.0%) |
Physical Housing Characteristics in Charleston
Housing Structures in Charleston
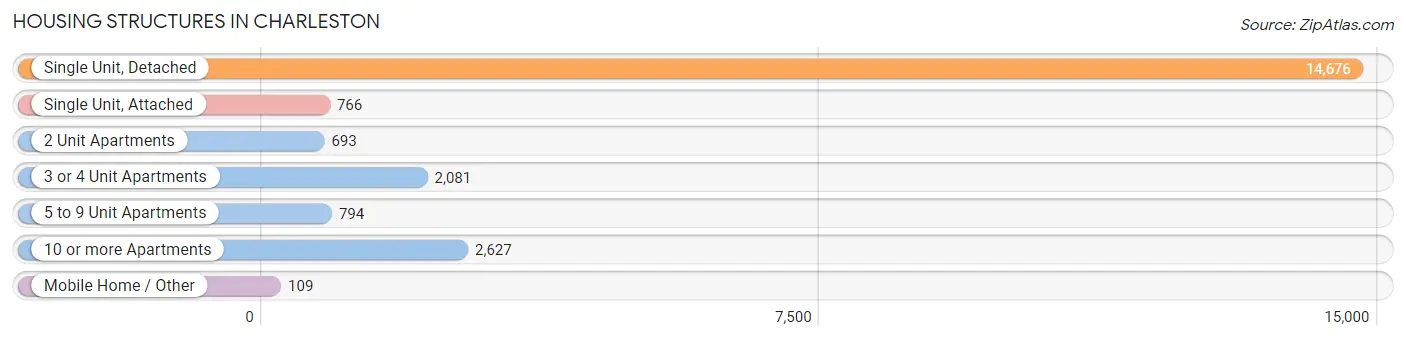
| Structure Type | # Housing Units | % Housing Units |
| Single Unit, Detached | 14,676 | 67.5% |
| Single Unit, Attached | 766 | 3.5% |
| 2 Unit Apartments | 693 | 3.2% |
| 3 or 4 Unit Apartments | 2,081 | 9.6% |
| 5 to 9 Unit Apartments | 794 | 3.6% |
| 10 or more Apartments | 2,627 | 12.1% |
| Mobile Home / Other | 109 | 0.5% |
| Total | 21,746 | 100.0% |
Housing Structures by Occupancy in Charleston
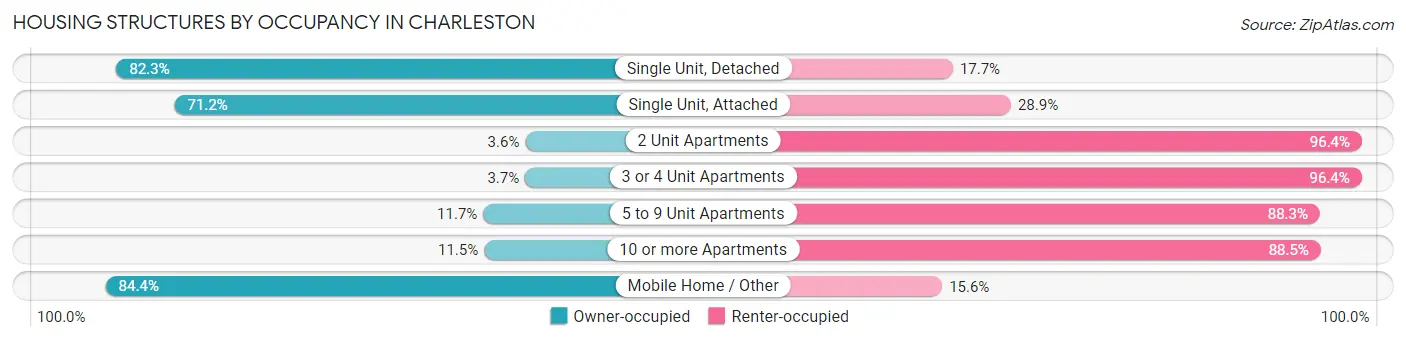
| Structure Type | Owner-occupied | Renter-occupied |
| Single Unit, Detached | 12,083 (82.3%) | 2,593 (17.7%) |
| Single Unit, Attached | 545 (71.2%) | 221 (28.8%) |
| 2 Unit Apartments | 25 (3.6%) | 668 (96.4%) |
| 3 or 4 Unit Apartments | 76 (3.6%) | 2,005 (96.4%) |
| 5 to 9 Unit Apartments | 93 (11.7%) | 701 (88.3%) |
| 10 or more Apartments | 303 (11.5%) | 2,324 (88.5%) |
| Mobile Home / Other | 92 (84.4%) | 17 (15.6%) |
| Total | 13,217 (60.8%) | 8,529 (39.2%) |
Housing Structures by Number of Rooms in Charleston
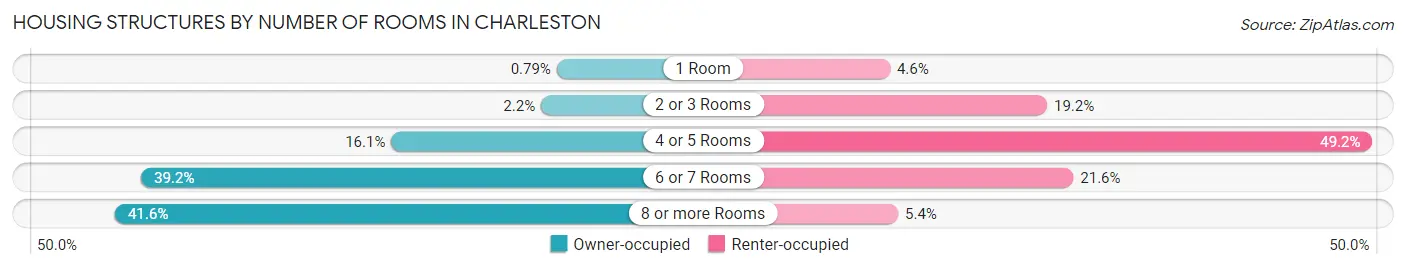
| Number of Rooms | Owner-occupied | Renter-occupied |
| 1 Room | 105 (0.8%) | 395 (4.6%) |
| 2 or 3 Rooms | 296 (2.2%) | 1,634 (19.2%) |
| 4 or 5 Rooms | 2,127 (16.1%) | 4,200 (49.2%) |
| 6 or 7 Rooms | 5,185 (39.2%) | 1,841 (21.6%) |
| 8 or more Rooms | 5,504 (41.6%) | 459 (5.4%) |
| Total | 13,217 (100.0%) | 8,529 (100.0%) |
Housing Structure by Heating Type in Charleston
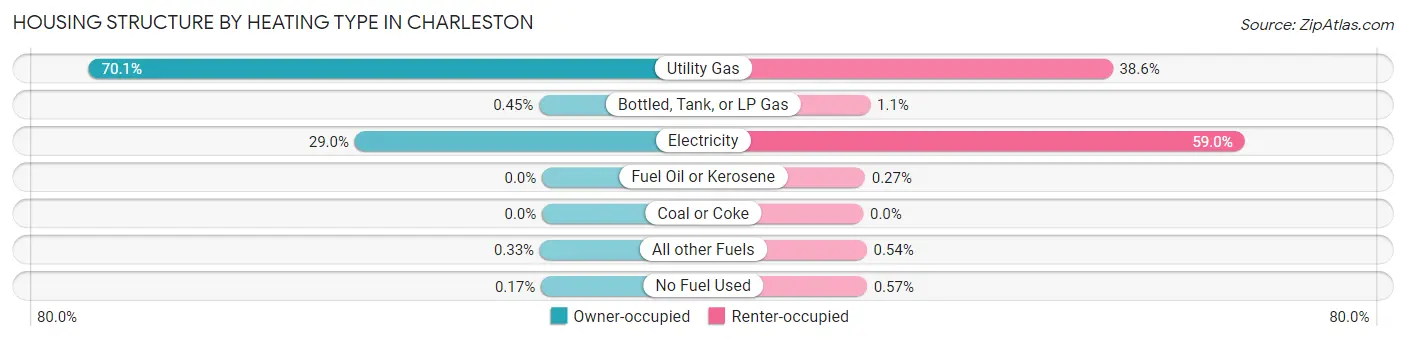
| Heating Type | Owner-occupied | Renter-occupied |
| Utility Gas | 9,265 (70.1%) | 3,289 (38.6%) |
| Bottled, Tank, or LP Gas | 60 (0.4%) | 93 (1.1%) |
| Electricity | 3,826 (28.9%) | 5,029 (59.0%) |
| Fuel Oil or Kerosene | 0 (0.0%) | 23 (0.3%) |
| Coal or Coke | 0 (0.0%) | 0 (0.0%) |
| All other Fuels | 44 (0.3%) | 46 (0.5%) |
| No Fuel Used | 22 (0.2%) | 49 (0.6%) |
| Total | 13,217 (100.0%) | 8,529 (100.0%) |
Household Vehicle Usage in Charleston
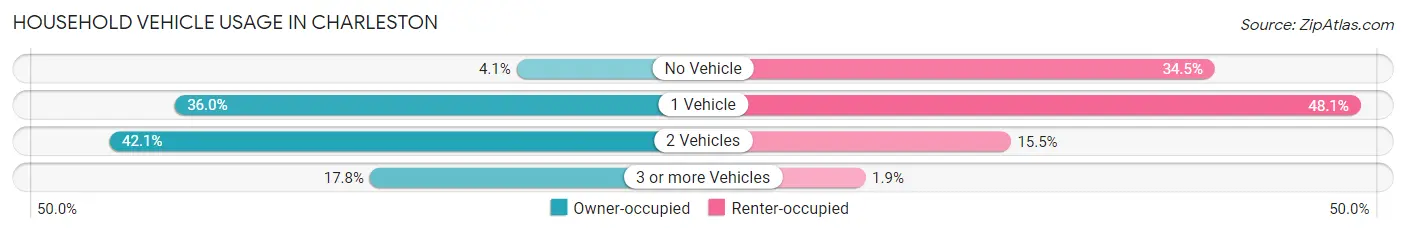
| Vehicles per Household | Owner-occupied | Renter-occupied |
| No Vehicle | 539 (4.1%) | 2,944 (34.5%) |
| 1 Vehicle | 4,762 (36.0%) | 4,106 (48.1%) |
| 2 Vehicles | 5,566 (42.1%) | 1,318 (15.4%) |
| 3 or more Vehicles | 2,350 (17.8%) | 161 (1.9%) |
| Total | 13,217 (100.0%) | 8,529 (100.0%) |
Real Estate & Mortgages in Charleston
Real Estate and Mortgage Overview in Charleston
| Characteristic | Without Mortgage | With Mortgage |
| Housing Units | 6,092 | 7,125 |
| Median Property Value | $146,900 | $187,200 |
| Median Household Income | $65,532 | $2,005 |
| Monthly Housing Costs | $494 | $531 |
| Real Estate Taxes | $1,210 | $190 |
Property Value by Mortgage Status in Charleston
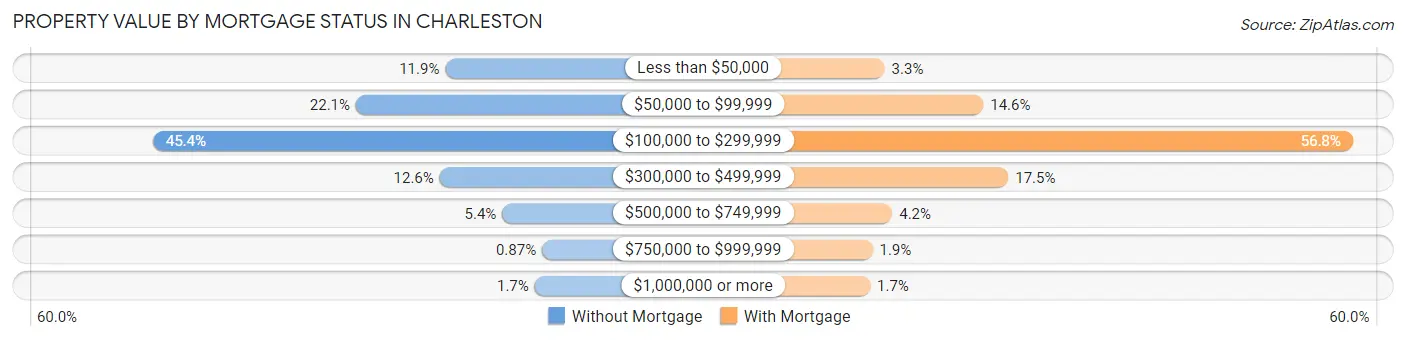
| Property Value | Without Mortgage | With Mortgage |
| Less than $50,000 | 727 (11.9%) | 237 (3.3%) |
| $50,000 to $99,999 | 1,349 (22.1%) | 1,040 (14.6%) |
| $100,000 to $299,999 | 2,763 (45.4%) | 4,049 (56.8%) |
| $300,000 to $499,999 | 766 (12.6%) | 1,244 (17.5%) |
| $500,000 to $749,999 | 330 (5.4%) | 299 (4.2%) |
| $750,000 to $999,999 | 53 (0.9%) | 138 (1.9%) |
| $1,000,000 or more | 104 (1.7%) | 118 (1.7%) |
| Total | 6,092 (100.0%) | 7,125 (100.0%) |
Household Income by Mortgage Status in Charleston
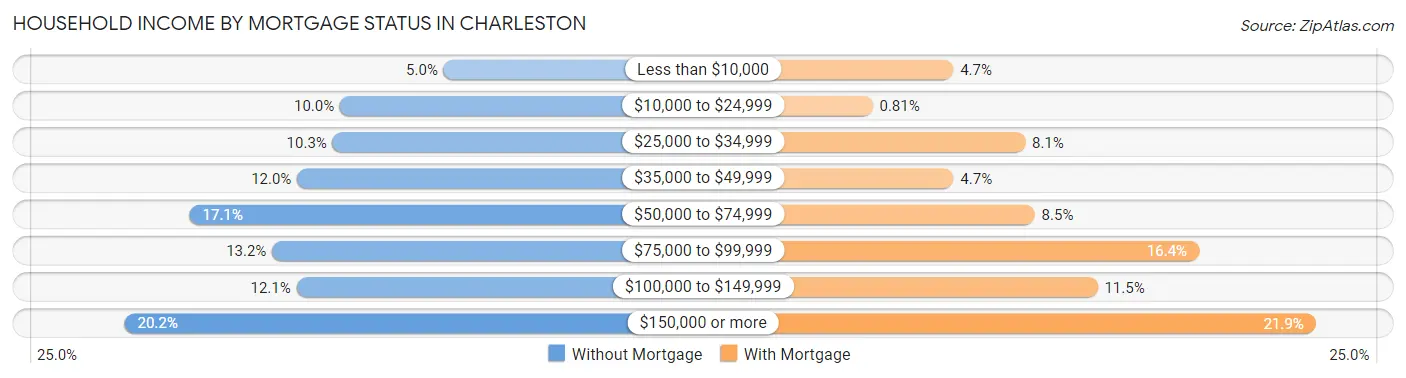
| Household Income | Without Mortgage | With Mortgage |
| Less than $10,000 | 307 (5.0%) | 331 (4.6%) |
| $10,000 to $24,999 | 608 (10.0%) | 58 (0.8%) |
| $25,000 to $34,999 | 629 (10.3%) | 575 (8.1%) |
| $35,000 to $49,999 | 732 (12.0%) | 332 (4.7%) |
| $50,000 to $74,999 | 1,044 (17.1%) | 608 (8.5%) |
| $75,000 to $99,999 | 805 (13.2%) | 1,165 (16.4%) |
| $100,000 to $149,999 | 734 (12.0%) | 821 (11.5%) |
| $150,000 or more | 1,233 (20.2%) | 1,561 (21.9%) |
| Total | 6,092 (100.0%) | 7,125 (100.0%) |
Property Value to Household Income Ratio in Charleston
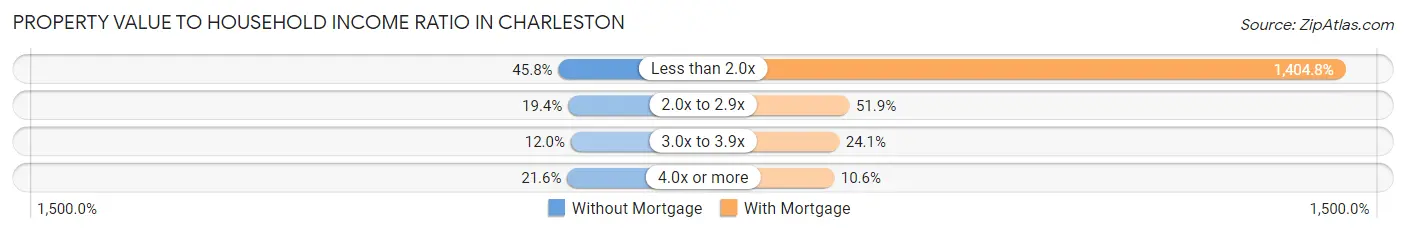
| Value-to-Income Ratio | Without Mortgage | With Mortgage |
| Less than 2.0x | 2,788 (45.8%) | 100,093 (1,404.8%) |
| 2.0x to 2.9x | 1,183 (19.4%) | 3,697 (51.9%) |
| 3.0x to 3.9x | 730 (12.0%) | 1,716 (24.1%) |
| 4.0x or more | 1,313 (21.5%) | 753 (10.6%) |
| Total | 6,092 (100.0%) | 7,125 (100.0%) |
Real Estate Taxes by Mortgage Status in Charleston
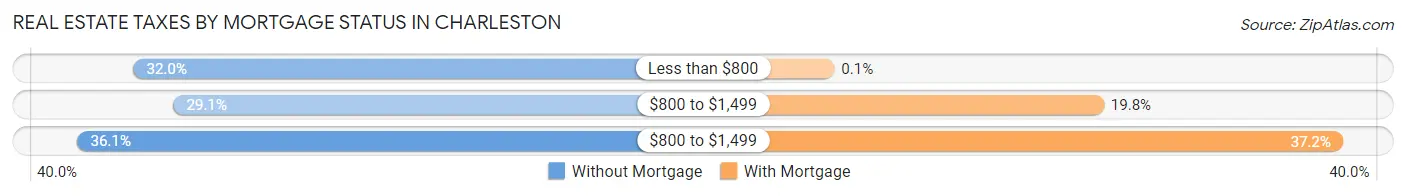
| Property Taxes | Without Mortgage | With Mortgage |
| Less than $800 | 1,952 (32.0%) | 7 (0.1%) |
| $800 to $1,499 | 1,774 (29.1%) | 1,410 (19.8%) |
| $800 to $1,499 | 2,201 (36.1%) | 2,653 (37.2%) |
| Total | 6,092 (100.0%) | 7,125 (100.0%) |
Health & Disability in Charleston
Health Insurance Coverage by Age in Charleston
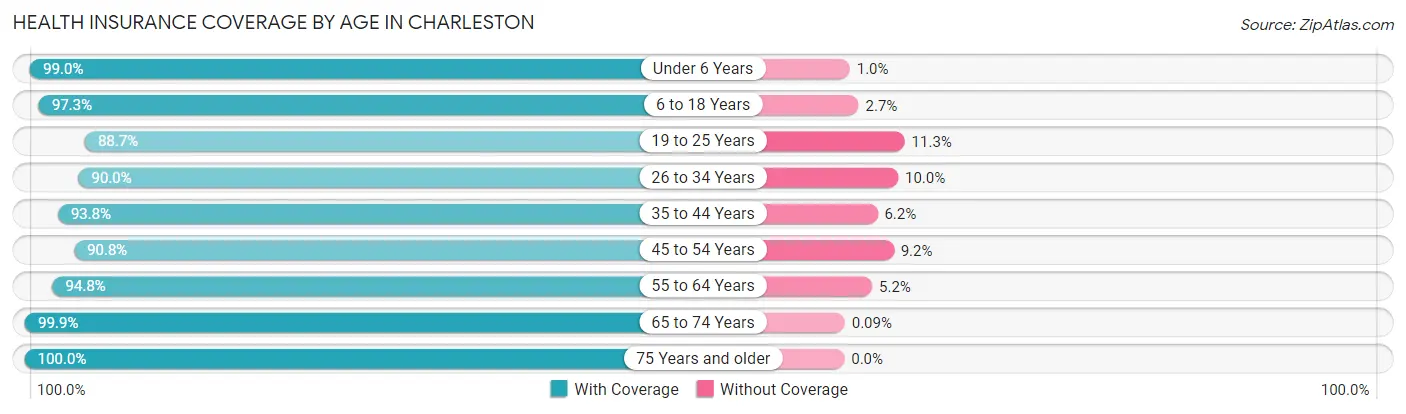
| Age Bracket | With Coverage | Without Coverage |
| Under 6 Years | 2,714 (99.0%) | 28 (1.0%) |
| 6 to 18 Years | 6,731 (97.3%) | 184 (2.7%) |
| 19 to 25 Years | 3,294 (88.7%) | 418 (11.3%) |
| 26 to 34 Years | 5,104 (90.0%) | 569 (10.0%) |
| 35 to 44 Years | 5,465 (93.8%) | 360 (6.2%) |
| 45 to 54 Years | 5,265 (90.8%) | 534 (9.2%) |
| 55 to 64 Years | 6,652 (94.8%) | 364 (5.2%) |
| 65 to 74 Years | 5,509 (99.9%) | 5 (0.1%) |
| 75 Years and older | 4,051 (100.0%) | 0 (0.0%) |
| Total | 44,785 (94.8%) | 2,462 (5.2%) |
Health Insurance Coverage by Citizenship Status in Charleston
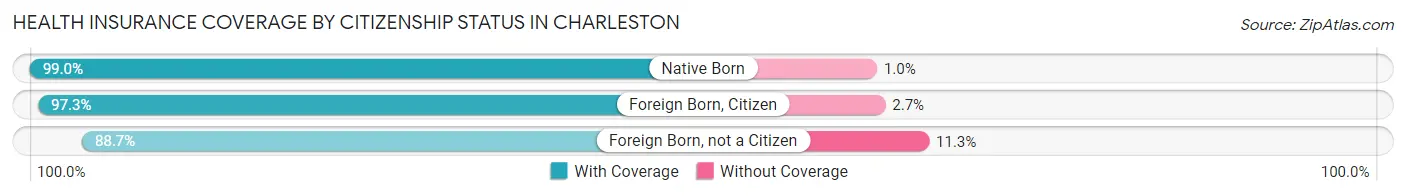
| Citizenship Status | With Coverage | Without Coverage |
| Native Born | 2,714 (99.0%) | 28 (1.0%) |
| Foreign Born, Citizen | 6,731 (97.3%) | 184 (2.7%) |
| Foreign Born, not a Citizen | 3,294 (88.7%) | 418 (11.3%) |
Health Insurance Coverage by Household Income in Charleston
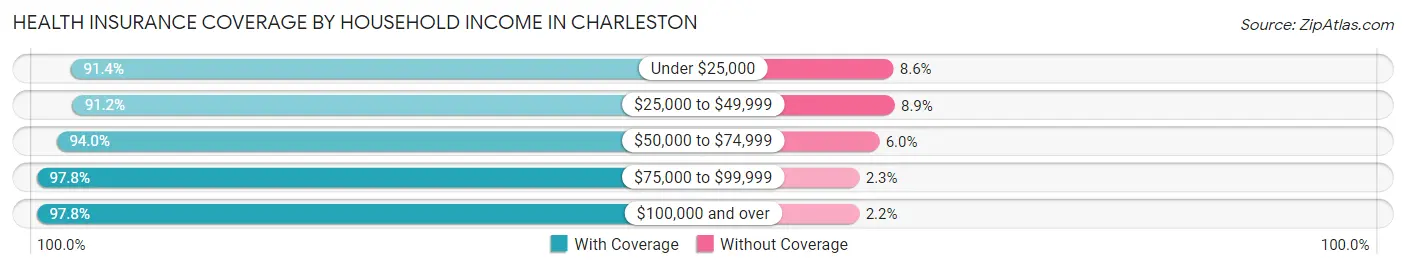
| Household Income | With Coverage | Without Coverage |
| Under $25,000 | 7,991 (91.4%) | 755 (8.6%) |
| $25,000 to $49,999 | 7,491 (91.1%) | 727 (8.8%) |
| $50,000 to $74,999 | 6,136 (94.0%) | 390 (6.0%) |
| $75,000 to $99,999 | 4,683 (97.8%) | 108 (2.2%) |
| $100,000 and over | 17,371 (97.8%) | 396 (2.2%) |
Public vs Private Health Insurance Coverage by Age in Charleston
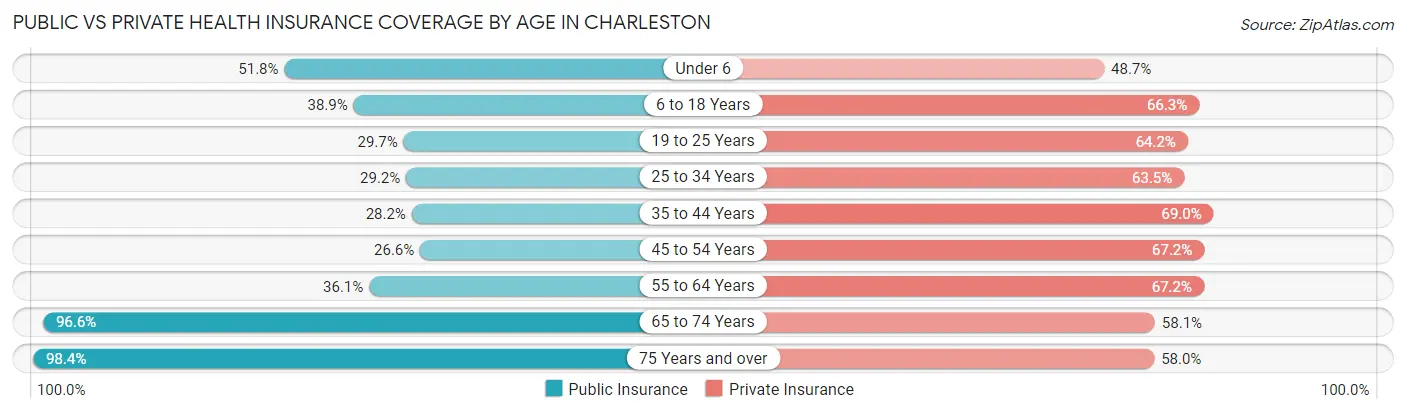
| Age Bracket | Public Insurance | Private Insurance |
| Under 6 | 1,420 (51.8%) | 1,335 (48.7%) |
| 6 to 18 Years | 2,693 (38.9%) | 4,585 (66.3%) |
| 19 to 25 Years | 1,101 (29.7%) | 2,383 (64.2%) |
| 25 to 34 Years | 1,656 (29.2%) | 3,604 (63.5%) |
| 35 to 44 Years | 1,640 (28.1%) | 4,020 (69.0%) |
| 45 to 54 Years | 1,542 (26.6%) | 3,899 (67.2%) |
| 55 to 64 Years | 2,529 (36.0%) | 4,714 (67.2%) |
| 65 to 74 Years | 5,326 (96.6%) | 3,205 (58.1%) |
| 75 Years and over | 3,988 (98.4%) | 2,349 (58.0%) |
| Total | 21,895 (46.3%) | 30,094 (63.7%) |
Disability Status by Sex by Age in Charleston
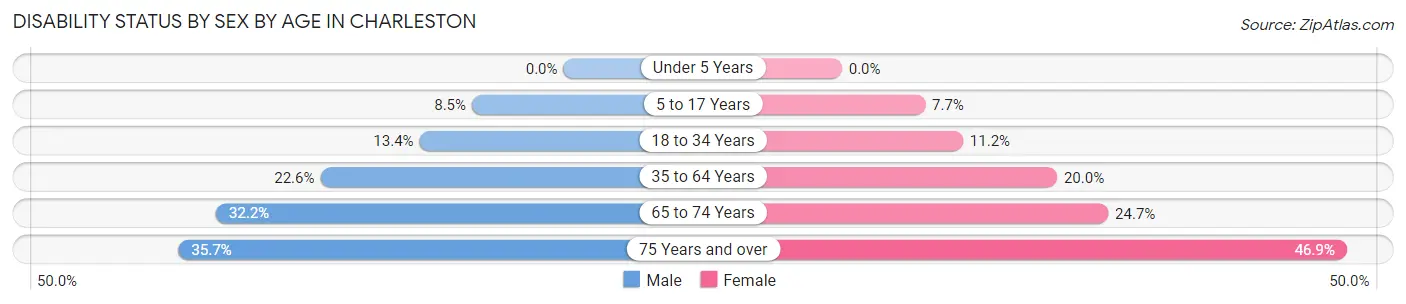
| Age Bracket | Male | Female |
| Under 5 Years | 0 (0.0%) | 0 (0.0%) |
| 5 to 17 Years | 303 (8.5%) | 228 (7.7%) |
| 18 to 34 Years | 650 (13.4%) | 602 (11.2%) |
| 35 to 64 Years | 2,058 (22.6%) | 1,901 (20.0%) |
| 65 to 74 Years | 878 (32.2%) | 690 (24.7%) |
| 75 Years and over | 594 (35.7%) | 1,119 (46.9%) |
Disability Class by Sex by Age in Charleston
Disability Class: Hearing Difficulty
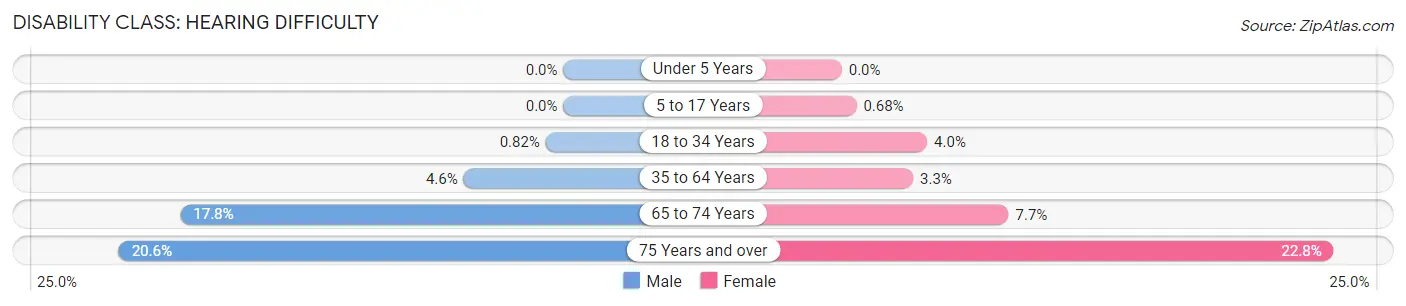
| Age Bracket | Male | Female |
| Under 5 Years | 0 (0.0%) | 0 (0.0%) |
| 5 to 17 Years | 0 (0.0%) | 20 (0.7%) |
| 18 to 34 Years | 40 (0.8%) | 212 (4.0%) |
| 35 to 64 Years | 422 (4.6%) | 315 (3.3%) |
| 65 to 74 Years | 484 (17.8%) | 216 (7.7%) |
| 75 Years and over | 343 (20.6%) | 545 (22.8%) |
Disability Class: Vision Difficulty
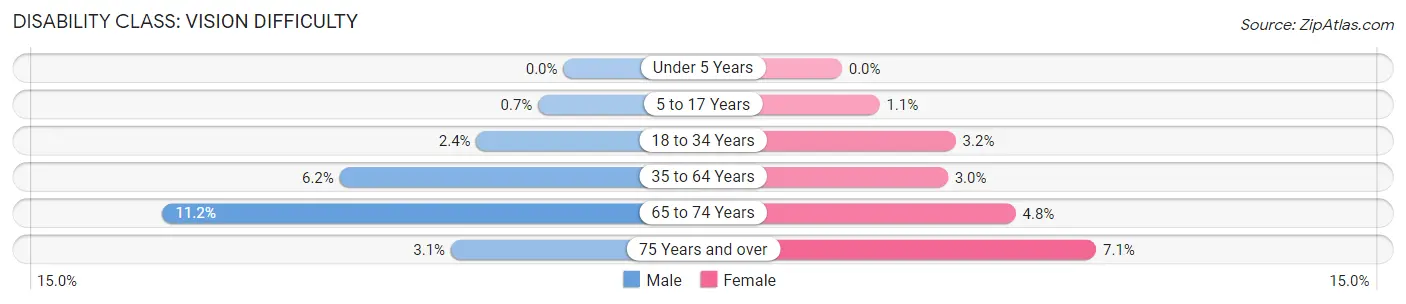
| Age Bracket | Male | Female |
| Under 5 Years | 0 (0.0%) | 0 (0.0%) |
| 5 to 17 Years | 25 (0.7%) | 31 (1.1%) |
| 18 to 34 Years | 118 (2.4%) | 170 (3.2%) |
| 35 to 64 Years | 568 (6.2%) | 281 (2.9%) |
| 65 to 74 Years | 304 (11.2%) | 135 (4.8%) |
| 75 Years and over | 52 (3.1%) | 169 (7.1%) |
Disability Class: Cognitive Difficulty
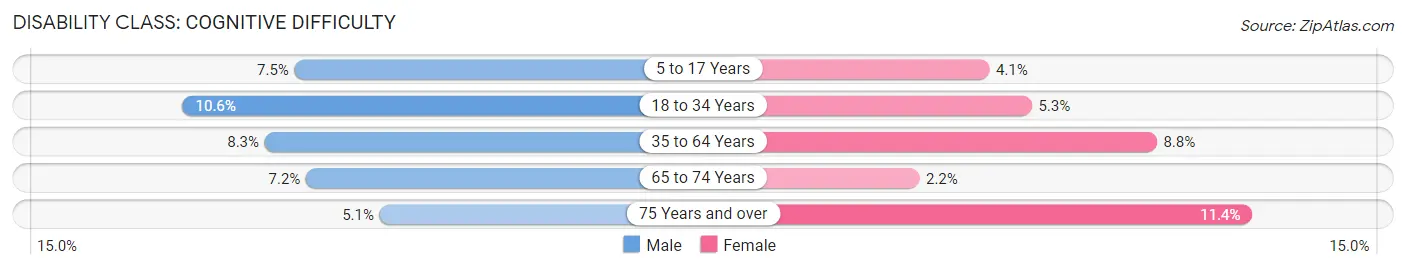
| Age Bracket | Male | Female |
| 5 to 17 Years | 267 (7.5%) | 121 (4.1%) |
| 18 to 34 Years | 516 (10.6%) | 283 (5.3%) |
| 35 to 64 Years | 758 (8.3%) | 834 (8.8%) |
| 65 to 74 Years | 195 (7.2%) | 60 (2.1%) |
| 75 Years and over | 85 (5.1%) | 273 (11.4%) |
Disability Class: Ambulatory Difficulty
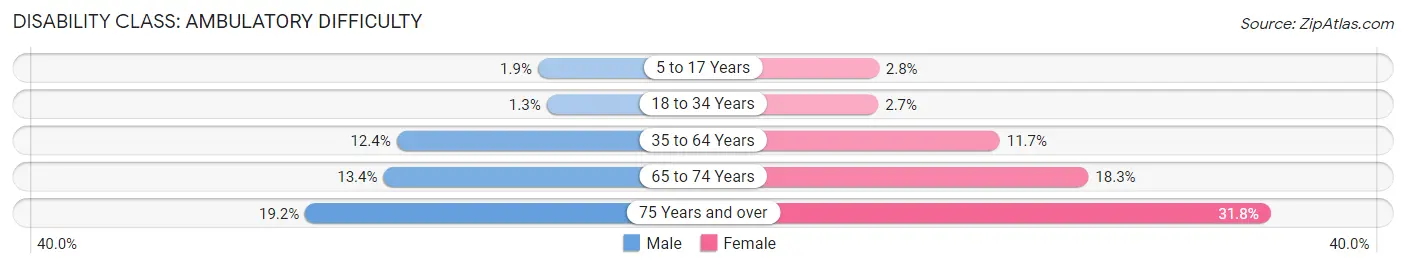
| Age Bracket | Male | Female |
| 5 to 17 Years | 68 (1.9%) | 81 (2.8%) |
| 18 to 34 Years | 61 (1.3%) | 145 (2.7%) |
| 35 to 64 Years | 1,130 (12.4%) | 1,117 (11.7%) |
| 65 to 74 Years | 364 (13.4%) | 511 (18.3%) |
| 75 Years and over | 319 (19.2%) | 760 (31.8%) |
Disability Class: Self-Care Difficulty
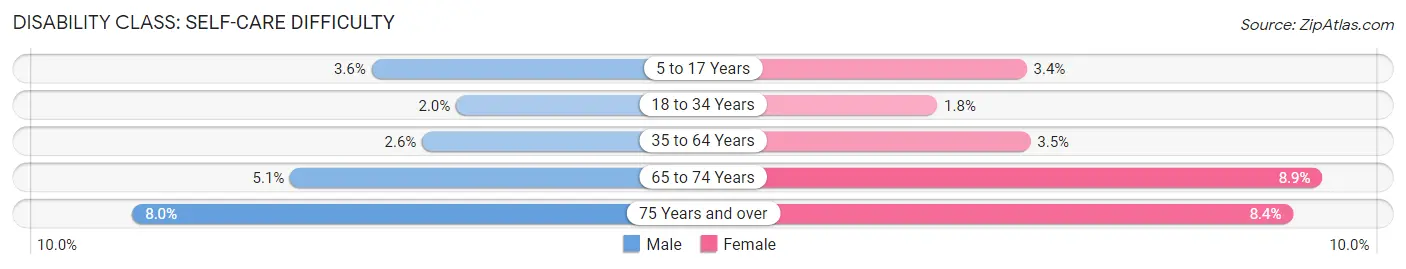
| Age Bracket | Male | Female |
| 5 to 17 Years | 127 (3.6%) | 101 (3.4%) |
| 18 to 34 Years | 97 (2.0%) | 95 (1.8%) |
| 35 to 64 Years | 239 (2.6%) | 333 (3.5%) |
| 65 to 74 Years | 138 (5.1%) | 249 (8.9%) |
| 75 Years and over | 133 (8.0%) | 200 (8.4%) |
Technology Access in Charleston
Computing Device Access in Charleston
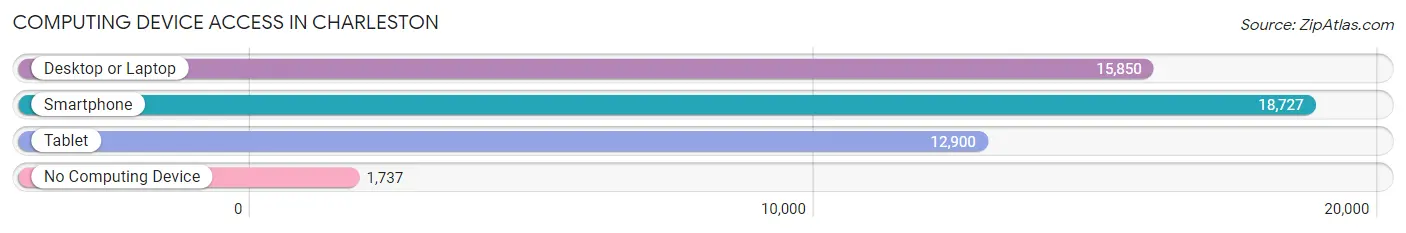
| Device Type | # Households | % Households |
| Desktop or Laptop | 15,850 | 72.9% |
| Smartphone | 18,727 | 86.1% |
| Tablet | 12,900 | 59.3% |
| No Computing Device | 1,737 | 8.0% |
| Total | 21,746 | 100.0% |
Internet Access in Charleston
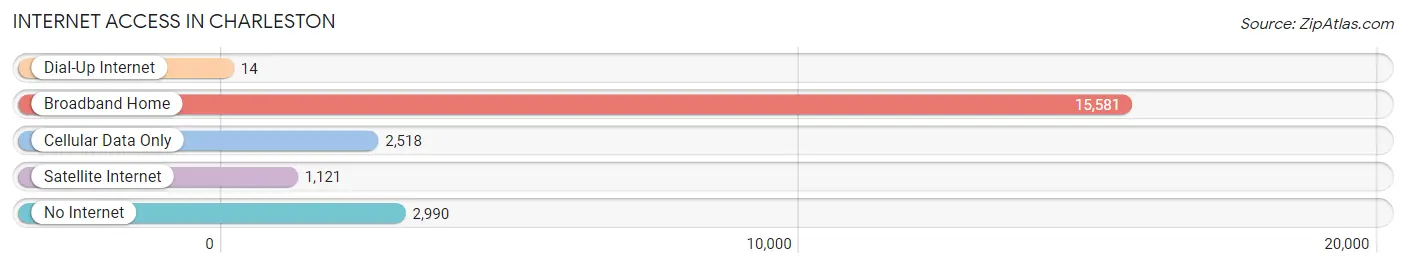
| Internet Type | # Households | % Households |
| Dial-Up Internet | 14 | 0.1% |
| Broadband Home | 15,581 | 71.7% |
| Cellular Data Only | 2,518 | 11.6% |
| Satellite Internet | 1,121 | 5.1% |
| No Internet | 2,990 | 13.8% |
| Total | 21,746 | 100.0% |
Charleston Summary
Charleston, West Virginia is the capital and largest city in the state of West Virginia. It is located in the Kanawha Valley, along the Kanawha River, and is the county seat of Kanawha County. The city has a population of approximately 50,000 people, making it the largest city in the state.
History
Charleston was founded in 1788 by Colonel George Clendenin and named after his father, Charles Clendenin. The city was originally a trading post and was the site of the first state capital of West Virginia. In 1818, the city was incorporated and became the county seat of Kanawha County.
During the Civil War, Charleston was the site of several battles, including the Battle of Charleston in 1861. The city was also the site of the Battle of Scary Creek in 1782, which was the first battle of the American Revolutionary War.
In the late 19th century, Charleston became an important industrial center, with the development of the coal and chemical industries. The city was also the site of the first oil refinery in the United States.
Geography
Charleston is located in the Kanawha Valley, along the Kanawha River. The city is situated at the confluence of the Elk and Kanawha Rivers. The city is located in the Appalachian Mountains and is surrounded by hills and mountains.
The climate in Charleston is humid subtropical, with hot, humid summers and cold, wet winters. The average annual temperature is around 57°F (14°C).
Economy
Charleston is the economic center of West Virginia. The city is home to several major industries, including coal mining, chemical production, and oil refining. The city is also home to several large corporations, including Bayer, Dow Chemical, and DuPont.
The city is also home to several universities, including West Virginia University, Marshall University, and the University of Charleston.
Demographics
As of the 2010 census, the population of Charleston was 50,404. The racial makeup of the city was 79.2% White, 15.2% African American, 0.3% Native American, 1.2% Asian, 0.1% Pacific Islander, and 3.0% from other races. The median household income was $37,837.
The city is home to several religious denominations, including Baptist, Methodist, Presbyterian, and Roman Catholic. The city is also home to several cultural institutions, including the Clay Center for the Arts and Sciences, the West Virginia State Museum, and the Charleston Civic Center.
Common Questions
What is Per Capita Income in Charleston?
Per Capita income in Charleston is $44,639.
What is the Median Family Income in Charleston?
Median Family Income in Charleston is $87,108.
What is the Median Household income in Charleston?
Median Household Income in Charleston is $58,902.
What is Income or Wage Gap in Charleston?
Income or Wage Gap in Charleston is 8.1%.
Women in Charleston earn 91.9 cents for every dollar earned by a man.
What is Family Income Deficit in Charleston?
Family Income Deficit in Charleston is $12,939.
Families that are below poverty line in Charleston earn $12,939 less on average than the poverty threshold level.
What is Inequality or Gini Index in Charleston?
Inequality or Gini Index in Charleston is 0.56.
What is the Total Population of Charleston?
Total Population of Charleston is 48,415.
What is the Total Male Population of Charleston?
Total Male Population of Charleston is 23,862.
What is the Total Female Population of Charleston?
Total Female Population of Charleston is 24,553.
What is the Ratio of Males per 100 Females in Charleston?
There are 97.19 Males per 100 Females in Charleston.
What is the Ratio of Females per 100 Males in Charleston?
There are 102.90 Females per 100 Males in Charleston.
What is the Median Population Age in Charleston?
Median Population Age in Charleston is 42.2 Years.
What is the Average Family Size in Charleston
Average Family Size in Charleston is 2.9 People.
What is the Average Household Size in Charleston
Average Household Size in Charleston is 2.1 People.
How Large is the Labor Force in Charleston?
There are 23,264 People in the Labor Forcein in Charleston.
What is the Percentage of People in the Labor Force in Charleston?
57.0% of People are in the Labor Force in Charleston.
What is the Unemployment Rate in Charleston?
Unemployment Rate in Charleston is 5.8%.