Midland, TX Map & Demographics
Midland Map

Midland Overview
$47,870
PER CAPITA INCOME
$109,030
AVG FAMILY INCOME
$90,448
AVG HOUSEHOLD INCOME
43.1%
WAGE / INCOME GAP [ % ]
56.9¢/ $1
WAGE / INCOME GAP [ $ ]
$9,732
FAMILY INCOME DEFICIT
0.47
INEQUALITY / GINI INDEX
132,490
TOTAL POPULATION
68,593
MALE POPULATION
63,897
FEMALE POPULATION
107.35
MALES / 100 FEMALES
93.15
FEMALES / 100 MALES
31.4
MEDIAN AGE
3.2
AVG FAMILY SIZE
2.5
AVG HOUSEHOLD SIZE
70,021
LABOR FORCE [ PEOPLE ]
71.5%
PERCENT IN LABOR FORCE
3.2%
UNEMPLOYMENT RATE
Midland Area Codes
Income in Midland
Income Overview in Midland
Per Capita Income in Midland is $47,870, while median incomes of families and households are $109,030 and $90,448 respectively.
| Characteristic | Number | Measure |
| Per Capita Income | 132,490 | $47,870 |
| Median Family Income | 34,247 | $109,030 |
| Mean Family Income | 34,247 | $142,772 |
| Median Household Income | 51,460 | $90,448 |
| Mean Household Income | 51,460 | $123,556 |
| Income Deficit | 34,247 | $9,732 |
| Wage / Income Gap (%) | 132,490 | 43.14% |
| Wage / Income Gap ($) | 132,490 | 56.86¢ per $1 |
| Gini / Inequality Index | 132,490 | 0.47 |
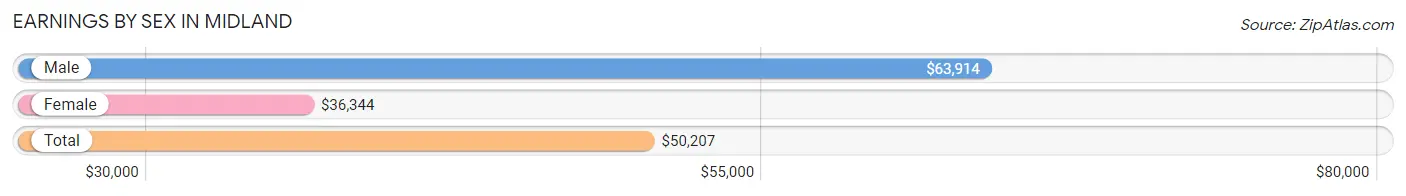
Earnings by Sex in Midland
Average Earnings in Midland are $50,207, $63,914 for men and $36,344 for women, a difference of 43.1%.
| Sex | Number | Average Earnings |
| Male | 43,027 (58.5%) | $63,914 |
| Female | 30,476 (41.5%) | $36,344 |
| Total | 73,503 (100.0%) | $50,207 |
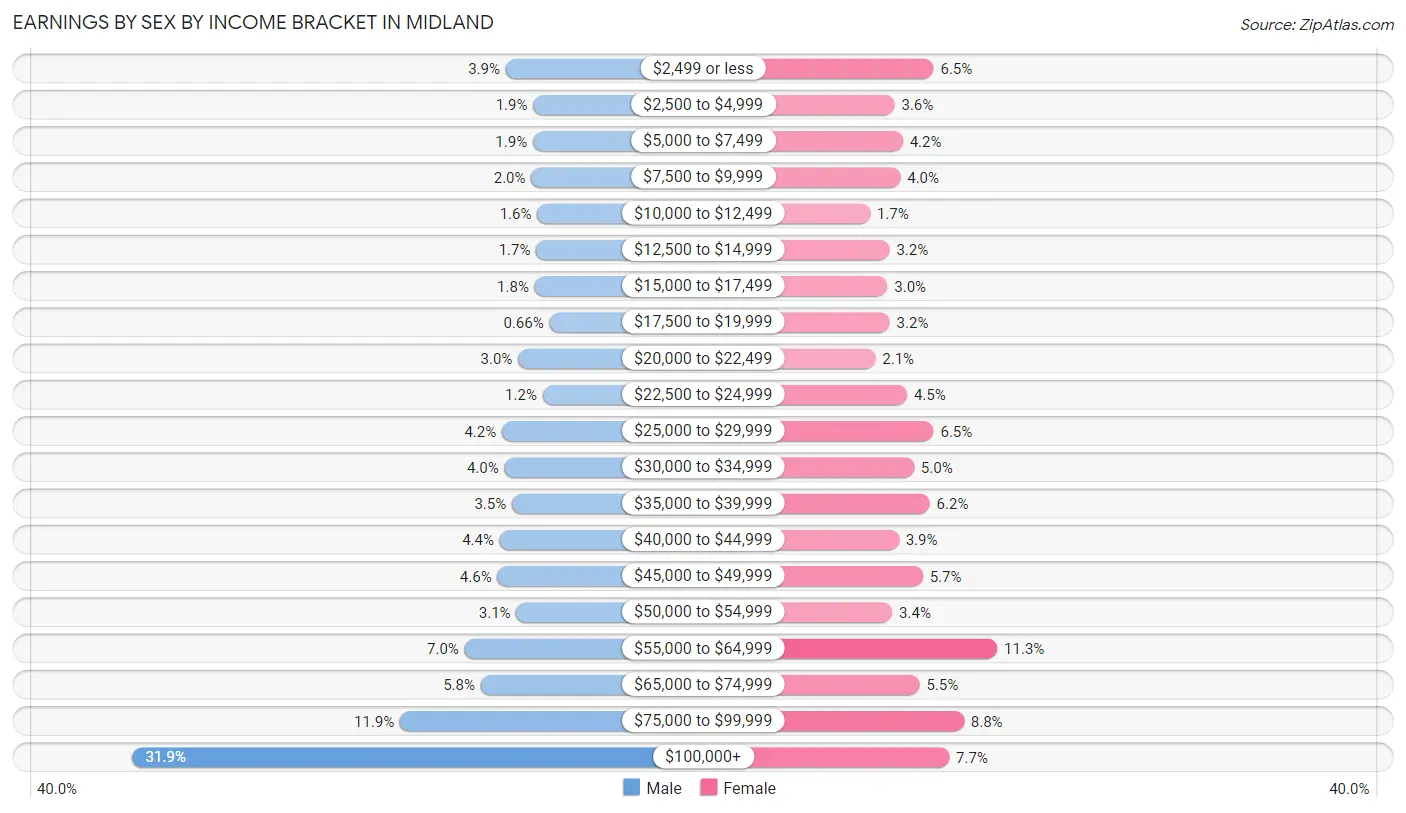
Earnings by Sex by Income Bracket in Midland
The most common earnings brackets in Midland are $100,000+ for men (13,730 | 31.9%) and $55,000 to $64,999 for women (3,435 | 11.3%).
| Income | Male | Female |
| $2,499 or less | 1,695 (3.9%) | 1,981 (6.5%) |
| $2,500 to $4,999 | 809 (1.9%) | 1,090 (3.6%) |
| $5,000 to $7,499 | 816 (1.9%) | 1,277 (4.2%) |
| $7,500 to $9,999 | 871 (2.0%) | 1,222 (4.0%) |
| $10,000 to $12,499 | 678 (1.6%) | 530 (1.7%) |
| $12,500 to $14,999 | 712 (1.7%) | 974 (3.2%) |
| $15,000 to $17,499 | 760 (1.8%) | 927 (3.0%) |
| $17,500 to $19,999 | 285 (0.7%) | 978 (3.2%) |
| $20,000 to $22,499 | 1,296 (3.0%) | 652 (2.1%) |
| $22,500 to $24,999 | 503 (1.2%) | 1,375 (4.5%) |
| $25,000 to $29,999 | 1,816 (4.2%) | 1,982 (6.5%) |
| $30,000 to $34,999 | 1,735 (4.0%) | 1,534 (5.0%) |
| $35,000 to $39,999 | 1,493 (3.5%) | 1,893 (6.2%) |
| $40,000 to $44,999 | 1,891 (4.4%) | 1,184 (3.9%) |
| $45,000 to $49,999 | 1,961 (4.6%) | 1,734 (5.7%) |
| $50,000 to $54,999 | 1,352 (3.1%) | 1,036 (3.4%) |
| $55,000 to $64,999 | 3,019 (7.0%) | 3,435 (11.3%) |
| $65,000 to $74,999 | 2,501 (5.8%) | 1,660 (5.4%) |
| $75,000 to $99,999 | 5,104 (11.9%) | 2,674 (8.8%) |
| $100,000+ | 13,730 (31.9%) | 2,338 (7.7%) |
| Total | 43,027 (100.0%) | 30,476 (100.0%) |
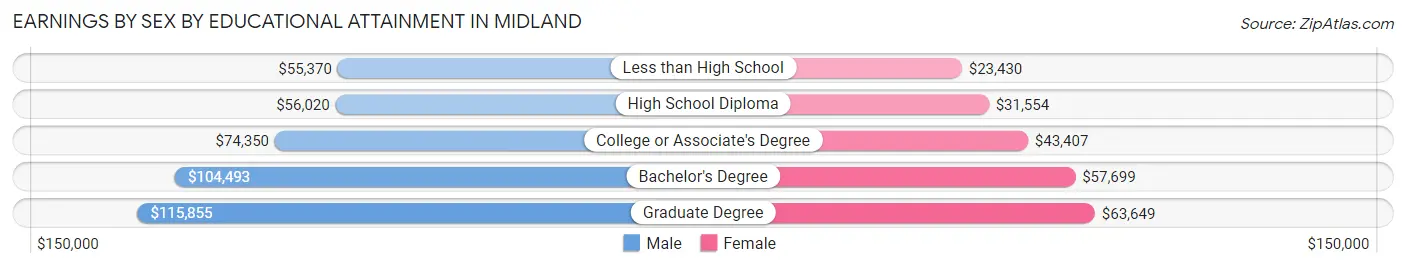
Earnings by Sex by Educational Attainment in Midland
Average earnings in Midland are $74,984 for men and $43,194 for women, a difference of 42.4%. Men with an educational attainment of graduate degree enjoy the highest average annual earnings of $115,855, while those with less than high school education earn the least with $55,370. Women with an educational attainment of graduate degree earn the most with the average annual earnings of $63,649, while those with less than high school education have the smallest earnings of $23,430.
| Educational Attainment | Male Income | Female Income |
| Less than High School | $55,370 | $23,430 |
| High School Diploma | $56,020 | $31,554 |
| College or Associate's Degree | $74,350 | $43,407 |
| Bachelor's Degree | $104,493 | $57,699 |
| Graduate Degree | $115,855 | $63,649 |
| Total | $74,984 | $43,194 |
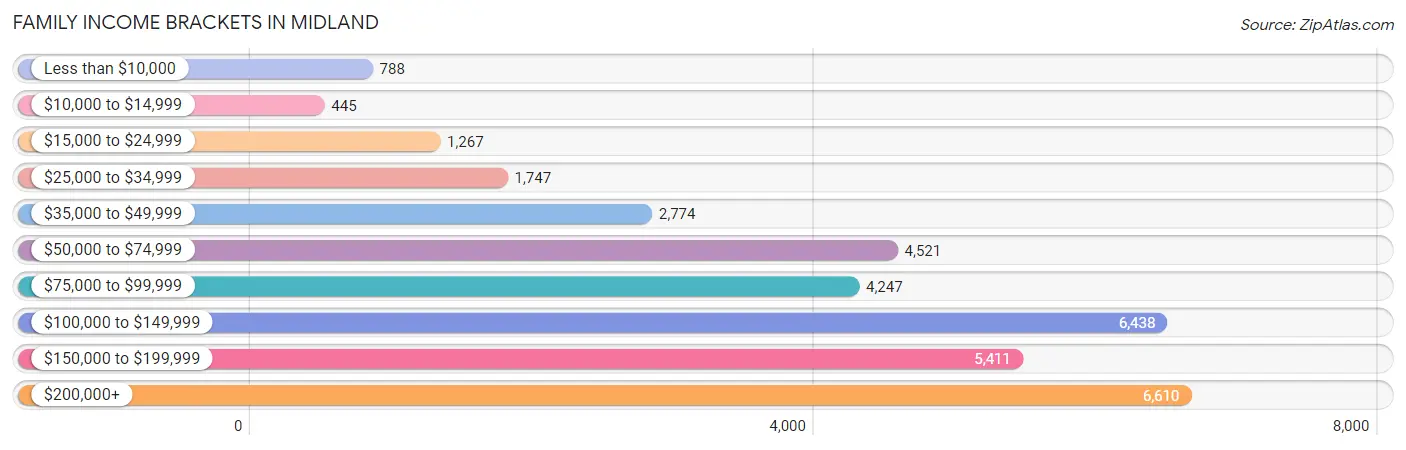
Family Income in Midland
Family Income Brackets in Midland
According to the Midland family income data, there are 6,610 families falling into the $200,000+ income range, which is the most common income bracket and makes up 19.3% of all families. Conversely, the $10,000 to $14,999 income bracket is the least frequent group with only 445 families (1.3%) belonging to this category.
| Income Bracket | # Families | % Families |
| Less than $10,000 | 788 | 2.3% |
| $10,000 to $14,999 | 445 | 1.3% |
| $15,000 to $24,999 | 1,267 | 3.7% |
| $25,000 to $34,999 | 1,747 | 5.1% |
| $35,000 to $49,999 | 2,774 | 8.1% |
| $50,000 to $74,999 | 4,521 | 13.2% |
| $75,000 to $99,999 | 4,247 | 12.4% |
| $100,000 to $149,999 | 6,438 | 18.8% |
| $150,000 to $199,999 | 5,411 | 15.8% |
| $200,000+ | 6,610 | 19.3% |
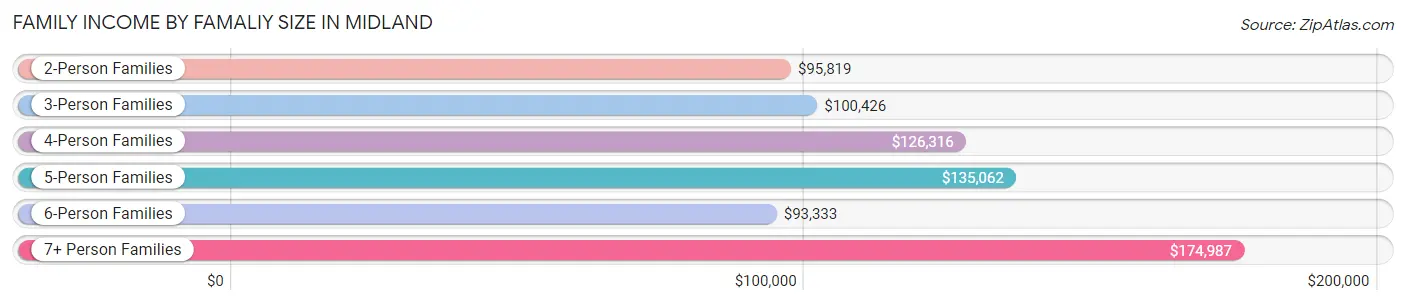
Family Income by Famaliy Size in Midland
7+ person families (421 | 1.2%) account for the highest median family income in Midland with $174,987 per family, while 2-person families (12,524 | 36.6%) have the highest median income of $47,910 per family member.
| Income Bracket | # Families | Median Income |
| 2-Person Families | 12,524 (36.6%) | $95,819 |
| 3-Person Families | 8,293 (24.2%) | $100,426 |
| 4-Person Families | 8,093 (23.6%) | $126,316 |
| 5-Person Families | 3,500 (10.2%) | $135,062 |
| 6-Person Families | 1,416 (4.1%) | $93,333 |
| 7+ Person Families | 421 (1.2%) | $174,987 |
| Total | 34,247 (100.0%) | $109,030 |
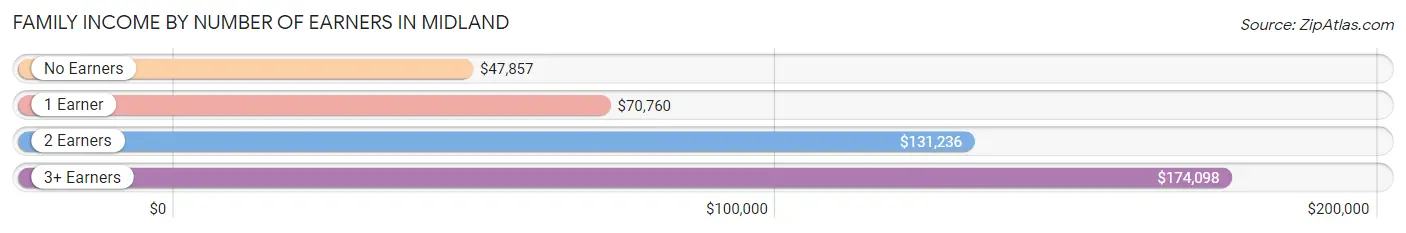
Family Income by Number of Earners in Midland
The median family income in Midland is $109,030, with families comprising 3+ earners (4,245) having the highest median family income of $174,098, while families with no earners (2,118) have the lowest median family income of $47,857, accounting for 12.4% and 6.2% of families, respectively.
| Number of Earners | # Families | Median Income |
| No Earners | 2,118 (6.2%) | $47,857 |
| 1 Earner | 12,098 (35.3%) | $70,760 |
| 2 Earners | 15,786 (46.1%) | $131,236 |
| 3+ Earners | 4,245 (12.4%) | $174,098 |
| Total | 34,247 (100.0%) | $109,030 |
Household Income in Midland
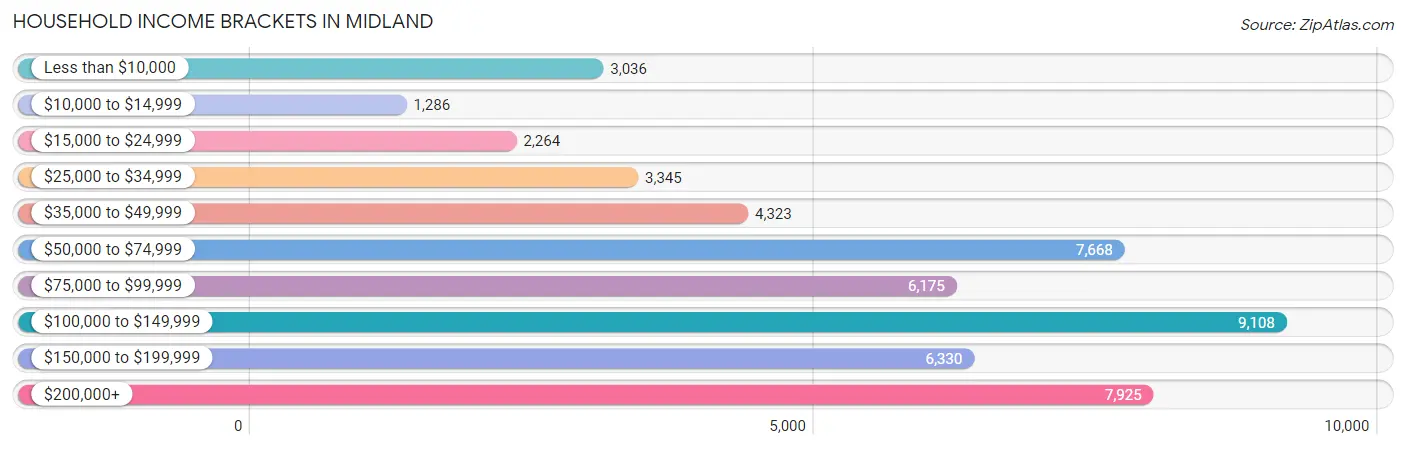
Household Income Brackets in Midland
With 9,108 households falling in the category, the $100,000 to $149,999 income range is the most frequent in Midland, accounting for 17.7% of all households. In contrast, only 1,286 households (2.5%) fall into the $10,000 to $14,999 income bracket, making it the least populous group.
| Income Bracket | # Households | % Households |
| Less than $10,000 | 3,036 | 5.9% |
| $10,000 to $14,999 | 1,286 | 2.5% |
| $15,000 to $24,999 | 2,264 | 4.4% |
| $25,000 to $34,999 | 3,345 | 6.5% |
| $35,000 to $49,999 | 4,323 | 8.4% |
| $50,000 to $74,999 | 7,668 | 14.9% |
| $75,000 to $99,999 | 6,175 | 12.0% |
| $100,000 to $149,999 | 9,108 | 17.7% |
| $150,000 to $199,999 | 6,330 | 12.3% |
| $200,000+ | 7,925 | 15.4% |
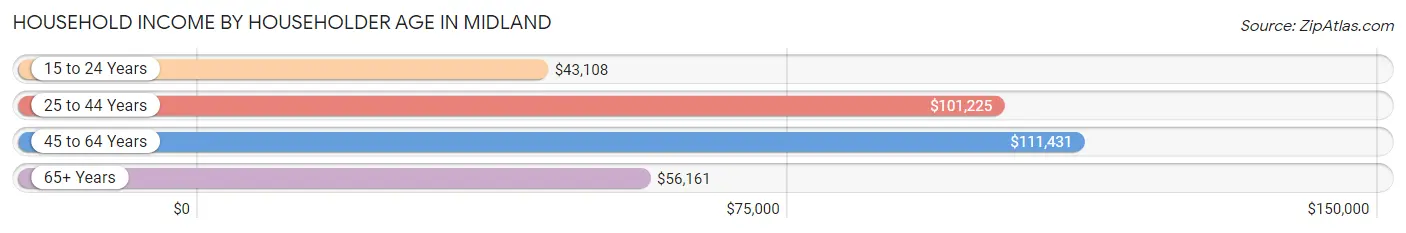
Household Income by Householder Age in Midland
The median household income in Midland is $90,448, with the highest median household income of $111,431 found in the 45 to 64 years age bracket for the primary householder. A total of 15,284 households (29.7%) fall into this category. Meanwhile, the 15 to 24 years age bracket for the primary householder has the lowest median household income of $43,108, with 3,591 households (7.0%) in this group.
| Income Bracket | # Households | Median Income |
| 15 to 24 Years | 3,591 (7.0%) | $43,108 |
| 25 to 44 Years | 23,591 (45.8%) | $101,225 |
| 45 to 64 Years | 15,284 (29.7%) | $111,431 |
| 65+ Years | 8,994 (17.5%) | $56,161 |
| Total | 51,460 (100.0%) | $90,448 |
Poverty in Midland
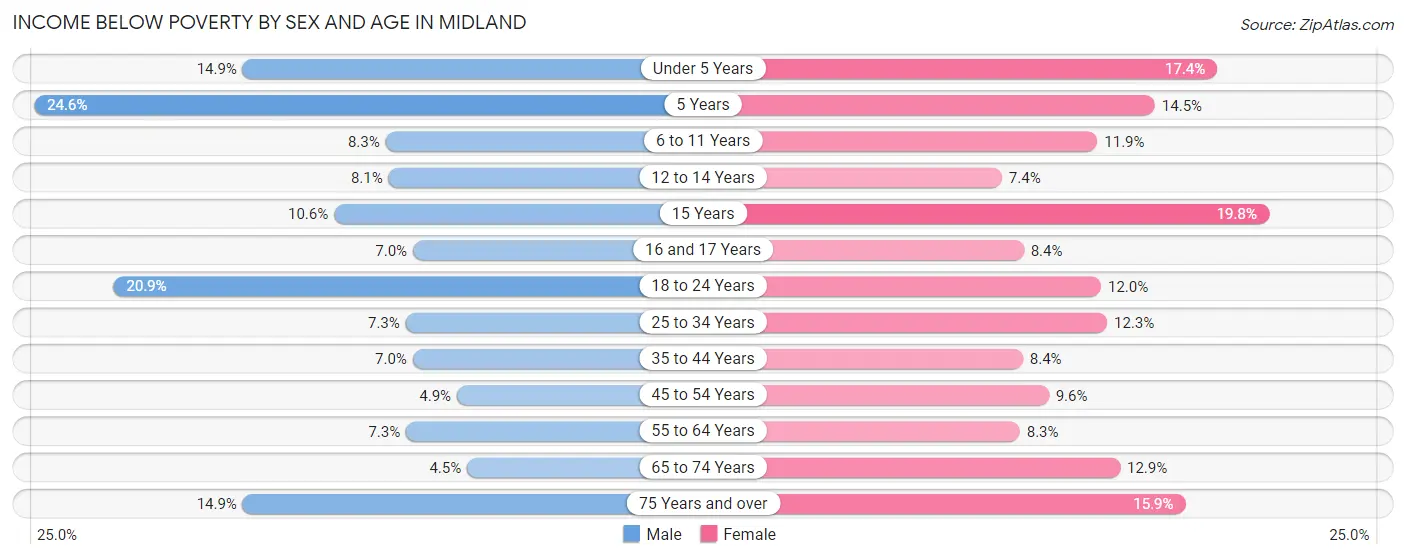
Income Below Poverty by Sex and Age in Midland
With 9.5% poverty level for males and 11.6% for females among the residents of Midland, 5 year old males and 15 year old females are the most vulnerable to poverty, with 291 males (24.6%) and 167 females (19.8%) in their respective age groups living below the poverty level.
| Age Bracket | Male | Female |
| Under 5 Years | 905 (14.9%) | 936 (17.4%) |
| 5 Years | 291 (24.6%) | 155 (14.5%) |
| 6 to 11 Years | 575 (8.3%) | 723 (11.9%) |
| 12 to 14 Years | 224 (8.1%) | 225 (7.4%) |
| 15 Years | 93 (10.6%) | 167 (19.8%) |
| 16 and 17 Years | 110 (7.0%) | 135 (8.4%) |
| 18 to 24 Years | 1,286 (20.9%) | 693 (12.0%) |
| 25 to 34 Years | 913 (7.3%) | 1,473 (12.3%) |
| 35 to 44 Years | 742 (7.0%) | 666 (8.4%) |
| 45 to 54 Years | 339 (4.9%) | 582 (9.6%) |
| 55 to 64 Years | 455 (7.3%) | 520 (8.3%) |
| 65 to 74 Years | 153 (4.5%) | 527 (12.9%) |
| 75 Years and over | 374 (14.9%) | 509 (15.9%) |
| Total | 6,460 (9.5%) | 7,311 (11.6%) |
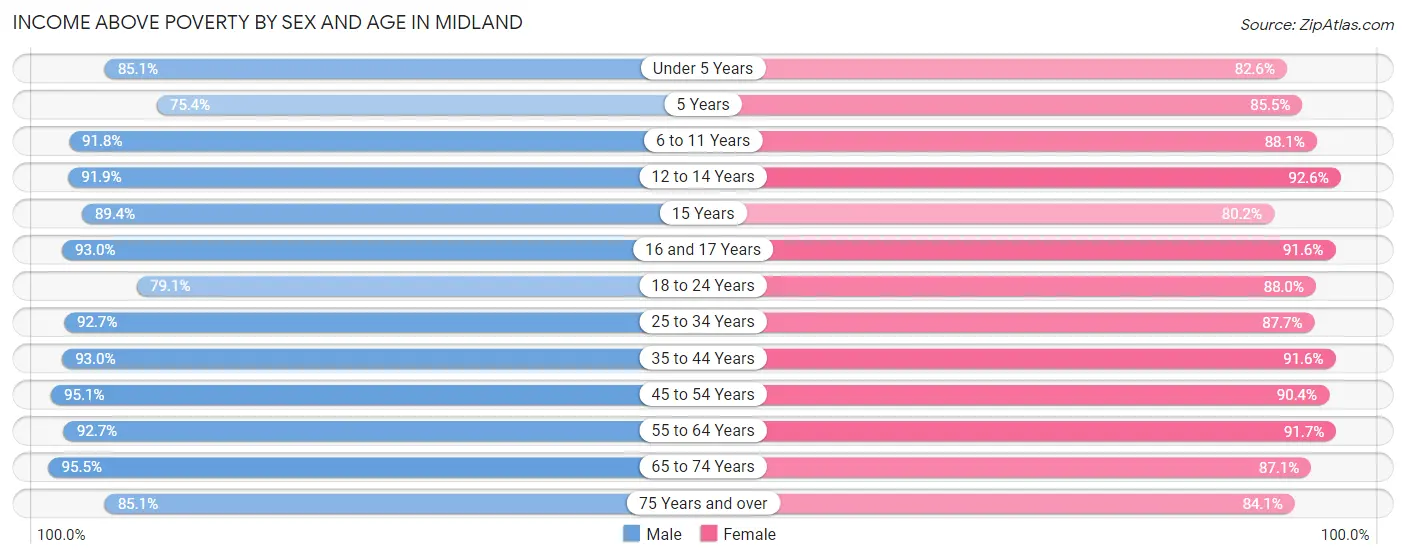
Income Above Poverty by Sex and Age in Midland
According to the poverty statistics in Midland, males aged 65 to 74 years and females aged 12 to 14 years are the age groups that are most secure financially, with 95.5% of males and 92.6% of females in these age groups living above the poverty line.
| Age Bracket | Male | Female |
| Under 5 Years | 5,176 (85.1%) | 4,439 (82.6%) |
| 5 Years | 894 (75.4%) | 912 (85.5%) |
| 6 to 11 Years | 6,391 (91.7%) | 5,375 (88.1%) |
| 12 to 14 Years | 2,538 (91.9%) | 2,804 (92.6%) |
| 15 Years | 781 (89.4%) | 676 (80.2%) |
| 16 and 17 Years | 1,466 (93.0%) | 1,465 (91.6%) |
| 18 to 24 Years | 4,873 (79.1%) | 5,066 (88.0%) |
| 25 to 34 Years | 11,560 (92.7%) | 10,491 (87.7%) |
| 35 to 44 Years | 9,872 (93.0%) | 7,264 (91.6%) |
| 45 to 54 Years | 6,524 (95.1%) | 5,479 (90.4%) |
| 55 to 64 Years | 5,777 (92.7%) | 5,778 (91.7%) |
| 65 to 74 Years | 3,273 (95.5%) | 3,555 (87.1%) |
| 75 Years and over | 2,140 (85.1%) | 2,684 (84.1%) |
| Total | 61,265 (90.5%) | 55,988 (88.4%) |
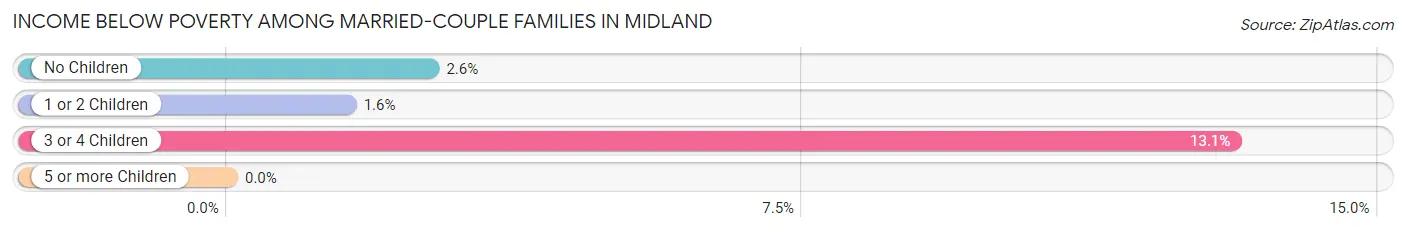
Income Below Poverty Among Married-Couple Families in Midland
The poverty statistics for married-couple families in Midland show that 3.6% or 914 of the total 25,406 families live below the poverty line. Families with 3 or 4 children have the highest poverty rate of 13.1%, comprising of 453 families. On the other hand, families with 5 or more children have the lowest poverty rate of 0.0%, which includes 0 families.
| Children | Above Poverty | Below Poverty |
| No Children | 10,927 (97.4%) | 295 (2.6%) |
| 1 or 2 Children | 10,530 (98.5%) | 166 (1.5%) |
| 3 or 4 Children | 3,002 (86.9%) | 453 (13.1%) |
| 5 or more Children | 33 (100.0%) | 0 (0.0%) |
| Total | 24,492 (96.4%) | 914 (3.6%) |
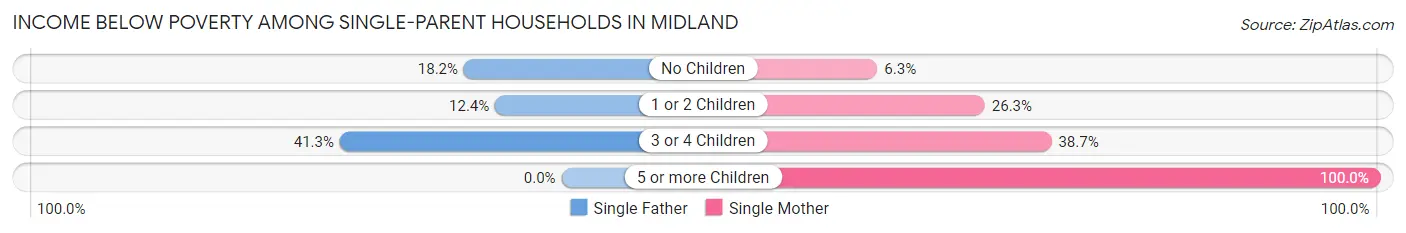
Income Below Poverty Among Single-Parent Households in Midland
According to the poverty data in Midland, 16.1% or 538 single-father households and 22.7% or 1,252 single-mother households are living below the poverty line. Among single-father households, those with 3 or 4 children have the highest poverty rate, with 83 households (41.3%) experiencing poverty. Likewise, among single-mother households, those with 5 or more children have the highest poverty rate, with 14 households (100.0%) falling below the poverty line.
| Children | Single Father | Single Mother |
| No Children | 218 (18.2%) | 83 (6.3%) |
| 1 or 2 Children | 237 (12.4%) | 975 (26.3%) |
| 3 or 4 Children | 83 (41.3%) | 180 (38.7%) |
| 5 or more Children | 0 (0.0%) | 14 (100.0%) |
| Total | 538 (16.1%) | 1,252 (22.7%) |
Income Below Poverty Among Married-Couple vs Single-Parent Households in Midland
The poverty data for Midland shows that 914 of the married-couple family households (3.6%) and 1,790 of the single-parent households (20.3%) are living below the poverty level. Within the married-couple family households, those with 3 or 4 children have the highest poverty rate, with 453 households (13.1%) falling below the poverty line. Among the single-parent households, those with 5 or more children have the highest poverty rate, with 14 household (45.2%) living below poverty.
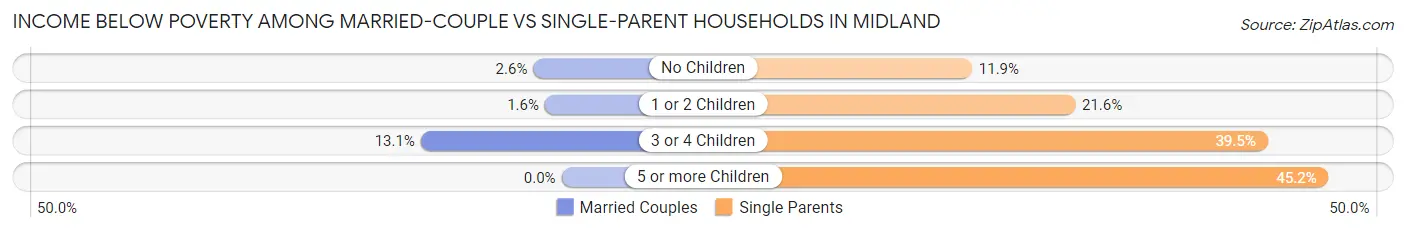
| Children | Married-Couple Families | Single-Parent Households |
| No Children | 295 (2.6%) | 301 (11.9%) |
| 1 or 2 Children | 166 (1.5%) | 1,212 (21.5%) |
| 3 or 4 Children | 453 (13.1%) | 263 (39.5%) |
| 5 or more Children | 0 (0.0%) | 14 (45.2%) |
| Total | 914 (3.6%) | 1,790 (20.3%) |
Race in Midland
The most populous races in Midland are White / Caucasian (84,691 | 63.9%), Hispanic or Latino (61,160 | 46.2%), and Two or more Races (19,767 | 14.9%).
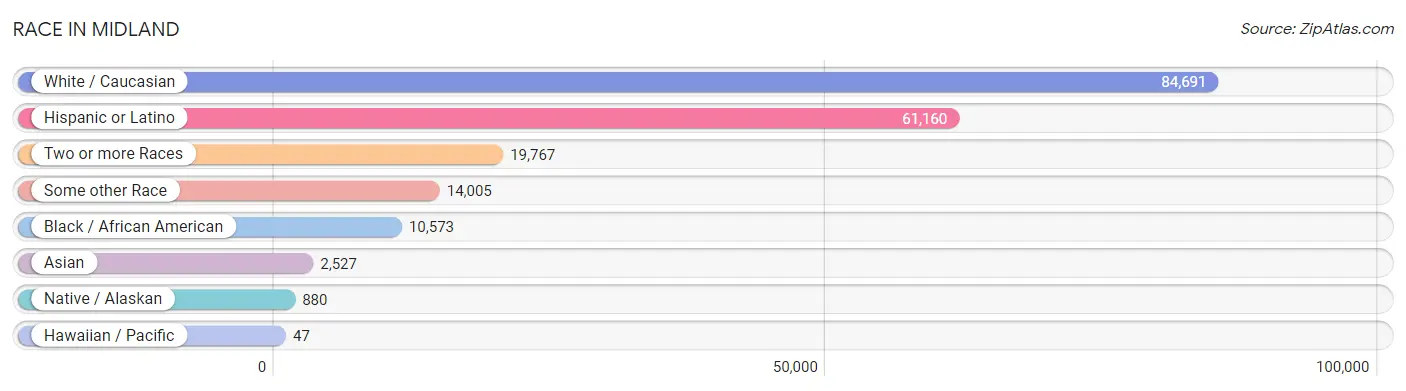
| Race | # Population | % Population |
| Asian | 2,527 | 1.9% |
| Black / African American | 10,573 | 8.0% |
| Hawaiian / Pacific | 47 | 0.0% |
| Hispanic or Latino | 61,160 | 46.2% |
| Native / Alaskan | 880 | 0.7% |
| White / Caucasian | 84,691 | 63.9% |
| Two or more Races | 19,767 | 14.9% |
| Some other Race | 14,005 | 10.6% |
| Total | 132,490 | 100.0% |
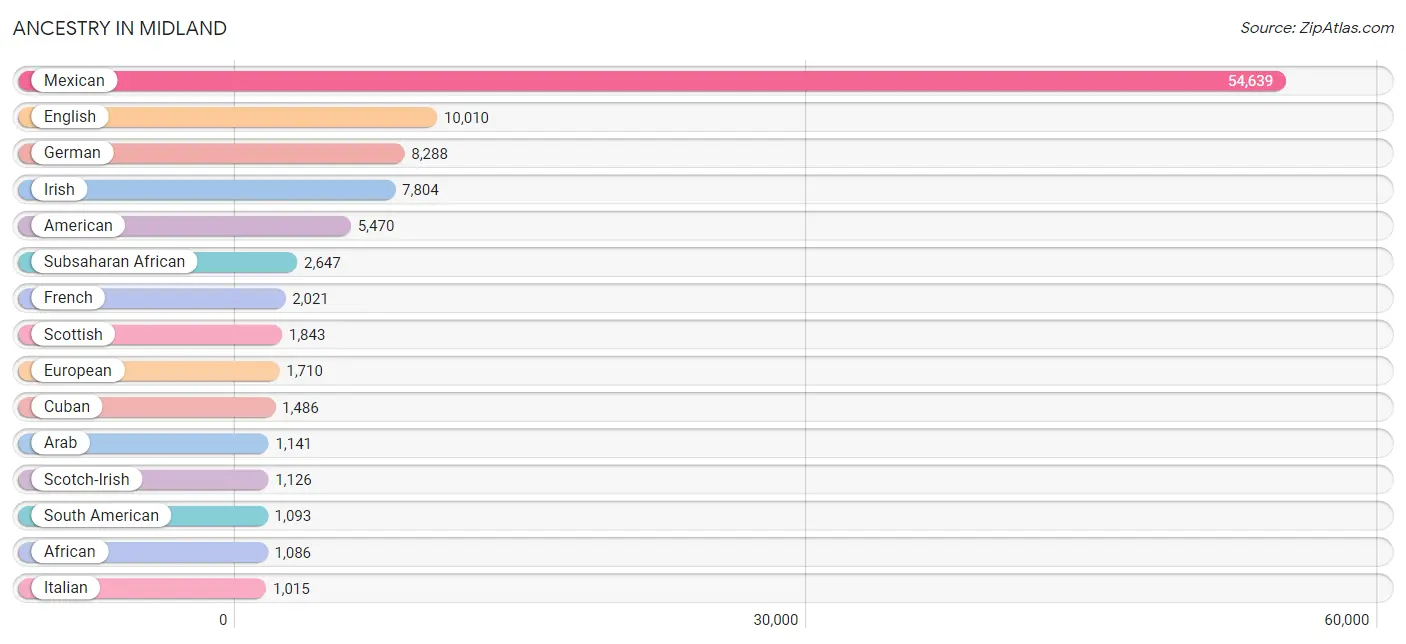
Ancestry in Midland
The most populous ancestries reported in Midland are Mexican (54,639 | 41.2%), English (10,010 | 7.6%), German (8,288 | 6.3%), Irish (7,804 | 5.9%), and American (5,470 | 4.1%), together accounting for 65.1% of all Midland residents.
| Ancestry | # Population | % Population |
| African | 1,086 | 0.8% |
| Alaska Native | 69 | 0.1% |
| Albanian | 18 | 0.0% |
| American | 5,470 | 4.1% |
| Apache | 23 | 0.0% |
| Arab | 1,141 | 0.9% |
| Australian | 33 | 0.0% |
| Austrian | 39 | 0.0% |
| Belgian | 59 | 0.0% |
| Bermudan | 22 | 0.0% |
| Bhutanese | 365 | 0.3% |
| Blackfeet | 206 | 0.2% |
| Bolivian | 26 | 0.0% |
| Brazilian | 8 | 0.0% |
| British | 706 | 0.5% |
| Burmese | 377 | 0.3% |
| Cajun | 59 | 0.0% |
| Canadian | 394 | 0.3% |
| Central American | 808 | 0.6% |
| Central American Indian | 37 | 0.0% |
| Cherokee | 383 | 0.3% |
| Chickasaw | 45 | 0.0% |
| Chippewa | 10 | 0.0% |
| Choctaw | 206 | 0.2% |
| Colombian | 408 | 0.3% |
| Creek | 25 | 0.0% |
| Croatian | 30 | 0.0% |
| Cuban | 1,486 | 1.1% |
| Czech | 561 | 0.4% |
| Czechoslovakian | 59 | 0.0% |
| Danish | 127 | 0.1% |
| Delaware | 34 | 0.0% |
| Dominican | 47 | 0.0% |
| Dutch | 414 | 0.3% |
| Dutch West Indian | 43 | 0.0% |
| Eastern European | 246 | 0.2% |
| Ecuadorian | 87 | 0.1% |
| Egyptian | 15 | 0.0% |
| English | 10,010 | 7.6% |
| Ethiopian | 12 | 0.0% |
| European | 1,710 | 1.3% |
| French | 2,021 | 1.5% |
| French Canadian | 221 | 0.2% |
| German | 8,288 | 6.3% |
| Ghanaian | 23 | 0.0% |
| Greek | 158 | 0.1% |
| Guatemalan | 232 | 0.2% |
| Guyanese | 40 | 0.0% |
| Honduran | 91 | 0.1% |
| Hungarian | 51 | 0.0% |
| Indian (Asian) | 683 | 0.5% |
| Indonesian | 272 | 0.2% |
| Iranian | 28 | 0.0% |
| Irish | 7,804 | 5.9% |
| Israeli | 104 | 0.1% |
| Italian | 1,015 | 0.8% |
| Jamaican | 286 | 0.2% |
| Japanese | 503 | 0.4% |
| Korean | 635 | 0.5% |
| Lebanese | 733 | 0.5% |
| Malaysian | 75 | 0.1% |
| Mexican | 54,639 | 41.2% |
| Mexican American Indian | 231 | 0.2% |
| Native Hawaiian | 28 | 0.0% |
| Navajo | 64 | 0.1% |
| New Zealander | 6 | 0.0% |
| Nicaraguan | 164 | 0.1% |
| Nigerian | 964 | 0.7% |
| Northern European | 125 | 0.1% |
| Norwegian | 431 | 0.3% |
| Palestinian | 260 | 0.2% |
| Peruvian | 312 | 0.2% |
| Polish | 635 | 0.5% |
| Portuguese | 69 | 0.1% |
| Potawatomi | 14 | 0.0% |
| Puerto Rican | 649 | 0.5% |
| Romanian | 21 | 0.0% |
| Russian | 101 | 0.1% |
| Salvadoran | 321 | 0.2% |
| Samoan | 48 | 0.0% |
| Scandinavian | 232 | 0.2% |
| Scotch-Irish | 1,126 | 0.9% |
| Scottish | 1,843 | 1.4% |
| Serbian | 11 | 0.0% |
| Sioux | 54 | 0.0% |
| Slavic | 10 | 0.0% |
| Slovak | 68 | 0.1% |
| South African | 21 | 0.0% |
| South American | 1,093 | 0.8% |
| South American Indian | 110 | 0.1% |
| Spaniard | 265 | 0.2% |
| Spanish | 71 | 0.1% |
| Spanish American | 74 | 0.1% |
| Sri Lankan | 310 | 0.2% |
| Subsaharan African | 2,647 | 2.0% |
| Sudanese | 159 | 0.1% |
| Swedish | 684 | 0.5% |
| Swiss | 45 | 0.0% |
| Thai | 810 | 0.6% |
| Tongan | 32 | 0.0% |
| Ukrainian | 79 | 0.1% |
| Venezuelan | 260 | 0.2% |
| Vietnamese | 25 | 0.0% |
| Welsh | 249 | 0.2% |
| West Indian | 74 | 0.1% |
| Yugoslavian | 40 | 0.0% | View All 106 Rows |
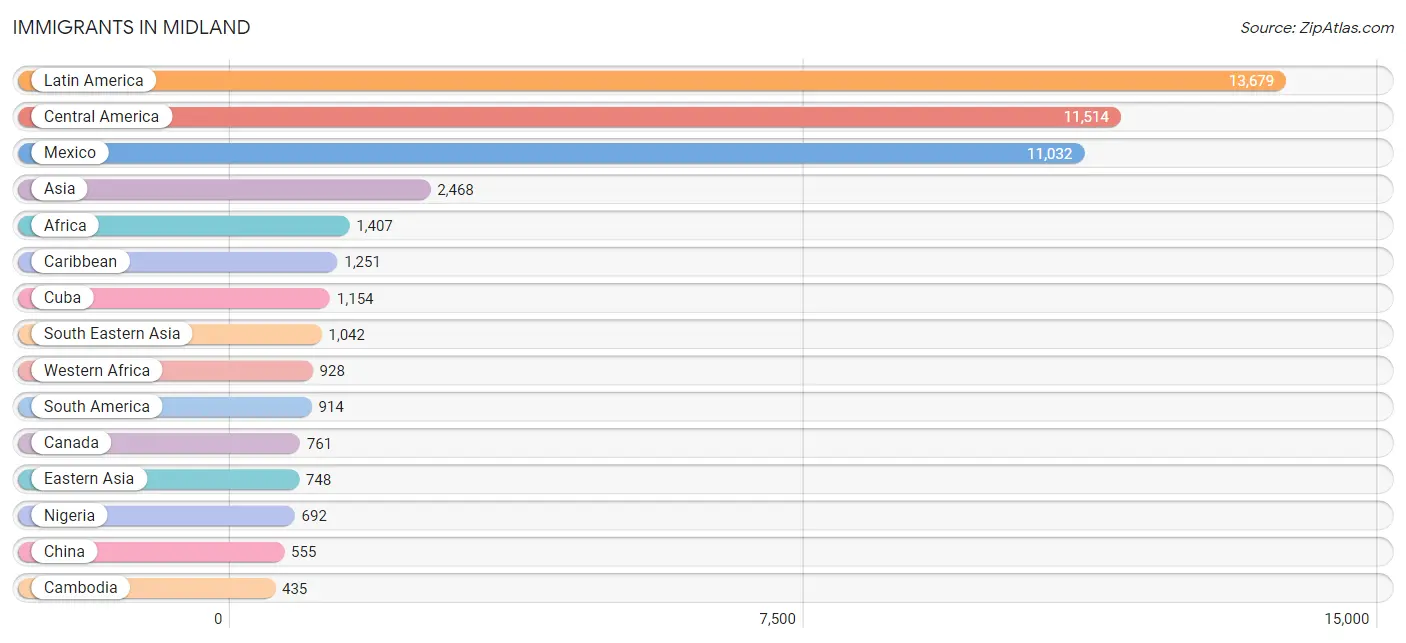
Immigrants in Midland
The most numerous immigrant groups reported in Midland came from Latin America (13,679 | 10.3%), Central America (11,514 | 8.7%), Mexico (11,032 | 8.3%), Asia (2,468 | 1.9%), and Africa (1,407 | 1.1%), together accounting for 30.3% of all Midland residents.
| Immigration Origin | # Population | % Population |
| Africa | 1,407 | 1.1% |
| Albania | 18 | 0.0% |
| Asia | 2,468 | 1.9% |
| Australia | 26 | 0.0% |
| Bangladesh | 12 | 0.0% |
| Bolivia | 26 | 0.0% |
| Cambodia | 435 | 0.3% |
| Canada | 761 | 0.6% |
| Caribbean | 1,251 | 0.9% |
| Central America | 11,514 | 8.7% |
| China | 555 | 0.4% |
| Colombia | 250 | 0.2% |
| Cuba | 1,154 | 0.9% |
| Dominican Republic | 97 | 0.1% |
| Eastern Africa | 329 | 0.3% |
| Eastern Asia | 748 | 0.6% |
| Eastern Europe | 121 | 0.1% |
| Ecuador | 87 | 0.1% |
| Egypt | 52 | 0.0% |
| El Salvador | 353 | 0.3% |
| England | 51 | 0.0% |
| Europe | 384 | 0.3% |
| France | 4 | 0.0% |
| Germany | 142 | 0.1% |
| Ghana | 23 | 0.0% |
| Guatemala | 55 | 0.0% |
| Guyana | 40 | 0.0% |
| Hong Kong | 15 | 0.0% |
| India | 179 | 0.1% |
| Iran | 64 | 0.1% |
| Iraq | 95 | 0.1% |
| Ireland | 1 | 0.0% |
| Italy | 37 | 0.0% |
| Japan | 110 | 0.1% |
| Kenya | 200 | 0.2% |
| Korea | 83 | 0.1% |
| Laos | 36 | 0.0% |
| Latin America | 13,679 | 10.3% |
| Lebanon | 147 | 0.1% |
| Mexico | 11,032 | 8.3% |
| Moldova | 25 | 0.0% |
| Morocco | 2 | 0.0% |
| Netherlands | 3 | 0.0% |
| Nicaragua | 74 | 0.1% |
| Nigeria | 692 | 0.5% |
| Northern Africa | 121 | 0.1% |
| Northern Europe | 77 | 0.1% |
| Oceania | 32 | 0.0% |
| Peru | 235 | 0.2% |
| Philippines | 346 | 0.3% |
| Romania | 21 | 0.0% |
| Russia | 40 | 0.0% |
| Saudi Arabia | 8 | 0.0% |
| Senegal | 51 | 0.0% |
| South Africa | 21 | 0.0% |
| South America | 914 | 0.7% |
| South Central Asia | 255 | 0.2% |
| South Eastern Asia | 1,042 | 0.8% |
| Southern Europe | 37 | 0.0% |
| Sudan | 67 | 0.1% |
| Taiwan | 14 | 0.0% |
| Turkey | 23 | 0.0% |
| Uganda | 129 | 0.1% |
| Ukraine | 17 | 0.0% |
| Venezuela | 250 | 0.2% |
| Vietnam | 69 | 0.1% |
| Western Africa | 928 | 0.7% |
| Western Asia | 273 | 0.2% |
| Western Europe | 149 | 0.1% | View All 69 Rows |
Sex and Age in Midland
Sex and Age in Midland
The most populous age groups in Midland are 25 to 29 Years (6,503 | 9.5%) for men and 25 to 29 Years (6,067 | 9.5%) for women.
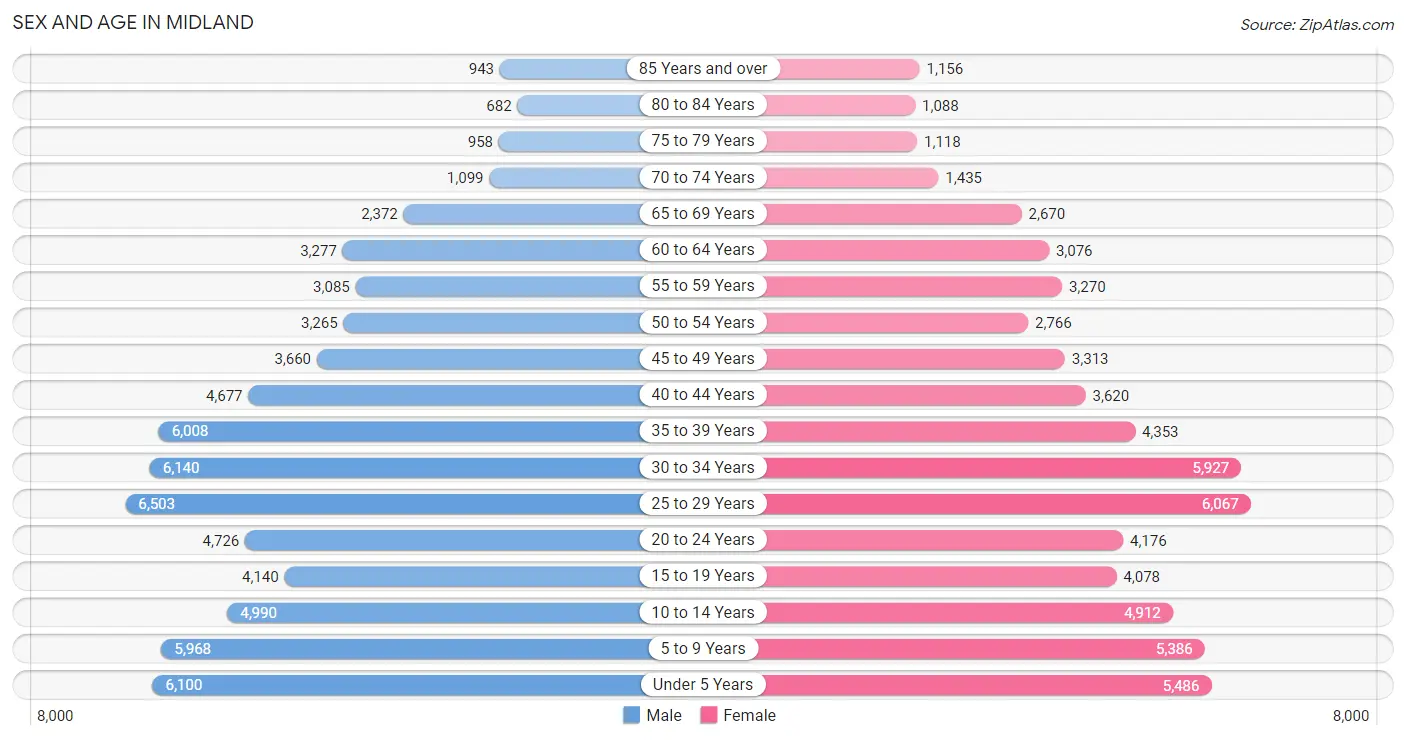
| Age Bracket | Male | Female |
| Under 5 Years | 6,100 (8.9%) | 5,486 (8.6%) |
| 5 to 9 Years | 5,968 (8.7%) | 5,386 (8.4%) |
| 10 to 14 Years | 4,990 (7.3%) | 4,912 (7.7%) |
| 15 to 19 Years | 4,140 (6.0%) | 4,078 (6.4%) |
| 20 to 24 Years | 4,726 (6.9%) | 4,176 (6.5%) |
| 25 to 29 Years | 6,503 (9.5%) | 6,067 (9.5%) |
| 30 to 34 Years | 6,140 (8.9%) | 5,927 (9.3%) |
| 35 to 39 Years | 6,008 (8.8%) | 4,353 (6.8%) |
| 40 to 44 Years | 4,677 (6.8%) | 3,620 (5.7%) |
| 45 to 49 Years | 3,660 (5.3%) | 3,313 (5.2%) |
| 50 to 54 Years | 3,265 (4.8%) | 2,766 (4.3%) |
| 55 to 59 Years | 3,085 (4.5%) | 3,270 (5.1%) |
| 60 to 64 Years | 3,277 (4.8%) | 3,076 (4.8%) |
| 65 to 69 Years | 2,372 (3.5%) | 2,670 (4.2%) |
| 70 to 74 Years | 1,099 (1.6%) | 1,435 (2.2%) |
| 75 to 79 Years | 958 (1.4%) | 1,118 (1.8%) |
| 80 to 84 Years | 682 (1.0%) | 1,088 (1.7%) |
| 85 Years and over | 943 (1.4%) | 1,156 (1.8%) |
| Total | 68,593 (100.0%) | 63,897 (100.0%) |
Families and Households in Midland
Median Family Size in Midland
The median family size in Midland is 3.16 persons per family, with married-couple families (25,406 | 74.2%) accounting for the largest median family size of 3.33 persons per family. On the other hand, single male/father families (3,334 | 9.7%) represent the smallest median family size with 2.44 persons per family.
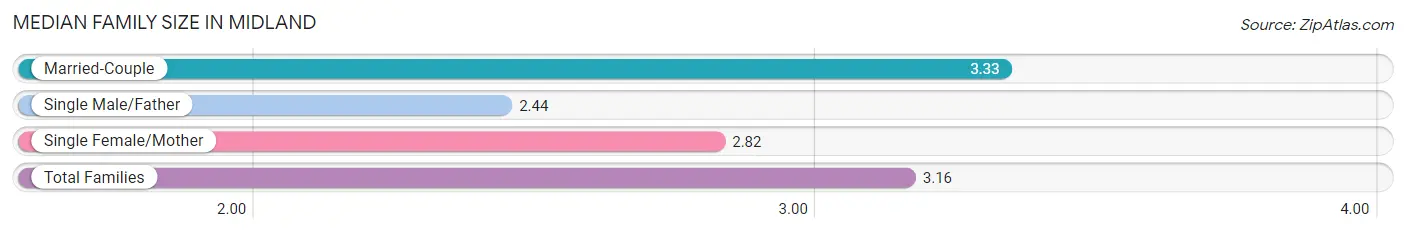
| Family Type | # Families | Family Size |
| Married-Couple | 25,406 (74.2%) | 3.33 |
| Single Male/Father | 3,334 (9.7%) | 2.44 |
| Single Female/Mother | 5,507 (16.1%) | 2.82 |
| Total Families | 34,247 (100.0%) | 3.16 |
Median Household Size in Midland
The median household size in Midland is 2.54 persons per household, with married-couple households (25,406 | 49.4%) accounting for the largest median household size of 3.35 persons per household. non-family households (17,213 | 33.5%) represent the smallest median household size with 1.14 persons per household.
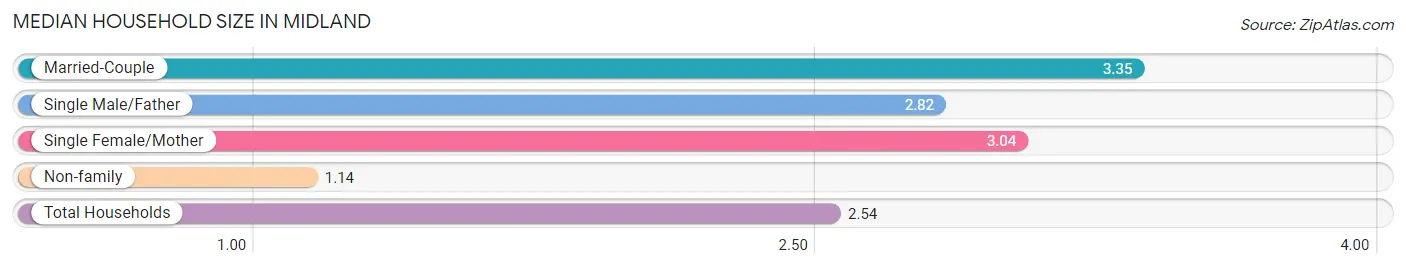
| Household Type | # Households | Household Size |
| Married-Couple | 25,406 (49.4%) | 3.35 |
| Single Male/Father | 3,334 (6.5%) | 2.82 |
| Single Female/Mother | 5,507 (10.7%) | 3.04 |
| Non-family | 17,213 (33.5%) | 1.14 |
| Total Households | 51,460 (100.0%) | 2.54 |
Household Size by Marriage Status in Midland
Out of a total of 51,460 households in Midland, 34,247 (66.5%) are family households, while 17,213 (33.5%) are nonfamily households. The most numerous type of family households are 2-person households, comprising 11,415, and the most common type of nonfamily households are 1-person households, comprising 14,558.
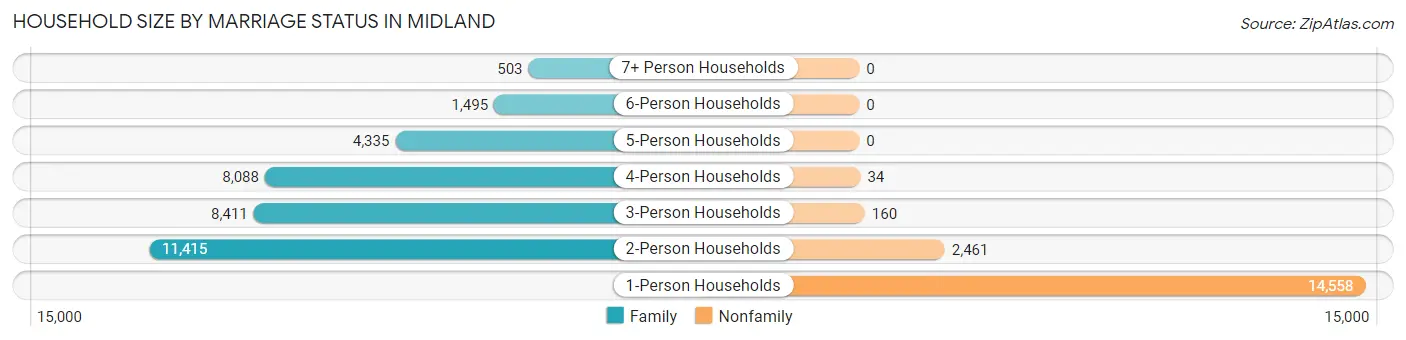
| Household Size | Family Households | Nonfamily Households |
| 1-Person Households | - | 14,558 (28.3%) |
| 2-Person Households | 11,415 (22.2%) | 2,461 (4.8%) |
| 3-Person Households | 8,411 (16.3%) | 160 (0.3%) |
| 4-Person Households | 8,088 (15.7%) | 34 (0.1%) |
| 5-Person Households | 4,335 (8.4%) | 0 (0.0%) |
| 6-Person Households | 1,495 (2.9%) | 0 (0.0%) |
| 7+ Person Households | 503 (1.0%) | 0 (0.0%) |
| Total | 34,247 (66.5%) | 17,213 (33.5%) |
Female Fertility in Midland
Fertility by Age in Midland
Average fertility rate in Midland is 94.0 births per 1,000 women. Women in the age bracket of 20 to 34 years have the highest fertility rate with 135.0 births per 1,000 women. Women in the age bracket of 20 to 34 years acount for 72.6% of all women with births.
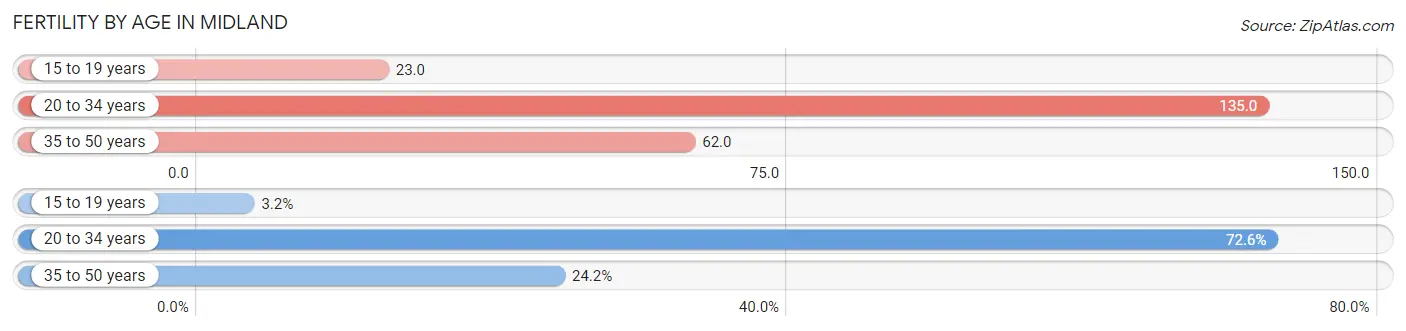
| Age Bracket | Women with Births | Births / 1,000 Women |
| 15 to 19 years | 95 (3.2%) | 23.0 |
| 20 to 34 years | 2,188 (72.6%) | 135.0 |
| 35 to 50 years | 730 (24.2%) | 62.0 |
| Total | 3,013 (100.0%) | 94.0 |
Fertility by Age by Marriage Status in Midland
77.5% of women with births (3,013) in Midland are married. The highest percentage of unmarried women with births falls into 15 to 19 years age bracket with 75.8% of them unmarried at the time of birth, while the lowest percentage of unmarried women with births belong to 35 to 50 years age bracket with 15.3% of them unmarried.
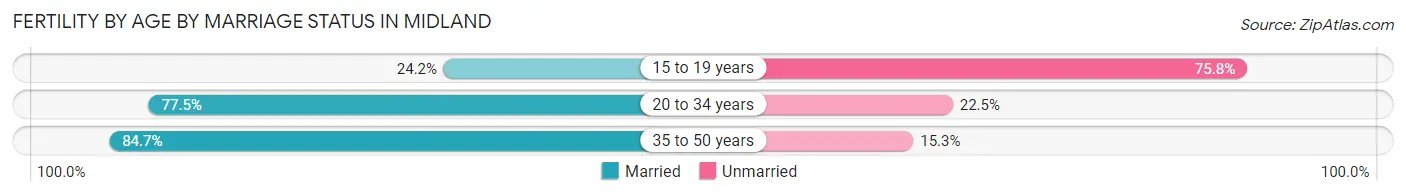
| Age Bracket | Married | Unmarried |
| 15 to 19 years | 23 (24.2%) | 72 (75.8%) |
| 20 to 34 years | 1,696 (77.5%) | 492 (22.5%) |
| 35 to 50 years | 618 (84.7%) | 112 (15.3%) |
| Total | 2,335 (77.5%) | 678 (22.5%) |
Fertility by Education in Midland
Average fertility rate in Midland is 94.0 births per 1,000 women. Women with the education attainment of bachelor's degree have the highest fertility rate of 131.0 births per 1,000 women, while women with the education attainment of graduate degree have the lowest fertility at 75.0 births per 1,000 women. Women with the education attainment of bachelor's degree represent 32.6% of all women with births.
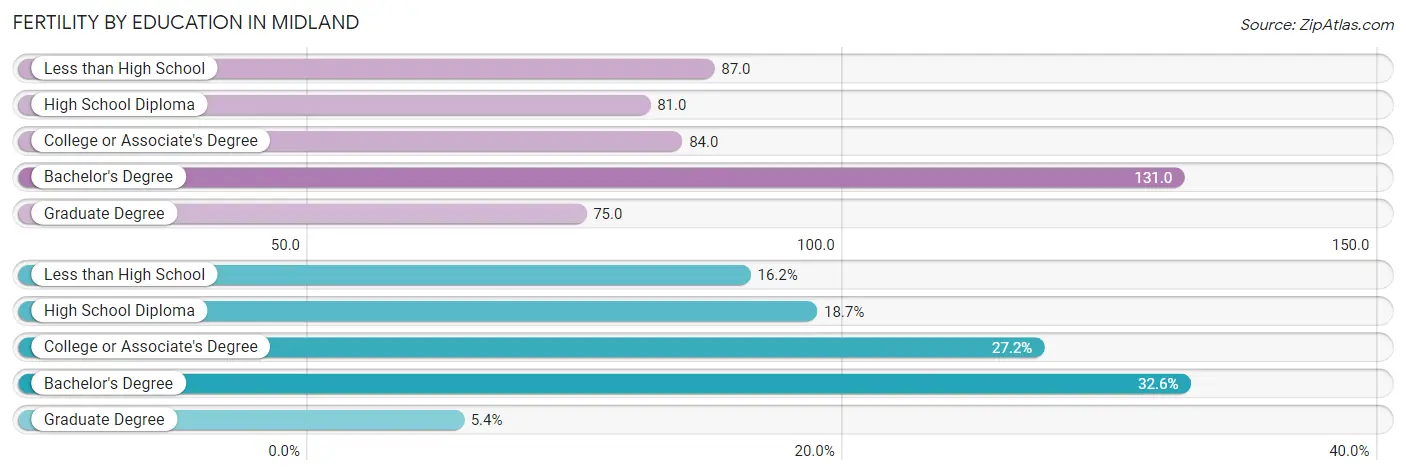
| Educational Attainment | Women with Births | Births / 1,000 Women |
| Less than High School | 487 (16.2%) | 87.0 |
| High School Diploma | 562 (18.6%) | 81.0 |
| College or Associate's Degree | 818 (27.2%) | 84.0 |
| Bachelor's Degree | 983 (32.6%) | 131.0 |
| Graduate Degree | 163 (5.4%) | 75.0 |
| Total | 3,013 (100.0%) | 94.0 |
Fertility by Education by Marriage Status in Midland
22.5% of women with births in Midland are unmarried. Women with the educational attainment of graduate degree are most likely to be married with 100.0% of them married at childbirth, while women with the educational attainment of high school diploma are least likely to be married with 59.3% of them unmarried at childbirth.
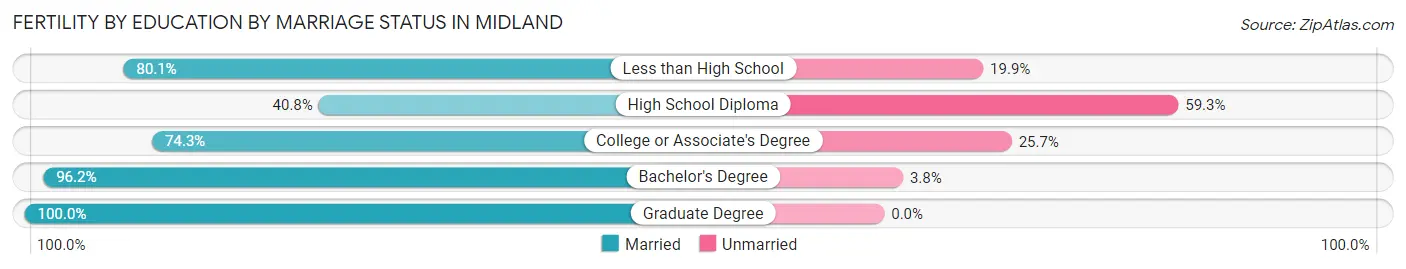
| Educational Attainment | Married | Unmarried |
| Less than High School | 390 (80.1%) | 97 (19.9%) |
| High School Diploma | 229 (40.7%) | 333 (59.3%) |
| College or Associate's Degree | 608 (74.3%) | 210 (25.7%) |
| Bachelor's Degree | 946 (96.2%) | 37 (3.8%) |
| Graduate Degree | 163 (100.0%) | 0 (0.0%) |
| Total | 2,335 (77.5%) | 678 (22.5%) |
Employment Characteristics in Midland
Employment by Class of Employer in Midland
Among the 66,887 employed individuals in Midland, private company employees (48,127 | 72.0%), not-for-profit organizations (4,741 | 7.1%), and self-employed (not incorporated) (4,313 | 6.5%) make up the most common classes of employment.
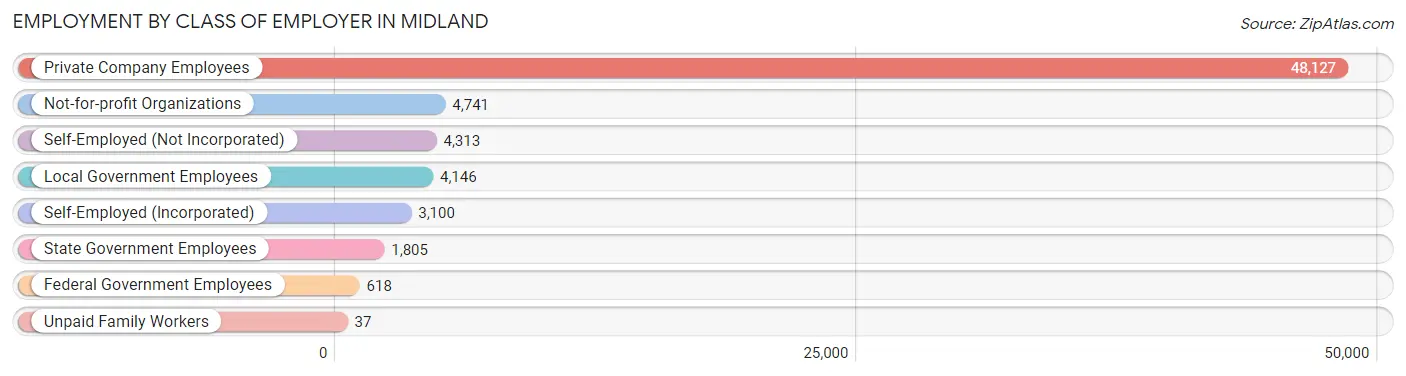
| Employer Class | # Employees | % Employees |
| Private Company Employees | 48,127 | 72.0% |
| Self-Employed (Incorporated) | 3,100 | 4.6% |
| Self-Employed (Not Incorporated) | 4,313 | 6.5% |
| Not-for-profit Organizations | 4,741 | 7.1% |
| Local Government Employees | 4,146 | 6.2% |
| State Government Employees | 1,805 | 2.7% |
| Federal Government Employees | 618 | 0.9% |
| Unpaid Family Workers | 37 | 0.1% |
| Total | 66,887 | 100.0% |
Employment Status by Age in Midland
According to the labor force statistics for Midland, out of the total population over 16 years of age (97,931), 71.5% or 70,021 individuals are in the labor force, with 3.2% or 2,241 of them unemployed. The age group with the highest labor force participation rate is 35 to 44 years, with 85.5% or 15,953 individuals in the labor force. Within the labor force, the 16 to 19 years age range has the highest percentage of unemployed individuals, with 6.4% or 184 of them being unemployed.
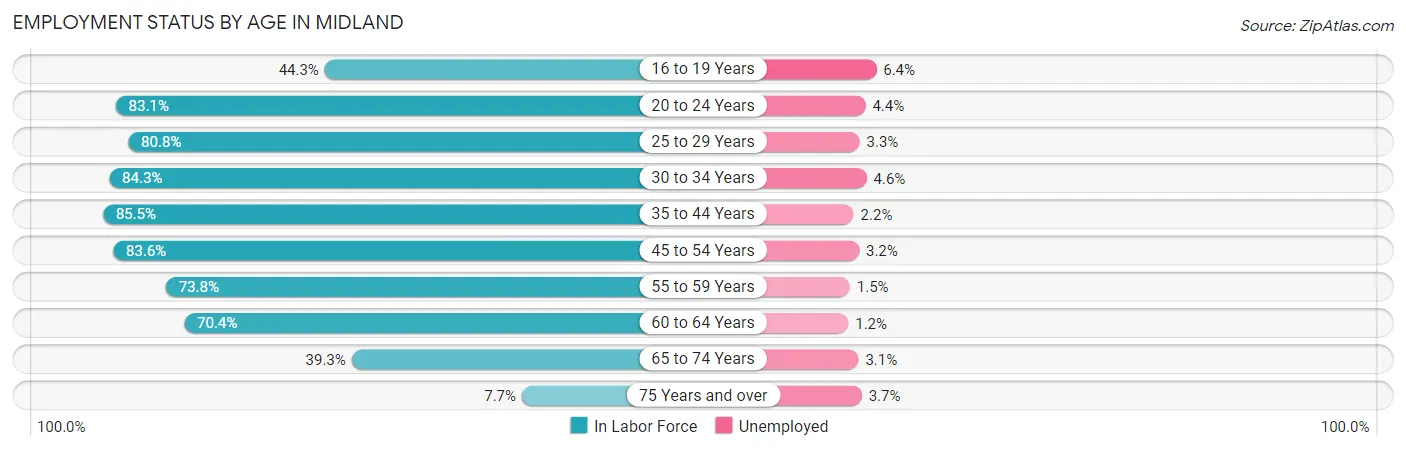
| Age Bracket | In Labor Force | Unemployed |
| 16 to 19 Years | 2,880 (44.3%) | 184 (6.4%) |
| 20 to 24 Years | 7,398 (83.1%) | 326 (4.4%) |
| 25 to 29 Years | 10,157 (80.8%) | 335 (3.3%) |
| 30 to 34 Years | 10,172 (84.3%) | 468 (4.6%) |
| 35 to 44 Years | 15,953 (85.5%) | 351 (2.2%) |
| 45 to 54 Years | 10,871 (83.6%) | 348 (3.2%) |
| 55 to 59 Years | 4,690 (73.8%) | 70 (1.5%) |
| 60 to 64 Years | 4,473 (70.4%) | 54 (1.2%) |
| 65 to 74 Years | 2,977 (39.3%) | 92 (3.1%) |
| 75 Years and over | 458 (7.7%) | 17 (3.7%) |
| Total | 70,021 (71.5%) | 2,241 (3.2%) |
Employment Status by Educational Attainment in Midland
According to labor force statistics for Midland, 81.6% of individuals (56,310) out of the total population between 25 and 64 years of age (69,007) are in the labor force, with 2.9% or 1,633 of them being unemployed. The group with the highest labor force participation rate are those with the educational attainment of bachelor's degree or higher, with 85.5% or 19,014 individuals in the labor force. Within the labor force, individuals with less than high school education have the highest percentage of unemployment, with 5.4% or 411 of them being unemployed.
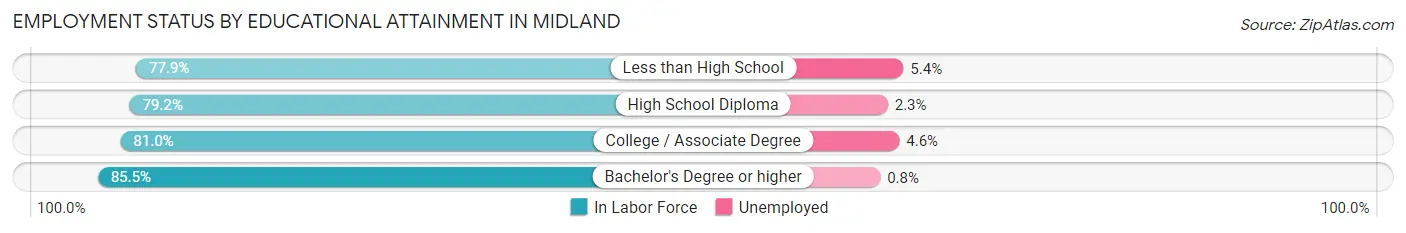
| Educational Attainment | In Labor Force | Unemployed |
| Less than High School | 7,612 (77.9%) | 528 (5.4%) |
| High School Diploma | 12,457 (79.2%) | 362 (2.3%) |
| College / Associate Degree | 17,226 (81.0%) | 978 (4.6%) |
| Bachelor's Degree or higher | 19,014 (85.5%) | 178 (0.8%) |
| Total | 56,310 (81.6%) | 2,001 (2.9%) |
Employment Occupations by Sex in Midland
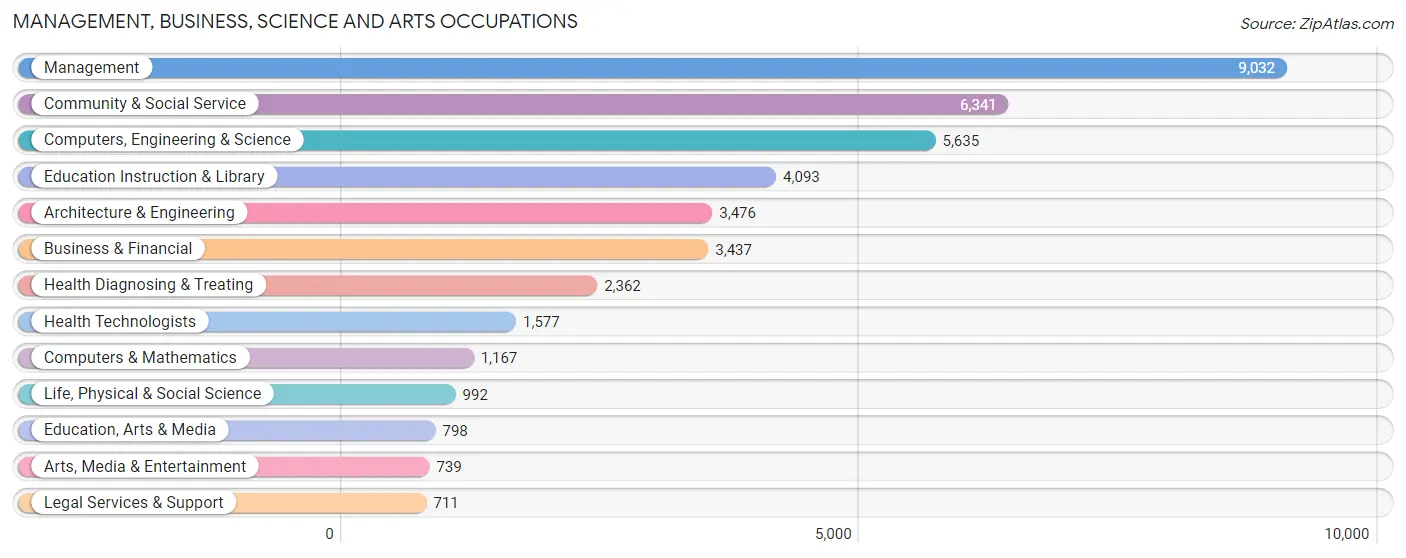
Management, Business, Science and Arts Occupations
The most common Management, Business, Science and Arts occupations in Midland are Management (9,032 | 13.4%), Community & Social Service (6,341 | 9.4%), Computers, Engineering & Science (5,635 | 8.3%), Education Instruction & Library (4,093 | 6.0%), and Architecture & Engineering (3,476 | 5.1%).
Management, Business, Science and Arts Occupations by Sex
Within the Management, Business, Science and Arts occupations in Midland, the most male-oriented occupations are Architecture & Engineering (86.1%), Computers, Engineering & Science (80.4%), and Life, Physical & Social Science (76.7%), while the most female-oriented occupations are Health Diagnosing & Treating (79.5%), Health Technologists (77.4%), and Education Instruction & Library (75.6%).
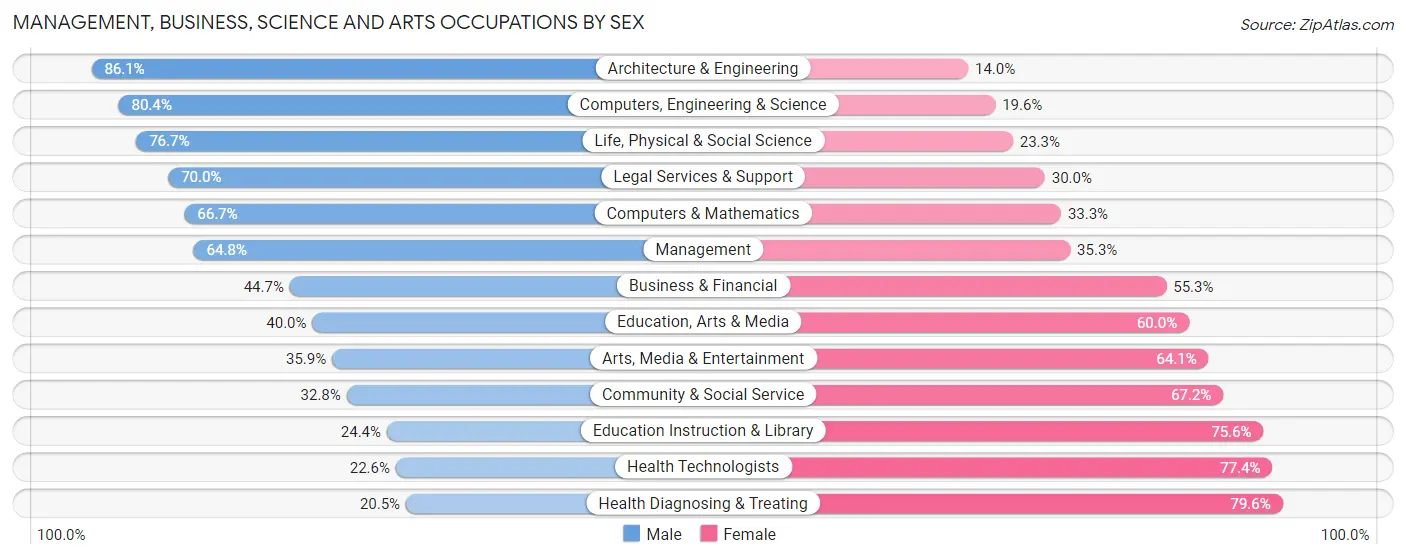
| Occupation | Male | Female |
| Management | 5,848 (64.7%) | 3,184 (35.2%) |
| Business & Financial | 1,536 (44.7%) | 1,901 (55.3%) |
| Computers, Engineering & Science | 4,530 (80.4%) | 1,105 (19.6%) |
| Computers & Mathematics | 778 (66.7%) | 389 (33.3%) |
| Architecture & Engineering | 2,991 (86.1%) | 485 (14.0%) |
| Life, Physical & Social Science | 761 (76.7%) | 231 (23.3%) |
| Community & Social Service | 2,082 (32.8%) | 4,259 (67.2%) |
| Education, Arts & Media | 319 (40.0%) | 479 (60.0%) |
| Legal Services & Support | 498 (70.0%) | 213 (30.0%) |
| Education Instruction & Library | 1,000 (24.4%) | 3,093 (75.6%) |
| Arts, Media & Entertainment | 265 (35.9%) | 474 (64.1%) |
| Health Diagnosing & Treating | 483 (20.4%) | 1,879 (79.5%) |
| Health Technologists | 356 (22.6%) | 1,221 (77.4%) |
| Total (Category) | 14,479 (54.0%) | 12,328 (46.0%) |
| Total (Overall) | 40,051 (59.2%) | 27,567 (40.8%) |
Services Occupations
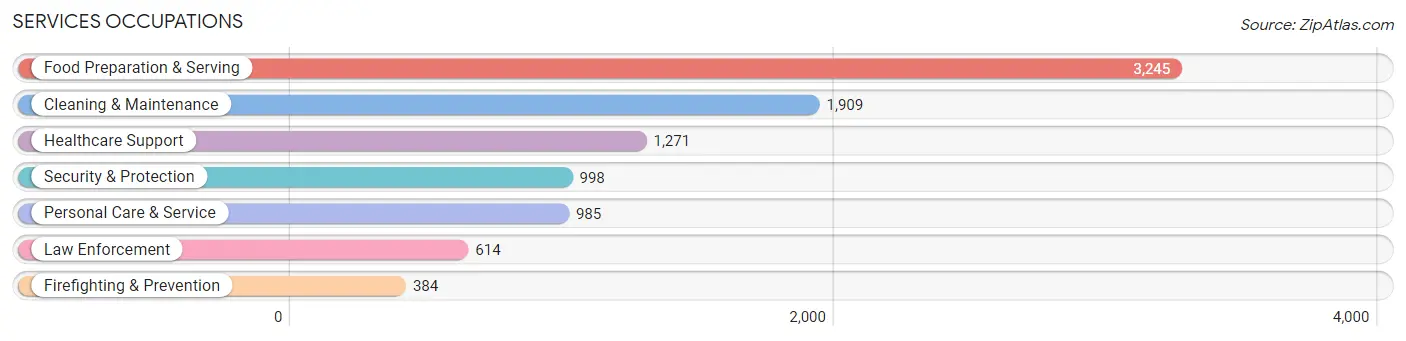
The most common Services occupations in Midland are Food Preparation & Serving (3,245 | 4.8%), Cleaning & Maintenance (1,909 | 2.8%), Healthcare Support (1,271 | 1.9%), Security & Protection (998 | 1.5%), and Personal Care & Service (985 | 1.5%).
Services Occupations by Sex
Within the Services occupations in Midland, the most male-oriented occupations are Firefighting & Prevention (87.5%), Security & Protection (85.8%), and Law Enforcement (84.7%), while the most female-oriented occupations are Healthcare Support (89.5%), Personal Care & Service (89.3%), and Food Preparation & Serving (50.3%).
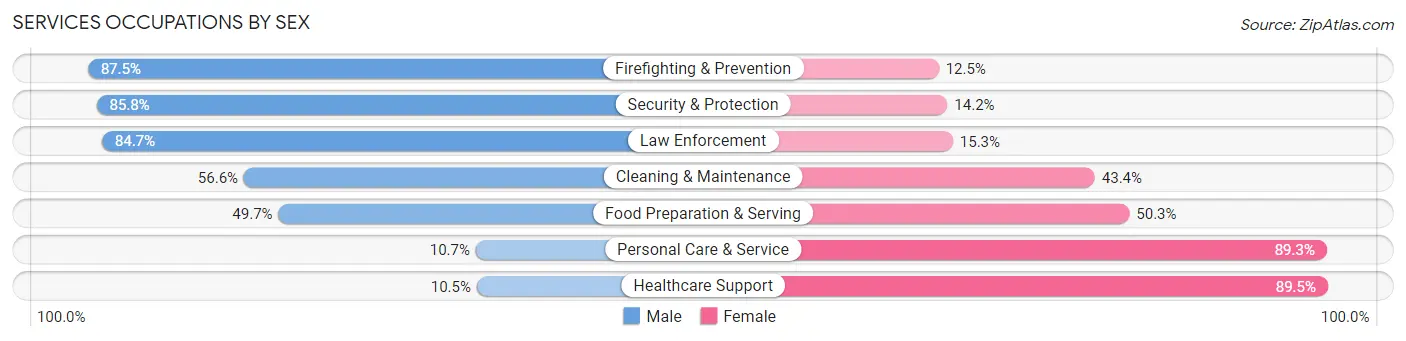
| Occupation | Male | Female |
| Healthcare Support | 133 (10.5%) | 1,138 (89.5%) |
| Security & Protection | 856 (85.8%) | 142 (14.2%) |
| Firefighting & Prevention | 336 (87.5%) | 48 (12.5%) |
| Law Enforcement | 520 (84.7%) | 94 (15.3%) |
| Food Preparation & Serving | 1,614 (49.7%) | 1,631 (50.3%) |
| Cleaning & Maintenance | 1,080 (56.6%) | 829 (43.4%) |
| Personal Care & Service | 105 (10.7%) | 880 (89.3%) |
| Total (Category) | 3,788 (45.1%) | 4,620 (54.9%) |
| Total (Overall) | 40,051 (59.2%) | 27,567 (40.8%) |
Sales and Office Occupations
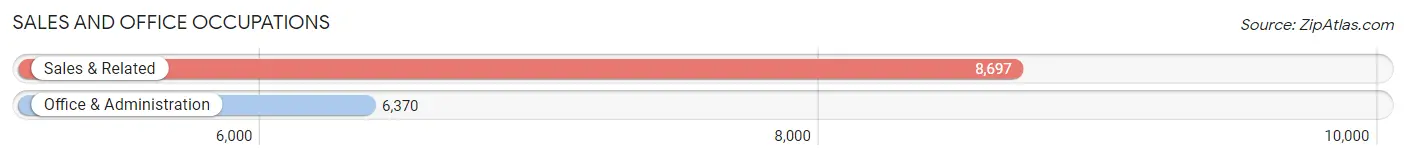
The most common Sales and Office occupations in Midland are Sales & Related (8,697 | 12.9%), and Office & Administration (6,370 | 9.4%).
Sales and Office Occupations by Sex
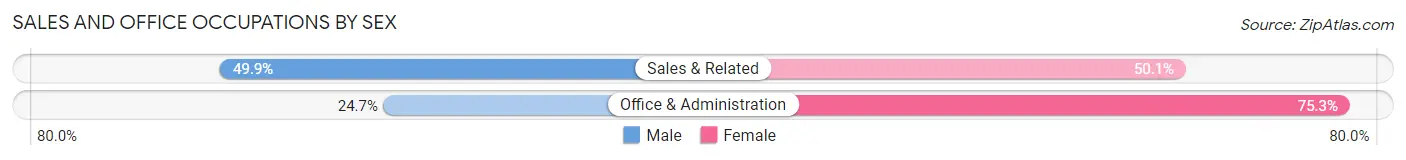
| Occupation | Male | Female |
| Sales & Related | 4,343 (49.9%) | 4,354 (50.1%) |
| Office & Administration | 1,576 (24.7%) | 4,794 (75.3%) |
| Total (Category) | 5,919 (39.3%) | 9,148 (60.7%) |
| Total (Overall) | 40,051 (59.2%) | 27,567 (40.8%) |
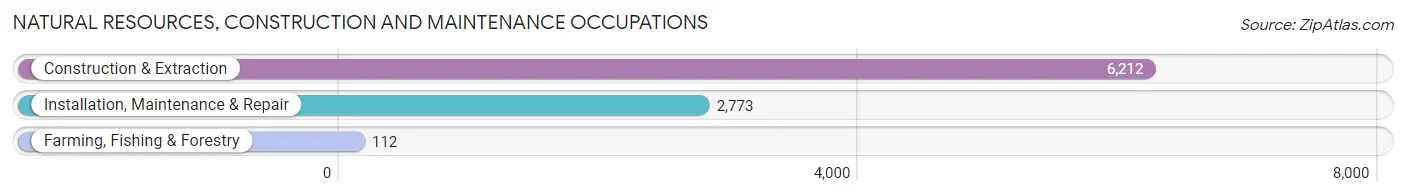
Natural Resources, Construction and Maintenance Occupations
The most common Natural Resources, Construction and Maintenance occupations in Midland are Construction & Extraction (6,212 | 9.2%), Installation, Maintenance & Repair (2,773 | 4.1%), and Farming, Fishing & Forestry (112 | 0.2%).
Natural Resources, Construction and Maintenance Occupations by Sex
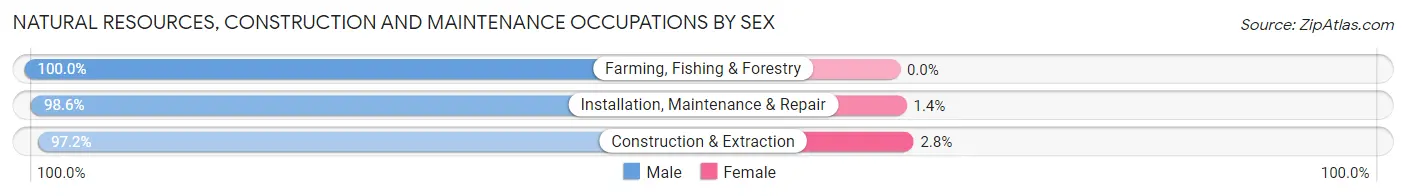
| Occupation | Male | Female |
| Farming, Fishing & Forestry | 112 (100.0%) | 0 (0.0%) |
| Construction & Extraction | 6,037 (97.2%) | 175 (2.8%) |
| Installation, Maintenance & Repair | 2,735 (98.6%) | 38 (1.4%) |
| Total (Category) | 8,884 (97.7%) | 213 (2.3%) |
| Total (Overall) | 40,051 (59.2%) | 27,567 (40.8%) |
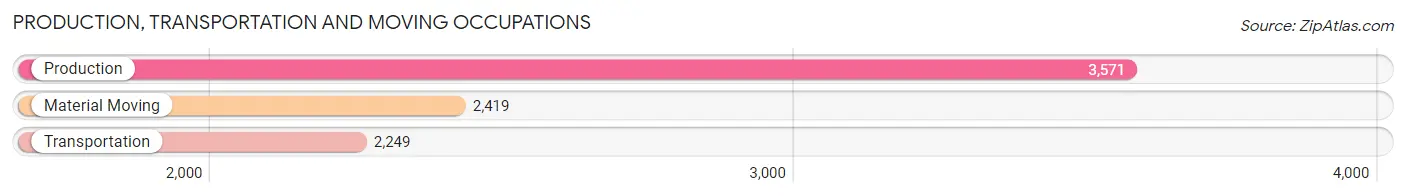
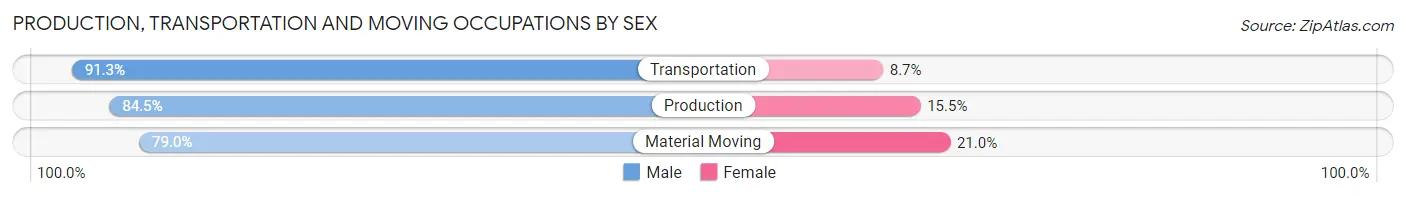
Production, Transportation and Moving Occupations
The most common Production, Transportation and Moving occupations in Midland are Production (3,571 | 5.3%), Material Moving (2,419 | 3.6%), and Transportation (2,249 | 3.3%).
Production, Transportation and Moving Occupations by Sex
| Occupation | Male | Female |
| Production | 3,016 (84.5%) | 555 (15.5%) |
| Transportation | 2,054 (91.3%) | 195 (8.7%) |
| Material Moving | 1,911 (79.0%) | 508 (21.0%) |
| Total (Category) | 6,981 (84.7%) | 1,258 (15.3%) |
| Total (Overall) | 40,051 (59.2%) | 27,567 (40.8%) |
Employment Industries by Sex in Midland
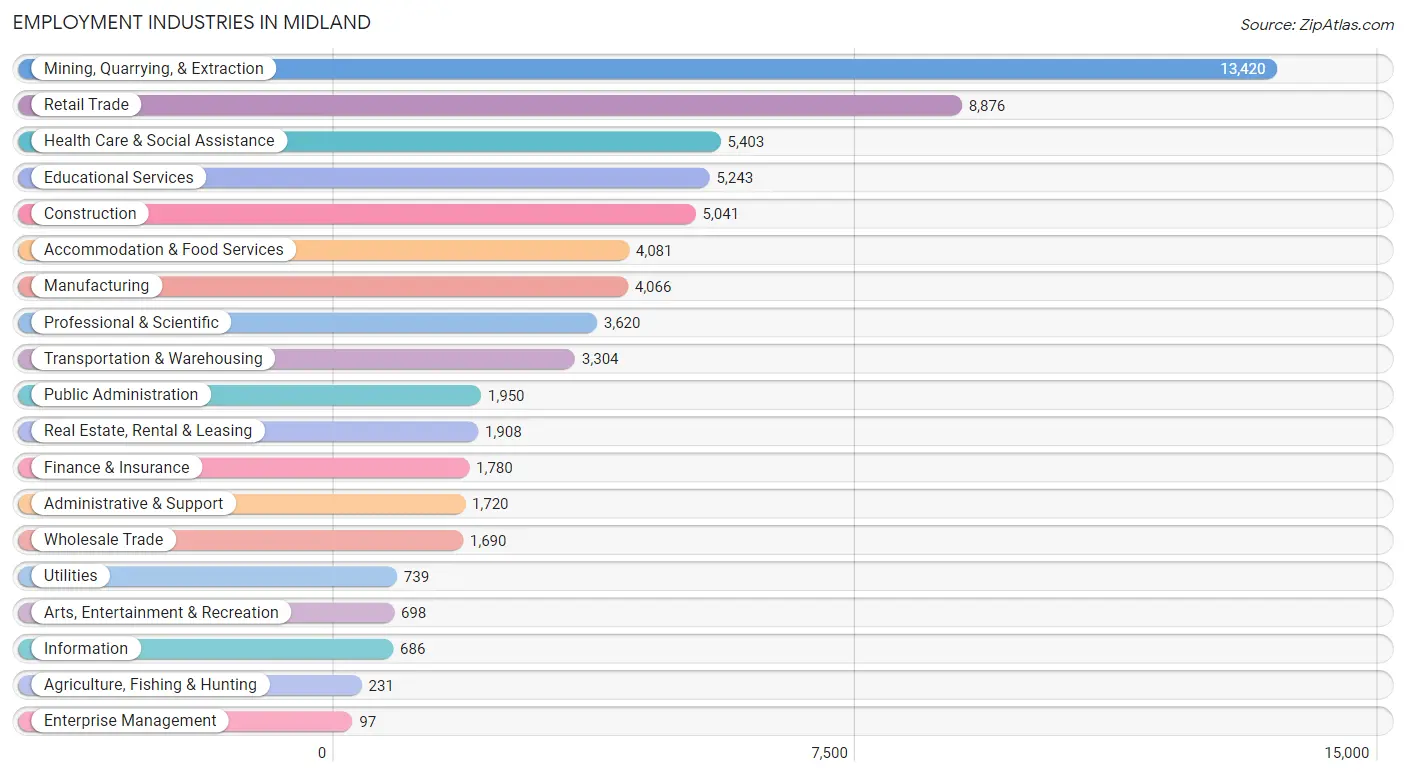
Employment Industries in Midland
The major employment industries in Midland include Mining, Quarrying, & Extraction (13,420 | 19.9%), Retail Trade (8,876 | 13.1%), Health Care & Social Assistance (5,403 | 8.0%), Educational Services (5,243 | 7.7%), and Construction (5,041 | 7.5%).
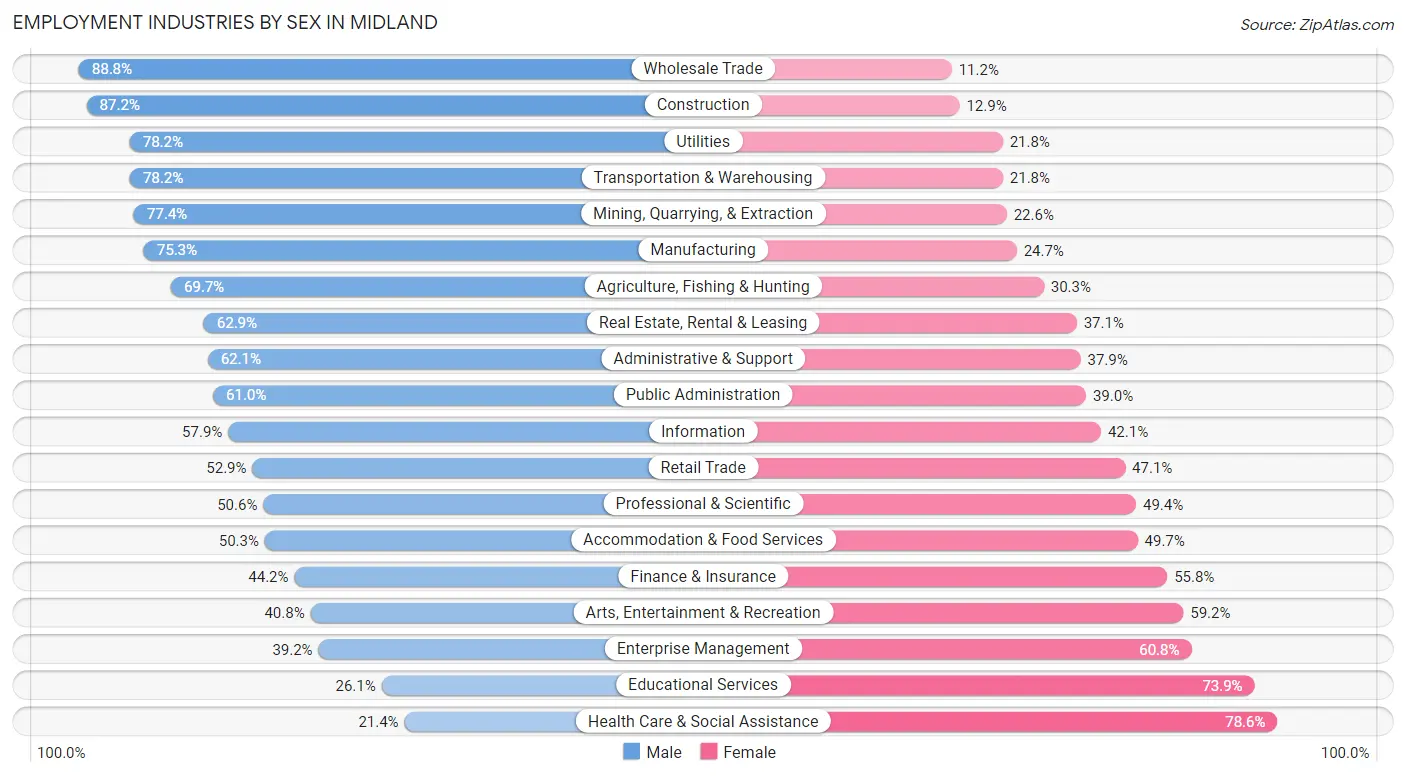
Employment Industries by Sex in Midland
The Midland industries that see more men than women are Wholesale Trade (88.8%), Construction (87.2%), and Utilities (78.2%), whereas the industries that tend to have a higher number of women are Health Care & Social Assistance (78.6%), Educational Services (73.9%), and Enterprise Management (60.8%).
| Industry | Male | Female |
| Agriculture, Fishing & Hunting | 161 (69.7%) | 70 (30.3%) |
| Mining, Quarrying, & Extraction | 10,383 (77.4%) | 3,037 (22.6%) |
| Construction | 4,393 (87.2%) | 648 (12.9%) |
| Manufacturing | 3,062 (75.3%) | 1,004 (24.7%) |
| Wholesale Trade | 1,500 (88.8%) | 190 (11.2%) |
| Retail Trade | 4,692 (52.9%) | 4,184 (47.1%) |
| Transportation & Warehousing | 2,583 (78.2%) | 721 (21.8%) |
| Utilities | 578 (78.2%) | 161 (21.8%) |
| Information | 397 (57.9%) | 289 (42.1%) |
| Finance & Insurance | 786 (44.2%) | 994 (55.8%) |
| Real Estate, Rental & Leasing | 1,200 (62.9%) | 708 (37.1%) |
| Professional & Scientific | 1,832 (50.6%) | 1,788 (49.4%) |
| Enterprise Management | 38 (39.2%) | 59 (60.8%) |
| Administrative & Support | 1,068 (62.1%) | 652 (37.9%) |
| Educational Services | 1,369 (26.1%) | 3,874 (73.9%) |
| Health Care & Social Assistance | 1,155 (21.4%) | 4,248 (78.6%) |
| Arts, Entertainment & Recreation | 285 (40.8%) | 413 (59.2%) |
| Accommodation & Food Services | 2,052 (50.3%) | 2,029 (49.7%) |
| Public Administration | 1,189 (61.0%) | 761 (39.0%) |
| Total | 40,051 (59.2%) | 27,567 (40.8%) |
Education in Midland
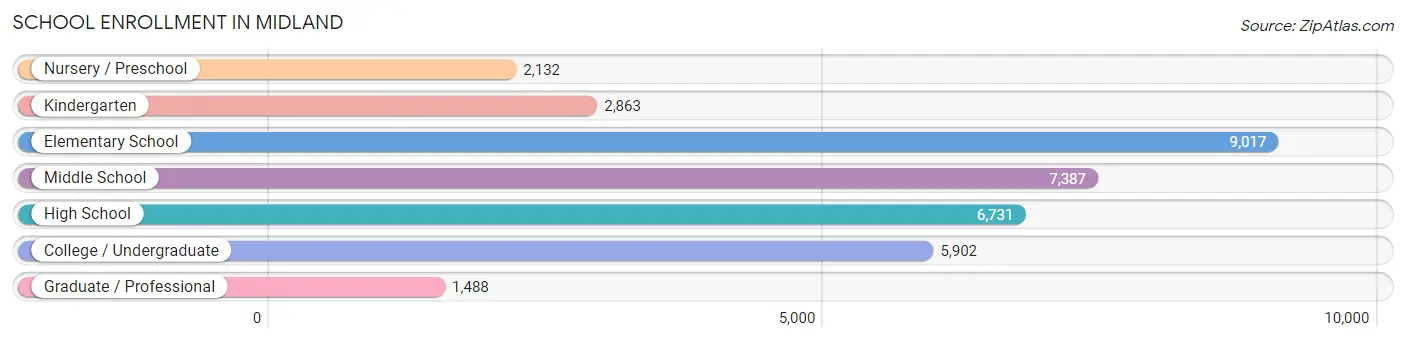
School Enrollment in Midland
The most common levels of schooling among the 35,520 students in Midland are elementary school (9,017 | 25.4%), middle school (7,387 | 20.8%), and high school (6,731 | 19.0%).
| School Level | # Students | % Students |
| Nursery / Preschool | 2,132 | 6.0% |
| Kindergarten | 2,863 | 8.1% |
| Elementary School | 9,017 | 25.4% |
| Middle School | 7,387 | 20.8% |
| High School | 6,731 | 19.0% |
| College / Undergraduate | 5,902 | 16.6% |
| Graduate / Professional | 1,488 | 4.2% |
| Total | 35,520 | 100.0% |
School Enrollment by Age by Funding Source in Midland
Out of a total of 35,520 students who are enrolled in schools in Midland, 6,713 (18.9%) attend a private institution, while the remaining 28,807 (81.1%) are enrolled in public schools. The age group of 3 to 4 year olds has the highest likelihood of being enrolled in private schools, with 688 (44.9% in the age bracket) enrolled. Conversely, the age group of 25 to 34 year olds has the lowest likelihood of being enrolled in a private school, with 1,909 (87.4% in the age bracket) attending a public institution.
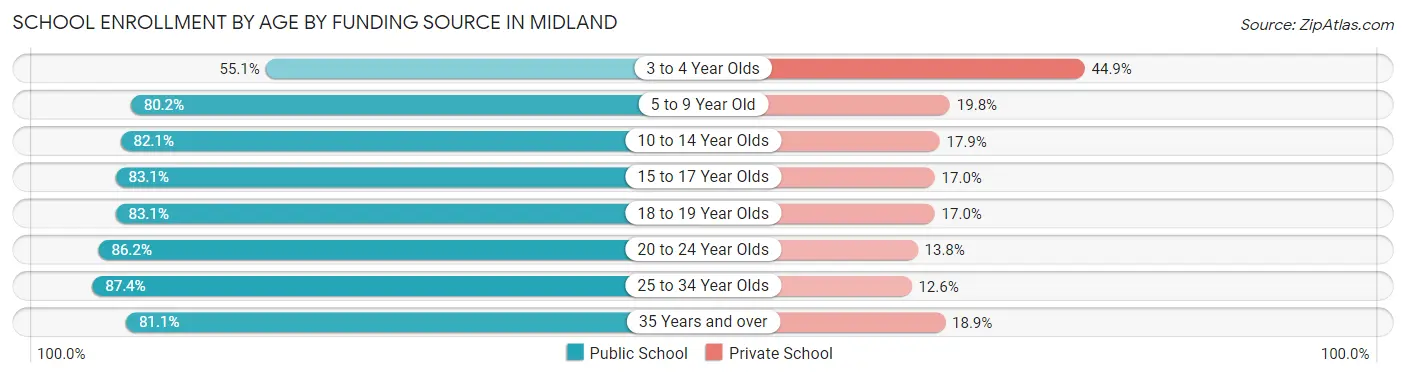
| Age Bracket | Public School | Private School |
| 3 to 4 Year Olds | 845 (55.1%) | 688 (44.9%) |
| 5 to 9 Year Old | 8,914 (80.2%) | 2,200 (19.8%) |
| 10 to 14 Year Olds | 7,928 (82.1%) | 1,725 (17.9%) |
| 15 to 17 Year Olds | 3,989 (83.1%) | 814 (17.0%) |
| 18 to 19 Year Olds | 1,700 (83.1%) | 347 (17.0%) |
| 20 to 24 Year Olds | 2,029 (86.2%) | 324 (13.8%) |
| 25 to 34 Year Olds | 1,909 (87.4%) | 276 (12.6%) |
| 35 Years and over | 1,486 (81.1%) | 346 (18.9%) |
| Total | 28,807 (81.1%) | 6,713 (18.9%) |
Educational Attainment by Field of Study in Midland
Business (6,607 | 23.9%), engineering (3,846 | 13.9%), education (3,690 | 13.3%), science & technology (2,276 | 8.2%), and arts & humanities (1,597 | 5.8%) are the most common fields of study among 27,669 individuals in Midland who have obtained a bachelor's degree or higher.
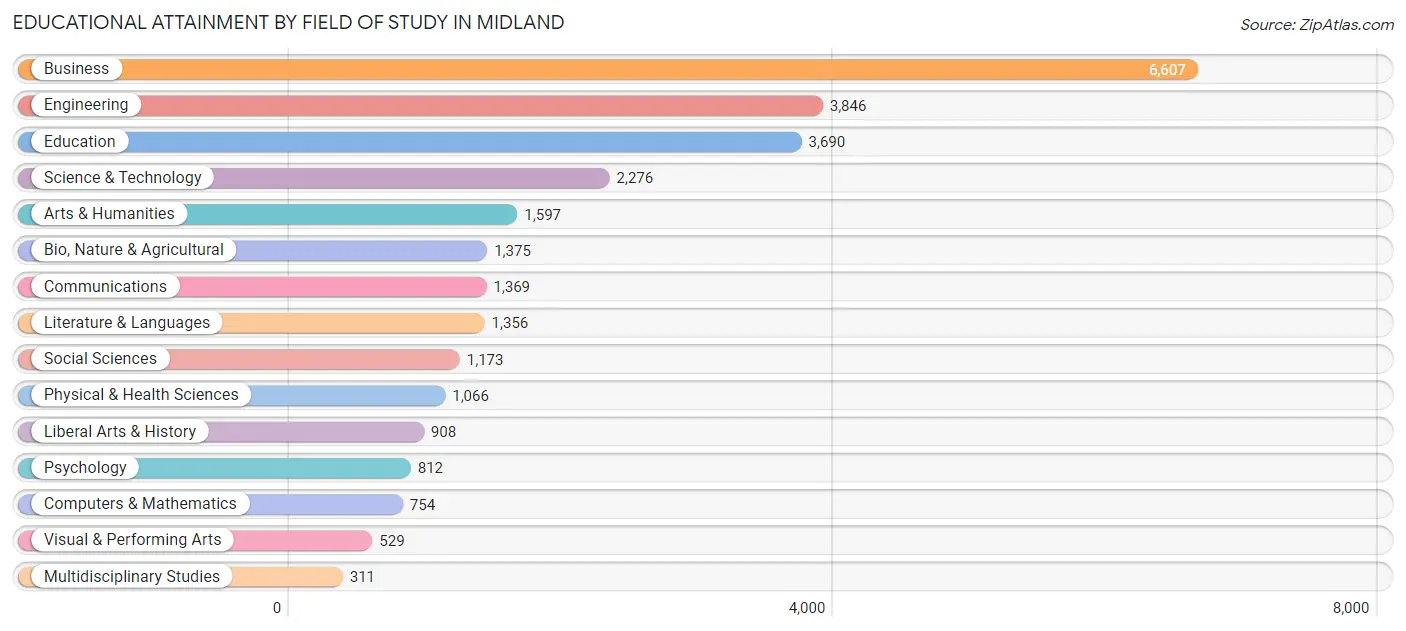
| Field of Study | # Graduates | % Graduates |
| Computers & Mathematics | 754 | 2.7% |
| Bio, Nature & Agricultural | 1,375 | 5.0% |
| Physical & Health Sciences | 1,066 | 3.8% |
| Psychology | 812 | 2.9% |
| Social Sciences | 1,173 | 4.2% |
| Engineering | 3,846 | 13.9% |
| Multidisciplinary Studies | 311 | 1.1% |
| Science & Technology | 2,276 | 8.2% |
| Business | 6,607 | 23.9% |
| Education | 3,690 | 13.3% |
| Literature & Languages | 1,356 | 4.9% |
| Liberal Arts & History | 908 | 3.3% |
| Visual & Performing Arts | 529 | 1.9% |
| Communications | 1,369 | 5.0% |
| Arts & Humanities | 1,597 | 5.8% |
| Total | 27,669 | 100.0% |
Transportation & Commute in Midland
Vehicle Availability by Sex in Midland
The most prevalent vehicle ownership categories in Midland are males with 2 vehicles (16,452, accounting for 41.4%) and females with 2 vehicles (11,678, making up 61.0%).
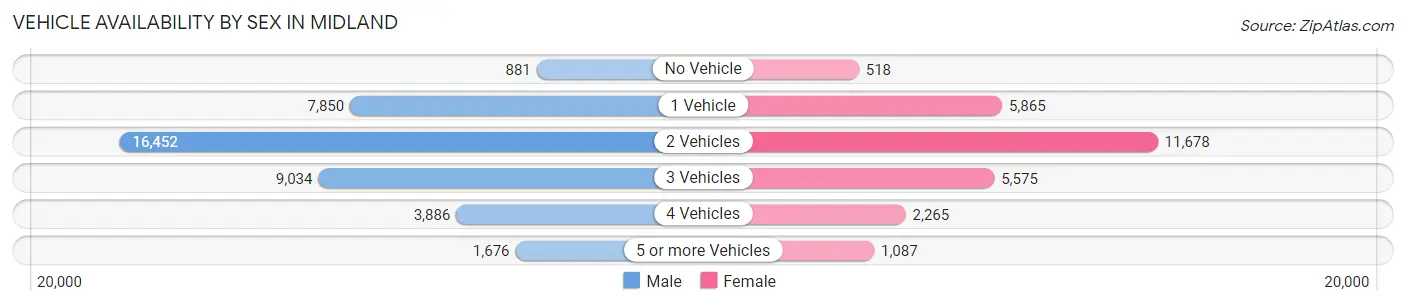
| Vehicles Available | Male | Female |
| No Vehicle | 881 (2.2%) | 518 (1.9%) |
| 1 Vehicle | 7,850 (19.7%) | 5,865 (21.7%) |
| 2 Vehicles | 16,452 (41.4%) | 11,678 (43.3%) |
| 3 Vehicles | 9,034 (22.7%) | 5,575 (20.7%) |
| 4 Vehicles | 3,886 (9.8%) | 2,265 (8.4%) |
| 5 or more Vehicles | 1,676 (4.2%) | 1,087 (4.0%) |
| Total | 39,779 (100.0%) | 26,988 (100.0%) |
Commute Time in Midland
The most frequently occuring commute durations in Midland are 10 to 14 minutes (15,011 commuters, 23.8%), 15 to 19 minutes (14,614 commuters, 23.1%), and 20 to 24 minutes (9,102 commuters, 14.4%).
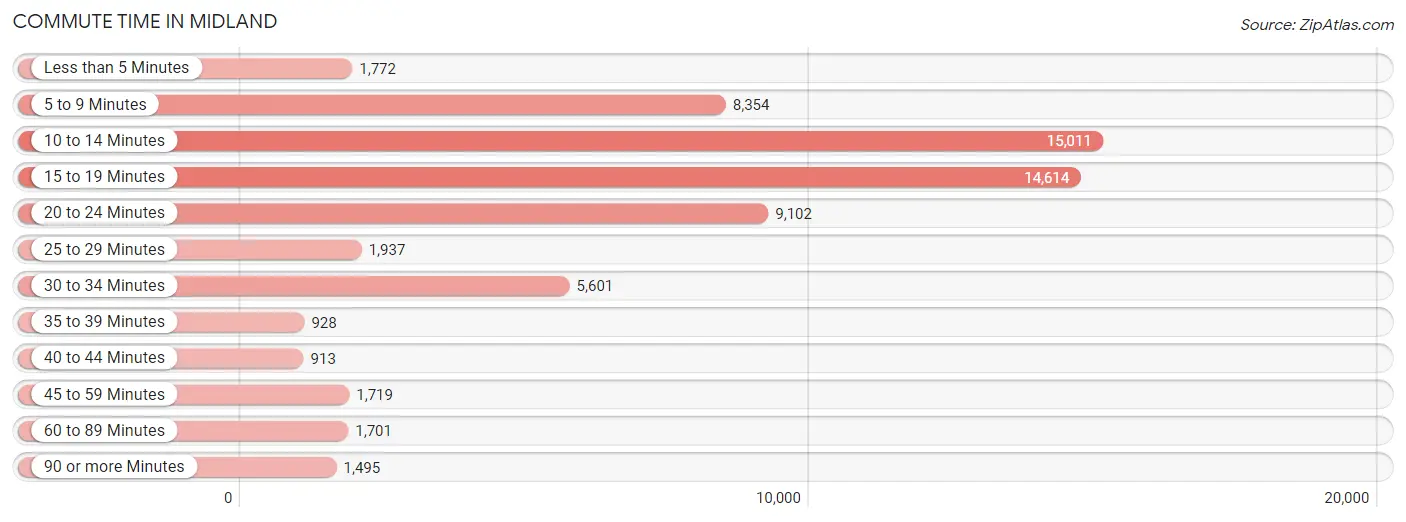
| Commute Time | # Commuters | % Commuters |
| Less than 5 Minutes | 1,772 | 2.8% |
| 5 to 9 Minutes | 8,354 | 13.2% |
| 10 to 14 Minutes | 15,011 | 23.8% |
| 15 to 19 Minutes | 14,614 | 23.1% |
| 20 to 24 Minutes | 9,102 | 14.4% |
| 25 to 29 Minutes | 1,937 | 3.1% |
| 30 to 34 Minutes | 5,601 | 8.9% |
| 35 to 39 Minutes | 928 | 1.5% |
| 40 to 44 Minutes | 913 | 1.5% |
| 45 to 59 Minutes | 1,719 | 2.7% |
| 60 to 89 Minutes | 1,701 | 2.7% |
| 90 or more Minutes | 1,495 | 2.4% |
Commute Time by Sex in Midland
The most common commute times in Midland are 15 to 19 minutes (8,602 commuters, 22.5%) for males and 10 to 14 minutes (6,676 commuters, 26.8%) for females.
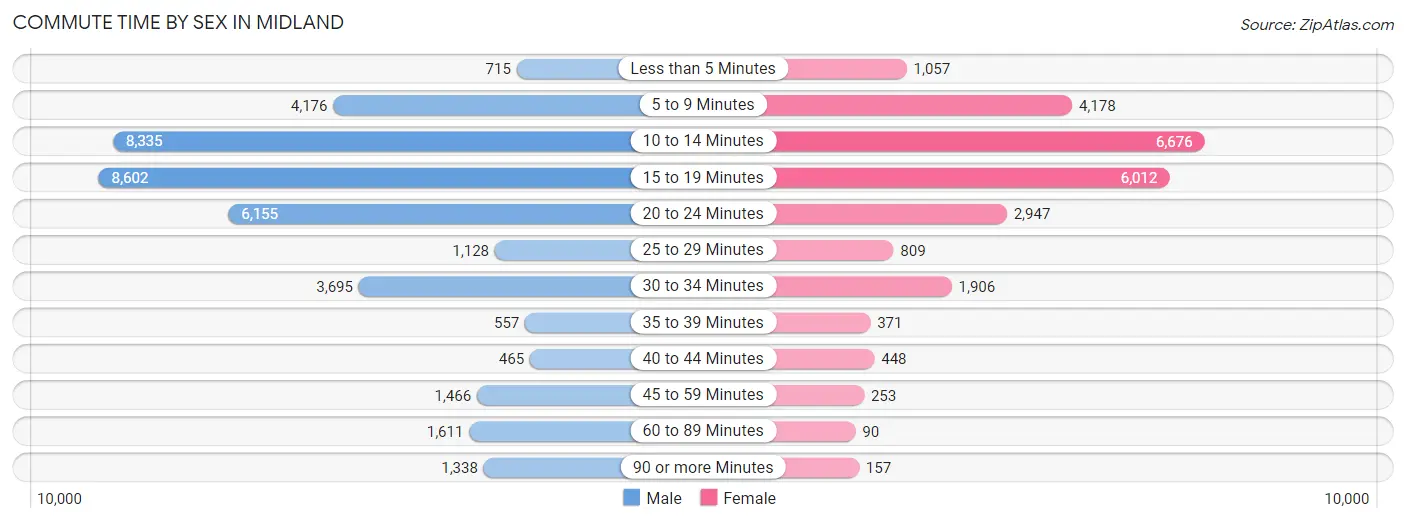
| Commute Time | Male | Female |
| Less than 5 Minutes | 715 (1.9%) | 1,057 (4.2%) |
| 5 to 9 Minutes | 4,176 (10.9%) | 4,178 (16.8%) |
| 10 to 14 Minutes | 8,335 (21.8%) | 6,676 (26.8%) |
| 15 to 19 Minutes | 8,602 (22.5%) | 6,012 (24.1%) |
| 20 to 24 Minutes | 6,155 (16.1%) | 2,947 (11.8%) |
| 25 to 29 Minutes | 1,128 (2.9%) | 809 (3.3%) |
| 30 to 34 Minutes | 3,695 (9.7%) | 1,906 (7.6%) |
| 35 to 39 Minutes | 557 (1.5%) | 371 (1.5%) |
| 40 to 44 Minutes | 465 (1.2%) | 448 (1.8%) |
| 45 to 59 Minutes | 1,466 (3.8%) | 253 (1.0%) |
| 60 to 89 Minutes | 1,611 (4.2%) | 90 (0.4%) |
| 90 or more Minutes | 1,338 (3.5%) | 157 (0.6%) |
Time of Departure to Work by Sex in Midland
The most frequent times of departure to work in Midland are 7:30 AM to 7:59 AM (6,269, 16.4%) for males and 7:30 AM to 7:59 AM (5,048, 20.3%) for females.
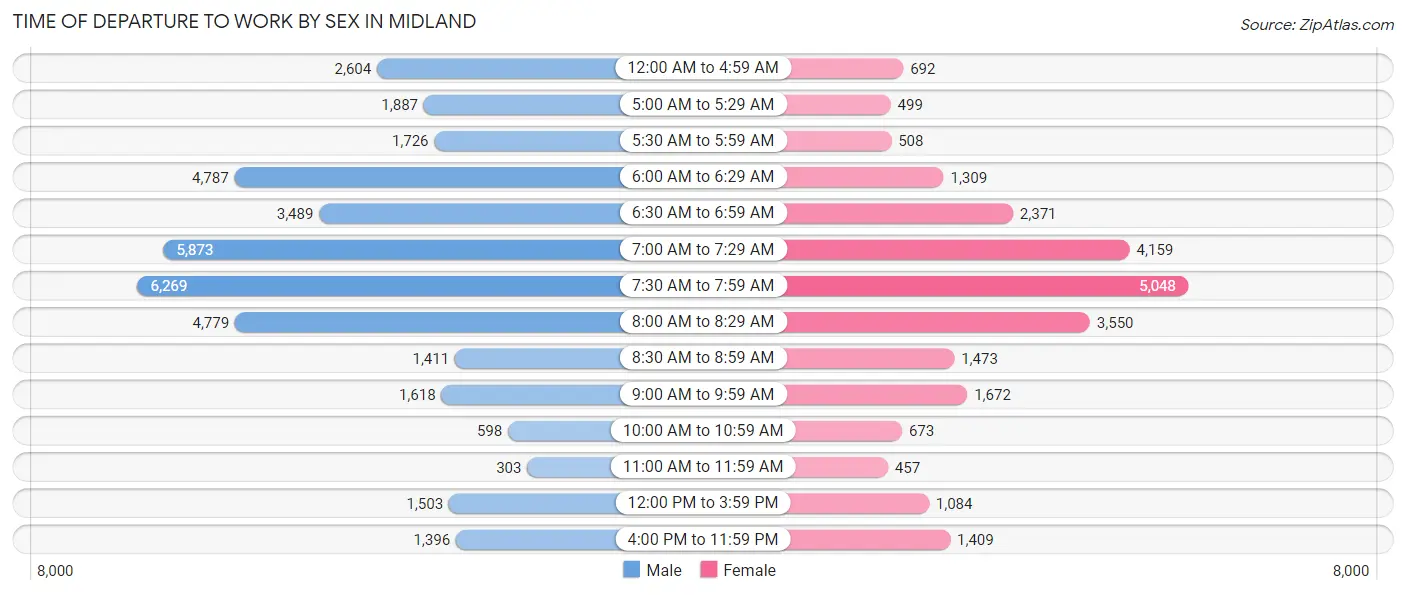
| Time of Departure | Male | Female |
| 12:00 AM to 4:59 AM | 2,604 (6.8%) | 692 (2.8%) |
| 5:00 AM to 5:29 AM | 1,887 (4.9%) | 499 (2.0%) |
| 5:30 AM to 5:59 AM | 1,726 (4.5%) | 508 (2.0%) |
| 6:00 AM to 6:29 AM | 4,787 (12.5%) | 1,309 (5.3%) |
| 6:30 AM to 6:59 AM | 3,489 (9.1%) | 2,371 (9.5%) |
| 7:00 AM to 7:29 AM | 5,873 (15.4%) | 4,159 (16.7%) |
| 7:30 AM to 7:59 AM | 6,269 (16.4%) | 5,048 (20.3%) |
| 8:00 AM to 8:29 AM | 4,779 (12.5%) | 3,550 (14.2%) |
| 8:30 AM to 8:59 AM | 1,411 (3.7%) | 1,473 (5.9%) |
| 9:00 AM to 9:59 AM | 1,618 (4.2%) | 1,672 (6.7%) |
| 10:00 AM to 10:59 AM | 598 (1.6%) | 673 (2.7%) |
| 11:00 AM to 11:59 AM | 303 (0.8%) | 457 (1.8%) |
| 12:00 PM to 3:59 PM | 1,503 (3.9%) | 1,084 (4.3%) |
| 4:00 PM to 11:59 PM | 1,396 (3.6%) | 1,409 (5.7%) |
| Total | 38,243 (100.0%) | 24,904 (100.0%) |
Housing Occupancy in Midland
Occupancy by Ownership in Midland
Of the total 51,460 dwellings in Midland, owner-occupied units account for 32,886 (63.9%), while renter-occupied units make up 18,574 (36.1%).
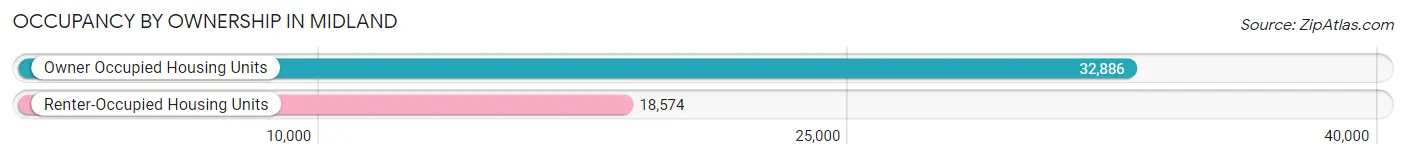
| Occupancy | # Housing Units | % Housing Units |
| Owner Occupied Housing Units | 32,886 | 63.9% |
| Renter-Occupied Housing Units | 18,574 | 36.1% |
| Total Occupied Housing Units | 51,460 | 100.0% |
Occupancy by Household Size in Midland
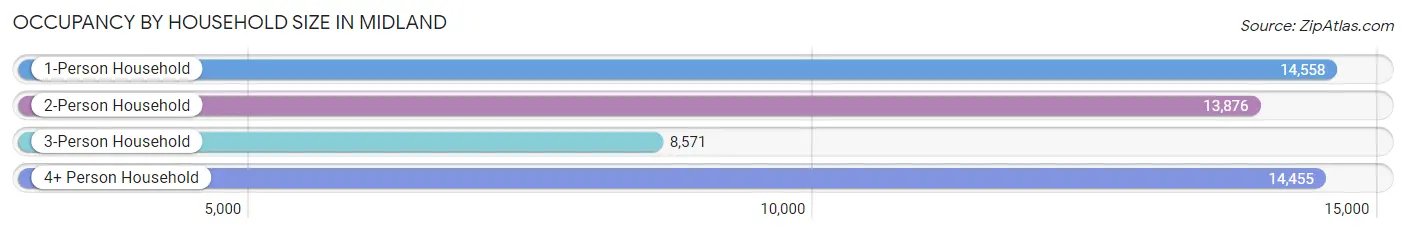
| Household Size | # Housing Units | % Housing Units |
| 1-Person Household | 14,558 | 28.3% |
| 2-Person Household | 13,876 | 27.0% |
| 3-Person Household | 8,571 | 16.7% |
| 4+ Person Household | 14,455 | 28.1% |
| Total Housing Units | 51,460 | 100.0% |
Occupancy by Ownership by Household Size in Midland
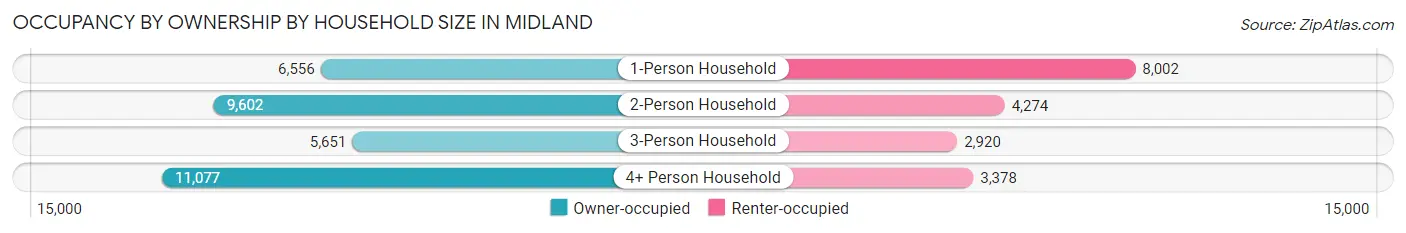
| Household Size | Owner-occupied | Renter-occupied |
| 1-Person Household | 6,556 (45.0%) | 8,002 (55.0%) |
| 2-Person Household | 9,602 (69.2%) | 4,274 (30.8%) |
| 3-Person Household | 5,651 (65.9%) | 2,920 (34.1%) |
| 4+ Person Household | 11,077 (76.6%) | 3,378 (23.4%) |
| Total Housing Units | 32,886 (63.9%) | 18,574 (36.1%) |
Occupancy by Educational Attainment in Midland
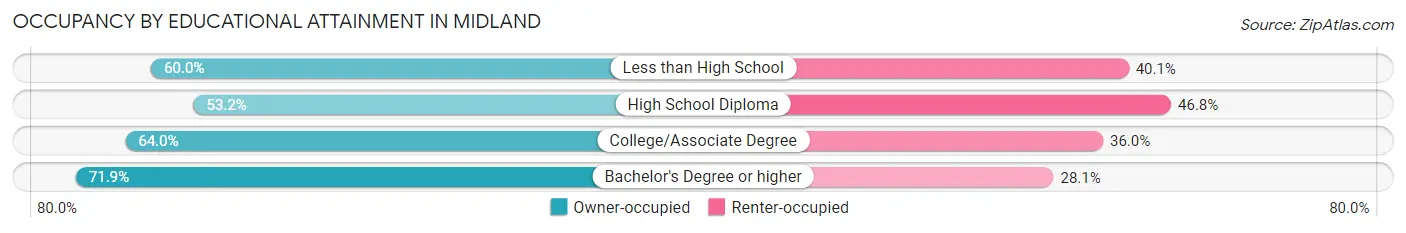
| Household Size | Owner-occupied | Renter-occupied |
| Less than High School | 4,273 (60.0%) | 2,855 (40.1%) |
| High School Diploma | 5,425 (53.2%) | 4,768 (46.8%) |
| College/Associate Degree | 10,971 (64.0%) | 6,166 (36.0%) |
| Bachelor's Degree or higher | 12,217 (71.9%) | 4,785 (28.1%) |
Occupancy by Age of Householder in Midland
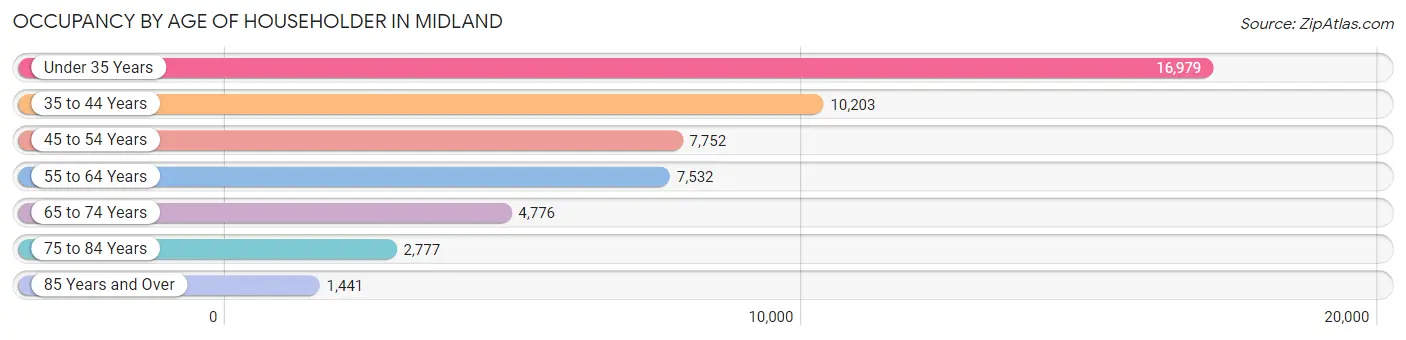
| Age Bracket | # Households | % Households |
| Under 35 Years | 16,979 | 33.0% |
| 35 to 44 Years | 10,203 | 19.8% |
| 45 to 54 Years | 7,752 | 15.1% |
| 55 to 64 Years | 7,532 | 14.6% |
| 65 to 74 Years | 4,776 | 9.3% |
| 75 to 84 Years | 2,777 | 5.4% |
| 85 Years and Over | 1,441 | 2.8% |
| Total | 51,460 | 100.0% |
Housing Finances in Midland
Median Income by Occupancy in Midland
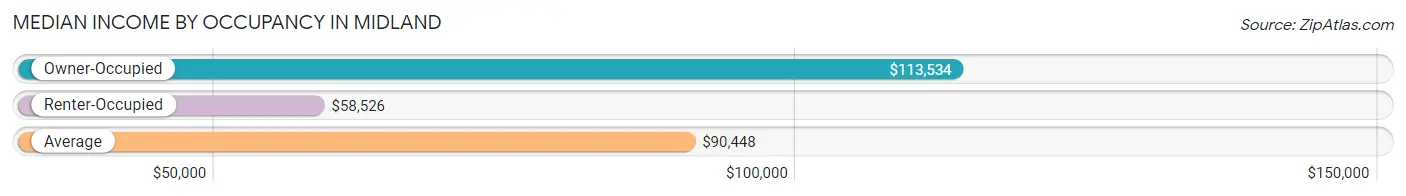
| Occupancy Type | # Households | Median Income |
| Owner-Occupied | 32,886 (63.9%) | $113,534 |
| Renter-Occupied | 18,574 (36.1%) | $58,526 |
| Average | 51,460 (100.0%) | $90,448 |
Occupancy by Householder Income Bracket in Midland
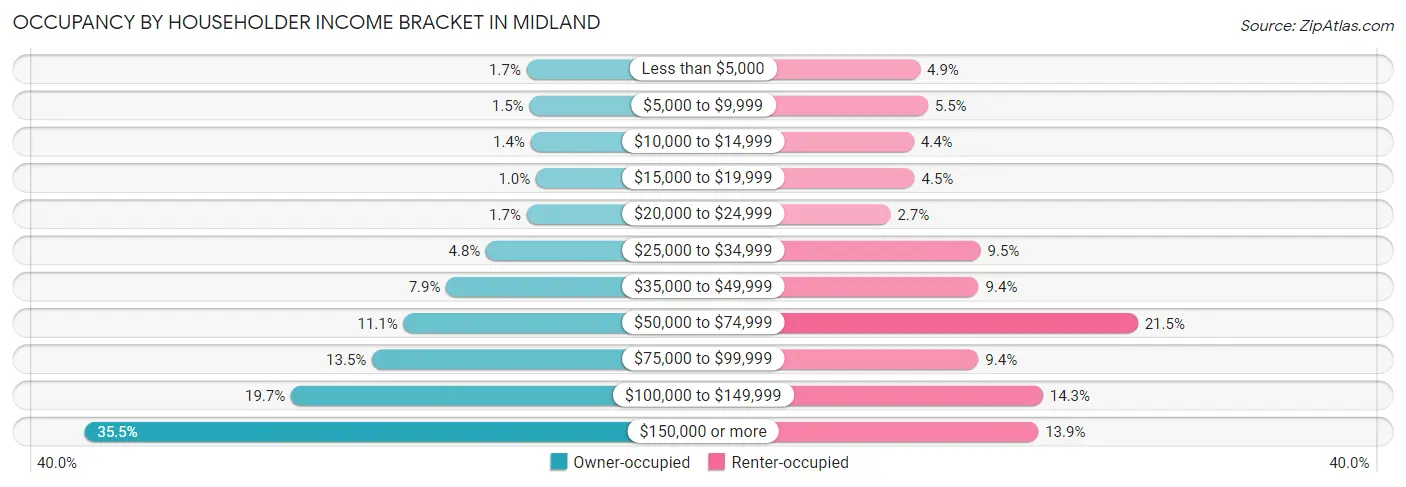
| Income Bracket | Owner-occupied | Renter-occupied |
| Less than $5,000 | 572 (1.7%) | 914 (4.9%) |
| $5,000 to $9,999 | 508 (1.5%) | 1,024 (5.5%) |
| $10,000 to $14,999 | 474 (1.4%) | 825 (4.4%) |
| $15,000 to $19,999 | 340 (1.0%) | 836 (4.5%) |
| $20,000 to $24,999 | 573 (1.7%) | 494 (2.7%) |
| $25,000 to $34,999 | 1,589 (4.8%) | 1,771 (9.5%) |
| $35,000 to $49,999 | 2,587 (7.9%) | 1,743 (9.4%) |
| $50,000 to $74,999 | 3,660 (11.1%) | 3,993 (21.5%) |
| $75,000 to $99,999 | 4,447 (13.5%) | 1,739 (9.4%) |
| $100,000 to $149,999 | 6,479 (19.7%) | 2,650 (14.3%) |
| $150,000 or more | 11,657 (35.4%) | 2,585 (13.9%) |
| Total | 32,886 (100.0%) | 18,574 (100.0%) |
Monthly Housing Cost Tiers in Midland
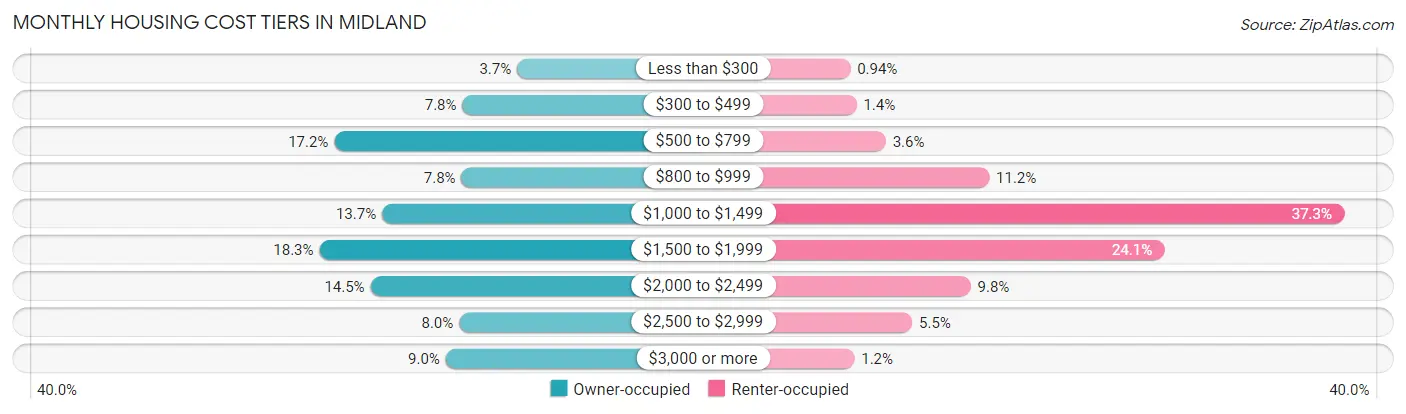
| Monthly Cost | Owner-occupied | Renter-occupied |
| Less than $300 | 1,227 (3.7%) | 174 (0.9%) |
| $300 to $499 | 2,552 (7.8%) | 260 (1.4%) |
| $500 to $799 | 5,656 (17.2%) | 661 (3.6%) |
| $800 to $999 | 2,574 (7.8%) | 2,074 (11.2%) |
| $1,000 to $1,499 | 4,499 (13.7%) | 6,927 (37.3%) |
| $1,500 to $1,999 | 6,015 (18.3%) | 4,467 (24.0%) |
| $2,000 to $2,499 | 4,778 (14.5%) | 1,822 (9.8%) |
| $2,500 to $2,999 | 2,630 (8.0%) | 1,021 (5.5%) |
| $3,000 or more | 2,955 (9.0%) | 231 (1.2%) |
| Total | 32,886 (100.0%) | 18,574 (100.0%) |
Physical Housing Characteristics in Midland
Housing Structures in Midland
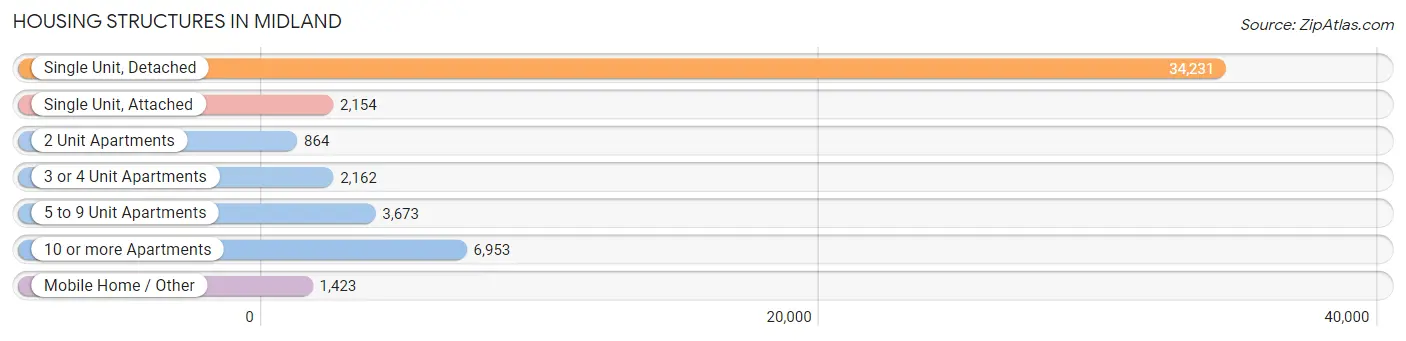
| Structure Type | # Housing Units | % Housing Units |
| Single Unit, Detached | 34,231 | 66.5% |
| Single Unit, Attached | 2,154 | 4.2% |
| 2 Unit Apartments | 864 | 1.7% |
| 3 or 4 Unit Apartments | 2,162 | 4.2% |
| 5 to 9 Unit Apartments | 3,673 | 7.1% |
| 10 or more Apartments | 6,953 | 13.5% |
| Mobile Home / Other | 1,423 | 2.8% |
| Total | 51,460 | 100.0% |
Housing Structures by Occupancy in Midland
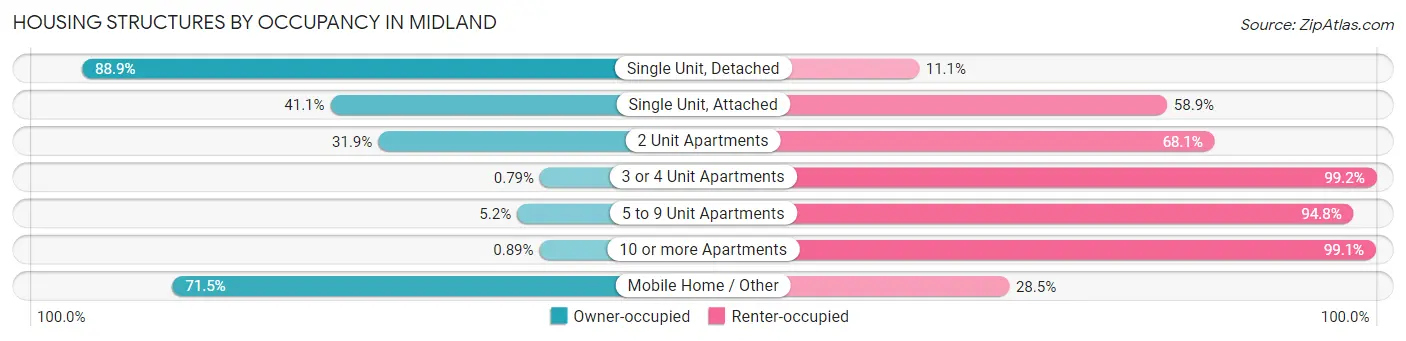
| Structure Type | Owner-occupied | Renter-occupied |
| Single Unit, Detached | 30,436 (88.9%) | 3,795 (11.1%) |
| Single Unit, Attached | 886 (41.1%) | 1,268 (58.9%) |
| 2 Unit Apartments | 276 (31.9%) | 588 (68.1%) |
| 3 or 4 Unit Apartments | 17 (0.8%) | 2,145 (99.2%) |
| 5 to 9 Unit Apartments | 191 (5.2%) | 3,482 (94.8%) |
| 10 or more Apartments | 62 (0.9%) | 6,891 (99.1%) |
| Mobile Home / Other | 1,018 (71.5%) | 405 (28.5%) |
| Total | 32,886 (63.9%) | 18,574 (36.1%) |
Housing Structures by Number of Rooms in Midland
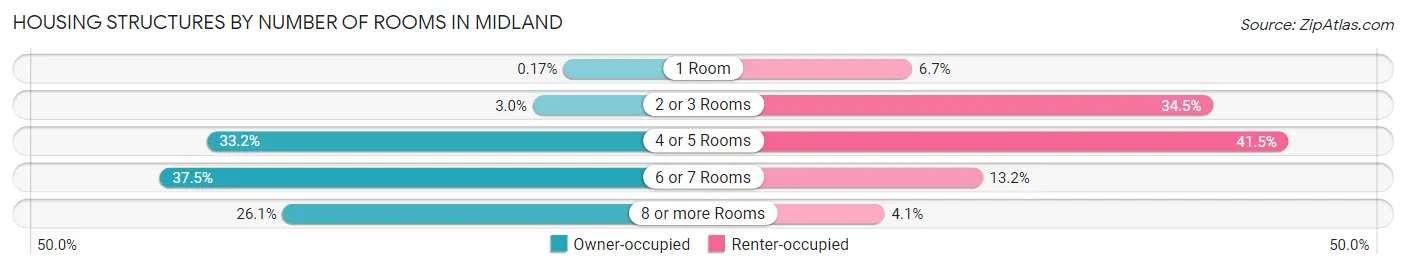
| Number of Rooms | Owner-occupied | Renter-occupied |
| 1 Room | 57 (0.2%) | 1,236 (6.7%) |
| 2 or 3 Rooms | 987 (3.0%) | 6,413 (34.5%) |
| 4 or 5 Rooms | 10,907 (33.2%) | 7,708 (41.5%) |
| 6 or 7 Rooms | 12,337 (37.5%) | 2,450 (13.2%) |
| 8 or more Rooms | 8,598 (26.1%) | 767 (4.1%) |
| Total | 32,886 (100.0%) | 18,574 (100.0%) |
Housing Structure by Heating Type in Midland
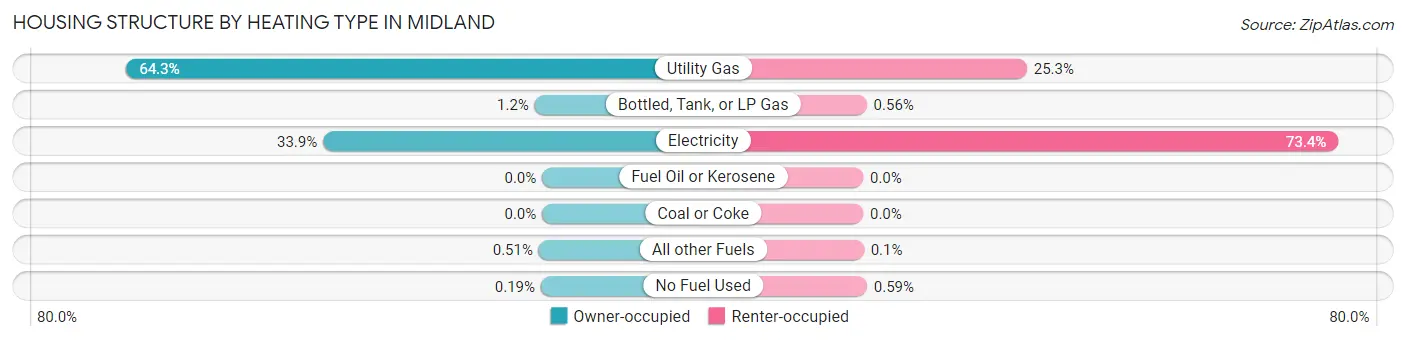
| Heating Type | Owner-occupied | Renter-occupied |
| Utility Gas | 21,137 (64.3%) | 4,702 (25.3%) |
| Bottled, Tank, or LP Gas | 379 (1.1%) | 104 (0.6%) |
| Electricity | 11,140 (33.9%) | 13,641 (73.4%) |
| Fuel Oil or Kerosene | 0 (0.0%) | 0 (0.0%) |
| Coal or Coke | 0 (0.0%) | 0 (0.0%) |
| All other Fuels | 168 (0.5%) | 18 (0.1%) |
| No Fuel Used | 62 (0.2%) | 109 (0.6%) |
| Total | 32,886 (100.0%) | 18,574 (100.0%) |
Household Vehicle Usage in Midland
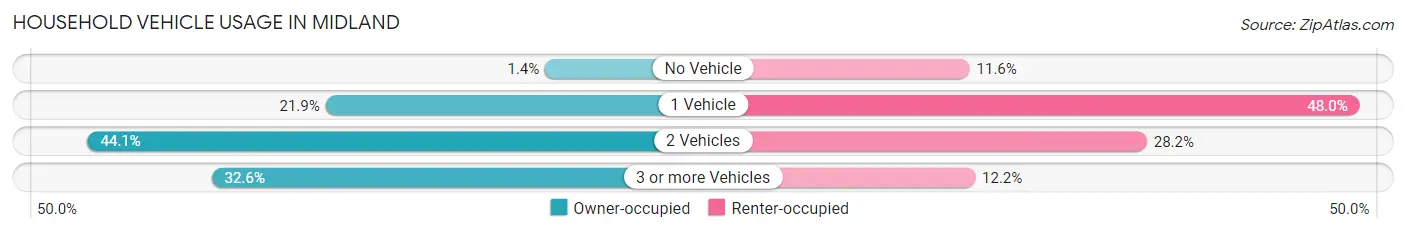
| Vehicles per Household | Owner-occupied | Renter-occupied |
| No Vehicle | 463 (1.4%) | 2,162 (11.6%) |
| 1 Vehicle | 7,204 (21.9%) | 8,921 (48.0%) |
| 2 Vehicles | 14,513 (44.1%) | 5,235 (28.2%) |
| 3 or more Vehicles | 10,706 (32.6%) | 2,256 (12.1%) |
| Total | 32,886 (100.0%) | 18,574 (100.0%) |
Real Estate & Mortgages in Midland
Real Estate and Mortgage Overview in Midland
| Characteristic | Without Mortgage | With Mortgage |
| Housing Units | 14,682 | 18,204 |
| Median Property Value | $244,800 | $304,000 |
| Median Household Income | $93,101 | $7,756 |
| Monthly Housing Costs | $723 | $2,902 |
| Real Estate Taxes | $2,967 | $812 |
Property Value by Mortgage Status in Midland
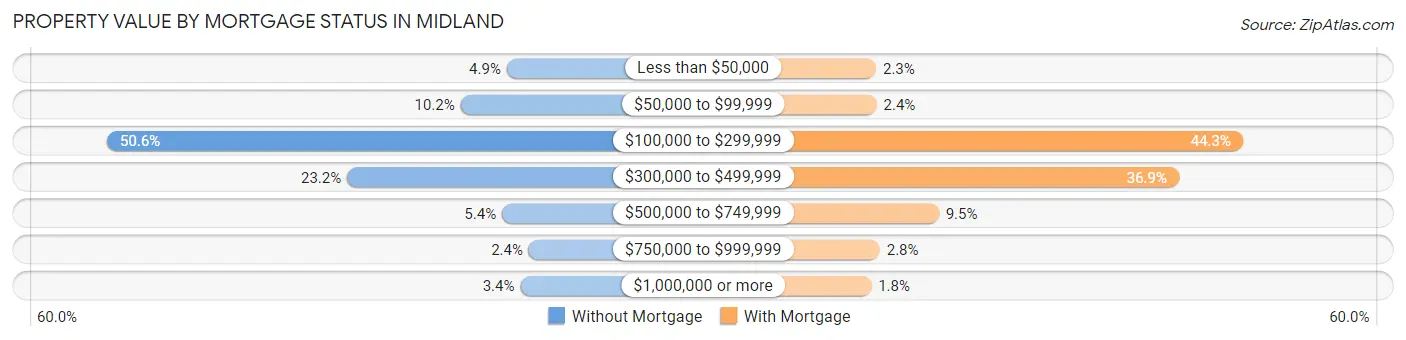
| Property Value | Without Mortgage | With Mortgage |
| Less than $50,000 | 720 (4.9%) | 426 (2.3%) |
| $50,000 to $99,999 | 1,495 (10.2%) | 439 (2.4%) |
| $100,000 to $299,999 | 7,428 (50.6%) | 8,055 (44.3%) |
| $300,000 to $499,999 | 3,399 (23.2%) | 6,725 (36.9%) |
| $500,000 to $749,999 | 798 (5.4%) | 1,730 (9.5%) |
| $750,000 to $999,999 | 350 (2.4%) | 504 (2.8%) |
| $1,000,000 or more | 492 (3.4%) | 325 (1.8%) |
| Total | 14,682 (100.0%) | 18,204 (100.0%) |
Household Income by Mortgage Status in Midland
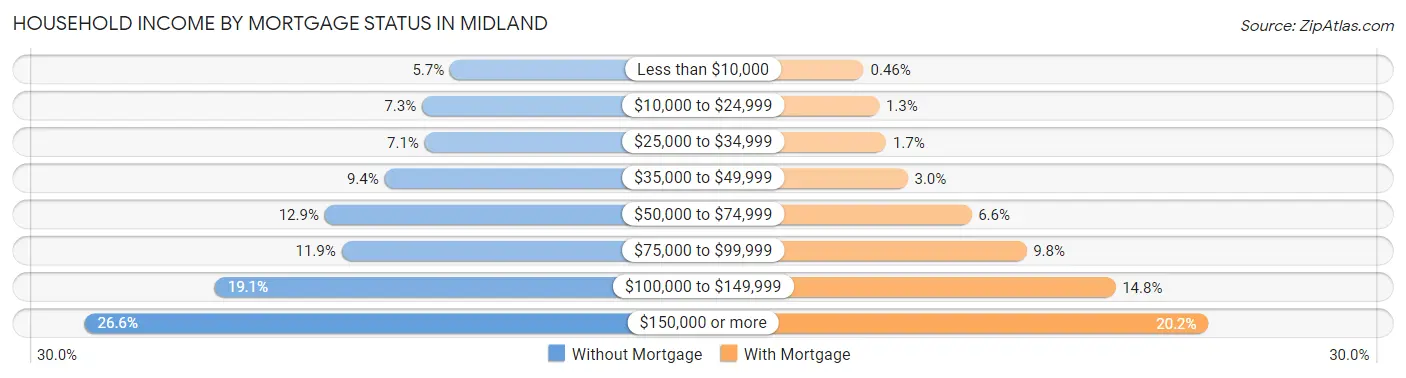
| Household Income | Without Mortgage | With Mortgage |
| Less than $10,000 | 836 (5.7%) | 83 (0.5%) |
| $10,000 to $24,999 | 1,071 (7.3%) | 244 (1.3%) |
| $25,000 to $34,999 | 1,049 (7.1%) | 316 (1.7%) |
| $35,000 to $49,999 | 1,384 (9.4%) | 540 (3.0%) |
| $50,000 to $74,999 | 1,886 (12.9%) | 1,203 (6.6%) |
| $75,000 to $99,999 | 1,746 (11.9%) | 1,774 (9.8%) |
| $100,000 to $149,999 | 2,809 (19.1%) | 2,701 (14.8%) |
| $150,000 or more | 3,901 (26.6%) | 3,670 (20.2%) |
| Total | 14,682 (100.0%) | 18,204 (100.0%) |
Property Value to Household Income Ratio in Midland
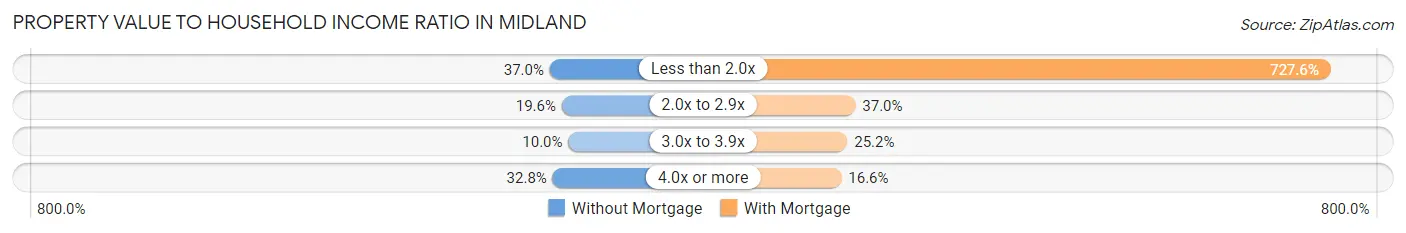
| Value-to-Income Ratio | Without Mortgage | With Mortgage |
| Less than 2.0x | 5,430 (37.0%) | 132,448 (727.6%) |
| 2.0x to 2.9x | 2,874 (19.6%) | 6,733 (37.0%) |
| 3.0x to 3.9x | 1,468 (10.0%) | 4,591 (25.2%) |
| 4.0x or more | 4,811 (32.8%) | 3,019 (16.6%) |
| Total | 14,682 (100.0%) | 18,204 (100.0%) |
Real Estate Taxes by Mortgage Status in Midland
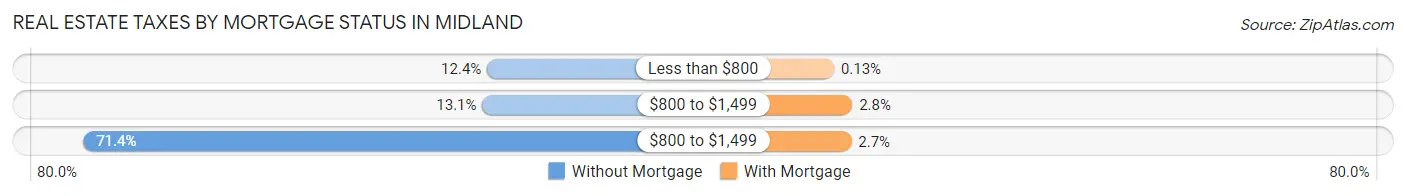
| Property Taxes | Without Mortgage | With Mortgage |
| Less than $800 | 1,822 (12.4%) | 23 (0.1%) |
| $800 to $1,499 | 1,925 (13.1%) | 509 (2.8%) |
| $800 to $1,499 | 10,488 (71.4%) | 486 (2.7%) |
| Total | 14,682 (100.0%) | 18,204 (100.0%) |
Health & Disability in Midland
Health Insurance Coverage by Age in Midland
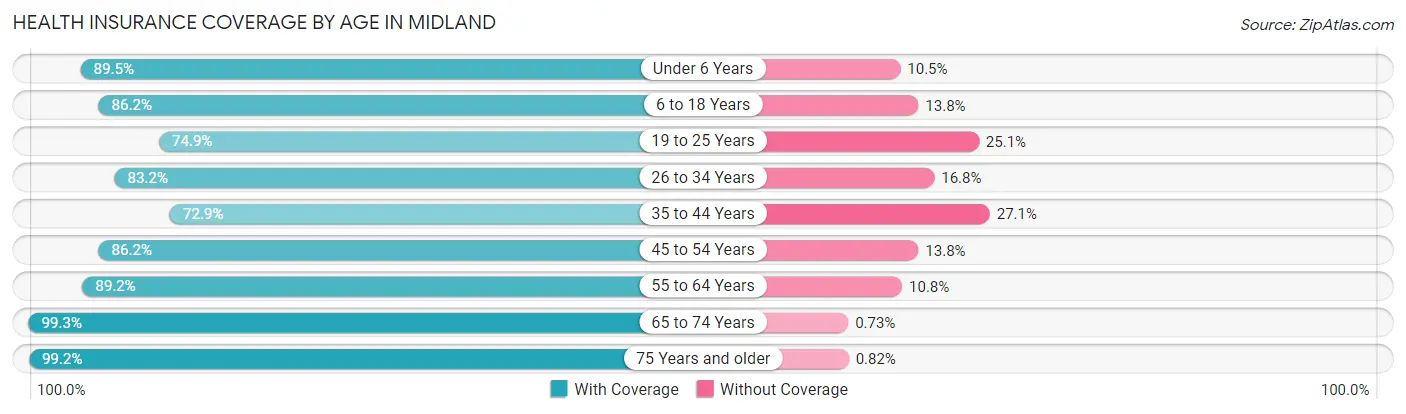
| Age Bracket | With Coverage | Without Coverage |
| Under 6 Years | 12,391 (89.5%) | 1,447 (10.5%) |
| 6 to 18 Years | 22,025 (86.2%) | 3,533 (13.8%) |
| 19 to 25 Years | 9,386 (74.9%) | 3,145 (25.1%) |
| 26 to 34 Years | 18,603 (83.2%) | 3,752 (16.8%) |
| 35 to 44 Years | 13,395 (72.9%) | 4,988 (27.1%) |
| 45 to 54 Years | 11,140 (86.2%) | 1,786 (13.8%) |
| 55 to 64 Years | 11,179 (89.2%) | 1,351 (10.8%) |
| 65 to 74 Years | 7,453 (99.3%) | 55 (0.7%) |
| 75 Years and older | 5,660 (99.2%) | 47 (0.8%) |
| Total | 111,232 (84.7%) | 20,104 (15.3%) |
Health Insurance Coverage by Citizenship Status in Midland
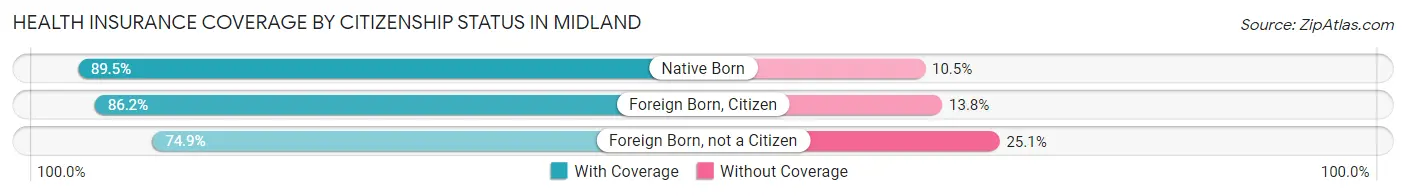
| Citizenship Status | With Coverage | Without Coverage |
| Native Born | 12,391 (89.5%) | 1,447 (10.5%) |
| Foreign Born, Citizen | 22,025 (86.2%) | 3,533 (13.8%) |
| Foreign Born, not a Citizen | 9,386 (74.9%) | 3,145 (25.1%) |
Health Insurance Coverage by Household Income in Midland
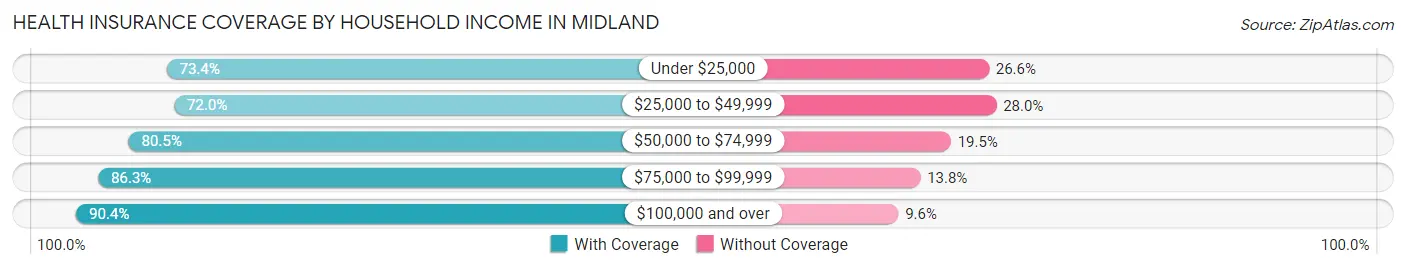
| Household Income | With Coverage | Without Coverage |
| Under $25,000 | 7,901 (73.4%) | 2,864 (26.6%) |
| $25,000 to $49,999 | 11,610 (72.0%) | 4,512 (28.0%) |
| $50,000 to $74,999 | 15,104 (80.5%) | 3,651 (19.5%) |
| $75,000 to $99,999 | 14,570 (86.3%) | 2,322 (13.8%) |
| $100,000 and over | 61,480 (90.4%) | 6,557 (9.6%) |
Public vs Private Health Insurance Coverage by Age in Midland
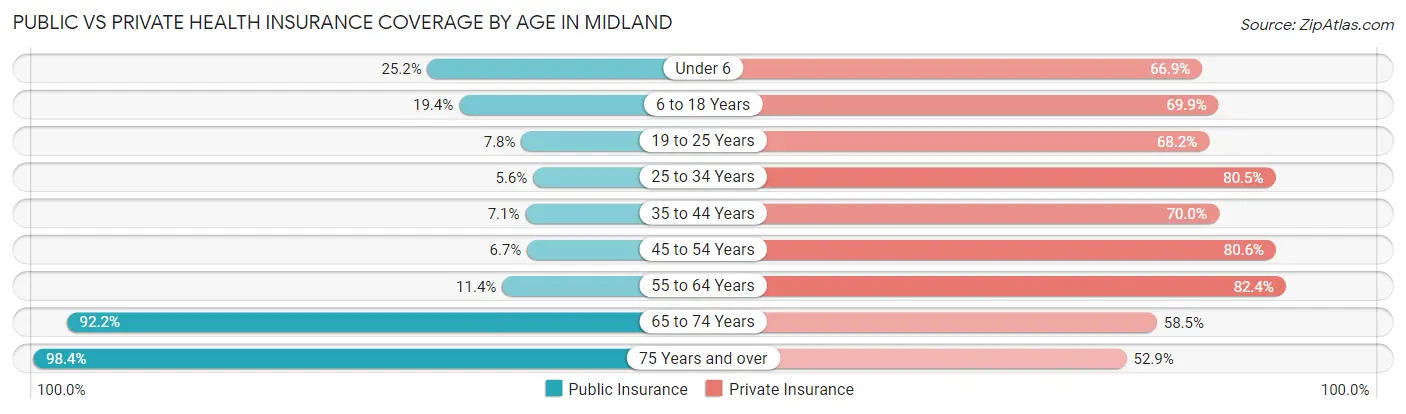
| Age Bracket | Public Insurance | Private Insurance |
| Under 6 | 3,487 (25.2%) | 9,256 (66.9%) |
| 6 to 18 Years | 4,949 (19.4%) | 17,874 (69.9%) |
| 19 to 25 Years | 976 (7.8%) | 8,544 (68.2%) |
| 25 to 34 Years | 1,254 (5.6%) | 17,986 (80.5%) |
| 35 to 44 Years | 1,297 (7.1%) | 12,861 (70.0%) |
| 45 to 54 Years | 870 (6.7%) | 10,414 (80.6%) |
| 55 to 64 Years | 1,423 (11.4%) | 10,323 (82.4%) |
| 65 to 74 Years | 6,922 (92.2%) | 4,390 (58.5%) |
| 75 Years and over | 5,616 (98.4%) | 3,017 (52.9%) |
| Total | 26,794 (20.4%) | 94,665 (72.1%) |
Disability Status by Sex by Age in Midland
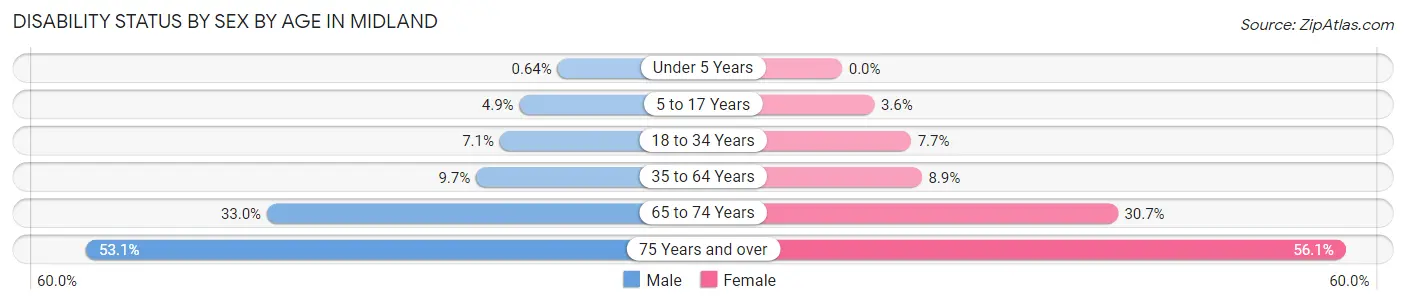
| Age Bracket | Male | Female |
| Under 5 Years | 39 (0.6%) | 0 (0.0%) |
| 5 to 17 Years | 656 (4.9%) | 456 (3.6%) |
| 18 to 34 Years | 1,329 (7.1%) | 1,365 (7.7%) |
| 35 to 64 Years | 2,289 (9.7%) | 1,800 (8.9%) |
| 65 to 74 Years | 1,131 (33.0%) | 1,253 (30.7%) |
| 75 Years and over | 1,336 (53.1%) | 1,791 (56.1%) |
Disability Class by Sex by Age in Midland
Disability Class: Hearing Difficulty
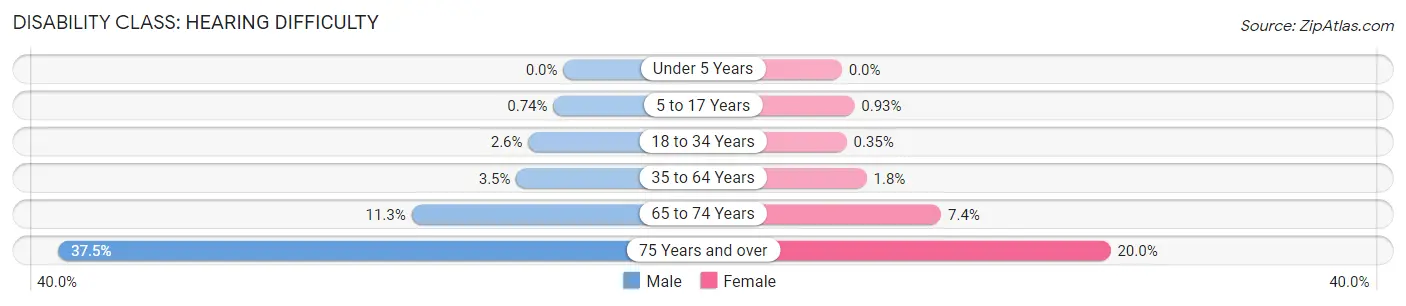
| Age Bracket | Male | Female |
| Under 5 Years | 0 (0.0%) | 0 (0.0%) |
| 5 to 17 Years | 99 (0.7%) | 118 (0.9%) |
| 18 to 34 Years | 489 (2.6%) | 62 (0.4%) |
| 35 to 64 Years | 823 (3.5%) | 374 (1.8%) |
| 65 to 74 Years | 386 (11.3%) | 301 (7.4%) |
| 75 Years and over | 943 (37.5%) | 637 (20.0%) |
Disability Class: Vision Difficulty
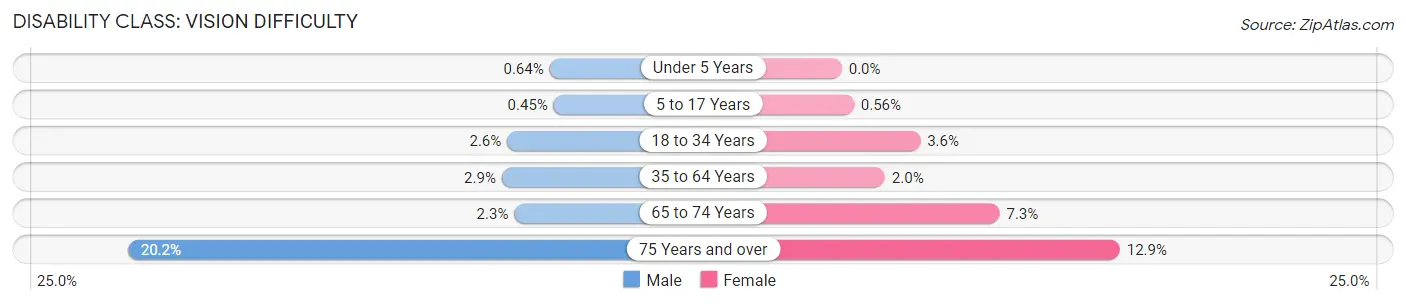
| Age Bracket | Male | Female |
| Under 5 Years | 39 (0.6%) | 0 (0.0%) |
| 5 to 17 Years | 60 (0.4%) | 71 (0.6%) |
| 18 to 34 Years | 491 (2.6%) | 646 (3.6%) |
| 35 to 64 Years | 674 (2.9%) | 405 (2.0%) |
| 65 to 74 Years | 78 (2.3%) | 299 (7.3%) |
| 75 Years and over | 508 (20.2%) | 412 (12.9%) |
Disability Class: Cognitive Difficulty
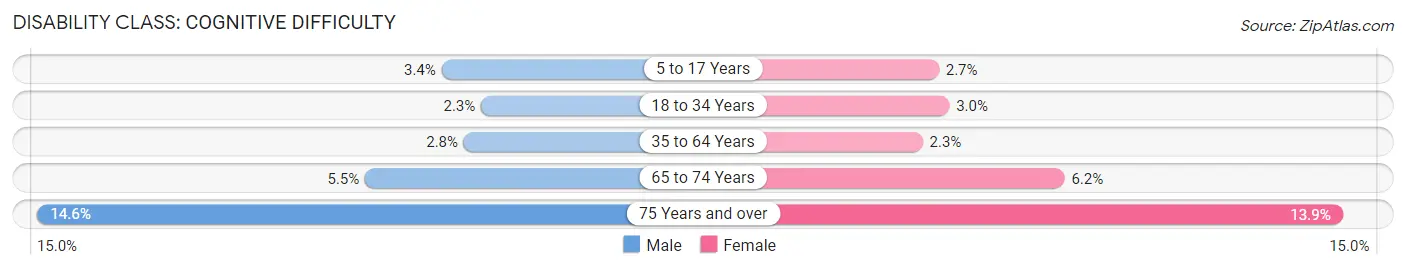
| Age Bracket | Male | Female |
| 5 to 17 Years | 454 (3.4%) | 344 (2.7%) |
| 18 to 34 Years | 431 (2.3%) | 532 (3.0%) |
| 35 to 64 Years | 652 (2.8%) | 456 (2.2%) |
| 65 to 74 Years | 189 (5.5%) | 253 (6.2%) |
| 75 Years and over | 368 (14.6%) | 445 (13.9%) |
Disability Class: Ambulatory Difficulty
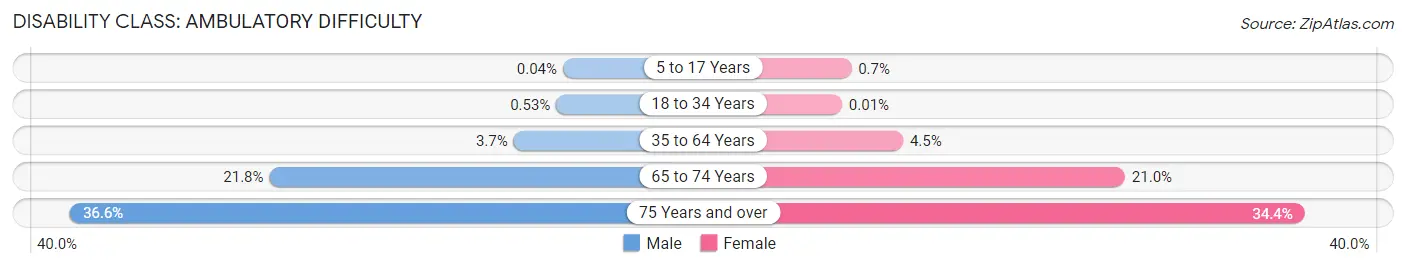
| Age Bracket | Male | Female |
| 5 to 17 Years | 6 (0.0%) | 89 (0.7%) |
| 18 to 34 Years | 100 (0.5%) | 2 (0.0%) |
| 35 to 64 Years | 872 (3.7%) | 921 (4.5%) |
| 65 to 74 Years | 748 (21.8%) | 858 (21.0%) |
| 75 Years and over | 921 (36.6%) | 1,097 (34.4%) |
Disability Class: Self-Care Difficulty
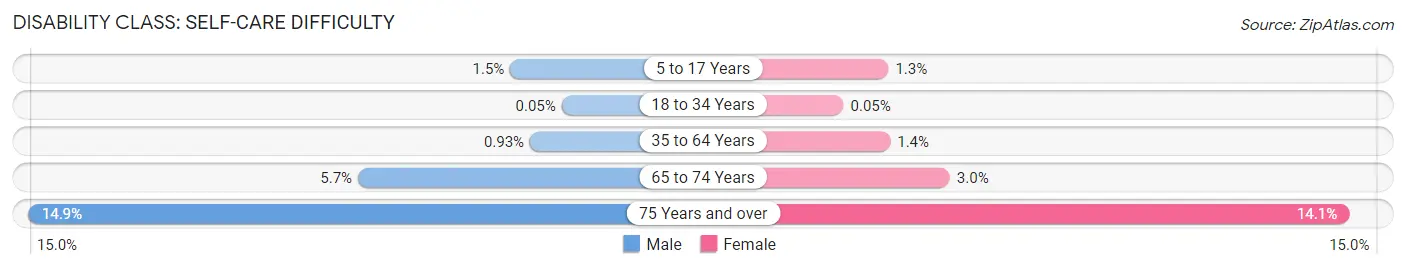
| Age Bracket | Male | Female |
| 5 to 17 Years | 198 (1.5%) | 165 (1.3%) |
| 18 to 34 Years | 10 (0.1%) | 8 (0.1%) |
| 35 to 64 Years | 218 (0.9%) | 274 (1.3%) |
| 65 to 74 Years | 196 (5.7%) | 123 (3.0%) |
| 75 Years and over | 374 (14.9%) | 451 (14.1%) |
Technology Access in Midland
Computing Device Access in Midland
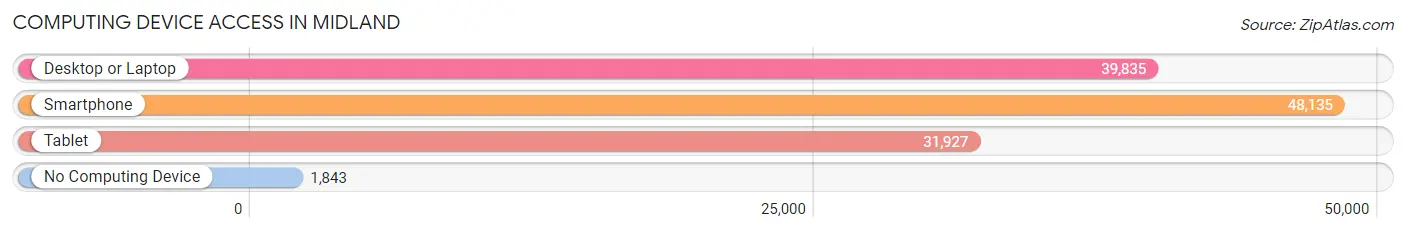
| Device Type | # Households | % Households |
| Desktop or Laptop | 39,835 | 77.4% |
| Smartphone | 48,135 | 93.5% |
| Tablet | 31,927 | 62.0% |
| No Computing Device | 1,843 | 3.6% |
| Total | 51,460 | 100.0% |
Internet Access in Midland
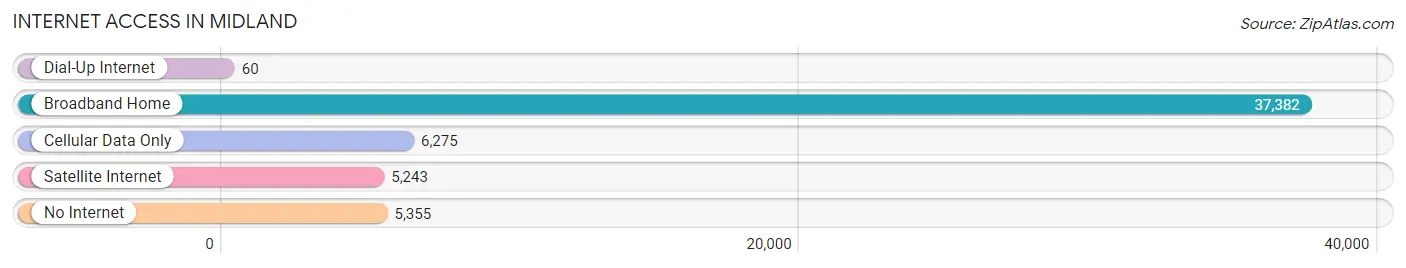
| Internet Type | # Households | % Households |
| Dial-Up Internet | 60 | 0.1% |
| Broadband Home | 37,382 | 72.6% |
| Cellular Data Only | 6,275 | 12.2% |
| Satellite Internet | 5,243 | 10.2% |
| No Internet | 5,355 | 10.4% |
| Total | 51,460 | 100.0% |
Midland Summary
Midland, Texas is a city located in the Permian Basin region of West Texas. It is the county seat of Midland County and is the principal city of the Midland, Texas Metropolitan Statistical Area. The city is situated in the Permian Basin, a large sedimentary basin in West Texas and southeastern New Mexico. Midland is located in the heart of the Permian Basin oil fields, and is the home of many major oil and gas companies.
History
Midland was founded in 1881 by John and Mary Kelsey, who were among the first settlers in the area. The city was named after Midland County, which was formed in 1885. The city was incorporated in 1906 and has grown steadily since then.
Midland was an important center for the oil and gas industry in the early 20th century. The city was the site of the first oil well in the Permian Basin, and the first commercial oil well in Texas. The city was also the site of the first oil refinery in Texas.
The city experienced a boom in the 1950s and 1960s due to the discovery of large oil reserves in the area. This led to an influx of people and businesses, and the city's population grew rapidly.
Geography
Midland is located in the Permian Basin region of West Texas. The city is situated on the southern edge of the Llano Estacado, a large plateau that stretches from the Texas Panhandle to the Rio Grande. The city is located at the intersection of Interstate 20 and US Highway 87.
The city has a total area of 71.2 square miles, of which 70.9 square miles is land and 0.3 square miles is water. The city is located at an elevation of 2,890 feet above sea level.
Economy
Midland is the economic center of the Permian Basin region. The city is home to many major oil and gas companies, including Chevron, ExxonMobil, and ConocoPhillips. The city is also home to many other businesses, including manufacturing, retail, and healthcare.
The city's economy is heavily dependent on the oil and gas industry. The city is home to many oil and gas related businesses, including drilling companies, oilfield services companies, and oilfield equipment manufacturers.
The city is also home to many other businesses, including manufacturing, retail, and healthcare. The city is home to many major employers, including Midland Memorial Hospital, Midland Independent School District, and Midland College.
Demographics
As of the 2010 census, the city had a population of 111,147. The racial makeup of the city was 75.3% White, 5.2% African American, 0.7% Native American, 1.2% Asian, 0.1% Pacific Islander, 15.3% from other races, and 2.2% from two or more races. Hispanic or Latino of any race were 37.2% of the population.
The median income for a household in the city was $45,945, and the median income for a family was $54,945. The per capita income for the city was $25,845. About 14.2% of families and 17.7% of the population were below the poverty line, including 25.2% of those under age 18 and 8.2% of those age 65 or over.
Common Questions
What is Per Capita Income in Midland?
Per Capita income in Midland is $47,870.
What is the Median Family Income in Midland?
Median Family Income in Midland is $109,030.
What is the Median Household income in Midland?
Median Household Income in Midland is $90,448.
What is Income or Wage Gap in Midland?
Income or Wage Gap in Midland is 43.1%.
Women in Midland earn 56.9 cents for every dollar earned by a man.
What is Family Income Deficit in Midland?
Family Income Deficit in Midland is $9,732.
Families that are below poverty line in Midland earn $9,732 less on average than the poverty threshold level.
What is Inequality or Gini Index in Midland?
Inequality or Gini Index in Midland is 0.47.
What is the Total Population of Midland?
Total Population of Midland is 132,490.
What is the Total Male Population of Midland?
Total Male Population of Midland is 68,593.
What is the Total Female Population of Midland?
Total Female Population of Midland is 63,897.
What is the Ratio of Males per 100 Females in Midland?
There are 107.35 Males per 100 Females in Midland.
What is the Ratio of Females per 100 Males in Midland?
There are 93.15 Females per 100 Males in Midland.
What is the Median Population Age in Midland?
Median Population Age in Midland is 31.4 Years.
What is the Average Family Size in Midland
Average Family Size in Midland is 3.2 People.
What is the Average Household Size in Midland
Average Household Size in Midland is 2.5 People.
How Large is the Labor Force in Midland?
There are 70,021 People in the Labor Forcein in Midland.
What is the Percentage of People in the Labor Force in Midland?
71.5% of People are in the Labor Force in Midland.
What is the Unemployment Rate in Midland?
Unemployment Rate in Midland is 3.2%.