Cities with the Largest Lebanese Community in Minnesota
RELATED REPORTS & OPTIONS
Lebanese
Minnesota
Compare Cities
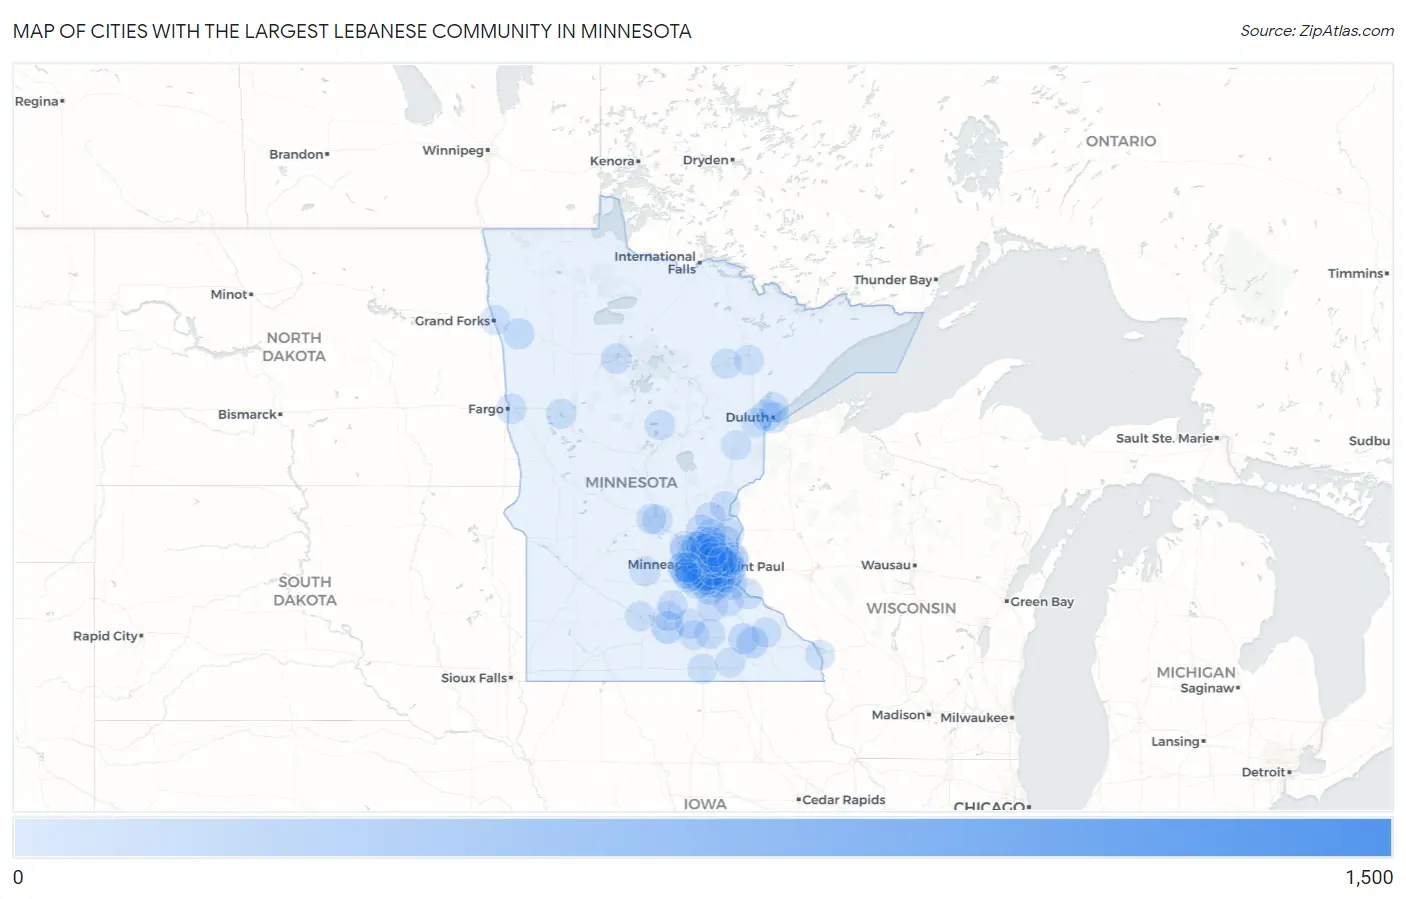
Map of Cities with the Largest Lebanese Community in Minnesota
0
1,500
Cities with the Largest Lebanese Community in Minnesota
| City | Lebanese | vs State | vs National | |
| 1. | Minneapolis | 1,448 | 8,040(18.01%)#1 | 546,795(0.26%)#23 |
| 2. | Woodbury | 437 | 8,040(5.44%)#2 | 546,795(0.08%)#138 |
| 3. | Maple Grove | 347 | 8,040(4.32%)#3 | 546,795(0.06%)#196 |
| 4. | Blaine | 302 | 8,040(3.76%)#4 | 546,795(0.06%)#238 |
| 5. | St Paul | 299 | 8,040(3.72%)#5 | 546,795(0.05%)#242 |
| 6. | Plymouth | 209 | 8,040(2.60%)#6 | 546,795(0.04%)#380 |
| 7. | Eagan | 202 | 8,040(2.51%)#7 | 546,795(0.04%)#392 |
| 8. | Mankato | 179 | 8,040(2.23%)#8 | 546,795(0.03%)#453 |
| 9. | West St Paul | 142 | 8,040(1.77%)#9 | 546,795(0.03%)#598 |
| 10. | Lakeville | 139 | 8,040(1.73%)#10 | 546,795(0.03%)#614 |
| 11. | Mound | 137 | 8,040(1.70%)#11 | 546,795(0.03%)#631 |
| 12. | Inver Grove Heights | 128 | 8,040(1.59%)#12 | 546,795(0.02%)#668 |
| 13. | Rochester | 123 | 8,040(1.53%)#13 | 546,795(0.02%)#696 |
| 14. | Hastings | 123 | 8,040(1.53%)#14 | 546,795(0.02%)#698 |
| 15. | Minnetonka | 120 | 8,040(1.49%)#15 | 546,795(0.02%)#714 |
| 16. | Rosemount | 119 | 8,040(1.48%)#16 | 546,795(0.02%)#724 |
| 17. | St Louis Park | 106 | 8,040(1.32%)#17 | 546,795(0.02%)#808 |
| 18. | Edina | 102 | 8,040(1.27%)#18 | 546,795(0.02%)#835 |
| 19. | South St Paul | 95 | 8,040(1.18%)#19 | 546,795(0.02%)#903 |
| 20. | Hermantown | 95 | 8,040(1.18%)#20 | 546,795(0.02%)#907 |
| 21. | Byron | 93 | 8,040(1.16%)#21 | 546,795(0.02%)#932 |
| 22. | Eden Prairie | 91 | 8,040(1.13%)#22 | 546,795(0.02%)#944 |
| 23. | Duluth | 87 | 8,040(1.08%)#23 | 546,795(0.02%)#986 |
| 24. | Savage | 87 | 8,040(1.08%)#24 | 546,795(0.02%)#994 |
| 25. | St Anthony City Hennepin And Ramsey Counties | 80 | 8,040(1.00%)#25 | 546,795(0.01%)#1,077 |
| 26. | Lino Lakes | 76 | 8,040(0.95%)#26 | 546,795(0.01%)#1,116 |
| 27. | Crookston | 74 | 8,040(0.92%)#27 | 546,795(0.01%)#1,144 |
| 28. | Maplewood | 68 | 8,040(0.85%)#28 | 546,795(0.01%)#1,217 |
| 29. | Fridley | 68 | 8,040(0.85%)#29 | 546,795(0.01%)#1,222 |
| 30. | Forest Lake | 67 | 8,040(0.83%)#30 | 546,795(0.01%)#1,234 |
| 31. | Cottage Grove | 65 | 8,040(0.81%)#31 | 546,795(0.01%)#1,265 |
| 32. | Red Wing | 64 | 8,040(0.80%)#32 | 546,795(0.01%)#1,294 |
| 33. | St Michael | 57 | 8,040(0.71%)#33 | 546,795(0.01%)#1,403 |
| 34. | Roseville | 55 | 8,040(0.68%)#34 | 546,795(0.01%)#1,442 |
| 35. | Stillwater | 54 | 8,040(0.67%)#35 | 546,795(0.01%)#1,466 |
| 36. | St Francis | 51 | 8,040(0.63%)#36 | 546,795(0.01%)#1,535 |
| 37. | Brooklyn Park | 48 | 8,040(0.60%)#37 | 546,795(0.01%)#1,585 |
| 38. | Brooklyn Center | 48 | 8,040(0.60%)#38 | 546,795(0.01%)#1,587 |
| 39. | Bloomington | 45 | 8,040(0.56%)#39 | 546,795(0.01%)#1,677 |
| 40. | Golden Valley | 45 | 8,040(0.56%)#40 | 546,795(0.01%)#1,689 |
| 41. | White Bear Lake | 44 | 8,040(0.55%)#41 | 546,795(0.01%)#1,721 |
| 42. | Cambridge | 44 | 8,040(0.55%)#42 | 546,795(0.01%)#1,739 |
| 43. | Apple Valley | 43 | 8,040(0.53%)#43 | 546,795(0.01%)#1,754 |
| 44. | Chanhassen | 38 | 8,040(0.47%)#44 | 546,795(0.01%)#1,898 |
| 45. | Northfield | 37 | 8,040(0.46%)#45 | 546,795(0.01%)#1,933 |
| 46. | Bemidji | 36 | 8,040(0.45%)#46 | 546,795(0.01%)#1,973 |
| 47. | Robbinsdale | 36 | 8,040(0.45%)#47 | 546,795(0.01%)#1,975 |
| 48. | St Cloud | 35 | 8,040(0.44%)#48 | 546,795(0.01%)#1,994 |
| 49. | Crosslake | 34 | 8,040(0.42%)#49 | 546,795(0.01%)#2,057 |
| 50. | East Bethel | 33 | 8,040(0.41%)#50 | 546,795(0.01%)#2,084 |
| 51. | Oakdale | 32 | 8,040(0.40%)#51 | 546,795(0.01%)#2,114 |
| 52. | Minnetrista | 30 | 8,040(0.37%)#52 | 546,795(0.01%)#2,197 |
| 53. | Burnsville | 29 | 8,040(0.36%)#53 | 546,795(0.01%)#2,218 |
| 54. | Owatonna | 29 | 8,040(0.36%)#54 | 546,795(0.01%)#2,227 |
| 55. | Champlin | 29 | 8,040(0.36%)#55 | 546,795(0.01%)#2,231 |
| 56. | Columbia Heights | 28 | 8,040(0.35%)#56 | 546,795(0.01%)#2,267 |
| 57. | Shorewood | 28 | 8,040(0.35%)#57 | 546,795(0.01%)#2,284 |
| 58. | Chisago City | 28 | 8,040(0.35%)#58 | 546,795(0.01%)#2,289 |
| 59. | Moorhead | 26 | 8,040(0.32%)#59 | 546,795(0.00%)#2,355 |
| 60. | Mounds View | 26 | 8,040(0.32%)#60 | 546,795(0.00%)#2,379 |
| 61. | New Hope | 24 | 8,040(0.30%)#61 | 546,795(0.00%)#2,468 |
| 62. | Anoka | 24 | 8,040(0.30%)#62 | 546,795(0.00%)#2,469 |
| 63. | Lake Elmo | 23 | 8,040(0.29%)#63 | 546,795(0.00%)#2,549 |
| 64. | Rush City | 23 | 8,040(0.29%)#64 | 546,795(0.00%)#2,570 |
| 65. | Detroit Lakes | 20 | 8,040(0.25%)#65 | 546,795(0.00%)#2,737 |
| 66. | Waite Park | 20 | 8,040(0.25%)#66 | 546,795(0.00%)#2,746 |
| 67. | Prior Lake | 19 | 8,040(0.24%)#67 | 546,795(0.00%)#2,797 |
| 68. | Hibbing | 19 | 8,040(0.24%)#68 | 546,795(0.00%)#2,805 |
| 69. | Hutchinson | 19 | 8,040(0.24%)#69 | 546,795(0.00%)#2,806 |
| 70. | St Peter | 18 | 8,040(0.22%)#70 | 546,795(0.00%)#2,874 |
| 71. | Mendota Heights | 18 | 8,040(0.22%)#71 | 546,795(0.00%)#2,877 |
| 72. | Waterville | 18 | 8,040(0.22%)#72 | 546,795(0.00%)#2,922 |
| 73. | Waseca | 16 | 8,040(0.20%)#73 | 546,795(0.00%)#3,049 |
| 74. | Chaska | 14 | 8,040(0.17%)#74 | 546,795(0.00%)#3,198 |
| 75. | Andover | 13 | 8,040(0.16%)#75 | 546,795(0.00%)#3,284 |
| 76. | Rice Lake | 13 | 8,040(0.16%)#76 | 546,795(0.00%)#3,341 |
| 77. | Eveleth | 13 | 8,040(0.16%)#77 | 546,795(0.00%)#3,343 |
| 78. | Albert Lea | 12 | 8,040(0.15%)#78 | 546,795(0.00%)#3,398 |
| 79. | New Ulm | 12 | 8,040(0.15%)#79 | 546,795(0.00%)#3,409 |
| 80. | Vadnais Heights | 11 | 8,040(0.14%)#80 | 546,795(0.00%)#3,525 |
| 81. | Victoria | 11 | 8,040(0.14%)#81 | 546,795(0.00%)#3,531 |
| 82. | Dayton | 11 | 8,040(0.14%)#82 | 546,795(0.00%)#3,540 |
| 83. | Coon Rapids | 10 | 8,040(0.12%)#83 | 546,795(0.00%)#3,604 |
| 84. | La Crescent | 10 | 8,040(0.12%)#84 | 546,795(0.00%)#3,691 |
| 85. | Scanlon | 10 | 8,040(0.12%)#85 | 546,795(0.00%)#3,739 |
| 86. | Falcon Heights | 9 | 8,040(0.11%)#86 | 546,795(0.00%)#3,819 |
| 87. | Oak Park Heights | 9 | 8,040(0.11%)#87 | 546,795(0.00%)#3,823 |
| 88. | Cannon Falls | 9 | 8,040(0.11%)#88 | 546,795(0.00%)#3,828 |
| 89. | Le Sueur | 9 | 8,040(0.11%)#89 | 546,795(0.00%)#3,829 |
| 90. | Hanover | 9 | 8,040(0.11%)#90 | 546,795(0.00%)#3,836 |
| 91. | Moose Lake | 9 | 8,040(0.11%)#91 | 546,795(0.00%)#3,839 |
| 92. | Lexington | 9 | 8,040(0.11%)#92 | 546,795(0.00%)#3,855 |
| 93. | Elgin | 9 | 8,040(0.11%)#93 | 546,795(0.00%)#3,880 |
| 94. | New Brighton | 8 | 8,040(0.10%)#94 | 546,795(0.00%)#3,905 |
| 95. | Ham Lake | 8 | 8,040(0.10%)#95 | 546,795(0.00%)#3,915 |
| 96. | Credit River | 8 | 8,040(0.10%)#96 | 546,795(0.00%)#3,969 |
| 97. | East Grand Forks | 7 | 8,040(0.09%)#97 | 546,795(0.00%)#4,098 |
| 98. | Spring Park | 7 | 8,040(0.09%)#98 | 546,795(0.00%)#4,160 |
| 99. | Brownsdale | 7 | 8,040(0.09%)#99 | 546,795(0.00%)#4,191 |
| 100. | North St Paul | 6 | 8,040(0.07%)#100 | 546,795(0.00%)#4,230 |
Common Questions
What are the Top 10 Cities with the Largest Lebanese Community in Minnesota?
Top 10 Cities with the Largest Lebanese Community in Minnesota are:
#1
1,448
#2
437
#3
347
#4
302
#5
299
#6
209
#7
202
#8
179
#9
142
#10
139
What city has the Largest Lebanese Community in Minnesota?
Minneapolis has the Largest Lebanese Community in Minnesota with 1,448.
What is the Total Lebanese Population in the State of Minnesota?
Total Lebanese Population in Minnesota is 8,040.
What is the Total Lebanese Population in the United States?
Total Lebanese Population in the United States is 546,795.