El Paso, TX Map & Demographics
El Paso Map
El Paso Overview
$27,434
PER CAPITA INCOME
$63,067
AVG FAMILY INCOME
$55,710
AVG HOUSEHOLD INCOME
26.5%
WAGE / INCOME GAP [ % ]
73.5¢/ $1
WAGE / INCOME GAP [ $ ]
$11,031
FAMILY INCOME DEFICIT
0.47
INEQUALITY / GINI INDEX
677,181
TOTAL POPULATION
333,662
MALE POPULATION
343,519
FEMALE POPULATION
97.13
MALES / 100 FEMALES
102.95
FEMALES / 100 MALES
33.7
MEDIAN AGE
3.4
AVG FAMILY SIZE
2.8
AVG HOUSEHOLD SIZE
328,693
LABOR FORCE [ PEOPLE ]
62.7%
PERCENT IN LABOR FORCE
6.8%
UNEMPLOYMENT RATE
El Paso Zip Codes
El Paso Area Codes
Income in El Paso
Income Overview in El Paso
Per Capita Income in El Paso is $27,434, while median incomes of families and households are $63,067 and $55,710 respectively.
| Characteristic | Number | Measure |
| Per Capita Income | 677,181 | $27,434 |
| Median Family Income | 166,726 | $63,067 |
| Mean Family Income | 166,726 | $84,323 |
| Median Household Income | 239,624 | $55,710 |
| Mean Household Income | 239,624 | $75,349 |
| Income Deficit | 166,726 | $11,031 |
| Wage / Income Gap (%) | 677,181 | 26.49% |
| Wage / Income Gap ($) | 677,181 | 73.51¢ per $1 |
| Gini / Inequality Index | 677,181 | 0.47 |
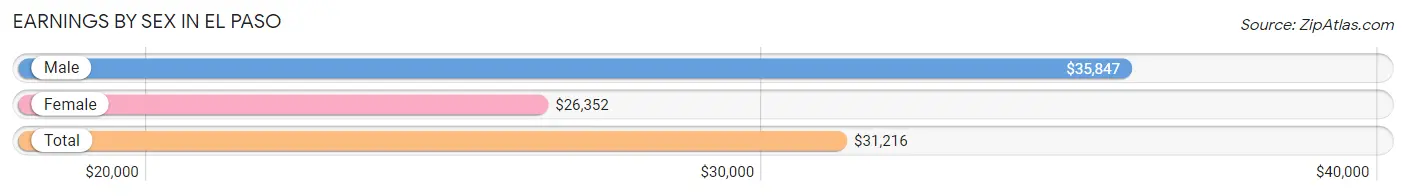
Earnings by Sex in El Paso
Average Earnings in El Paso are $31,216, $35,847 for men and $26,352 for women, a difference of 26.5%.
| Sex | Number | Average Earnings |
| Male | 184,390 (54.9%) | $35,847 |
| Female | 151,286 (45.1%) | $26,352 |
| Total | 335,676 (100.0%) | $31,216 |
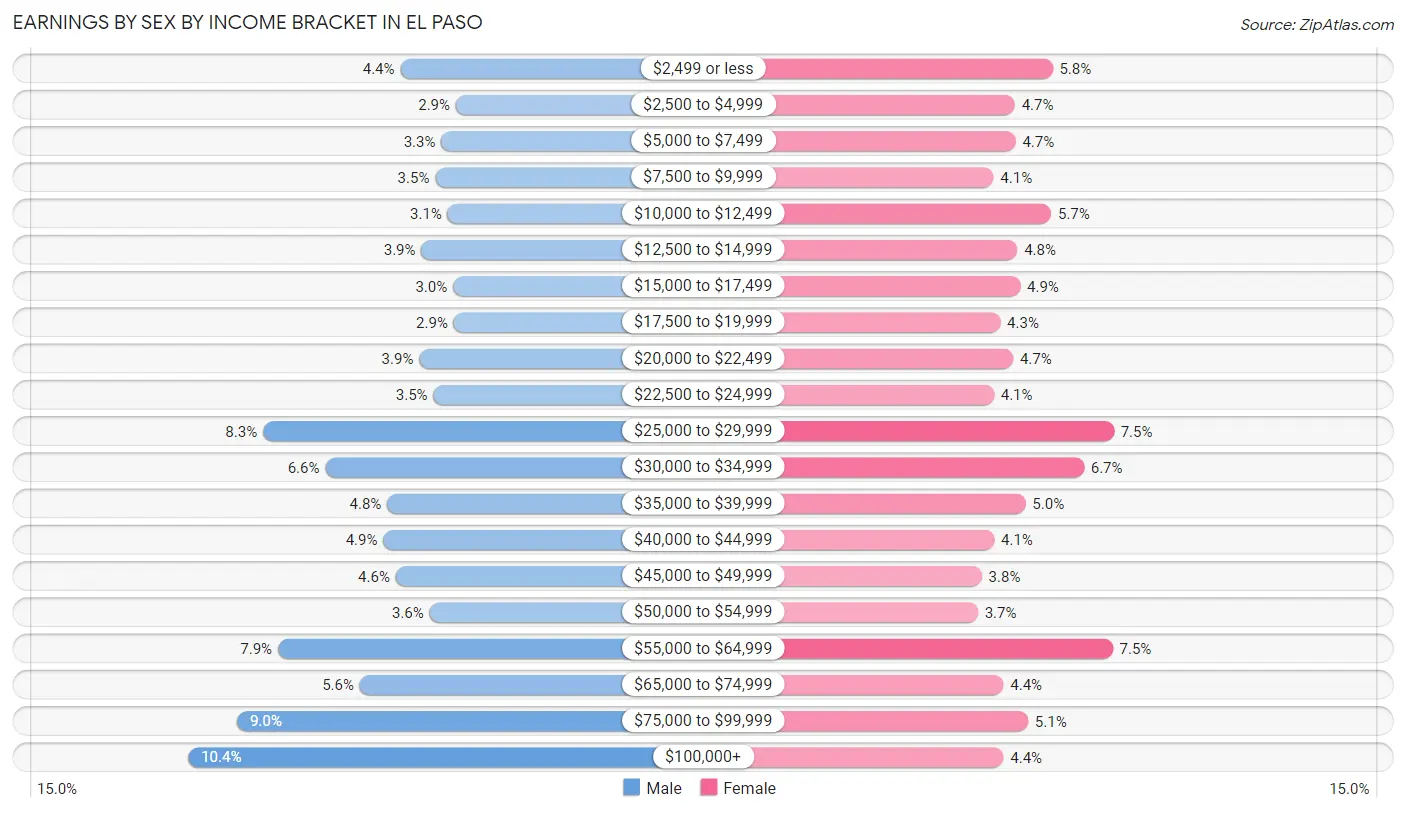
Earnings by Sex by Income Bracket in El Paso
The most common earnings brackets in El Paso are $100,000+ for men (19,168 | 10.4%) and $25,000 to $29,999 for women (11,344 | 7.5%).
| Income | Male | Female |
| $2,499 or less | 8,178 (4.4%) | 8,745 (5.8%) |
| $2,500 to $4,999 | 5,318 (2.9%) | 7,136 (4.7%) |
| $5,000 to $7,499 | 6,068 (3.3%) | 7,175 (4.7%) |
| $7,500 to $9,999 | 6,382 (3.5%) | 6,226 (4.1%) |
| $10,000 to $12,499 | 5,727 (3.1%) | 8,683 (5.7%) |
| $12,500 to $14,999 | 7,107 (3.8%) | 7,253 (4.8%) |
| $15,000 to $17,499 | 5,450 (3.0%) | 7,370 (4.9%) |
| $17,500 to $19,999 | 5,418 (2.9%) | 6,521 (4.3%) |
| $20,000 to $22,499 | 7,212 (3.9%) | 7,063 (4.7%) |
| $22,500 to $24,999 | 6,476 (3.5%) | 6,241 (4.1%) |
| $25,000 to $29,999 | 15,296 (8.3%) | 11,344 (7.5%) |
| $30,000 to $34,999 | 12,079 (6.6%) | 10,070 (6.7%) |
| $35,000 to $39,999 | 8,868 (4.8%) | 7,590 (5.0%) |
| $40,000 to $44,999 | 9,076 (4.9%) | 6,261 (4.1%) |
| $45,000 to $49,999 | 8,424 (4.6%) | 5,734 (3.8%) |
| $50,000 to $54,999 | 6,670 (3.6%) | 5,564 (3.7%) |
| $55,000 to $64,999 | 14,534 (7.9%) | 11,300 (7.5%) |
| $65,000 to $74,999 | 10,283 (5.6%) | 6,657 (4.4%) |
| $75,000 to $99,999 | 16,656 (9.0%) | 7,701 (5.1%) |
| $100,000+ | 19,168 (10.4%) | 6,652 (4.4%) |
| Total | 184,390 (100.0%) | 151,286 (100.0%) |
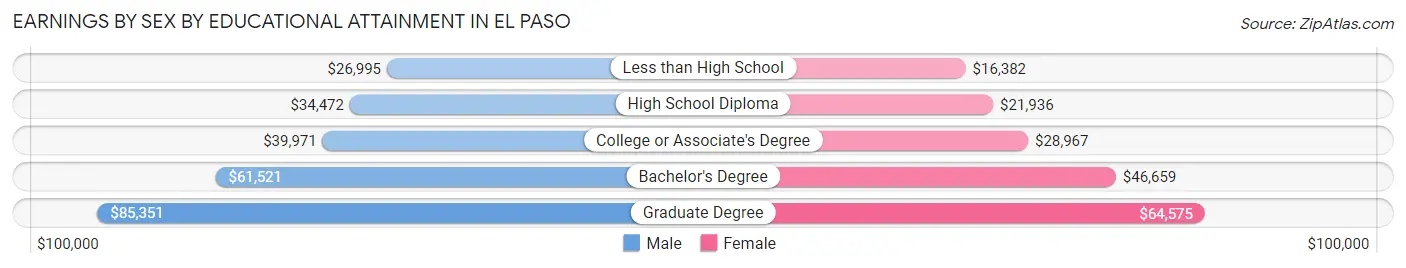
Earnings by Sex by Educational Attainment in El Paso
Average earnings in El Paso are $42,823 for men and $30,948 for women, a difference of 27.7%. Men with an educational attainment of graduate degree enjoy the highest average annual earnings of $85,351, while those with less than high school education earn the least with $26,995. Women with an educational attainment of graduate degree earn the most with the average annual earnings of $64,575, while those with less than high school education have the smallest earnings of $16,382.
| Educational Attainment | Male Income | Female Income |
| Less than High School | $26,995 | $16,382 |
| High School Diploma | $34,472 | $21,936 |
| College or Associate's Degree | $39,971 | $28,967 |
| Bachelor's Degree | $61,521 | $46,659 |
| Graduate Degree | $85,351 | $64,575 |
| Total | $42,823 | $30,948 |
Family Income in El Paso
Family Income Brackets in El Paso
According to the El Paso family income data, there are 31,511 families falling into the $50,000 to $74,999 income range, which is the most common income bracket and makes up 18.9% of all families. Conversely, the $10,000 to $14,999 income bracket is the least frequent group with only 5,835 families (3.5%) belonging to this category.
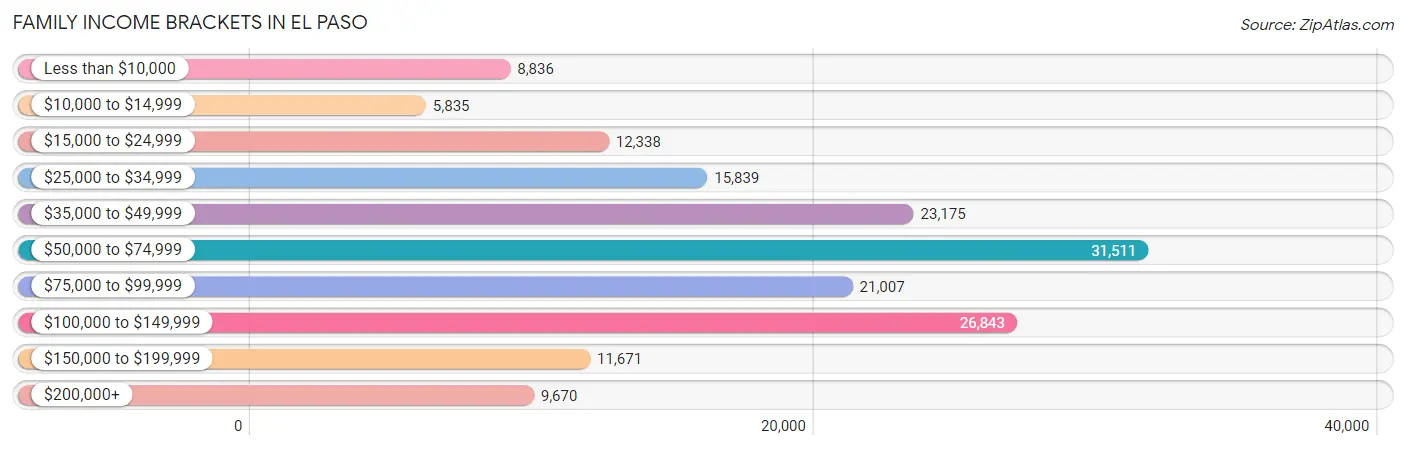
| Income Bracket | # Families | % Families |
| Less than $10,000 | 8,836 | 5.3% |
| $10,000 to $14,999 | 5,835 | 3.5% |
| $15,000 to $24,999 | 12,338 | 7.4% |
| $25,000 to $34,999 | 15,839 | 9.5% |
| $35,000 to $49,999 | 23,175 | 13.9% |
| $50,000 to $74,999 | 31,511 | 18.9% |
| $75,000 to $99,999 | 21,007 | 12.6% |
| $100,000 to $149,999 | 26,843 | 16.1% |
| $150,000 to $199,999 | 11,671 | 7.0% |
| $200,000+ | 9,670 | 5.8% |
Family Income by Famaliy Size in El Paso
7+ person families (2,976 | 1.8%) account for the highest median family income in El Paso with $101,512 per family, while 2-person families (62,865 | 37.7%) have the highest median income of $27,399 per family member.
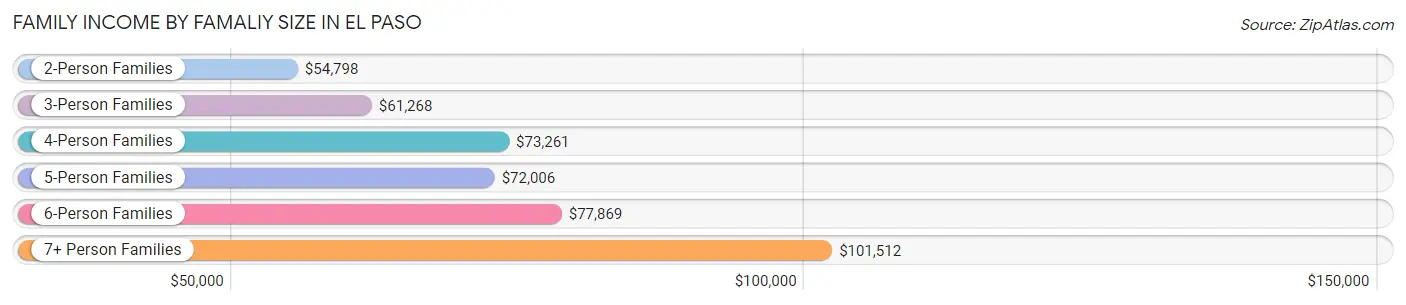
| Income Bracket | # Families | Median Income |
| 2-Person Families | 62,865 (37.7%) | $54,798 |
| 3-Person Families | 42,432 (25.5%) | $61,268 |
| 4-Person Families | 34,577 (20.7%) | $73,261 |
| 5-Person Families | 17,288 (10.4%) | $72,006 |
| 6-Person Families | 6,588 (4.0%) | $77,869 |
| 7+ Person Families | 2,976 (1.8%) | $101,512 |
| Total | 166,726 (100.0%) | $63,067 |
Family Income by Number of Earners in El Paso
The median family income in El Paso is $63,067, with families comprising 3+ earners (20,625) having the highest median family income of $112,460, while families with no earners (21,010) have the lowest median family income of $26,204, accounting for 12.4% and 12.6% of families, respectively.
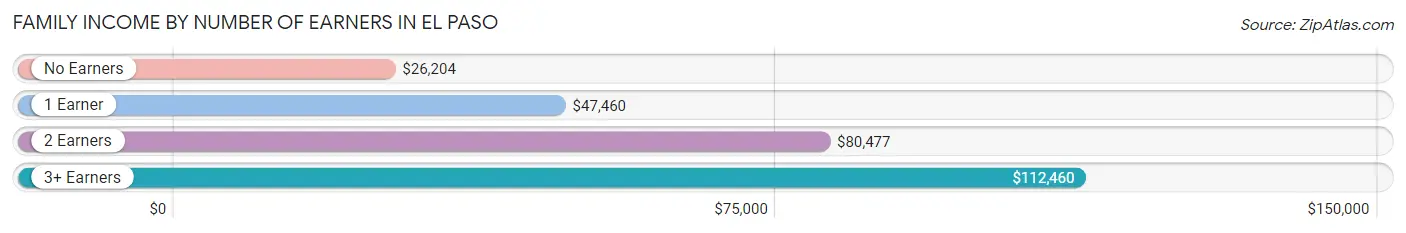
| Number of Earners | # Families | Median Income |
| No Earners | 21,010 (12.6%) | $26,204 |
| 1 Earner | 64,044 (38.4%) | $47,460 |
| 2 Earners | 61,047 (36.6%) | $80,477 |
| 3+ Earners | 20,625 (12.4%) | $112,460 |
| Total | 166,726 (100.0%) | $63,067 |
Household Income in El Paso
Household Income Brackets in El Paso
With 43,851 households falling in the category, the $50,000 to $74,999 income range is the most frequent in El Paso, accounting for 18.3% of all households. In contrast, only 11,502 households (4.8%) fall into the $200,000+ income bracket, making it the least populous group.
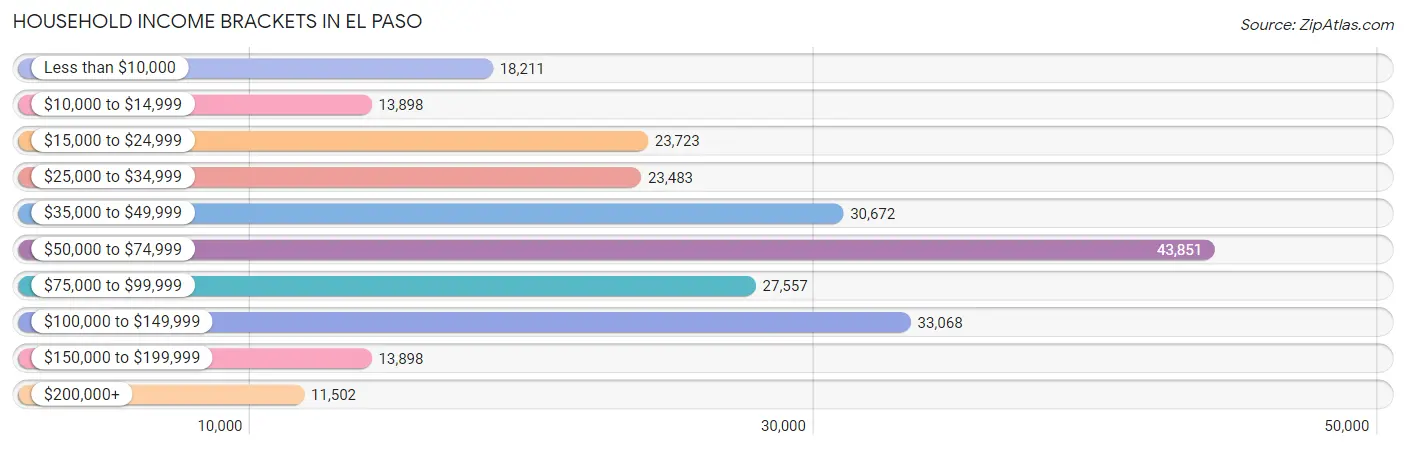
| Income Bracket | # Households | % Households |
| Less than $10,000 | 18,211 | 7.6% |
| $10,000 to $14,999 | 13,898 | 5.8% |
| $15,000 to $24,999 | 23,723 | 9.9% |
| $25,000 to $34,999 | 23,483 | 9.8% |
| $35,000 to $49,999 | 30,672 | 12.8% |
| $50,000 to $74,999 | 43,851 | 18.3% |
| $75,000 to $99,999 | 27,557 | 11.5% |
| $100,000 to $149,999 | 33,068 | 13.8% |
| $150,000 to $199,999 | 13,898 | 5.8% |
| $200,000+ | 11,502 | 4.8% |
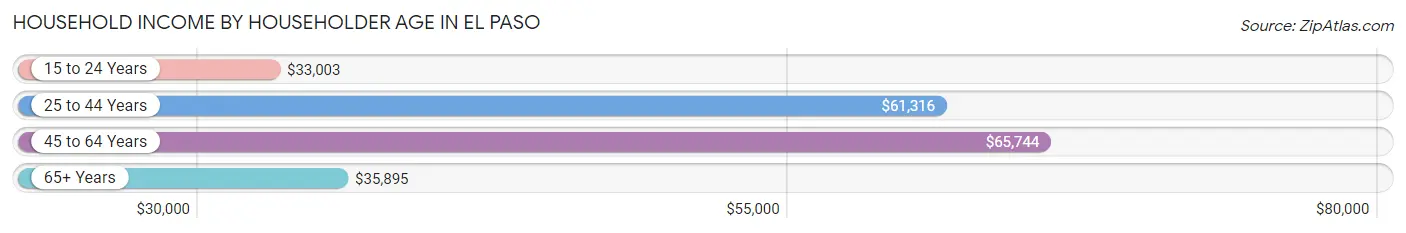
Household Income by Householder Age in El Paso
The median household income in El Paso is $55,710, with the highest median household income of $65,744 found in the 45 to 64 years age bracket for the primary householder. A total of 84,905 households (35.4%) fall into this category. Meanwhile, the 15 to 24 years age bracket for the primary householder has the lowest median household income of $33,003, with 11,153 households (4.6%) in this group.
| Income Bracket | # Households | Median Income |
| 15 to 24 Years | 11,153 (4.6%) | $33,003 |
| 25 to 44 Years | 87,433 (36.5%) | $61,316 |
| 45 to 64 Years | 84,905 (35.4%) | $65,744 |
| 65+ Years | 56,133 (23.4%) | $35,895 |
| Total | 239,624 (100.0%) | $55,710 |
Poverty in El Paso
Income Below Poverty by Sex and Age in El Paso
With 16.8% poverty level for males and 21.0% for females among the residents of El Paso, 6 to 11 year old males and under 5 year old females are the most vulnerable to poverty, with 8,480 males (29.4%) and 6,618 females (29.9%) in their respective age groups living below the poverty level.
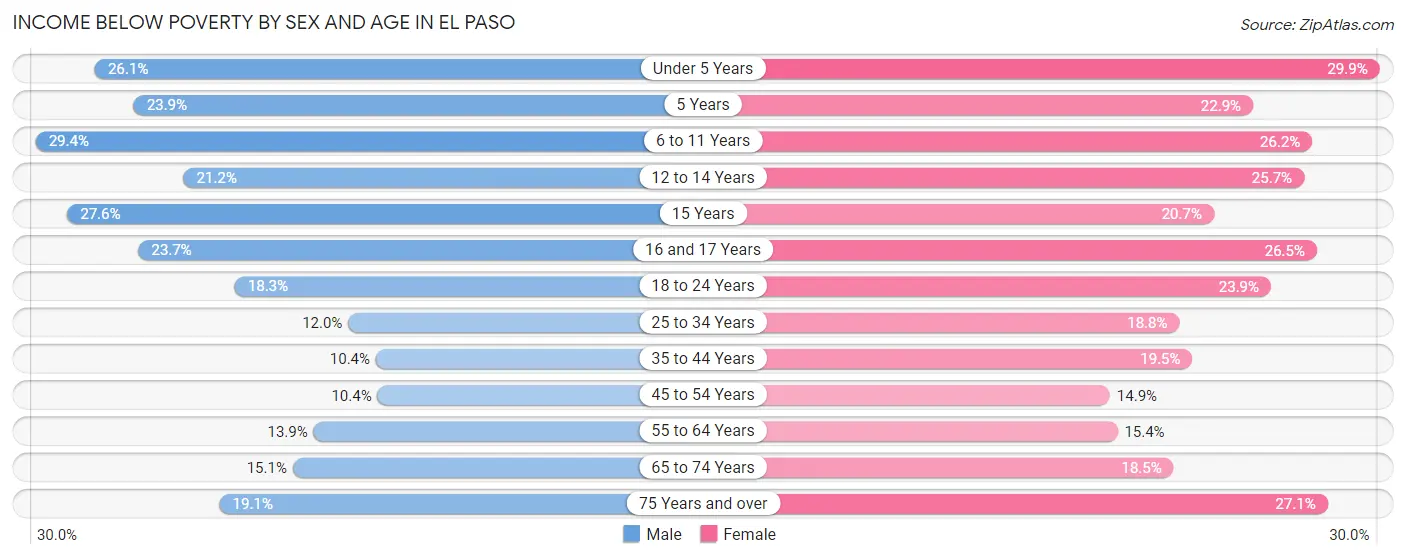
| Age Bracket | Male | Female |
| Under 5 Years | 5,923 (26.1%) | 6,618 (29.9%) |
| 5 Years | 1,125 (23.9%) | 954 (22.9%) |
| 6 to 11 Years | 8,480 (29.4%) | 7,274 (26.2%) |
| 12 to 14 Years | 3,315 (21.1%) | 3,833 (25.7%) |
| 15 Years | 1,490 (27.6%) | 1,029 (20.7%) |
| 16 and 17 Years | 2,316 (23.7%) | 2,502 (26.5%) |
| 18 to 24 Years | 7,086 (18.3%) | 8,789 (23.9%) |
| 25 to 34 Years | 6,405 (12.0%) | 9,069 (18.8%) |
| 35 to 44 Years | 4,397 (10.4%) | 8,048 (19.5%) |
| 45 to 54 Years | 3,816 (10.3%) | 6,042 (14.9%) |
| 55 to 64 Years | 4,709 (13.9%) | 5,934 (15.3%) |
| 65 to 74 Years | 3,393 (15.1%) | 5,370 (18.5%) |
| 75 Years and over | 2,860 (19.1%) | 6,273 (27.1%) |
| Total | 55,315 (16.8%) | 71,735 (21.0%) |
Income Above Poverty by Sex and Age in El Paso
According to the poverty statistics in El Paso, males aged 45 to 54 years and females aged 45 to 54 years are the age groups that are most secure financially, with 89.6% of males and 85.1% of females in these age groups living above the poverty line.
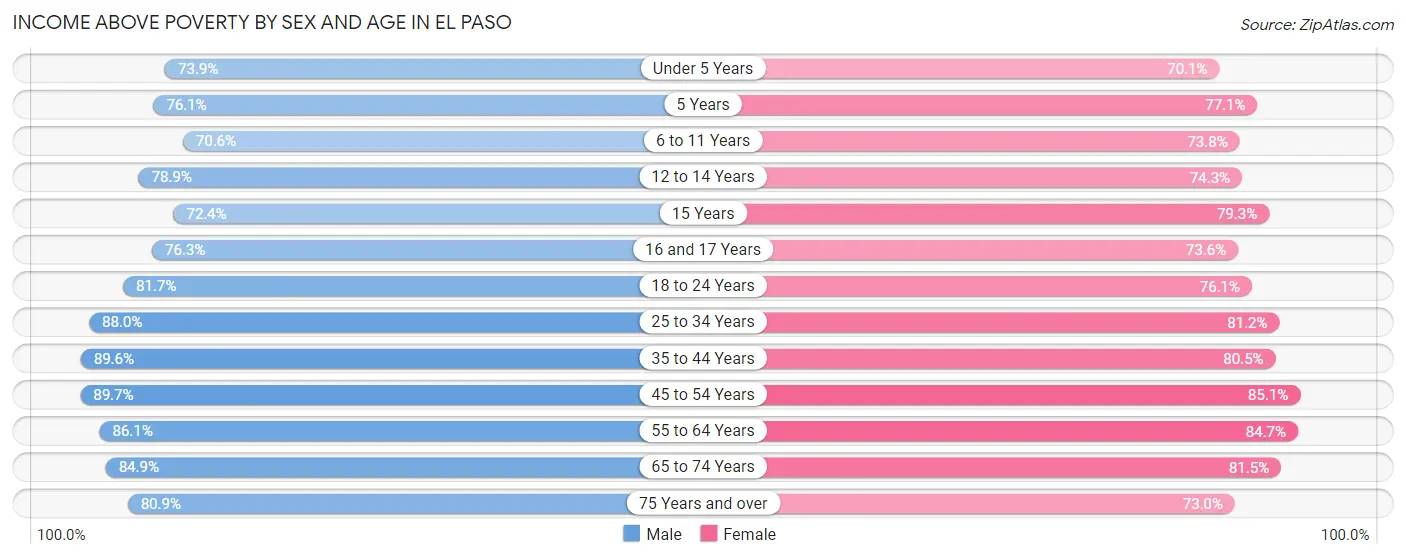
| Age Bracket | Male | Female |
| Under 5 Years | 16,789 (73.9%) | 15,483 (70.1%) |
| 5 Years | 3,579 (76.1%) | 3,214 (77.1%) |
| 6 to 11 Years | 20,384 (70.6%) | 20,499 (73.8%) |
| 12 to 14 Years | 12,362 (78.8%) | 11,065 (74.3%) |
| 15 Years | 3,904 (72.4%) | 3,940 (79.3%) |
| 16 and 17 Years | 7,472 (76.3%) | 6,959 (73.6%) |
| 18 to 24 Years | 31,655 (81.7%) | 27,999 (76.1%) |
| 25 to 34 Years | 47,049 (88.0%) | 39,190 (81.2%) |
| 35 to 44 Years | 37,707 (89.6%) | 33,190 (80.5%) |
| 45 to 54 Years | 33,065 (89.6%) | 34,431 (85.1%) |
| 55 to 64 Years | 29,154 (86.1%) | 32,719 (84.7%) |
| 65 to 74 Years | 19,121 (84.9%) | 23,702 (81.5%) |
| 75 Years and over | 12,079 (80.9%) | 16,915 (73.0%) |
| Total | 274,320 (83.2%) | 269,306 (79.0%) |
Income Below Poverty Among Married-Couple Families in El Paso
The poverty statistics for married-couple families in El Paso show that 10.2% or 10,871 of the total 107,124 families live below the poverty line. Families with 5 or more children have the highest poverty rate of 35.0%, comprising of 324 families. On the other hand, families with no children have the lowest poverty rate of 7.9%, which includes 4,395 families.
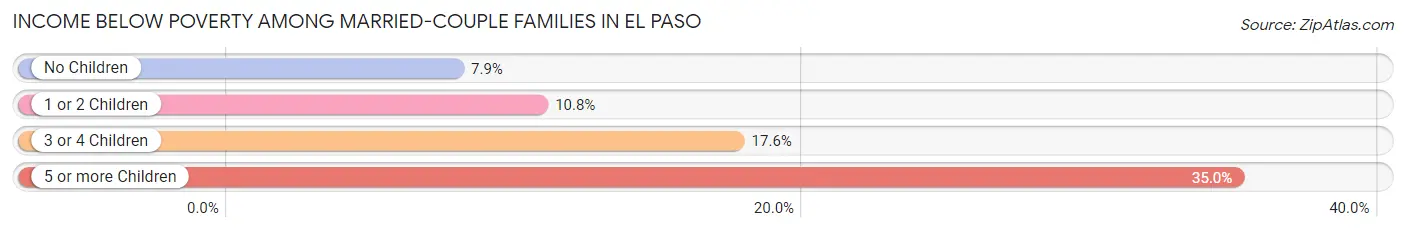
| Children | Above Poverty | Below Poverty |
| No Children | 51,433 (92.1%) | 4,395 (7.9%) |
| 1 or 2 Children | 35,666 (89.2%) | 4,320 (10.8%) |
| 3 or 4 Children | 8,553 (82.4%) | 1,832 (17.6%) |
| 5 or more Children | 601 (65.0%) | 324 (35.0%) |
| Total | 96,253 (89.8%) | 10,871 (10.2%) |
Income Below Poverty Among Single-Parent Households in El Paso
According to the poverty data in El Paso, 14.5% or 2,241 single-father households and 31.1% or 13,752 single-mother households are living below the poverty line. Among single-father households, those with 3 or 4 children have the highest poverty rate, with 613 households (43.2%) experiencing poverty. Likewise, among single-mother households, those with 3 or 4 children have the highest poverty rate, with 3,113 households (66.8%) falling below the poverty line.
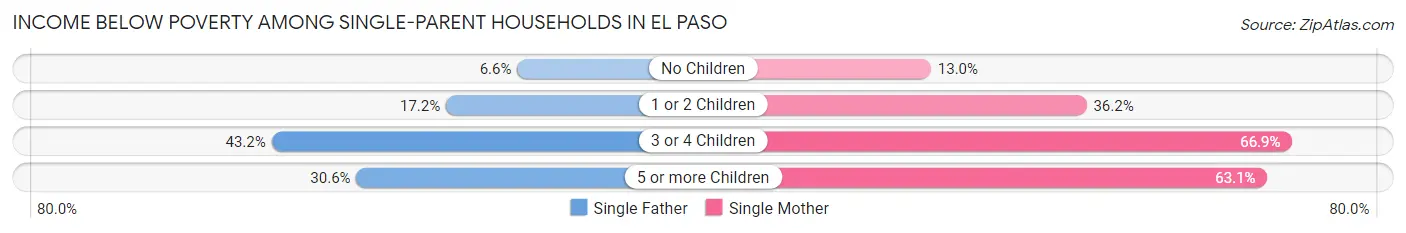
| Children | Single Father | Single Mother |
| No Children | 487 (6.6%) | 2,121 (13.0%) |
| 1 or 2 Children | 1,130 (17.2%) | 8,220 (36.2%) |
| 3 or 4 Children | 613 (43.2%) | 3,113 (66.8%) |
| 5 or more Children | 11 (30.6%) | 298 (63.1%) |
| Total | 2,241 (14.5%) | 13,752 (31.1%) |
Income Below Poverty Among Married-Couple vs Single-Parent Households in El Paso
The poverty data for El Paso shows that 10,871 of the married-couple family households (10.2%) and 15,993 of the single-parent households (26.8%) are living below the poverty level. Within the married-couple family households, those with 5 or more children have the highest poverty rate, with 324 households (35.0%) falling below the poverty line. Among the single-parent households, those with 3 or 4 children have the highest poverty rate, with 3,726 household (61.3%) living below poverty.
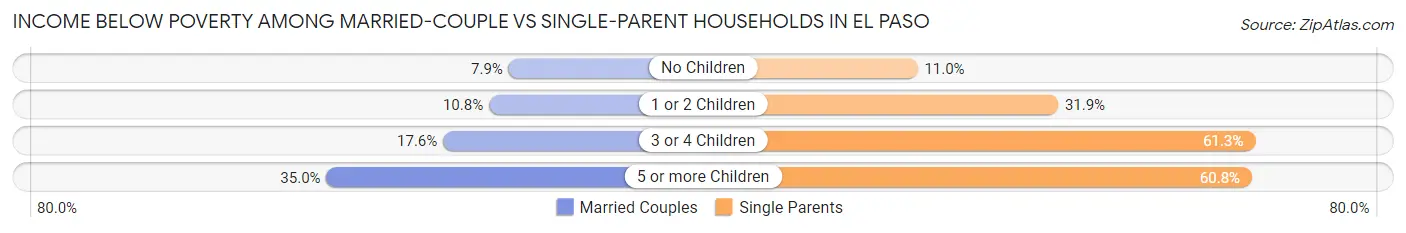
| Children | Married-Couple Families | Single-Parent Households |
| No Children | 4,395 (7.9%) | 2,608 (11.0%) |
| 1 or 2 Children | 4,320 (10.8%) | 9,350 (31.9%) |
| 3 or 4 Children | 1,832 (17.6%) | 3,726 (61.3%) |
| 5 or more Children | 324 (35.0%) | 309 (60.8%) |
| Total | 10,871 (10.2%) | 15,993 (26.8%) |
Race in El Paso
The most populous races in El Paso are Hispanic or Latino (552,434 | 81.6%), White / Caucasian (334,767 | 49.4%), and Two or more Races (202,616 | 29.9%).
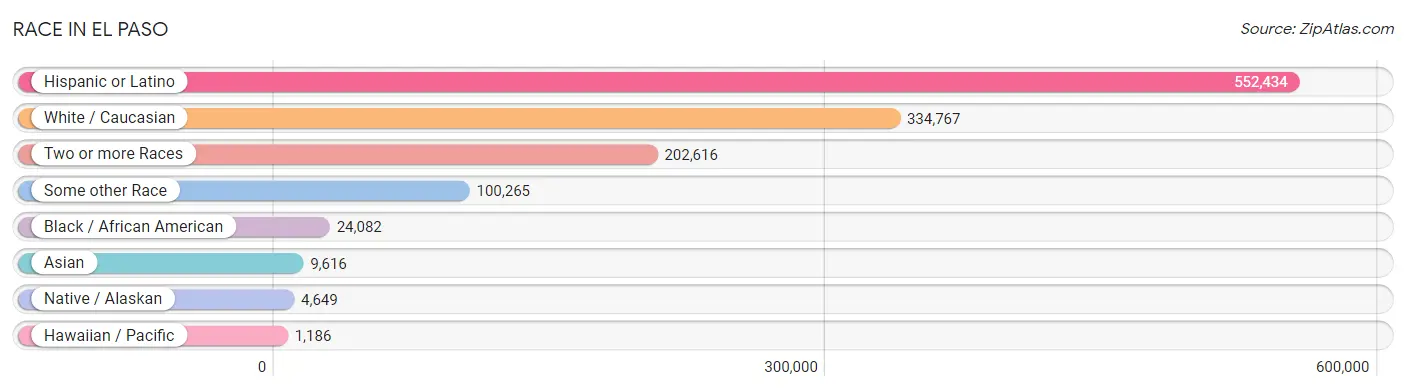
| Race | # Population | % Population |
| Asian | 9,616 | 1.4% |
| Black / African American | 24,082 | 3.6% |
| Hawaiian / Pacific | 1,186 | 0.2% |
| Hispanic or Latino | 552,434 | 81.6% |
| Native / Alaskan | 4,649 | 0.7% |
| White / Caucasian | 334,767 | 49.4% |
| Two or more Races | 202,616 | 29.9% |
| Some other Race | 100,265 | 14.8% |
| Total | 677,181 | 100.0% |
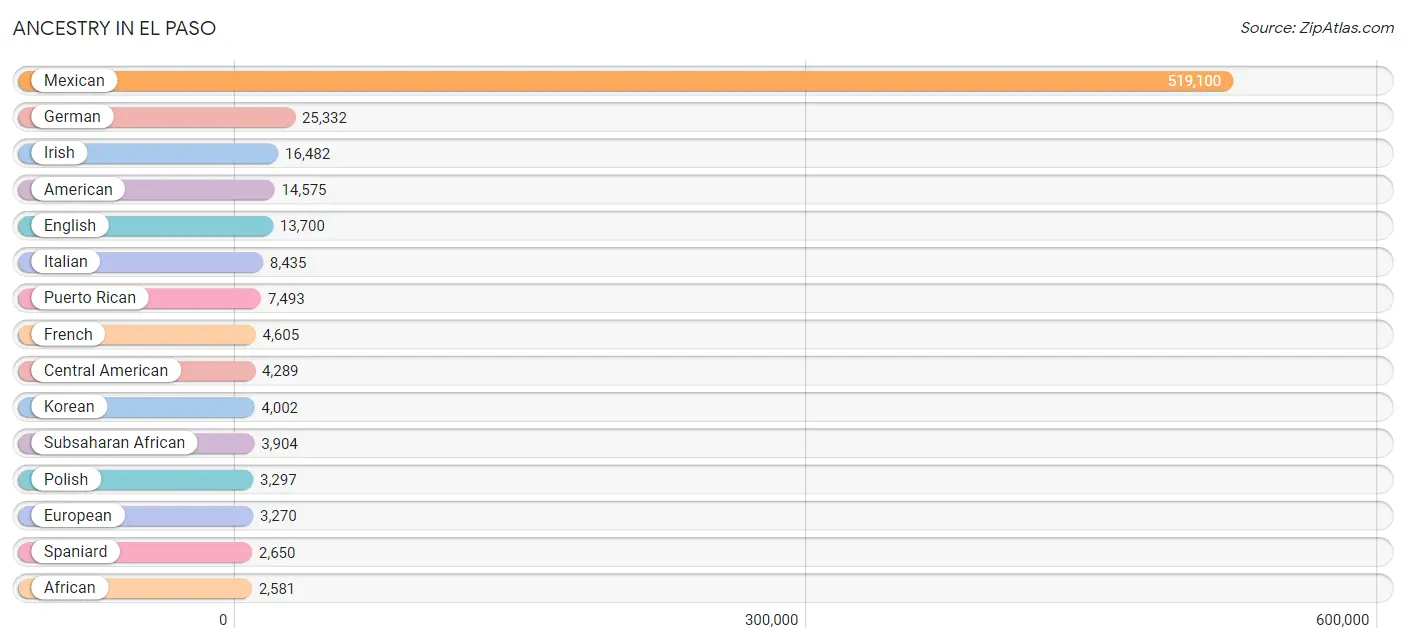
Ancestry in El Paso
The most populous ancestries reported in El Paso are Mexican (519,100 | 76.7%), German (25,332 | 3.7%), Irish (16,482 | 2.4%), American (14,575 | 2.1%), and English (13,700 | 2.0%), together accounting for 87.0% of all El Paso residents.
| Ancestry | # Population | % Population |
| Afghan | 73 | 0.0% |
| African | 2,581 | 0.4% |
| Alaska Native | 76 | 0.0% |
| Aleut | 11 | 0.0% |
| American | 14,575 | 2.1% |
| Apache | 745 | 0.1% |
| Arab | 1,863 | 0.3% |
| Argentinean | 200 | 0.0% |
| Armenian | 329 | 0.1% |
| Austrian | 380 | 0.1% |
| Barbadian | 51 | 0.0% |
| Basque | 230 | 0.0% |
| Belgian | 55 | 0.0% |
| Belizean | 30 | 0.0% |
| Bhutanese | 1,728 | 0.3% |
| Blackfeet | 184 | 0.0% |
| Bolivian | 127 | 0.0% |
| Brazilian | 209 | 0.0% |
| British | 905 | 0.1% |
| British West Indian | 15 | 0.0% |
| Burmese | 2,564 | 0.4% |
| Cajun | 56 | 0.0% |
| Canadian | 338 | 0.1% |
| Celtic | 8 | 0.0% |
| Central American | 4,289 | 0.6% |
| Central American Indian | 396 | 0.1% |
| Cherokee | 825 | 0.1% |
| Cheyenne | 125 | 0.0% |
| Chickasaw | 63 | 0.0% |
| Chilean | 327 | 0.1% |
| Chinese | 14 | 0.0% |
| Chippewa | 81 | 0.0% |
| Choctaw | 289 | 0.0% |
| Colombian | 719 | 0.1% |
| Colville | 12 | 0.0% |
| Comanche | 131 | 0.0% |
| Costa Rican | 801 | 0.1% |
| Cree | 24 | 0.0% |
| Creek | 47 | 0.0% |
| Croatian | 238 | 0.0% |
| Cuban | 848 | 0.1% |
| Czech | 724 | 0.1% |
| Czechoslovakian | 329 | 0.1% |
| Danish | 572 | 0.1% |
| Delaware | 29 | 0.0% |
| Dominican | 907 | 0.1% |
| Dutch | 1,208 | 0.2% |
| Eastern European | 594 | 0.1% |
| Ecuadorian | 212 | 0.0% |
| Egyptian | 52 | 0.0% |
| English | 13,700 | 2.0% |
| Ethiopian | 89 | 0.0% |
| European | 3,270 | 0.5% |
| Filipino | 161 | 0.0% |
| Finnish | 255 | 0.0% |
| French | 4,605 | 0.7% |
| French Canadian | 859 | 0.1% |
| German | 25,332 | 3.7% |
| German Russian | 38 | 0.0% |
| Ghanaian | 134 | 0.0% |
| Greek | 258 | 0.0% |
| Guamanian / Chamorro | 602 | 0.1% |
| Guatemalan | 920 | 0.1% |
| Haitian | 338 | 0.1% |
| Honduran | 716 | 0.1% |
| Hopi | 47 | 0.0% |
| Houma | 3 | 0.0% |
| Hungarian | 506 | 0.1% |
| Icelander | 14 | 0.0% |
| Indian (Asian) | 2,493 | 0.4% |
| Indonesian | 219 | 0.0% |
| Inupiat | 47 | 0.0% |
| Iranian | 309 | 0.1% |
| Irish | 16,482 | 2.4% |
| Iroquois | 442 | 0.1% |
| Israeli | 21 | 0.0% |
| Italian | 8,435 | 1.3% |
| Jamaican | 1,236 | 0.2% |
| Japanese | 207 | 0.0% |
| Jordanian | 59 | 0.0% |
| Korean | 4,002 | 0.6% |
| Laotian | 126 | 0.0% |
| Lebanese | 566 | 0.1% |
| Lithuanian | 181 | 0.0% |
| Lumbee | 129 | 0.0% |
| Luxembourger | 21 | 0.0% |
| Malaysian | 114 | 0.0% |
| Maltese | 9 | 0.0% |
| Mexican | 519,100 | 76.7% |
| Mexican American Indian | 1,920 | 0.3% |
| Mongolian | 78 | 0.0% |
| Moroccan | 207 | 0.0% |
| Native Hawaiian | 489 | 0.1% |
| Navajo | 528 | 0.1% |
| Nicaraguan | 146 | 0.0% |
| Nigerian | 660 | 0.1% |
| Northern European | 316 | 0.1% |
| Norwegian | 983 | 0.2% |
| Ottawa | 4 | 0.0% |
| Pakistani | 255 | 0.0% |
| Palestinian | 21 | 0.0% |
| Panamanian | 756 | 0.1% |
| Pennsylvania German | 17 | 0.0% |
| Peruvian | 284 | 0.0% |
| Pima | 104 | 0.0% |
| Polish | 3,297 | 0.5% |
| Portuguese | 628 | 0.1% |
| Potawatomi | 67 | 0.0% |
| Pueblo | 1,340 | 0.2% |
| Puerto Rican | 7,493 | 1.1% |
| Romanian | 30 | 0.0% |
| Russian | 818 | 0.1% |
| Salvadoran | 950 | 0.1% |
| Samoan | 464 | 0.1% |
| Scandinavian | 562 | 0.1% |
| Scotch-Irish | 1,341 | 0.2% |
| Scottish | 2,538 | 0.4% |
| Senegalese | 103 | 0.0% |
| Serbian | 4 | 0.0% |
| Sioux | 69 | 0.0% |
| Slavic | 28 | 0.0% |
| Slovak | 71 | 0.0% |
| Slovene | 42 | 0.0% |
| South American | 2,008 | 0.3% |
| South American Indian | 17 | 0.0% |
| Spaniard | 2,650 | 0.4% |
| Spanish | 1,527 | 0.2% |
| Spanish American | 76 | 0.0% |
| Spanish American Indian | 50 | 0.0% |
| Sri Lankan | 1,013 | 0.2% |
| Subsaharan African | 3,904 | 0.6% |
| Swedish | 921 | 0.1% |
| Swiss | 272 | 0.0% |
| Syrian | 272 | 0.0% |
| Thai | 1,976 | 0.3% |
| Tohono O'Odham | 70 | 0.0% |
| Tongan | 21 | 0.0% |
| Trinidadian and Tobagonian | 57 | 0.0% |
| Turkish | 340 | 0.1% |
| Ugandan | 25 | 0.0% |
| Ukrainian | 214 | 0.0% |
| Uruguayan | 18 | 0.0% |
| Venezuelan | 121 | 0.0% |
| Vietnamese | 22 | 0.0% |
| Welsh | 1,200 | 0.2% |
| West Indian | 257 | 0.0% |
| Yaqui | 85 | 0.0% |
| Yugoslavian | 244 | 0.0% |
| Yup'ik | 108 | 0.0% | View All 149 Rows |
Immigrants in El Paso
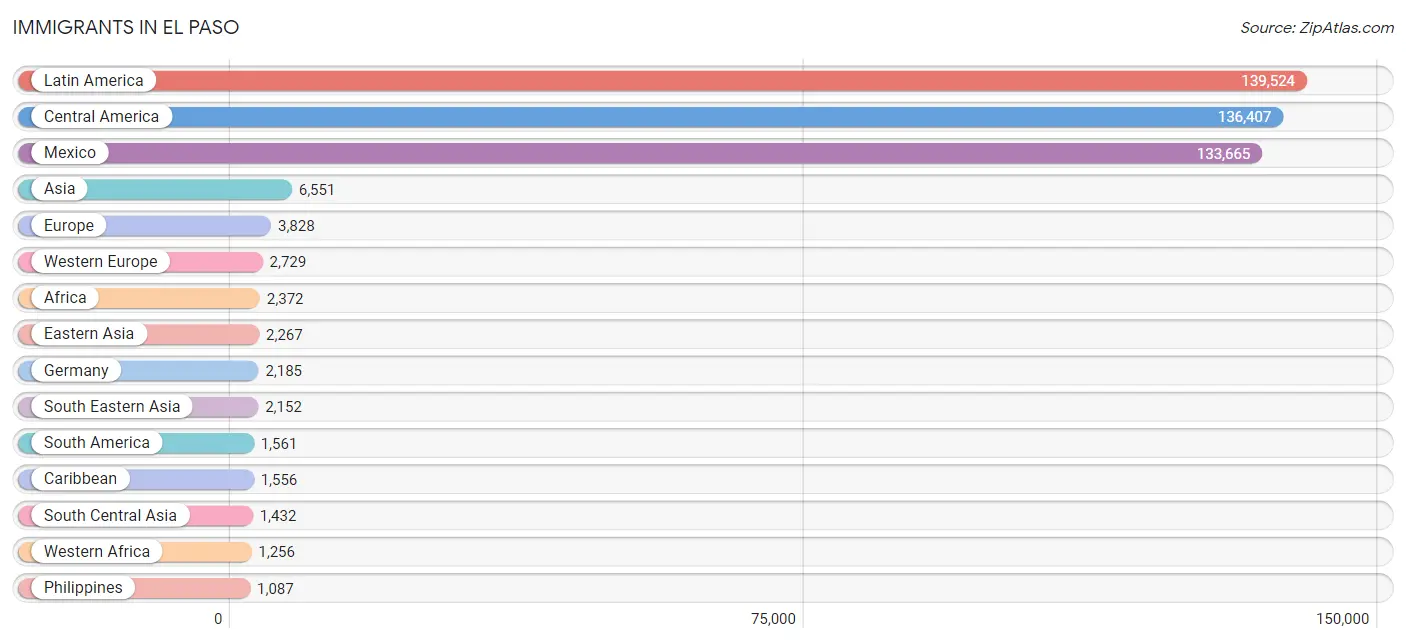
The most numerous immigrant groups reported in El Paso came from Latin America (139,524 | 20.6%), Central America (136,407 | 20.1%), Mexico (133,665 | 19.7%), Asia (6,551 | 1.0%), and Europe (3,828 | 0.6%), together accounting for 62.0% of all El Paso residents.
| Immigration Origin | # Population | % Population |
| Afghanistan | 115 | 0.0% |
| Africa | 2,372 | 0.4% |
| Argentina | 224 | 0.0% |
| Armenia | 56 | 0.0% |
| Asia | 6,551 | 1.0% |
| Australia | 45 | 0.0% |
| Austria | 41 | 0.0% |
| Bangladesh | 35 | 0.0% |
| Barbados | 41 | 0.0% |
| Belgium | 58 | 0.0% |
| Belize | 17 | 0.0% |
| Bolivia | 116 | 0.0% |
| Brazil | 82 | 0.0% |
| Cambodia | 29 | 0.0% |
| Cameroon | 293 | 0.0% |
| Canada | 583 | 0.1% |
| Caribbean | 1,556 | 0.2% |
| Central America | 136,407 | 20.1% |
| Chile | 91 | 0.0% |
| China | 981 | 0.1% |
| Colombia | 460 | 0.1% |
| Congo | 36 | 0.0% |
| Costa Rica | 780 | 0.1% |
| Croatia | 20 | 0.0% |
| Cuba | 284 | 0.0% |
| Czechoslovakia | 33 | 0.0% |
| Denmark | 9 | 0.0% |
| Dominican Republic | 423 | 0.1% |
| Eastern Africa | 227 | 0.0% |
| Eastern Asia | 2,267 | 0.3% |
| Eastern Europe | 390 | 0.1% |
| Ecuador | 169 | 0.0% |
| Egypt | 59 | 0.0% |
| El Salvador | 594 | 0.1% |
| England | 112 | 0.0% |
| Eritrea | 32 | 0.0% |
| Ethiopia | 109 | 0.0% |
| Europe | 3,828 | 0.6% |
| Fiji | 63 | 0.0% |
| France | 428 | 0.1% |
| Germany | 2,185 | 0.3% |
| Ghana | 195 | 0.0% |
| Greece | 15 | 0.0% |
| Guatemala | 697 | 0.1% |
| Haiti | 69 | 0.0% |
| Honduras | 323 | 0.1% |
| Hong Kong | 80 | 0.0% |
| Hungary | 39 | 0.0% |
| India | 866 | 0.1% |
| Indonesia | 56 | 0.0% |
| Iran | 143 | 0.0% |
| Iraq | 63 | 0.0% |
| Ireland | 63 | 0.0% |
| Israel | 9 | 0.0% |
| Italy | 169 | 0.0% |
| Jamaica | 552 | 0.1% |
| Japan | 266 | 0.0% |
| Jordan | 130 | 0.0% |
| Kenya | 55 | 0.0% |
| Korea | 1,020 | 0.2% |
| Kuwait | 39 | 0.0% |
| Latin America | 139,524 | 20.6% |
| Lebanon | 74 | 0.0% |
| Liberia | 24 | 0.0% |
| Malaysia | 145 | 0.0% |
| Mexico | 133,665 | 19.7% |
| Micronesia | 80 | 0.0% |
| Middle Africa | 329 | 0.1% |
| Morocco | 21 | 0.0% |
| Nepal | 85 | 0.0% |
| Netherlands | 17 | 0.0% |
| Nicaragua | 88 | 0.0% |
| Nigeria | 617 | 0.1% |
| Northern Africa | 83 | 0.0% |
| Northern Europe | 367 | 0.1% |
| Oceania | 293 | 0.0% |
| Pakistan | 68 | 0.0% |
| Panama | 243 | 0.0% |
| Peru | 266 | 0.0% |
| Philippines | 1,087 | 0.2% |
| Poland | 86 | 0.0% |
| Portugal | 17 | 0.0% |
| Russia | 172 | 0.0% |
| Saudi Arabia | 27 | 0.0% |
| Scotland | 54 | 0.0% |
| Senegal | 16 | 0.0% |
| Singapore | 18 | 0.0% |
| South Africa | 33 | 0.0% |
| South America | 1,561 | 0.2% |
| South Central Asia | 1,432 | 0.2% |
| South Eastern Asia | 2,152 | 0.3% |
| Southern Europe | 333 | 0.1% |
| Spain | 132 | 0.0% |
| Sri Lanka | 14 | 0.0% |
| St. Vincent and the Grenadines | 4 | 0.0% |
| Syria | 41 | 0.0% |
| Taiwan | 214 | 0.0% |
| Thailand | 85 | 0.0% |
| Trinidad and Tobago | 57 | 0.0% |
| Turkey | 217 | 0.0% |
| Uganda | 25 | 0.0% |
| Ukraine | 26 | 0.0% |
| Uruguay | 18 | 0.0% |
| Uzbekistan | 39 | 0.0% |
| Venezuela | 116 | 0.0% |
| Vietnam | 651 | 0.1% |
| West Indies | 25 | 0.0% |
| Western Africa | 1,256 | 0.2% |
| Western Asia | 700 | 0.1% |
| Western Europe | 2,729 | 0.4% |
| Yemen | 7 | 0.0% | View All 111 Rows |
Sex and Age in El Paso
Sex and Age in El Paso
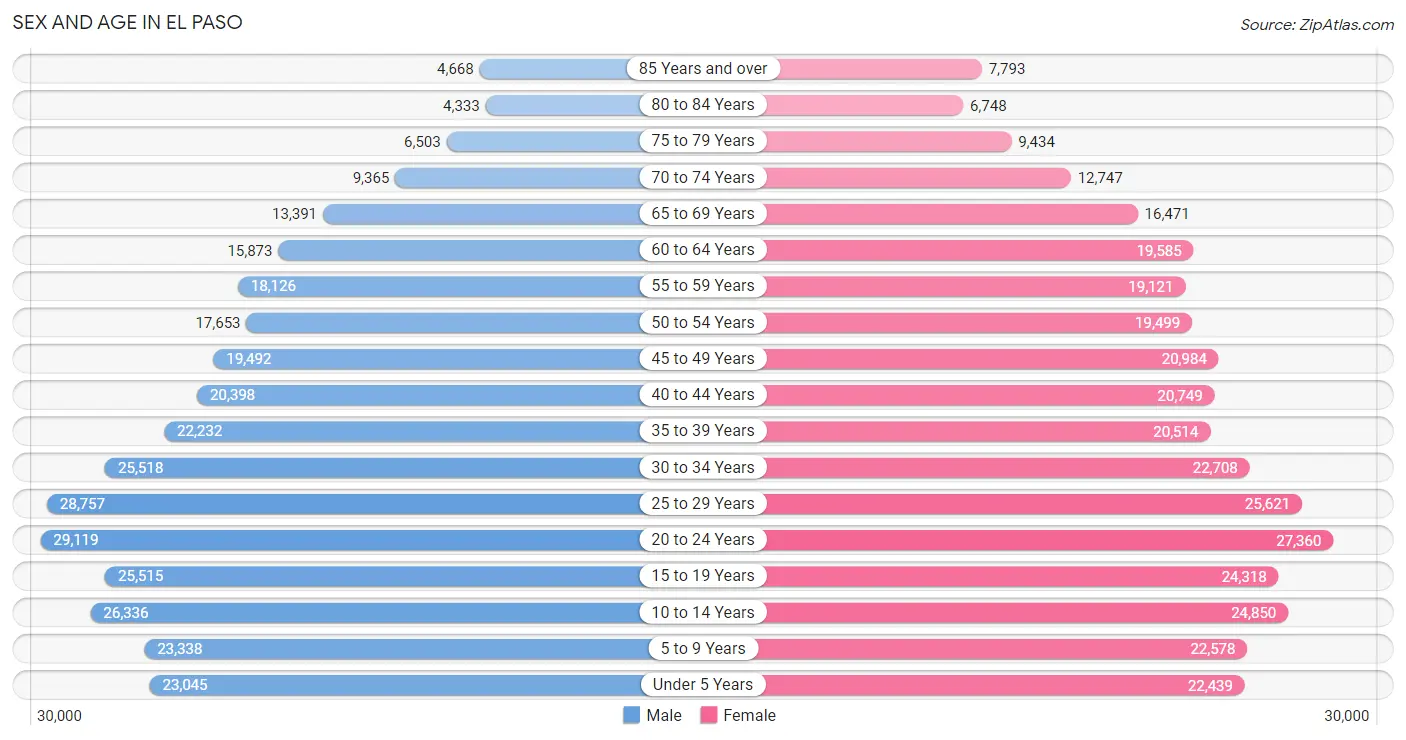
The most populous age groups in El Paso are 20 to 24 Years (29,119 | 8.7%) for men and 20 to 24 Years (27,360 | 8.0%) for women.
| Age Bracket | Male | Female |
| Under 5 Years | 23,045 (6.9%) | 22,439 (6.5%) |
| 5 to 9 Years | 23,338 (7.0%) | 22,578 (6.6%) |
| 10 to 14 Years | 26,336 (7.9%) | 24,850 (7.2%) |
| 15 to 19 Years | 25,515 (7.6%) | 24,318 (7.1%) |
| 20 to 24 Years | 29,119 (8.7%) | 27,360 (8.0%) |
| 25 to 29 Years | 28,757 (8.6%) | 25,621 (7.5%) |
| 30 to 34 Years | 25,518 (7.6%) | 22,708 (6.6%) |
| 35 to 39 Years | 22,232 (6.7%) | 20,514 (6.0%) |
| 40 to 44 Years | 20,398 (6.1%) | 20,749 (6.0%) |
| 45 to 49 Years | 19,492 (5.8%) | 20,984 (6.1%) |
| 50 to 54 Years | 17,653 (5.3%) | 19,499 (5.7%) |
| 55 to 59 Years | 18,126 (5.4%) | 19,121 (5.6%) |
| 60 to 64 Years | 15,873 (4.8%) | 19,585 (5.7%) |
| 65 to 69 Years | 13,391 (4.0%) | 16,471 (4.8%) |
| 70 to 74 Years | 9,365 (2.8%) | 12,747 (3.7%) |
| 75 to 79 Years | 6,503 (1.9%) | 9,434 (2.8%) |
| 80 to 84 Years | 4,333 (1.3%) | 6,748 (2.0%) |
| 85 Years and over | 4,668 (1.4%) | 7,793 (2.3%) |
| Total | 333,662 (100.0%) | 343,519 (100.0%) |
Families and Households in El Paso
Median Family Size in El Paso
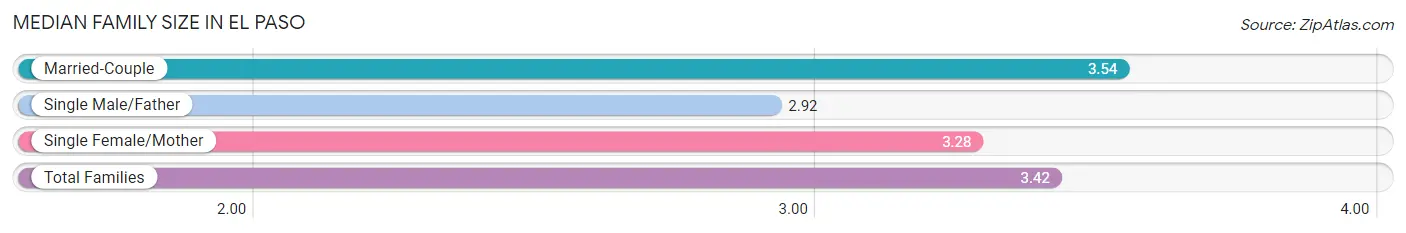
The median family size in El Paso is 3.42 persons per family, with married-couple families (107,124 | 64.2%) accounting for the largest median family size of 3.54 persons per family. On the other hand, single male/father families (15,423 | 9.2%) represent the smallest median family size with 2.92 persons per family.
| Family Type | # Families | Family Size |
| Married-Couple | 107,124 (64.2%) | 3.54 |
| Single Male/Father | 15,423 (9.2%) | 2.92 |
| Single Female/Mother | 44,179 (26.5%) | 3.28 |
| Total Families | 166,726 (100.0%) | 3.42 |
Median Household Size in El Paso
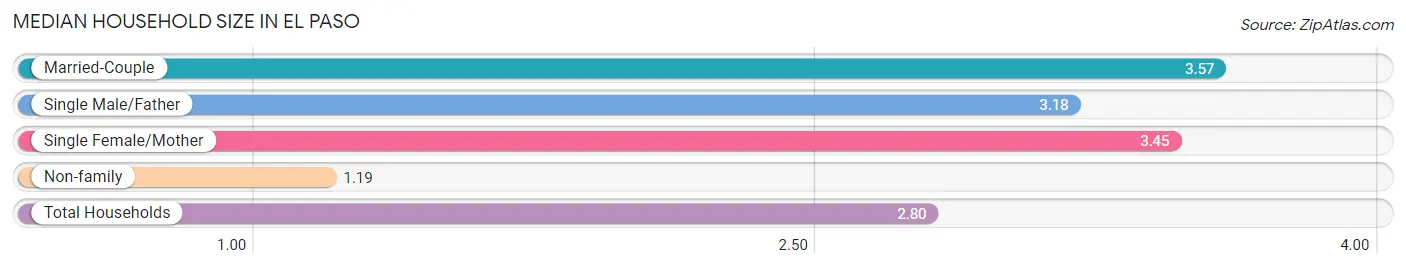
The median household size in El Paso is 2.80 persons per household, with married-couple households (107,124 | 44.7%) accounting for the largest median household size of 3.57 persons per household. non-family households (72,898 | 30.4%) represent the smallest median household size with 1.19 persons per household.
| Household Type | # Households | Household Size |
| Married-Couple | 107,124 (44.7%) | 3.57 |
| Single Male/Father | 15,423 (6.4%) | 3.18 |
| Single Female/Mother | 44,179 (18.4%) | 3.45 |
| Non-family | 72,898 (30.4%) | 1.19 |
| Total Households | 239,624 (100.0%) | 2.80 |
Household Size by Marriage Status in El Paso
Out of a total of 239,624 households in El Paso, 166,726 (69.6%) are family households, while 72,898 (30.4%) are nonfamily households. The most numerous type of family households are 2-person households, comprising 58,553, and the most common type of nonfamily households are 1-person households, comprising 61,972.
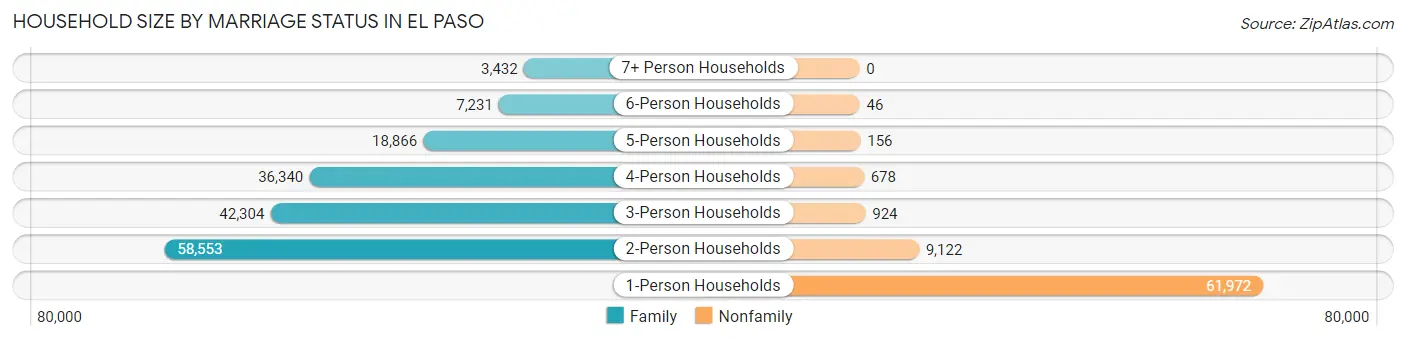
| Household Size | Family Households | Nonfamily Households |
| 1-Person Households | - | 61,972 (25.9%) |
| 2-Person Households | 58,553 (24.4%) | 9,122 (3.8%) |
| 3-Person Households | 42,304 (17.6%) | 924 (0.4%) |
| 4-Person Households | 36,340 (15.2%) | 678 (0.3%) |
| 5-Person Households | 18,866 (7.9%) | 156 (0.1%) |
| 6-Person Households | 7,231 (3.0%) | 46 (0.0%) |
| 7+ Person Households | 3,432 (1.4%) | 0 (0.0%) |
| Total | 166,726 (69.6%) | 72,898 (30.4%) |
Female Fertility in El Paso
Fertility by Age in El Paso
Average fertility rate in El Paso is 63.0 births per 1,000 women. Women in the age bracket of 20 to 34 years have the highest fertility rate with 98.0 births per 1,000 women. Women in the age bracket of 20 to 34 years acount for 71.2% of all women with births.
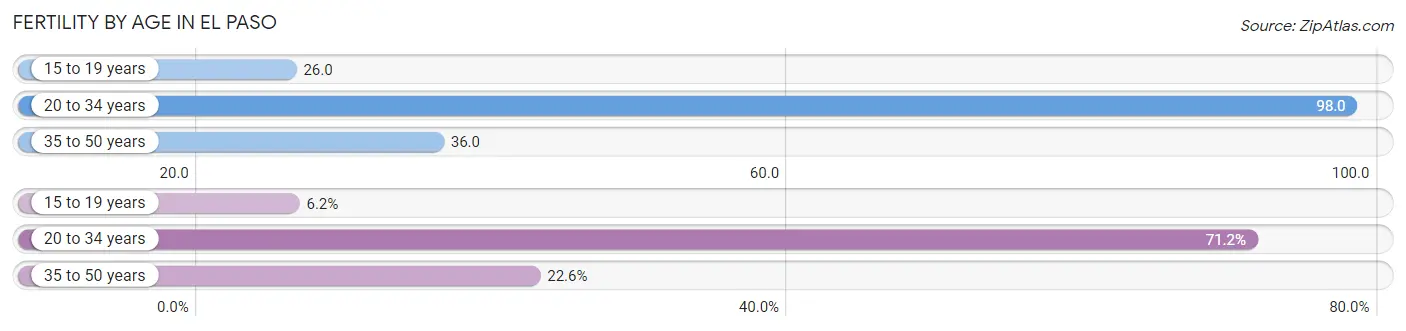
| Age Bracket | Women with Births | Births / 1,000 Women |
| 15 to 19 years | 644 (6.2%) | 26.0 |
| 20 to 34 years | 7,392 (71.2%) | 98.0 |
| 35 to 50 years | 2,340 (22.6%) | 36.0 |
| Total | 10,376 (100.0%) | 63.0 |
Fertility by Age by Marriage Status in El Paso
61.4% of women with births (10,376) in El Paso are married. The highest percentage of unmarried women with births falls into 15 to 19 years age bracket with 84.0% of them unmarried at the time of birth, while the lowest percentage of unmarried women with births belong to 35 to 50 years age bracket with 28.1% of them unmarried.
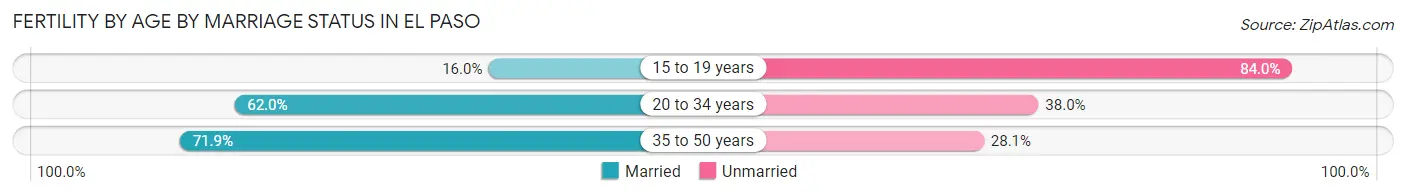
| Age Bracket | Married | Unmarried |
| 15 to 19 years | 103 (16.0%) | 541 (84.0%) |
| 20 to 34 years | 4,583 (62.0%) | 2,809 (38.0%) |
| 35 to 50 years | 1,682 (71.9%) | 658 (28.1%) |
| Total | 6,371 (61.4%) | 4,005 (38.6%) |
Fertility by Education in El Paso
Average fertility rate in El Paso is 63.0 births per 1,000 women. Women with the education attainment of college or associate's degree have the highest fertility rate of 79.0 births per 1,000 women, while women with the education attainment of less than high school have the lowest fertility at 33.0 births per 1,000 women. Women with the education attainment of college or associate's degree represent 44.3% of all women with births.
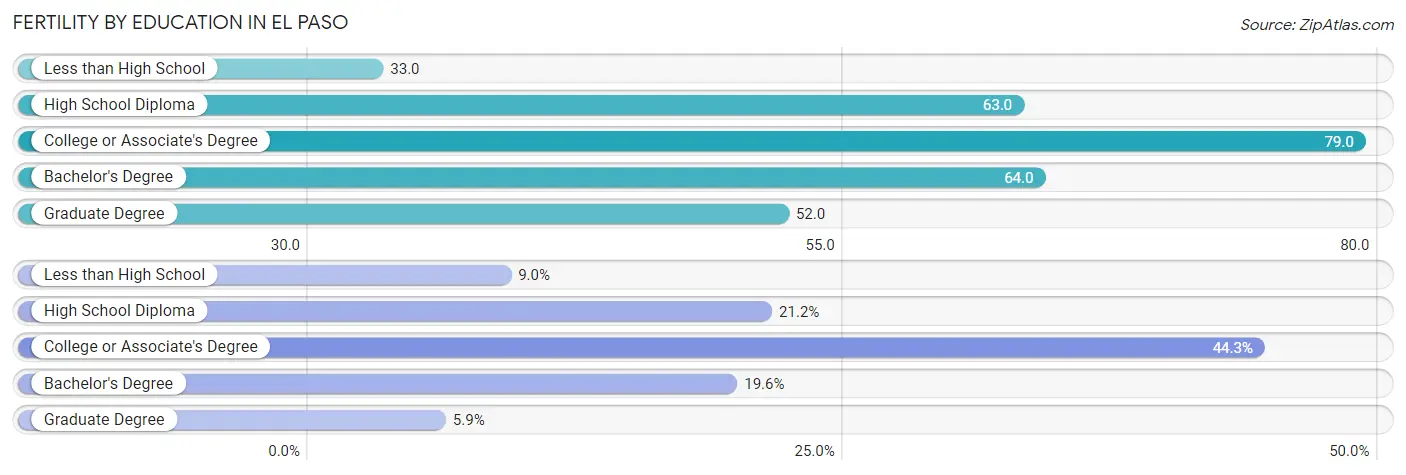
| Educational Attainment | Women with Births | Births / 1,000 Women |
| Less than High School | 933 (9.0%) | 33.0 |
| High School Diploma | 2,201 (21.2%) | 63.0 |
| College or Associate's Degree | 4,595 (44.3%) | 79.0 |
| Bachelor's Degree | 2,032 (19.6%) | 64.0 |
| Graduate Degree | 615 (5.9%) | 52.0 |
| Total | 10,376 (100.0%) | 63.0 |
Fertility by Education by Marriage Status in El Paso
38.6% of women with births in El Paso are unmarried. Women with the educational attainment of graduate degree are most likely to be married with 89.3% of them married at childbirth, while women with the educational attainment of college or associate's degree are least likely to be married with 46.6% of them unmarried at childbirth.
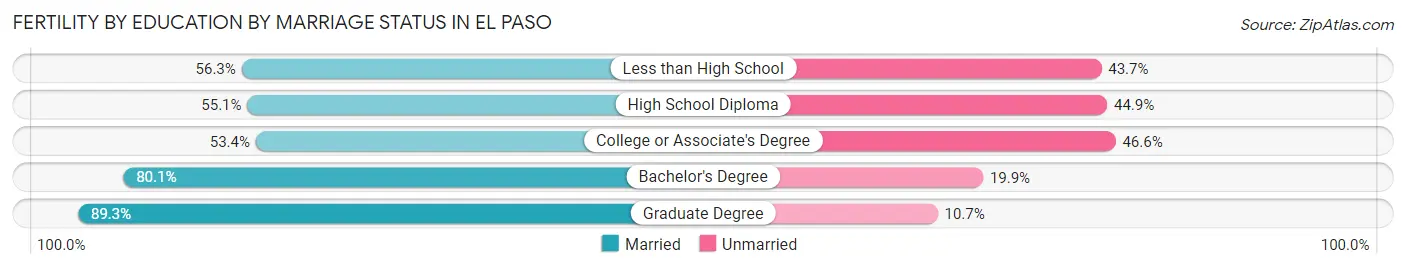
| Educational Attainment | Married | Unmarried |
| Less than High School | 525 (56.3%) | 408 (43.7%) |
| High School Diploma | 1,213 (55.1%) | 988 (44.9%) |
| College or Associate's Degree | 2,454 (53.4%) | 2,141 (46.6%) |
| Bachelor's Degree | 1,628 (80.1%) | 404 (19.9%) |
| Graduate Degree | 549 (89.3%) | 66 (10.7%) |
| Total | 6,371 (61.4%) | 4,005 (38.6%) |
Employment Characteristics in El Paso
Employment by Class of Employer in El Paso
Among the 300,196 employed individuals in El Paso, private company employees (188,021 | 62.6%), federal government employees (29,483 | 9.8%), and local government employees (27,478 | 9.1%) make up the most common classes of employment.
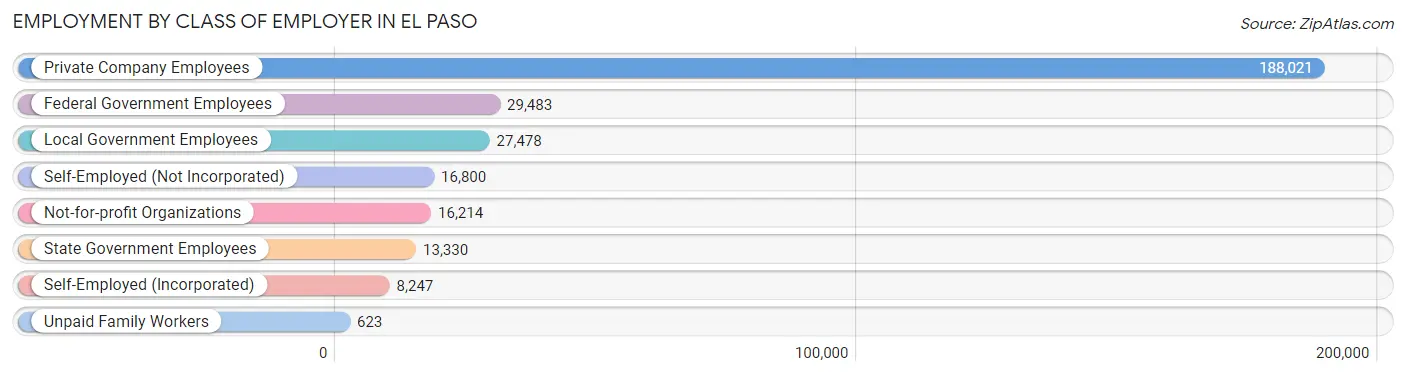
| Employer Class | # Employees | % Employees |
| Private Company Employees | 188,021 | 62.6% |
| Self-Employed (Incorporated) | 8,247 | 2.8% |
| Self-Employed (Not Incorporated) | 16,800 | 5.6% |
| Not-for-profit Organizations | 16,214 | 5.4% |
| Local Government Employees | 27,478 | 9.1% |
| State Government Employees | 13,330 | 4.4% |
| Federal Government Employees | 29,483 | 9.8% |
| Unpaid Family Workers | 623 | 0.2% |
| Total | 300,196 | 100.0% |
Employment Status by Age in El Paso
According to the labor force statistics for El Paso, out of the total population over 16 years of age (524,232), 62.7% or 328,693 individuals are in the labor force, with 6.8% or 22,351 of them unemployed. The age group with the highest labor force participation rate is 35 to 44 years, with 81.4% or 68,289 individuals in the labor force. Within the labor force, the 16 to 19 years age range has the highest percentage of unemployed individuals, with 16.1% or 2,097 of them being unemployed.
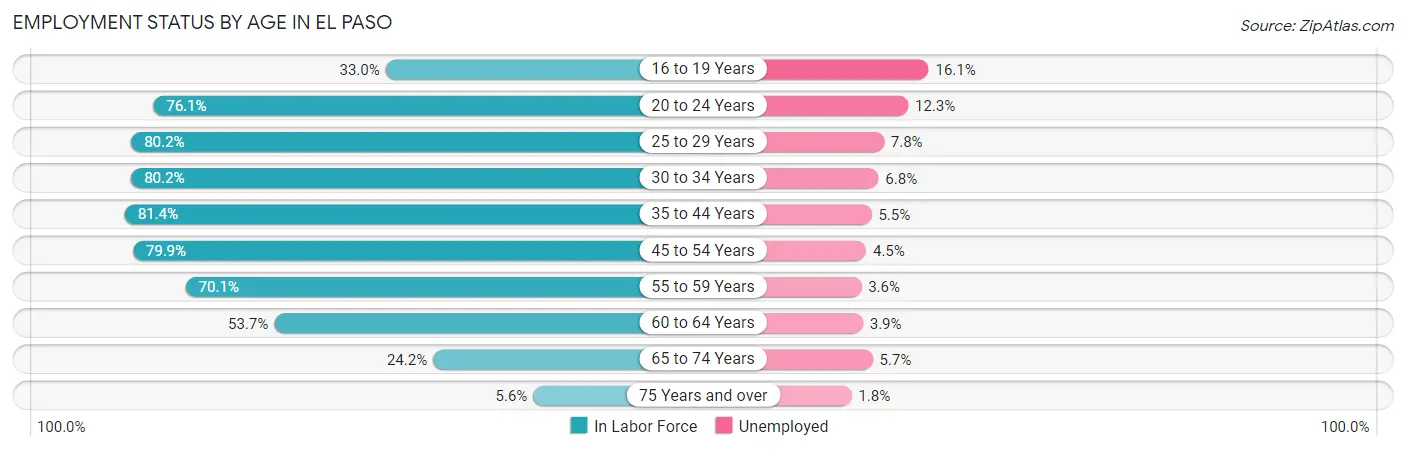
| Age Bracket | In Labor Force | Unemployed |
| 16 to 19 Years | 13,025 (33.0%) | 2,097 (16.1%) |
| 20 to 24 Years | 42,981 (76.1%) | 5,287 (12.3%) |
| 25 to 29 Years | 43,611 (80.2%) | 3,402 (7.8%) |
| 30 to 34 Years | 38,677 (80.2%) | 2,630 (6.8%) |
| 35 to 44 Years | 68,289 (81.4%) | 3,756 (5.5%) |
| 45 to 54 Years | 62,025 (79.9%) | 2,791 (4.5%) |
| 55 to 59 Years | 26,110 (70.1%) | 940 (3.6%) |
| 60 to 64 Years | 19,041 (53.7%) | 743 (3.9%) |
| 65 to 74 Years | 12,578 (24.2%) | 717 (5.7%) |
| 75 Years and over | 2,211 (5.6%) | 40 (1.8%) |
| Total | 328,693 (62.7%) | 22,351 (6.8%) |
Employment Status by Educational Attainment in El Paso
According to labor force statistics for El Paso, 76.5% of individuals (257,675) out of the total population between 25 and 64 years of age (336,830) are in the labor force, with 5.5% or 14,172 of them being unemployed. The group with the highest labor force participation rate are those with the educational attainment of bachelor's degree or higher, with 84.3% or 83,578 individuals in the labor force. Within the labor force, individuals with less than high school education have the highest percentage of unemployment, with 8.8% or 2,430 of them being unemployed.
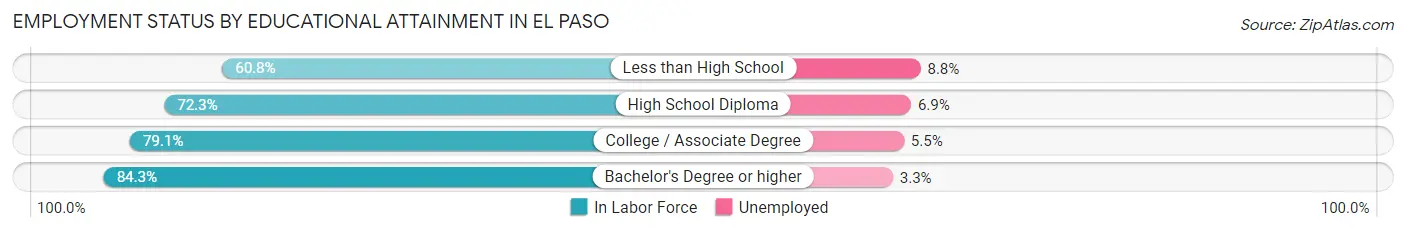
| Educational Attainment | In Labor Force | Unemployed |
| Less than High School | 27,618 (60.8%) | 3,997 (8.8%) |
| High School Diploma | 57,852 (72.3%) | 5,521 (6.9%) |
| College / Associate Degree | 88,786 (79.1%) | 6,173 (5.5%) |
| Bachelor's Degree or higher | 83,578 (84.3%) | 3,272 (3.3%) |
| Total | 257,675 (76.5%) | 18,526 (5.5%) |
Employment Occupations by Sex in El Paso
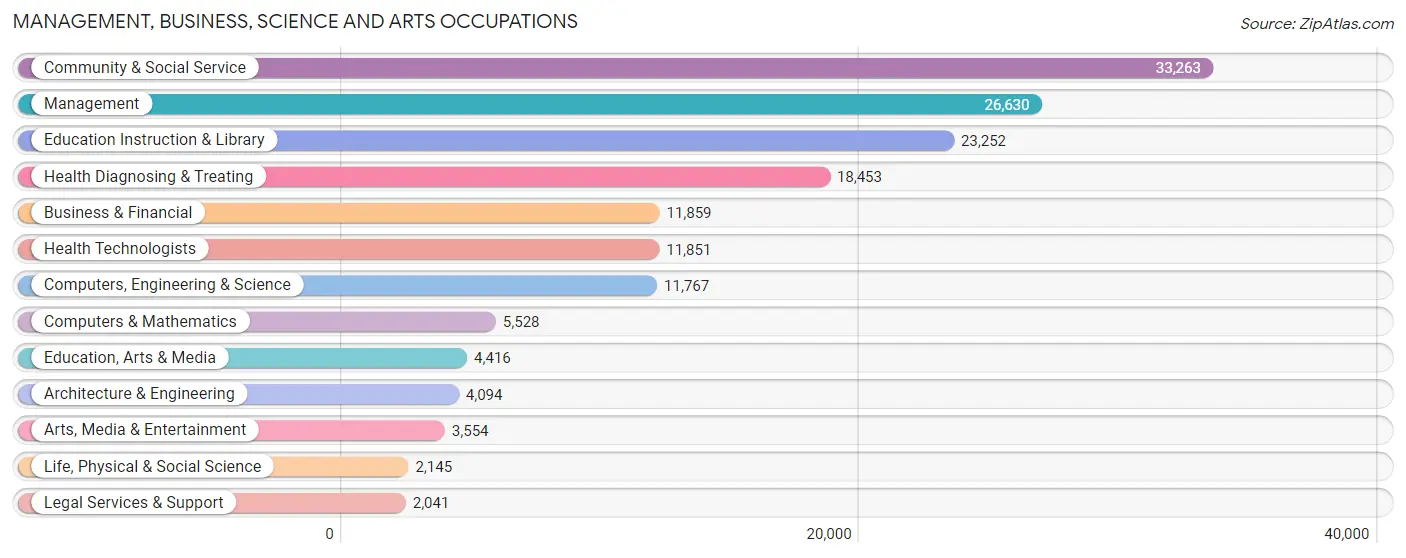
Management, Business, Science and Arts Occupations
The most common Management, Business, Science and Arts occupations in El Paso are Community & Social Service (33,263 | 11.3%), Management (26,630 | 9.0%), Education Instruction & Library (23,252 | 7.9%), Health Diagnosing & Treating (18,453 | 6.2%), and Business & Financial (11,859 | 4.0%).
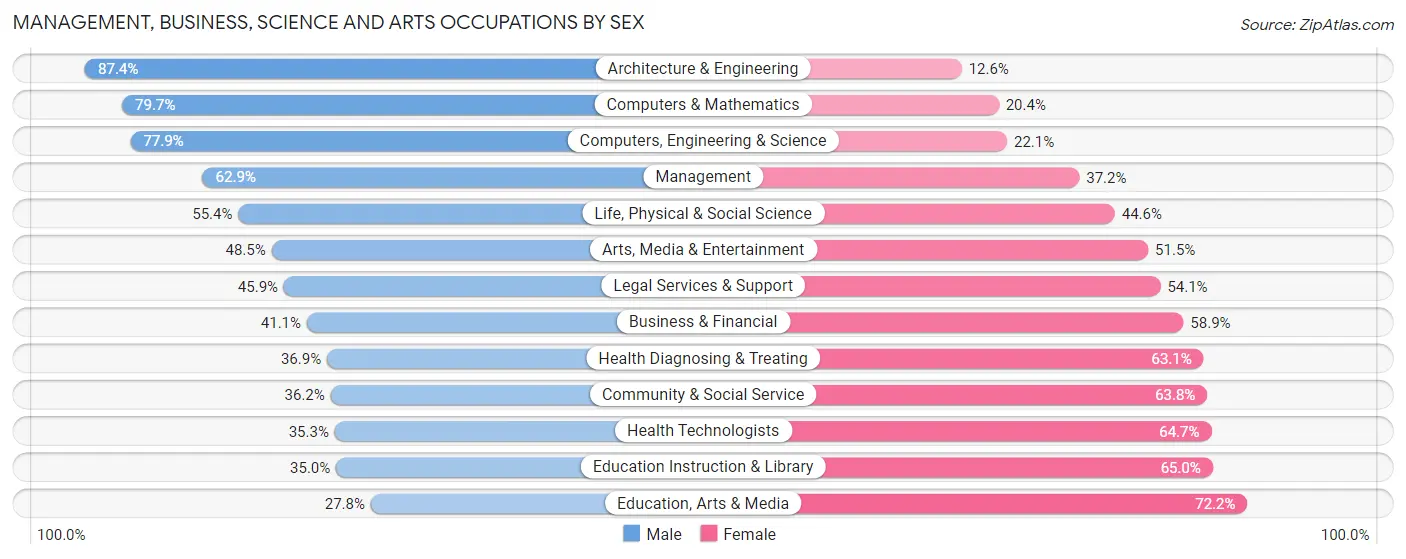
Management, Business, Science and Arts Occupations by Sex
Within the Management, Business, Science and Arts occupations in El Paso, the most male-oriented occupations are Architecture & Engineering (87.4%), Computers & Mathematics (79.6%), and Computers, Engineering & Science (77.9%), while the most female-oriented occupations are Education, Arts & Media (72.2%), Education Instruction & Library (65.0%), and Health Technologists (64.7%).
| Occupation | Male | Female |
| Management | 16,737 (62.8%) | 9,893 (37.1%) |
| Business & Financial | 4,877 (41.1%) | 6,982 (58.9%) |
| Computers, Engineering & Science | 9,169 (77.9%) | 2,598 (22.1%) |
| Computers & Mathematics | 4,403 (79.6%) | 1,125 (20.3%) |
| Architecture & Engineering | 3,577 (87.4%) | 517 (12.6%) |
| Life, Physical & Social Science | 1,189 (55.4%) | 956 (44.6%) |
| Community & Social Service | 12,030 (36.2%) | 21,233 (63.8%) |
| Education, Arts & Media | 1,227 (27.8%) | 3,189 (72.2%) |
| Legal Services & Support | 937 (45.9%) | 1,104 (54.1%) |
| Education Instruction & Library | 8,143 (35.0%) | 15,109 (65.0%) |
| Arts, Media & Entertainment | 1,723 (48.5%) | 1,831 (51.5%) |
| Health Diagnosing & Treating | 6,813 (36.9%) | 11,640 (63.1%) |
| Health Technologists | 4,183 (35.3%) | 7,668 (64.7%) |
| Total (Category) | 49,626 (48.7%) | 52,346 (51.3%) |
| Total (Overall) | 159,645 (54.0%) | 135,884 (46.0%) |
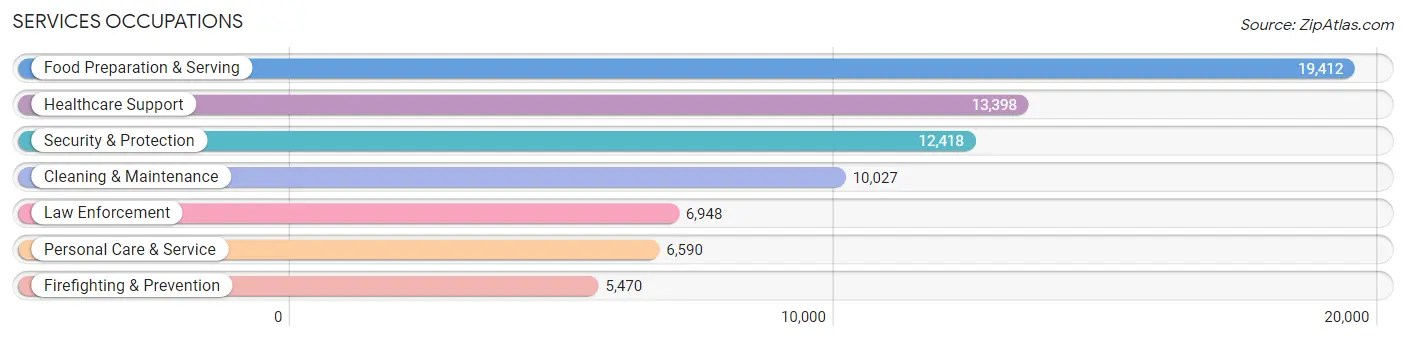
Services Occupations
The most common Services occupations in El Paso are Food Preparation & Serving (19,412 | 6.6%), Healthcare Support (13,398 | 4.5%), Security & Protection (12,418 | 4.2%), Cleaning & Maintenance (10,027 | 3.4%), and Law Enforcement (6,948 | 2.4%).
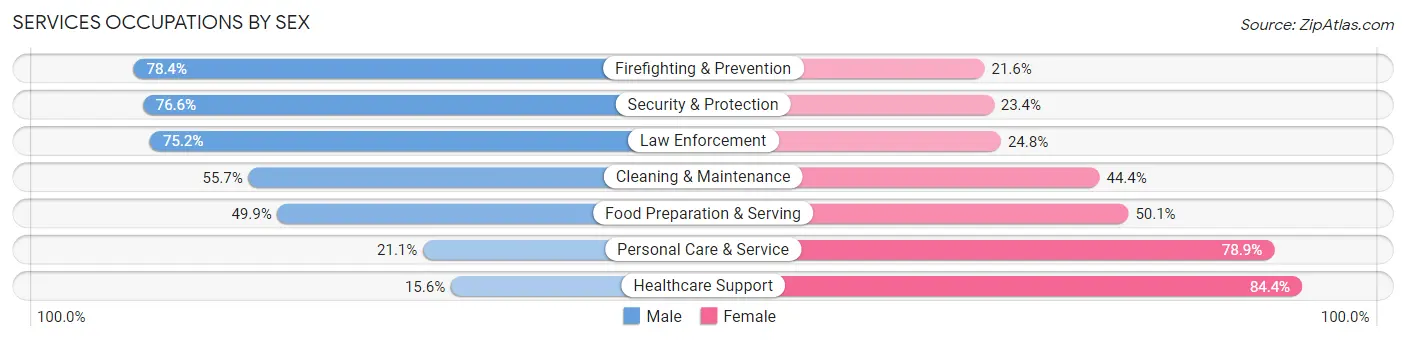
Services Occupations by Sex
Within the Services occupations in El Paso, the most male-oriented occupations are Firefighting & Prevention (78.4%), Security & Protection (76.6%), and Law Enforcement (75.2%), while the most female-oriented occupations are Healthcare Support (84.4%), Personal Care & Service (78.9%), and Food Preparation & Serving (50.1%).
| Occupation | Male | Female |
| Healthcare Support | 2,086 (15.6%) | 11,312 (84.4%) |
| Security & Protection | 9,511 (76.6%) | 2,907 (23.4%) |
| Firefighting & Prevention | 4,289 (78.4%) | 1,181 (21.6%) |
| Law Enforcement | 5,222 (75.2%) | 1,726 (24.8%) |
| Food Preparation & Serving | 9,691 (49.9%) | 9,721 (50.1%) |
| Cleaning & Maintenance | 5,580 (55.6%) | 4,447 (44.4%) |
| Personal Care & Service | 1,390 (21.1%) | 5,200 (78.9%) |
| Total (Category) | 28,258 (45.7%) | 33,587 (54.3%) |
| Total (Overall) | 159,645 (54.0%) | 135,884 (46.0%) |
Sales and Office Occupations
The most common Sales and Office occupations in El Paso are Office & Administration (37,145 | 12.6%), and Sales & Related (31,963 | 10.8%).

Sales and Office Occupations by Sex

| Occupation | Male | Female |
| Sales & Related | 16,040 (50.2%) | 15,923 (49.8%) |
| Office & Administration | 11,339 (30.5%) | 25,806 (69.5%) |
| Total (Category) | 27,379 (39.6%) | 41,729 (60.4%) |
| Total (Overall) | 159,645 (54.0%) | 135,884 (46.0%) |
Natural Resources, Construction and Maintenance Occupations
The most common Natural Resources, Construction and Maintenance occupations in El Paso are Construction & Extraction (15,403 | 5.2%), Installation, Maintenance & Repair (9,843 | 3.3%), and Farming, Fishing & Forestry (332 | 0.1%).
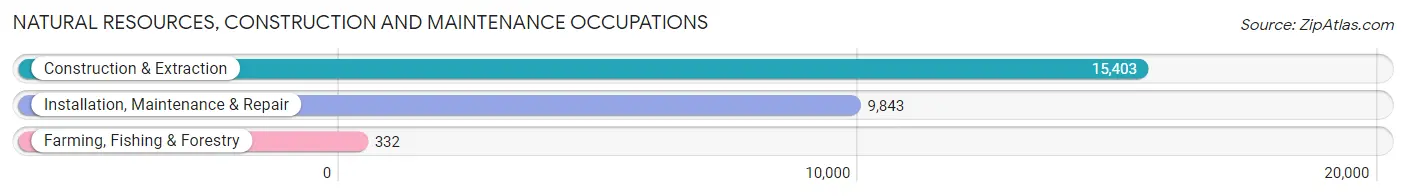
Natural Resources, Construction and Maintenance Occupations by Sex
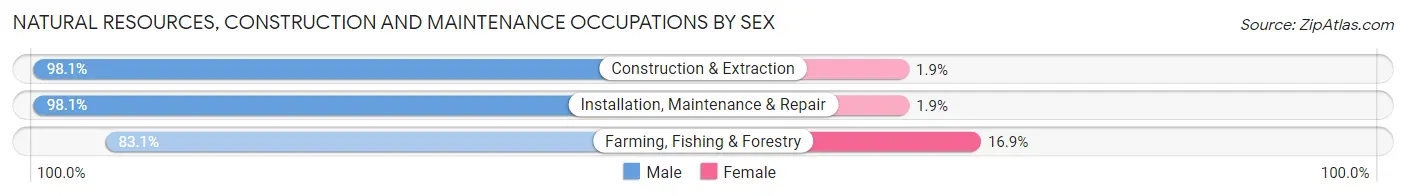
| Occupation | Male | Female |
| Farming, Fishing & Forestry | 276 (83.1%) | 56 (16.9%) |
| Construction & Extraction | 15,107 (98.1%) | 296 (1.9%) |
| Installation, Maintenance & Repair | 9,652 (98.1%) | 191 (1.9%) |
| Total (Category) | 25,035 (97.9%) | 543 (2.1%) |
| Total (Overall) | 159,645 (54.0%) | 135,884 (46.0%) |
Production, Transportation and Moving Occupations
The most common Production, Transportation and Moving occupations in El Paso are Transportation (14,613 | 4.9%), Production (11,552 | 3.9%), and Material Moving (10,861 | 3.7%).
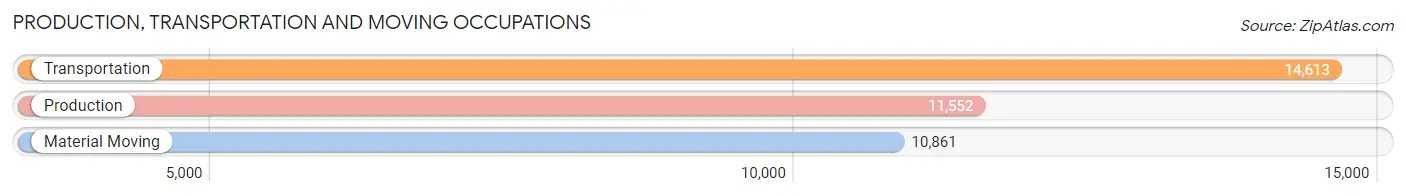
Production, Transportation and Moving Occupations by Sex
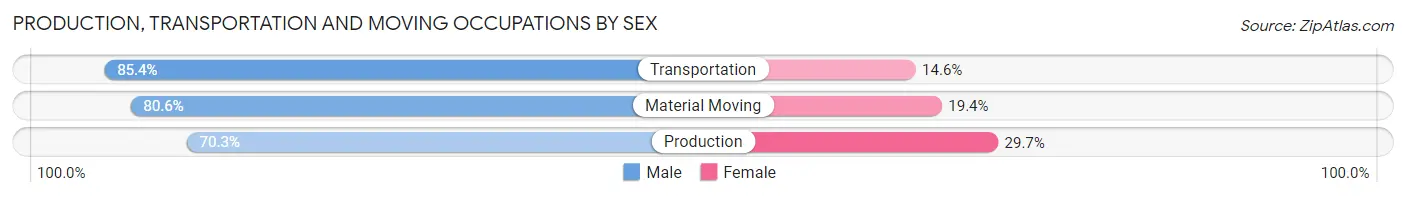
| Occupation | Male | Female |
| Production | 8,117 (70.3%) | 3,435 (29.7%) |
| Transportation | 12,478 (85.4%) | 2,135 (14.6%) |
| Material Moving | 8,752 (80.6%) | 2,109 (19.4%) |
| Total (Category) | 29,347 (79.3%) | 7,679 (20.7%) |
| Total (Overall) | 159,645 (54.0%) | 135,884 (46.0%) |
Employment Industries by Sex in El Paso
Employment Industries in El Paso
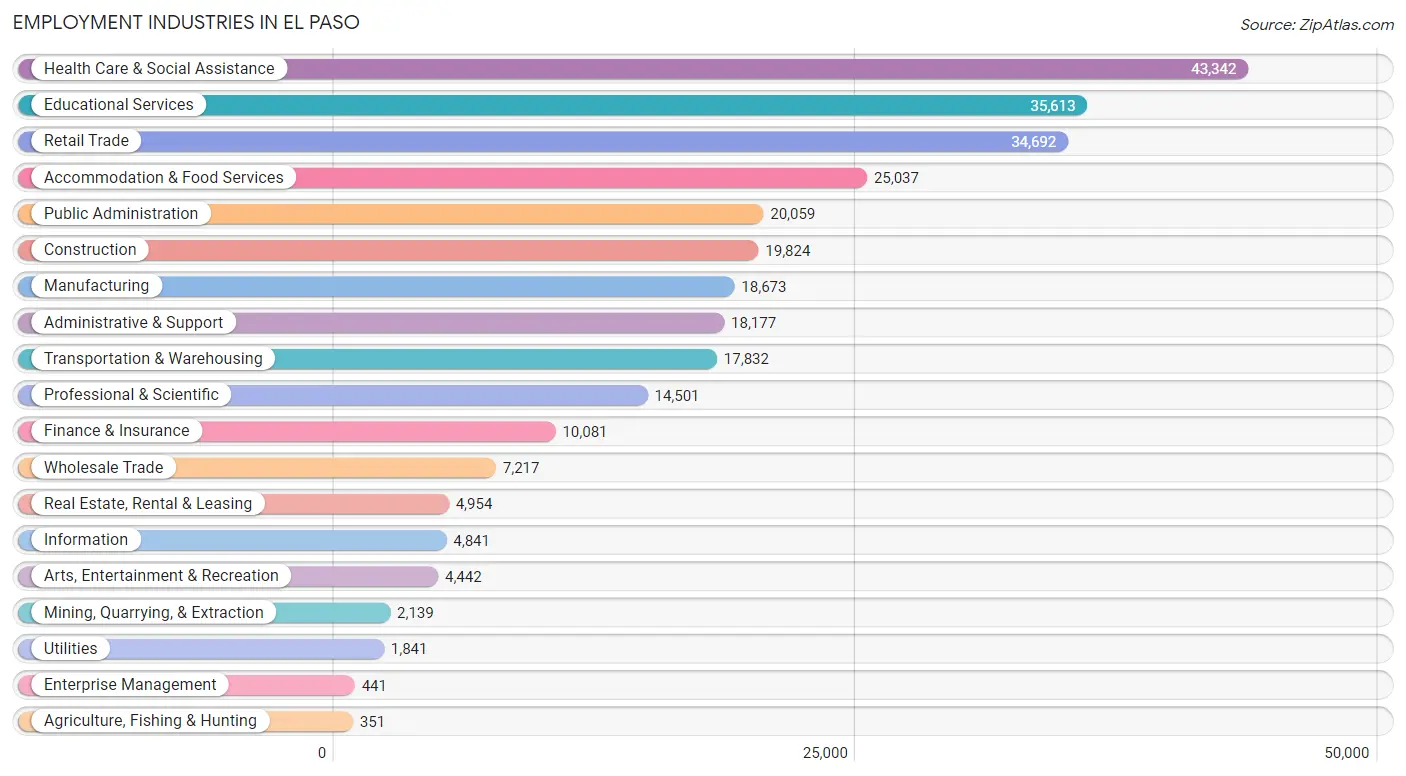
The major employment industries in El Paso include Health Care & Social Assistance (43,342 | 14.7%), Educational Services (35,613 | 12.0%), Retail Trade (34,692 | 11.7%), Accommodation & Food Services (25,037 | 8.5%), and Public Administration (20,059 | 6.8%).
Employment Industries by Sex in El Paso
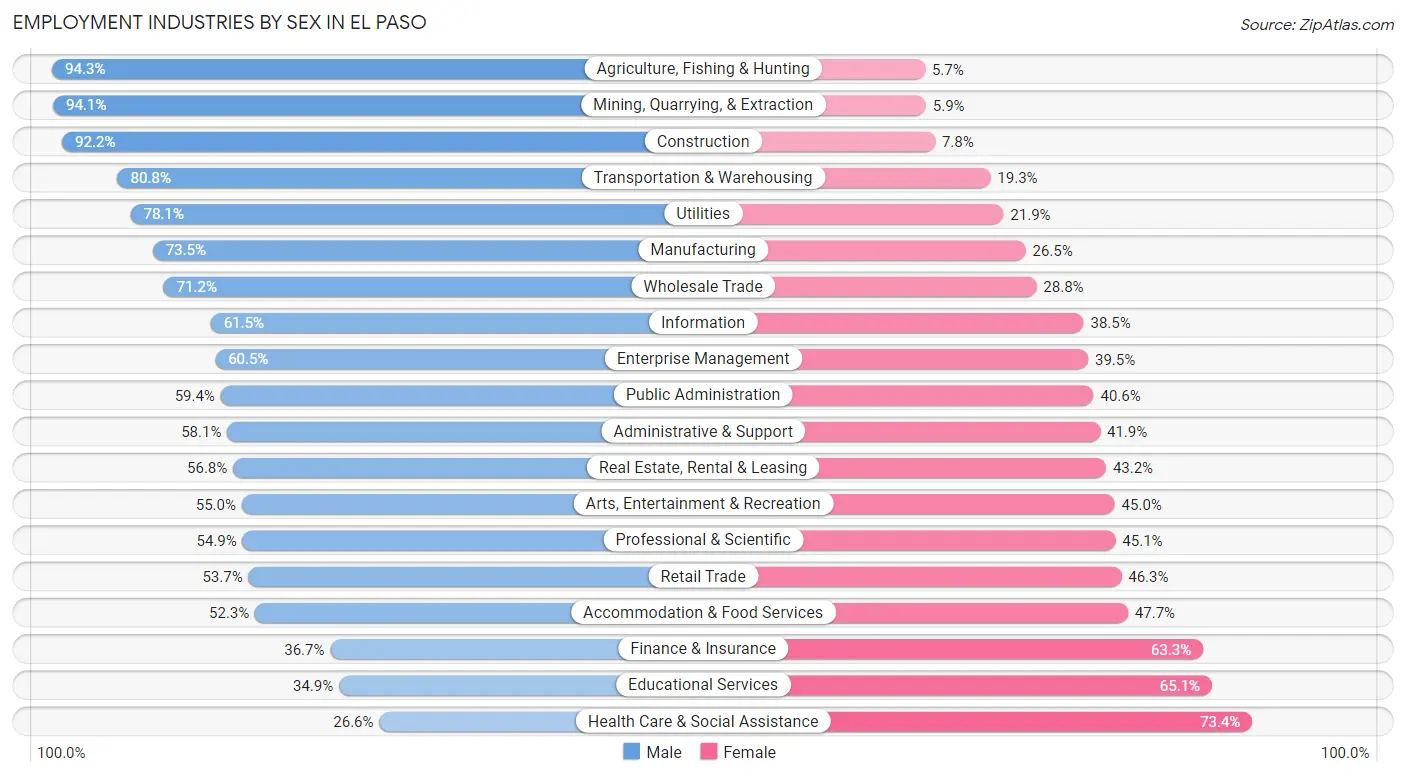
The El Paso industries that see more men than women are Agriculture, Fishing & Hunting (94.3%), Mining, Quarrying, & Extraction (94.1%), and Construction (92.2%), whereas the industries that tend to have a higher number of women are Health Care & Social Assistance (73.4%), Educational Services (65.1%), and Finance & Insurance (63.3%).
| Industry | Male | Female |
| Agriculture, Fishing & Hunting | 331 (94.3%) | 20 (5.7%) |
| Mining, Quarrying, & Extraction | 2,013 (94.1%) | 126 (5.9%) |
| Construction | 18,283 (92.2%) | 1,541 (7.8%) |
| Manufacturing | 13,720 (73.5%) | 4,953 (26.5%) |
| Wholesale Trade | 5,141 (71.2%) | 2,076 (28.8%) |
| Retail Trade | 18,616 (53.7%) | 16,076 (46.3%) |
| Transportation & Warehousing | 14,400 (80.7%) | 3,432 (19.3%) |
| Utilities | 1,437 (78.1%) | 404 (21.9%) |
| Information | 2,976 (61.5%) | 1,865 (38.5%) |
| Finance & Insurance | 3,703 (36.7%) | 6,378 (63.3%) |
| Real Estate, Rental & Leasing | 2,816 (56.8%) | 2,138 (43.2%) |
| Professional & Scientific | 7,958 (54.9%) | 6,543 (45.1%) |
| Enterprise Management | 267 (60.5%) | 174 (39.5%) |
| Administrative & Support | 10,553 (58.1%) | 7,624 (41.9%) |
| Educational Services | 12,434 (34.9%) | 23,179 (65.1%) |
| Health Care & Social Assistance | 11,518 (26.6%) | 31,824 (73.4%) |
| Arts, Entertainment & Recreation | 2,445 (55.0%) | 1,997 (45.0%) |
| Accommodation & Food Services | 13,093 (52.3%) | 11,944 (47.7%) |
| Public Administration | 11,917 (59.4%) | 8,142 (40.6%) |
| Total | 159,645 (54.0%) | 135,884 (46.0%) |
Education in El Paso
School Enrollment in El Paso
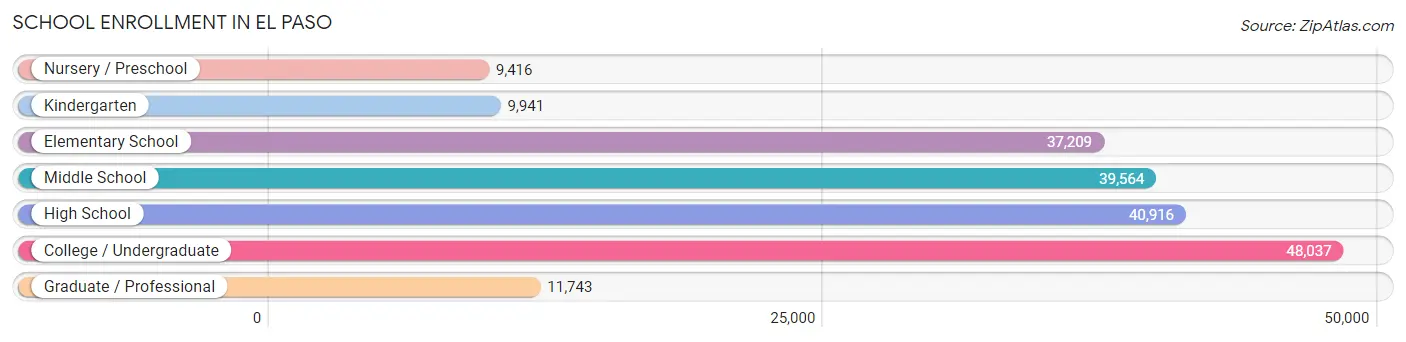
The most common levels of schooling among the 196,826 students in El Paso are college / undergraduate (48,037 | 24.4%), high school (40,916 | 20.8%), and middle school (39,564 | 20.1%).
| School Level | # Students | % Students |
| Nursery / Preschool | 9,416 | 4.8% |
| Kindergarten | 9,941 | 5.1% |
| Elementary School | 37,209 | 18.9% |
| Middle School | 39,564 | 20.1% |
| High School | 40,916 | 20.8% |
| College / Undergraduate | 48,037 | 24.4% |
| Graduate / Professional | 11,743 | 6.0% |
| Total | 196,826 | 100.0% |
School Enrollment by Age by Funding Source in El Paso
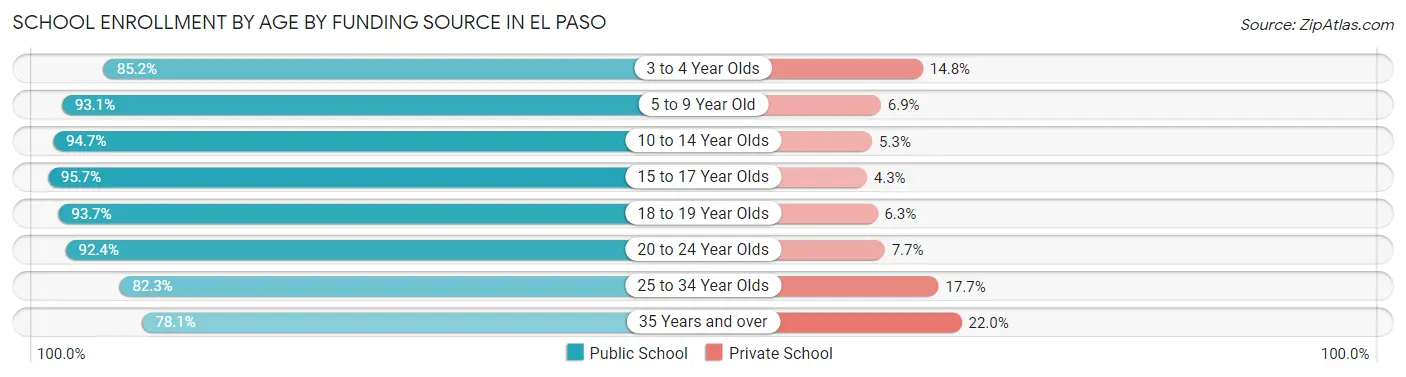
Out of a total of 196,826 students who are enrolled in schools in El Paso, 16,337 (8.3%) attend a private institution, while the remaining 180,489 (91.7%) are enrolled in public schools. The age group of 35 years and over has the highest likelihood of being enrolled in private schools, with 2,779 (22.0% in the age bracket) enrolled. Conversely, the age group of 15 to 17 year olds has the lowest likelihood of being enrolled in a private school, with 27,687 (95.7% in the age bracket) attending a public institution.
| Age Bracket | Public School | Private School |
| 3 to 4 Year Olds | 6,220 (85.2%) | 1,077 (14.8%) |
| 5 to 9 Year Old | 40,893 (93.1%) | 3,047 (6.9%) |
| 10 to 14 Year Olds | 47,588 (94.7%) | 2,670 (5.3%) |
| 15 to 17 Year Olds | 27,687 (95.7%) | 1,249 (4.3%) |
| 18 to 19 Year Olds | 13,782 (93.7%) | 926 (6.3%) |
| 20 to 24 Year Olds | 21,409 (92.3%) | 1,773 (7.6%) |
| 25 to 34 Year Olds | 13,043 (82.3%) | 2,800 (17.7%) |
| 35 Years and over | 9,883 (78.0%) | 2,779 (22.0%) |
| Total | 180,489 (91.7%) | 16,337 (8.3%) |
Educational Attainment by Field of Study in El Paso
Business (26,435 | 21.5%), education (17,135 | 13.9%), science & technology (14,433 | 11.7%), arts & humanities (11,954 | 9.7%), and engineering (9,397 | 7.6%) are the most common fields of study among 123,186 individuals in El Paso who have obtained a bachelor's degree or higher.
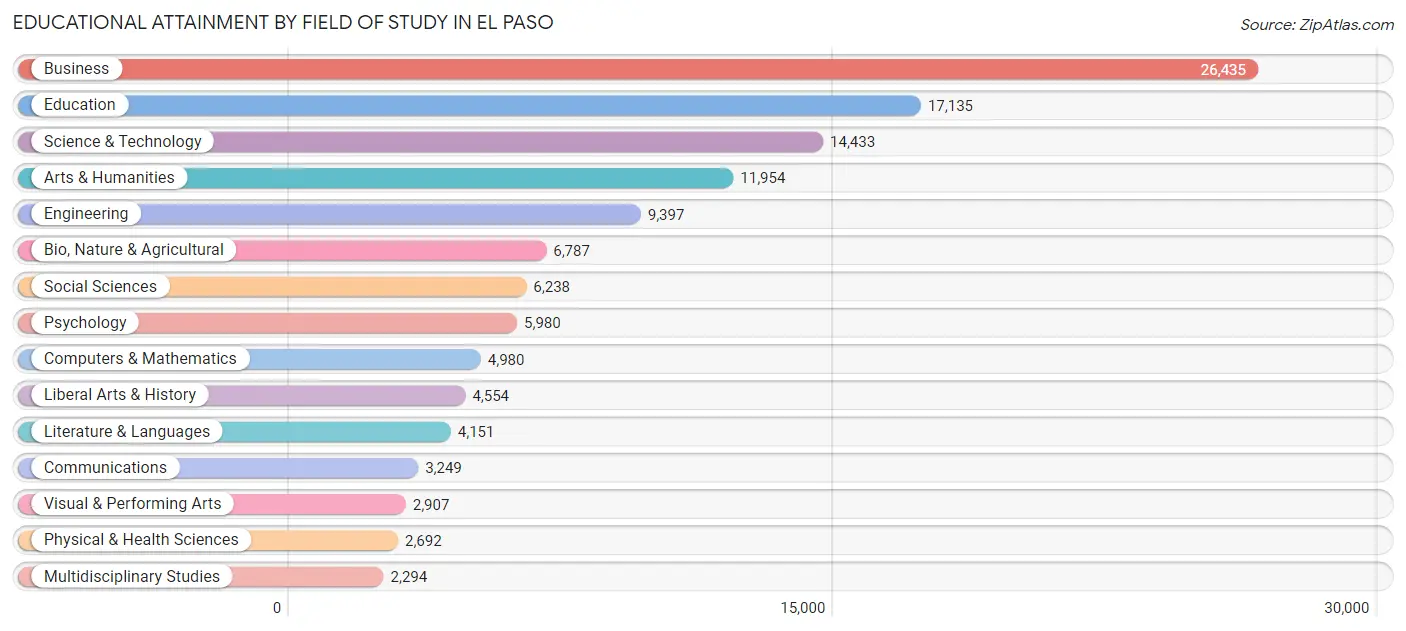
| Field of Study | # Graduates | % Graduates |
| Computers & Mathematics | 4,980 | 4.0% |
| Bio, Nature & Agricultural | 6,787 | 5.5% |
| Physical & Health Sciences | 2,692 | 2.2% |
| Psychology | 5,980 | 4.9% |
| Social Sciences | 6,238 | 5.1% |
| Engineering | 9,397 | 7.6% |
| Multidisciplinary Studies | 2,294 | 1.9% |
| Science & Technology | 14,433 | 11.7% |
| Business | 26,435 | 21.5% |
| Education | 17,135 | 13.9% |
| Literature & Languages | 4,151 | 3.4% |
| Liberal Arts & History | 4,554 | 3.7% |
| Visual & Performing Arts | 2,907 | 2.4% |
| Communications | 3,249 | 2.6% |
| Arts & Humanities | 11,954 | 9.7% |
| Total | 123,186 | 100.0% |
Transportation & Commute in El Paso
Vehicle Availability by Sex in El Paso
The most prevalent vehicle ownership categories in El Paso are males with 2 vehicles (66,394, accounting for 40.0%) and females with 2 vehicles (50,439, making up 49.7%).
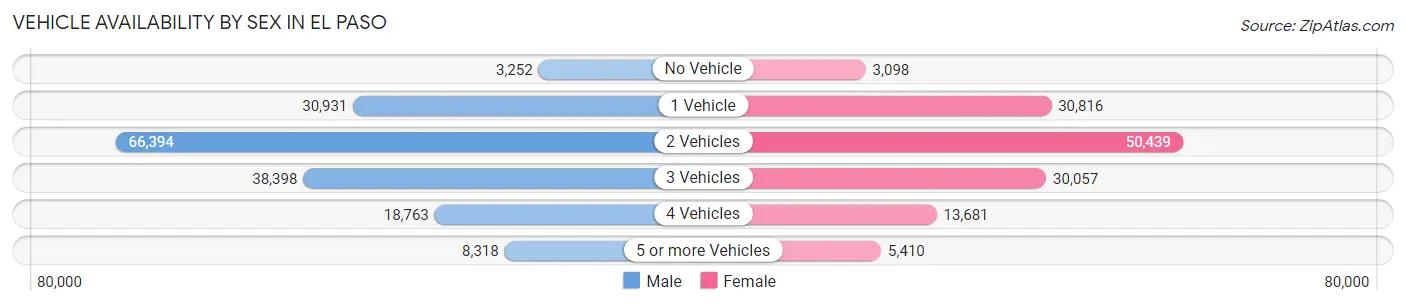
| Vehicles Available | Male | Female |
| No Vehicle | 3,252 (2.0%) | 3,098 (2.3%) |
| 1 Vehicle | 30,931 (18.6%) | 30,816 (23.1%) |
| 2 Vehicles | 66,394 (40.0%) | 50,439 (37.8%) |
| 3 Vehicles | 38,398 (23.1%) | 30,057 (22.5%) |
| 4 Vehicles | 18,763 (11.3%) | 13,681 (10.2%) |
| 5 or more Vehicles | 8,318 (5.0%) | 5,410 (4.1%) |
| Total | 166,056 (100.0%) | 133,501 (100.0%) |
Commute Time in El Paso
The most frequently occuring commute durations in El Paso are 20 to 24 minutes (54,466 commuters, 19.5%), 15 to 19 minutes (53,417 commuters, 19.1%), and 30 to 34 minutes (41,906 commuters, 15.0%).
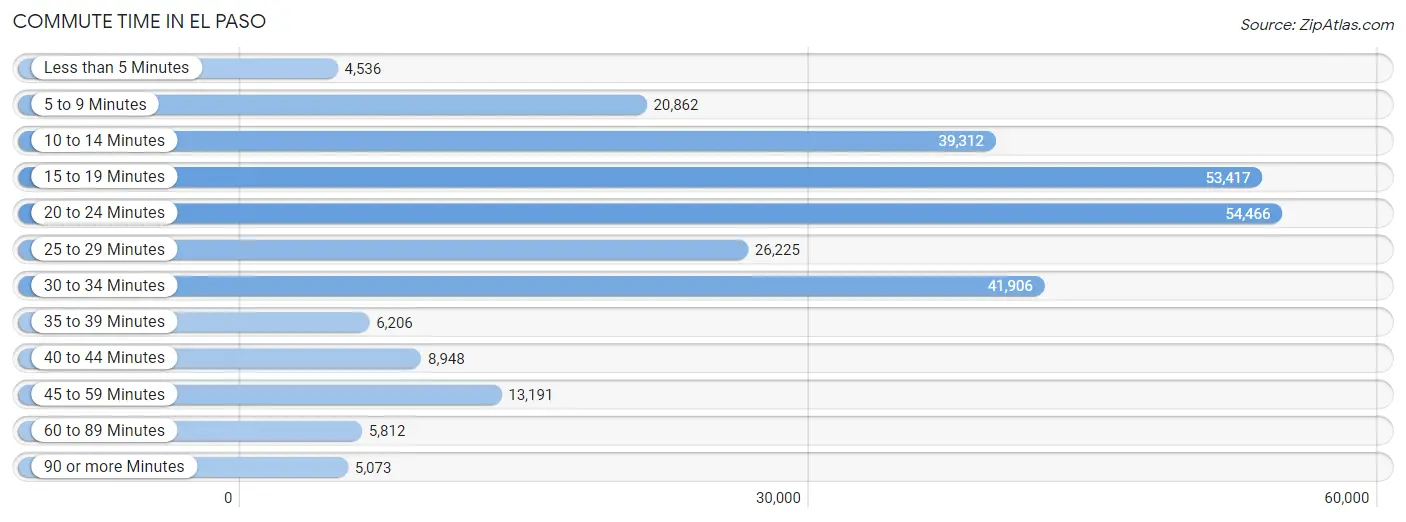
| Commute Time | # Commuters | % Commuters |
| Less than 5 Minutes | 4,536 | 1.6% |
| 5 to 9 Minutes | 20,862 | 7.4% |
| 10 to 14 Minutes | 39,312 | 14.0% |
| 15 to 19 Minutes | 53,417 | 19.1% |
| 20 to 24 Minutes | 54,466 | 19.5% |
| 25 to 29 Minutes | 26,225 | 9.4% |
| 30 to 34 Minutes | 41,906 | 15.0% |
| 35 to 39 Minutes | 6,206 | 2.2% |
| 40 to 44 Minutes | 8,948 | 3.2% |
| 45 to 59 Minutes | 13,191 | 4.7% |
| 60 to 89 Minutes | 5,812 | 2.1% |
| 90 or more Minutes | 5,073 | 1.8% |
Commute Time by Sex in El Paso
The most common commute times in El Paso are 20 to 24 minutes (31,506 commuters, 20.1%) for males and 15 to 19 minutes (23,840 commuters, 19.4%) for females.
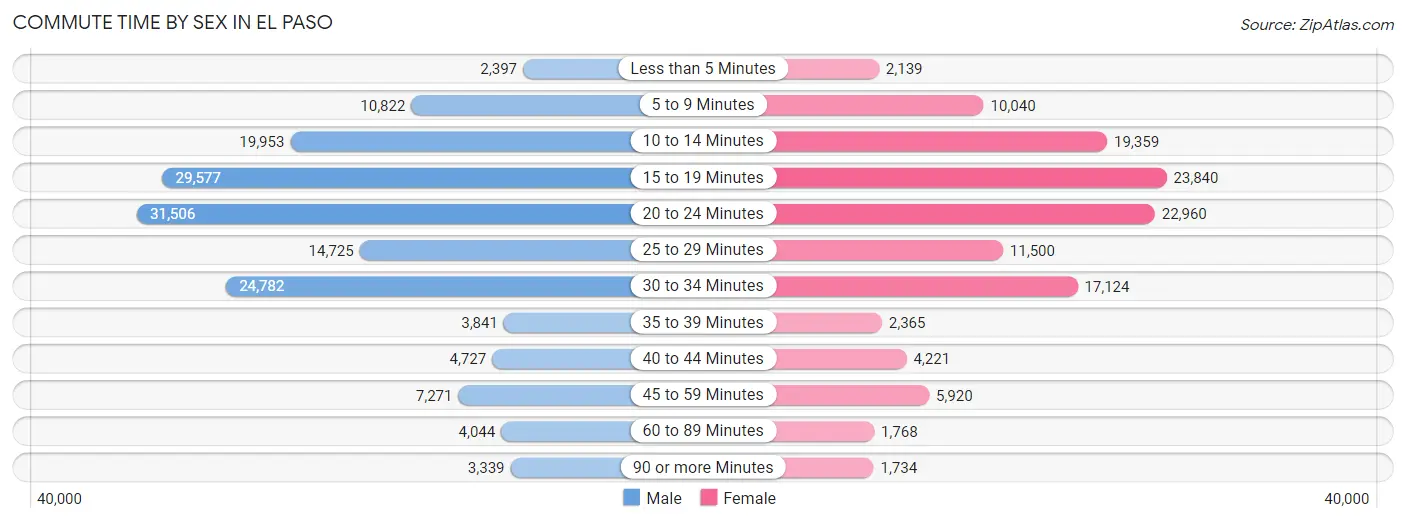
| Commute Time | Male | Female |
| Less than 5 Minutes | 2,397 (1.5%) | 2,139 (1.7%) |
| 5 to 9 Minutes | 10,822 (6.9%) | 10,040 (8.2%) |
| 10 to 14 Minutes | 19,953 (12.7%) | 19,359 (15.7%) |
| 15 to 19 Minutes | 29,577 (18.8%) | 23,840 (19.4%) |
| 20 to 24 Minutes | 31,506 (20.1%) | 22,960 (18.7%) |
| 25 to 29 Minutes | 14,725 (9.4%) | 11,500 (9.3%) |
| 30 to 34 Minutes | 24,782 (15.8%) | 17,124 (13.9%) |
| 35 to 39 Minutes | 3,841 (2.5%) | 2,365 (1.9%) |
| 40 to 44 Minutes | 4,727 (3.0%) | 4,221 (3.4%) |
| 45 to 59 Minutes | 7,271 (4.6%) | 5,920 (4.8%) |
| 60 to 89 Minutes | 4,044 (2.6%) | 1,768 (1.4%) |
| 90 or more Minutes | 3,339 (2.1%) | 1,734 (1.4%) |
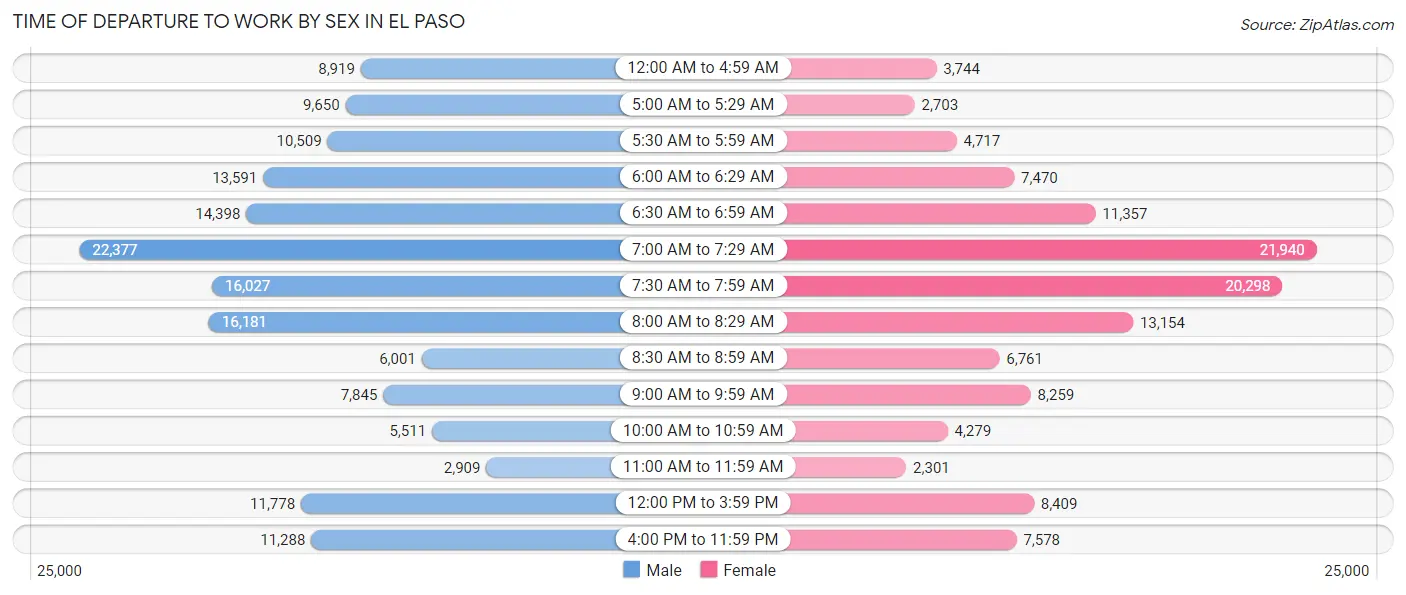
Time of Departure to Work by Sex in El Paso
The most frequent times of departure to work in El Paso are 7:00 AM to 7:29 AM (22,377, 14.2%) for males and 7:00 AM to 7:29 AM (21,940, 17.8%) for females.
| Time of Departure | Male | Female |
| 12:00 AM to 4:59 AM | 8,919 (5.7%) | 3,744 (3.0%) |
| 5:00 AM to 5:29 AM | 9,650 (6.1%) | 2,703 (2.2%) |
| 5:30 AM to 5:59 AM | 10,509 (6.7%) | 4,717 (3.8%) |
| 6:00 AM to 6:29 AM | 13,591 (8.7%) | 7,470 (6.1%) |
| 6:30 AM to 6:59 AM | 14,398 (9.2%) | 11,357 (9.2%) |
| 7:00 AM to 7:29 AM | 22,377 (14.2%) | 21,940 (17.8%) |
| 7:30 AM to 7:59 AM | 16,027 (10.2%) | 20,298 (16.5%) |
| 8:00 AM to 8:29 AM | 16,181 (10.3%) | 13,154 (10.7%) |
| 8:30 AM to 8:59 AM | 6,001 (3.8%) | 6,761 (5.5%) |
| 9:00 AM to 9:59 AM | 7,845 (5.0%) | 8,259 (6.7%) |
| 10:00 AM to 10:59 AM | 5,511 (3.5%) | 4,279 (3.5%) |
| 11:00 AM to 11:59 AM | 2,909 (1.8%) | 2,301 (1.9%) |
| 12:00 PM to 3:59 PM | 11,778 (7.5%) | 8,409 (6.8%) |
| 4:00 PM to 11:59 PM | 11,288 (7.2%) | 7,578 (6.2%) |
| Total | 156,984 (100.0%) | 122,970 (100.0%) |
Housing Occupancy in El Paso
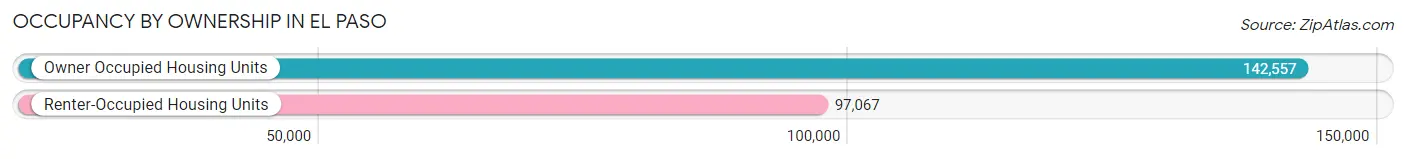
Occupancy by Ownership in El Paso
Of the total 239,624 dwellings in El Paso, owner-occupied units account for 142,557 (59.5%), while renter-occupied units make up 97,067 (40.5%).
| Occupancy | # Housing Units | % Housing Units |
| Owner Occupied Housing Units | 142,557 | 59.5% |
| Renter-Occupied Housing Units | 97,067 | 40.5% |
| Total Occupied Housing Units | 239,624 | 100.0% |
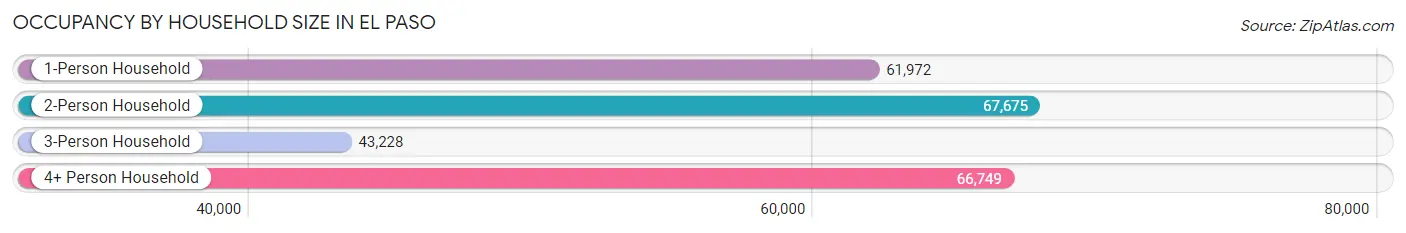
Occupancy by Household Size in El Paso
| Household Size | # Housing Units | % Housing Units |
| 1-Person Household | 61,972 | 25.9% |
| 2-Person Household | 67,675 | 28.2% |
| 3-Person Household | 43,228 | 18.0% |
| 4+ Person Household | 66,749 | 27.9% |
| Total Housing Units | 239,624 | 100.0% |
Occupancy by Ownership by Household Size in El Paso
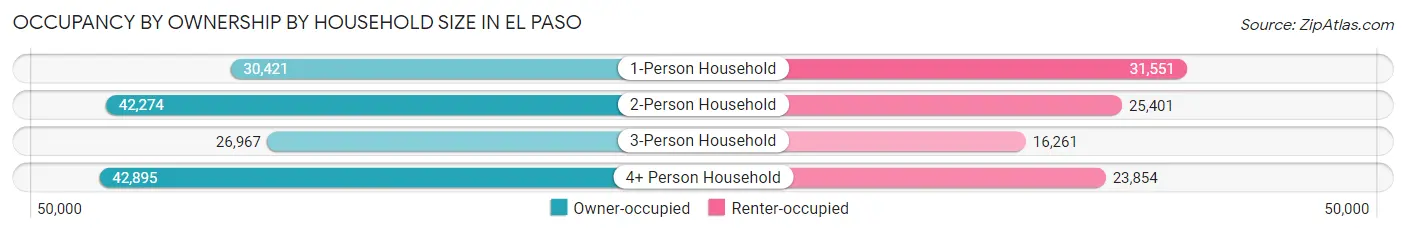
| Household Size | Owner-occupied | Renter-occupied |
| 1-Person Household | 30,421 (49.1%) | 31,551 (50.9%) |
| 2-Person Household | 42,274 (62.5%) | 25,401 (37.5%) |
| 3-Person Household | 26,967 (62.4%) | 16,261 (37.6%) |
| 4+ Person Household | 42,895 (64.3%) | 23,854 (35.7%) |
| Total Housing Units | 142,557 (59.5%) | 97,067 (40.5%) |
Occupancy by Educational Attainment in El Paso
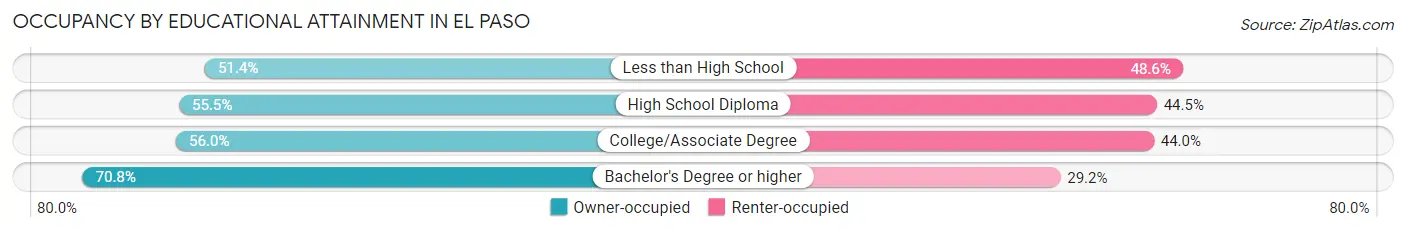
| Household Size | Owner-occupied | Renter-occupied |
| Less than High School | 20,563 (51.4%) | 19,458 (48.6%) |
| High School Diploma | 27,851 (55.5%) | 22,330 (44.5%) |
| College/Associate Degree | 43,948 (56.0%) | 34,568 (44.0%) |
| Bachelor's Degree or higher | 50,195 (70.8%) | 20,711 (29.2%) |
Occupancy by Age of Householder in El Paso
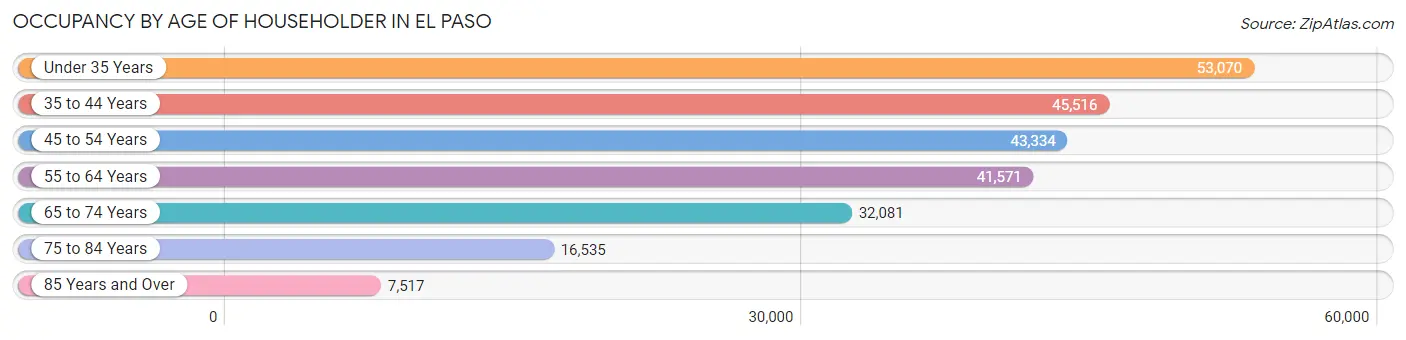
| Age Bracket | # Households | % Households |
| Under 35 Years | 53,070 | 22.2% |
| 35 to 44 Years | 45,516 | 19.0% |
| 45 to 54 Years | 43,334 | 18.1% |
| 55 to 64 Years | 41,571 | 17.3% |
| 65 to 74 Years | 32,081 | 13.4% |
| 75 to 84 Years | 16,535 | 6.9% |
| 85 Years and Over | 7,517 | 3.1% |
| Total | 239,624 | 100.0% |
Housing Finances in El Paso
Median Income by Occupancy in El Paso
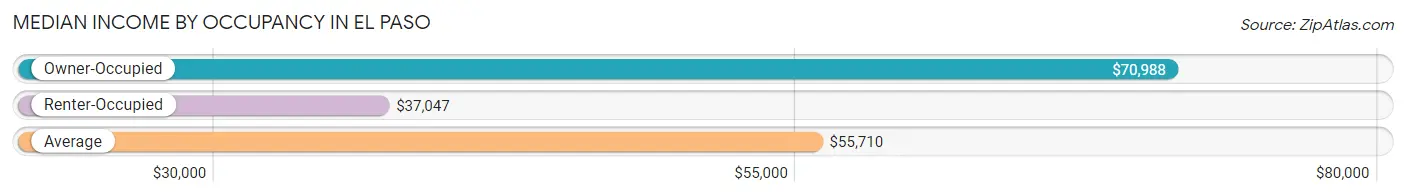
| Occupancy Type | # Households | Median Income |
| Owner-Occupied | 142,557 (59.5%) | $70,988 |
| Renter-Occupied | 97,067 (40.5%) | $37,047 |
| Average | 239,624 (100.0%) | $55,710 |
Occupancy by Householder Income Bracket in El Paso
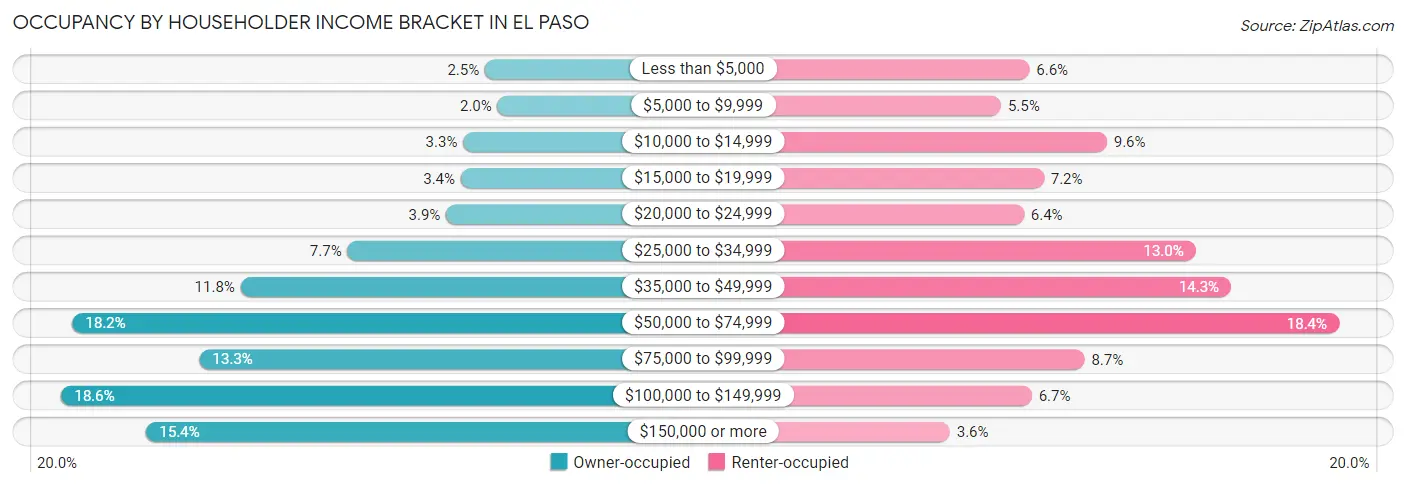
| Income Bracket | Owner-occupied | Renter-occupied |
| Less than $5,000 | 3,514 (2.5%) | 6,426 (6.6%) |
| $5,000 to $9,999 | 2,818 (2.0%) | 5,377 (5.5%) |
| $10,000 to $14,999 | 4,687 (3.3%) | 9,293 (9.6%) |
| $15,000 to $19,999 | 4,817 (3.4%) | 6,963 (7.2%) |
| $20,000 to $24,999 | 5,616 (3.9%) | 6,223 (6.4%) |
| $25,000 to $34,999 | 10,973 (7.7%) | 12,569 (13.0%) |
| $35,000 to $49,999 | 16,786 (11.8%) | 13,882 (14.3%) |
| $50,000 to $74,999 | 25,918 (18.2%) | 17,870 (18.4%) |
| $75,000 to $99,999 | 19,013 (13.3%) | 8,467 (8.7%) |
| $100,000 to $149,999 | 26,517 (18.6%) | 6,513 (6.7%) |
| $150,000 or more | 21,898 (15.4%) | 3,484 (3.6%) |
| Total | 142,557 (100.0%) | 97,067 (100.0%) |
Monthly Housing Cost Tiers in El Paso
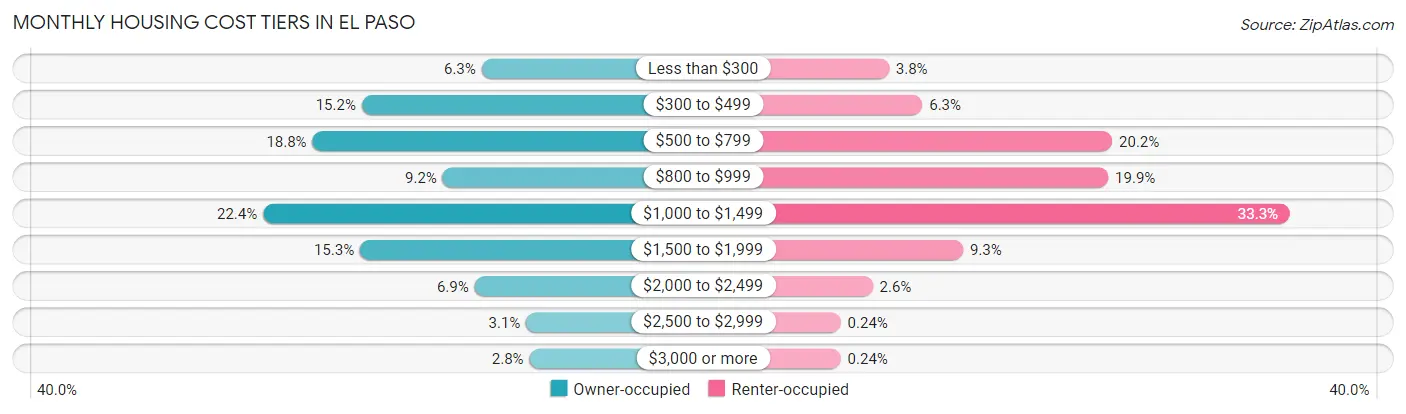
| Monthly Cost | Owner-occupied | Renter-occupied |
| Less than $300 | 9,041 (6.3%) | 3,678 (3.8%) |
| $300 to $499 | 21,628 (15.2%) | 6,071 (6.2%) |
| $500 to $799 | 26,794 (18.8%) | 19,640 (20.2%) |
| $800 to $999 | 13,129 (9.2%) | 19,355 (19.9%) |
| $1,000 to $1,499 | 31,990 (22.4%) | 32,347 (33.3%) |
| $1,500 to $1,999 | 21,814 (15.3%) | 8,976 (9.2%) |
| $2,000 to $2,499 | 9,777 (6.9%) | 2,515 (2.6%) |
| $2,500 to $2,999 | 4,364 (3.1%) | 229 (0.2%) |
| $3,000 or more | 4,020 (2.8%) | 235 (0.2%) |
| Total | 142,557 (100.0%) | 97,067 (100.0%) |
Physical Housing Characteristics in El Paso
Housing Structures in El Paso
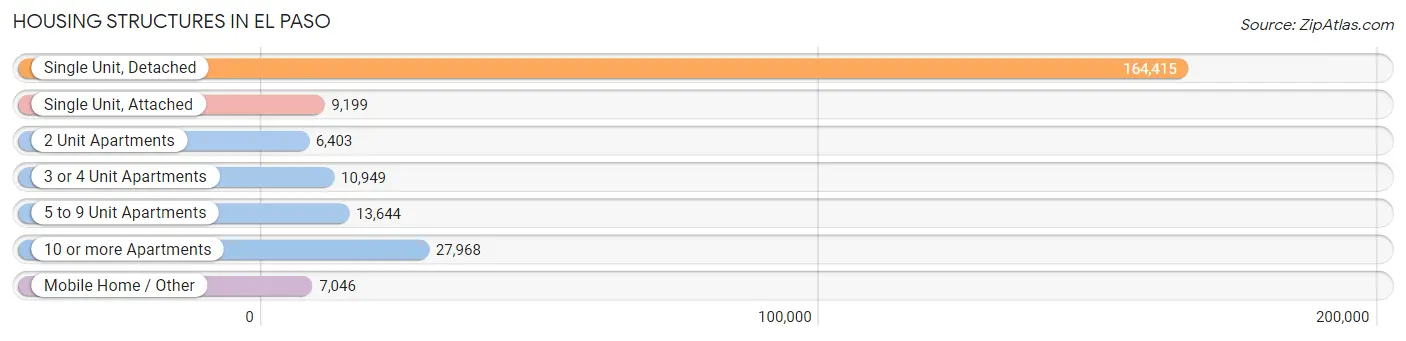
| Structure Type | # Housing Units | % Housing Units |
| Single Unit, Detached | 164,415 | 68.6% |
| Single Unit, Attached | 9,199 | 3.8% |
| 2 Unit Apartments | 6,403 | 2.7% |
| 3 or 4 Unit Apartments | 10,949 | 4.6% |
| 5 to 9 Unit Apartments | 13,644 | 5.7% |
| 10 or more Apartments | 27,968 | 11.7% |
| Mobile Home / Other | 7,046 | 2.9% |
| Total | 239,624 | 100.0% |
Housing Structures by Occupancy in El Paso
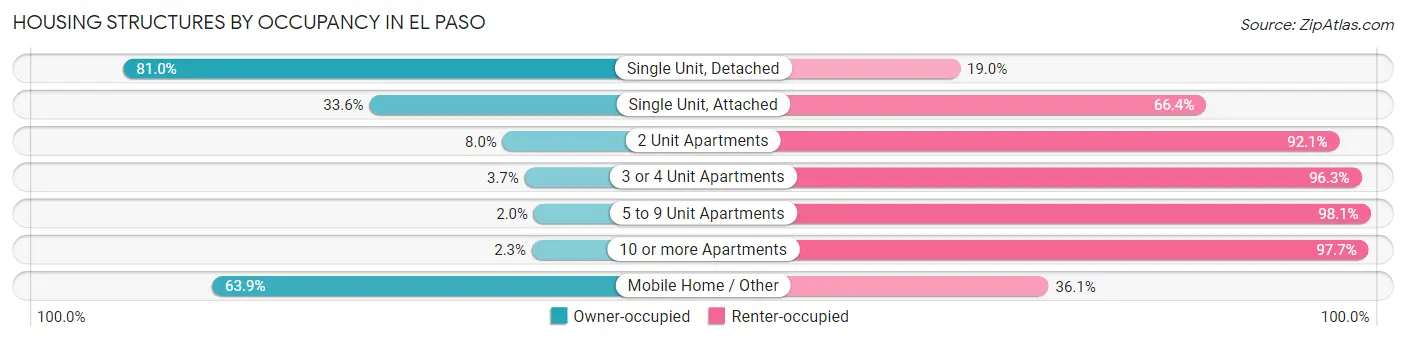
| Structure Type | Owner-occupied | Renter-occupied |
| Single Unit, Detached | 133,128 (81.0%) | 31,287 (19.0%) |
| Single Unit, Attached | 3,092 (33.6%) | 6,107 (66.4%) |
| 2 Unit Apartments | 509 (8.0%) | 5,894 (92.0%) |
| 3 or 4 Unit Apartments | 408 (3.7%) | 10,541 (96.3%) |
| 5 to 9 Unit Apartments | 266 (1.9%) | 13,378 (98.1%) |
| 10 or more Apartments | 651 (2.3%) | 27,317 (97.7%) |
| Mobile Home / Other | 4,503 (63.9%) | 2,543 (36.1%) |
| Total | 142,557 (59.5%) | 97,067 (40.5%) |
Housing Structures by Number of Rooms in El Paso
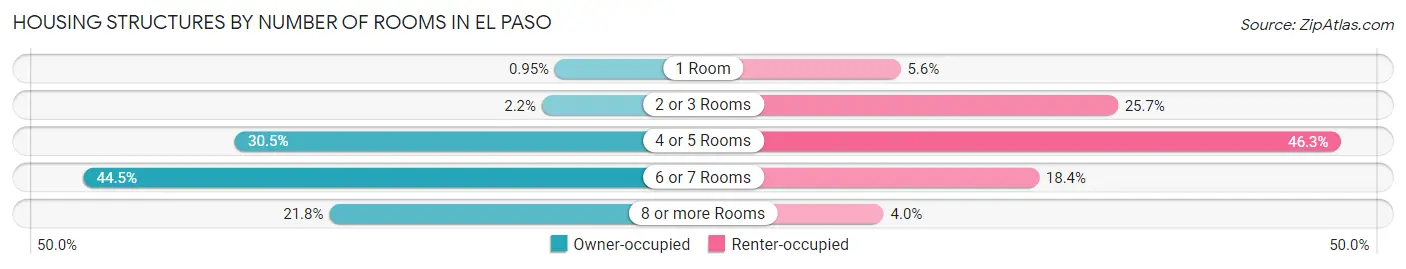
| Number of Rooms | Owner-occupied | Renter-occupied |
| 1 Room | 1,359 (0.9%) | 5,434 (5.6%) |
| 2 or 3 Rooms | 3,073 (2.2%) | 24,932 (25.7%) |
| 4 or 5 Rooms | 43,525 (30.5%) | 44,915 (46.3%) |
| 6 or 7 Rooms | 63,499 (44.5%) | 17,861 (18.4%) |
| 8 or more Rooms | 31,101 (21.8%) | 3,925 (4.0%) |
| Total | 142,557 (100.0%) | 97,067 (100.0%) |
Housing Structure by Heating Type in El Paso
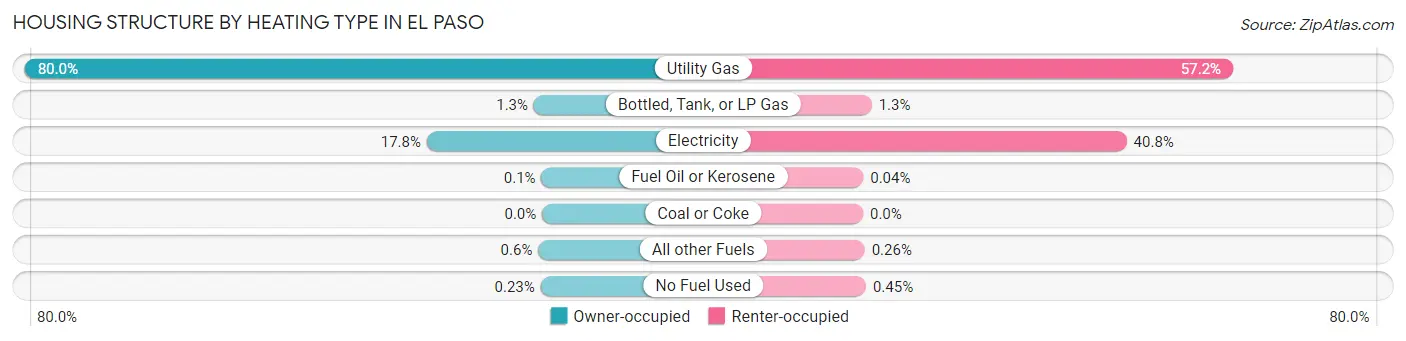
| Heating Type | Owner-occupied | Renter-occupied |
| Utility Gas | 114,002 (80.0%) | 55,489 (57.2%) |
| Bottled, Tank, or LP Gas | 1,808 (1.3%) | 1,305 (1.3%) |
| Electricity | 25,418 (17.8%) | 39,553 (40.7%) |
| Fuel Oil or Kerosene | 137 (0.1%) | 37 (0.0%) |
| Coal or Coke | 7 (0.0%) | 0 (0.0%) |
| All other Fuels | 862 (0.6%) | 250 (0.3%) |
| No Fuel Used | 323 (0.2%) | 433 (0.4%) |
| Total | 142,557 (100.0%) | 97,067 (100.0%) |
Household Vehicle Usage in El Paso
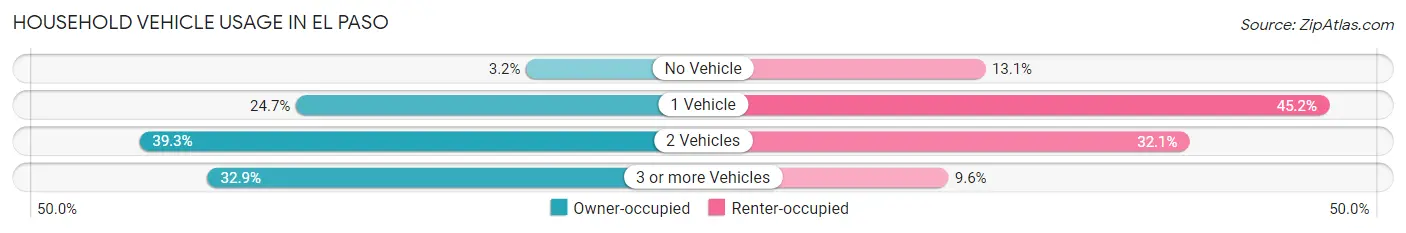
| Vehicles per Household | Owner-occupied | Renter-occupied |
| No Vehicle | 4,503 (3.2%) | 12,690 (13.1%) |
| 1 Vehicle | 35,135 (24.6%) | 43,848 (45.2%) |
| 2 Vehicles | 56,005 (39.3%) | 31,200 (32.1%) |
| 3 or more Vehicles | 46,914 (32.9%) | 9,329 (9.6%) |
| Total | 142,557 (100.0%) | 97,067 (100.0%) |
Real Estate & Mortgages in El Paso
Real Estate and Mortgage Overview in El Paso
| Characteristic | Without Mortgage | With Mortgage |
| Housing Units | 63,917 | 78,640 |
| Median Property Value | $140,100 | $173,300 |
| Median Household Income | $57,276 | $14,463 |
| Monthly Housing Costs | $519 | $3,875 |
| Real Estate Taxes | $2,749 | $3,815 |
Property Value by Mortgage Status in El Paso
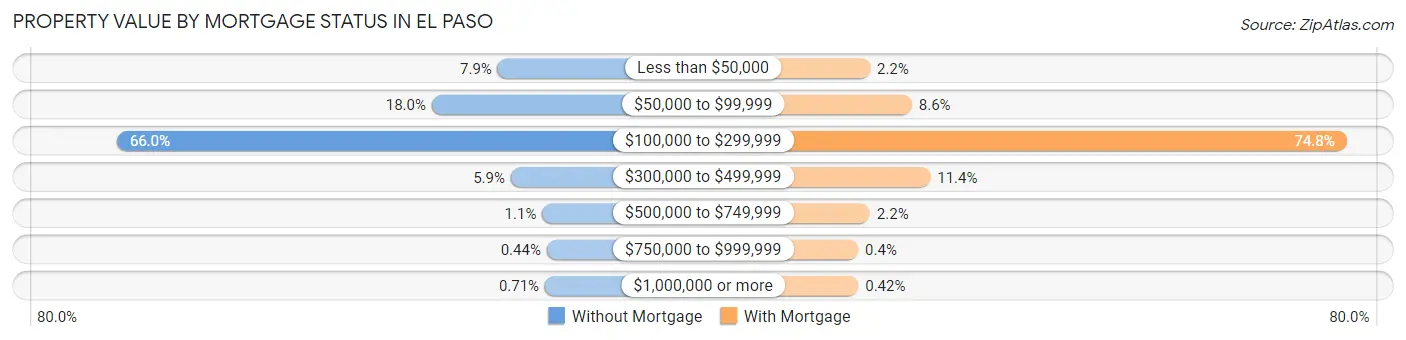
| Property Value | Without Mortgage | With Mortgage |
| Less than $50,000 | 5,059 (7.9%) | 1,735 (2.2%) |
| $50,000 to $99,999 | 11,475 (17.9%) | 6,751 (8.6%) |
| $100,000 to $299,999 | 42,154 (65.9%) | 58,834 (74.8%) |
| $300,000 to $499,999 | 3,778 (5.9%) | 8,957 (11.4%) |
| $500,000 to $749,999 | 717 (1.1%) | 1,719 (2.2%) |
| $750,000 to $999,999 | 281 (0.4%) | 313 (0.4%) |
| $1,000,000 or more | 453 (0.7%) | 331 (0.4%) |
| Total | 63,917 (100.0%) | 78,640 (100.0%) |
Household Income by Mortgage Status in El Paso
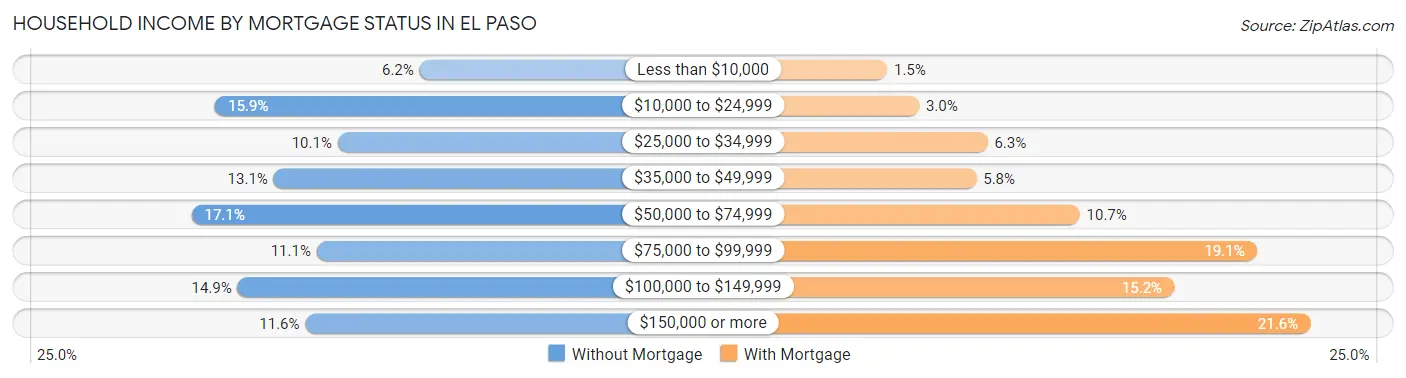
| Household Income | Without Mortgage | With Mortgage |
| Less than $10,000 | 3,959 (6.2%) | 1,178 (1.5%) |
| $10,000 to $24,999 | 10,183 (15.9%) | 2,373 (3.0%) |
| $25,000 to $34,999 | 6,450 (10.1%) | 4,937 (6.3%) |
| $35,000 to $49,999 | 8,399 (13.1%) | 4,523 (5.8%) |
| $50,000 to $74,999 | 10,899 (17.1%) | 8,387 (10.7%) |
| $75,000 to $99,999 | 7,091 (11.1%) | 15,019 (19.1%) |
| $100,000 to $149,999 | 9,501 (14.9%) | 11,922 (15.2%) |
| $150,000 or more | 7,435 (11.6%) | 17,016 (21.6%) |
| Total | 63,917 (100.0%) | 78,640 (100.0%) |
Property Value to Household Income Ratio in El Paso
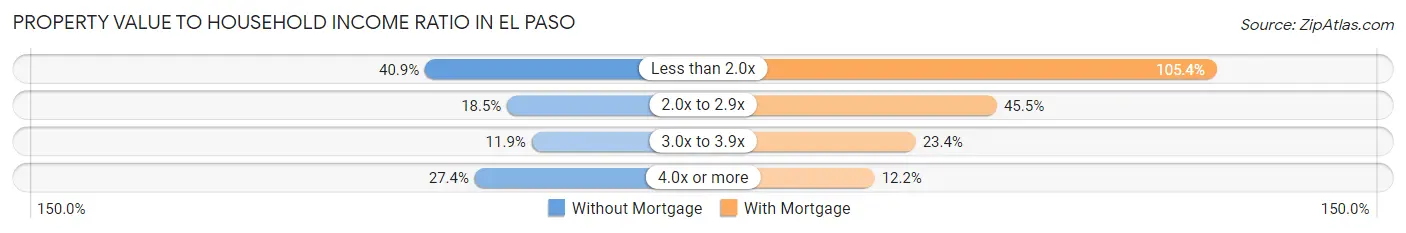
| Value-to-Income Ratio | Without Mortgage | With Mortgage |
| Less than 2.0x | 26,145 (40.9%) | 82,878 (105.4%) |
| 2.0x to 2.9x | 11,841 (18.5%) | 35,786 (45.5%) |
| 3.0x to 3.9x | 7,587 (11.9%) | 18,377 (23.4%) |
| 4.0x or more | 17,489 (27.4%) | 9,596 (12.2%) |
| Total | 63,917 (100.0%) | 78,640 (100.0%) |
Real Estate Taxes by Mortgage Status in El Paso
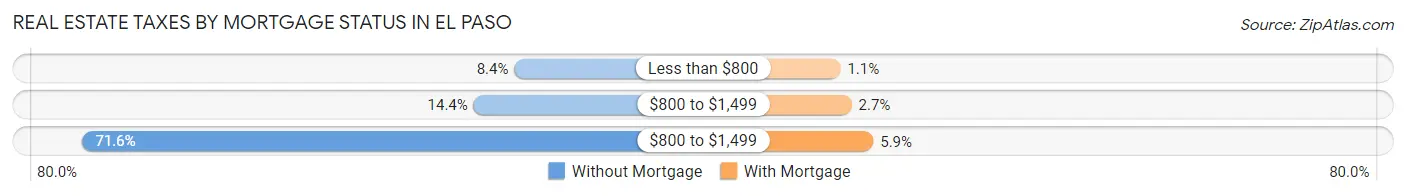
| Property Taxes | Without Mortgage | With Mortgage |
| Less than $800 | 5,393 (8.4%) | 851 (1.1%) |
| $800 to $1,499 | 9,200 (14.4%) | 2,135 (2.7%) |
| $800 to $1,499 | 45,738 (71.6%) | 4,623 (5.9%) |
| Total | 63,917 (100.0%) | 78,640 (100.0%) |
Health & Disability in El Paso
Health Insurance Coverage by Age in El Paso
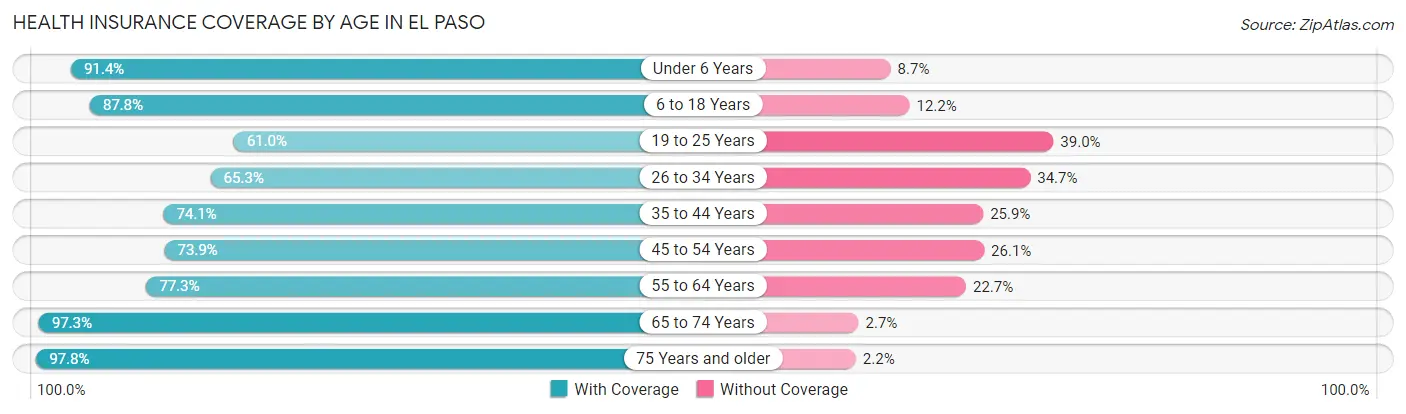
| Age Bracket | With Coverage | Without Coverage |
| Under 6 Years | 49,815 (91.3%) | 4,715 (8.6%) |
| 6 to 18 Years | 113,354 (87.8%) | 15,714 (12.2%) |
| 19 to 25 Years | 44,721 (61.0%) | 28,590 (39.0%) |
| 26 to 34 Years | 55,819 (65.3%) | 29,630 (34.7%) |
| 35 to 44 Years | 59,632 (74.1%) | 20,842 (25.9%) |
| 45 to 54 Years | 56,734 (73.9%) | 20,013 (26.1%) |
| 55 to 64 Years | 56,036 (77.3%) | 16,452 (22.7%) |
| 65 to 74 Years | 50,214 (97.3%) | 1,372 (2.7%) |
| 75 Years and older | 37,300 (97.8%) | 827 (2.2%) |
| Total | 523,625 (79.1%) | 138,155 (20.9%) |
Health Insurance Coverage by Citizenship Status in El Paso
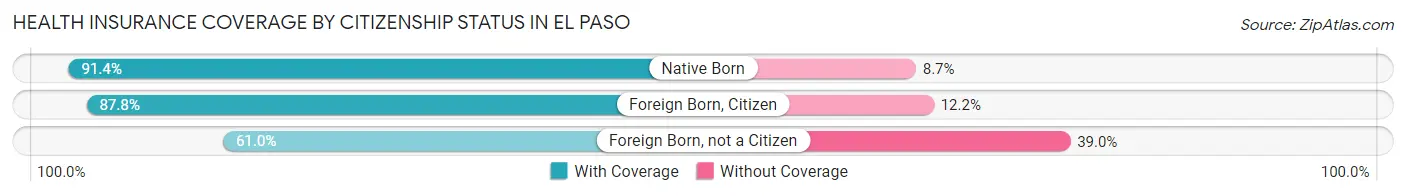
| Citizenship Status | With Coverage | Without Coverage |
| Native Born | 49,815 (91.3%) | 4,715 (8.6%) |
| Foreign Born, Citizen | 113,354 (87.8%) | 15,714 (12.2%) |
| Foreign Born, not a Citizen | 44,721 (61.0%) | 28,590 (39.0%) |
Health Insurance Coverage by Household Income in El Paso
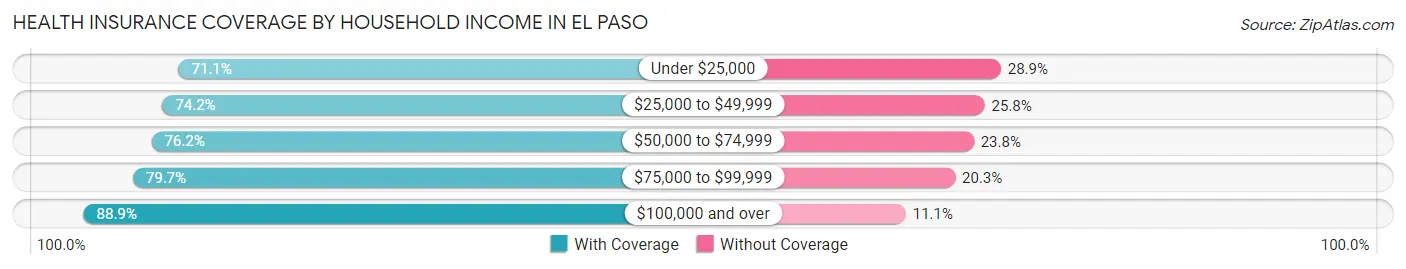
| Household Income | With Coverage | Without Coverage |
| Under $25,000 | 79,471 (71.1%) | 32,232 (28.9%) |
| $25,000 to $49,999 | 106,186 (74.2%) | 36,967 (25.8%) |
| $50,000 to $74,999 | 92,097 (76.2%) | 28,727 (23.8%) |
| $75,000 to $99,999 | 69,082 (79.7%) | 17,582 (20.3%) |
| $100,000 and over | 175,312 (88.9%) | 21,802 (11.1%) |
Public vs Private Health Insurance Coverage by Age in El Paso
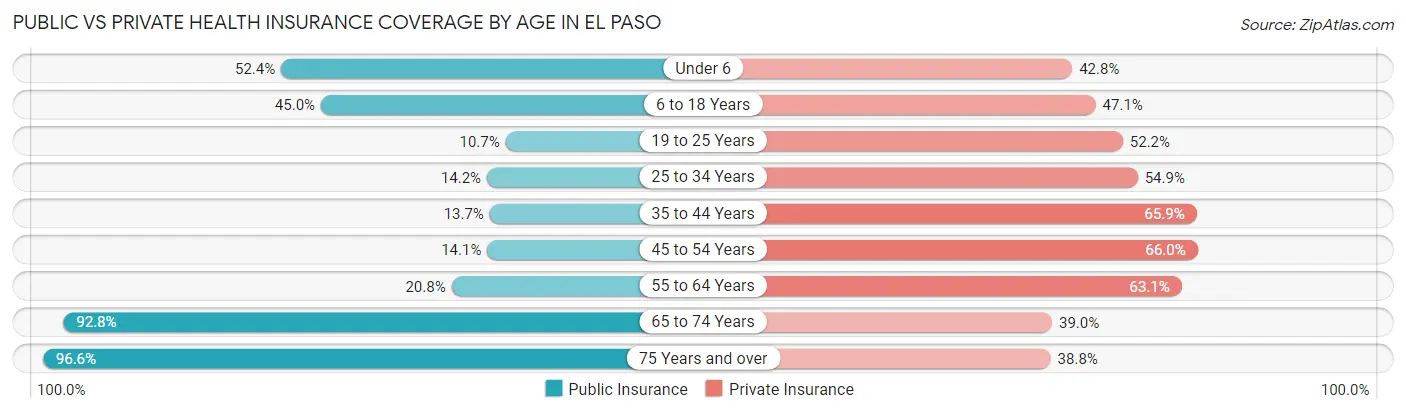
| Age Bracket | Public Insurance | Private Insurance |
| Under 6 | 28,575 (52.4%) | 23,320 (42.8%) |
| 6 to 18 Years | 58,080 (45.0%) | 60,822 (47.1%) |
| 19 to 25 Years | 7,863 (10.7%) | 38,249 (52.2%) |
| 25 to 34 Years | 12,113 (14.2%) | 46,939 (54.9%) |
| 35 to 44 Years | 10,997 (13.7%) | 52,993 (65.8%) |
| 45 to 54 Years | 10,846 (14.1%) | 50,683 (66.0%) |
| 55 to 64 Years | 15,051 (20.8%) | 45,723 (63.1%) |
| 65 to 74 Years | 47,873 (92.8%) | 20,136 (39.0%) |
| 75 Years and over | 36,829 (96.6%) | 14,783 (38.8%) |
| Total | 228,227 (34.5%) | 353,648 (53.4%) |
Disability Status by Sex by Age in El Paso
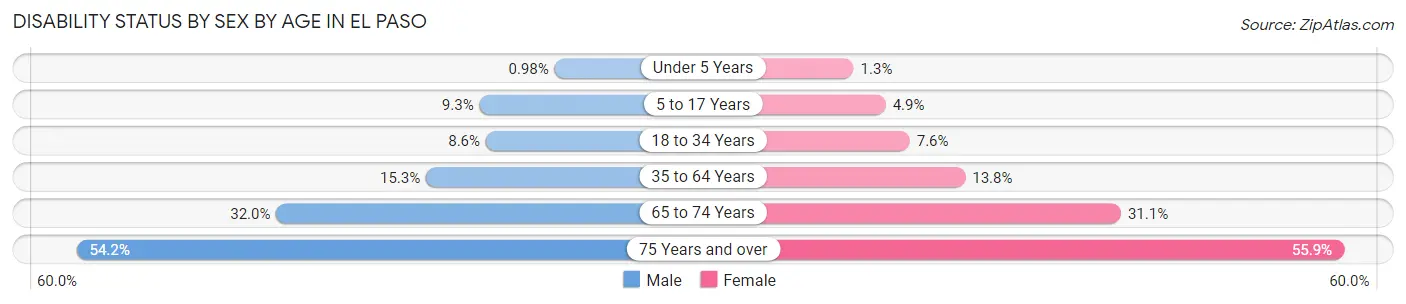
| Age Bracket | Male | Female |
| Under 5 Years | 226 (1.0%) | 296 (1.3%) |
| 5 to 17 Years | 6,058 (9.3%) | 3,022 (4.9%) |
| 18 to 34 Years | 7,413 (8.6%) | 6,377 (7.6%) |
| 35 to 64 Years | 16,800 (15.3%) | 16,478 (13.8%) |
| 65 to 74 Years | 7,197 (32.0%) | 9,038 (31.1%) |
| 75 Years and over | 8,098 (54.2%) | 12,966 (55.9%) |
Disability Class by Sex by Age in El Paso
Disability Class: Hearing Difficulty
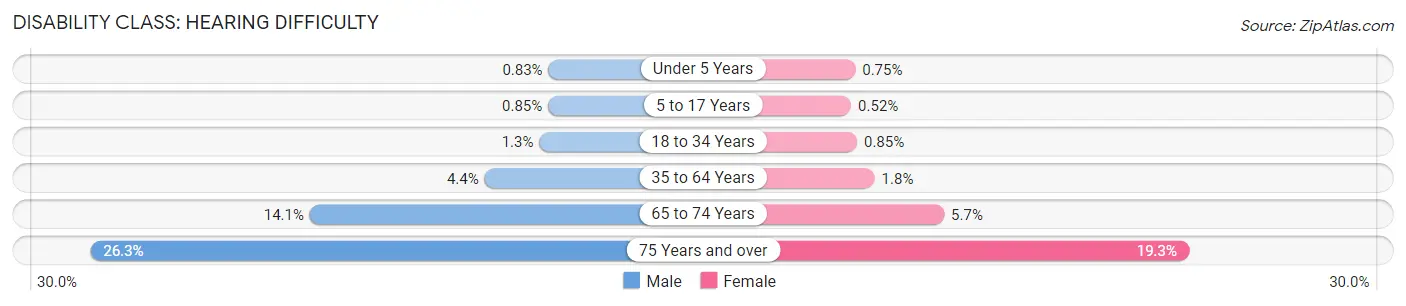
| Age Bracket | Male | Female |
| Under 5 Years | 192 (0.8%) | 169 (0.7%) |
| 5 to 17 Years | 549 (0.9%) | 319 (0.5%) |
| 18 to 34 Years | 1,151 (1.3%) | 713 (0.9%) |
| 35 to 64 Years | 4,819 (4.4%) | 2,193 (1.8%) |
| 65 to 74 Years | 3,180 (14.1%) | 1,657 (5.7%) |
| 75 Years and over | 3,935 (26.3%) | 4,481 (19.3%) |
Disability Class: Vision Difficulty
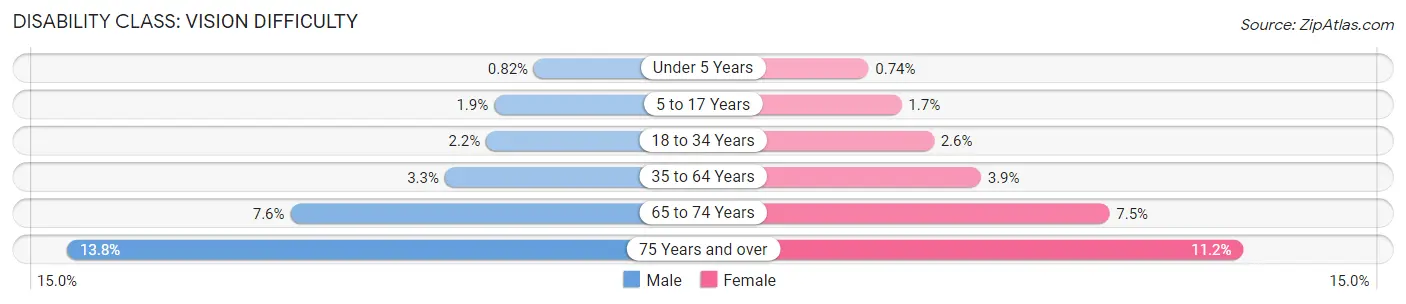
| Age Bracket | Male | Female |
| Under 5 Years | 190 (0.8%) | 166 (0.7%) |
| 5 to 17 Years | 1,254 (1.9%) | 1,025 (1.7%) |
| 18 to 34 Years | 1,843 (2.1%) | 2,153 (2.6%) |
| 35 to 64 Years | 3,630 (3.3%) | 4,637 (3.9%) |
| 65 to 74 Years | 1,710 (7.6%) | 2,166 (7.4%) |
| 75 Years and over | 2,064 (13.8%) | 2,593 (11.2%) |
Disability Class: Cognitive Difficulty
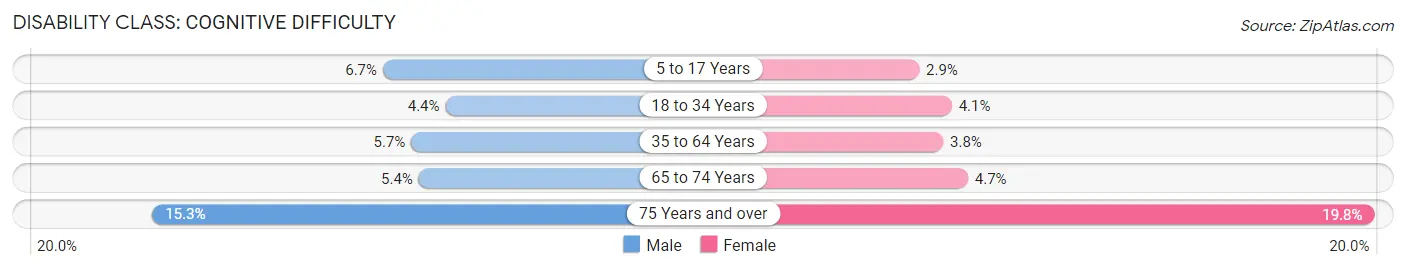
| Age Bracket | Male | Female |
| 5 to 17 Years | 4,346 (6.7%) | 1,776 (2.9%) |
| 18 to 34 Years | 3,762 (4.4%) | 3,440 (4.1%) |
| 35 to 64 Years | 6,209 (5.7%) | 4,509 (3.8%) |
| 65 to 74 Years | 1,210 (5.4%) | 1,360 (4.7%) |
| 75 Years and over | 2,280 (15.3%) | 4,584 (19.8%) |
Disability Class: Ambulatory Difficulty
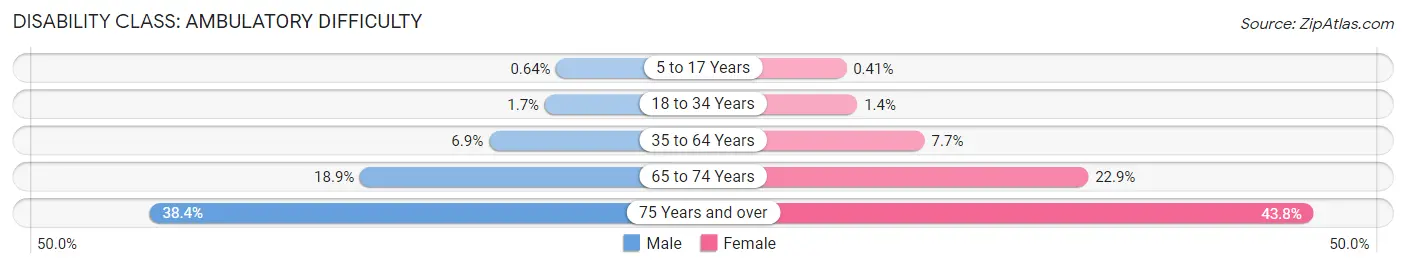
| Age Bracket | Male | Female |
| 5 to 17 Years | 413 (0.6%) | 251 (0.4%) |
| 18 to 34 Years | 1,465 (1.7%) | 1,202 (1.4%) |
| 35 to 64 Years | 7,580 (6.9%) | 9,218 (7.7%) |
| 65 to 74 Years | 4,246 (18.9%) | 6,650 (22.9%) |
| 75 Years and over | 5,735 (38.4%) | 10,152 (43.8%) |
Disability Class: Self-Care Difficulty
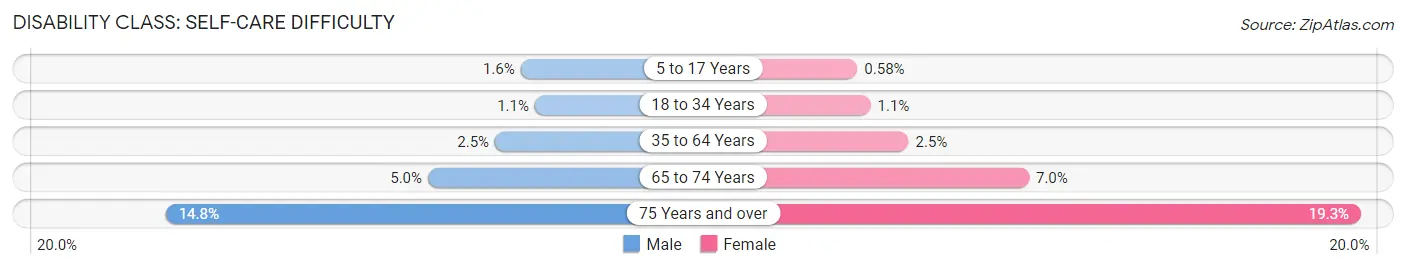
| Age Bracket | Male | Female |
| 5 to 17 Years | 1,029 (1.6%) | 360 (0.6%) |
| 18 to 34 Years | 909 (1.1%) | 900 (1.1%) |
| 35 to 64 Years | 2,788 (2.5%) | 2,978 (2.5%) |
| 65 to 74 Years | 1,133 (5.0%) | 2,020 (7.0%) |
| 75 Years and over | 2,205 (14.8%) | 4,469 (19.3%) |
Technology Access in El Paso
Computing Device Access in El Paso
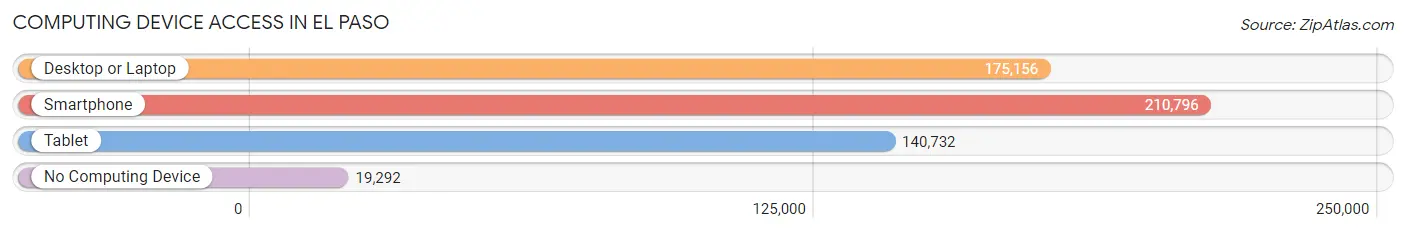
| Device Type | # Households | % Households |
| Desktop or Laptop | 175,156 | 73.1% |
| Smartphone | 210,796 | 88.0% |
| Tablet | 140,732 | 58.7% |
| No Computing Device | 19,292 | 8.1% |
| Total | 239,624 | 100.0% |
Internet Access in El Paso
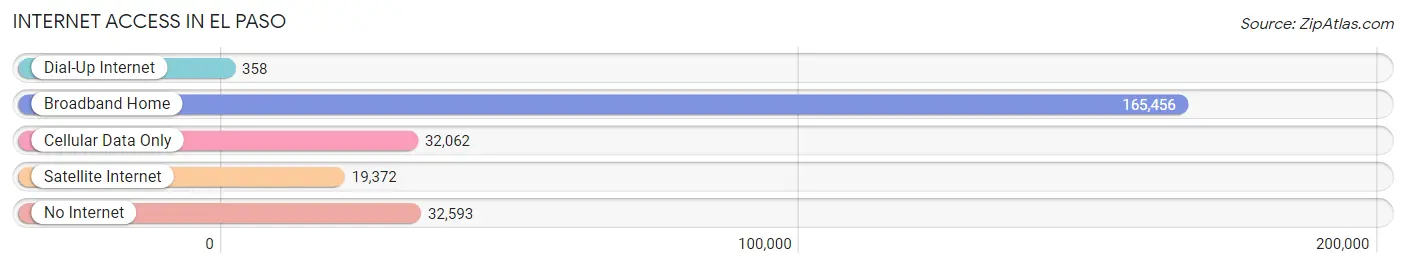
| Internet Type | # Households | % Households |
| Dial-Up Internet | 358 | 0.2% |
| Broadband Home | 165,456 | 69.1% |
| Cellular Data Only | 32,062 | 13.4% |
| Satellite Internet | 19,372 | 8.1% |
| No Internet | 32,593 | 13.6% |
| Total | 239,624 | 100.0% |
El Paso Summary
El Paso, Texas is a city located in the westernmost part of the state, along the Rio Grande river. It is the sixth-largest city in Texas and the 22nd-largest in the United States. El Paso is the county seat of El Paso County and is part of the El Paso-Las Cruces Combined Statistical Area. The city is situated in the far western corner of the state of Texas, and borders both New Mexico and Mexico.
History
The area that is now El Paso has been inhabited for thousands of years. The first known inhabitants were the Manso Indians, who lived in the area for centuries before the arrival of the Spanish in the 16th century. The Spanish established a mission in the area in 1680, and the settlement of El Paso del Norte was founded in 1659. The city was part of the Spanish Empire until 1821, when Mexico gained its independence. El Paso was then part of the Mexican state of Chihuahua until 1848, when it became part of the United States after the Mexican-American War.
El Paso grew rapidly after the arrival of the railroad in 1881, and the city was incorporated in 1873. The city was a major stop on the Butterfield Overland Mail route, and it became a major trading center for the region. El Paso was also a major hub for the cattle industry, and the city was home to several large ranches.
In the early 20th century, El Paso became a major center for the oil and gas industry. The city was also a major center for the military, and Fort Bliss was established in the city in 1848. The city was also home to several military bases, including Biggs Army Airfield and White Sands Missile Range.
Geography
El Paso is located in the far western corner of Texas, along the Rio Grande river. The city is situated at an elevation of 3,800 feet, and is surrounded by the Franklin Mountains. The city covers an area of 251 square miles, and has a population of 681,124.
The climate in El Paso is semi-arid, with hot summers and mild winters. The average annual temperature is 68 degrees Fahrenheit, and the average annual precipitation is 8.5 inches.
Economy
El Paso has a diversified economy, with a strong focus on the military, manufacturing, and tourism. The city is home to several major military installations, including Fort Bliss and White Sands Missile Range. The city is also home to several major manufacturing companies, including Boeing, Lockheed Martin, and Raytheon.
The city is also a major tourist destination, with attractions such as the El Paso Zoo, the El Paso Museum of Art, and the El Paso Mission Trail. The city is also home to several major festivals, including the El Paso International Mariachi Festival and the El Paso Balloon Festival.
Demographics
As of the 2010 census, El Paso had a population of 679,036. The racial makeup of the city was 77.2% Hispanic or Latino, 16.2% White, 4.2% African American, 0.7% Native American, 0.7% Asian, and 1.2% from other races. The median household income was $37,845, and the median family income was $45,945.
El Paso is a culturally diverse city, with a large population of Mexican-Americans. The city is also home to a large population of immigrants from other countries, including Guatemala, Honduras, and El Salvador. The city is also home to a large population of military personnel, and the city has a large veteran population.
Common Questions
What is Per Capita Income in El Paso?
Per Capita income in El Paso is $27,434.
What is the Median Family Income in El Paso?
Median Family Income in El Paso is $63,067.
What is the Median Household income in El Paso?
Median Household Income in El Paso is $55,710.
What is Income or Wage Gap in El Paso?
Income or Wage Gap in El Paso is 26.5%.
Women in El Paso earn 73.5 cents for every dollar earned by a man.
What is Family Income Deficit in El Paso?
Family Income Deficit in El Paso is $11,031.
Families that are below poverty line in El Paso earn $11,031 less on average than the poverty threshold level.
What is Inequality or Gini Index in El Paso?
Inequality or Gini Index in El Paso is 0.47.
What is the Total Population of El Paso?
Total Population of El Paso is 677,181.
What is the Total Male Population of El Paso?
Total Male Population of El Paso is 333,662.
What is the Total Female Population of El Paso?
Total Female Population of El Paso is 343,519.
What is the Ratio of Males per 100 Females in El Paso?
There are 97.13 Males per 100 Females in El Paso.
What is the Ratio of Females per 100 Males in El Paso?
There are 102.95 Females per 100 Males in El Paso.
What is the Median Population Age in El Paso?
Median Population Age in El Paso is 33.7 Years.
What is the Average Family Size in El Paso
Average Family Size in El Paso is 3.4 People.
What is the Average Household Size in El Paso
Average Household Size in El Paso is 2.8 People.
How Large is the Labor Force in El Paso?
There are 328,693 People in the Labor Forcein in El Paso.
What is the Percentage of People in the Labor Force in El Paso?
62.7% of People are in the Labor Force in El Paso.
What is the Unemployment Rate in El Paso?
Unemployment Rate in El Paso is 6.8%.