Cities with the Largest Lebanese Community in Kentucky
RELATED REPORTS & OPTIONS
Lebanese
Kentucky
Compare Cities
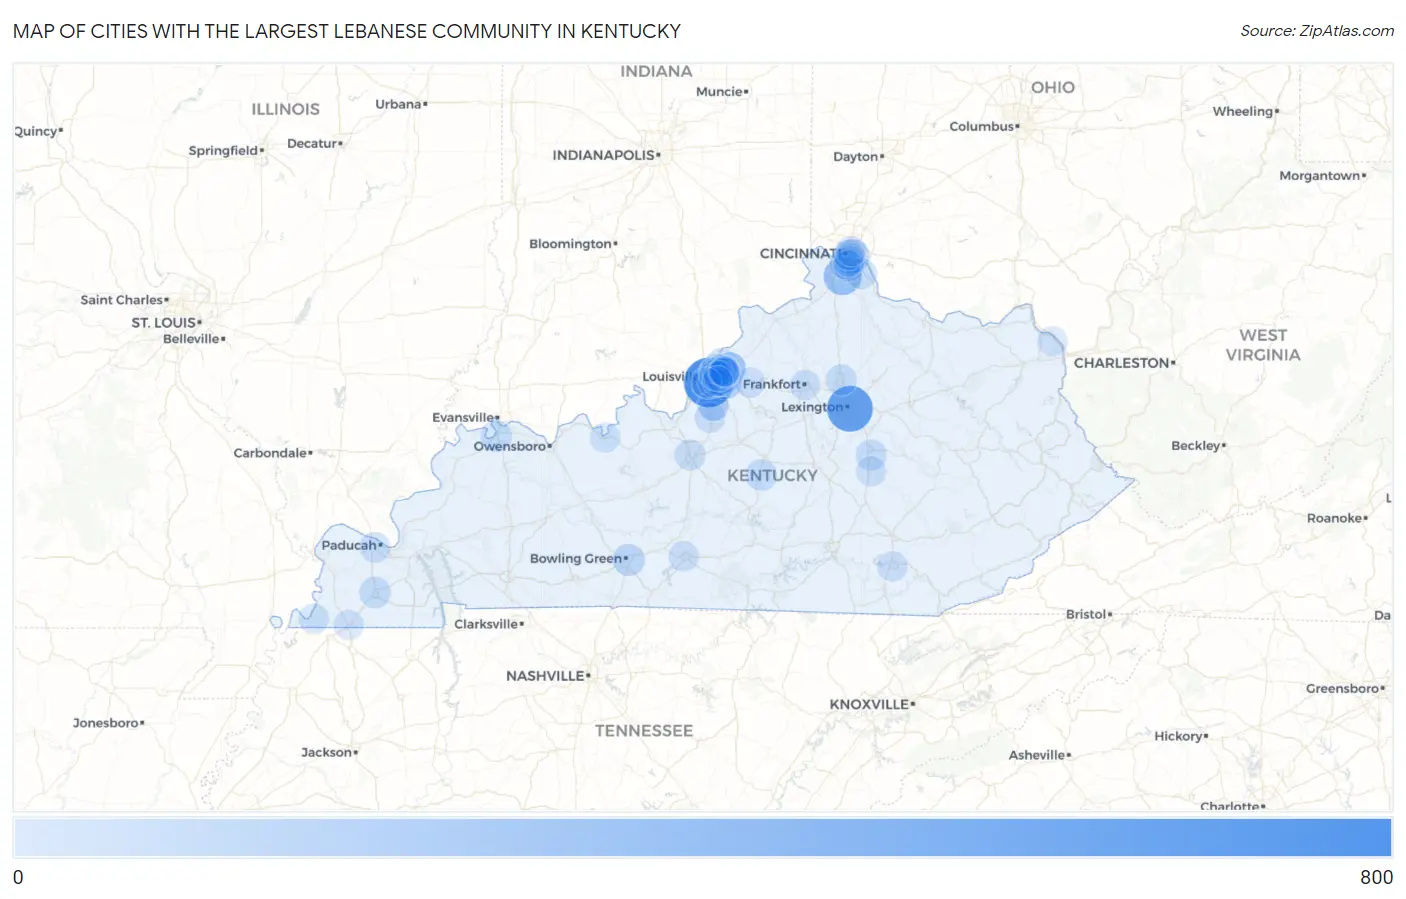
Map of Cities with the Largest Lebanese Community in Kentucky
0
800

Cities with the Largest Lebanese Community in Kentucky
| City | Lebanese | vs State | vs National | |
| 1. | Louisville | 659 | 3,462(19.04%)#1 | 546,795(0.12%)#78 |
| 2. | Lexington | 528 | 3,462(15.25%)#2 | 546,795(0.10%)#106 |
| 3. | Independence | 255 | 3,462(7.37%)#3 | 546,795(0.05%)#296 |
| 4. | St Matthews | 186 | 3,462(5.37%)#4 | 546,795(0.03%)#434 |
| 5. | Fort Thomas | 129 | 3,462(3.73%)#5 | 546,795(0.02%)#665 |
| 6. | Jeffersontown | 115 | 3,462(3.32%)#6 | 546,795(0.02%)#742 |
| 7. | Worthington Hills | 76 | 3,462(2.20%)#7 | 546,795(0.01%)#1,123 |
| 8. | Bowling Green | 62 | 3,462(1.79%)#8 | 546,795(0.01%)#1,312 |
| 9. | Mayfield | 47 | 3,462(1.36%)#9 | 546,795(0.01%)#1,638 |
| 10. | Lebanon | 46 | 3,462(1.33%)#10 | 546,795(0.01%)#1,670 |
| 11. | Henderson | 43 | 3,462(1.24%)#11 | 546,795(0.01%)#1,760 |
| 12. | Georgetown | 38 | 3,462(1.10%)#12 | 546,795(0.01%)#1,892 |
| 13. | Southgate | 38 | 3,462(1.10%)#13 | 546,795(0.01%)#1,916 |
| 14. | Indian Hills | 35 | 3,462(1.01%)#14 | 546,795(0.01%)#2,023 |
| 15. | Covington | 33 | 3,462(0.95%)#15 | 546,795(0.01%)#2,067 |
| 16. | Richmond | 33 | 3,462(0.95%)#16 | 546,795(0.01%)#2,068 |
| 17. | Alexandria | 30 | 3,462(0.87%)#17 | 546,795(0.01%)#2,194 |
| 18. | Taylor Mill | 29 | 3,462(0.84%)#18 | 546,795(0.01%)#2,245 |
| 19. | Wilder | 29 | 3,462(0.84%)#19 | 546,795(0.01%)#2,251 |
| 20. | Elizabethtown | 28 | 3,462(0.81%)#20 | 546,795(0.01%)#2,264 |
| 21. | Paducah | 23 | 3,462(0.66%)#21 | 546,795(0.00%)#2,532 |
| 22. | St Regis Park | 23 | 3,462(0.66%)#22 | 546,795(0.00%)#2,575 |
| 23. | Hillview | 22 | 3,462(0.64%)#23 | 546,795(0.00%)#2,618 |
| 24. | Prospect | 21 | 3,462(0.61%)#24 | 546,795(0.00%)#2,687 |
| 25. | Newport | 16 | 3,462(0.46%)#25 | 546,795(0.00%)#3,033 |
| 26. | Broeck Pointe | 15 | 3,462(0.43%)#26 | 546,795(0.00%)#3,188 |
| 27. | Shepherdsville | 13 | 3,462(0.38%)#27 | 546,795(0.00%)#3,303 |
| 28. | Riverwood | 12 | 3,462(0.35%)#28 | 546,795(0.00%)#3,490 |
| 29. | Frankfort | 11 | 3,462(0.32%)#29 | 546,795(0.00%)#3,502 |
| 30. | Blue Ridge Manor | 10 | 3,462(0.29%)#30 | 546,795(0.00%)#3,743 |
| 31. | Glasgow | 9 | 3,462(0.26%)#31 | 546,795(0.00%)#3,785 |
| 32. | Corbin | 9 | 3,462(0.26%)#32 | 546,795(0.00%)#3,806 |
| 33. | Coldstream | 8 | 3,462(0.23%)#33 | 546,795(0.00%)#4,014 |
| 34. | Woodlawn Park | 8 | 3,462(0.23%)#34 | 546,795(0.00%)#4,031 |
| 35. | Simpsonville | 7 | 3,462(0.20%)#35 | 546,795(0.00%)#4,146 |
| 36. | Hickman | 7 | 3,462(0.20%)#36 | 546,795(0.00%)#4,162 |
| 37. | Strathmoor Village | 7 | 3,462(0.20%)#37 | 546,795(0.00%)#4,206 |
| 38. | Fulton | 6 | 3,462(0.17%)#38 | 546,795(0.00%)#4,285 |
| 39. | Hebron Estates | 6 | 3,462(0.17%)#39 | 546,795(0.00%)#4,319 |
| 40. | Bellefonte | 6 | 3,462(0.17%)#40 | 546,795(0.00%)#4,320 |
| 41. | Barbourmeade | 6 | 3,462(0.17%)#41 | 546,795(0.00%)#4,321 |
| 42. | Brownsboro Farm | 6 | 3,462(0.17%)#42 | 546,795(0.00%)#4,339 |
| 43. | Berea | 5 | 3,462(0.14%)#43 | 546,795(0.00%)#4,365 |
| 44. | Audubon Park | 5 | 3,462(0.14%)#44 | 546,795(0.00%)#4,449 |
| 45. | Rolling Fields | 5 | 3,462(0.14%)#45 | 546,795(0.00%)#4,477 |
| 46. | Moorland | 5 | 3,462(0.14%)#46 | 546,795(0.00%)#4,478 |
| 47. | Dayton | 4 | 3,462(0.12%)#47 | 546,795(0.00%)#4,523 |
| 48. | Spring Valley | 4 | 3,462(0.12%)#48 | 546,795(0.00%)#4,613 |
| 49. | Norwood | 4 | 3,462(0.12%)#49 | 546,795(0.00%)#4,635 |
| 50. | Richlawn | 4 | 3,462(0.12%)#50 | 546,795(0.00%)#4,637 |
| 51. | Lincolnshire | 4 | 3,462(0.12%)#51 | 546,795(0.00%)#4,647 |
| 52. | Hurstbourne Acres | 3 | 3,462(0.09%)#52 | 546,795(0.00%)#4,679 |
| 53. | Northfield | 3 | 3,462(0.09%)#53 | 546,795(0.00%)#4,727 |
| 54. | Glenview | 3 | 3,462(0.09%)#54 | 546,795(0.00%)#4,759 |
| 55. | Wellington | 3 | 3,462(0.09%)#55 | 546,795(0.00%)#4,772 |
| 56. | Brownsboro Village | 3 | 3,462(0.09%)#56 | 546,795(0.00%)#4,779 |
| 57. | Beechwood Village | 2 | 3,462(0.06%)#57 | 546,795(0.00%)#4,854 |
| 58. | Cloverport | 2 | 3,462(0.06%)#58 | 546,795(0.00%)#4,860 |
| 59. | Rolling Hills | 2 | 3,462(0.06%)#59 | 546,795(0.00%)#4,875 |
| 60. | Langdon Place | 2 | 3,462(0.06%)#60 | 546,795(0.00%)#4,880 |
| 61. | Meadow Vale | 2 | 3,462(0.06%)#61 | 546,795(0.00%)#4,882 |
| 62. | Parkway Village | 2 | 3,462(0.06%)#62 | 546,795(0.00%)#4,912 |
| 63. | Creekside | 1 | 3,462(0.03%)#63 | 546,795(0.00%)#5,043 |
| 64. | Meadowview Estates | 1 | 3,462(0.03%)#64 | 546,795(0.00%)#5,075 |
Common Questions
What are the Top 10 Cities with the Largest Lebanese Community in Kentucky?
Top 10 Cities with the Largest Lebanese Community in Kentucky are:
#1
659
#2
528
#3
255
#4
186
#5
129
#6
115
#7
76
#8
62
#9
47
#10
46
What city has the Largest Lebanese Community in Kentucky?
Louisville has the Largest Lebanese Community in Kentucky with 659.
What is the Total Lebanese Population in the State of Kentucky?
Total Lebanese Population in Kentucky is 3,462.
What is the Total Lebanese Population in the United States?
Total Lebanese Population in the United States is 546,795.