Horizon West, FL Map & Demographics
Horizon West Map
Horizon West Overview
$48,282
PER CAPITA INCOME
$128,770
AVG FAMILY INCOME
$118,064
AVG HOUSEHOLD INCOME
36.8%
WAGE / INCOME GAP [ % ]
63.2¢/ $1
WAGE / INCOME GAP [ $ ]
0.43
INEQUALITY / GINI INDEX
58,595
TOTAL POPULATION
27,027
MALE POPULATION
31,568
FEMALE POPULATION
85.62
MALES / 100 FEMALES
116.80
FEMALES / 100 MALES
35.2
MEDIAN AGE
3.5
AVG FAMILY SIZE
3.1
AVG HOUSEHOLD SIZE
30,556
LABOR FORCE [ PEOPLE ]
73.4%
PERCENT IN LABOR FORCE
3.4%
UNEMPLOYMENT RATE
Income in Horizon West
Income Overview in Horizon West
Per Capita Income in Horizon West is $48,282, while median incomes of families and households are $128,770 and $118,064 respectively.
| Characteristic | Number | Measure |
| Per Capita Income | 58,595 | $48,282 |
| Median Family Income | 14,270 | $128,770 |
| Mean Family Income | 14,270 | $163,643 |
| Median Household Income | 18,629 | $118,064 |
| Mean Household Income | 18,629 | $150,022 |
| Income Deficit | 14,270 | $0 |
| Wage / Income Gap (%) | 58,595 | 36.77% |
| Wage / Income Gap ($) | 58,595 | 63.23¢ per $1 |
| Gini / Inequality Index | 58,595 | 0.43 |
Earnings by Sex in Horizon West
Average Earnings in Horizon West are $58,386, $69,972 for men and $44,244 for women, a difference of 36.8%.
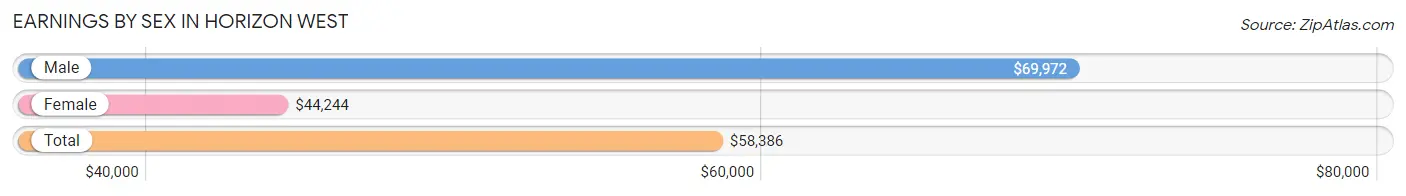
| Sex | Number | Average Earnings |
| Male | 16,113 (51.6%) | $69,972 |
| Female | 15,139 (48.4%) | $44,244 |
| Total | 31,252 (100.0%) | $58,386 |
Earnings by Sex by Income Bracket in Horizon West
The most common earnings brackets in Horizon West are $100,000+ for men (5,230 | 32.5%) and $100,000+ for women (2,304 | 15.2%).
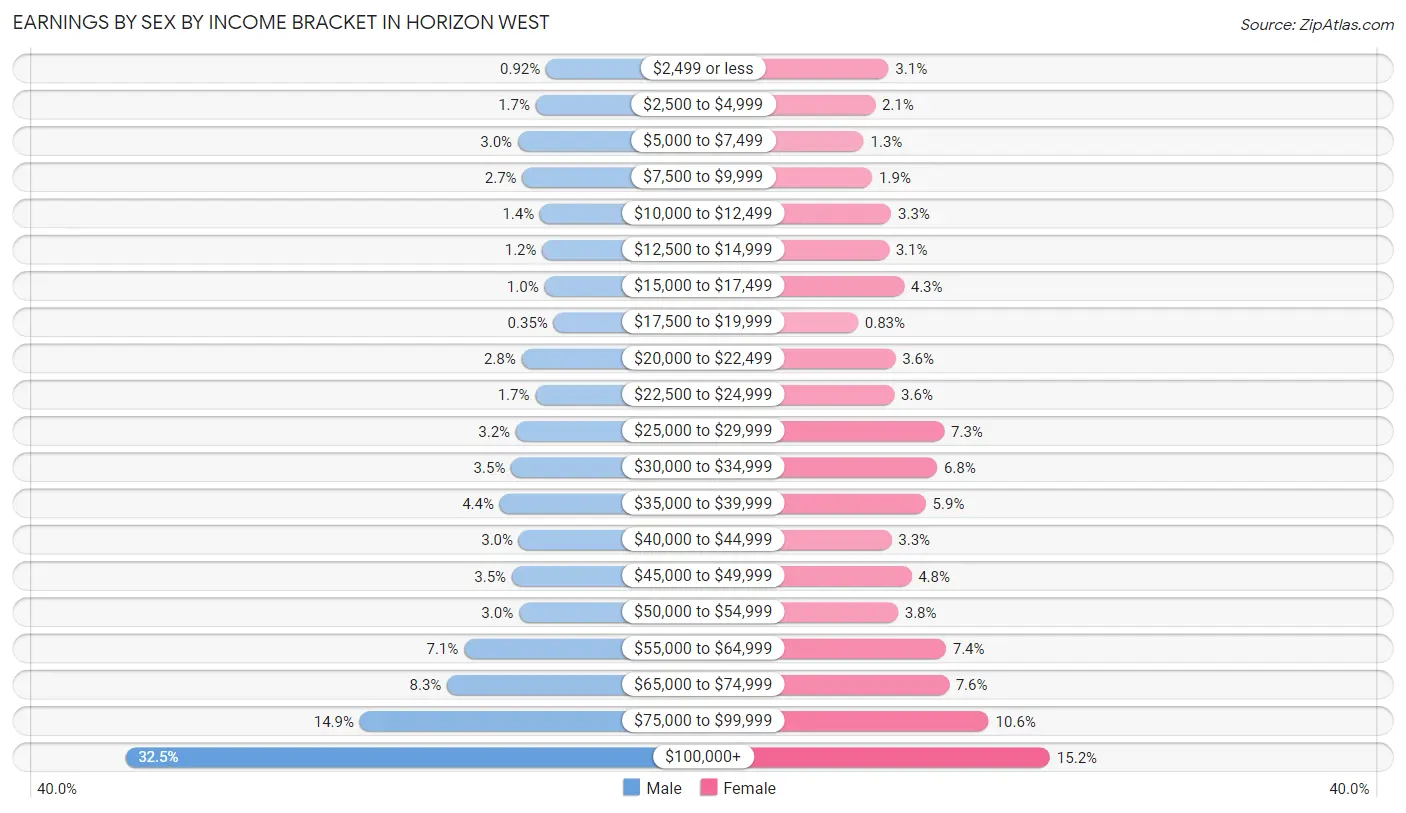
| Income | Male | Female |
| $2,499 or less | 148 (0.9%) | 472 (3.1%) |
| $2,500 to $4,999 | 273 (1.7%) | 320 (2.1%) |
| $5,000 to $7,499 | 489 (3.0%) | 191 (1.3%) |
| $7,500 to $9,999 | 434 (2.7%) | 288 (1.9%) |
| $10,000 to $12,499 | 220 (1.4%) | 502 (3.3%) |
| $12,500 to $14,999 | 194 (1.2%) | 476 (3.1%) |
| $15,000 to $17,499 | 167 (1.0%) | 646 (4.3%) |
| $17,500 to $19,999 | 56 (0.4%) | 125 (0.8%) |
| $20,000 to $22,499 | 445 (2.8%) | 550 (3.6%) |
| $22,500 to $24,999 | 279 (1.7%) | 538 (3.5%) |
| $25,000 to $29,999 | 512 (3.2%) | 1,103 (7.3%) |
| $30,000 to $34,999 | 568 (3.5%) | 1,024 (6.8%) |
| $35,000 to $39,999 | 707 (4.4%) | 895 (5.9%) |
| $40,000 to $44,999 | 477 (3.0%) | 506 (3.3%) |
| $45,000 to $49,999 | 561 (3.5%) | 731 (4.8%) |
| $50,000 to $54,999 | 476 (2.9%) | 579 (3.8%) |
| $55,000 to $64,999 | 1,137 (7.1%) | 1,123 (7.4%) |
| $65,000 to $74,999 | 1,343 (8.3%) | 1,156 (7.6%) |
| $75,000 to $99,999 | 2,397 (14.9%) | 1,610 (10.6%) |
| $100,000+ | 5,230 (32.5%) | 2,304 (15.2%) |
| Total | 16,113 (100.0%) | 15,139 (100.0%) |
Earnings by Sex by Educational Attainment in Horizon West
Average earnings in Horizon West are $75,320 for men and $49,697 for women, a difference of 34.0%. Men with an educational attainment of graduate degree enjoy the highest average annual earnings of $98,322, while those with high school diploma education earn the least with $49,950. Women with an educational attainment of graduate degree earn the most with the average annual earnings of $81,895, while those with high school diploma education have the smallest earnings of $32,985.
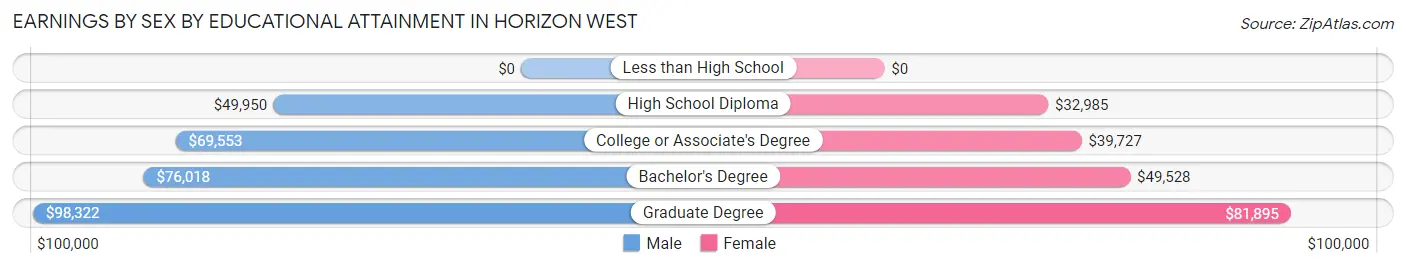
| Educational Attainment | Male Income | Female Income |
| Less than High School | - | - |
| High School Diploma | $49,950 | $32,985 |
| College or Associate's Degree | $69,553 | $39,727 |
| Bachelor's Degree | $76,018 | $49,528 |
| Graduate Degree | $98,322 | $81,895 |
| Total | $75,320 | $49,697 |
Family Income in Horizon West
Family Income Brackets in Horizon West
According to the Horizon West family income data, there are 3,767 families falling into the $100,000 to $149,999 income range, which is the most common income bracket and makes up 26.4% of all families. Conversely, the $10,000 to $14,999 income bracket is the least frequent group with only 86 families (0.6%) belonging to this category.
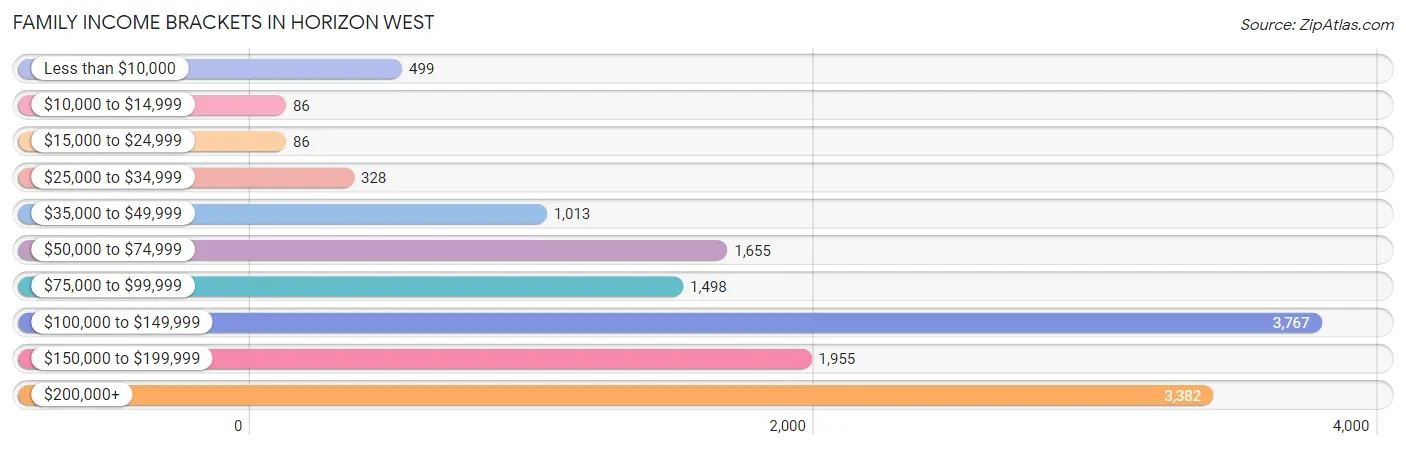
| Income Bracket | # Families | % Families |
| Less than $10,000 | 499 | 3.5% |
| $10,000 to $14,999 | 86 | 0.6% |
| $15,000 to $24,999 | 86 | 0.6% |
| $25,000 to $34,999 | 328 | 2.3% |
| $35,000 to $49,999 | 1,013 | 7.1% |
| $50,000 to $74,999 | 1,655 | 11.6% |
| $75,000 to $99,999 | 1,498 | 10.5% |
| $100,000 to $149,999 | 3,767 | 26.4% |
| $150,000 to $199,999 | 1,955 | 13.7% |
| $200,000+ | 3,382 | 23.7% |
Family Income by Famaliy Size in Horizon West
3-person families (2,814 | 19.7%) account for the highest median family income in Horizon West with $152,838 per family, while 2-person families (4,657 | 32.6%) have the highest median income of $63,999 per family member.
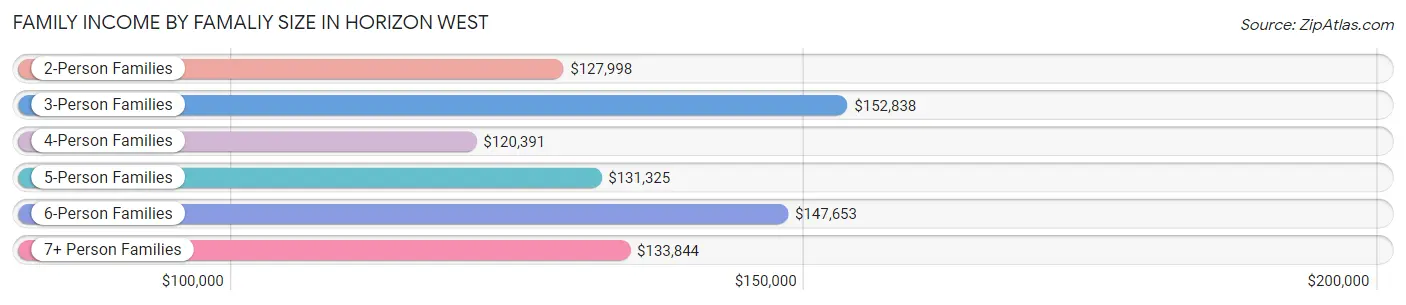
| Income Bracket | # Families | Median Income |
| 2-Person Families | 4,657 (32.6%) | $127,998 |
| 3-Person Families | 2,814 (19.7%) | $152,838 |
| 4-Person Families | 4,357 (30.5%) | $120,391 |
| 5-Person Families | 1,316 (9.2%) | $131,325 |
| 6-Person Families | 1,063 (7.4%) | $147,653 |
| 7+ Person Families | 63 (0.4%) | $133,844 |
| Total | 14,270 (100.0%) | $128,770 |
Family Income by Number of Earners in Horizon West
The median family income in Horizon West is $128,770, with families comprising 3+ earners (1,154) having the highest median family income of $177,195, while families with no earners (1,128) have the lowest median family income of $32,419, accounting for 8.1% and 7.9% of families, respectively.
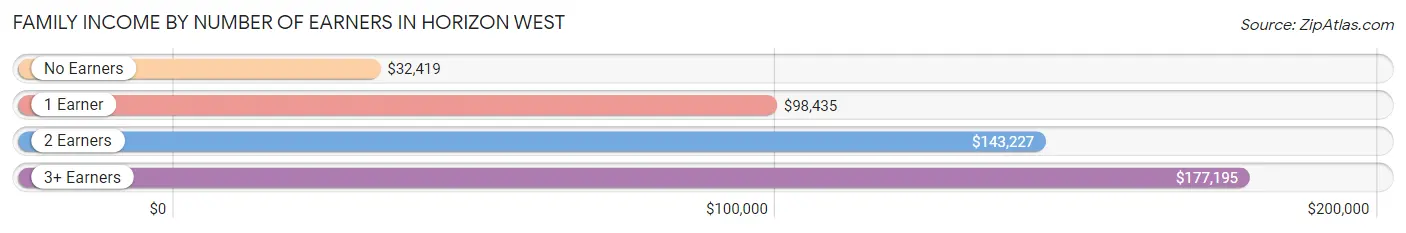
| Number of Earners | # Families | Median Income |
| No Earners | 1,128 (7.9%) | $32,419 |
| 1 Earner | 3,824 (26.8%) | $98,435 |
| 2 Earners | 8,164 (57.2%) | $143,227 |
| 3+ Earners | 1,154 (8.1%) | $177,195 |
| Total | 14,270 (100.0%) | $128,770 |
Household Income in Horizon West
Household Income Brackets in Horizon West
With 4,993 households falling in the category, the $100,000 to $149,999 income range is the most frequent in Horizon West, accounting for 26.8% of all households. In contrast, only 56 households (0.3%) fall into the $10,000 to $14,999 income bracket, making it the least populous group.
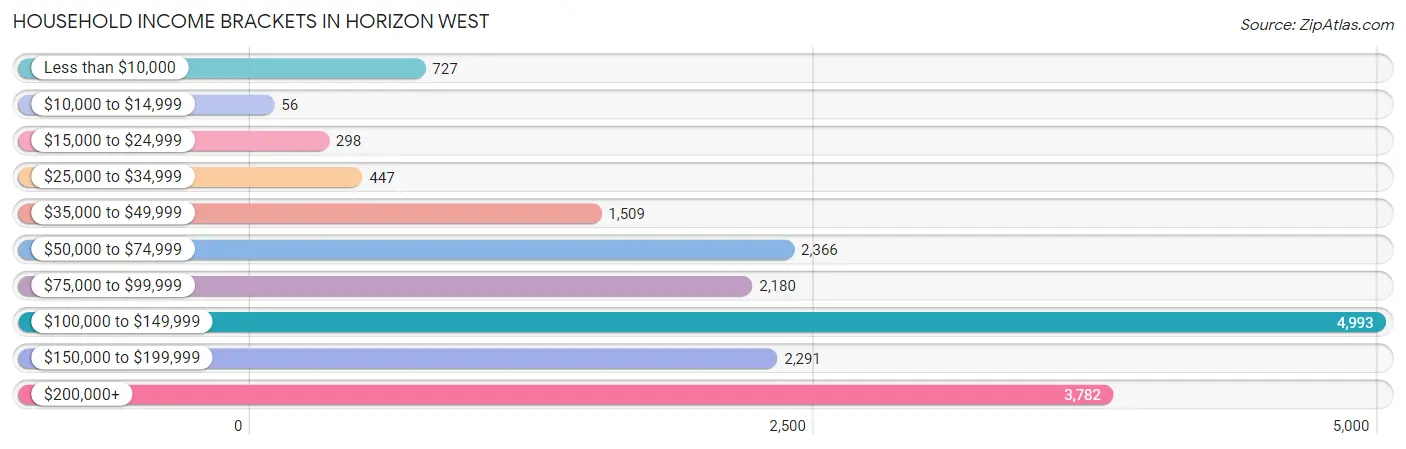
| Income Bracket | # Households | % Households |
| Less than $10,000 | 727 | 3.9% |
| $10,000 to $14,999 | 56 | 0.3% |
| $15,000 to $24,999 | 298 | 1.6% |
| $25,000 to $34,999 | 447 | 2.4% |
| $35,000 to $49,999 | 1,509 | 8.1% |
| $50,000 to $74,999 | 2,366 | 12.7% |
| $75,000 to $99,999 | 2,180 | 11.7% |
| $100,000 to $149,999 | 4,993 | 26.8% |
| $150,000 to $199,999 | 2,291 | 12.3% |
| $200,000+ | 3,782 | 20.3% |
Household Income by Householder Age in Horizon West
The median household income in Horizon West is $118,064, with the highest median household income of $126,028 found in the 25 to 44 years age bracket for the primary householder. A total of 10,081 households (54.1%) fall into this category. Meanwhile, the 15 to 24 years age bracket for the primary householder has the lowest median household income of $54,578, with 499 households (2.7%) in this group.
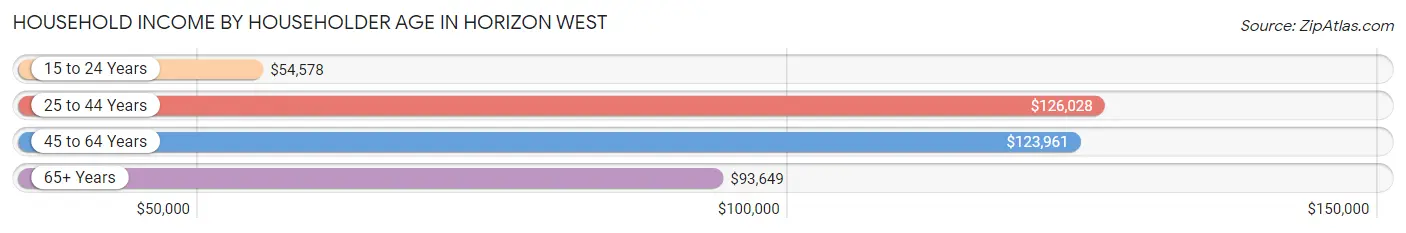
| Income Bracket | # Households | Median Income |
| 15 to 24 Years | 499 (2.7%) | $54,578 |
| 25 to 44 Years | 10,081 (54.1%) | $126,028 |
| 45 to 64 Years | 6,363 (34.2%) | $123,961 |
| 65+ Years | 1,686 (9.0%) | $93,649 |
| Total | 18,629 (100.0%) | $118,064 |
Poverty in Horizon West
Income Below Poverty by Sex and Age in Horizon West
With 7.0% poverty level for males and 8.3% for females among the residents of Horizon West, 75 year old and over males and 16 and 17 year old females are the most vulnerable to poverty, with 109 males (25.5%) and 243 females (56.9%) in their respective age groups living below the poverty level.
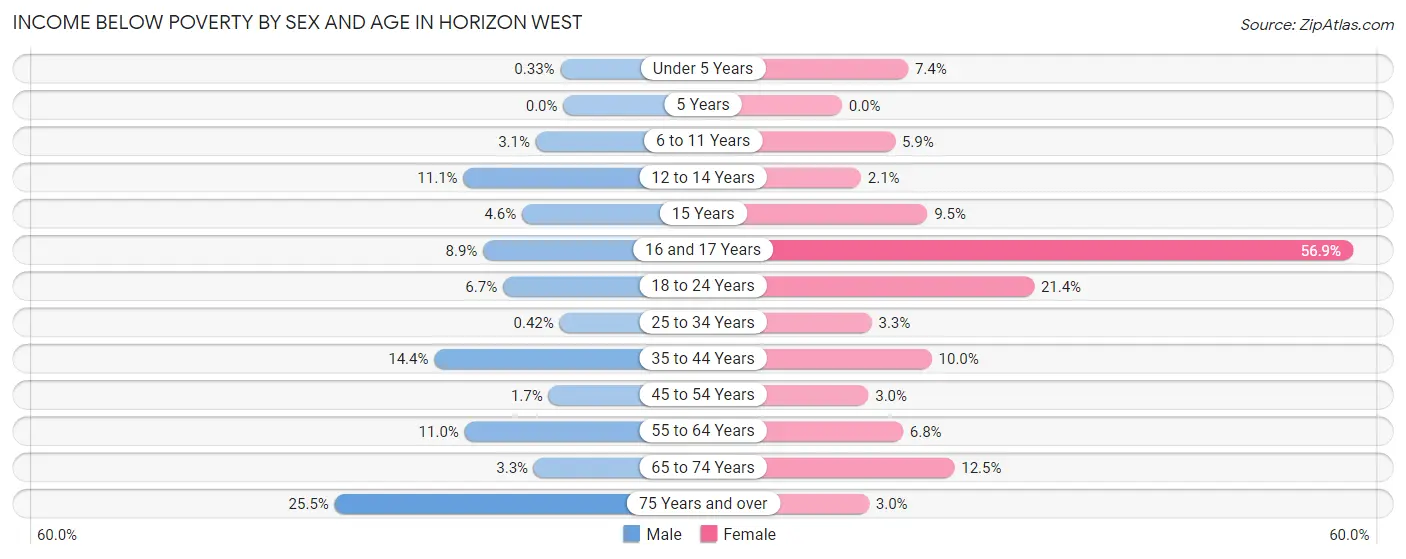
| Age Bracket | Male | Female |
| Under 5 Years | 6 (0.3%) | 197 (7.4%) |
| 5 Years | 0 (0.0%) | 0 (0.0%) |
| 6 to 11 Years | 79 (3.1%) | 255 (5.9%) |
| 12 to 14 Years | 218 (11.1%) | 33 (2.1%) |
| 15 Years | 19 (4.6%) | 62 (9.5%) |
| 16 and 17 Years | 76 (8.9%) | 243 (56.9%) |
| 18 to 24 Years | 82 (6.7%) | 509 (21.4%) |
| 25 to 34 Years | 13 (0.4%) | 133 (3.3%) |
| 35 to 44 Years | 965 (14.4%) | 725 (10.0%) |
| 45 to 54 Years | 64 (1.7%) | 110 (2.9%) |
| 55 to 64 Years | 206 (11.0%) | 129 (6.8%) |
| 65 to 74 Years | 54 (3.3%) | 186 (12.5%) |
| 75 Years and over | 109 (25.5%) | 21 (3.0%) |
| Total | 1,891 (7.0%) | 2,603 (8.3%) |
Income Above Poverty by Sex and Age in Horizon West
According to the poverty statistics in Horizon West, males aged 5 years and females aged 5 years are the age groups that are most secure financially, with 100.0% of males and 100.0% of females in these age groups living above the poverty line.
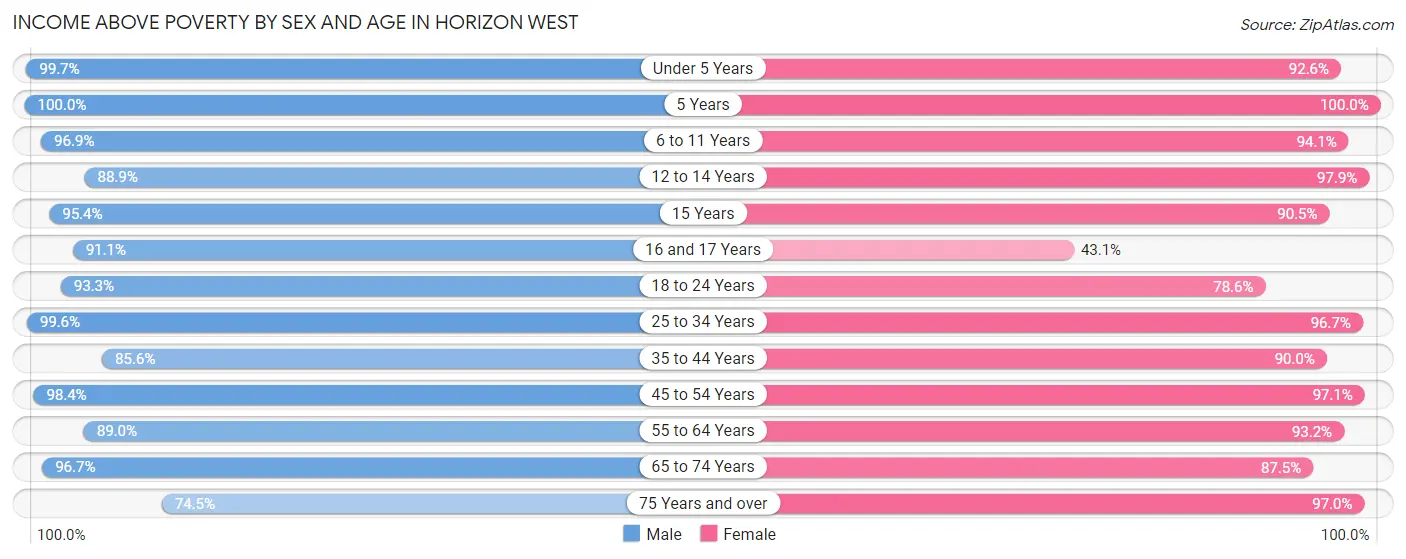
| Age Bracket | Male | Female |
| Under 5 Years | 1,820 (99.7%) | 2,476 (92.6%) |
| 5 Years | 384 (100.0%) | 246 (100.0%) |
| 6 to 11 Years | 2,496 (96.9%) | 4,053 (94.1%) |
| 12 to 14 Years | 1,740 (88.9%) | 1,527 (97.9%) |
| 15 Years | 395 (95.4%) | 590 (90.5%) |
| 16 and 17 Years | 775 (91.1%) | 184 (43.1%) |
| 18 to 24 Years | 1,139 (93.3%) | 1,869 (78.6%) |
| 25 to 34 Years | 3,116 (99.6%) | 3,882 (96.7%) |
| 35 to 44 Years | 5,749 (85.6%) | 6,526 (90.0%) |
| 45 to 54 Years | 3,822 (98.4%) | 3,617 (97.1%) |
| 55 to 64 Years | 1,668 (89.0%) | 1,769 (93.2%) |
| 65 to 74 Years | 1,594 (96.7%) | 1,298 (87.5%) |
| 75 Years and over | 319 (74.5%) | 677 (97.0%) |
| Total | 25,017 (93.0%) | 28,714 (91.7%) |
Income Below Poverty Among Married-Couple Families in Horizon West
The poverty statistics for married-couple families in Horizon West show that 5.0% or 615 of the total 12,413 families live below the poverty line. Families with 1 or 2 children have the highest poverty rate of 8.4%, comprising of 516 families. On the other hand, families with no children have the lowest poverty rate of 0.9%, which includes 43 families.
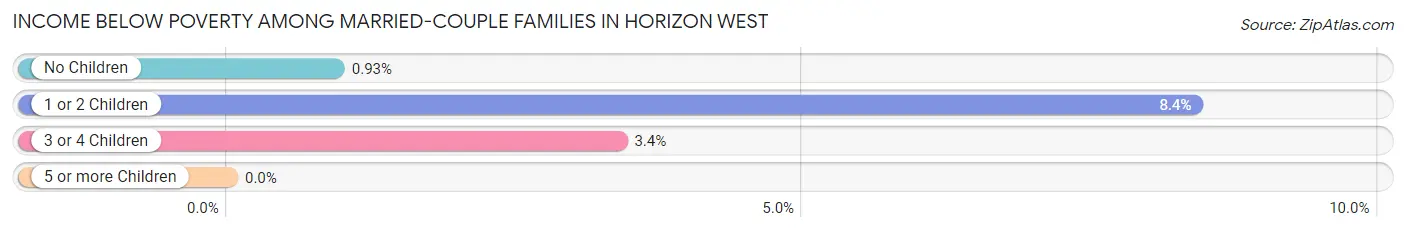
| Children | Above Poverty | Below Poverty |
| No Children | 4,575 (99.1%) | 43 (0.9%) |
| 1 or 2 Children | 5,626 (91.6%) | 516 (8.4%) |
| 3 or 4 Children | 1,597 (96.6%) | 56 (3.4%) |
| 5 or more Children | 0 (0.0%) | 0 (0.0%) |
| Total | 11,798 (95.1%) | 615 (5.0%) |
Income Below Poverty Among Single-Parent Households in Horizon West
According to the poverty data in Horizon West, 3.9% or 18 single-father households and 10.7% or 150 single-mother households are living below the poverty line. Among single-father households, those with 1 or 2 children have the highest poverty rate, with 18 households (6.1%) experiencing poverty. Likewise, among single-mother households, those with 1 or 2 children have the highest poverty rate, with 126 households (15.5%) falling below the poverty line.
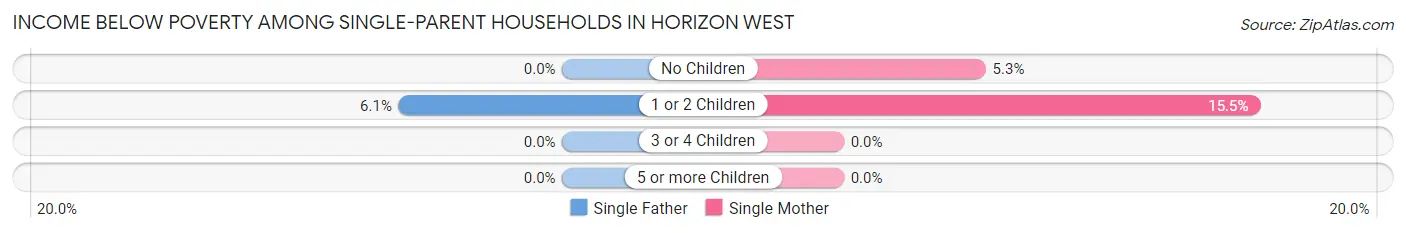
| Children | Single Father | Single Mother |
| No Children | 0 (0.0%) | 24 (5.3%) |
| 1 or 2 Children | 18 (6.1%) | 126 (15.5%) |
| 3 or 4 Children | 0 (0.0%) | 0 (0.0%) |
| 5 or more Children | 0 (0.0%) | 0 (0.0%) |
| Total | 18 (3.9%) | 150 (10.7%) |
Income Below Poverty Among Married-Couple vs Single-Parent Households in Horizon West
The poverty data for Horizon West shows that 615 of the married-couple family households (5.0%) and 168 of the single-parent households (9.0%) are living below the poverty level. Within the married-couple family households, those with 1 or 2 children have the highest poverty rate, with 516 households (8.4%) falling below the poverty line. Among the single-parent households, those with 1 or 2 children have the highest poverty rate, with 144 household (13.0%) living below poverty.
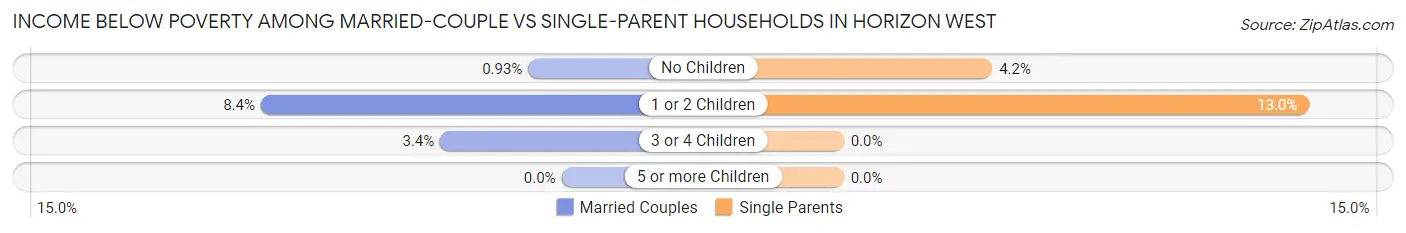
| Children | Married-Couple Families | Single-Parent Households |
| No Children | 43 (0.9%) | 24 (4.2%) |
| 1 or 2 Children | 516 (8.4%) | 144 (13.0%) |
| 3 or 4 Children | 56 (3.4%) | 0 (0.0%) |
| 5 or more Children | 0 (0.0%) | 0 (0.0%) |
| Total | 615 (5.0%) | 168 (9.0%) |
Race in Horizon West
The most populous races in Horizon West are White / Caucasian (37,687 | 64.3%), Hispanic or Latino (13,040 | 22.3%), and Two or more Races (12,707 | 21.7%).
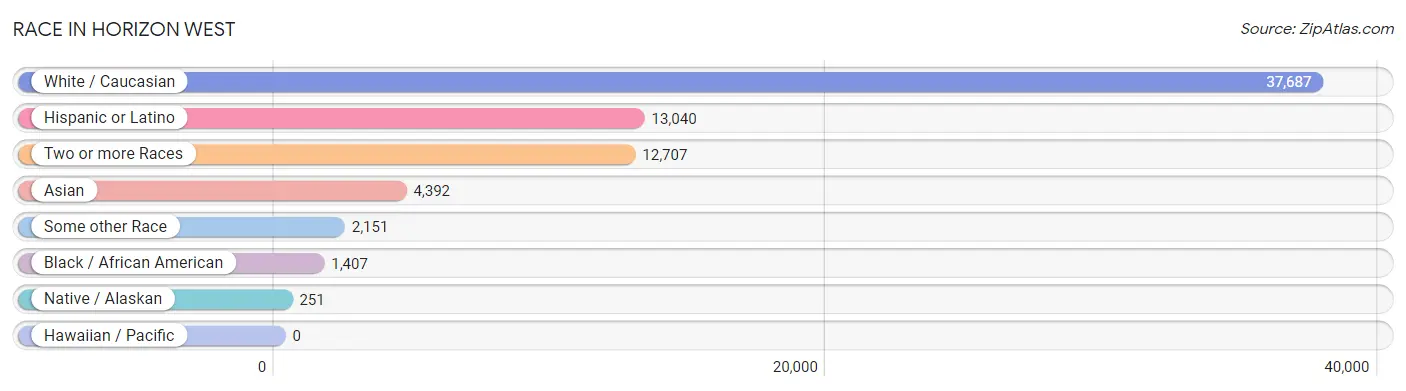
| Race | # Population | % Population |
| Asian | 4,392 | 7.5% |
| Black / African American | 1,407 | 2.4% |
| Hawaiian / Pacific | 0 | 0.0% |
| Hispanic or Latino | 13,040 | 22.3% |
| Native / Alaskan | 251 | 0.4% |
| White / Caucasian | 37,687 | 64.3% |
| Two or more Races | 12,707 | 21.7% |
| Some other Race | 2,151 | 3.7% |
| Total | 58,595 | 100.0% |
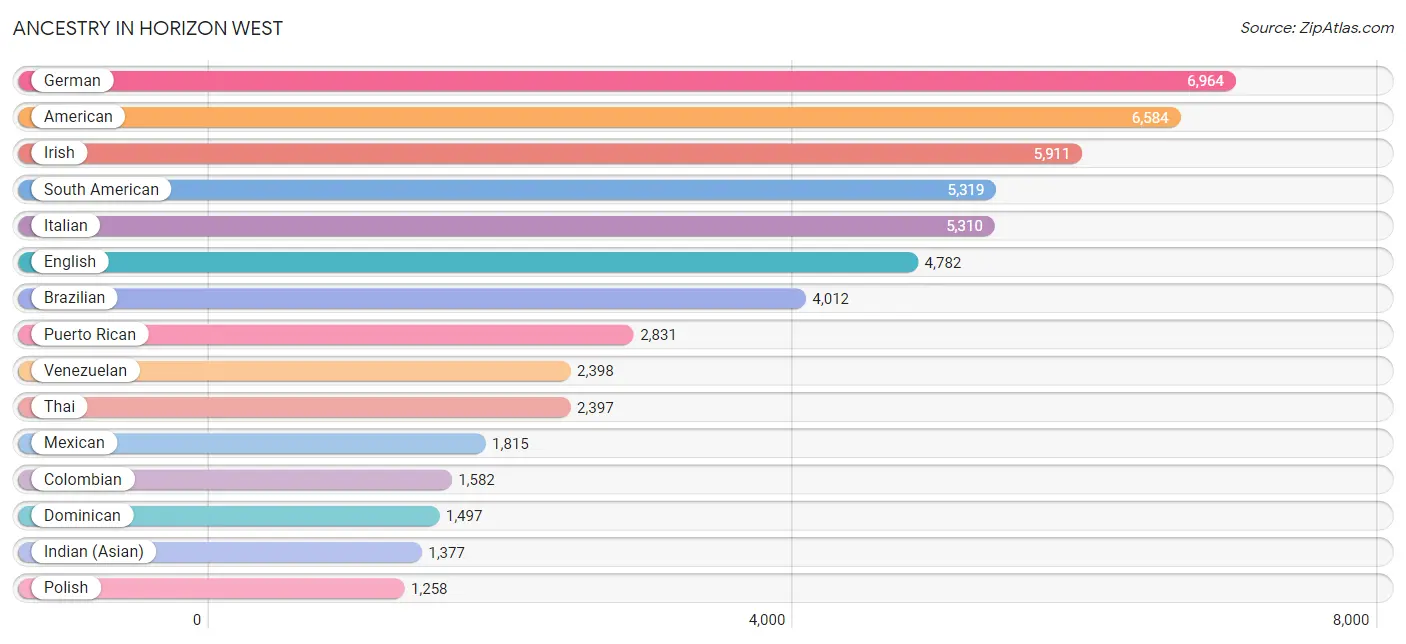
Ancestry in Horizon West
The most populous ancestries reported in Horizon West are German (6,964 | 11.9%), American (6,584 | 11.2%), Irish (5,911 | 10.1%), South American (5,319 | 9.1%), and Italian (5,310 | 9.1%), together accounting for 51.3% of all Horizon West residents.
| Ancestry | # Population | % Population |
| African | 227 | 0.4% |
| American | 6,584 | 11.2% |
| Apache | 39 | 0.1% |
| Arab | 822 | 1.4% |
| Argentinean | 257 | 0.4% |
| Armenian | 61 | 0.1% |
| Austrian | 202 | 0.3% |
| Belgian | 40 | 0.1% |
| Bhutanese | 84 | 0.1% |
| Brazilian | 4,012 | 6.9% |
| British | 598 | 1.0% |
| British West Indian | 46 | 0.1% |
| Bulgarian | 148 | 0.3% |
| Burmese | 342 | 0.6% |
| Cajun | 83 | 0.1% |
| Central American | 219 | 0.4% |
| Central American Indian | 909 | 1.5% |
| Cherokee | 65 | 0.1% |
| Choctaw | 87 | 0.2% |
| Colombian | 1,582 | 2.7% |
| Costa Rican | 40 | 0.1% |
| Croatian | 82 | 0.1% |
| Cuban | 941 | 1.6% |
| Czech | 340 | 0.6% |
| Danish | 10 | 0.0% |
| Dominican | 1,497 | 2.5% |
| Dutch | 975 | 1.7% |
| Eastern European | 110 | 0.2% |
| Ecuadorian | 191 | 0.3% |
| Egyptian | 135 | 0.2% |
| English | 4,782 | 8.2% |
| Ethiopian | 78 | 0.1% |
| European | 747 | 1.3% |
| Finnish | 99 | 0.2% |
| French | 775 | 1.3% |
| French Canadian | 168 | 0.3% |
| German | 6,964 | 11.9% |
| Greek | 399 | 0.7% |
| Guyanese | 67 | 0.1% |
| Hungarian | 551 | 0.9% |
| Indian (Asian) | 1,377 | 2.4% |
| Iranian | 686 | 1.2% |
| Irish | 5,911 | 10.1% |
| Italian | 5,310 | 9.1% |
| Jamaican | 301 | 0.5% |
| Korean | 552 | 0.9% |
| Latvian | 30 | 0.1% |
| Lebanese | 582 | 1.0% |
| Lithuanian | 42 | 0.1% |
| Malaysian | 115 | 0.2% |
| Mexican | 1,815 | 3.1% |
| Mexican American Indian | 772 | 1.3% |
| Moroccan | 105 | 0.2% |
| Nigerian | 170 | 0.3% |
| Northern European | 48 | 0.1% |
| Norwegian | 243 | 0.4% |
| Panamanian | 110 | 0.2% |
| Paraguayan | 37 | 0.1% |
| Pennsylvania German | 155 | 0.3% |
| Peruvian | 351 | 0.6% |
| Polish | 1,258 | 2.1% |
| Portuguese | 1,016 | 1.7% |
| Puerto Rican | 2,831 | 4.8% |
| Romanian | 82 | 0.1% |
| Russian | 345 | 0.6% |
| Salvadoran | 69 | 0.1% |
| Scandinavian | 68 | 0.1% |
| Scotch-Irish | 82 | 0.1% |
| Scottish | 464 | 0.8% |
| Slavic | 17 | 0.0% |
| Slovak | 54 | 0.1% |
| South American | 5,319 | 9.1% |
| South American Indian | 89 | 0.2% |
| Spaniard | 104 | 0.2% |
| Spanish | 83 | 0.1% |
| Sri Lankan | 557 | 0.9% |
| Subsaharan African | 475 | 0.8% |
| Swedish | 278 | 0.5% |
| Thai | 2,397 | 4.1% |
| Turkish | 75 | 0.1% |
| Ukrainian | 270 | 0.5% |
| Uruguayan | 503 | 0.9% |
| Venezuelan | 2,398 | 4.1% |
| Welsh | 152 | 0.3% |
| West Indian | 18 | 0.0% | View All 85 Rows |
Immigrants in Horizon West
The most numerous immigrant groups reported in Horizon West came from Latin America (9,272 | 15.8%), South America (7,977 | 13.6%), Brazil (4,097 | 7.0%), Asia (3,402 | 5.8%), and Venezuela (1,992 | 3.4%), together accounting for 45.6% of all Horizon West residents.
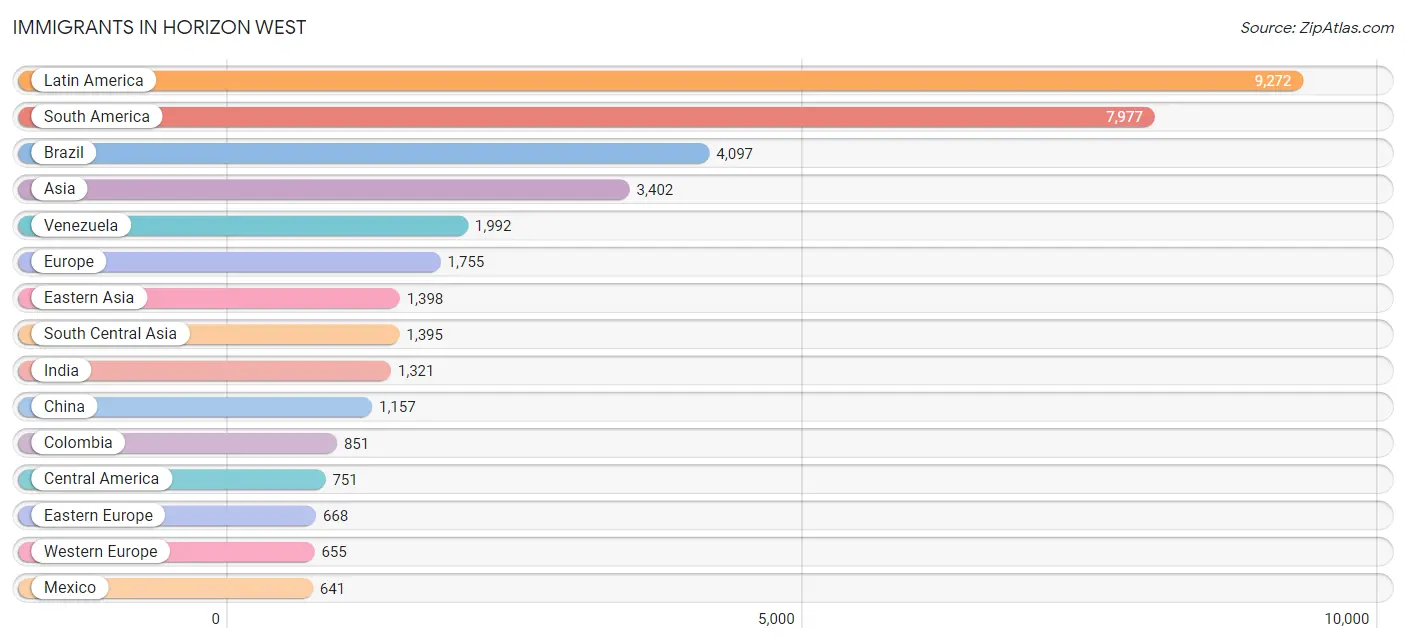
| Immigration Origin | # Population | % Population |
| Africa | 397 | 0.7% |
| Argentina | 220 | 0.4% |
| Asia | 3,402 | 5.8% |
| Belarus | 65 | 0.1% |
| Brazil | 4,097 | 7.0% |
| Bulgaria | 279 | 0.5% |
| Canada | 122 | 0.2% |
| Caribbean | 544 | 0.9% |
| Central America | 751 | 1.3% |
| China | 1,157 | 2.0% |
| Colombia | 851 | 1.5% |
| Croatia | 54 | 0.1% |
| Cuba | 148 | 0.3% |
| Dominican Republic | 285 | 0.5% |
| Eastern Africa | 168 | 0.3% |
| Eastern Asia | 1,398 | 2.4% |
| Eastern Europe | 668 | 1.1% |
| Egypt | 47 | 0.1% |
| England | 266 | 0.4% |
| Ethiopia | 32 | 0.1% |
| Europe | 1,755 | 3.0% |
| France | 17 | 0.0% |
| Germany | 15 | 0.0% |
| Guyana | 125 | 0.2% |
| Hong Kong | 27 | 0.1% |
| Hungary | 59 | 0.1% |
| India | 1,321 | 2.2% |
| Iran | 41 | 0.1% |
| Ireland | 18 | 0.0% |
| Jamaica | 111 | 0.2% |
| Korea | 241 | 0.4% |
| Latin America | 9,272 | 15.8% |
| Mexico | 641 | 1.1% |
| Middle Africa | 99 | 0.2% |
| Morocco | 83 | 0.1% |
| Netherlands | 623 | 1.1% |
| Northern Africa | 130 | 0.2% |
| Northern Europe | 432 | 0.7% |
| Pakistan | 33 | 0.1% |
| Panama | 110 | 0.2% |
| Peru | 189 | 0.3% |
| Philippines | 301 | 0.5% |
| Poland | 167 | 0.3% |
| Russia | 44 | 0.1% |
| South America | 7,977 | 13.6% |
| South Central Asia | 1,395 | 2.4% |
| South Eastern Asia | 572 | 1.0% |
| Sweden | 51 | 0.1% |
| Turkey | 37 | 0.1% |
| Uganda | 18 | 0.0% |
| Uruguay | 503 | 0.9% |
| Venezuela | 1,992 | 3.4% |
| Vietnam | 271 | 0.5% |
| Western Asia | 37 | 0.1% |
| Western Europe | 655 | 1.1% |
| Zimbabwe | 101 | 0.2% | View All 56 Rows |
Sex and Age in Horizon West
Sex and Age in Horizon West
The most populous age groups in Horizon West are 40 to 44 Years (3,662 | 13.6%) for men and 35 to 39 Years (4,003 | 12.7%) for women.
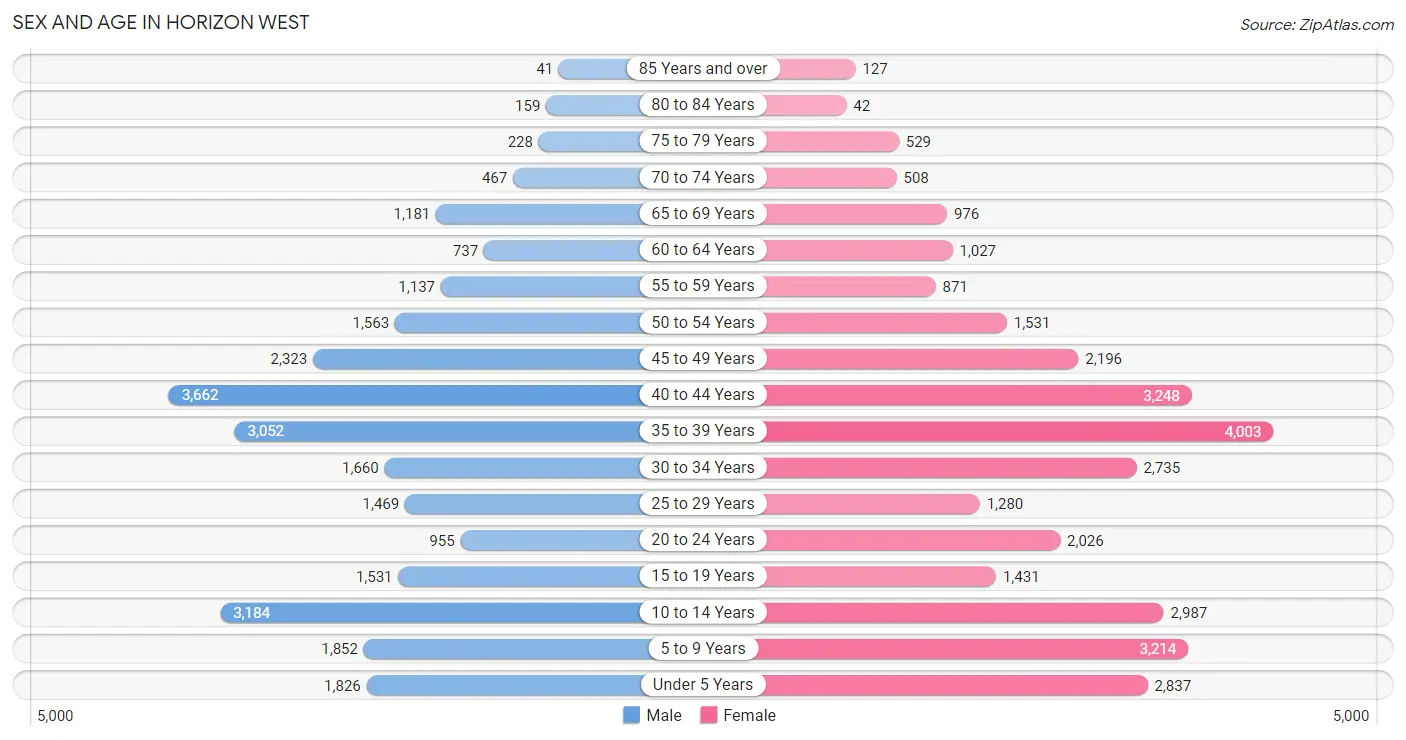
| Age Bracket | Male | Female |
| Under 5 Years | 1,826 (6.8%) | 2,837 (9.0%) |
| 5 to 9 Years | 1,852 (6.9%) | 3,214 (10.2%) |
| 10 to 14 Years | 3,184 (11.8%) | 2,987 (9.5%) |
| 15 to 19 Years | 1,531 (5.7%) | 1,431 (4.5%) |
| 20 to 24 Years | 955 (3.5%) | 2,026 (6.4%) |
| 25 to 29 Years | 1,469 (5.4%) | 1,280 (4.1%) |
| 30 to 34 Years | 1,660 (6.1%) | 2,735 (8.7%) |
| 35 to 39 Years | 3,052 (11.3%) | 4,003 (12.7%) |
| 40 to 44 Years | 3,662 (13.6%) | 3,248 (10.3%) |
| 45 to 49 Years | 2,323 (8.6%) | 2,196 (7.0%) |
| 50 to 54 Years | 1,563 (5.8%) | 1,531 (4.9%) |
| 55 to 59 Years | 1,137 (4.2%) | 871 (2.8%) |
| 60 to 64 Years | 737 (2.7%) | 1,027 (3.3%) |
| 65 to 69 Years | 1,181 (4.4%) | 976 (3.1%) |
| 70 to 74 Years | 467 (1.7%) | 508 (1.6%) |
| 75 to 79 Years | 228 (0.8%) | 529 (1.7%) |
| 80 to 84 Years | 159 (0.6%) | 42 (0.1%) |
| 85 Years and over | 41 (0.2%) | 127 (0.4%) |
| Total | 27,027 (100.0%) | 31,568 (100.0%) |
Families and Households in Horizon West
Median Family Size in Horizon West
The median family size in Horizon West is 3.53 persons per family, with married-couple families (12,413 | 87.0%) accounting for the largest median family size of 3.58 persons per family. On the other hand, single female/mother families (1,397 | 9.8%) represent the smallest median family size with 3.10 persons per family.
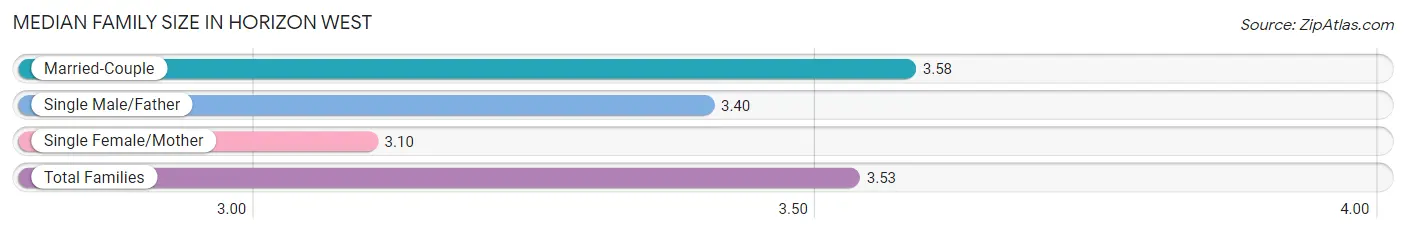
| Family Type | # Families | Family Size |
| Married-Couple | 12,413 (87.0%) | 3.58 |
| Single Male/Father | 460 (3.2%) | 3.40 |
| Single Female/Mother | 1,397 (9.8%) | 3.10 |
| Total Families | 14,270 (100.0%) | 3.53 |
Median Household Size in Horizon West
The median household size in Horizon West is 3.14 persons per household, with single male/father households (460 | 2.5%) accounting for the largest median household size of 3.78 persons per household. non-family households (4,359 | 23.4%) represent the smallest median household size with 1.66 persons per household.
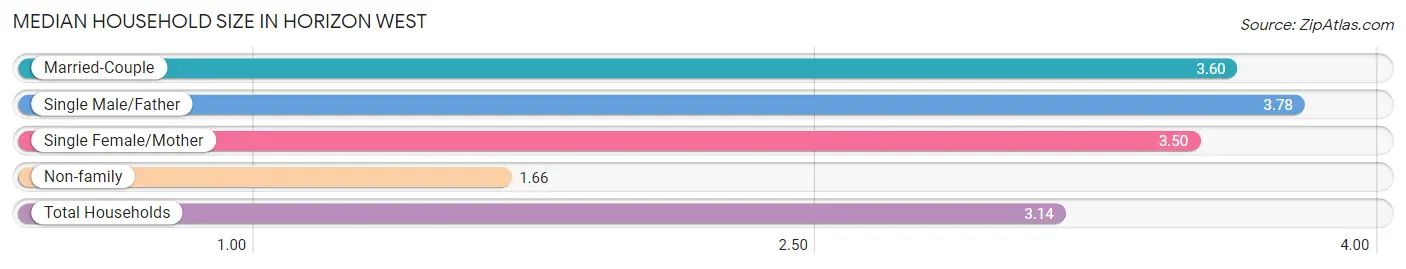
| Household Type | # Households | Household Size |
| Married-Couple | 12,413 (66.6%) | 3.60 |
| Single Male/Father | 460 (2.5%) | 3.78 |
| Single Female/Mother | 1,397 (7.5%) | 3.50 |
| Non-family | 4,359 (23.4%) | 1.66 |
| Total Households | 18,629 (100.0%) | 3.14 |
Household Size by Marriage Status in Horizon West
Out of a total of 18,629 households in Horizon West, 14,270 (76.6%) are family households, while 4,359 (23.4%) are nonfamily households. The most numerous type of family households are 4-person households, comprising 4,398, and the most common type of nonfamily households are 1-person households, comprising 2,764.
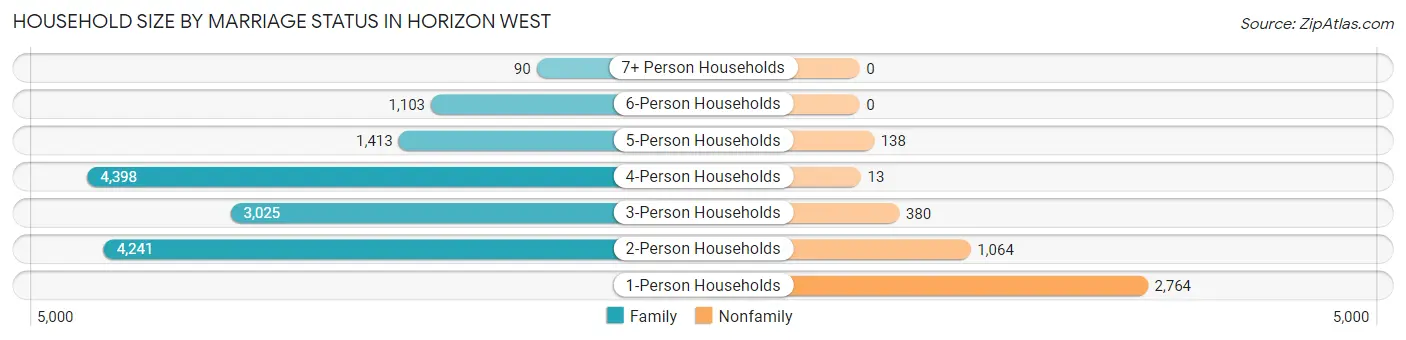
| Household Size | Family Households | Nonfamily Households |
| 1-Person Households | - | 2,764 (14.8%) |
| 2-Person Households | 4,241 (22.8%) | 1,064 (5.7%) |
| 3-Person Households | 3,025 (16.2%) | 380 (2.0%) |
| 4-Person Households | 4,398 (23.6%) | 13 (0.1%) |
| 5-Person Households | 1,413 (7.6%) | 138 (0.7%) |
| 6-Person Households | 1,103 (5.9%) | 0 (0.0%) |
| 7+ Person Households | 90 (0.5%) | 0 (0.0%) |
| Total | 14,270 (76.6%) | 4,359 (23.4%) |
Female Fertility in Horizon West
Fertility by Age in Horizon West
Average fertility rate in Horizon West is 18.0 births per 1,000 women. Women in the age bracket of 20 to 34 years have the highest fertility rate with 22.0 births per 1,000 women. Women in the age bracket of 35 to 50 years acount for 57.1% of all women with births.
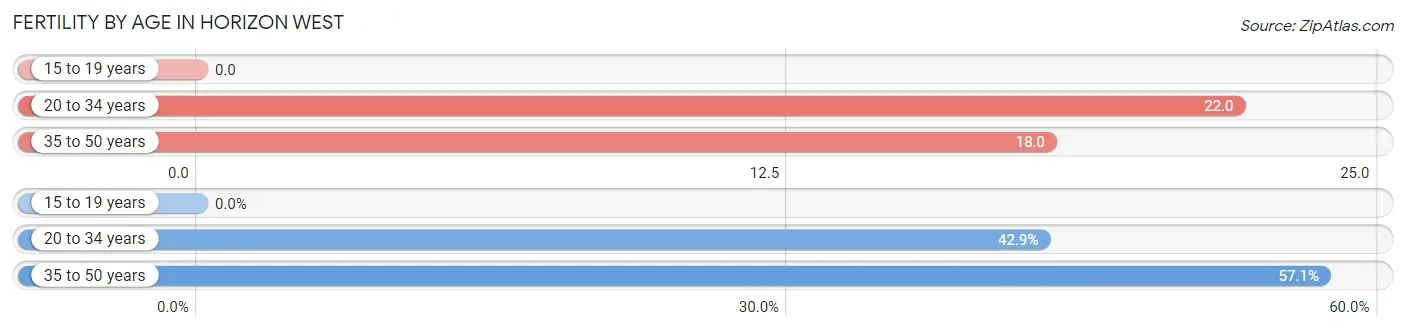
| Age Bracket | Women with Births | Births / 1,000 Women |
| 15 to 19 years | 0 (0.0%) | 0.0 |
| 20 to 34 years | 132 (42.9%) | 22.0 |
| 35 to 50 years | 176 (57.1%) | 18.0 |
| Total | 308 (100.0%) | 18.0 |
Fertility by Age by Marriage Status in Horizon West
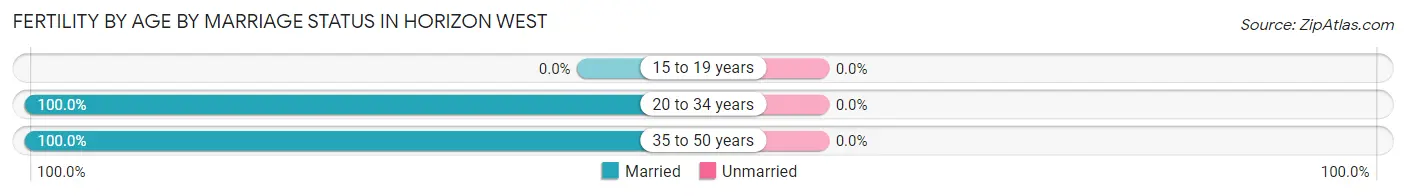
| Age Bracket | Married | Unmarried |
| 15 to 19 years | 0 (0.0%) | 0 (0.0%) |
| 20 to 34 years | 132 (100.0%) | 0 (0.0%) |
| 35 to 50 years | 176 (100.0%) | 0 (0.0%) |
| Total | 308 (100.0%) | 0 (0.0%) |
Fertility by Education in Horizon West
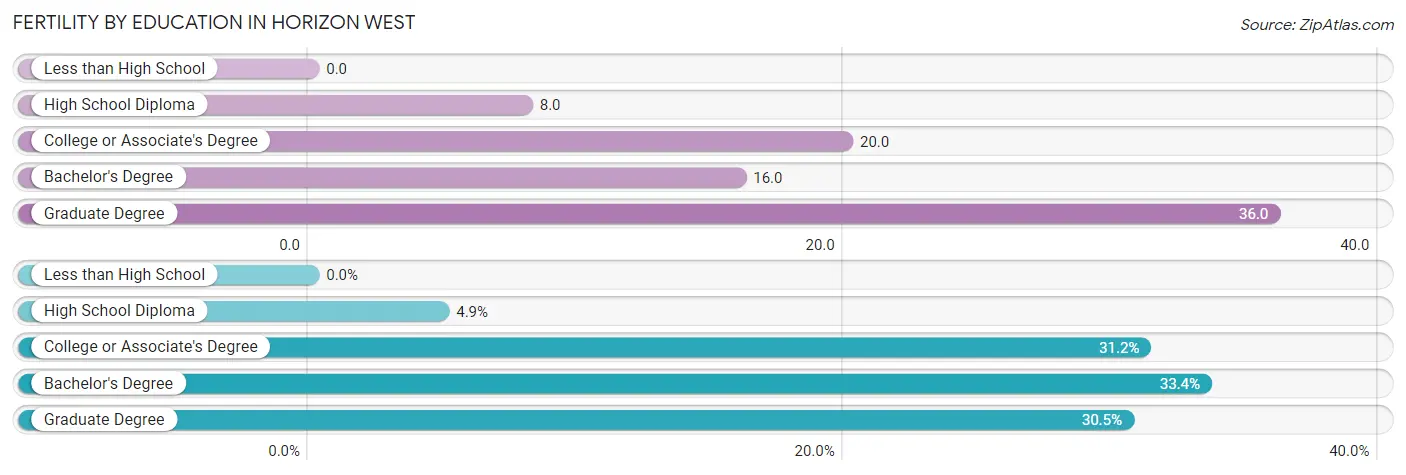
| Educational Attainment | Women with Births | Births / 1,000 Women |
| Less than High School | 0 (0.0%) | 0.0 |
| High School Diploma | 15 (4.9%) | 8.0 |
| College or Associate's Degree | 96 (31.2%) | 20.0 |
| Bachelor's Degree | 103 (33.4%) | 16.0 |
| Graduate Degree | 94 (30.5%) | 36.0 |
| Total | 308 (100.0%) | 18.0 |
Fertility by Education by Marriage Status in Horizon West
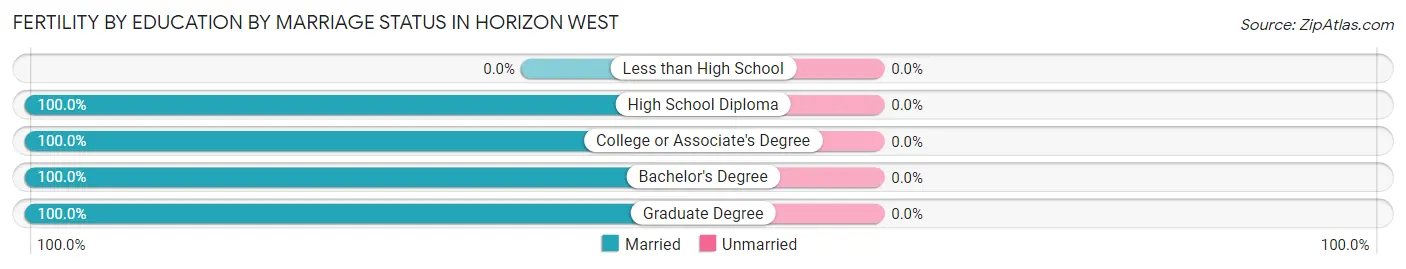
| Educational Attainment | Married | Unmarried |
| Less than High School | 0 (0.0%) | 0 (0.0%) |
| High School Diploma | 15 (100.0%) | 0 (0.0%) |
| College or Associate's Degree | 96 (100.0%) | 0 (0.0%) |
| Bachelor's Degree | 103 (100.0%) | 0 (0.0%) |
| Graduate Degree | 94 (100.0%) | 0 (0.0%) |
| Total | 308 (100.0%) | 0 (0.0%) |
Employment Characteristics in Horizon West
Employment by Class of Employer in Horizon West
Among the 28,935 employed individuals in Horizon West, private company employees (20,709 | 71.6%), self-employed (not incorporated) (2,469 | 8.5%), and not-for-profit organizations (2,138 | 7.4%) make up the most common classes of employment.
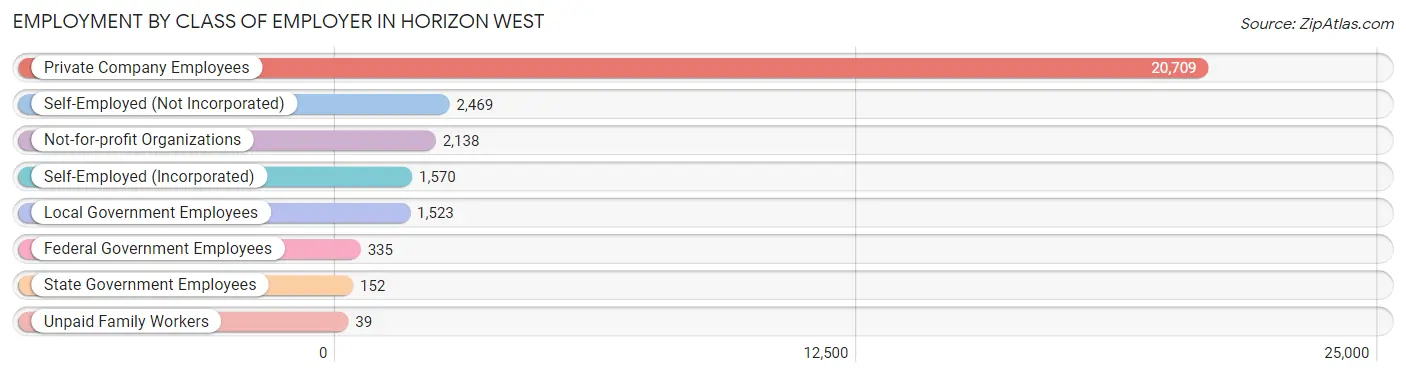
| Employer Class | # Employees | % Employees |
| Private Company Employees | 20,709 | 71.6% |
| Self-Employed (Incorporated) | 1,570 | 5.4% |
| Self-Employed (Not Incorporated) | 2,469 | 8.5% |
| Not-for-profit Organizations | 2,138 | 7.4% |
| Local Government Employees | 1,523 | 5.3% |
| State Government Employees | 152 | 0.5% |
| Federal Government Employees | 335 | 1.2% |
| Unpaid Family Workers | 39 | 0.1% |
| Total | 28,935 | 100.0% |
Employment Status by Age in Horizon West
According to the labor force statistics for Horizon West, out of the total population over 16 years of age (41,629), 73.4% or 30,556 individuals are in the labor force, with 3.4% or 1,039 of them unemployed. The age group with the highest labor force participation rate is 25 to 29 years, with 93.2% or 2,562 individuals in the labor force. Within the labor force, the 16 to 19 years age range has the highest percentage of unemployed individuals, with 15.3% or 50 of them being unemployed.
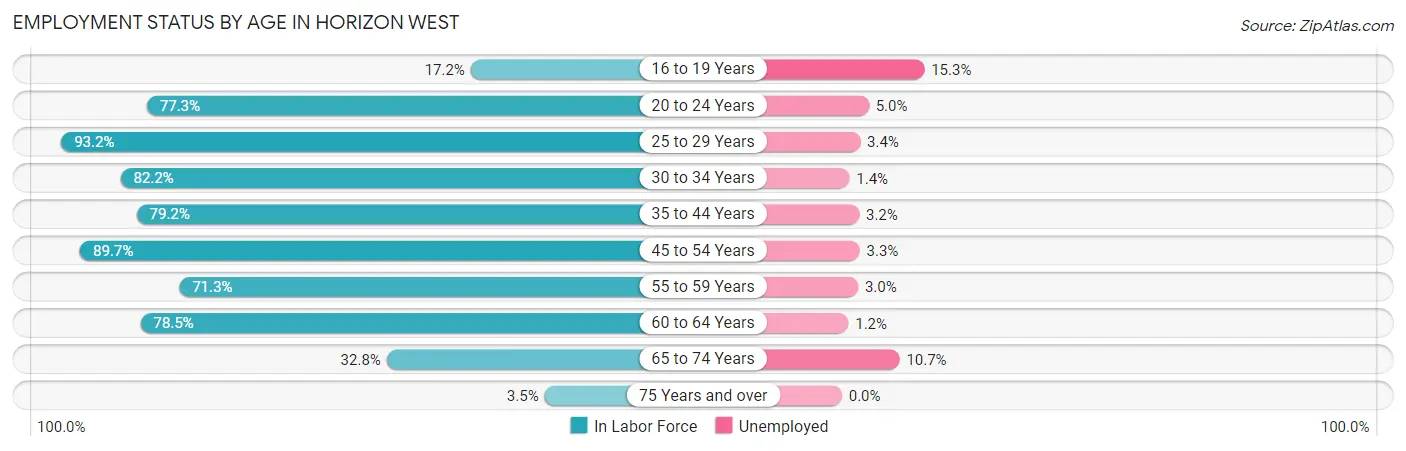
| Age Bracket | In Labor Force | Unemployed |
| 16 to 19 Years | 326 (17.2%) | 50 (15.3%) |
| 20 to 24 Years | 2,304 (77.3%) | 115 (5.0%) |
| 25 to 29 Years | 2,562 (93.2%) | 87 (3.4%) |
| 30 to 34 Years | 3,613 (82.2%) | 51 (1.4%) |
| 35 to 44 Years | 11,060 (79.2%) | 354 (3.2%) |
| 45 to 54 Years | 6,829 (89.7%) | 225 (3.3%) |
| 55 to 59 Years | 1,432 (71.3%) | 43 (3.0%) |
| 60 to 64 Years | 1,385 (78.5%) | 17 (1.2%) |
| 65 to 74 Years | 1,027 (32.8%) | 110 (10.7%) |
| 75 Years and over | 39 (3.5%) | 0 (0.0%) |
| Total | 30,556 (73.4%) | 1,039 (3.4%) |
Employment Status by Educational Attainment in Horizon West
According to labor force statistics for Horizon West, 82.7% of individuals (26,873) out of the total population between 25 and 64 years of age (32,494) are in the labor force, with 2.9% or 779 of them being unemployed. The group with the highest labor force participation rate are those with the educational attainment of bachelor's degree or higher, with 85.5% or 15,756 individuals in the labor force. Within the labor force, individuals with college / associate degree education have the highest percentage of unemployment, with 4.6% or 379 of them being unemployed.
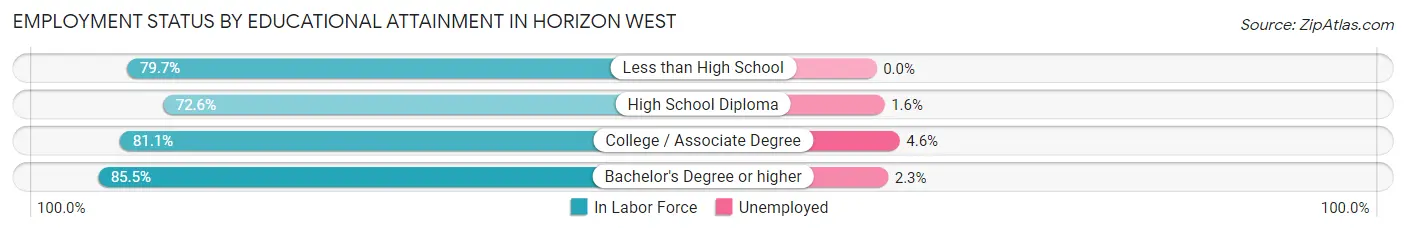
| Educational Attainment | In Labor Force | Unemployed |
| Less than High School | 365 (79.7%) | 0 (0.0%) |
| High School Diploma | 2,512 (72.6%) | 55 (1.6%) |
| College / Associate Degree | 8,230 (81.1%) | 467 (4.6%) |
| Bachelor's Degree or higher | 15,756 (85.5%) | 424 (2.3%) |
| Total | 26,873 (82.7%) | 942 (2.9%) |
Employment Occupations by Sex in Horizon West
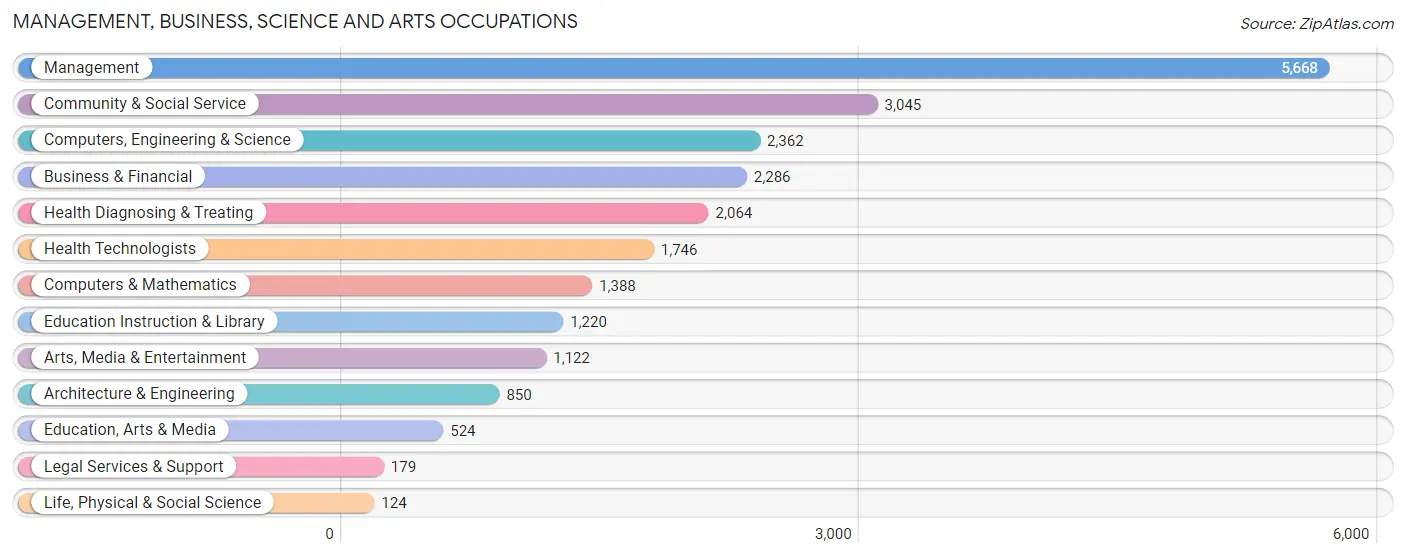
Management, Business, Science and Arts Occupations
The most common Management, Business, Science and Arts occupations in Horizon West are Management (5,668 | 19.2%), Community & Social Service (3,045 | 10.3%), Computers, Engineering & Science (2,362 | 8.0%), Business & Financial (2,286 | 7.7%), and Health Diagnosing & Treating (2,064 | 7.0%).
Management, Business, Science and Arts Occupations by Sex
Within the Management, Business, Science and Arts occupations in Horizon West, the most male-oriented occupations are Architecture & Engineering (95.8%), Computers, Engineering & Science (83.6%), and Computers & Mathematics (79.7%), while the most female-oriented occupations are Education Instruction & Library (88.3%), Health Diagnosing & Treating (79.0%), and Health Technologists (76.2%).
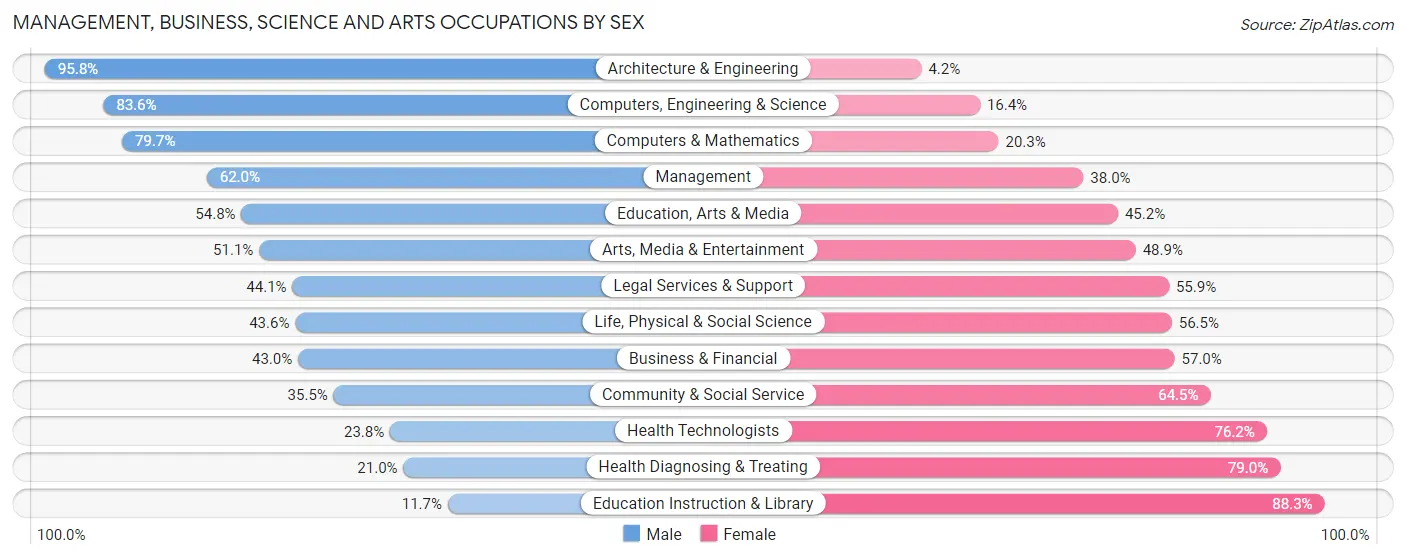
| Occupation | Male | Female |
| Management | 3,513 (62.0%) | 2,155 (38.0%) |
| Business & Financial | 982 (43.0%) | 1,304 (57.0%) |
| Computers, Engineering & Science | 1,974 (83.6%) | 388 (16.4%) |
| Computers & Mathematics | 1,106 (79.7%) | 282 (20.3%) |
| Architecture & Engineering | 814 (95.8%) | 36 (4.2%) |
| Life, Physical & Social Science | 54 (43.5%) | 70 (56.5%) |
| Community & Social Service | 1,082 (35.5%) | 1,963 (64.5%) |
| Education, Arts & Media | 287 (54.8%) | 237 (45.2%) |
| Legal Services & Support | 79 (44.1%) | 100 (55.9%) |
| Education Instruction & Library | 143 (11.7%) | 1,077 (88.3%) |
| Arts, Media & Entertainment | 573 (51.1%) | 549 (48.9%) |
| Health Diagnosing & Treating | 433 (21.0%) | 1,631 (79.0%) |
| Health Technologists | 415 (23.8%) | 1,331 (76.2%) |
| Total (Category) | 7,984 (51.8%) | 7,441 (48.2%) |
| Total (Overall) | 15,433 (52.3%) | 14,046 (47.6%) |
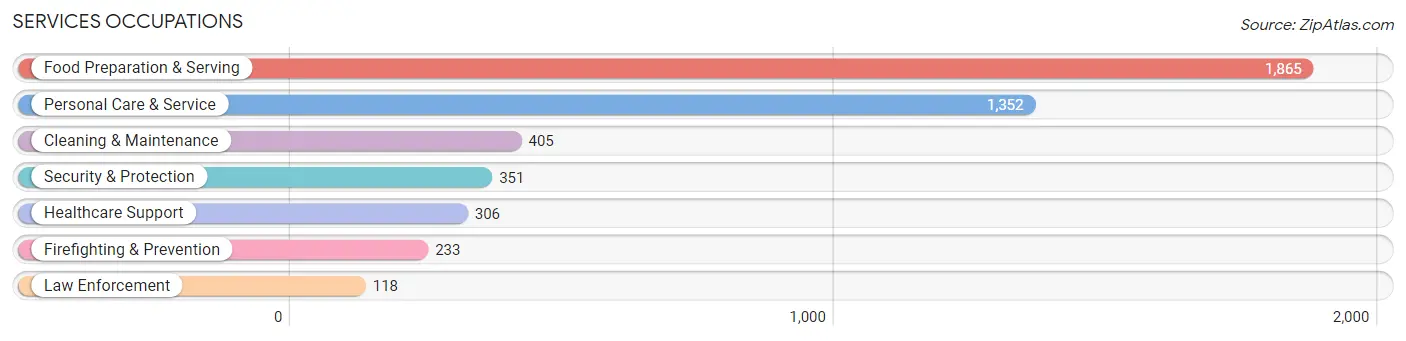
Services Occupations
The most common Services occupations in Horizon West are Food Preparation & Serving (1,865 | 6.3%), Personal Care & Service (1,352 | 4.6%), Cleaning & Maintenance (405 | 1.4%), Security & Protection (351 | 1.2%), and Healthcare Support (306 | 1.0%).
Services Occupations by Sex
Within the Services occupations in Horizon West, the most male-oriented occupations are Law Enforcement (100.0%), Cleaning & Maintenance (66.2%), and Security & Protection (45.9%), while the most female-oriented occupations are Firefighting & Prevention (81.6%), Personal Care & Service (65.0%), and Healthcare Support (64.4%).
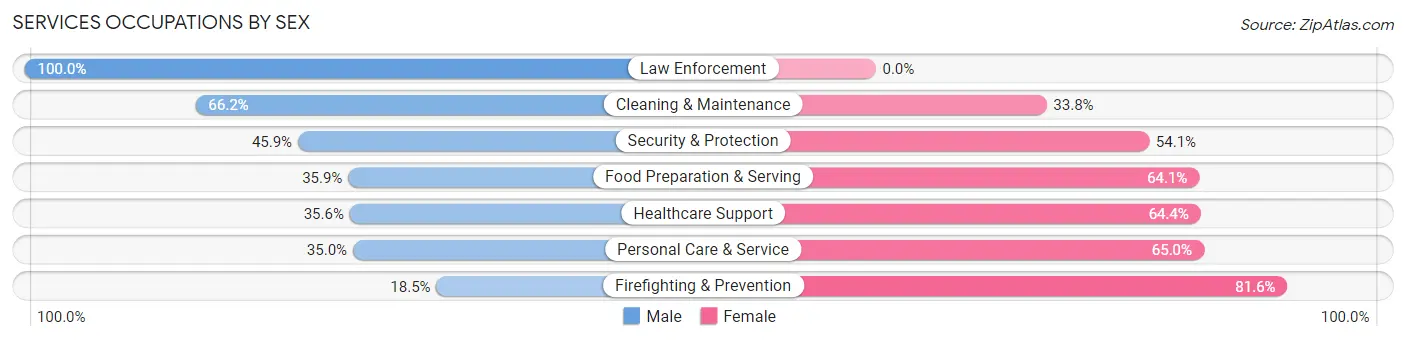
| Occupation | Male | Female |
| Healthcare Support | 109 (35.6%) | 197 (64.4%) |
| Security & Protection | 161 (45.9%) | 190 (54.1%) |
| Firefighting & Prevention | 43 (18.4%) | 190 (81.6%) |
| Law Enforcement | 118 (100.0%) | 0 (0.0%) |
| Food Preparation & Serving | 670 (35.9%) | 1,195 (64.1%) |
| Cleaning & Maintenance | 268 (66.2%) | 137 (33.8%) |
| Personal Care & Service | 473 (35.0%) | 879 (65.0%) |
| Total (Category) | 1,681 (39.3%) | 2,598 (60.7%) |
| Total (Overall) | 15,433 (52.3%) | 14,046 (47.6%) |
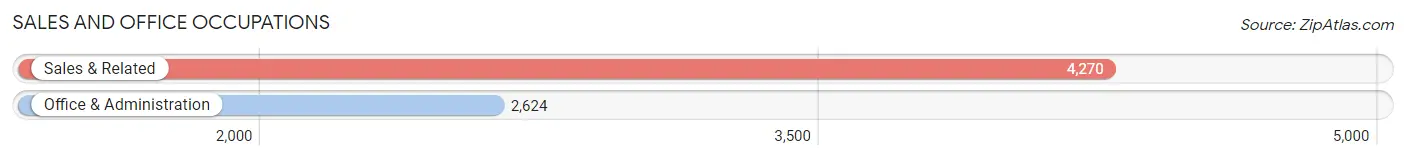
Sales and Office Occupations
The most common Sales and Office occupations in Horizon West are Sales & Related (4,270 | 14.5%), and Office & Administration (2,624 | 8.9%).
Sales and Office Occupations by Sex
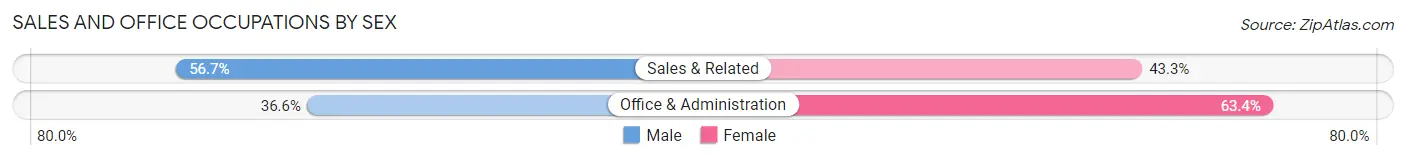
| Occupation | Male | Female |
| Sales & Related | 2,420 (56.7%) | 1,850 (43.3%) |
| Office & Administration | 960 (36.6%) | 1,664 (63.4%) |
| Total (Category) | 3,380 (49.0%) | 3,514 (51.0%) |
| Total (Overall) | 15,433 (52.3%) | 14,046 (47.6%) |
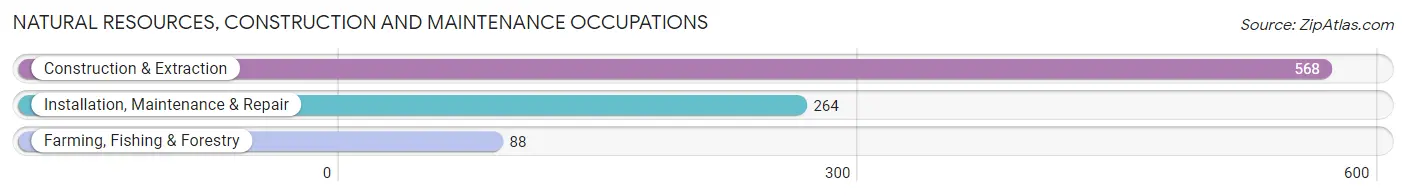
Natural Resources, Construction and Maintenance Occupations
The most common Natural Resources, Construction and Maintenance occupations in Horizon West are Construction & Extraction (568 | 1.9%), Installation, Maintenance & Repair (264 | 0.9%), and Farming, Fishing & Forestry (88 | 0.3%).
Natural Resources, Construction and Maintenance Occupations by Sex
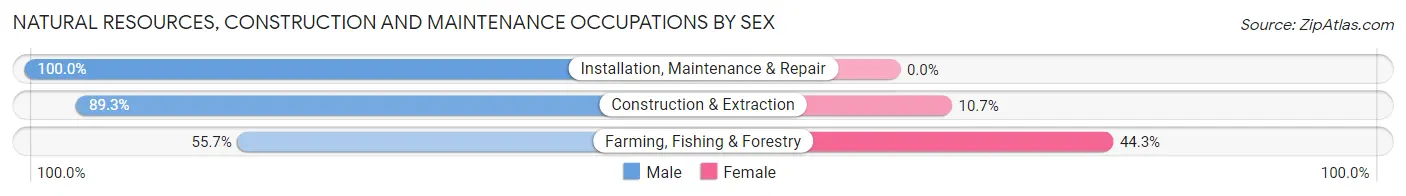
| Occupation | Male | Female |
| Farming, Fishing & Forestry | 49 (55.7%) | 39 (44.3%) |
| Construction & Extraction | 507 (89.3%) | 61 (10.7%) |
| Installation, Maintenance & Repair | 264 (100.0%) | 0 (0.0%) |
| Total (Category) | 820 (89.1%) | 100 (10.9%) |
| Total (Overall) | 15,433 (52.3%) | 14,046 (47.6%) |
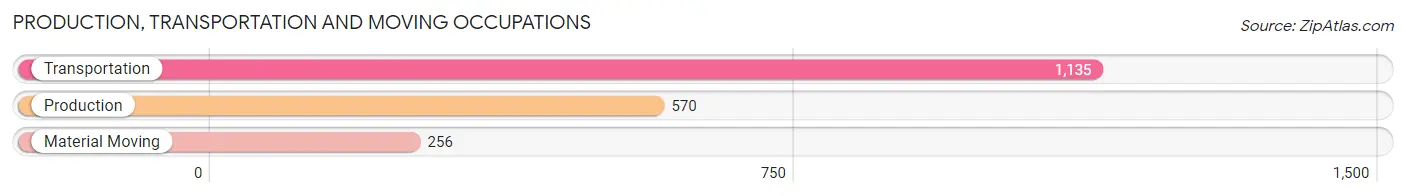
Production, Transportation and Moving Occupations
The most common Production, Transportation and Moving occupations in Horizon West are Transportation (1,135 | 3.8%), Production (570 | 1.9%), and Material Moving (256 | 0.9%).
Production, Transportation and Moving Occupations by Sex
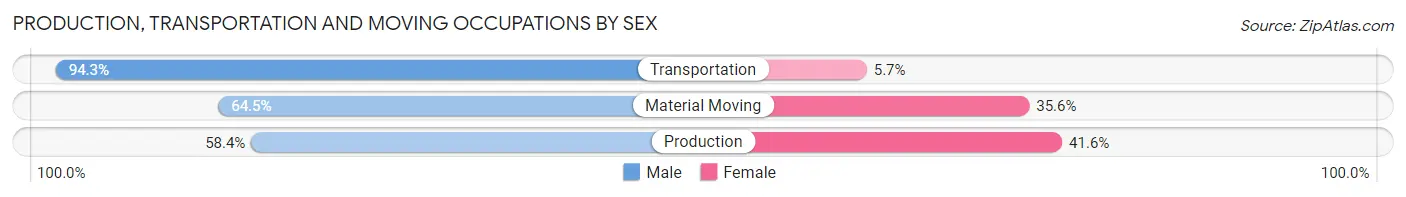
| Occupation | Male | Female |
| Production | 333 (58.4%) | 237 (41.6%) |
| Transportation | 1,070 (94.3%) | 65 (5.7%) |
| Material Moving | 165 (64.4%) | 91 (35.5%) |
| Total (Category) | 1,568 (80.0%) | 393 (20.0%) |
| Total (Overall) | 15,433 (52.3%) | 14,046 (47.6%) |
Employment Industries by Sex in Horizon West
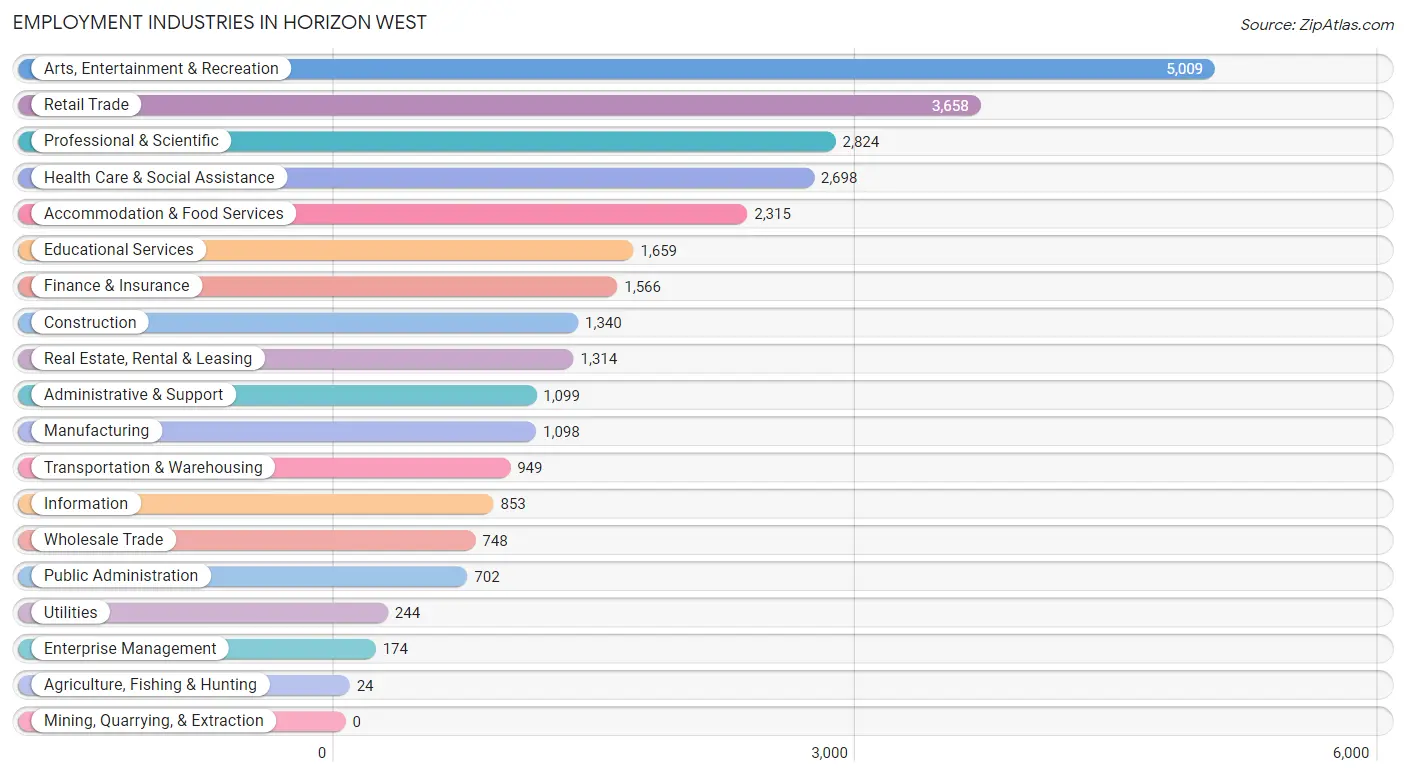
Employment Industries in Horizon West
The major employment industries in Horizon West include Arts, Entertainment & Recreation (5,009 | 17.0%), Retail Trade (3,658 | 12.4%), Professional & Scientific (2,824 | 9.6%), Health Care & Social Assistance (2,698 | 9.1%), and Accommodation & Food Services (2,315 | 7.9%).
Employment Industries by Sex in Horizon West
The Horizon West industries that see more men than women are Agriculture, Fishing & Hunting (100.0%), Transportation & Warehousing (91.7%), and Manufacturing (79.1%), whereas the industries that tend to have a higher number of women are Utilities (75.0%), Health Care & Social Assistance (74.8%), and Educational Services (70.9%).
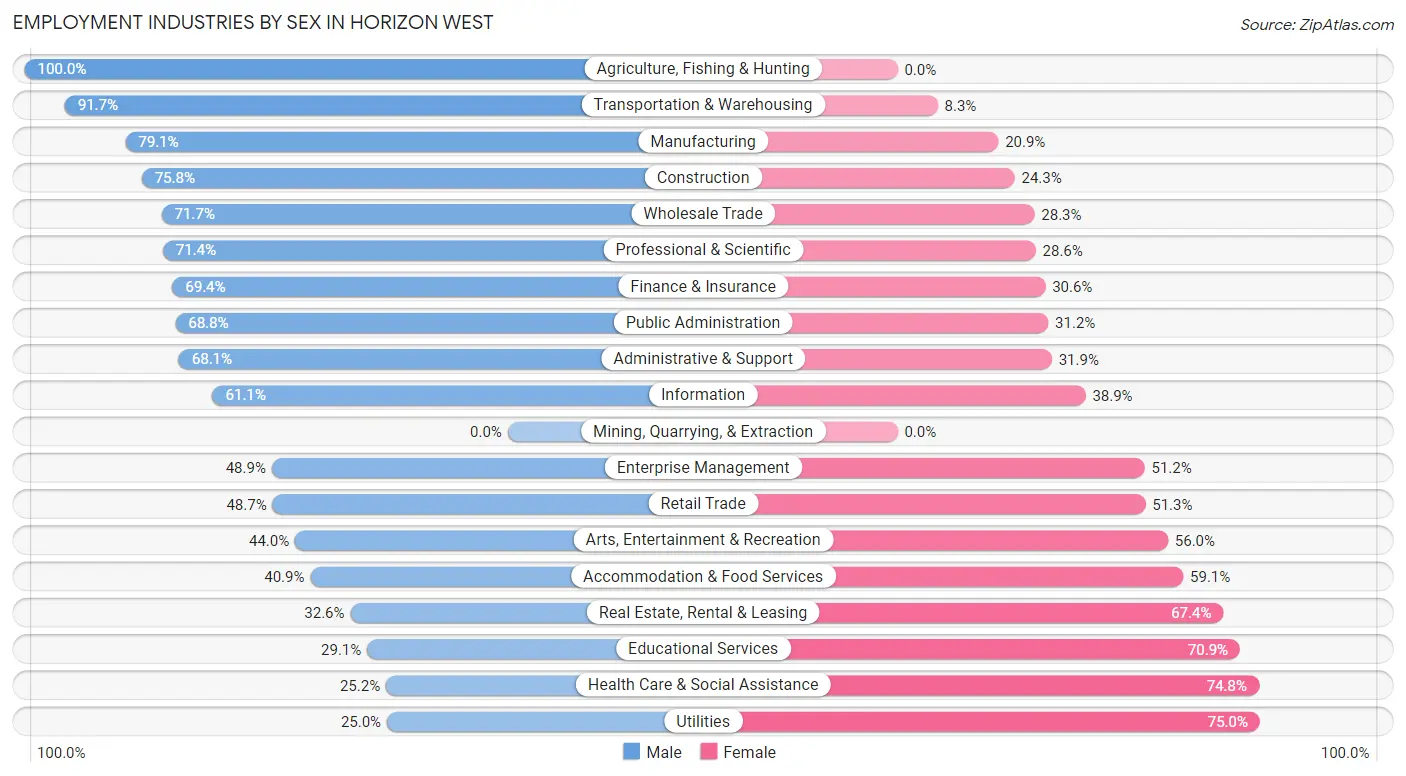
| Industry | Male | Female |
| Agriculture, Fishing & Hunting | 24 (100.0%) | 0 (0.0%) |
| Mining, Quarrying, & Extraction | 0 (0.0%) | 0 (0.0%) |
| Construction | 1,015 (75.7%) | 325 (24.2%) |
| Manufacturing | 869 (79.1%) | 229 (20.9%) |
| Wholesale Trade | 536 (71.7%) | 212 (28.3%) |
| Retail Trade | 1,781 (48.7%) | 1,877 (51.3%) |
| Transportation & Warehousing | 870 (91.7%) | 79 (8.3%) |
| Utilities | 61 (25.0%) | 183 (75.0%) |
| Information | 521 (61.1%) | 332 (38.9%) |
| Finance & Insurance | 1,087 (69.4%) | 479 (30.6%) |
| Real Estate, Rental & Leasing | 428 (32.6%) | 886 (67.4%) |
| Professional & Scientific | 2,016 (71.4%) | 808 (28.6%) |
| Enterprise Management | 85 (48.8%) | 89 (51.1%) |
| Administrative & Support | 748 (68.1%) | 351 (31.9%) |
| Educational Services | 483 (29.1%) | 1,176 (70.9%) |
| Health Care & Social Assistance | 680 (25.2%) | 2,018 (74.8%) |
| Arts, Entertainment & Recreation | 2,205 (44.0%) | 2,804 (56.0%) |
| Accommodation & Food Services | 946 (40.9%) | 1,369 (59.1%) |
| Public Administration | 483 (68.8%) | 219 (31.2%) |
| Total | 15,433 (52.3%) | 14,046 (47.6%) |
Education in Horizon West
School Enrollment in Horizon West
The most common levels of schooling among the 19,344 students in Horizon West are middle school (4,927 | 25.5%), elementary school (4,521 | 23.4%), and high school (3,225 | 16.7%).
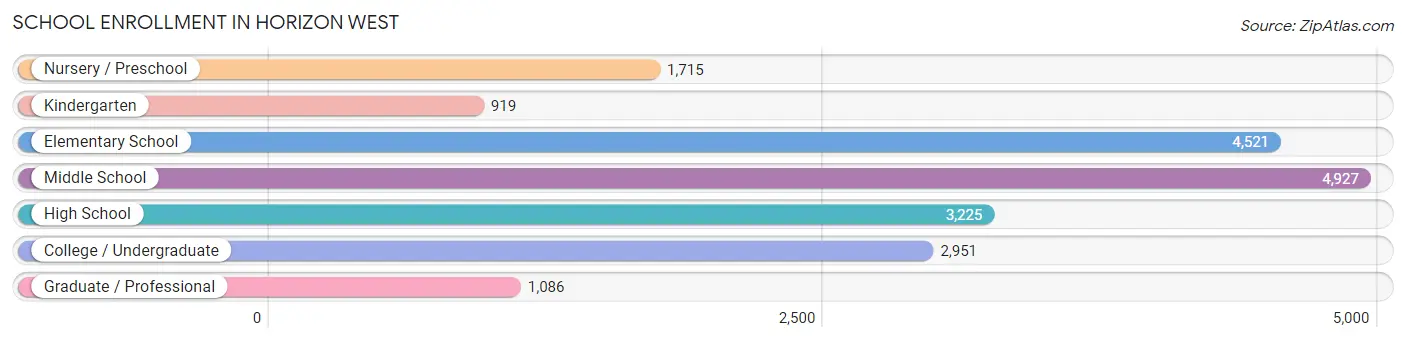
| School Level | # Students | % Students |
| Nursery / Preschool | 1,715 | 8.9% |
| Kindergarten | 919 | 4.8% |
| Elementary School | 4,521 | 23.4% |
| Middle School | 4,927 | 25.5% |
| High School | 3,225 | 16.7% |
| College / Undergraduate | 2,951 | 15.3% |
| Graduate / Professional | 1,086 | 5.6% |
| Total | 19,344 | 100.0% |
School Enrollment by Age by Funding Source in Horizon West
Out of a total of 19,344 students who are enrolled in schools in Horizon West, 3,985 (20.6%) attend a private institution, while the remaining 15,359 (79.4%) are enrolled in public schools. The age group of 3 to 4 year olds has the highest likelihood of being enrolled in private schools, with 1,032 (69.5% in the age bracket) enrolled. Conversely, the age group of 10 to 14 year olds has the lowest likelihood of being enrolled in a private school, with 5,664 (91.8% in the age bracket) attending a public institution.
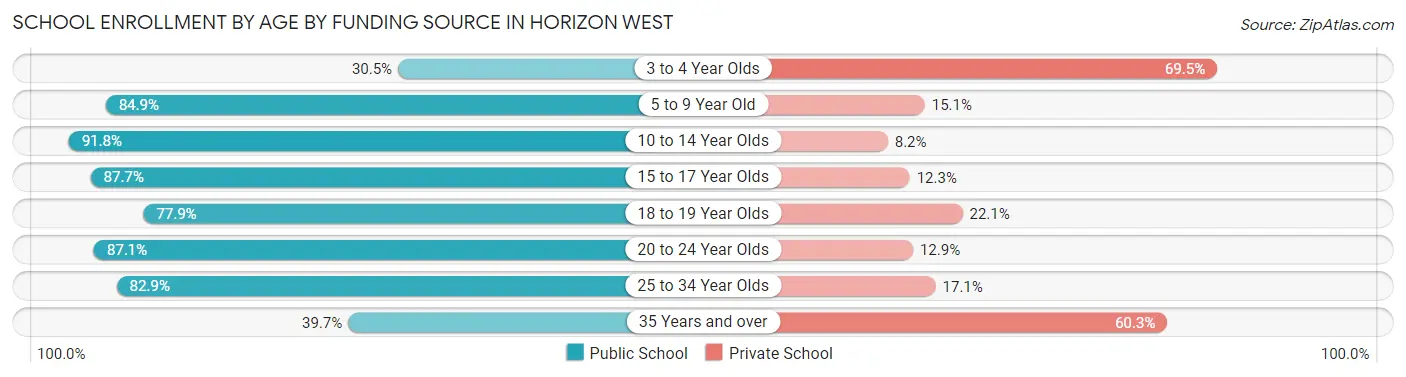
| Age Bracket | Public School | Private School |
| 3 to 4 Year Olds | 452 (30.5%) | 1,032 (69.5%) |
| 5 to 9 Year Old | 4,242 (84.9%) | 755 (15.1%) |
| 10 to 14 Year Olds | 5,664 (91.8%) | 507 (8.2%) |
| 15 to 17 Year Olds | 2,039 (87.7%) | 286 (12.3%) |
| 18 to 19 Year Olds | 415 (77.9%) | 118 (22.1%) |
| 20 to 24 Year Olds | 1,410 (87.1%) | 209 (12.9%) |
| 25 to 34 Year Olds | 503 (82.9%) | 104 (17.1%) |
| 35 Years and over | 639 (39.7%) | 969 (60.3%) |
| Total | 15,359 (79.4%) | 3,985 (20.6%) |
Educational Attainment by Field of Study in Horizon West
Business (5,466 | 26.4%), engineering (2,166 | 10.4%), science & technology (2,160 | 10.4%), education (1,836 | 8.8%), and arts & humanities (1,365 | 6.6%) are the most common fields of study among 20,746 individuals in Horizon West who have obtained a bachelor's degree or higher.
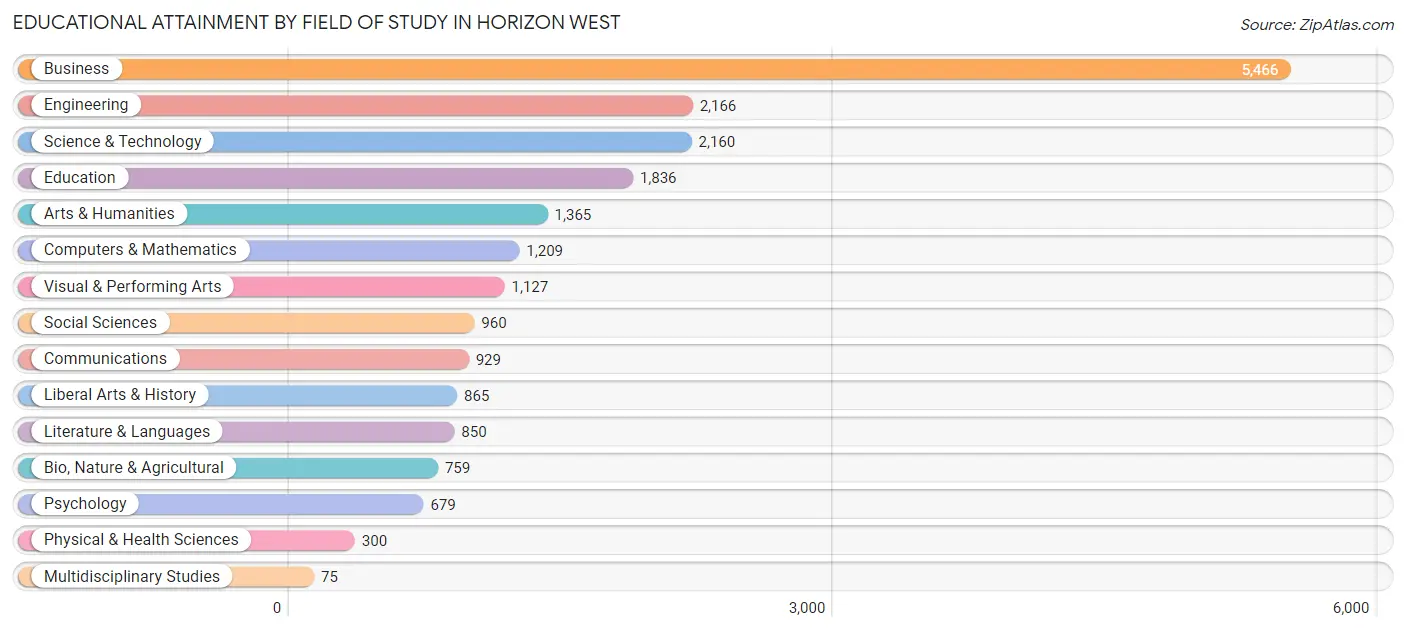
| Field of Study | # Graduates | % Graduates |
| Computers & Mathematics | 1,209 | 5.8% |
| Bio, Nature & Agricultural | 759 | 3.7% |
| Physical & Health Sciences | 300 | 1.5% |
| Psychology | 679 | 3.3% |
| Social Sciences | 960 | 4.6% |
| Engineering | 2,166 | 10.4% |
| Multidisciplinary Studies | 75 | 0.4% |
| Science & Technology | 2,160 | 10.4% |
| Business | 5,466 | 26.4% |
| Education | 1,836 | 8.8% |
| Literature & Languages | 850 | 4.1% |
| Liberal Arts & History | 865 | 4.2% |
| Visual & Performing Arts | 1,127 | 5.4% |
| Communications | 929 | 4.5% |
| Arts & Humanities | 1,365 | 6.6% |
| Total | 20,746 | 100.0% |
Transportation & Commute in Horizon West
Vehicle Availability by Sex in Horizon West
The most prevalent vehicle ownership categories in Horizon West are males with 2 vehicles (9,100, accounting for 59.7%) and females with 2 vehicles (6,615, making up 66.5%).
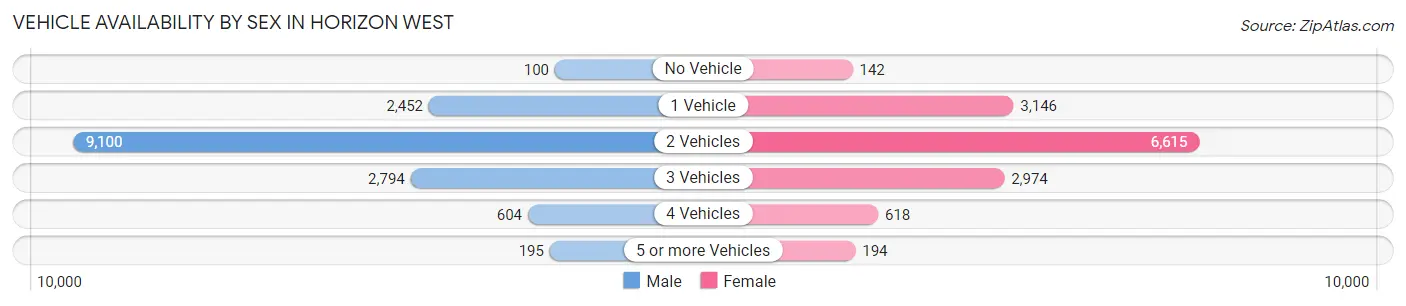
| Vehicles Available | Male | Female |
| No Vehicle | 100 (0.7%) | 142 (1.0%) |
| 1 Vehicle | 2,452 (16.1%) | 3,146 (23.0%) |
| 2 Vehicles | 9,100 (59.7%) | 6,615 (48.3%) |
| 3 Vehicles | 2,794 (18.3%) | 2,974 (21.7%) |
| 4 Vehicles | 604 (4.0%) | 618 (4.5%) |
| 5 or more Vehicles | 195 (1.3%) | 194 (1.4%) |
| Total | 15,245 (100.0%) | 13,689 (100.0%) |
Commute Time in Horizon West
The most frequently occuring commute durations in Horizon West are 30 to 34 minutes (4,579 commuters, 20.5%), 25 to 29 minutes (2,577 commuters, 11.5%), and 10 to 14 minutes (2,495 commuters, 11.2%).
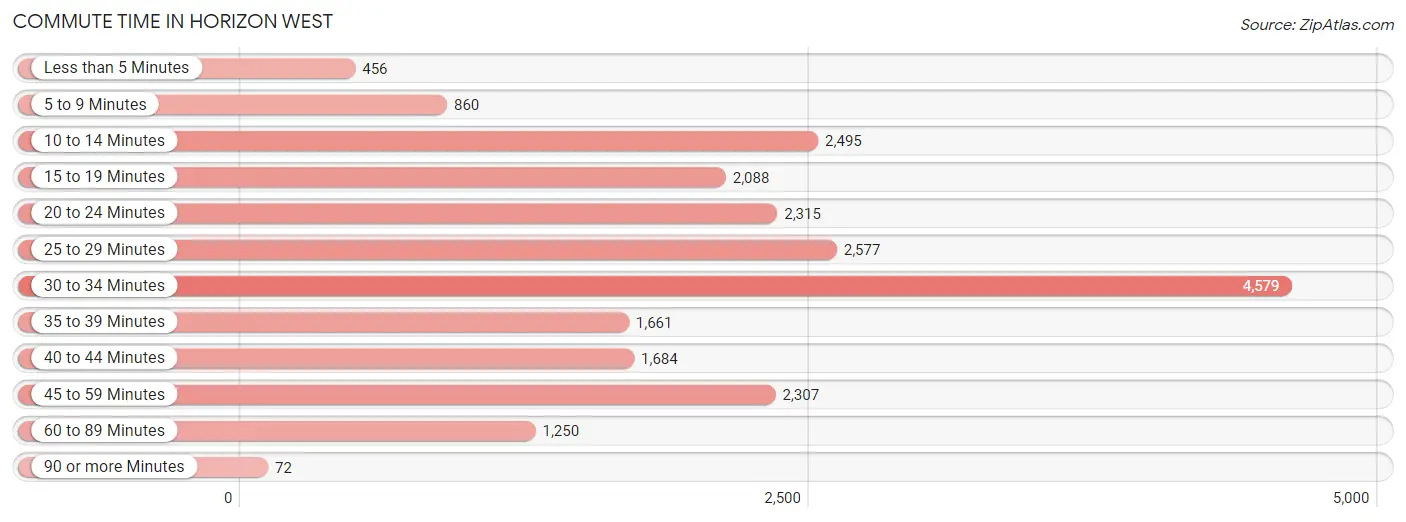
| Commute Time | # Commuters | % Commuters |
| Less than 5 Minutes | 456 | 2.0% |
| 5 to 9 Minutes | 860 | 3.8% |
| 10 to 14 Minutes | 2,495 | 11.2% |
| 15 to 19 Minutes | 2,088 | 9.3% |
| 20 to 24 Minutes | 2,315 | 10.4% |
| 25 to 29 Minutes | 2,577 | 11.5% |
| 30 to 34 Minutes | 4,579 | 20.5% |
| 35 to 39 Minutes | 1,661 | 7.4% |
| 40 to 44 Minutes | 1,684 | 7.5% |
| 45 to 59 Minutes | 2,307 | 10.3% |
| 60 to 89 Minutes | 1,250 | 5.6% |
| 90 or more Minutes | 72 | 0.3% |
Commute Time by Sex in Horizon West
The most common commute times in Horizon West are 30 to 34 minutes (2,889 commuters, 24.7%) for males and 30 to 34 minutes (1,690 commuters, 15.9%) for females.
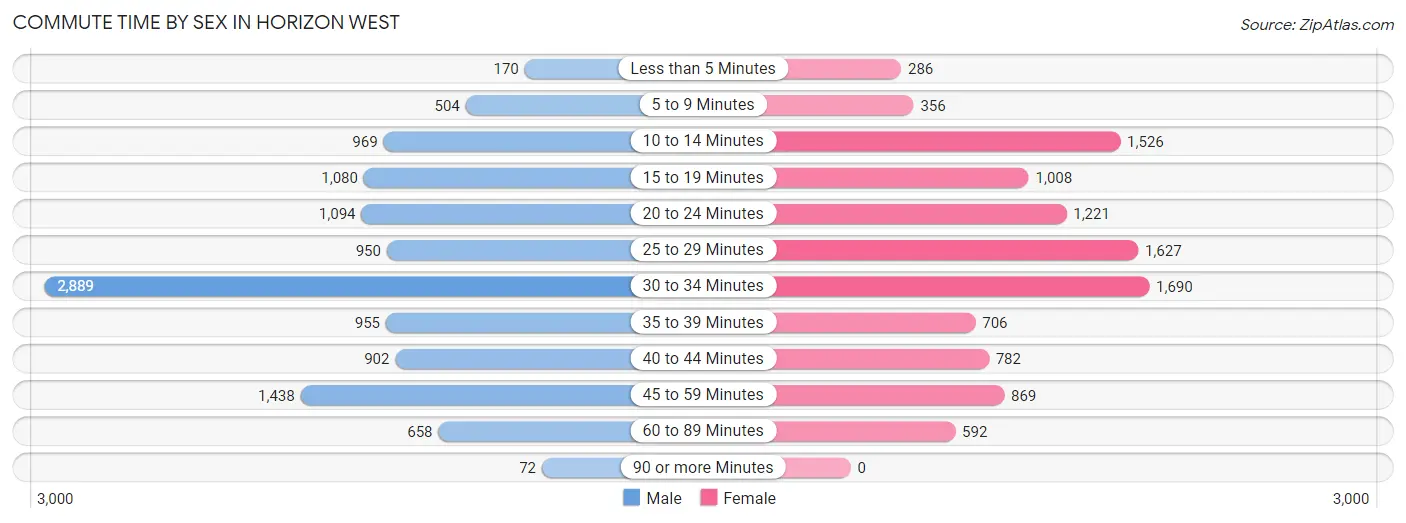
| Commute Time | Male | Female |
| Less than 5 Minutes | 170 (1.5%) | 286 (2.7%) |
| 5 to 9 Minutes | 504 (4.3%) | 356 (3.3%) |
| 10 to 14 Minutes | 969 (8.3%) | 1,526 (14.3%) |
| 15 to 19 Minutes | 1,080 (9.2%) | 1,008 (9.5%) |
| 20 to 24 Minutes | 1,094 (9.4%) | 1,221 (11.5%) |
| 25 to 29 Minutes | 950 (8.1%) | 1,627 (15.3%) |
| 30 to 34 Minutes | 2,889 (24.7%) | 1,690 (15.9%) |
| 35 to 39 Minutes | 955 (8.2%) | 706 (6.6%) |
| 40 to 44 Minutes | 902 (7.7%) | 782 (7.3%) |
| 45 to 59 Minutes | 1,438 (12.3%) | 869 (8.2%) |
| 60 to 89 Minutes | 658 (5.6%) | 592 (5.6%) |
| 90 or more Minutes | 72 (0.6%) | 0 (0.0%) |
Time of Departure to Work by Sex in Horizon West
The most frequent times of departure to work in Horizon West are 8:00 AM to 8:29 AM (1,888, 16.2%) for males and 7:00 AM to 7:29 AM (1,837, 17.2%) for females.
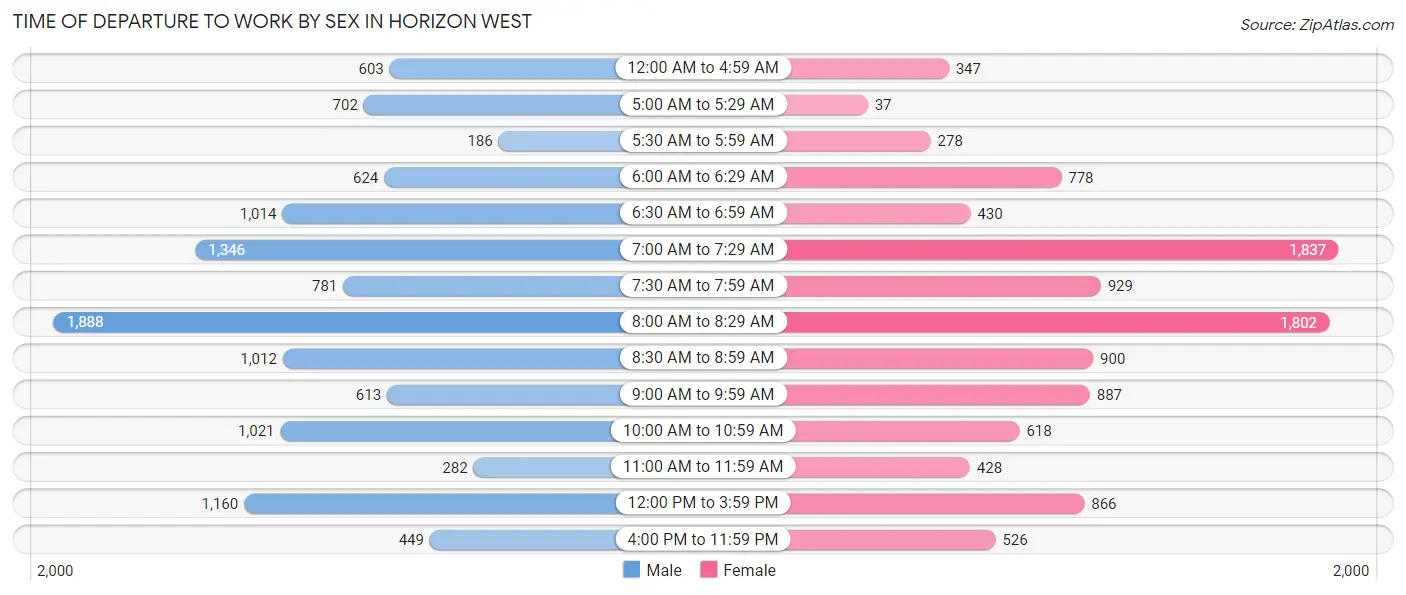
| Time of Departure | Male | Female |
| 12:00 AM to 4:59 AM | 603 (5.2%) | 347 (3.3%) |
| 5:00 AM to 5:29 AM | 702 (6.0%) | 37 (0.4%) |
| 5:30 AM to 5:59 AM | 186 (1.6%) | 278 (2.6%) |
| 6:00 AM to 6:29 AM | 624 (5.3%) | 778 (7.3%) |
| 6:30 AM to 6:59 AM | 1,014 (8.7%) | 430 (4.0%) |
| 7:00 AM to 7:29 AM | 1,346 (11.5%) | 1,837 (17.2%) |
| 7:30 AM to 7:59 AM | 781 (6.7%) | 929 (8.7%) |
| 8:00 AM to 8:29 AM | 1,888 (16.2%) | 1,802 (16.9%) |
| 8:30 AM to 8:59 AM | 1,012 (8.7%) | 900 (8.4%) |
| 9:00 AM to 9:59 AM | 613 (5.2%) | 887 (8.3%) |
| 10:00 AM to 10:59 AM | 1,021 (8.7%) | 618 (5.8%) |
| 11:00 AM to 11:59 AM | 282 (2.4%) | 428 (4.0%) |
| 12:00 PM to 3:59 PM | 1,160 (9.9%) | 866 (8.1%) |
| 4:00 PM to 11:59 PM | 449 (3.8%) | 526 (4.9%) |
| Total | 11,681 (100.0%) | 10,663 (100.0%) |
Housing Occupancy in Horizon West
Occupancy by Ownership in Horizon West
Of the total 18,629 dwellings in Horizon West, owner-occupied units account for 12,575 (67.5%), while renter-occupied units make up 6,054 (32.5%).
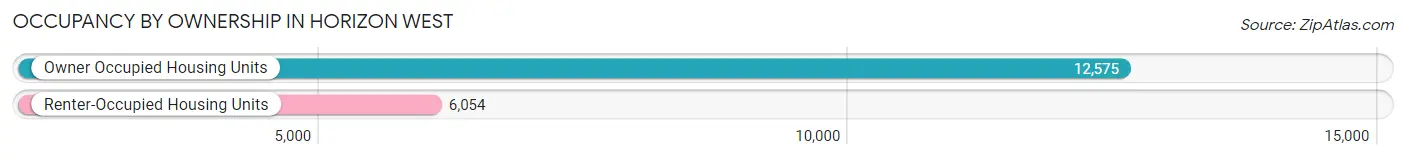
| Occupancy | # Housing Units | % Housing Units |
| Owner Occupied Housing Units | 12,575 | 67.5% |
| Renter-Occupied Housing Units | 6,054 | 32.5% |
| Total Occupied Housing Units | 18,629 | 100.0% |
Occupancy by Household Size in Horizon West
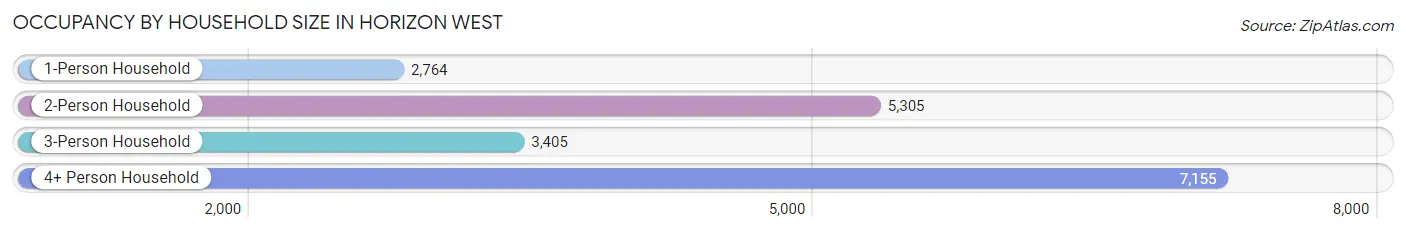
| Household Size | # Housing Units | % Housing Units |
| 1-Person Household | 2,764 | 14.8% |
| 2-Person Household | 5,305 | 28.5% |
| 3-Person Household | 3,405 | 18.3% |
| 4+ Person Household | 7,155 | 38.4% |
| Total Housing Units | 18,629 | 100.0% |
Occupancy by Ownership by Household Size in Horizon West
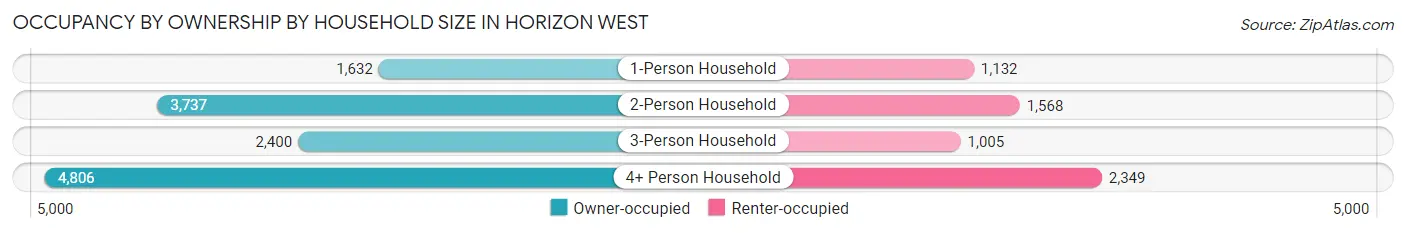
| Household Size | Owner-occupied | Renter-occupied |
| 1-Person Household | 1,632 (59.0%) | 1,132 (41.0%) |
| 2-Person Household | 3,737 (70.4%) | 1,568 (29.6%) |
| 3-Person Household | 2,400 (70.5%) | 1,005 (29.5%) |
| 4+ Person Household | 4,806 (67.2%) | 2,349 (32.8%) |
| Total Housing Units | 12,575 (67.5%) | 6,054 (32.5%) |
Occupancy by Educational Attainment in Horizon West
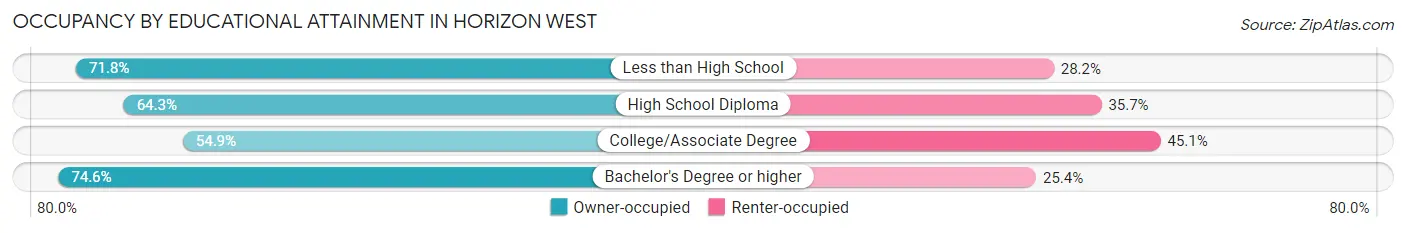
| Household Size | Owner-occupied | Renter-occupied |
| Less than High School | 102 (71.8%) | 40 (28.2%) |
| High School Diploma | 903 (64.3%) | 502 (35.7%) |
| College/Associate Degree | 3,280 (54.9%) | 2,696 (45.1%) |
| Bachelor's Degree or higher | 8,290 (74.6%) | 2,816 (25.4%) |
Occupancy by Age of Householder in Horizon West
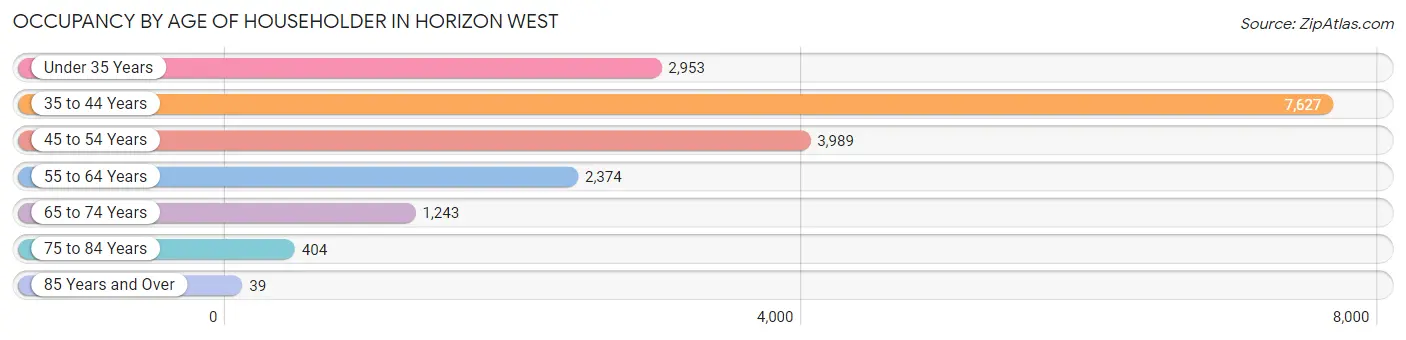
| Age Bracket | # Households | % Households |
| Under 35 Years | 2,953 | 15.9% |
| 35 to 44 Years | 7,627 | 40.9% |
| 45 to 54 Years | 3,989 | 21.4% |
| 55 to 64 Years | 2,374 | 12.7% |
| 65 to 74 Years | 1,243 | 6.7% |
| 75 to 84 Years | 404 | 2.2% |
| 85 Years and Over | 39 | 0.2% |
| Total | 18,629 | 100.0% |
Housing Finances in Horizon West
Median Income by Occupancy in Horizon West
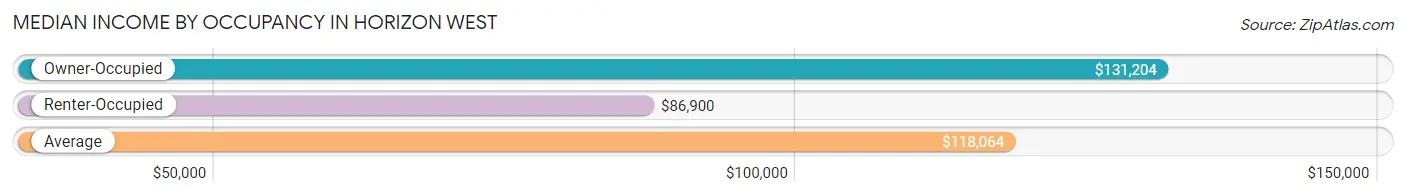
| Occupancy Type | # Households | Median Income |
| Owner-Occupied | 12,575 (67.5%) | $131,204 |
| Renter-Occupied | 6,054 (32.5%) | $86,900 |
| Average | 18,629 (100.0%) | $118,064 |
Occupancy by Householder Income Bracket in Horizon West
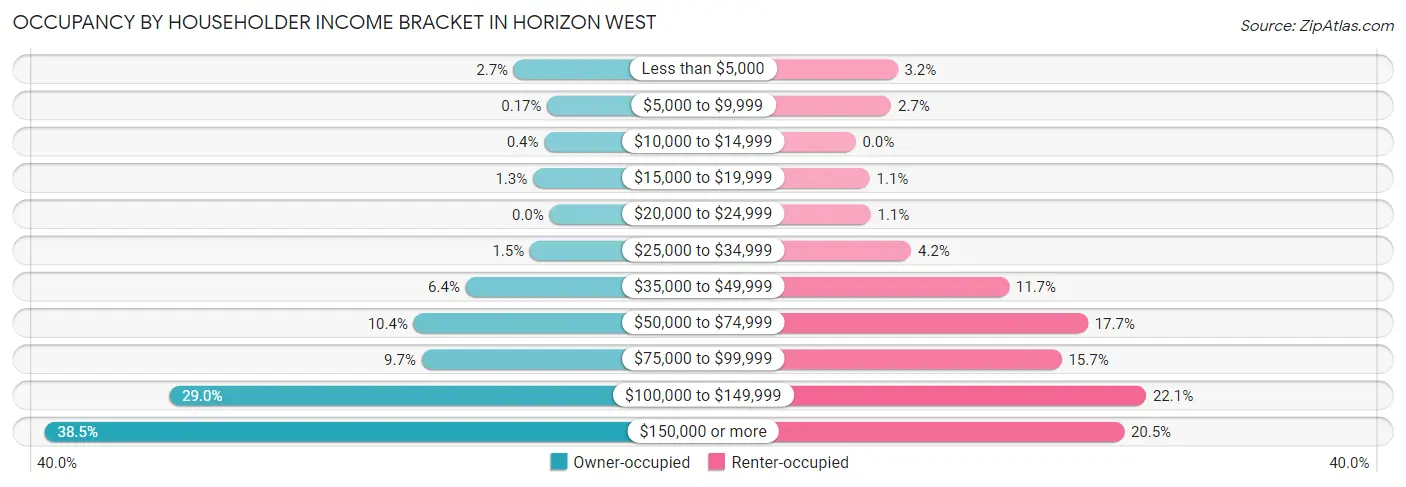
| Income Bracket | Owner-occupied | Renter-occupied |
| Less than $5,000 | 342 (2.7%) | 194 (3.2%) |
| $5,000 to $9,999 | 21 (0.2%) | 164 (2.7%) |
| $10,000 to $14,999 | 50 (0.4%) | 0 (0.0%) |
| $15,000 to $19,999 | 159 (1.3%) | 65 (1.1%) |
| $20,000 to $24,999 | 0 (0.0%) | 69 (1.1%) |
| $25,000 to $34,999 | 187 (1.5%) | 256 (4.2%) |
| $35,000 to $49,999 | 804 (6.4%) | 707 (11.7%) |
| $50,000 to $74,999 | 1,302 (10.3%) | 1,071 (17.7%) |
| $75,000 to $99,999 | 1,225 (9.7%) | 950 (15.7%) |
| $100,000 to $149,999 | 3,646 (29.0%) | 1,340 (22.1%) |
| $150,000 or more | 4,839 (38.5%) | 1,238 (20.4%) |
| Total | 12,575 (100.0%) | 6,054 (100.0%) |
Monthly Housing Cost Tiers in Horizon West
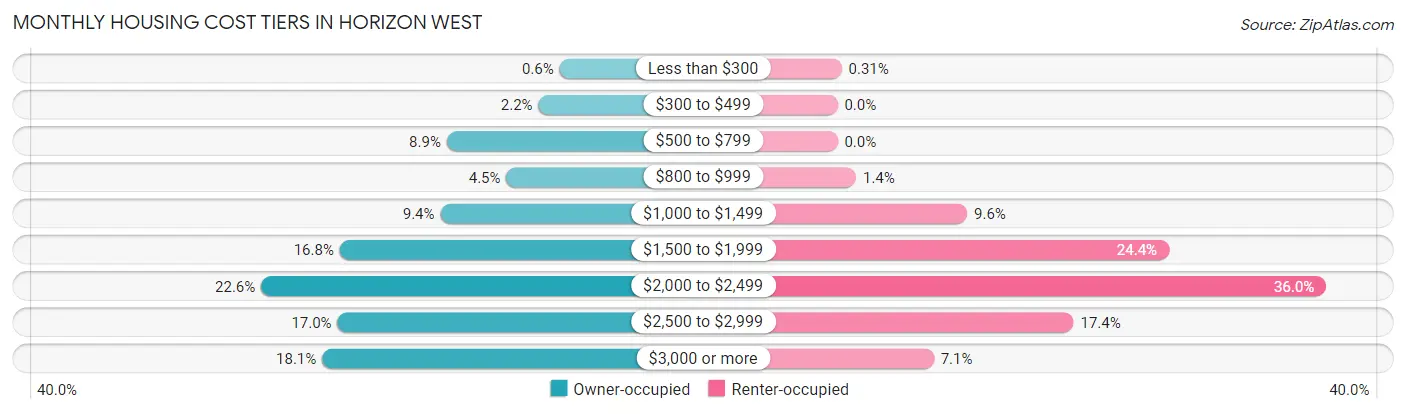
| Monthly Cost | Owner-occupied | Renter-occupied |
| Less than $300 | 75 (0.6%) | 19 (0.3%) |
| $300 to $499 | 272 (2.2%) | 0 (0.0%) |
| $500 to $799 | 1,120 (8.9%) | 0 (0.0%) |
| $800 to $999 | 569 (4.5%) | 83 (1.4%) |
| $1,000 to $1,499 | 1,180 (9.4%) | 578 (9.6%) |
| $1,500 to $1,999 | 2,111 (16.8%) | 1,478 (24.4%) |
| $2,000 to $2,499 | 2,840 (22.6%) | 2,179 (36.0%) |
| $2,500 to $2,999 | 2,133 (17.0%) | 1,053 (17.4%) |
| $3,000 or more | 2,275 (18.1%) | 429 (7.1%) |
| Total | 12,575 (100.0%) | 6,054 (100.0%) |
Physical Housing Characteristics in Horizon West
Housing Structures in Horizon West
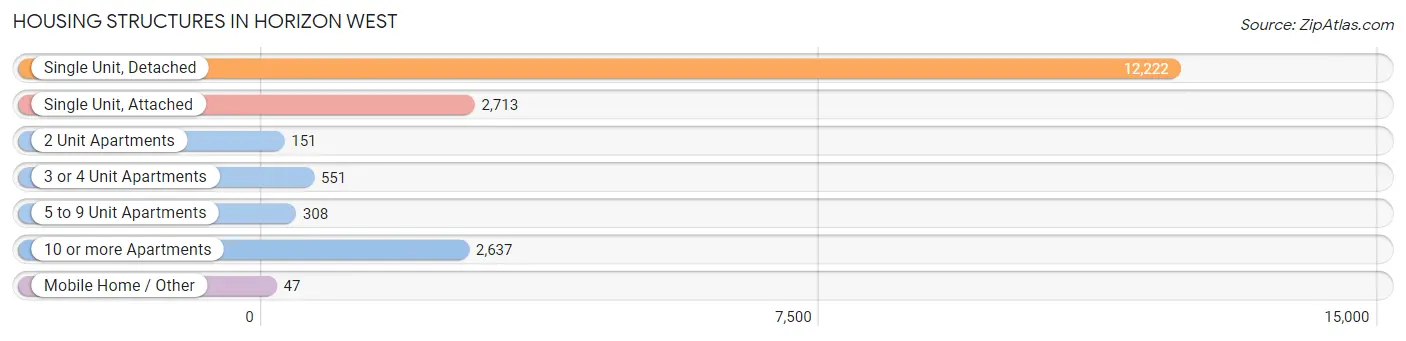
| Structure Type | # Housing Units | % Housing Units |
| Single Unit, Detached | 12,222 | 65.6% |
| Single Unit, Attached | 2,713 | 14.6% |
| 2 Unit Apartments | 151 | 0.8% |
| 3 or 4 Unit Apartments | 551 | 3.0% |
| 5 to 9 Unit Apartments | 308 | 1.7% |
| 10 or more Apartments | 2,637 | 14.2% |
| Mobile Home / Other | 47 | 0.3% |
| Total | 18,629 | 100.0% |
Housing Structures by Occupancy in Horizon West
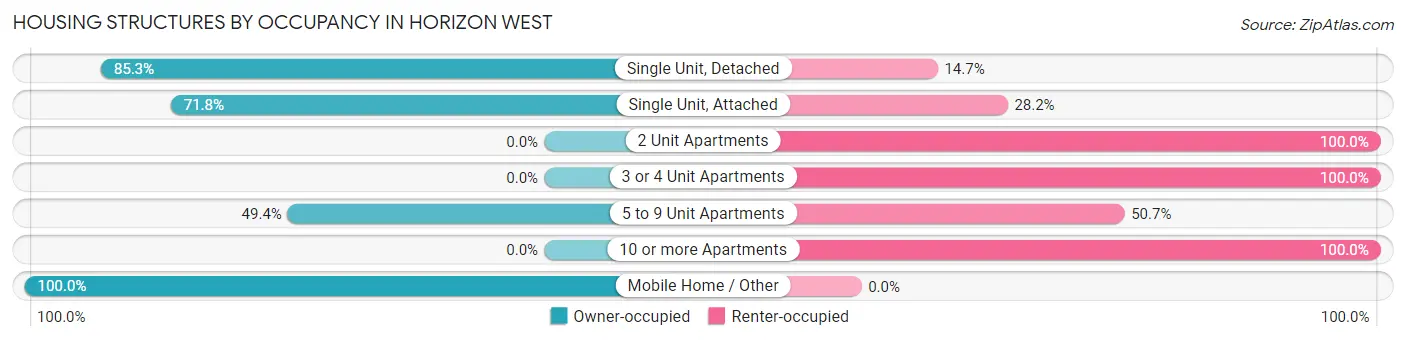
| Structure Type | Owner-occupied | Renter-occupied |
| Single Unit, Detached | 10,427 (85.3%) | 1,795 (14.7%) |
| Single Unit, Attached | 1,949 (71.8%) | 764 (28.2%) |
| 2 Unit Apartments | 0 (0.0%) | 151 (100.0%) |
| 3 or 4 Unit Apartments | 0 (0.0%) | 551 (100.0%) |
| 5 to 9 Unit Apartments | 152 (49.3%) | 156 (50.6%) |
| 10 or more Apartments | 0 (0.0%) | 2,637 (100.0%) |
| Mobile Home / Other | 47 (100.0%) | 0 (0.0%) |
| Total | 12,575 (67.5%) | 6,054 (32.5%) |
Housing Structures by Number of Rooms in Horizon West
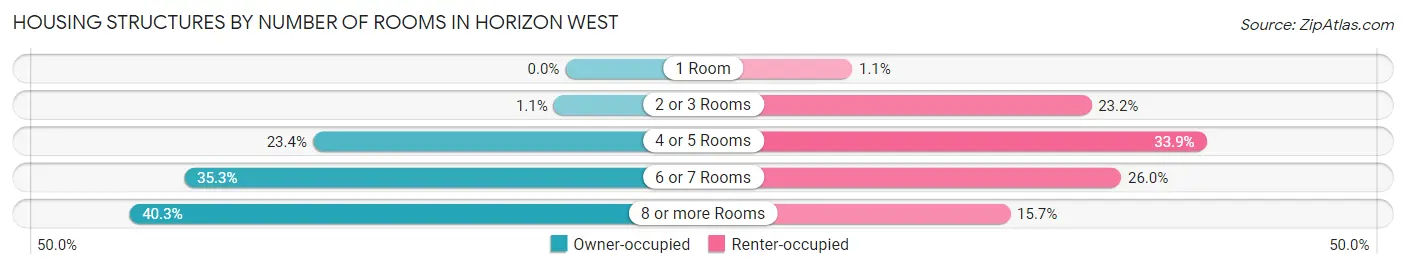
| Number of Rooms | Owner-occupied | Renter-occupied |
| 1 Room | 0 (0.0%) | 68 (1.1%) |
| 2 or 3 Rooms | 136 (1.1%) | 1,407 (23.2%) |
| 4 or 5 Rooms | 2,936 (23.4%) | 2,052 (33.9%) |
| 6 or 7 Rooms | 4,433 (35.2%) | 1,574 (26.0%) |
| 8 or more Rooms | 5,070 (40.3%) | 953 (15.7%) |
| Total | 12,575 (100.0%) | 6,054 (100.0%) |
Housing Structure by Heating Type in Horizon West
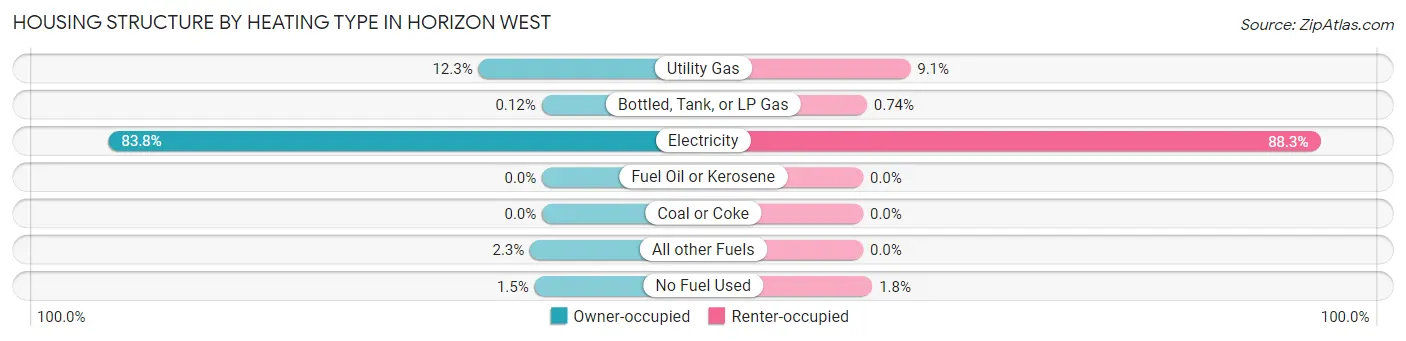
| Heating Type | Owner-occupied | Renter-occupied |
| Utility Gas | 1,546 (12.3%) | 553 (9.1%) |
| Bottled, Tank, or LP Gas | 15 (0.1%) | 45 (0.7%) |
| Electricity | 10,539 (83.8%) | 5,348 (88.3%) |
| Fuel Oil or Kerosene | 0 (0.0%) | 0 (0.0%) |
| Coal or Coke | 0 (0.0%) | 0 (0.0%) |
| All other Fuels | 291 (2.3%) | 0 (0.0%) |
| No Fuel Used | 184 (1.5%) | 108 (1.8%) |
| Total | 12,575 (100.0%) | 6,054 (100.0%) |
Household Vehicle Usage in Horizon West
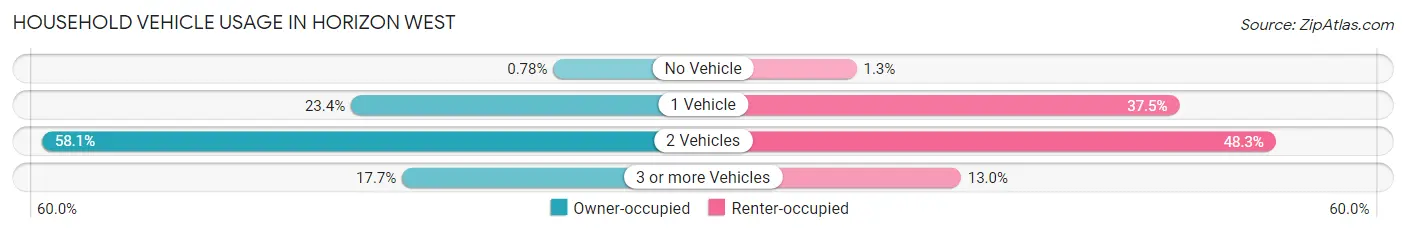
| Vehicles per Household | Owner-occupied | Renter-occupied |
| No Vehicle | 98 (0.8%) | 79 (1.3%) |
| 1 Vehicle | 2,948 (23.4%) | 2,268 (37.5%) |
| 2 Vehicles | 7,302 (58.1%) | 2,921 (48.2%) |
| 3 or more Vehicles | 2,227 (17.7%) | 786 (13.0%) |
| Total | 12,575 (100.0%) | 6,054 (100.0%) |
Real Estate & Mortgages in Horizon West
Real Estate and Mortgage Overview in Horizon West
| Characteristic | Without Mortgage | With Mortgage |
| Housing Units | 2,528 | 10,047 |
| Median Property Value | $451,900 | $461,100 |
| Median Household Income | $116,833 | $4,145 |
| Monthly Housing Costs | $762 | $2,275 |
| Real Estate Taxes | $4,592 | $168 |
Property Value by Mortgage Status in Horizon West
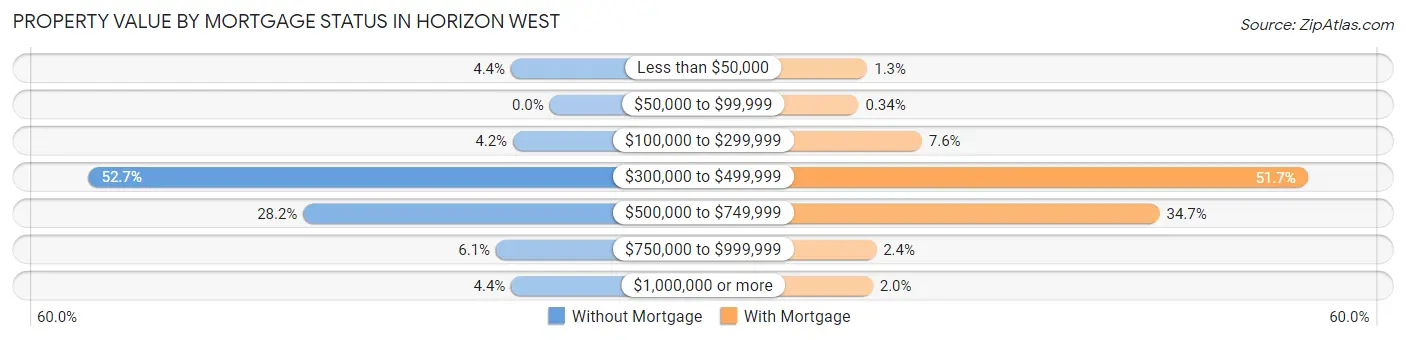
| Property Value | Without Mortgage | With Mortgage |
| Less than $50,000 | 112 (4.4%) | 135 (1.3%) |
| $50,000 to $99,999 | 0 (0.0%) | 34 (0.3%) |
| $100,000 to $299,999 | 106 (4.2%) | 762 (7.6%) |
| $300,000 to $499,999 | 1,332 (52.7%) | 5,191 (51.7%) |
| $500,000 to $749,999 | 712 (28.2%) | 3,490 (34.7%) |
| $750,000 to $999,999 | 155 (6.1%) | 237 (2.4%) |
| $1,000,000 or more | 111 (4.4%) | 198 (2.0%) |
| Total | 2,528 (100.0%) | 10,047 (100.0%) |
Household Income by Mortgage Status in Horizon West
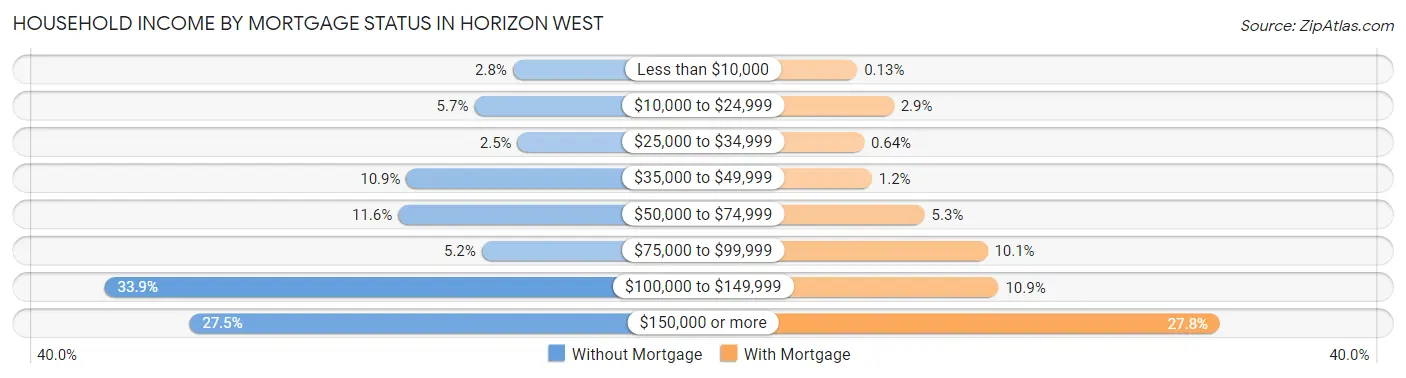
| Household Income | Without Mortgage | With Mortgage |
| Less than $10,000 | 71 (2.8%) | 13 (0.1%) |
| $10,000 to $24,999 | 145 (5.7%) | 292 (2.9%) |
| $25,000 to $34,999 | 62 (2.5%) | 64 (0.6%) |
| $35,000 to $49,999 | 276 (10.9%) | 125 (1.2%) |
| $50,000 to $74,999 | 292 (11.6%) | 528 (5.3%) |
| $75,000 to $99,999 | 131 (5.2%) | 1,010 (10.1%) |
| $100,000 to $149,999 | 857 (33.9%) | 1,094 (10.9%) |
| $150,000 or more | 694 (27.5%) | 2,789 (27.8%) |
| Total | 2,528 (100.0%) | 10,047 (100.0%) |
Property Value to Household Income Ratio in Horizon West
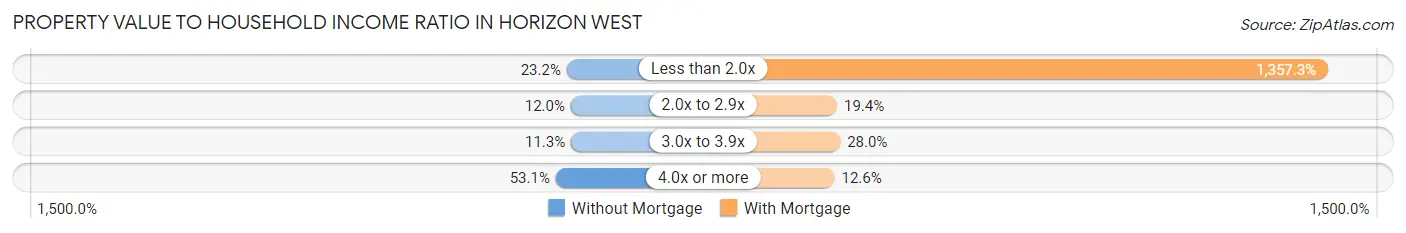
| Value-to-Income Ratio | Without Mortgage | With Mortgage |
| Less than 2.0x | 586 (23.2%) | 136,372 (1,357.3%) |
| 2.0x to 2.9x | 303 (12.0%) | 1,948 (19.4%) |
| 3.0x to 3.9x | 286 (11.3%) | 2,814 (28.0%) |
| 4.0x or more | 1,341 (53.0%) | 1,265 (12.6%) |
| Total | 2,528 (100.0%) | 10,047 (100.0%) |
Real Estate Taxes by Mortgage Status in Horizon West
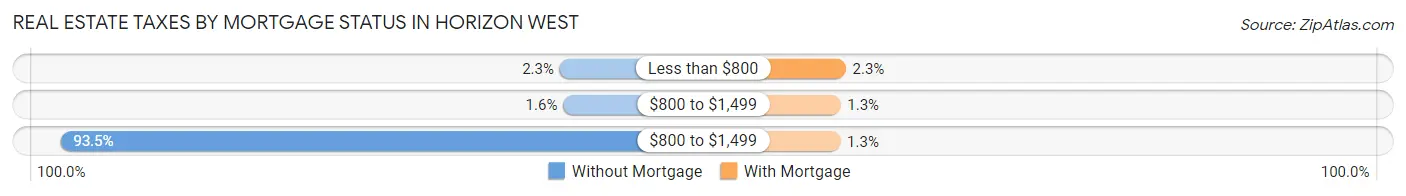
| Property Taxes | Without Mortgage | With Mortgage |
| Less than $800 | 57 (2.2%) | 230 (2.3%) |
| $800 to $1,499 | 41 (1.6%) | 135 (1.3%) |
| $800 to $1,499 | 2,363 (93.5%) | 131 (1.3%) |
| Total | 2,528 (100.0%) | 10,047 (100.0%) |
Health & Disability in Horizon West
Health Insurance Coverage by Age in Horizon West
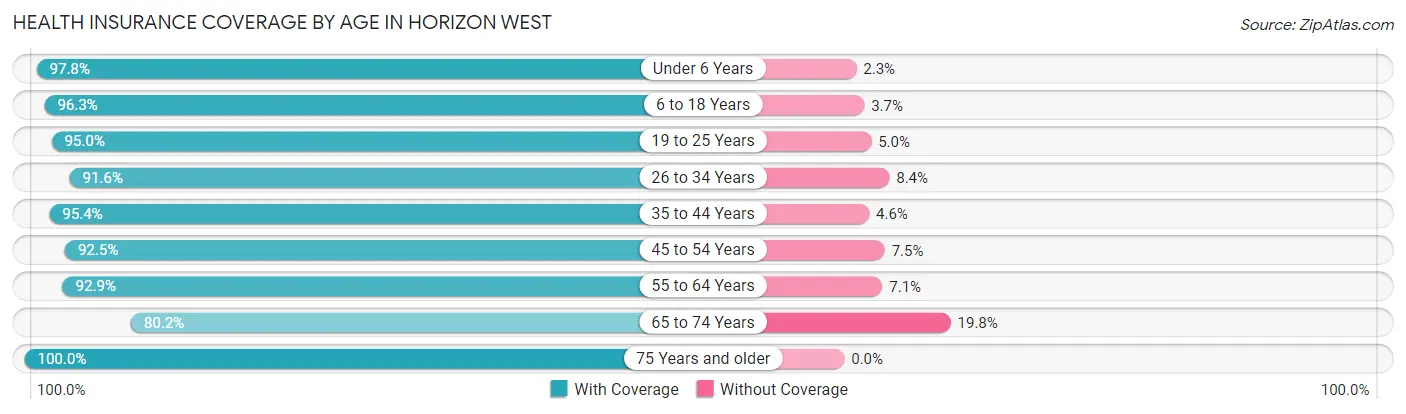
| Age Bracket | With Coverage | Without Coverage |
| Under 6 Years | 5,174 (97.8%) | 119 (2.2%) |
| 6 to 18 Years | 12,757 (96.3%) | 492 (3.7%) |
| 19 to 25 Years | 3,629 (95.0%) | 192 (5.0%) |
| 26 to 34 Years | 6,068 (91.6%) | 556 (8.4%) |
| 35 to 44 Years | 13,280 (95.4%) | 644 (4.6%) |
| 45 to 54 Years | 7,039 (92.5%) | 574 (7.5%) |
| 55 to 64 Years | 3,504 (92.9%) | 268 (7.1%) |
| 65 to 74 Years | 2,511 (80.2%) | 621 (19.8%) |
| 75 Years and older | 1,126 (100.0%) | 0 (0.0%) |
| Total | 55,088 (94.1%) | 3,466 (5.9%) |
Health Insurance Coverage by Citizenship Status in Horizon West
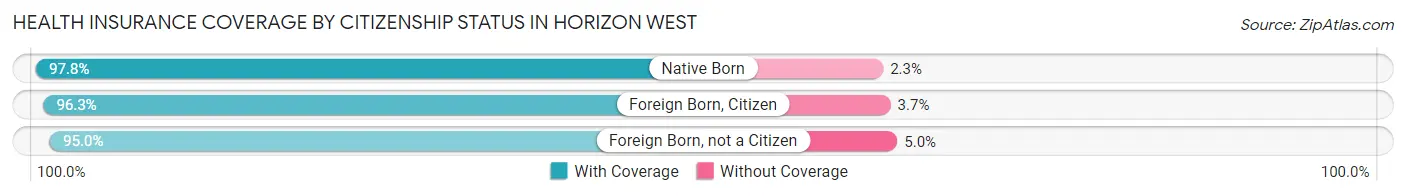
| Citizenship Status | With Coverage | Without Coverage |
| Native Born | 5,174 (97.8%) | 119 (2.2%) |
| Foreign Born, Citizen | 12,757 (96.3%) | 492 (3.7%) |
| Foreign Born, not a Citizen | 3,629 (95.0%) | 192 (5.0%) |
Health Insurance Coverage by Household Income in Horizon West
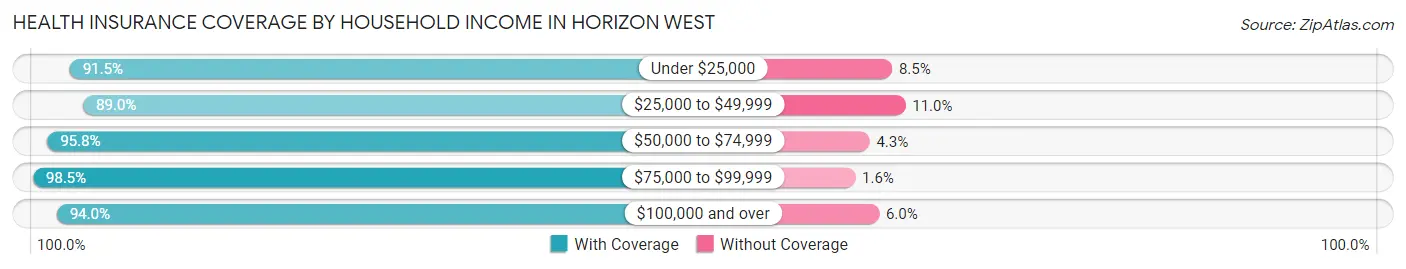
| Household Income | With Coverage | Without Coverage |
| Under $25,000 | 2,326 (91.5%) | 215 (8.5%) |
| $25,000 to $49,999 | 5,535 (89.0%) | 681 (11.0%) |
| $50,000 to $74,999 | 6,469 (95.8%) | 287 (4.3%) |
| $75,000 to $99,999 | 6,850 (98.5%) | 108 (1.5%) |
| $100,000 and over | 33,889 (94.0%) | 2,175 (6.0%) |
Public vs Private Health Insurance Coverage by Age in Horizon West
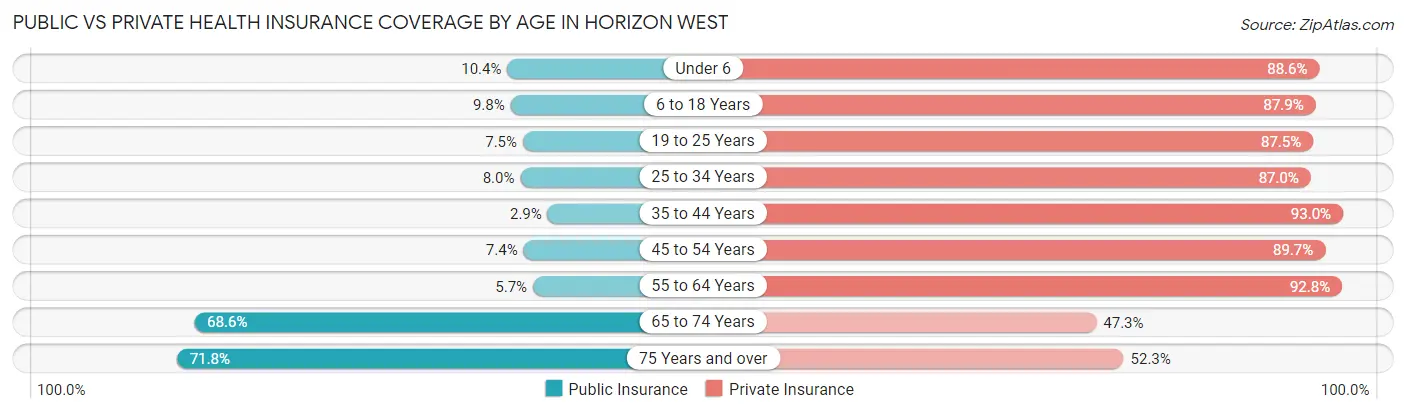
| Age Bracket | Public Insurance | Private Insurance |
| Under 6 | 551 (10.4%) | 4,691 (88.6%) |
| 6 to 18 Years | 1,298 (9.8%) | 11,650 (87.9%) |
| 19 to 25 Years | 287 (7.5%) | 3,342 (87.5%) |
| 25 to 34 Years | 529 (8.0%) | 5,765 (87.0%) |
| 35 to 44 Years | 407 (2.9%) | 12,951 (93.0%) |
| 45 to 54 Years | 563 (7.4%) | 6,828 (89.7%) |
| 55 to 64 Years | 213 (5.7%) | 3,502 (92.8%) |
| 65 to 74 Years | 2,147 (68.5%) | 1,480 (47.2%) |
| 75 Years and over | 808 (71.8%) | 589 (52.3%) |
| Total | 6,803 (11.6%) | 50,798 (86.8%) |
Disability Status by Sex by Age in Horizon West
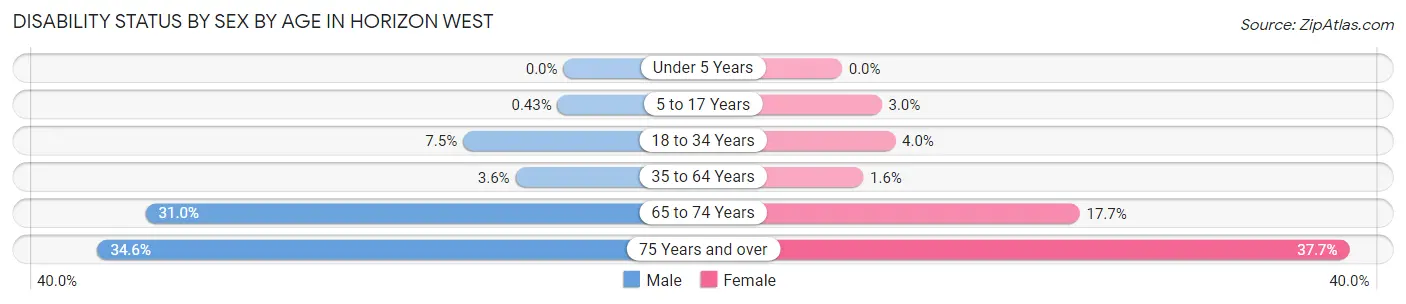
| Age Bracket | Male | Female |
| Under 5 Years | 0 (0.0%) | 0 (0.0%) |
| 5 to 17 Years | 27 (0.4%) | 215 (2.9%) |
| 18 to 34 Years | 324 (7.4%) | 253 (4.0%) |
| 35 to 64 Years | 442 (3.6%) | 203 (1.6%) |
| 65 to 74 Years | 511 (31.0%) | 262 (17.6%) |
| 75 Years and over | 148 (34.6%) | 263 (37.7%) |
Disability Class by Sex by Age in Horizon West
Disability Class: Hearing Difficulty
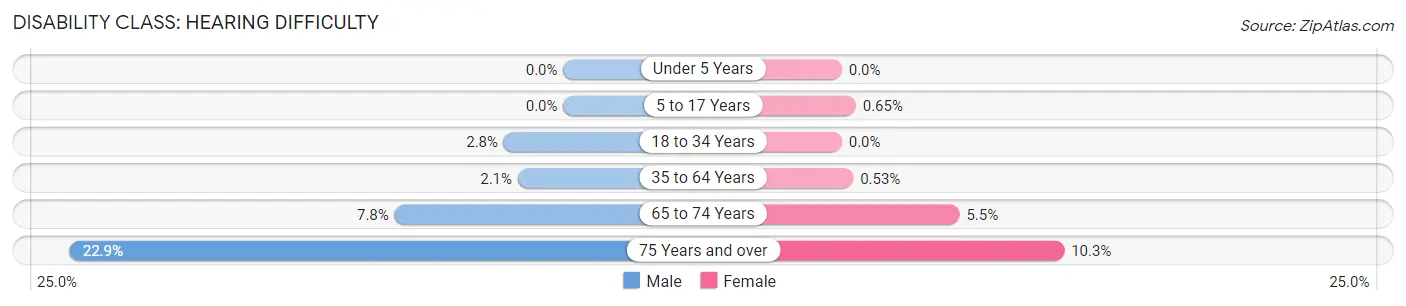
| Age Bracket | Male | Female |
| Under 5 Years | 0 (0.0%) | 0 (0.0%) |
| 5 to 17 Years | 0 (0.0%) | 47 (0.6%) |
| 18 to 34 Years | 120 (2.8%) | 0 (0.0%) |
| 35 to 64 Years | 262 (2.1%) | 68 (0.5%) |
| 65 to 74 Years | 129 (7.8%) | 81 (5.5%) |
| 75 Years and over | 98 (22.9%) | 72 (10.3%) |
Disability Class: Vision Difficulty
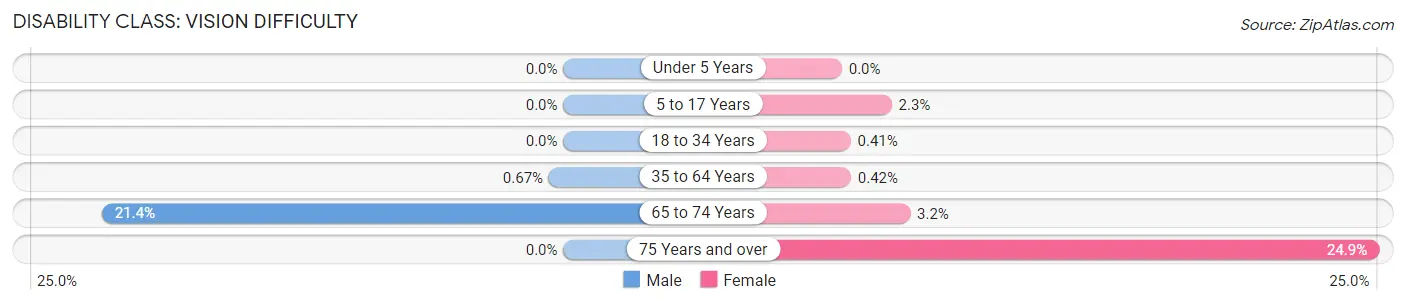
| Age Bracket | Male | Female |
| Under 5 Years | 0 (0.0%) | 0 (0.0%) |
| 5 to 17 Years | 0 (0.0%) | 168 (2.3%) |
| 18 to 34 Years | 0 (0.0%) | 26 (0.4%) |
| 35 to 64 Years | 83 (0.7%) | 54 (0.4%) |
| 65 to 74 Years | 353 (21.4%) | 47 (3.2%) |
| 75 Years and over | 0 (0.0%) | 174 (24.9%) |
Disability Class: Cognitive Difficulty
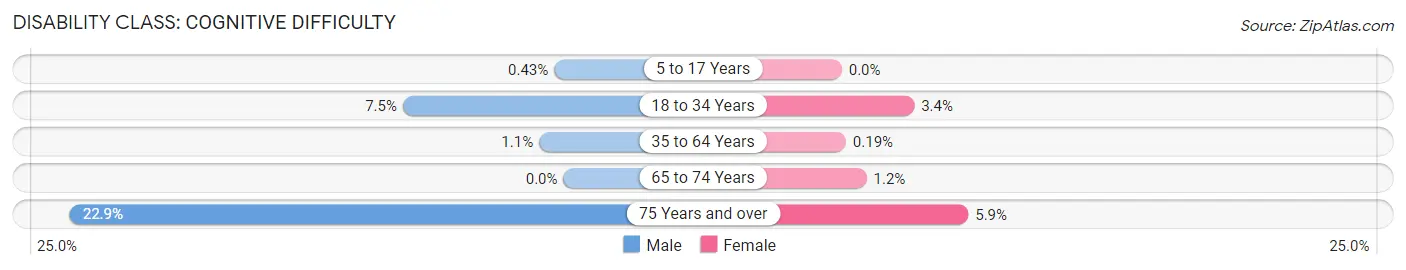
| Age Bracket | Male | Female |
| 5 to 17 Years | 27 (0.4%) | 0 (0.0%) |
| 18 to 34 Years | 324 (7.4%) | 215 (3.4%) |
| 35 to 64 Years | 141 (1.1%) | 24 (0.2%) |
| 65 to 74 Years | 0 (0.0%) | 17 (1.1%) |
| 75 Years and over | 98 (22.9%) | 41 (5.9%) |
Disability Class: Ambulatory Difficulty
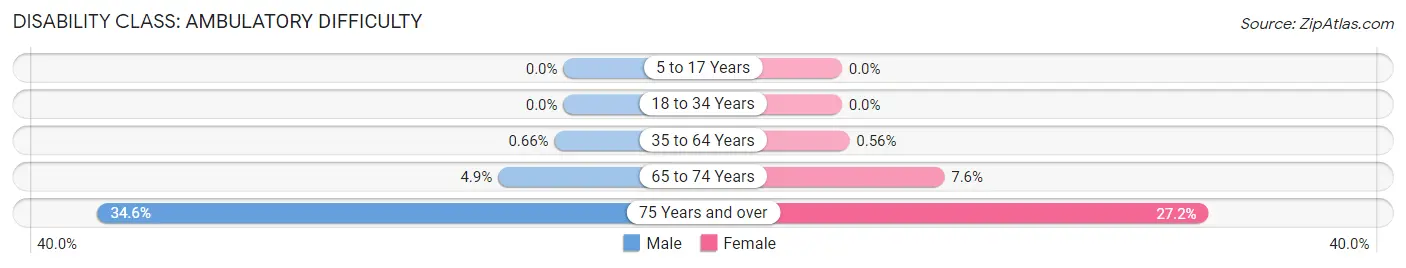
| Age Bracket | Male | Female |
| 5 to 17 Years | 0 (0.0%) | 0 (0.0%) |
| 18 to 34 Years | 0 (0.0%) | 0 (0.0%) |
| 35 to 64 Years | 82 (0.7%) | 72 (0.6%) |
| 65 to 74 Years | 80 (4.9%) | 113 (7.6%) |
| 75 Years and over | 148 (34.6%) | 190 (27.2%) |
Disability Class: Self-Care Difficulty
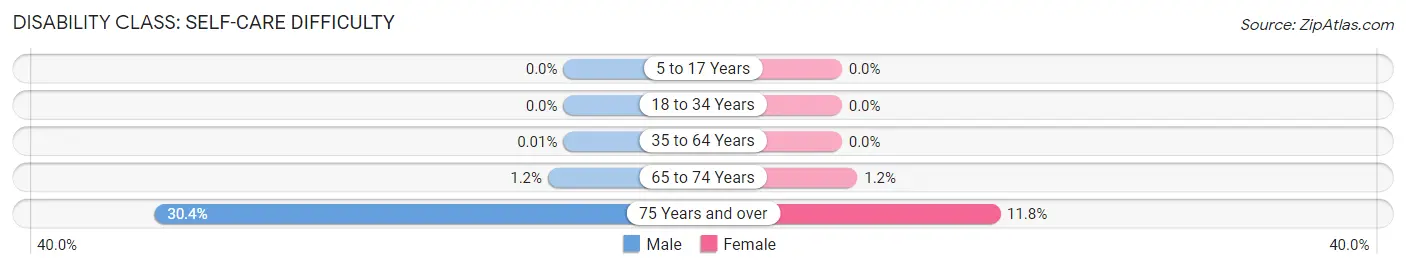
| Age Bracket | Male | Female |
| 5 to 17 Years | 0 (0.0%) | 0 (0.0%) |
| 18 to 34 Years | 0 (0.0%) | 0 (0.0%) |
| 35 to 64 Years | 1 (0.0%) | 0 (0.0%) |
| 65 to 74 Years | 19 (1.1%) | 17 (1.1%) |
| 75 Years and over | 130 (30.4%) | 82 (11.7%) |
Technology Access in Horizon West
Computing Device Access in Horizon West
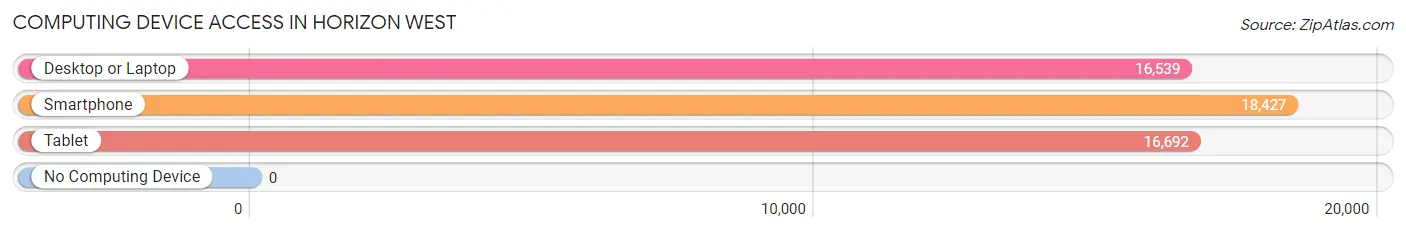
| Device Type | # Households | % Households |
| Desktop or Laptop | 16,539 | 88.8% |
| Smartphone | 18,427 | 98.9% |
| Tablet | 16,692 | 89.6% |
| No Computing Device | 0 | 0.0% |
| Total | 18,629 | 100.0% |
Internet Access in Horizon West
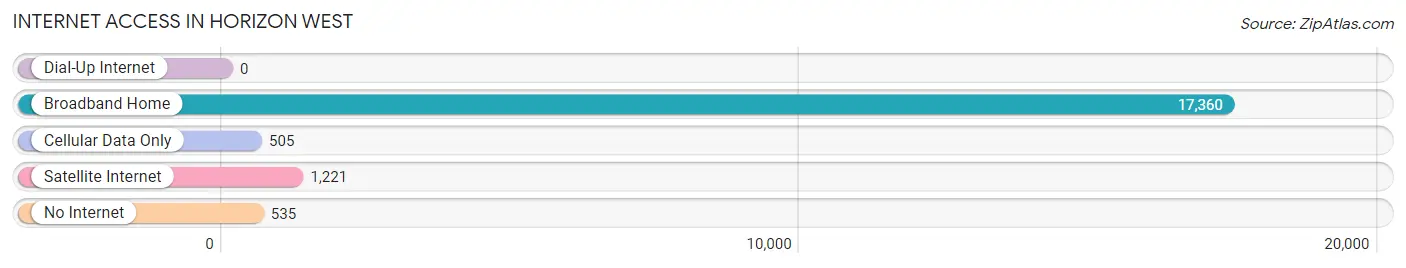
| Internet Type | # Households | % Households |
| Dial-Up Internet | 0 | 0.0% |
| Broadband Home | 17,360 | 93.2% |
| Cellular Data Only | 505 | 2.7% |
| Satellite Internet | 1,221 | 6.6% |
| No Internet | 535 | 2.9% |
| Total | 18,629 | 100.0% |
Horizon West Summary
Horizon West is a master-planned community located in western Orange County, Florida. It is situated between the cities of Winter Garden and Windermere, and is part of the Orlando-Kissimmee-Sanford Metropolitan Statistical Area. The community was established in 1989 and is one of the fastest growing communities in Central Florida.
History
Horizon West was established in 1989 by the Orange County Board of County Commissioners. The community was designed to be a master-planned community with a mix of residential, commercial, and recreational uses. The community was designed to be a self-contained community with its own schools, shopping centers, and recreational facilities.
The community was designed to be a “village” concept, with each village having its own distinct character and identity. The villages are: Hamlin, Lakeside, Orange Tree, Town Center, and Waterview.
Geography
Horizon West is located in western Orange County, Florida. It is situated between the cities of Winter Garden and Windermere, and is part of the Orlando-Kissimmee-Sanford Metropolitan Statistical Area. The community is located on the western shore of Lake Apopka, and is bordered by the cities of Ocoee and Winter Garden to the north, and Windermere to the south.
The community is located in the Central Florida Highlands, and is characterized by rolling hills and flatlands. The terrain is mostly flat, with some areas of higher elevation. The highest point in the community is located at the intersection of County Road 545 and County Road 535, which is approximately 100 feet above sea level.
Economy
The economy of Horizon West is largely driven by tourism and retail. The community is home to several major retail centers, including the Horizon West Town Center, which is anchored by a Walmart Supercenter. Other major retailers in the community include Publix, Target, and Lowe’s.
The community is also home to several major employers, including Walt Disney World, Universal Orlando Resort, and SeaWorld Orlando. The community is also home to several medical facilities, including Florida Hospital and Health Central.
Demographics
As of the 2010 census, the population of Horizon West was estimated to be 24,717. The population is predominantly white (83.3%), followed by Hispanic or Latino (9.3%), African American (3.7%), and Asian (2.2%). The median household income in the community is $76,845, and the median home value is $269,000.
The community is served by the Orange County Public Schools system, which includes seven elementary schools, two middle schools, and one high school. The community is also home to several private schools, including Windermere Preparatory School and The First Academy.
Conclusion
Horizon West is a master-planned community located in western Orange County, Florida. It was established in 1989 and is one of the fastest growing communities in Central Florida. The community is characterized by rolling hills and flatlands, and is home to several major retail centers and employers. The population of Horizon West is predominantly white, and the median household income is $76,845. The community is served by the Orange County Public Schools system, as well as several private schools.
Common Questions
What is Per Capita Income in Horizon West?
Per Capita income in Horizon West is $48,282.
What is the Median Family Income in Horizon West?
Median Family Income in Horizon West is $128,770.
What is the Median Household income in Horizon West?
Median Household Income in Horizon West is $118,064.
What is Income or Wage Gap in Horizon West?
Income or Wage Gap in Horizon West is 36.8%.
Women in Horizon West earn 63.2 cents for every dollar earned by a man.
What is Inequality or Gini Index in Horizon West?
Inequality or Gini Index in Horizon West is 0.43.
What is the Total Population of Horizon West?
Total Population of Horizon West is 58,595.
What is the Total Male Population of Horizon West?
Total Male Population of Horizon West is 27,027.
What is the Total Female Population of Horizon West?
Total Female Population of Horizon West is 31,568.
What is the Ratio of Males per 100 Females in Horizon West?
There are 85.62 Males per 100 Females in Horizon West.
What is the Ratio of Females per 100 Males in Horizon West?
There are 116.80 Females per 100 Males in Horizon West.
What is the Median Population Age in Horizon West?
Median Population Age in Horizon West is 35.2 Years.
What is the Average Family Size in Horizon West
Average Family Size in Horizon West is 3.5 People.
What is the Average Household Size in Horizon West
Average Household Size in Horizon West is 3.1 People.
How Large is the Labor Force in Horizon West?
There are 30,556 People in the Labor Forcein in Horizon West.
What is the Percentage of People in the Labor Force in Horizon West?
73.4% of People are in the Labor Force in Horizon West.
What is the Unemployment Rate in Horizon West?
Unemployment Rate in Horizon West is 3.4%.