Chelsea, AL Map & Demographics
Chelsea Map
Chelsea Overview
$43,448
PER CAPITA INCOME
$114,893
AVG FAMILY INCOME
$102,344
AVG HOUSEHOLD INCOME
32.8%
WAGE / INCOME GAP [ % ]
67.2¢/ $1
WAGE / INCOME GAP [ $ ]
$11,035
FAMILY INCOME DEFICIT
0.38
INEQUALITY / GINI INDEX
15,201
TOTAL POPULATION
7,884
MALE POPULATION
7,317
FEMALE POPULATION
107.75
MALES / 100 FEMALES
92.81
FEMALES / 100 MALES
37.9
MEDIAN AGE
3.3
AVG FAMILY SIZE
2.9
AVG HOUSEHOLD SIZE
7,467
LABOR FORCE [ PEOPLE ]
66.4%
PERCENT IN LABOR FORCE
4.1%
UNEMPLOYMENT RATE
Chelsea Zip Codes
Chelsea Area Codes
Income in Chelsea
Income Overview in Chelsea
Per Capita Income in Chelsea is $43,448, while median incomes of families and households are $114,893 and $102,344 respectively.
| Characteristic | Number | Measure |
| Per Capita Income | 15,201 | $43,448 |
| Median Family Income | 4,153 | $114,893 |
| Mean Family Income | 4,153 | $135,600 |
| Median Household Income | 5,209 | $102,344 |
| Mean Household Income | 5,209 | $121,561 |
| Income Deficit | 4,153 | $11,035 |
| Wage / Income Gap (%) | 15,201 | 32.77% |
| Wage / Income Gap ($) | 15,201 | 67.23¢ per $1 |
| Gini / Inequality Index | 15,201 | 0.38 |
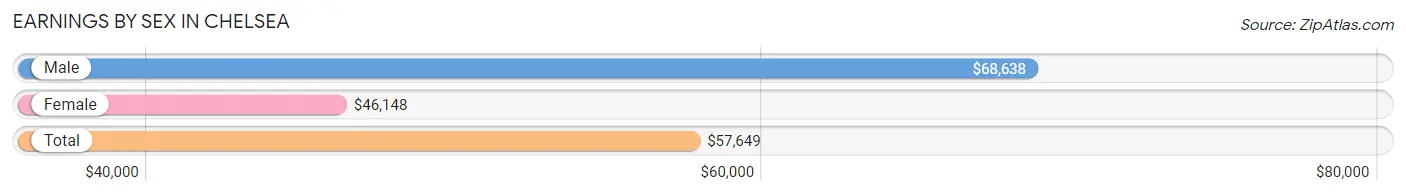
Earnings by Sex in Chelsea
Average Earnings in Chelsea are $57,649, $68,638 for men and $46,148 for women, a difference of 32.8%.
| Sex | Number | Average Earnings |
| Male | 4,113 (53.5%) | $68,638 |
| Female | 3,577 (46.5%) | $46,148 |
| Total | 7,690 (100.0%) | $57,649 |
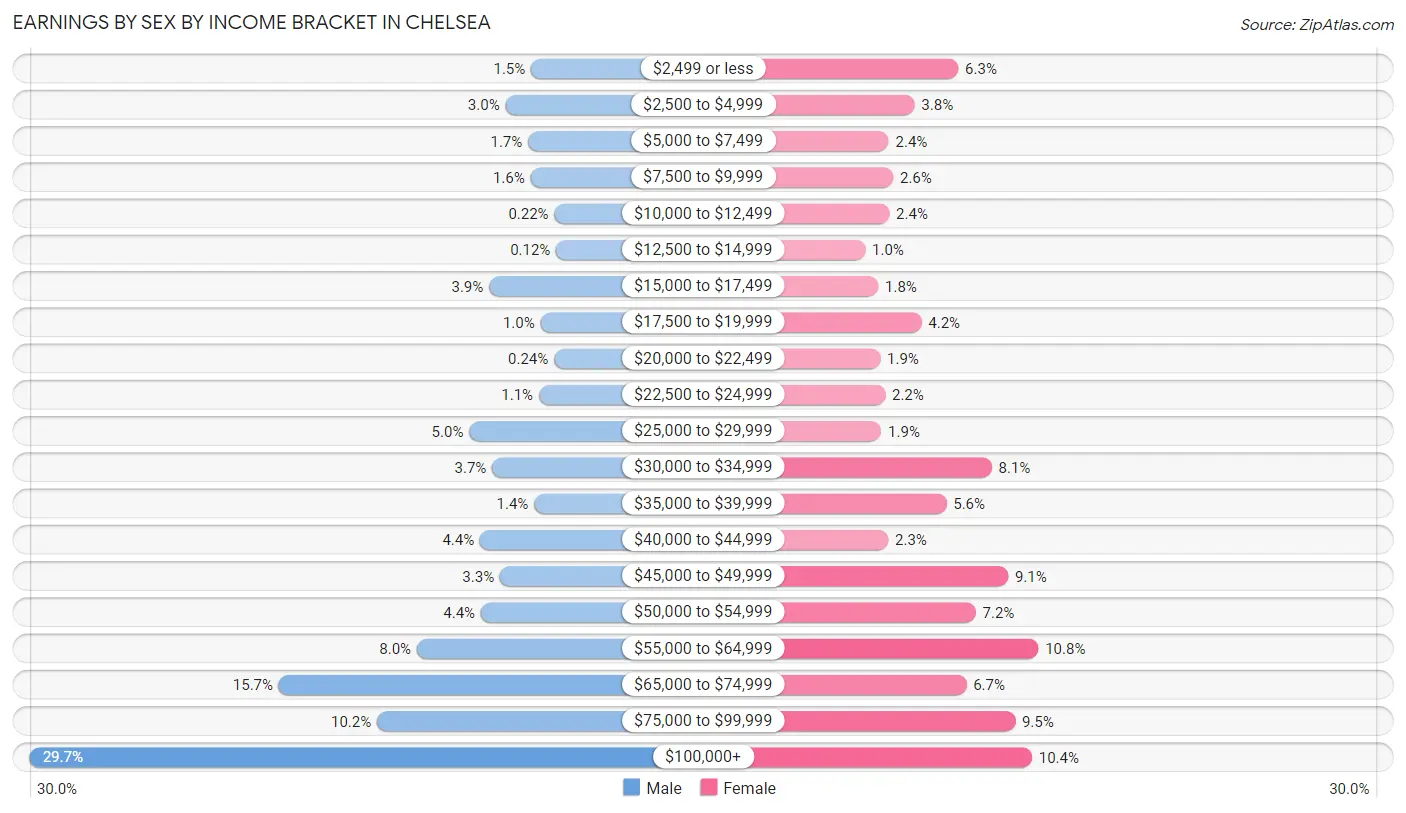
Earnings by Sex by Income Bracket in Chelsea
The most common earnings brackets in Chelsea are $100,000+ for men (1,222 | 29.7%) and $55,000 to $64,999 for women (385 | 10.8%).
| Income | Male | Female |
| $2,499 or less | 63 (1.5%) | 224 (6.3%) |
| $2,500 to $4,999 | 122 (3.0%) | 136 (3.8%) |
| $5,000 to $7,499 | 70 (1.7%) | 84 (2.4%) |
| $7,500 to $9,999 | 64 (1.6%) | 93 (2.6%) |
| $10,000 to $12,499 | 9 (0.2%) | 85 (2.4%) |
| $12,500 to $14,999 | 5 (0.1%) | 37 (1.0%) |
| $15,000 to $17,499 | 160 (3.9%) | 63 (1.8%) |
| $17,500 to $19,999 | 41 (1.0%) | 150 (4.2%) |
| $20,000 to $22,499 | 10 (0.2%) | 67 (1.9%) |
| $22,500 to $24,999 | 45 (1.1%) | 77 (2.1%) |
| $25,000 to $29,999 | 206 (5.0%) | 69 (1.9%) |
| $30,000 to $34,999 | 153 (3.7%) | 291 (8.1%) |
| $35,000 to $39,999 | 56 (1.4%) | 200 (5.6%) |
| $40,000 to $44,999 | 181 (4.4%) | 83 (2.3%) |
| $45,000 to $49,999 | 135 (3.3%) | 324 (9.1%) |
| $50,000 to $54,999 | 179 (4.3%) | 259 (7.2%) |
| $55,000 to $64,999 | 327 (8.0%) | 385 (10.8%) |
| $65,000 to $74,999 | 646 (15.7%) | 240 (6.7%) |
| $75,000 to $99,999 | 419 (10.2%) | 338 (9.5%) |
| $100,000+ | 1,222 (29.7%) | 372 (10.4%) |
| Total | 4,113 (100.0%) | 3,577 (100.0%) |
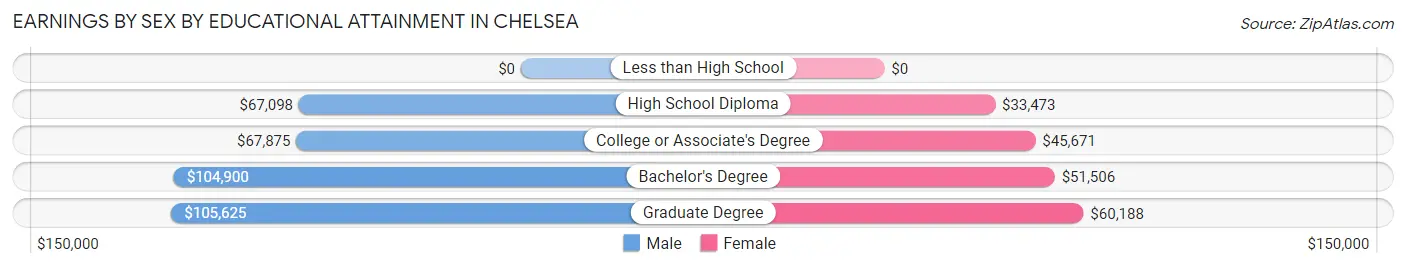
Earnings by Sex by Educational Attainment in Chelsea
Average earnings in Chelsea are $72,749 for men and $46,955 for women, a difference of 35.5%. Men with an educational attainment of graduate degree enjoy the highest average annual earnings of $105,625, while those with high school diploma education earn the least with $67,098. Women with an educational attainment of graduate degree earn the most with the average annual earnings of $60,188, while those with high school diploma education have the smallest earnings of $33,473.
| Educational Attainment | Male Income | Female Income |
| Less than High School | - | - |
| High School Diploma | $67,098 | $33,473 |
| College or Associate's Degree | $67,875 | $45,671 |
| Bachelor's Degree | $104,900 | $51,506 |
| Graduate Degree | $105,625 | $60,188 |
| Total | $72,749 | $46,955 |
Family Income in Chelsea
Family Income Brackets in Chelsea
According to the Chelsea family income data, there are 1,292 families falling into the $100,000 to $149,999 income range, which is the most common income bracket and makes up 31.1% of all families.
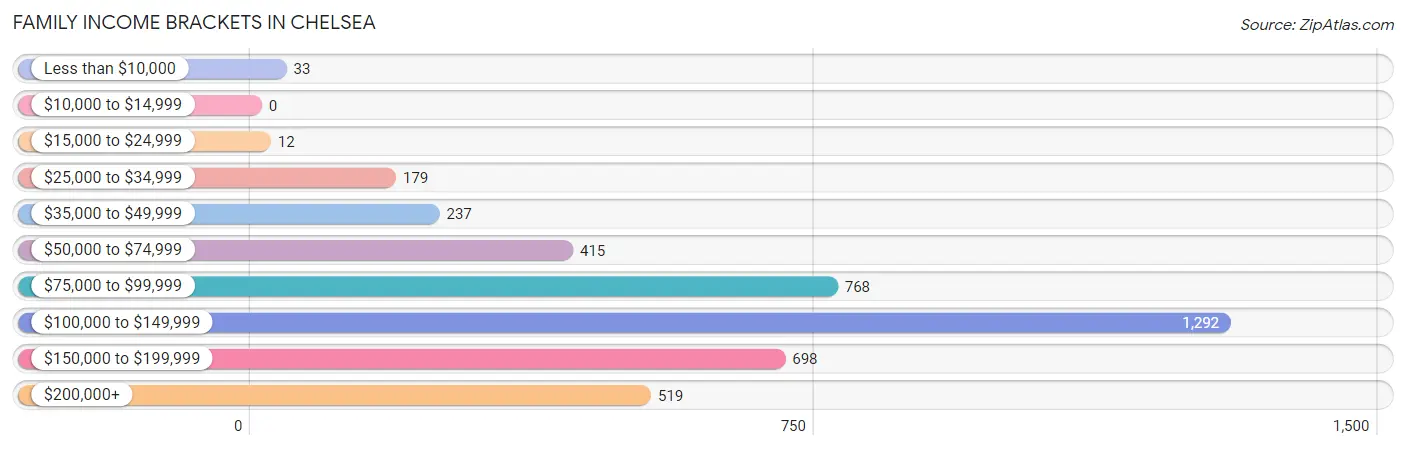
| Income Bracket | # Families | % Families |
| Less than $10,000 | 33 | 0.8% |
| $10,000 to $14,999 | 0 | 0.0% |
| $15,000 to $24,999 | 12 | 0.3% |
| $25,000 to $34,999 | 179 | 4.3% |
| $35,000 to $49,999 | 237 | 5.7% |
| $50,000 to $74,999 | 415 | 10.0% |
| $75,000 to $99,999 | 768 | 18.5% |
| $100,000 to $149,999 | 1,292 | 31.1% |
| $150,000 to $199,999 | 698 | 16.8% |
| $200,000+ | 519 | 12.5% |
Family Income by Famaliy Size in Chelsea
4-person families (921 | 22.2%) account for the highest median family income in Chelsea with $132,917 per family, while 2-person families (1,833 | 44.1%) have the highest median income of $58,270 per family member.
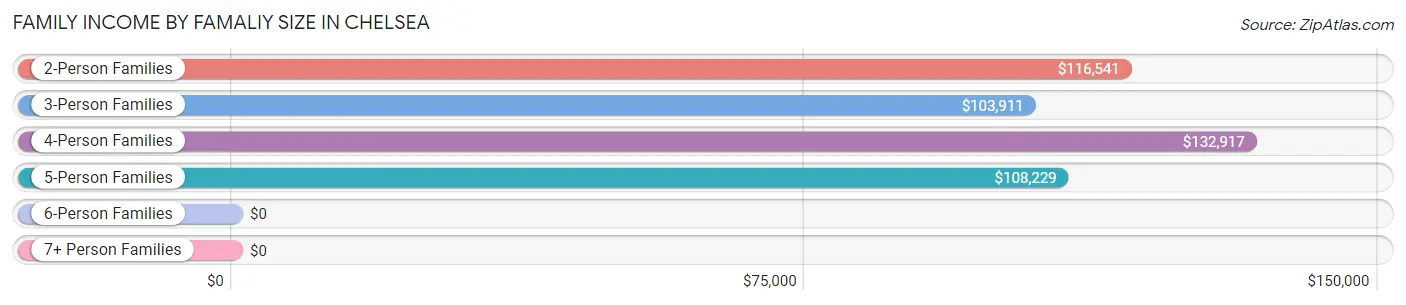
| Income Bracket | # Families | Median Income |
| 2-Person Families | 1,833 (44.1%) | $116,541 |
| 3-Person Families | 813 (19.6%) | $103,911 |
| 4-Person Families | 921 (22.2%) | $132,917 |
| 5-Person Families | 494 (11.9%) | $108,229 |
| 6-Person Families | 65 (1.6%) | $0 |
| 7+ Person Families | 27 (0.6%) | $0 |
| Total | 4,153 (100.0%) | $114,893 |
Family Income by Number of Earners in Chelsea
The median family income in Chelsea is $114,893, with families comprising 3+ earners (265) having the highest median family income of $162,104, while families with no earners (494) have the lowest median family income of $65,667, accounting for 6.4% and 11.9% of families, respectively.
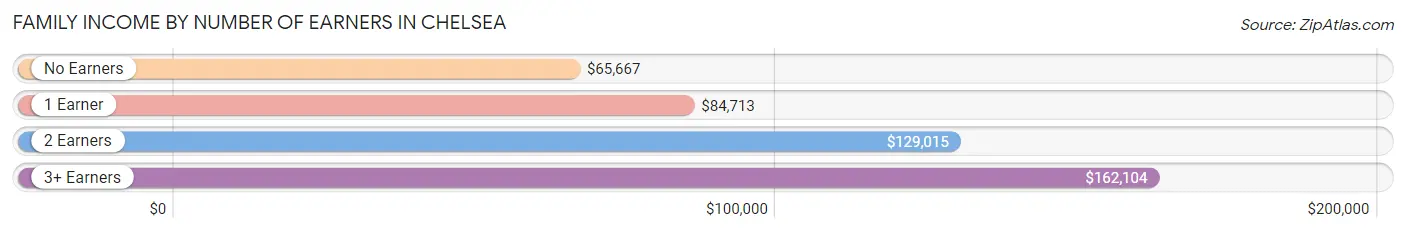
| Number of Earners | # Families | Median Income |
| No Earners | 494 (11.9%) | $65,667 |
| 1 Earner | 1,202 (28.9%) | $84,713 |
| 2 Earners | 2,192 (52.8%) | $129,015 |
| 3+ Earners | 265 (6.4%) | $162,104 |
| Total | 4,153 (100.0%) | $114,893 |
Household Income in Chelsea
Household Income Brackets in Chelsea
With 1,375 households falling in the category, the $100,000 to $149,999 income range is the most frequent in Chelsea, accounting for 26.4% of all households. In contrast, only 26 households (0.5%) fall into the $10,000 to $14,999 income bracket, making it the least populous group.
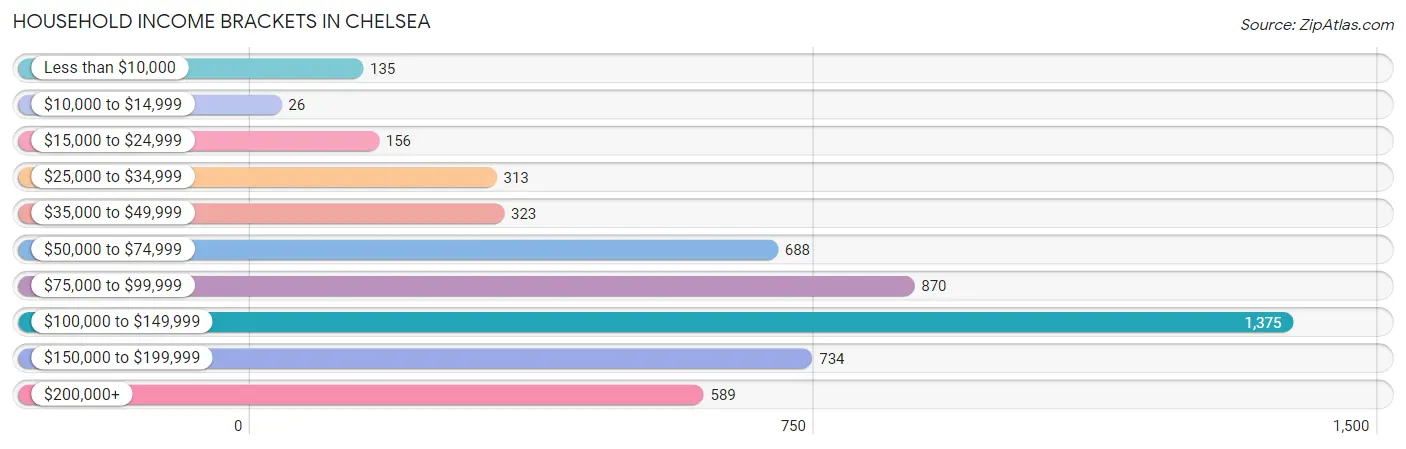
| Income Bracket | # Households | % Households |
| Less than $10,000 | 135 | 2.6% |
| $10,000 to $14,999 | 26 | 0.5% |
| $15,000 to $24,999 | 156 | 3.0% |
| $25,000 to $34,999 | 313 | 6.0% |
| $35,000 to $49,999 | 323 | 6.2% |
| $50,000 to $74,999 | 688 | 13.2% |
| $75,000 to $99,999 | 870 | 16.7% |
| $100,000 to $149,999 | 1,375 | 26.4% |
| $150,000 to $199,999 | 734 | 14.1% |
| $200,000+ | 589 | 11.3% |
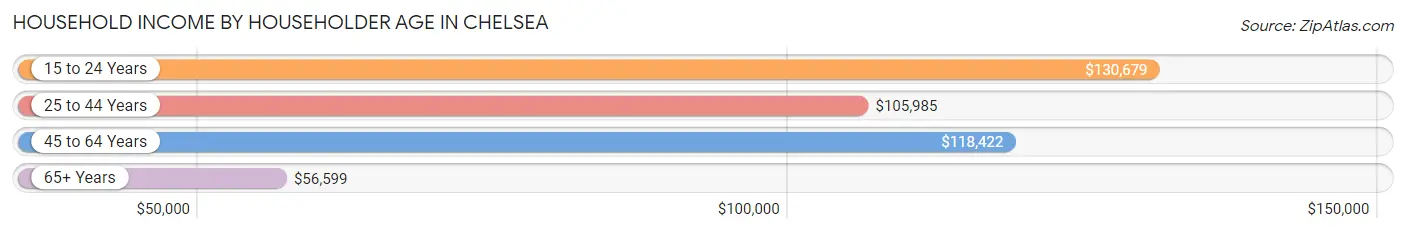
Household Income by Householder Age in Chelsea
The median household income in Chelsea is $102,344, with the highest median household income of $130,679 found in the 15 to 24 years age bracket for the primary householder. A total of 75 households (1.4%) fall into this category. Meanwhile, the 65+ years age bracket for the primary householder has the lowest median household income of $56,599, with 1,304 households (25.0%) in this group.
| Income Bracket | # Households | Median Income |
| 15 to 24 Years | 75 (1.4%) | $130,679 |
| 25 to 44 Years | 1,963 (37.7%) | $105,985 |
| 45 to 64 Years | 1,867 (35.8%) | $118,422 |
| 65+ Years | 1,304 (25.0%) | $56,599 |
| Total | 5,209 (100.0%) | $102,344 |
Poverty in Chelsea
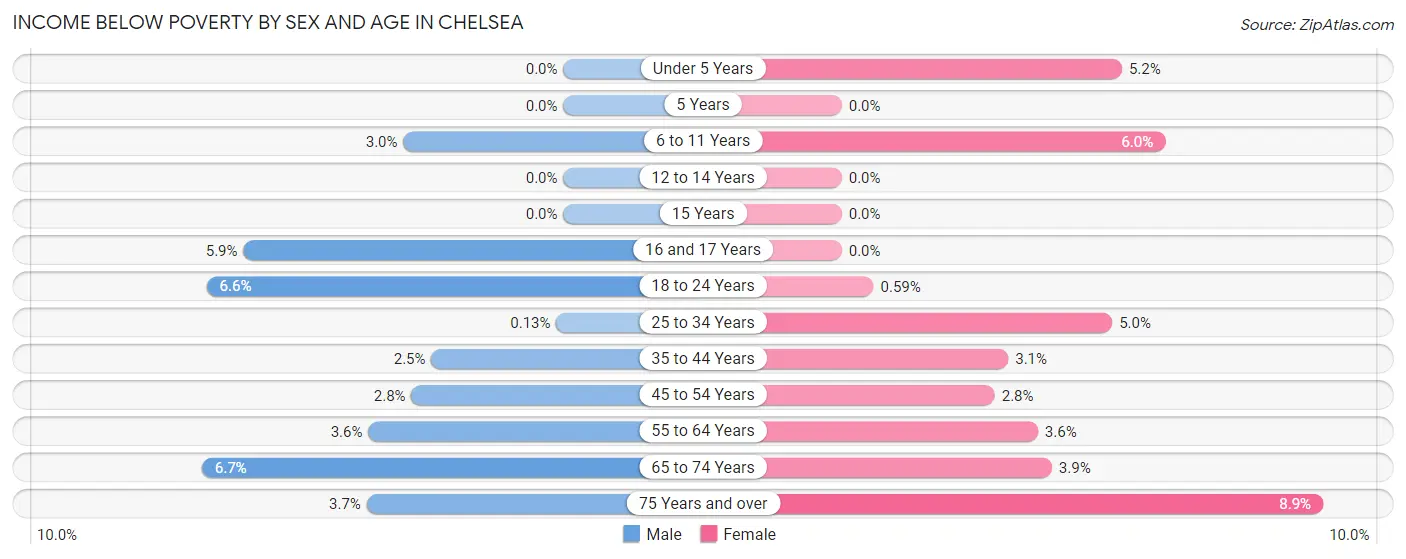
Income Below Poverty by Sex and Age in Chelsea
With 3.0% poverty level for males and 3.9% for females among the residents of Chelsea, 65 to 74 year old males and 75 year old and over females are the most vulnerable to poverty, with 46 males (6.7%) and 31 females (8.9%) in their respective age groups living below the poverty level.
| Age Bracket | Male | Female |
| Under 5 Years | 0 (0.0%) | 30 (5.2%) |
| 5 Years | 0 (0.0%) | 0 (0.0%) |
| 6 to 11 Years | 39 (3.0%) | 46 (6.0%) |
| 12 to 14 Years | 0 (0.0%) | 0 (0.0%) |
| 15 Years | 0 (0.0%) | 0 (0.0%) |
| 16 and 17 Years | 12 (5.9%) | 0 (0.0%) |
| 18 to 24 Years | 35 (6.6%) | 2 (0.6%) |
| 25 to 34 Years | 1 (0.1%) | 45 (5.0%) |
| 35 to 44 Years | 30 (2.5%) | 42 (3.1%) |
| 45 to 54 Years | 31 (2.8%) | 24 (2.8%) |
| 55 to 64 Years | 27 (3.6%) | 29 (3.6%) |
| 65 to 74 Years | 46 (6.7%) | 34 (3.9%) |
| 75 Years and over | 12 (3.6%) | 31 (8.9%) |
| Total | 233 (3.0%) | 283 (3.9%) |
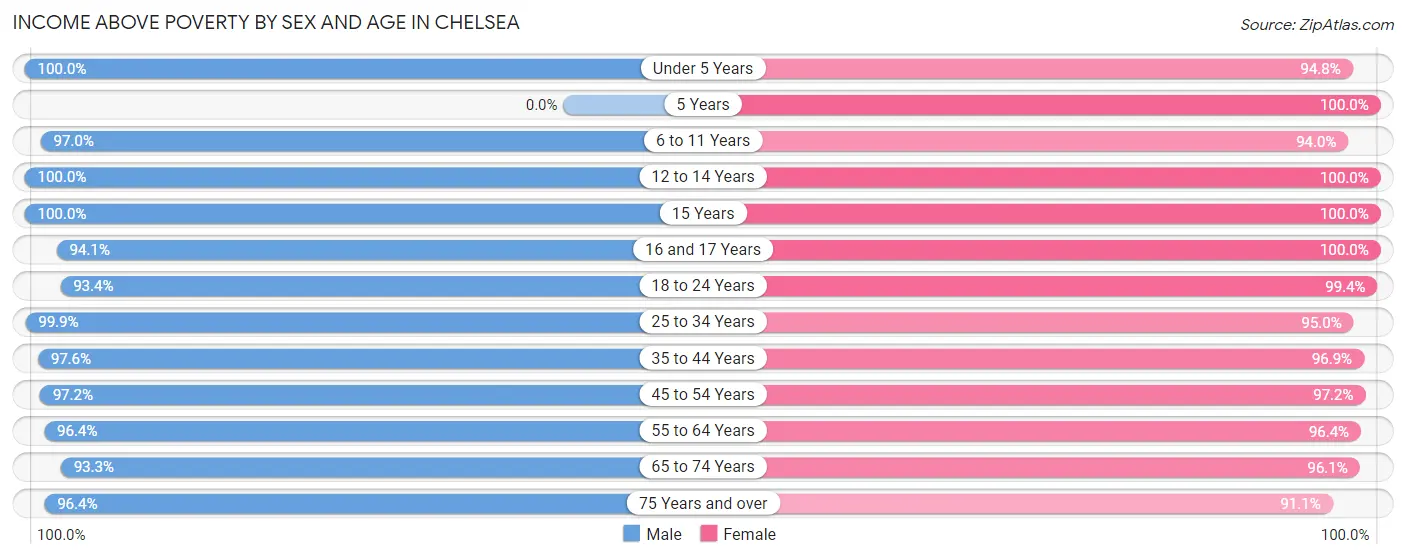
Income Above Poverty by Sex and Age in Chelsea
According to the poverty statistics in Chelsea, males aged under 5 years and females aged 5 years are the age groups that are most secure financially, with 100.0% of males and 100.0% of females in these age groups living above the poverty line.
| Age Bracket | Male | Female |
| Under 5 Years | 270 (100.0%) | 547 (94.8%) |
| 5 Years | 0 (0.0%) | 33 (100.0%) |
| 6 to 11 Years | 1,273 (97.0%) | 721 (94.0%) |
| 12 to 14 Years | 460 (100.0%) | 248 (100.0%) |
| 15 Years | 254 (100.0%) | 5 (100.0%) |
| 16 and 17 Years | 190 (94.1%) | 172 (100.0%) |
| 18 to 24 Years | 494 (93.4%) | 335 (99.4%) |
| 25 to 34 Years | 761 (99.9%) | 852 (95.0%) |
| 35 to 44 Years | 1,192 (97.6%) | 1,317 (96.9%) |
| 45 to 54 Years | 1,067 (97.2%) | 822 (97.2%) |
| 55 to 64 Years | 718 (96.4%) | 768 (96.4%) |
| 65 to 74 Years | 640 (93.3%) | 838 (96.1%) |
| 75 Years and over | 317 (96.4%) | 316 (91.1%) |
| Total | 7,636 (97.0%) | 6,974 (96.1%) |
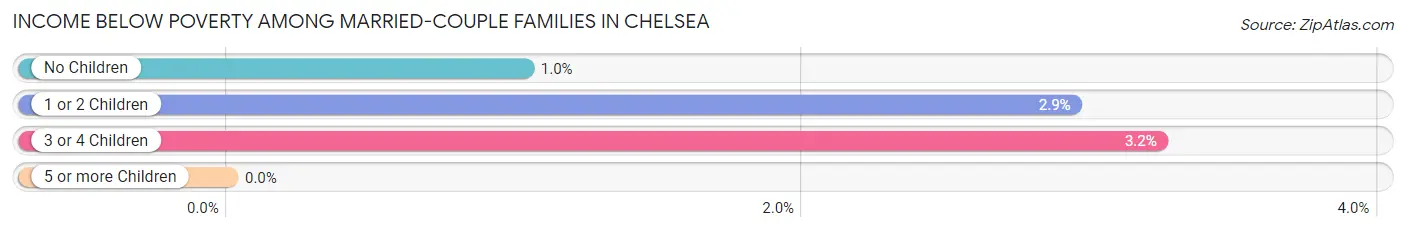
Income Below Poverty Among Married-Couple Families in Chelsea
The poverty statistics for married-couple families in Chelsea show that 2.0% or 77 of the total 3,771 families live below the poverty line. Families with 3 or 4 children have the highest poverty rate of 3.2%, comprising of 15 families. On the other hand, families with no children have the lowest poverty rate of 1.0%, which includes 19 families.
| Children | Above Poverty | Below Poverty |
| No Children | 1,826 (99.0%) | 19 (1.0%) |
| 1 or 2 Children | 1,420 (97.1%) | 43 (2.9%) |
| 3 or 4 Children | 448 (96.8%) | 15 (3.2%) |
| 5 or more Children | 0 (0.0%) | 0 (0.0%) |
| Total | 3,694 (98.0%) | 77 (2.0%) |
Income Below Poverty Among Single-Parent Households in Chelsea
| Children | Single Father | Single Mother |
| No Children | 0 (0.0%) | 0 (0.0%) |
| 1 or 2 Children | 0 (0.0%) | 0 (0.0%) |
| 3 or 4 Children | 0 (0.0%) | 0 (0.0%) |
| 5 or more Children | 0 (0.0%) | 0 (0.0%) |
| Total | 0 (0.0%) | 0 (0.0%) |
Income Below Poverty Among Married-Couple vs Single-Parent Households in Chelsea
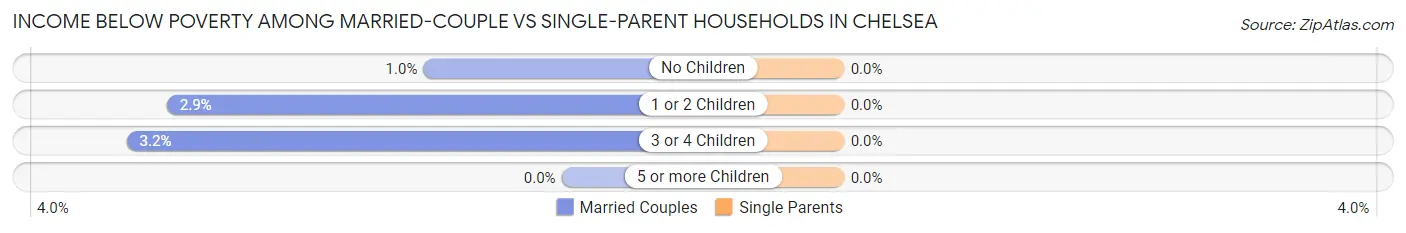
| Children | Married-Couple Families | Single-Parent Households |
| No Children | 19 (1.0%) | 0 (0.0%) |
| 1 or 2 Children | 43 (2.9%) | 0 (0.0%) |
| 3 or 4 Children | 15 (3.2%) | 0 (0.0%) |
| 5 or more Children | 0 (0.0%) | 0 (0.0%) |
| Total | 77 (2.0%) | 0 (0.0%) |
Race in Chelsea
The most populous races in Chelsea are White / Caucasian (13,375 | 88.0%), Black / African American (1,270 | 8.4%), and Hispanic or Latino (524 | 3.5%).
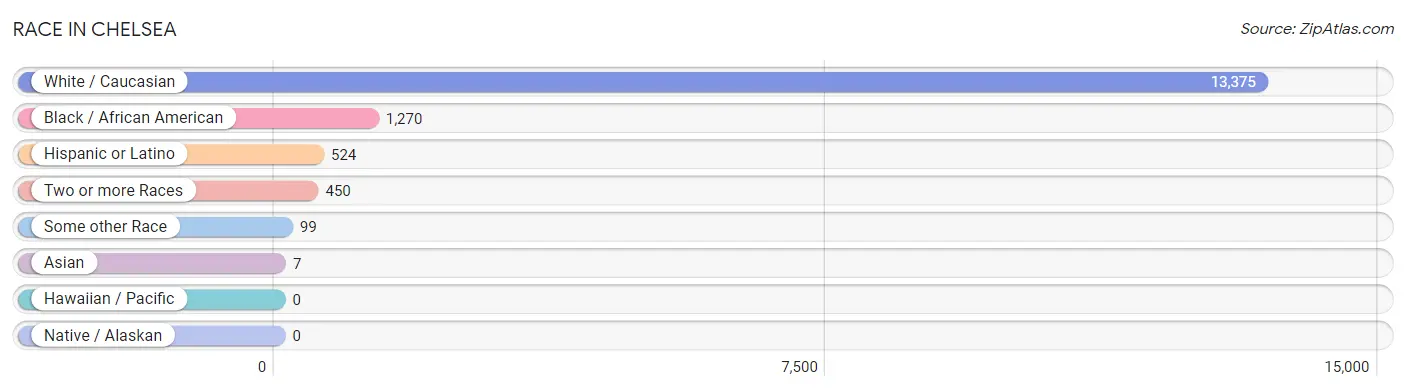
| Race | # Population | % Population |
| Asian | 7 | 0.1% |
| Black / African American | 1,270 | 8.4% |
| Hawaiian / Pacific | 0 | 0.0% |
| Hispanic or Latino | 524 | 3.5% |
| Native / Alaskan | 0 | 0.0% |
| White / Caucasian | 13,375 | 88.0% |
| Two or more Races | 450 | 3.0% |
| Some other Race | 99 | 0.6% |
| Total | 15,201 | 100.0% |
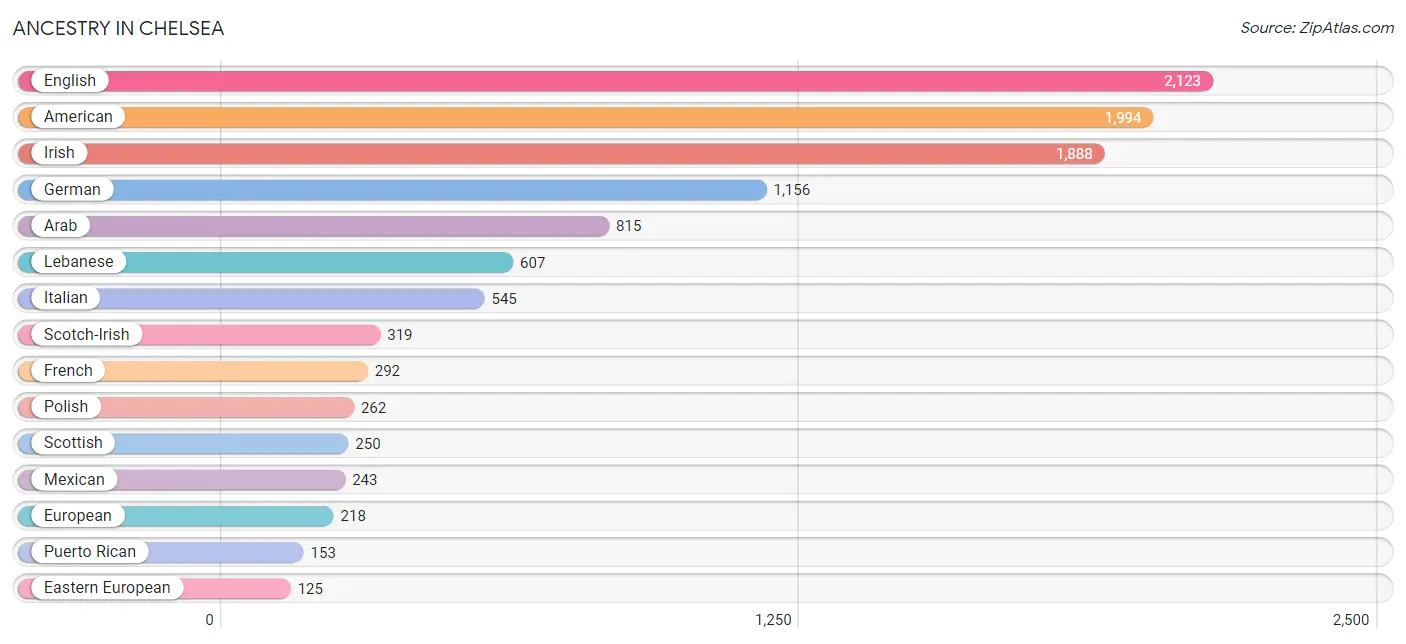
Ancestry in Chelsea
The most populous ancestries reported in Chelsea are English (2,123 | 14.0%), American (1,994 | 13.1%), Irish (1,888 | 12.4%), German (1,156 | 7.6%), and Arab (815 | 5.4%), together accounting for 52.5% of all Chelsea residents.
| Ancestry | # Population | % Population |
| African | 36 | 0.2% |
| American | 1,994 | 13.1% |
| Arab | 815 | 5.4% |
| Austrian | 26 | 0.2% |
| Bhutanese | 25 | 0.2% |
| British | 53 | 0.4% |
| Burmese | 7 | 0.1% |
| Cajun | 32 | 0.2% |
| Cherokee | 21 | 0.1% |
| Colombian | 20 | 0.1% |
| Cuban | 55 | 0.4% |
| Czechoslovakian | 8 | 0.1% |
| Danish | 11 | 0.1% |
| Dutch | 97 | 0.6% |
| Eastern European | 125 | 0.8% |
| English | 2,123 | 14.0% |
| European | 218 | 1.4% |
| Finnish | 107 | 0.7% |
| French | 292 | 1.9% |
| French Canadian | 11 | 0.1% |
| German | 1,156 | 7.6% |
| Greek | 22 | 0.1% |
| Guamanian / Chamorro | 70 | 0.5% |
| Irish | 1,888 | 12.4% |
| Italian | 545 | 3.6% |
| Korean | 24 | 0.2% |
| Lebanese | 607 | 4.0% |
| Mexican | 243 | 1.6% |
| Native Hawaiian | 30 | 0.2% |
| Northern European | 71 | 0.5% |
| Norwegian | 14 | 0.1% |
| Pakistani | 72 | 0.5% |
| Polish | 262 | 1.7% |
| Puerto Rican | 153 | 1.0% |
| Romanian | 54 | 0.4% |
| Russian | 44 | 0.3% |
| Scandinavian | 35 | 0.2% |
| Scotch-Irish | 319 | 2.1% |
| Scottish | 250 | 1.6% |
| Seminole | 4 | 0.0% |
| Slavic | 10 | 0.1% |
| South American | 65 | 0.4% |
| Subsaharan African | 36 | 0.2% |
| Swedish | 88 | 0.6% |
| Swiss | 20 | 0.1% |
| Syrian | 51 | 0.3% |
| Turkish | 7 | 0.1% |
| Ukrainian | 17 | 0.1% |
| Venezuelan | 45 | 0.3% |
| Welsh | 15 | 0.1% | View All 50 Rows |
Immigrants in Chelsea
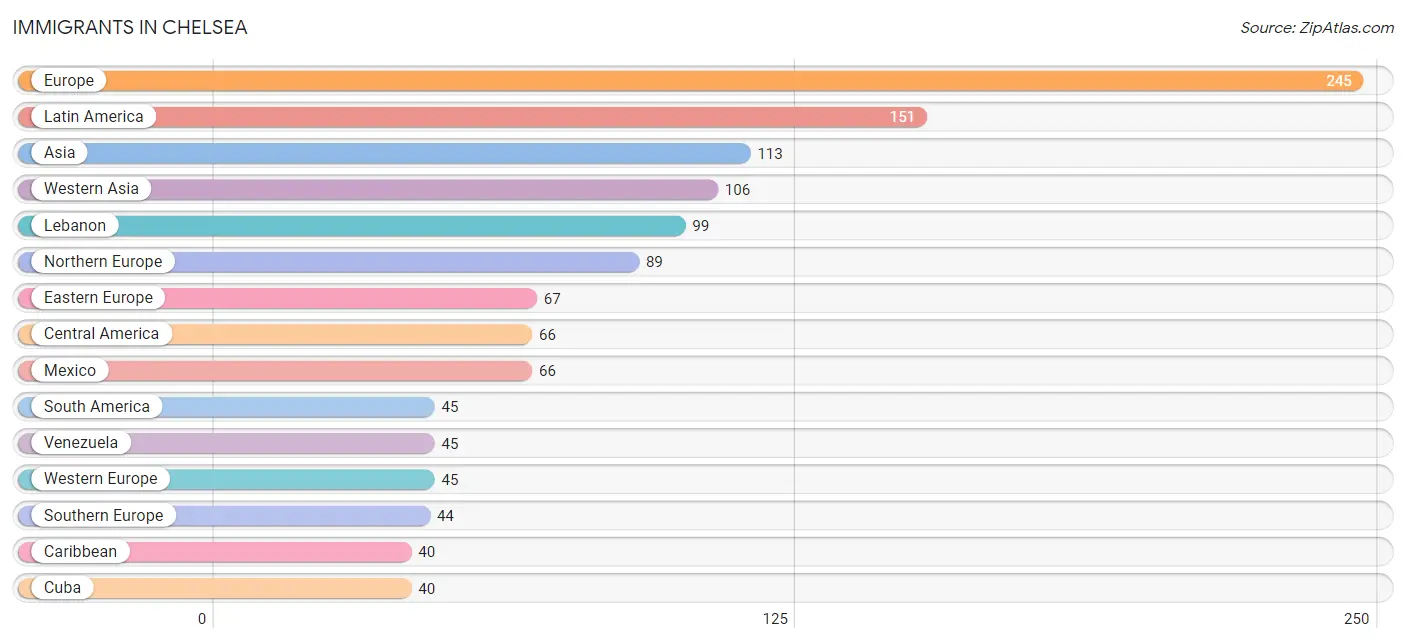
The most numerous immigrant groups reported in Chelsea came from Europe (245 | 1.6%), Latin America (151 | 1.0%), Asia (113 | 0.7%), Western Asia (106 | 0.7%), and Lebanon (99 | 0.6%), together accounting for 4.7% of all Chelsea residents.
| Immigration Origin | # Population | % Population |
| Asia | 113 | 0.7% |
| Caribbean | 40 | 0.3% |
| Central America | 66 | 0.4% |
| Cuba | 40 | 0.3% |
| Eastern Asia | 7 | 0.1% |
| Eastern Europe | 67 | 0.4% |
| England | 10 | 0.1% |
| Europe | 245 | 1.6% |
| Germany | 12 | 0.1% |
| Greece | 13 | 0.1% |
| Italy | 31 | 0.2% |
| Korea | 7 | 0.1% |
| Latin America | 151 | 1.0% |
| Lebanon | 99 | 0.6% |
| Mexico | 66 | 0.4% |
| Netherlands | 33 | 0.2% |
| Northern Europe | 89 | 0.6% |
| Russia | 24 | 0.2% |
| South America | 45 | 0.3% |
| Southern Europe | 44 | 0.3% |
| Turkey | 7 | 0.1% |
| Ukraine | 33 | 0.2% |
| Venezuela | 45 | 0.3% |
| Western Asia | 106 | 0.7% |
| Western Europe | 45 | 0.3% | View All 25 Rows |
Sex and Age in Chelsea
Sex and Age in Chelsea
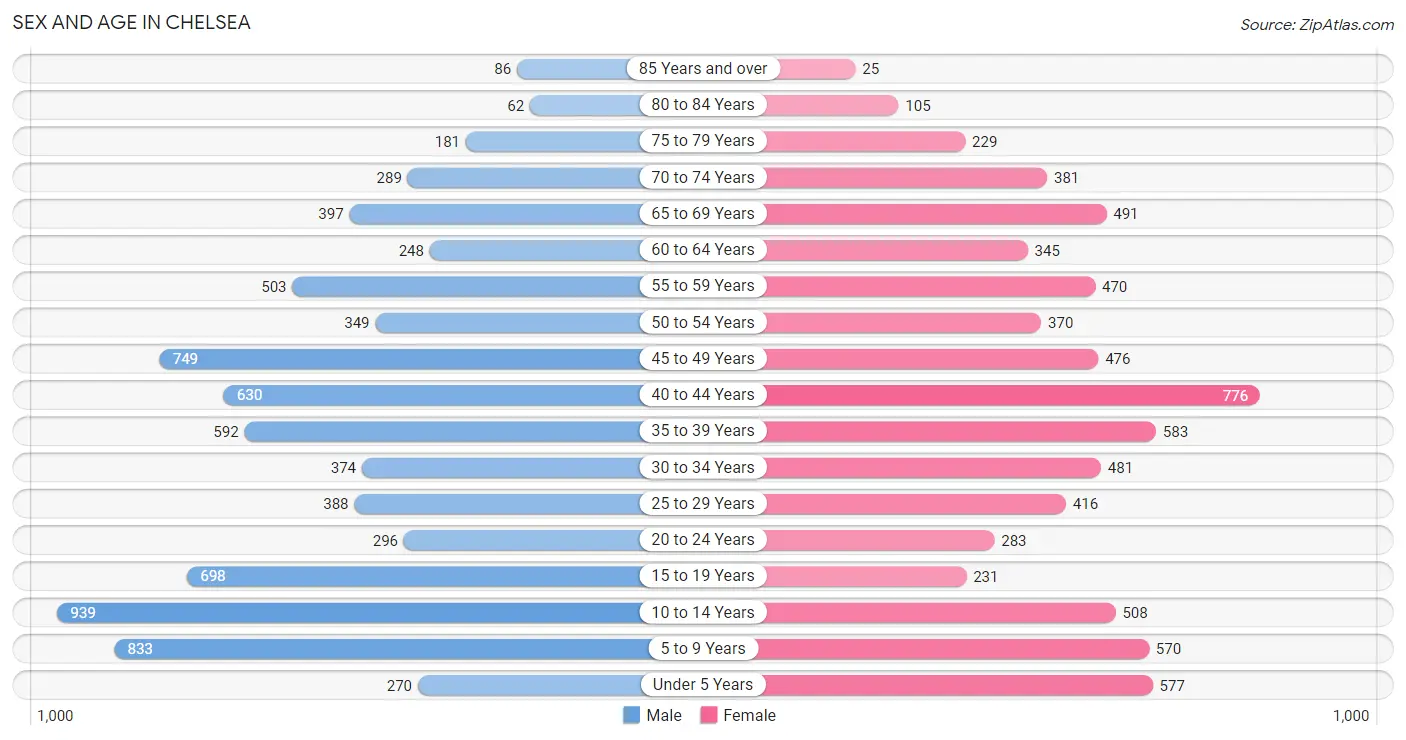
The most populous age groups in Chelsea are 10 to 14 Years (939 | 11.9%) for men and 40 to 44 Years (776 | 10.6%) for women.
| Age Bracket | Male | Female |
| Under 5 Years | 270 (3.4%) | 577 (7.9%) |
| 5 to 9 Years | 833 (10.6%) | 570 (7.8%) |
| 10 to 14 Years | 939 (11.9%) | 508 (6.9%) |
| 15 to 19 Years | 698 (8.8%) | 231 (3.2%) |
| 20 to 24 Years | 296 (3.7%) | 283 (3.9%) |
| 25 to 29 Years | 388 (4.9%) | 416 (5.7%) |
| 30 to 34 Years | 374 (4.7%) | 481 (6.6%) |
| 35 to 39 Years | 592 (7.5%) | 583 (8.0%) |
| 40 to 44 Years | 630 (8.0%) | 776 (10.6%) |
| 45 to 49 Years | 749 (9.5%) | 476 (6.5%) |
| 50 to 54 Years | 349 (4.4%) | 370 (5.1%) |
| 55 to 59 Years | 503 (6.4%) | 470 (6.4%) |
| 60 to 64 Years | 248 (3.2%) | 345 (4.7%) |
| 65 to 69 Years | 397 (5.0%) | 491 (6.7%) |
| 70 to 74 Years | 289 (3.7%) | 381 (5.2%) |
| 75 to 79 Years | 181 (2.3%) | 229 (3.1%) |
| 80 to 84 Years | 62 (0.8%) | 105 (1.4%) |
| 85 Years and over | 86 (1.1%) | 25 (0.3%) |
| Total | 7,884 (100.0%) | 7,317 (100.0%) |
Families and Households in Chelsea
Median Family Size in Chelsea
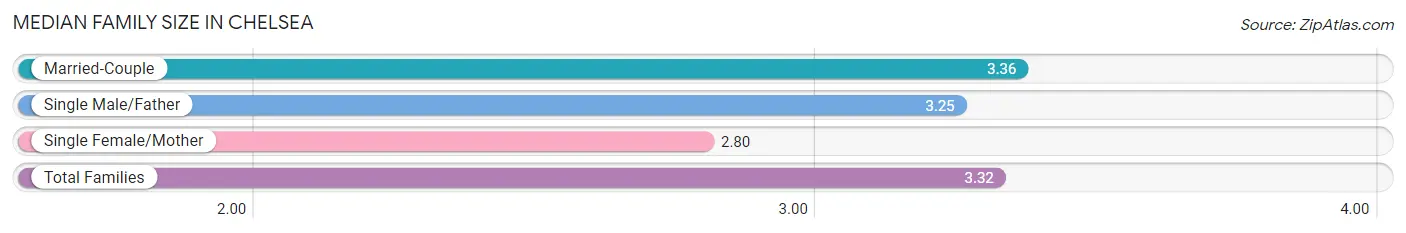
The median family size in Chelsea is 3.32 persons per family, with married-couple families (3,771 | 90.8%) accounting for the largest median family size of 3.36 persons per family. On the other hand, single female/mother families (215 | 5.2%) represent the smallest median family size with 2.80 persons per family.
| Family Type | # Families | Family Size |
| Married-Couple | 3,771 (90.8%) | 3.36 |
| Single Male/Father | 167 (4.0%) | 3.25 |
| Single Female/Mother | 215 (5.2%) | 2.80 |
| Total Families | 4,153 (100.0%) | 3.32 |
Median Household Size in Chelsea
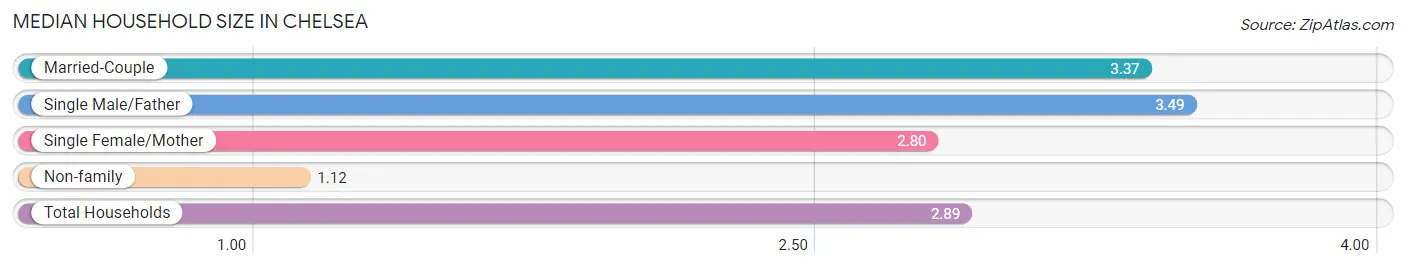
The median household size in Chelsea is 2.89 persons per household, with single male/father households (167 | 3.2%) accounting for the largest median household size of 3.49 persons per household. non-family households (1,056 | 20.3%) represent the smallest median household size with 1.12 persons per household.
| Household Type | # Households | Household Size |
| Married-Couple | 3,771 (72.4%) | 3.37 |
| Single Male/Father | 167 (3.2%) | 3.49 |
| Single Female/Mother | 215 (4.1%) | 2.80 |
| Non-family | 1,056 (20.3%) | 1.12 |
| Total Households | 5,209 (100.0%) | 2.89 |
Household Size by Marriage Status in Chelsea
Out of a total of 5,209 households in Chelsea, 4,153 (79.7%) are family households, while 1,056 (20.3%) are nonfamily households. The most numerous type of family households are 2-person households, comprising 1,821, and the most common type of nonfamily households are 1-person households, comprising 981.
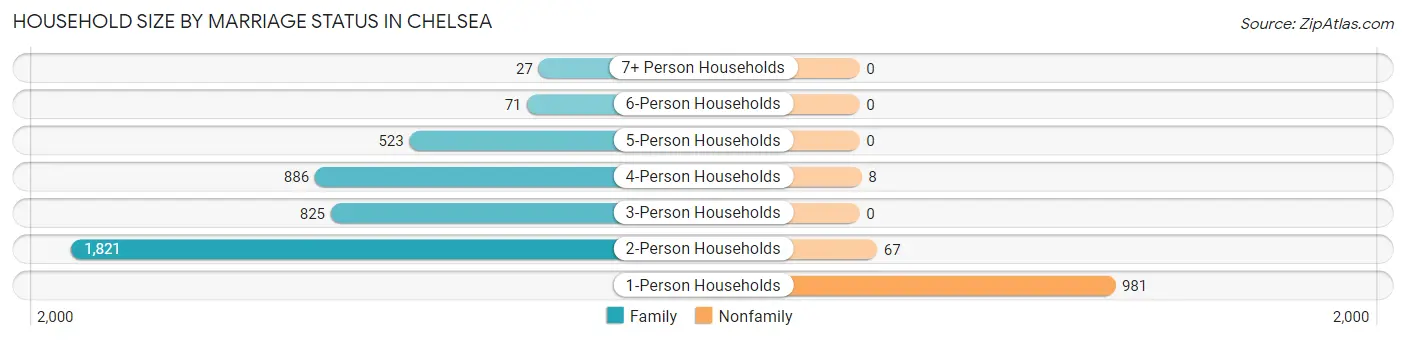
| Household Size | Family Households | Nonfamily Households |
| 1-Person Households | - | 981 (18.8%) |
| 2-Person Households | 1,821 (35.0%) | 67 (1.3%) |
| 3-Person Households | 825 (15.8%) | 0 (0.0%) |
| 4-Person Households | 886 (17.0%) | 8 (0.2%) |
| 5-Person Households | 523 (10.0%) | 0 (0.0%) |
| 6-Person Households | 71 (1.4%) | 0 (0.0%) |
| 7+ Person Households | 27 (0.5%) | 0 (0.0%) |
| Total | 4,153 (79.7%) | 1,056 (20.3%) |
Female Fertility in Chelsea
Fertility by Age in Chelsea
Average fertility rate in Chelsea is 58.0 births per 1,000 women. Women in the age bracket of 20 to 34 years have the highest fertility rate with 137.0 births per 1,000 women. Women in the age bracket of 20 to 34 years acount for 84.4% of all women with births.
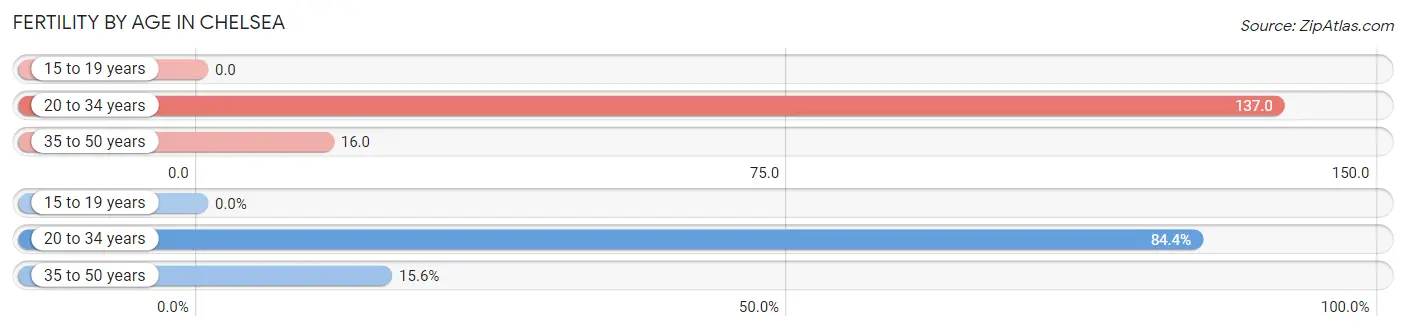
| Age Bracket | Women with Births | Births / 1,000 Women |
| 15 to 19 years | 0 (0.0%) | 0.0 |
| 20 to 34 years | 162 (84.4%) | 137.0 |
| 35 to 50 years | 30 (15.6%) | 16.0 |
| Total | 192 (100.0%) | 58.0 |
Fertility by Age by Marriage Status in Chelsea
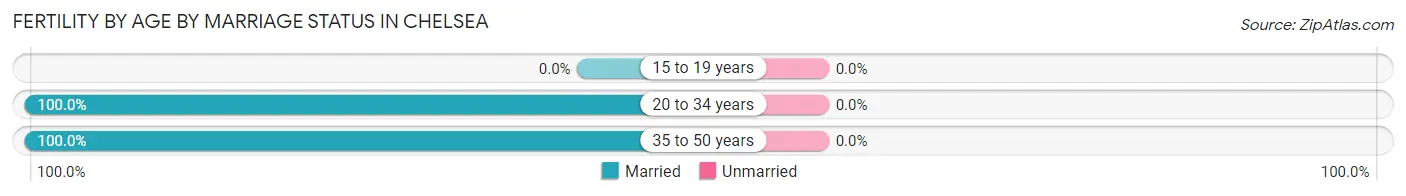
| Age Bracket | Married | Unmarried |
| 15 to 19 years | 0 (0.0%) | 0 (0.0%) |
| 20 to 34 years | 162 (100.0%) | 0 (0.0%) |
| 35 to 50 years | 30 (100.0%) | 0 (0.0%) |
| Total | 192 (100.0%) | 0 (0.0%) |
Fertility by Education in Chelsea
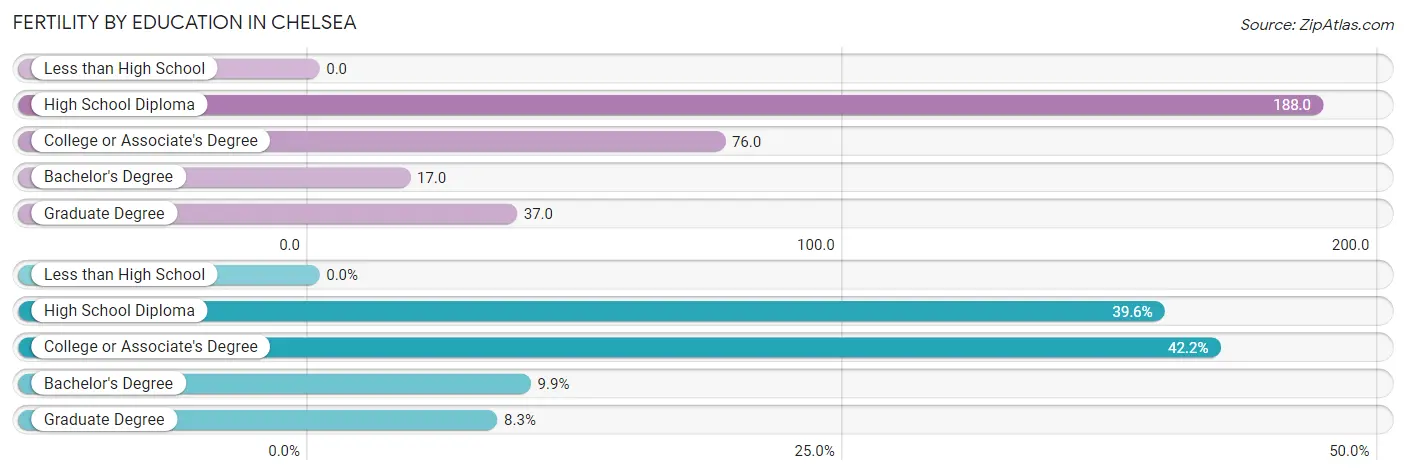
| Educational Attainment | Women with Births | Births / 1,000 Women |
| Less than High School | 0 (0.0%) | 0.0 |
| High School Diploma | 76 (39.6%) | 188.0 |
| College or Associate's Degree | 81 (42.2%) | 76.0 |
| Bachelor's Degree | 19 (9.9%) | 17.0 |
| Graduate Degree | 16 (8.3%) | 37.0 |
| Total | 192 (100.0%) | 58.0 |
Fertility by Education by Marriage Status in Chelsea
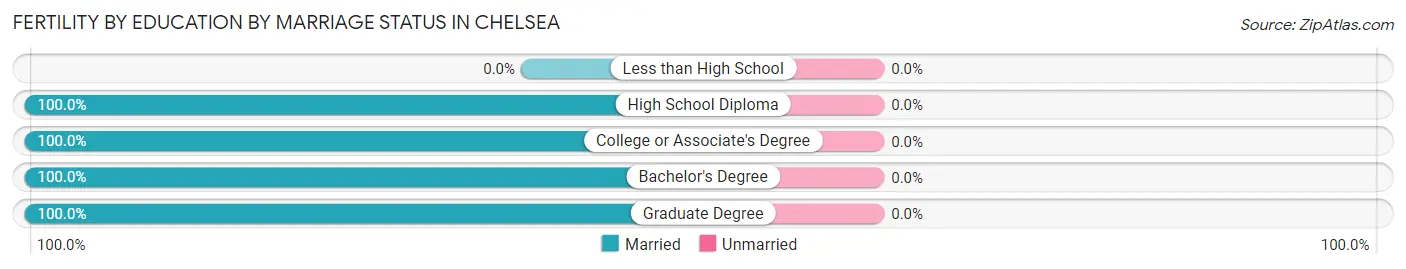
| Educational Attainment | Married | Unmarried |
| Less than High School | 0 (0.0%) | 0 (0.0%) |
| High School Diploma | 76 (100.0%) | 0 (0.0%) |
| College or Associate's Degree | 81 (100.0%) | 0 (0.0%) |
| Bachelor's Degree | 19 (100.0%) | 0 (0.0%) |
| Graduate Degree | 16 (100.0%) | 0 (0.0%) |
| Total | 192 (100.0%) | 0 (0.0%) |
Employment Characteristics in Chelsea
Employment by Class of Employer in Chelsea
Among the 7,154 employed individuals in Chelsea, private company employees (5,006 | 70.0%), local government employees (761 | 10.6%), and not-for-profit organizations (529 | 7.4%) make up the most common classes of employment.
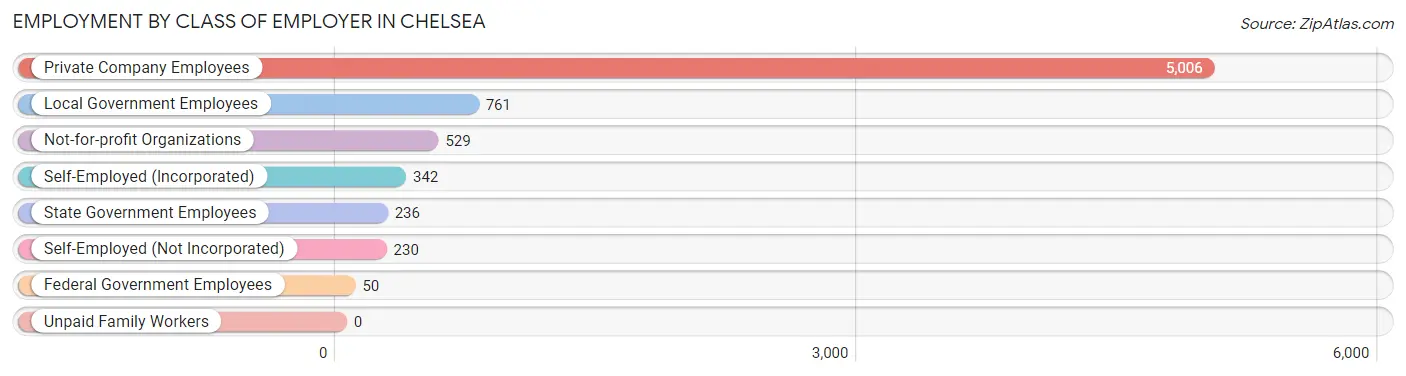
| Employer Class | # Employees | % Employees |
| Private Company Employees | 5,006 | 70.0% |
| Self-Employed (Incorporated) | 342 | 4.8% |
| Self-Employed (Not Incorporated) | 230 | 3.2% |
| Not-for-profit Organizations | 529 | 7.4% |
| Local Government Employees | 761 | 10.6% |
| State Government Employees | 236 | 3.3% |
| Federal Government Employees | 50 | 0.7% |
| Unpaid Family Workers | 0 | 0.0% |
| Total | 7,154 | 100.0% |
Employment Status by Age in Chelsea
According to the labor force statistics for Chelsea, out of the total population over 16 years of age (11,245), 66.4% or 7,467 individuals are in the labor force, with 4.1% or 306 of them unemployed. The age group with the highest labor force participation rate is 25 to 29 years, with 96.1% or 773 individuals in the labor force. Within the labor force, the 16 to 19 years age range has the highest percentage of unemployed individuals, with 23.8% or 77 of them being unemployed.
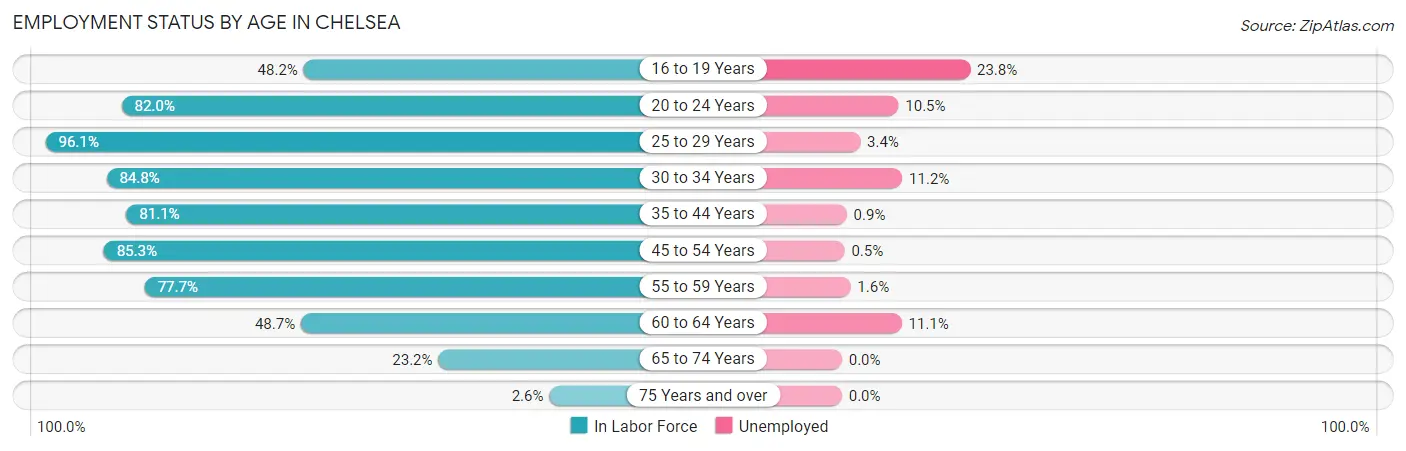
| Age Bracket | In Labor Force | Unemployed |
| 16 to 19 Years | 323 (48.2%) | 77 (23.8%) |
| 20 to 24 Years | 475 (82.0%) | 50 (10.5%) |
| 25 to 29 Years | 773 (96.1%) | 26 (3.4%) |
| 30 to 34 Years | 725 (84.8%) | 81 (11.2%) |
| 35 to 44 Years | 2,093 (81.1%) | 19 (0.9%) |
| 45 to 54 Years | 1,658 (85.3%) | 8 (0.5%) |
| 55 to 59 Years | 756 (77.7%) | 12 (1.6%) |
| 60 to 64 Years | 289 (48.7%) | 32 (11.1%) |
| 65 to 74 Years | 361 (23.2%) | 0 (0.0%) |
| 75 Years and over | 18 (2.6%) | 0 (0.0%) |
| Total | 7,467 (66.4%) | 306 (4.1%) |
Employment Status by Educational Attainment in Chelsea
According to labor force statistics for Chelsea, 81.2% of individuals (6,293) out of the total population between 25 and 64 years of age (7,750) are in the labor force, with 2.8% or 176 of them being unemployed. The group with the highest labor force participation rate are those with the educational attainment of bachelor's degree or higher, with 84.2% or 3,193 individuals in the labor force. Within the labor force, individuals with high school diploma education have the highest percentage of unemployment, with 5.8% or 45 of them being unemployed.
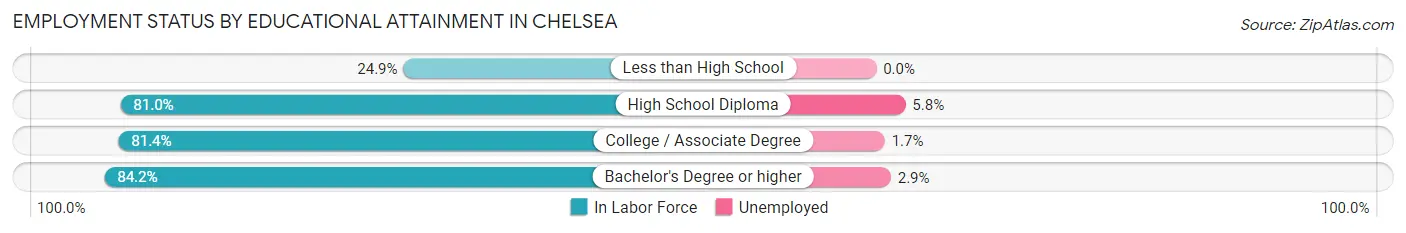
| Educational Attainment | In Labor Force | Unemployed |
| Less than High School | 51 (24.9%) | 0 (0.0%) |
| High School Diploma | 773 (81.0%) | 55 (5.8%) |
| College / Associate Degree | 2,278 (81.4%) | 48 (1.7%) |
| Bachelor's Degree or higher | 3,193 (84.2%) | 110 (2.9%) |
| Total | 6,293 (81.2%) | 217 (2.8%) |
Employment Occupations by Sex in Chelsea
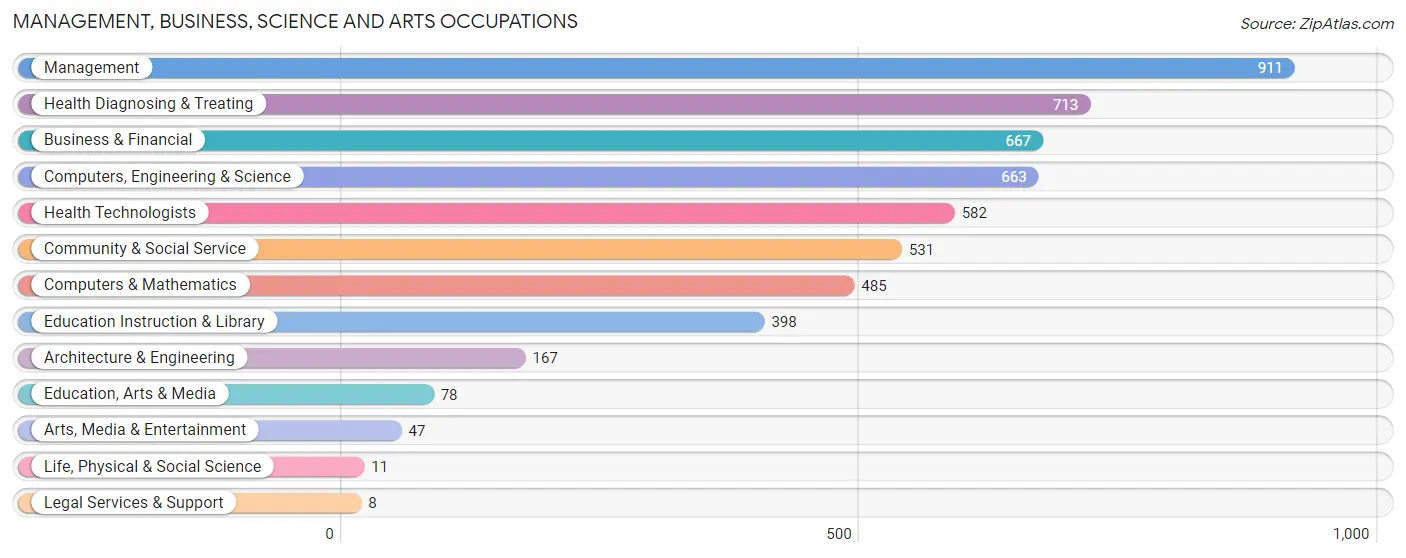
Management, Business, Science and Arts Occupations
The most common Management, Business, Science and Arts occupations in Chelsea are Management (911 | 12.7%), Health Diagnosing & Treating (713 | 10.0%), Business & Financial (667 | 9.3%), Computers, Engineering & Science (663 | 9.2%), and Health Technologists (582 | 8.1%).
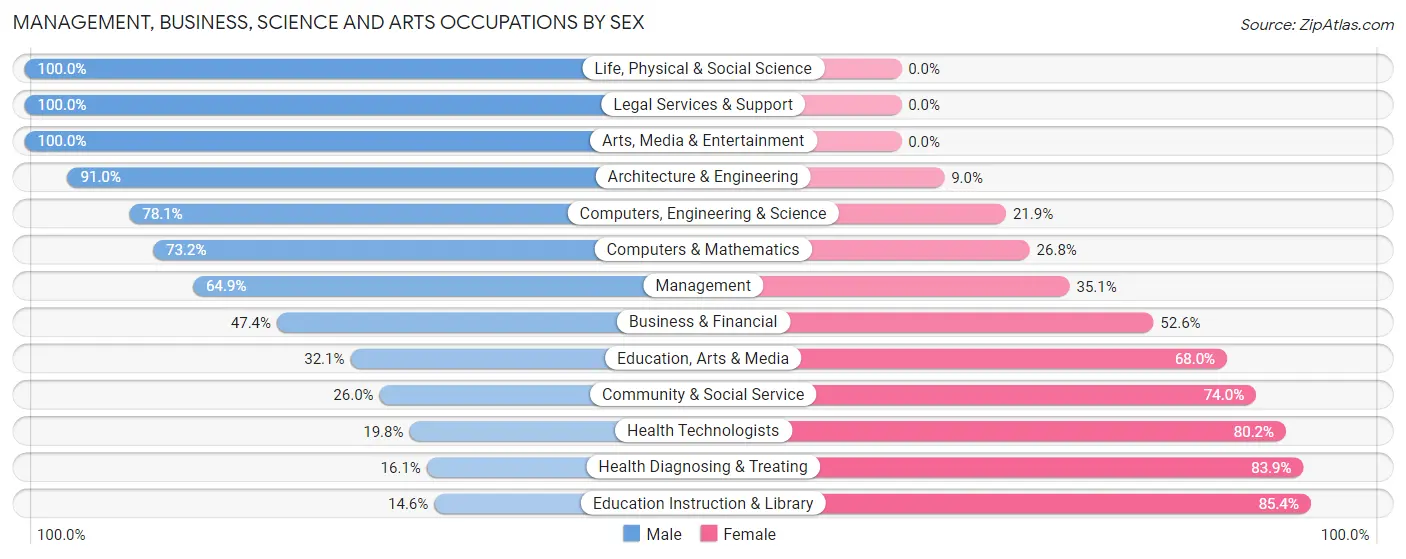
Management, Business, Science and Arts Occupations by Sex
Within the Management, Business, Science and Arts occupations in Chelsea, the most male-oriented occupations are Life, Physical & Social Science (100.0%), Legal Services & Support (100.0%), and Arts, Media & Entertainment (100.0%), while the most female-oriented occupations are Education Instruction & Library (85.4%), Health Diagnosing & Treating (83.9%), and Health Technologists (80.2%).
| Occupation | Male | Female |
| Management | 591 (64.9%) | 320 (35.1%) |
| Business & Financial | 316 (47.4%) | 351 (52.6%) |
| Computers, Engineering & Science | 518 (78.1%) | 145 (21.9%) |
| Computers & Mathematics | 355 (73.2%) | 130 (26.8%) |
| Architecture & Engineering | 152 (91.0%) | 15 (9.0%) |
| Life, Physical & Social Science | 11 (100.0%) | 0 (0.0%) |
| Community & Social Service | 138 (26.0%) | 393 (74.0%) |
| Education, Arts & Media | 25 (32.1%) | 53 (67.9%) |
| Legal Services & Support | 8 (100.0%) | 0 (0.0%) |
| Education Instruction & Library | 58 (14.6%) | 340 (85.4%) |
| Arts, Media & Entertainment | 47 (100.0%) | 0 (0.0%) |
| Health Diagnosing & Treating | 115 (16.1%) | 598 (83.9%) |
| Health Technologists | 115 (19.8%) | 467 (80.2%) |
| Total (Category) | 1,678 (48.1%) | 1,807 (51.8%) |
| Total (Overall) | 3,993 (55.7%) | 3,173 (44.3%) |
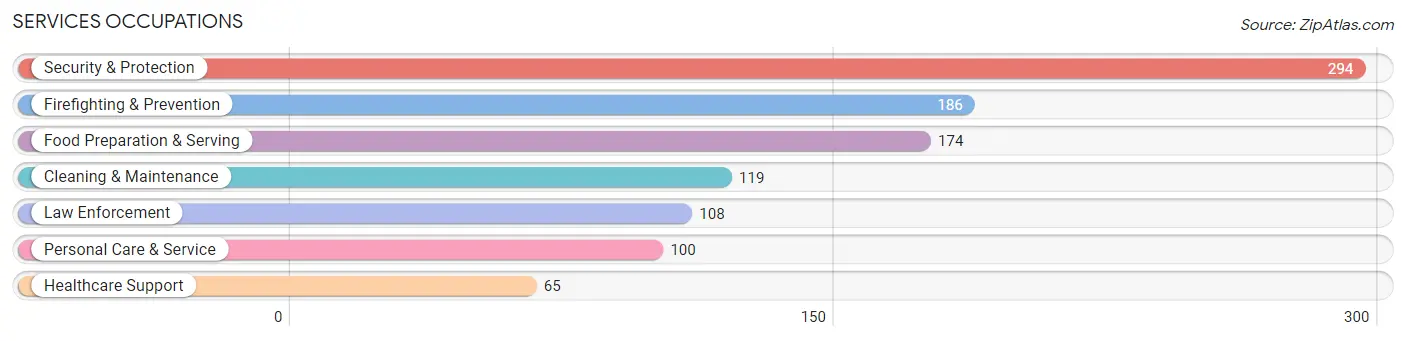
Services Occupations
The most common Services occupations in Chelsea are Security & Protection (294 | 4.1%), Firefighting & Prevention (186 | 2.6%), Food Preparation & Serving (174 | 2.4%), Cleaning & Maintenance (119 | 1.7%), and Law Enforcement (108 | 1.5%).
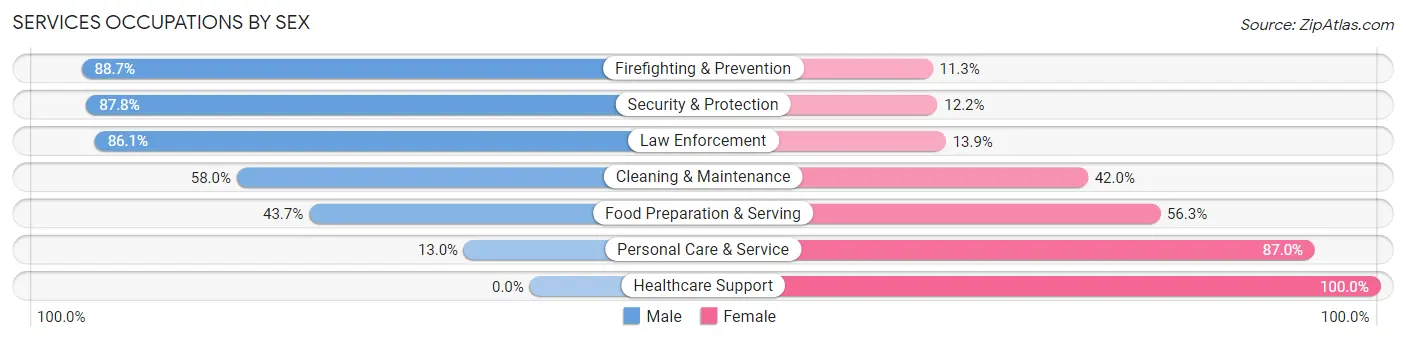
Services Occupations by Sex
Within the Services occupations in Chelsea, the most male-oriented occupations are Firefighting & Prevention (88.7%), Security & Protection (87.8%), and Law Enforcement (86.1%), while the most female-oriented occupations are Healthcare Support (100.0%), Personal Care & Service (87.0%), and Food Preparation & Serving (56.3%).
| Occupation | Male | Female |
| Healthcare Support | 0 (0.0%) | 65 (100.0%) |
| Security & Protection | 258 (87.8%) | 36 (12.2%) |
| Firefighting & Prevention | 165 (88.7%) | 21 (11.3%) |
| Law Enforcement | 93 (86.1%) | 15 (13.9%) |
| Food Preparation & Serving | 76 (43.7%) | 98 (56.3%) |
| Cleaning & Maintenance | 69 (58.0%) | 50 (42.0%) |
| Personal Care & Service | 13 (13.0%) | 87 (87.0%) |
| Total (Category) | 416 (55.3%) | 336 (44.7%) |
| Total (Overall) | 3,993 (55.7%) | 3,173 (44.3%) |
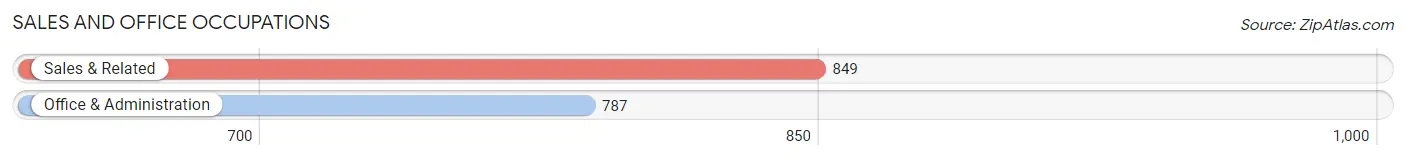
Sales and Office Occupations
The most common Sales and Office occupations in Chelsea are Sales & Related (849 | 11.8%), and Office & Administration (787 | 11.0%).
Sales and Office Occupations by Sex
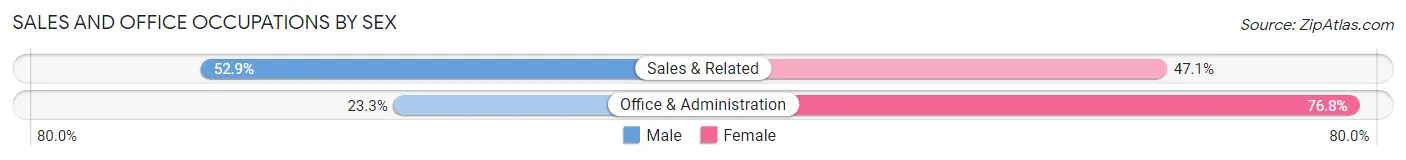
| Occupation | Male | Female |
| Sales & Related | 449 (52.9%) | 400 (47.1%) |
| Office & Administration | 183 (23.3%) | 604 (76.7%) |
| Total (Category) | 632 (38.6%) | 1,004 (61.4%) |
| Total (Overall) | 3,993 (55.7%) | 3,173 (44.3%) |
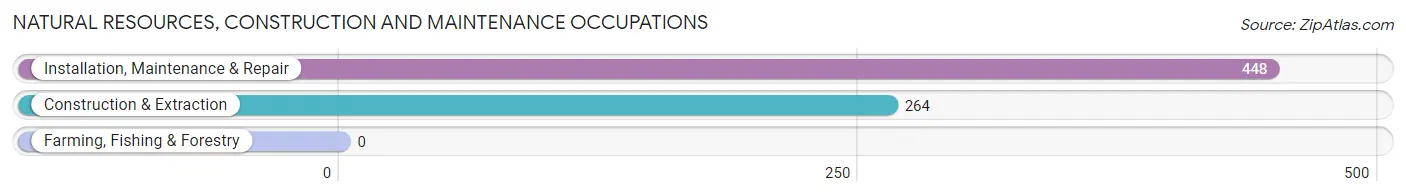
Natural Resources, Construction and Maintenance Occupations
The most common Natural Resources, Construction and Maintenance occupations in Chelsea are Installation, Maintenance & Repair (448 | 6.2%), and Construction & Extraction (264 | 3.7%).
Natural Resources, Construction and Maintenance Occupations by Sex
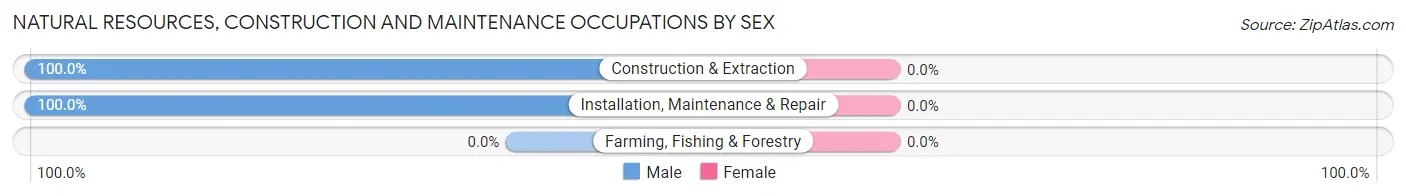
| Occupation | Male | Female |
| Farming, Fishing & Forestry | 0 (0.0%) | 0 (0.0%) |
| Construction & Extraction | 264 (100.0%) | 0 (0.0%) |
| Installation, Maintenance & Repair | 448 (100.0%) | 0 (0.0%) |
| Total (Category) | 712 (100.0%) | 0 (0.0%) |
| Total (Overall) | 3,993 (55.7%) | 3,173 (44.3%) |
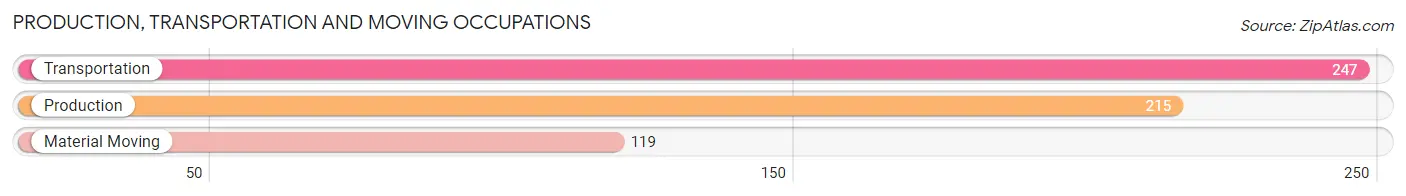
Production, Transportation and Moving Occupations
The most common Production, Transportation and Moving occupations in Chelsea are Transportation (247 | 3.5%), Production (215 | 3.0%), and Material Moving (119 | 1.7%).
Production, Transportation and Moving Occupations by Sex
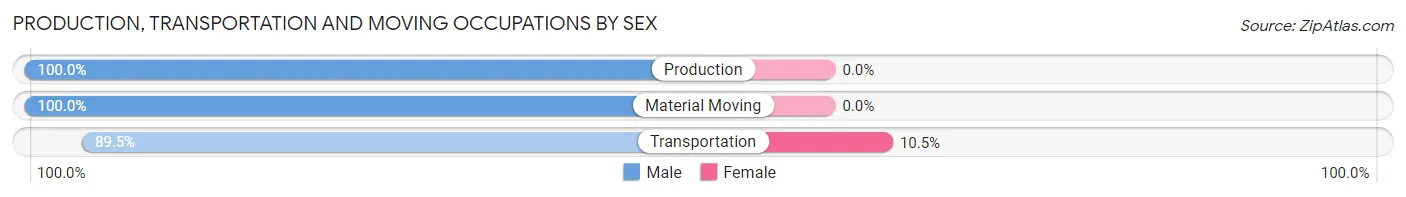
| Occupation | Male | Female |
| Production | 215 (100.0%) | 0 (0.0%) |
| Transportation | 221 (89.5%) | 26 (10.5%) |
| Material Moving | 119 (100.0%) | 0 (0.0%) |
| Total (Category) | 555 (95.5%) | 26 (4.5%) |
| Total (Overall) | 3,993 (55.7%) | 3,173 (44.3%) |
Employment Industries by Sex in Chelsea
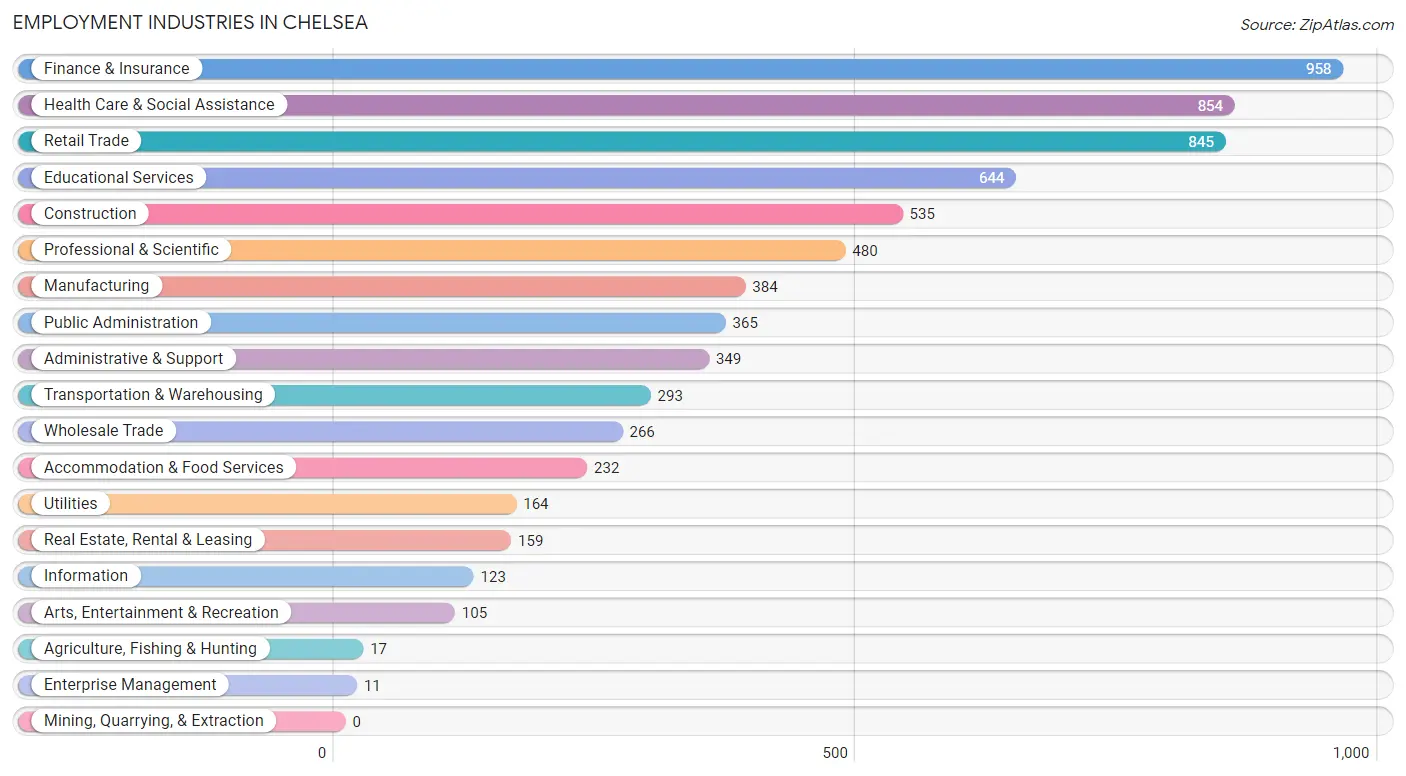
Employment Industries in Chelsea
The major employment industries in Chelsea include Finance & Insurance (958 | 13.4%), Health Care & Social Assistance (854 | 11.9%), Retail Trade (845 | 11.8%), Educational Services (644 | 9.0%), and Construction (535 | 7.5%).
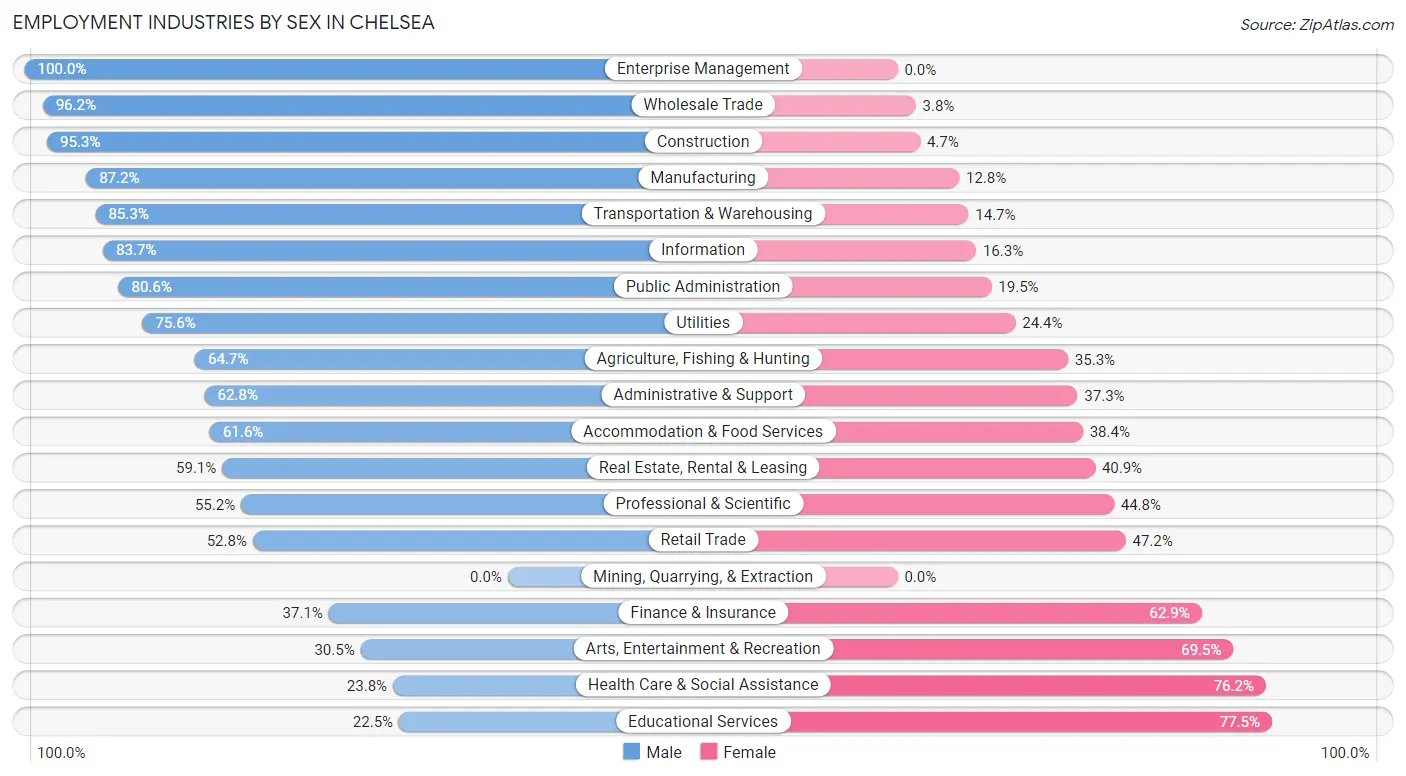
Employment Industries by Sex in Chelsea
The Chelsea industries that see more men than women are Enterprise Management (100.0%), Wholesale Trade (96.2%), and Construction (95.3%), whereas the industries that tend to have a higher number of women are Educational Services (77.5%), Health Care & Social Assistance (76.2%), and Arts, Entertainment & Recreation (69.5%).
| Industry | Male | Female |
| Agriculture, Fishing & Hunting | 11 (64.7%) | 6 (35.3%) |
| Mining, Quarrying, & Extraction | 0 (0.0%) | 0 (0.0%) |
| Construction | 510 (95.3%) | 25 (4.7%) |
| Manufacturing | 335 (87.2%) | 49 (12.8%) |
| Wholesale Trade | 256 (96.2%) | 10 (3.8%) |
| Retail Trade | 446 (52.8%) | 399 (47.2%) |
| Transportation & Warehousing | 250 (85.3%) | 43 (14.7%) |
| Utilities | 124 (75.6%) | 40 (24.4%) |
| Information | 103 (83.7%) | 20 (16.3%) |
| Finance & Insurance | 355 (37.1%) | 603 (62.9%) |
| Real Estate, Rental & Leasing | 94 (59.1%) | 65 (40.9%) |
| Professional & Scientific | 265 (55.2%) | 215 (44.8%) |
| Enterprise Management | 11 (100.0%) | 0 (0.0%) |
| Administrative & Support | 219 (62.7%) | 130 (37.2%) |
| Educational Services | 145 (22.5%) | 499 (77.5%) |
| Health Care & Social Assistance | 203 (23.8%) | 651 (76.2%) |
| Arts, Entertainment & Recreation | 32 (30.5%) | 73 (69.5%) |
| Accommodation & Food Services | 143 (61.6%) | 89 (38.4%) |
| Public Administration | 294 (80.5%) | 71 (19.5%) |
| Total | 3,993 (55.7%) | 3,173 (44.3%) |
Education in Chelsea
School Enrollment in Chelsea
The most common levels of schooling among the 4,308 students in Chelsea are elementary school (1,289 | 29.9%), middle school (1,108 | 25.7%), and high school (844 | 19.6%).
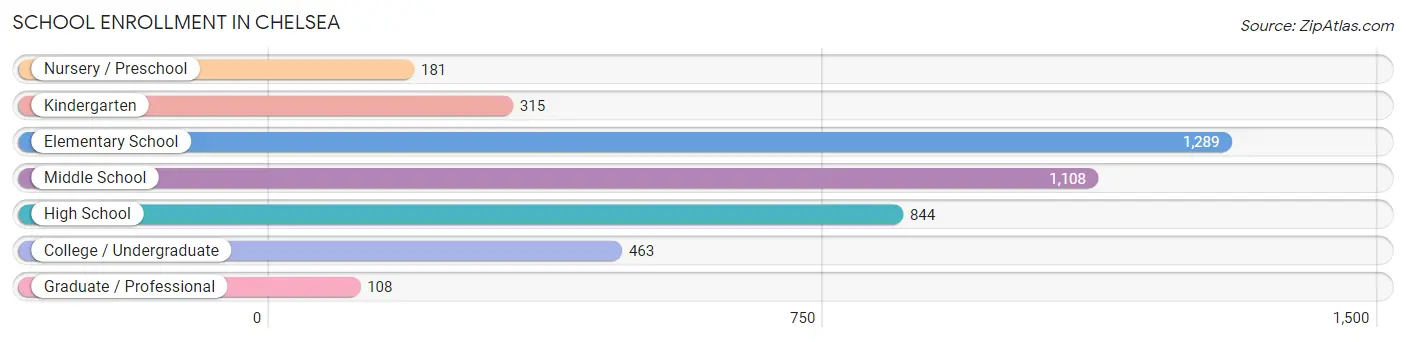
| School Level | # Students | % Students |
| Nursery / Preschool | 181 | 4.2% |
| Kindergarten | 315 | 7.3% |
| Elementary School | 1,289 | 29.9% |
| Middle School | 1,108 | 25.7% |
| High School | 844 | 19.6% |
| College / Undergraduate | 463 | 10.7% |
| Graduate / Professional | 108 | 2.5% |
| Total | 4,308 | 100.0% |
School Enrollment by Age by Funding Source in Chelsea
Out of a total of 4,308 students who are enrolled in schools in Chelsea, 922 (21.4%) attend a private institution, while the remaining 3,386 (78.6%) are enrolled in public schools. The age group of 3 to 4 year olds has the highest likelihood of being enrolled in private schools, with 168 (78.1% in the age bracket) enrolled. Conversely, the age group of 15 to 17 year olds has the lowest likelihood of being enrolled in a private school, with 616 (96.0% in the age bracket) attending a public institution.
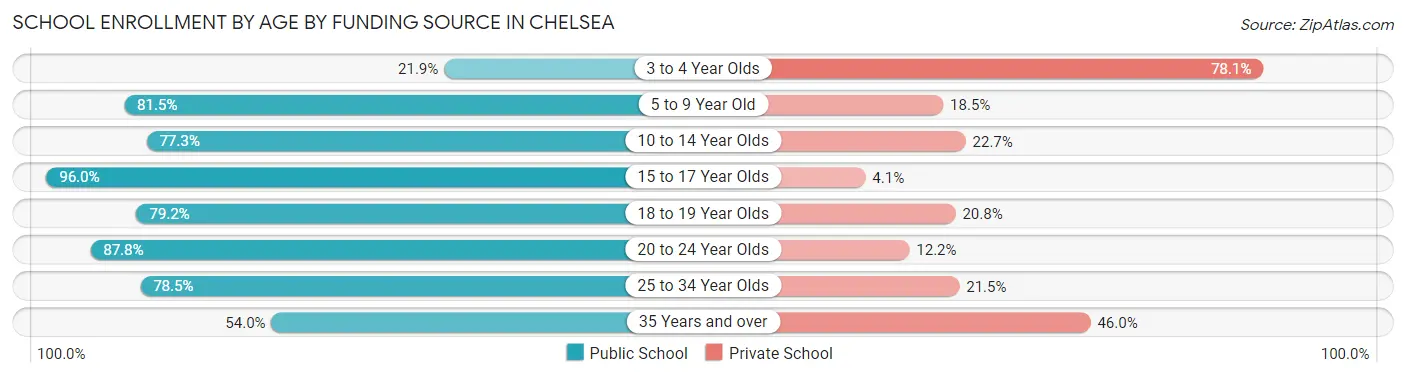
| Age Bracket | Public School | Private School |
| 3 to 4 Year Olds | 47 (21.9%) | 168 (78.1%) |
| 5 to 9 Year Old | 1,108 (81.5%) | 252 (18.5%) |
| 10 to 14 Year Olds | 1,106 (77.3%) | 325 (22.7%) |
| 15 to 17 Year Olds | 616 (96.0%) | 26 (4.1%) |
| 18 to 19 Year Olds | 76 (79.2%) | 20 (20.8%) |
| 20 to 24 Year Olds | 215 (87.8%) | 30 (12.2%) |
| 25 to 34 Year Olds | 153 (78.5%) | 42 (21.5%) |
| 35 Years and over | 67 (54.0%) | 57 (46.0%) |
| Total | 3,386 (78.6%) | 922 (21.4%) |
Educational Attainment by Field of Study in Chelsea
Business (1,327 | 26.8%), education (608 | 12.3%), engineering (409 | 8.3%), computers & mathematics (393 | 7.9%), and science & technology (391 | 7.9%) are the most common fields of study among 4,956 individuals in Chelsea who have obtained a bachelor's degree or higher.
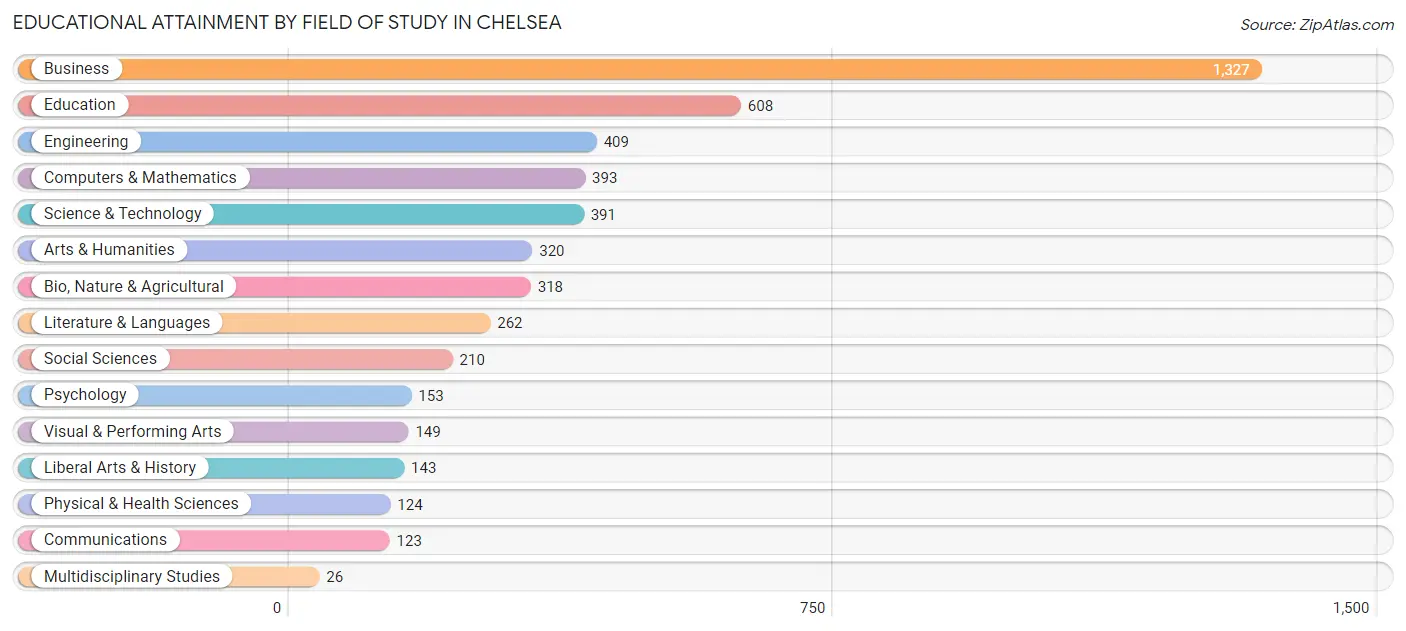
| Field of Study | # Graduates | % Graduates |
| Computers & Mathematics | 393 | 7.9% |
| Bio, Nature & Agricultural | 318 | 6.4% |
| Physical & Health Sciences | 124 | 2.5% |
| Psychology | 153 | 3.1% |
| Social Sciences | 210 | 4.2% |
| Engineering | 409 | 8.3% |
| Multidisciplinary Studies | 26 | 0.5% |
| Science & Technology | 391 | 7.9% |
| Business | 1,327 | 26.8% |
| Education | 608 | 12.3% |
| Literature & Languages | 262 | 5.3% |
| Liberal Arts & History | 143 | 2.9% |
| Visual & Performing Arts | 149 | 3.0% |
| Communications | 123 | 2.5% |
| Arts & Humanities | 320 | 6.5% |
| Total | 4,956 | 100.0% |
Transportation & Commute in Chelsea
Vehicle Availability by Sex in Chelsea
The most prevalent vehicle ownership categories in Chelsea are males with 2 vehicles (1,866, accounting for 46.9%) and females with 2 vehicles (1,450, making up 59.0%).
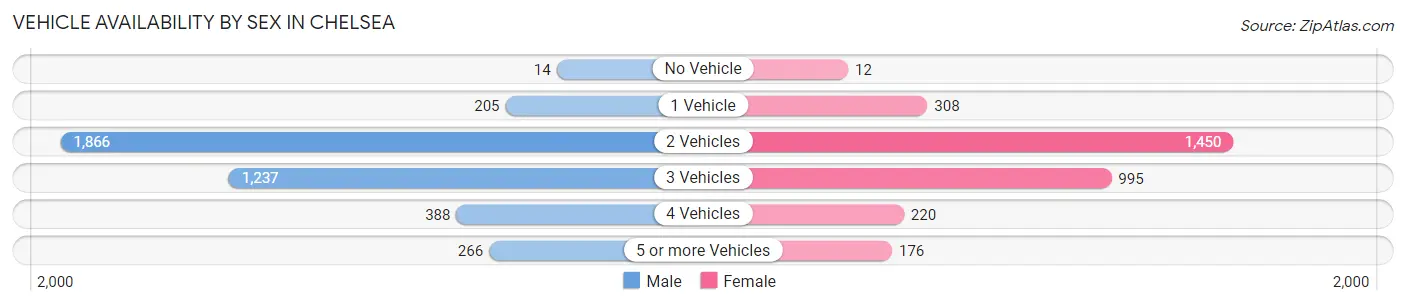
| Vehicles Available | Male | Female |
| No Vehicle | 14 (0.4%) | 12 (0.4%) |
| 1 Vehicle | 205 (5.2%) | 308 (9.7%) |
| 2 Vehicles | 1,866 (46.9%) | 1,450 (45.9%) |
| 3 Vehicles | 1,237 (31.1%) | 995 (31.5%) |
| 4 Vehicles | 388 (9.8%) | 220 (7.0%) |
| 5 or more Vehicles | 266 (6.7%) | 176 (5.6%) |
| Total | 3,976 (100.0%) | 3,161 (100.0%) |
Commute Time in Chelsea
The most frequently occuring commute durations in Chelsea are 30 to 34 minutes (1,337 commuters, 21.0%), 45 to 59 minutes (1,155 commuters, 18.2%), and 40 to 44 minutes (740 commuters, 11.6%).
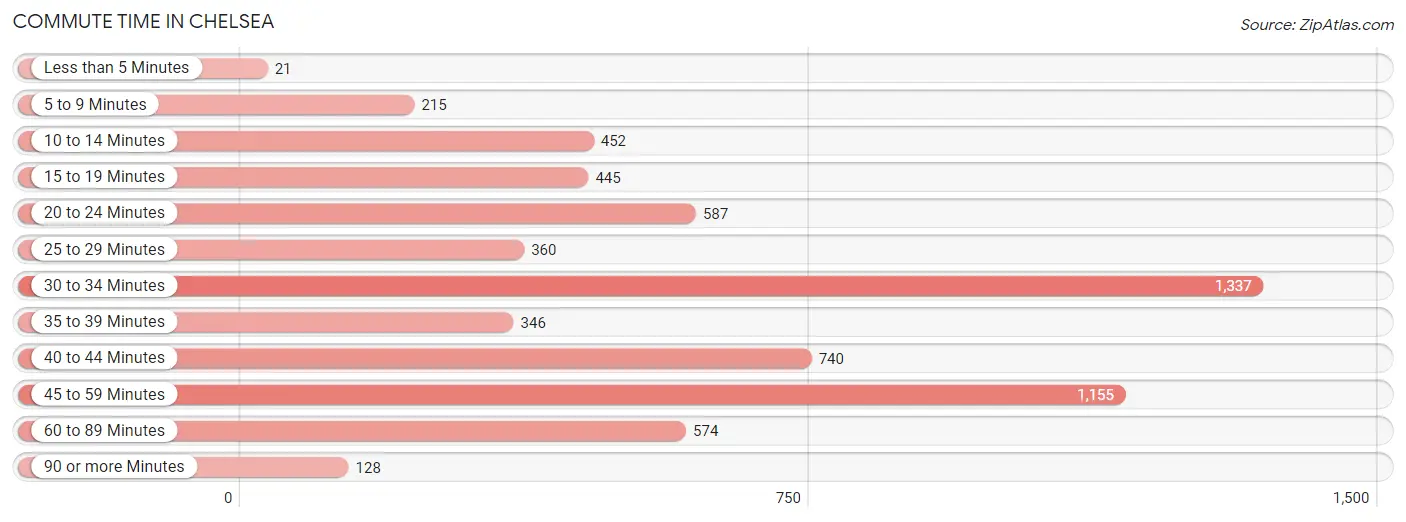
| Commute Time | # Commuters | % Commuters |
| Less than 5 Minutes | 21 | 0.3% |
| 5 to 9 Minutes | 215 | 3.4% |
| 10 to 14 Minutes | 452 | 7.1% |
| 15 to 19 Minutes | 445 | 7.0% |
| 20 to 24 Minutes | 587 | 9.2% |
| 25 to 29 Minutes | 360 | 5.7% |
| 30 to 34 Minutes | 1,337 | 21.0% |
| 35 to 39 Minutes | 346 | 5.4% |
| 40 to 44 Minutes | 740 | 11.6% |
| 45 to 59 Minutes | 1,155 | 18.2% |
| 60 to 89 Minutes | 574 | 9.0% |
| 90 or more Minutes | 128 | 2.0% |
Commute Time by Sex in Chelsea
The most common commute times in Chelsea are 45 to 59 minutes (795 commuters, 21.1%) for males and 30 to 34 minutes (715 commuters, 27.6%) for females.
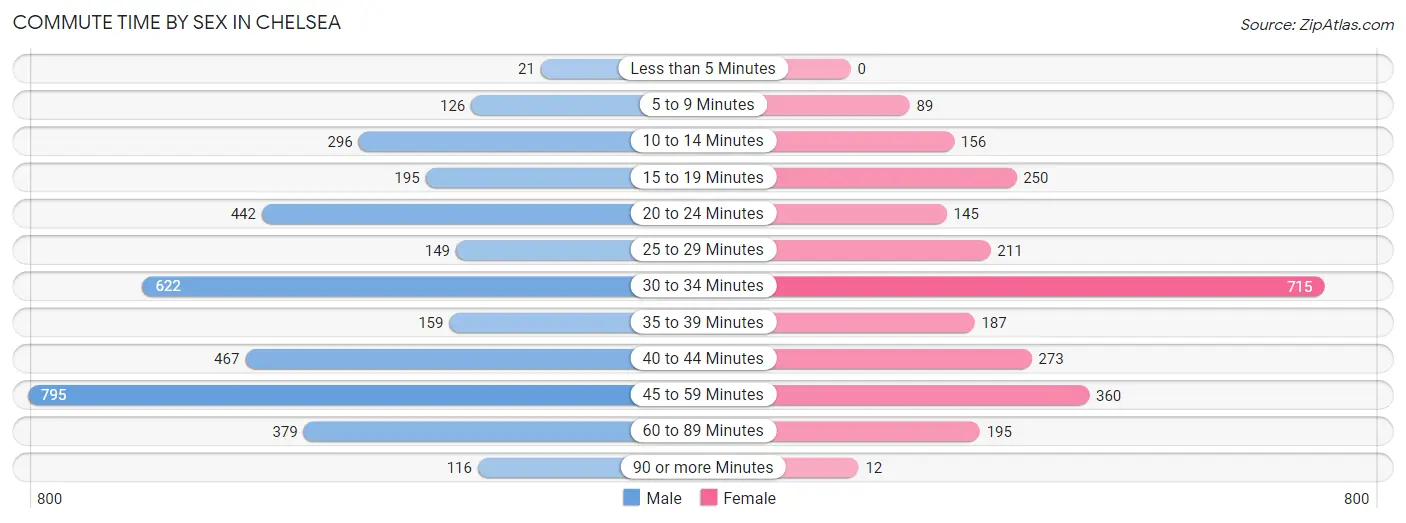
| Commute Time | Male | Female |
| Less than 5 Minutes | 21 (0.6%) | 0 (0.0%) |
| 5 to 9 Minutes | 126 (3.3%) | 89 (3.4%) |
| 10 to 14 Minutes | 296 (7.9%) | 156 (6.0%) |
| 15 to 19 Minutes | 195 (5.2%) | 250 (9.6%) |
| 20 to 24 Minutes | 442 (11.7%) | 145 (5.6%) |
| 25 to 29 Minutes | 149 (4.0%) | 211 (8.1%) |
| 30 to 34 Minutes | 622 (16.5%) | 715 (27.6%) |
| 35 to 39 Minutes | 159 (4.2%) | 187 (7.2%) |
| 40 to 44 Minutes | 467 (12.4%) | 273 (10.5%) |
| 45 to 59 Minutes | 795 (21.1%) | 360 (13.9%) |
| 60 to 89 Minutes | 379 (10.1%) | 195 (7.5%) |
| 90 or more Minutes | 116 (3.1%) | 12 (0.5%) |
Time of Departure to Work by Sex in Chelsea
The most frequent times of departure to work in Chelsea are 6:00 AM to 6:29 AM (630, 16.7%) for males and 7:00 AM to 7:29 AM (621, 23.9%) for females.
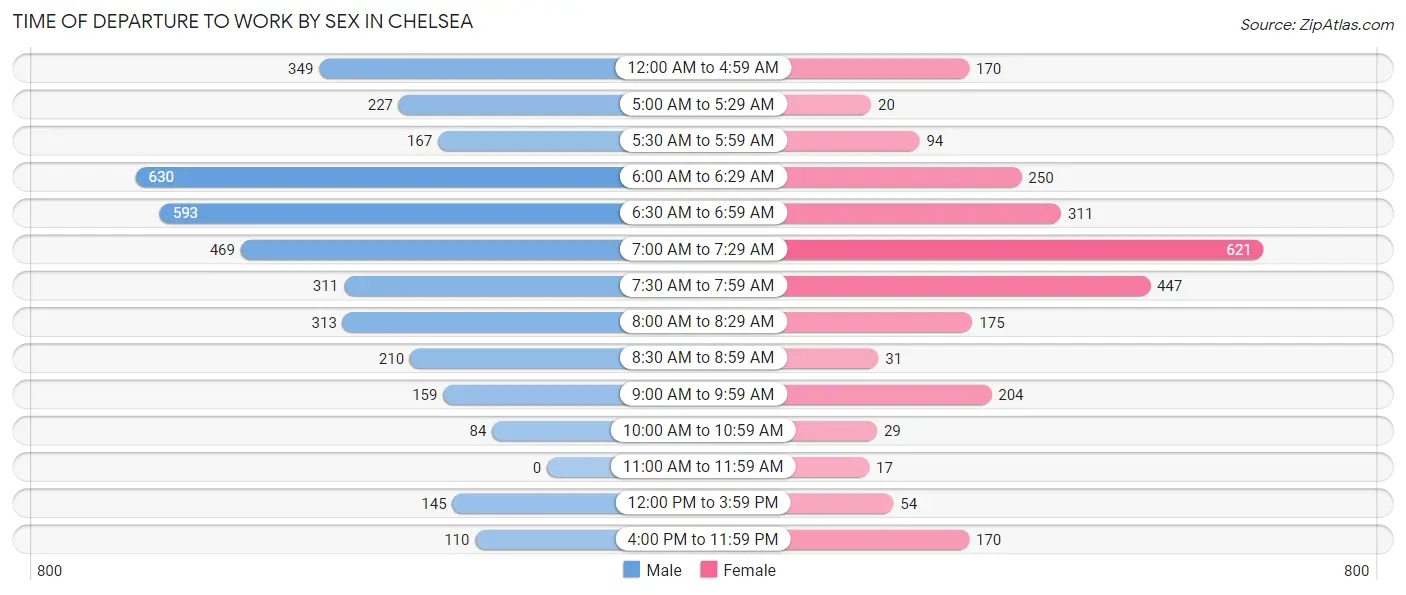
| Time of Departure | Male | Female |
| 12:00 AM to 4:59 AM | 349 (9.3%) | 170 (6.6%) |
| 5:00 AM to 5:29 AM | 227 (6.0%) | 20 (0.8%) |
| 5:30 AM to 5:59 AM | 167 (4.4%) | 94 (3.6%) |
| 6:00 AM to 6:29 AM | 630 (16.7%) | 250 (9.6%) |
| 6:30 AM to 6:59 AM | 593 (15.7%) | 311 (12.0%) |
| 7:00 AM to 7:29 AM | 469 (12.4%) | 621 (23.9%) |
| 7:30 AM to 7:59 AM | 311 (8.3%) | 447 (17.2%) |
| 8:00 AM to 8:29 AM | 313 (8.3%) | 175 (6.8%) |
| 8:30 AM to 8:59 AM | 210 (5.6%) | 31 (1.2%) |
| 9:00 AM to 9:59 AM | 159 (4.2%) | 204 (7.9%) |
| 10:00 AM to 10:59 AM | 84 (2.2%) | 29 (1.1%) |
| 11:00 AM to 11:59 AM | 0 (0.0%) | 17 (0.7%) |
| 12:00 PM to 3:59 PM | 145 (3.8%) | 54 (2.1%) |
| 4:00 PM to 11:59 PM | 110 (2.9%) | 170 (6.6%) |
| Total | 3,767 (100.0%) | 2,593 (100.0%) |
Housing Occupancy in Chelsea
Occupancy by Ownership in Chelsea
Of the total 5,209 dwellings in Chelsea, owner-occupied units account for 4,648 (89.2%), while renter-occupied units make up 561 (10.8%).
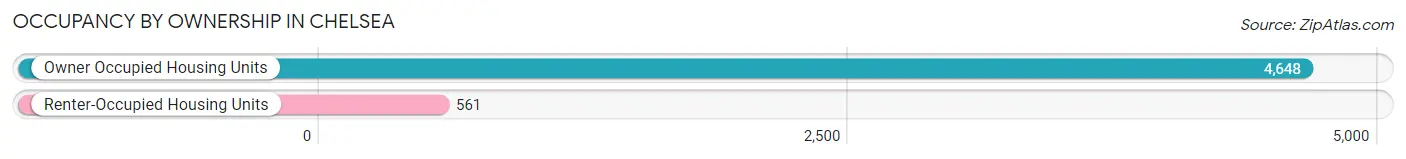
| Occupancy | # Housing Units | % Housing Units |
| Owner Occupied Housing Units | 4,648 | 89.2% |
| Renter-Occupied Housing Units | 561 | 10.8% |
| Total Occupied Housing Units | 5,209 | 100.0% |
Occupancy by Household Size in Chelsea
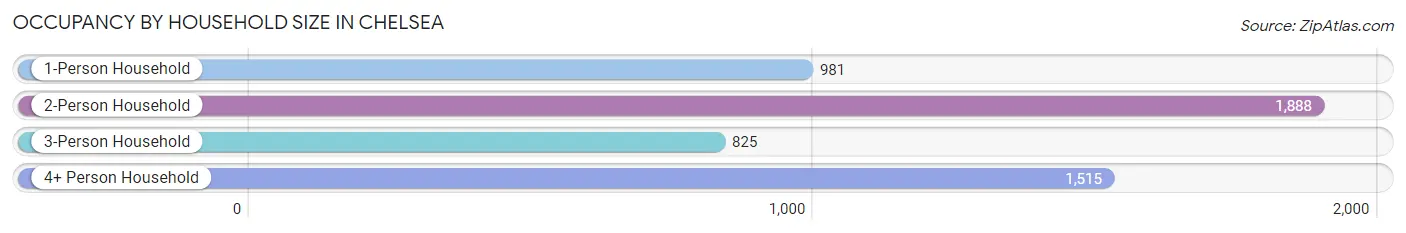
| Household Size | # Housing Units | % Housing Units |
| 1-Person Household | 981 | 18.8% |
| 2-Person Household | 1,888 | 36.2% |
| 3-Person Household | 825 | 15.8% |
| 4+ Person Household | 1,515 | 29.1% |
| Total Housing Units | 5,209 | 100.0% |
Occupancy by Ownership by Household Size in Chelsea
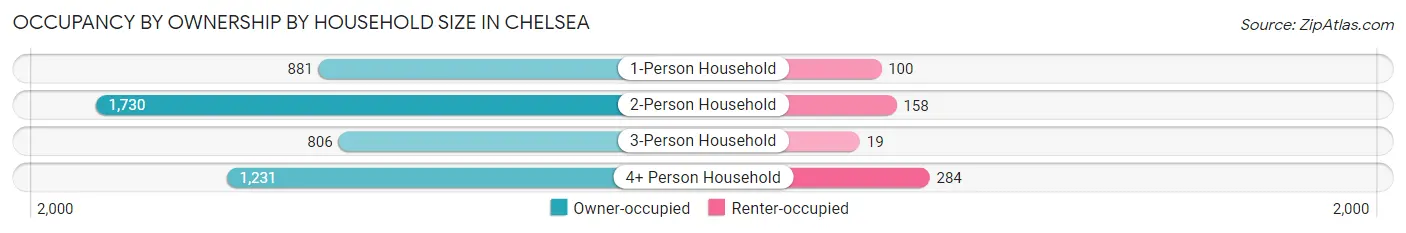
| Household Size | Owner-occupied | Renter-occupied |
| 1-Person Household | 881 (89.8%) | 100 (10.2%) |
| 2-Person Household | 1,730 (91.6%) | 158 (8.4%) |
| 3-Person Household | 806 (97.7%) | 19 (2.3%) |
| 4+ Person Household | 1,231 (81.2%) | 284 (18.8%) |
| Total Housing Units | 4,648 (89.2%) | 561 (10.8%) |
Occupancy by Educational Attainment in Chelsea
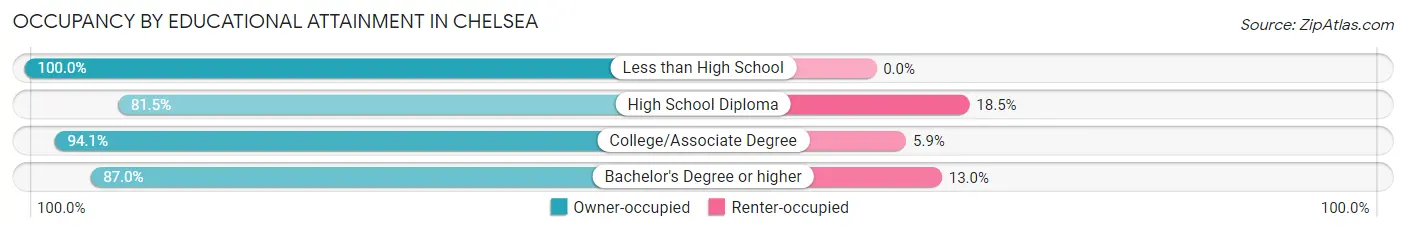
| Household Size | Owner-occupied | Renter-occupied |
| Less than High School | 132 (100.0%) | 0 (0.0%) |
| High School Diploma | 432 (81.5%) | 98 (18.5%) |
| College/Associate Degree | 1,710 (94.1%) | 108 (5.9%) |
| Bachelor's Degree or higher | 2,374 (87.0%) | 355 (13.0%) |
Occupancy by Age of Householder in Chelsea
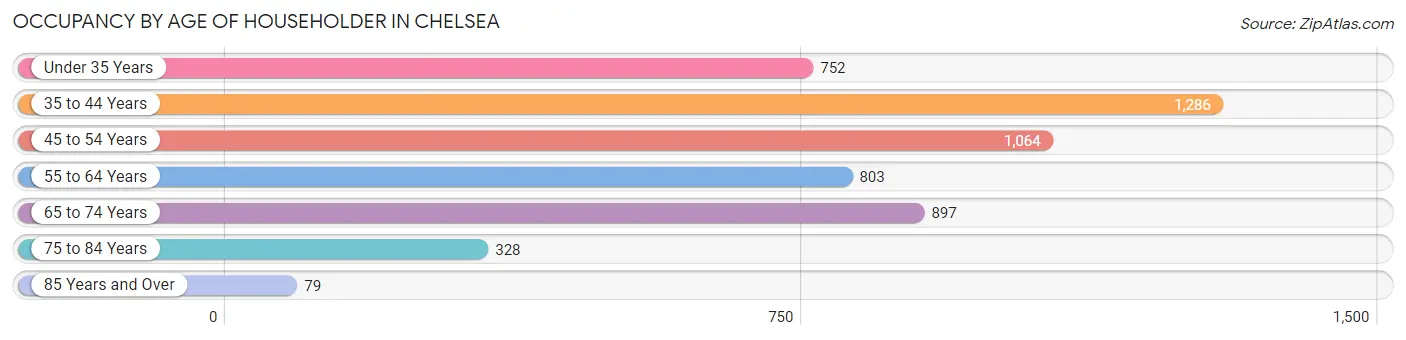
| Age Bracket | # Households | % Households |
| Under 35 Years | 752 | 14.4% |
| 35 to 44 Years | 1,286 | 24.7% |
| 45 to 54 Years | 1,064 | 20.4% |
| 55 to 64 Years | 803 | 15.4% |
| 65 to 74 Years | 897 | 17.2% |
| 75 to 84 Years | 328 | 6.3% |
| 85 Years and Over | 79 | 1.5% |
| Total | 5,209 | 100.0% |
Housing Finances in Chelsea
Median Income by Occupancy in Chelsea
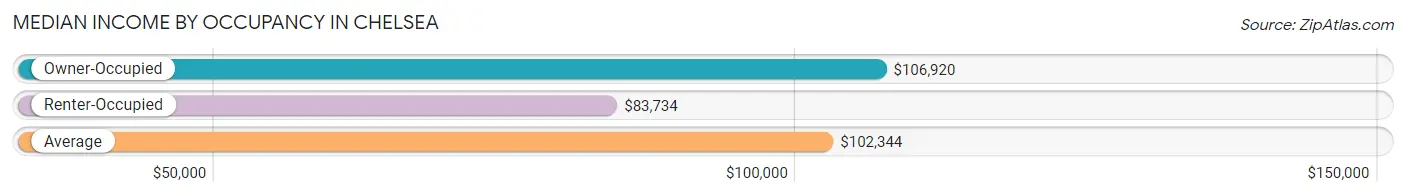
| Occupancy Type | # Households | Median Income |
| Owner-Occupied | 4,648 (89.2%) | $106,920 |
| Renter-Occupied | 561 (10.8%) | $83,734 |
| Average | 5,209 (100.0%) | $102,344 |
Occupancy by Householder Income Bracket in Chelsea
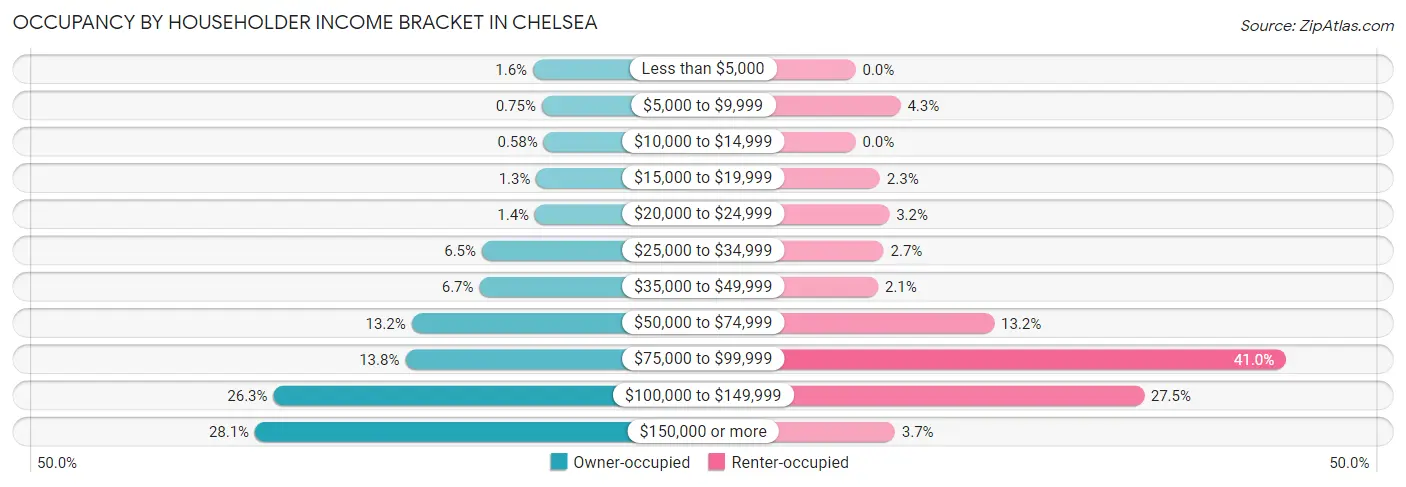
| Income Bracket | Owner-occupied | Renter-occupied |
| Less than $5,000 | 74 (1.6%) | 0 (0.0%) |
| $5,000 to $9,999 | 35 (0.7%) | 24 (4.3%) |
| $10,000 to $14,999 | 27 (0.6%) | 0 (0.0%) |
| $15,000 to $19,999 | 59 (1.3%) | 13 (2.3%) |
| $20,000 to $24,999 | 65 (1.4%) | 18 (3.2%) |
| $25,000 to $34,999 | 300 (6.5%) | 15 (2.7%) |
| $35,000 to $49,999 | 311 (6.7%) | 12 (2.1%) |
| $50,000 to $74,999 | 611 (13.2%) | 74 (13.2%) |
| $75,000 to $99,999 | 639 (13.8%) | 230 (41.0%) |
| $100,000 to $149,999 | 1,223 (26.3%) | 154 (27.5%) |
| $150,000 or more | 1,304 (28.1%) | 21 (3.7%) |
| Total | 4,648 (100.0%) | 561 (100.0%) |
Monthly Housing Cost Tiers in Chelsea
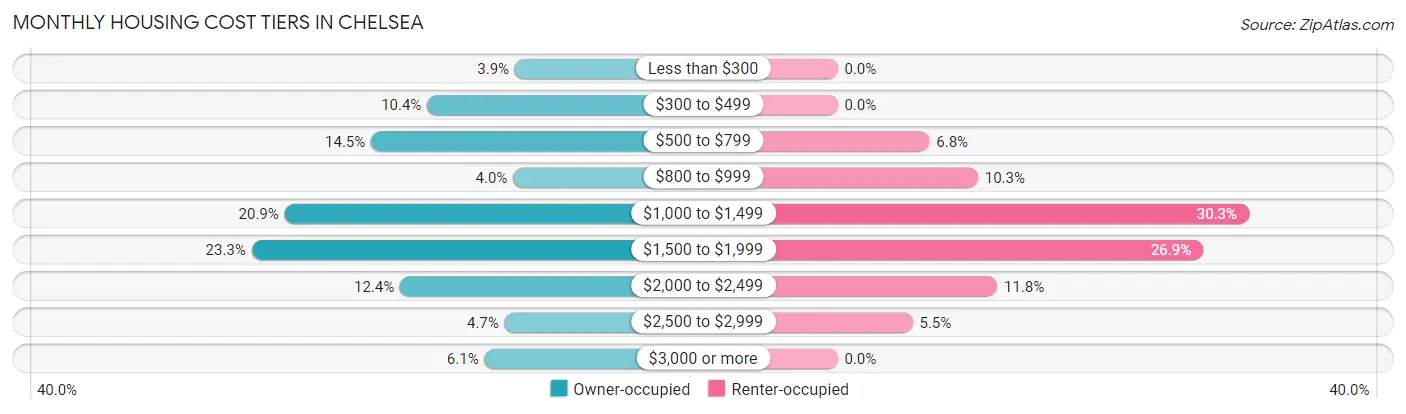
| Monthly Cost | Owner-occupied | Renter-occupied |
| Less than $300 | 181 (3.9%) | 0 (0.0%) |
| $300 to $499 | 481 (10.3%) | 0 (0.0%) |
| $500 to $799 | 673 (14.5%) | 38 (6.8%) |
| $800 to $999 | 187 (4.0%) | 58 (10.3%) |
| $1,000 to $1,499 | 969 (20.8%) | 170 (30.3%) |
| $1,500 to $1,999 | 1,082 (23.3%) | 151 (26.9%) |
| $2,000 to $2,499 | 574 (12.3%) | 66 (11.8%) |
| $2,500 to $2,999 | 216 (4.6%) | 31 (5.5%) |
| $3,000 or more | 285 (6.1%) | 0 (0.0%) |
| Total | 4,648 (100.0%) | 561 (100.0%) |
Physical Housing Characteristics in Chelsea
Housing Structures in Chelsea
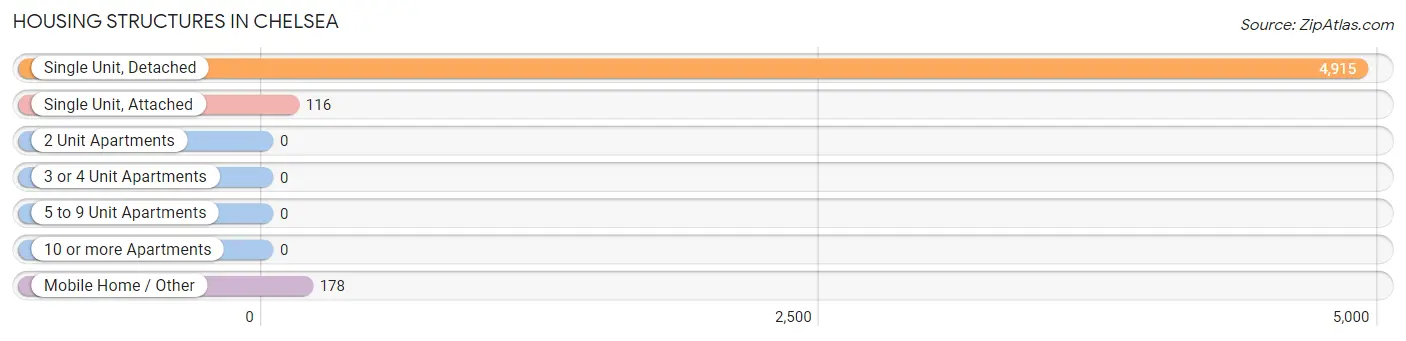
| Structure Type | # Housing Units | % Housing Units |
| Single Unit, Detached | 4,915 | 94.4% |
| Single Unit, Attached | 116 | 2.2% |
| 2 Unit Apartments | 0 | 0.0% |
| 3 or 4 Unit Apartments | 0 | 0.0% |
| 5 to 9 Unit Apartments | 0 | 0.0% |
| 10 or more Apartments | 0 | 0.0% |
| Mobile Home / Other | 178 | 3.4% |
| Total | 5,209 | 100.0% |
Housing Structures by Occupancy in Chelsea
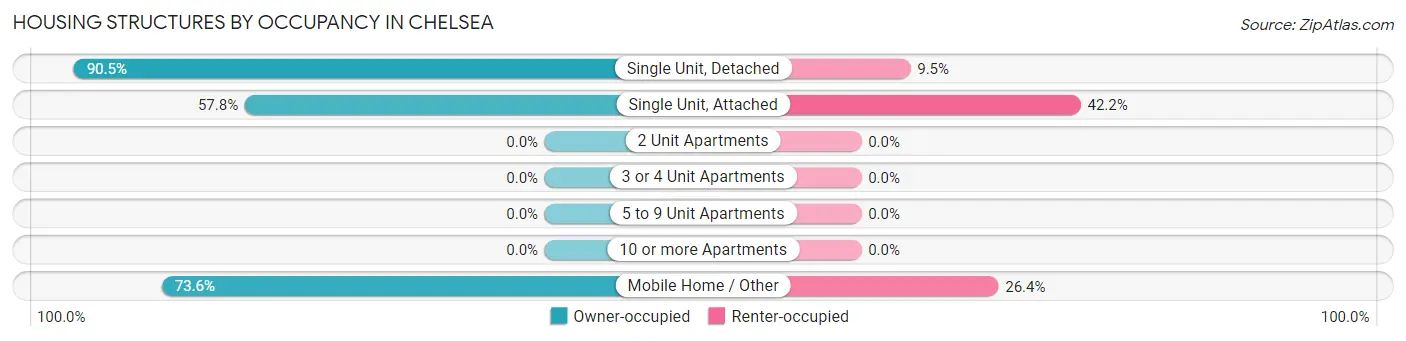
| Structure Type | Owner-occupied | Renter-occupied |
| Single Unit, Detached | 4,450 (90.5%) | 465 (9.5%) |
| Single Unit, Attached | 67 (57.8%) | 49 (42.2%) |
| 2 Unit Apartments | 0 (0.0%) | 0 (0.0%) |
| 3 or 4 Unit Apartments | 0 (0.0%) | 0 (0.0%) |
| 5 to 9 Unit Apartments | 0 (0.0%) | 0 (0.0%) |
| 10 or more Apartments | 0 (0.0%) | 0 (0.0%) |
| Mobile Home / Other | 131 (73.6%) | 47 (26.4%) |
| Total | 4,648 (89.2%) | 561 (10.8%) |
Housing Structures by Number of Rooms in Chelsea
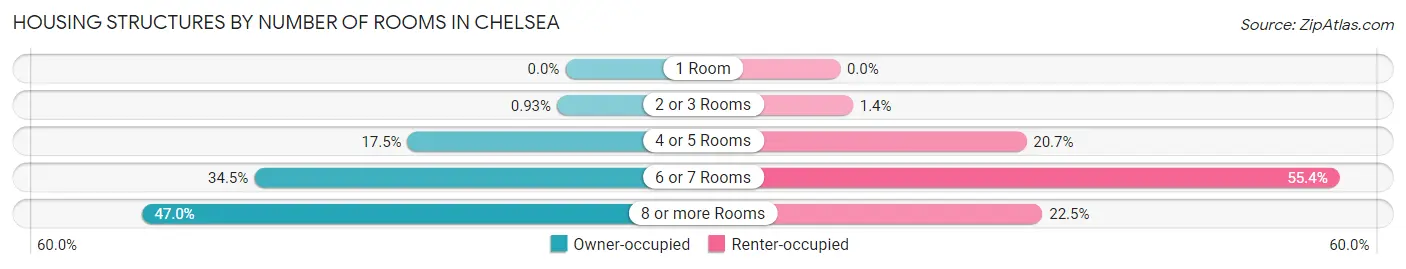
| Number of Rooms | Owner-occupied | Renter-occupied |
| 1 Room | 0 (0.0%) | 0 (0.0%) |
| 2 or 3 Rooms | 43 (0.9%) | 8 (1.4%) |
| 4 or 5 Rooms | 814 (17.5%) | 116 (20.7%) |
| 6 or 7 Rooms | 1,605 (34.5%) | 311 (55.4%) |
| 8 or more Rooms | 2,186 (47.0%) | 126 (22.5%) |
| Total | 4,648 (100.0%) | 561 (100.0%) |
Housing Structure by Heating Type in Chelsea
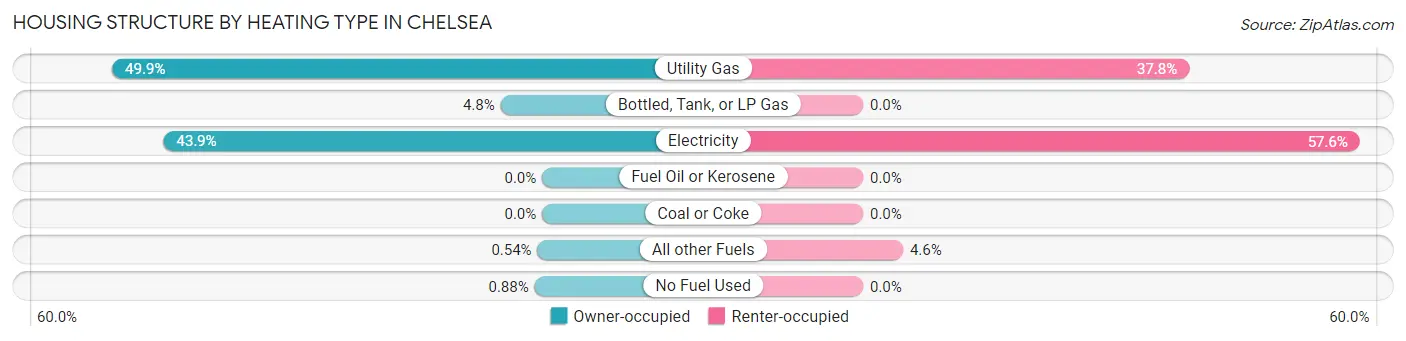
| Heating Type | Owner-occupied | Renter-occupied |
| Utility Gas | 2,317 (49.8%) | 212 (37.8%) |
| Bottled, Tank, or LP Gas | 224 (4.8%) | 0 (0.0%) |
| Electricity | 2,041 (43.9%) | 323 (57.6%) |
| Fuel Oil or Kerosene | 0 (0.0%) | 0 (0.0%) |
| Coal or Coke | 0 (0.0%) | 0 (0.0%) |
| All other Fuels | 25 (0.5%) | 26 (4.6%) |
| No Fuel Used | 41 (0.9%) | 0 (0.0%) |
| Total | 4,648 (100.0%) | 561 (100.0%) |
Household Vehicle Usage in Chelsea
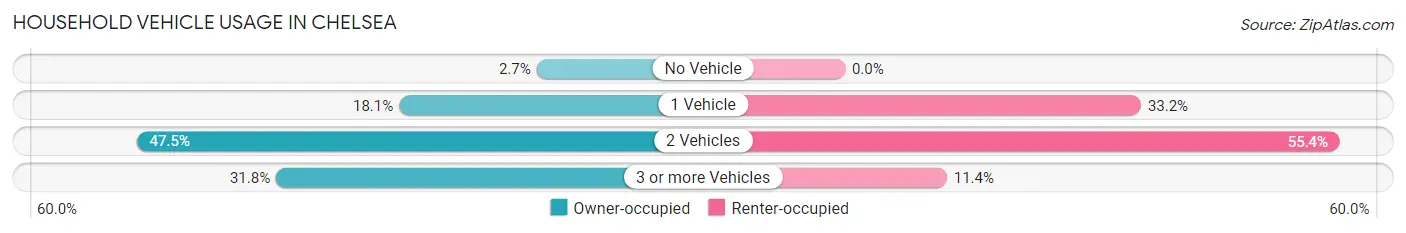
| Vehicles per Household | Owner-occupied | Renter-occupied |
| No Vehicle | 123 (2.6%) | 0 (0.0%) |
| 1 Vehicle | 839 (18.0%) | 186 (33.2%) |
| 2 Vehicles | 2,206 (47.5%) | 311 (55.4%) |
| 3 or more Vehicles | 1,480 (31.8%) | 64 (11.4%) |
| Total | 4,648 (100.0%) | 561 (100.0%) |
Real Estate & Mortgages in Chelsea
Real Estate and Mortgage Overview in Chelsea
| Characteristic | Without Mortgage | With Mortgage |
| Housing Units | 1,358 | 3,290 |
| Median Property Value | $297,500 | $294,500 |
| Median Household Income | $76,563 | $1,047 |
| Monthly Housing Costs | $509 | $285 |
| Real Estate Taxes | $1,192 | $257 |
Property Value by Mortgage Status in Chelsea
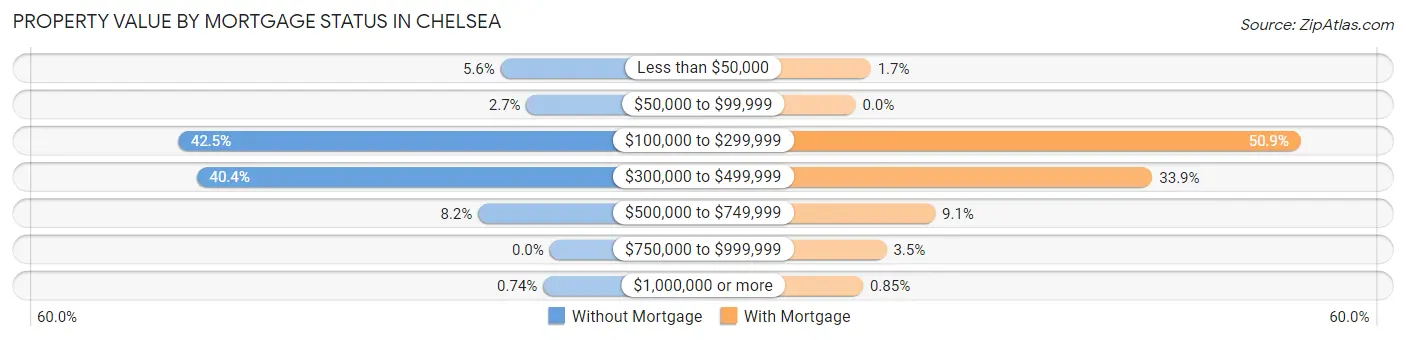
| Property Value | Without Mortgage | With Mortgage |
| Less than $50,000 | 76 (5.6%) | 57 (1.7%) |
| $50,000 to $99,999 | 36 (2.6%) | 0 (0.0%) |
| $100,000 to $299,999 | 577 (42.5%) | 1,674 (50.9%) |
| $300,000 to $499,999 | 548 (40.4%) | 1,116 (33.9%) |
| $500,000 to $749,999 | 111 (8.2%) | 299 (9.1%) |
| $750,000 to $999,999 | 0 (0.0%) | 116 (3.5%) |
| $1,000,000 or more | 10 (0.7%) | 28 (0.9%) |
| Total | 1,358 (100.0%) | 3,290 (100.0%) |
Household Income by Mortgage Status in Chelsea
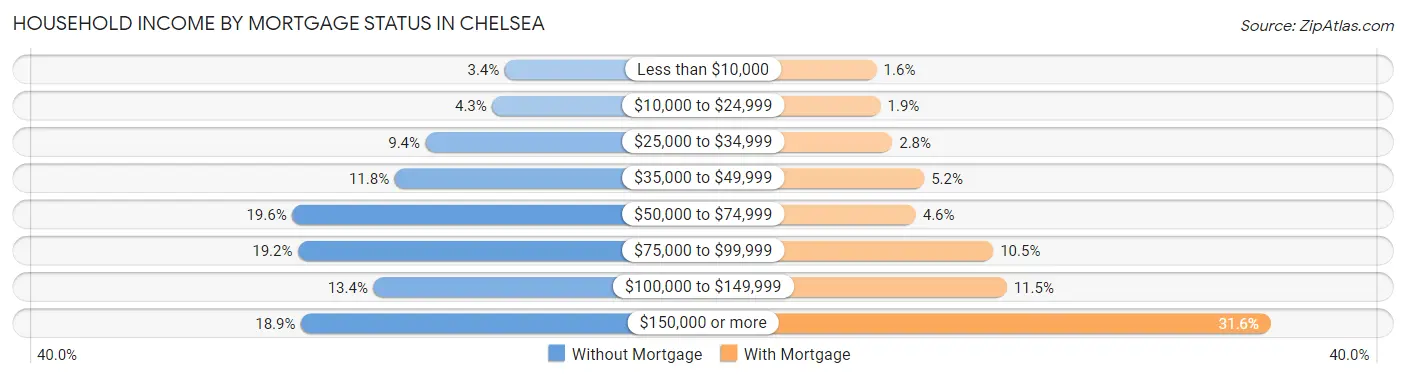
| Household Income | Without Mortgage | With Mortgage |
| Less than $10,000 | 46 (3.4%) | 53 (1.6%) |
| $10,000 to $24,999 | 59 (4.3%) | 63 (1.9%) |
| $25,000 to $34,999 | 128 (9.4%) | 92 (2.8%) |
| $35,000 to $49,999 | 160 (11.8%) | 172 (5.2%) |
| $50,000 to $74,999 | 266 (19.6%) | 151 (4.6%) |
| $75,000 to $99,999 | 260 (19.2%) | 345 (10.5%) |
| $100,000 to $149,999 | 182 (13.4%) | 379 (11.5%) |
| $150,000 or more | 257 (18.9%) | 1,041 (31.6%) |
| Total | 1,358 (100.0%) | 3,290 (100.0%) |
Property Value to Household Income Ratio in Chelsea
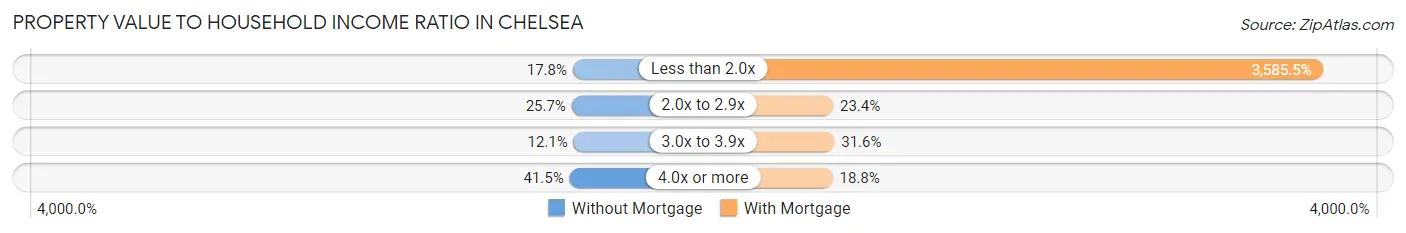
| Value-to-Income Ratio | Without Mortgage | With Mortgage |
| Less than 2.0x | 241 (17.7%) | 117,964 (3,585.5%) |
| 2.0x to 2.9x | 349 (25.7%) | 769 (23.4%) |
| 3.0x to 3.9x | 164 (12.1%) | 1,041 (31.6%) |
| 4.0x or more | 564 (41.5%) | 620 (18.8%) |
| Total | 1,358 (100.0%) | 3,290 (100.0%) |
Real Estate Taxes by Mortgage Status in Chelsea
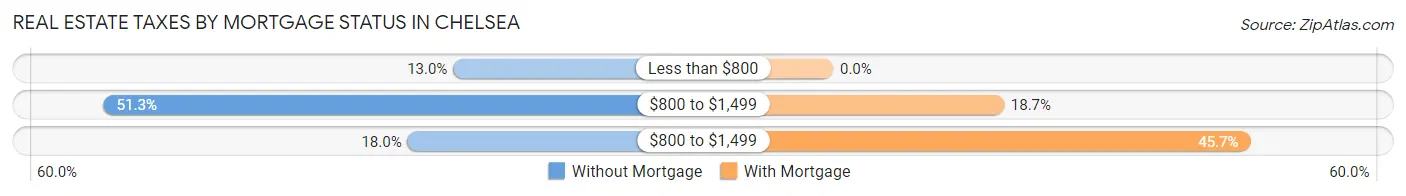
| Property Taxes | Without Mortgage | With Mortgage |
| Less than $800 | 177 (13.0%) | 0 (0.0%) |
| $800 to $1,499 | 697 (51.3%) | 616 (18.7%) |
| $800 to $1,499 | 245 (18.0%) | 1,505 (45.7%) |
| Total | 1,358 (100.0%) | 3,290 (100.0%) |
Health & Disability in Chelsea
Health Insurance Coverage by Age in Chelsea
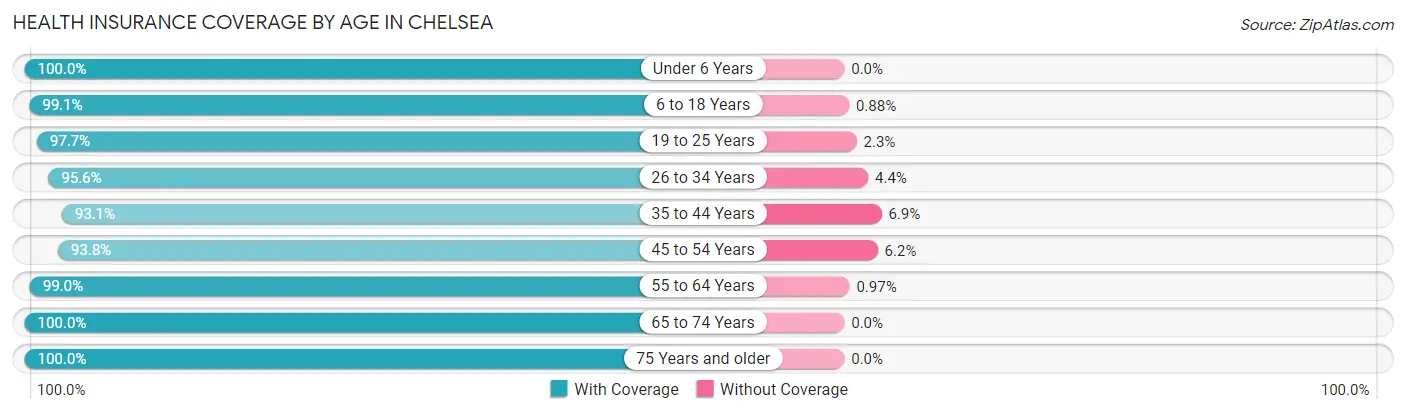
| Age Bracket | With Coverage | Without Coverage |
| Under 6 Years | 880 (100.0%) | 0 (0.0%) |
| 6 to 18 Years | 3,509 (99.1%) | 31 (0.9%) |
| 19 to 25 Years | 809 (97.7%) | 19 (2.3%) |
| 26 to 34 Years | 1,507 (95.6%) | 70 (4.4%) |
| 35 to 44 Years | 2,402 (93.1%) | 179 (6.9%) |
| 45 to 54 Years | 1,823 (93.8%) | 121 (6.2%) |
| 55 to 64 Years | 1,527 (99.0%) | 15 (1.0%) |
| 65 to 74 Years | 1,558 (100.0%) | 0 (0.0%) |
| 75 Years and older | 676 (100.0%) | 0 (0.0%) |
| Total | 14,691 (97.1%) | 435 (2.9%) |
Health Insurance Coverage by Citizenship Status in Chelsea
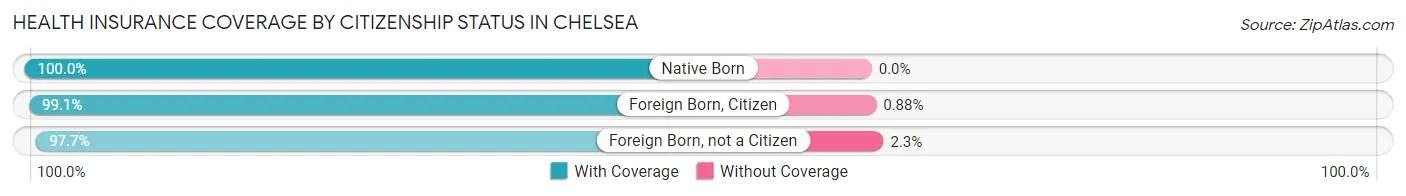
| Citizenship Status | With Coverage | Without Coverage |
| Native Born | 880 (100.0%) | 0 (0.0%) |
| Foreign Born, Citizen | 3,509 (99.1%) | 31 (0.9%) |
| Foreign Born, not a Citizen | 809 (97.7%) | 19 (2.3%) |
Health Insurance Coverage by Household Income in Chelsea
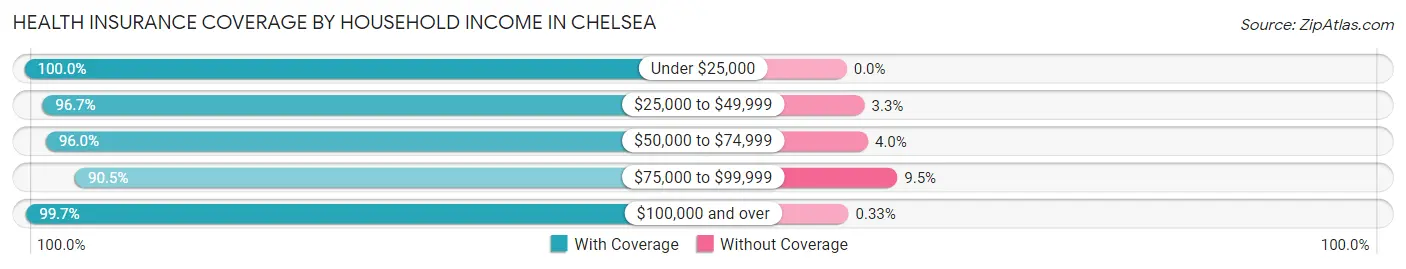
| Household Income | With Coverage | Without Coverage |
| Under $25,000 | 427 (100.0%) | 0 (0.0%) |
| $25,000 to $49,999 | 1,218 (96.7%) | 42 (3.3%) |
| $50,000 to $74,999 | 1,447 (96.0%) | 60 (4.0%) |
| $75,000 to $99,999 | 2,592 (90.5%) | 271 (9.5%) |
| $100,000 and over | 8,973 (99.7%) | 30 (0.3%) |
Public vs Private Health Insurance Coverage by Age in Chelsea
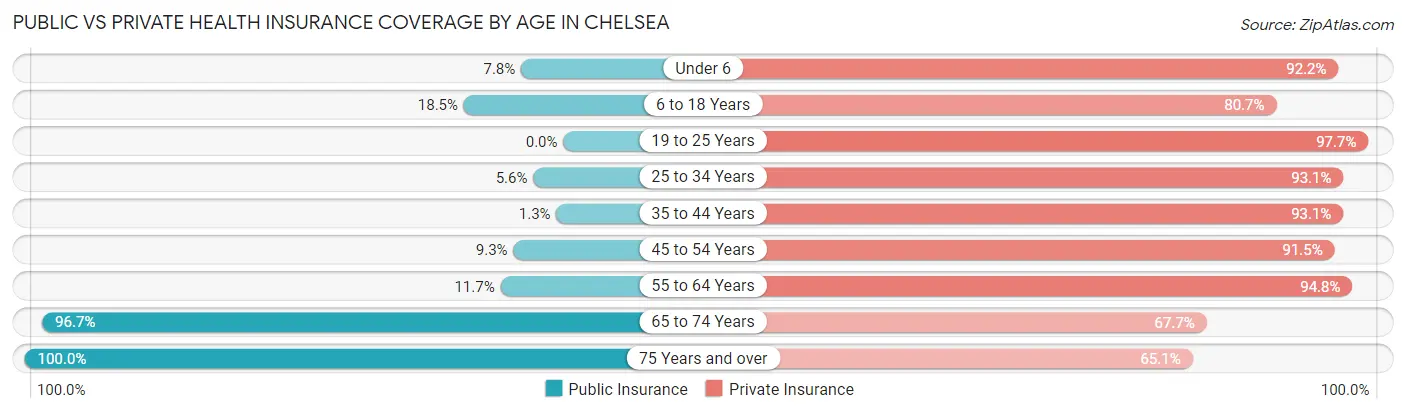
| Age Bracket | Public Insurance | Private Insurance |
| Under 6 | 69 (7.8%) | 811 (92.2%) |
| 6 to 18 Years | 654 (18.5%) | 2,855 (80.6%) |
| 19 to 25 Years | 0 (0.0%) | 809 (97.7%) |
| 25 to 34 Years | 88 (5.6%) | 1,468 (93.1%) |
| 35 to 44 Years | 33 (1.3%) | 2,402 (93.1%) |
| 45 to 54 Years | 180 (9.3%) | 1,778 (91.5%) |
| 55 to 64 Years | 180 (11.7%) | 1,461 (94.8%) |
| 65 to 74 Years | 1,507 (96.7%) | 1,055 (67.7%) |
| 75 Years and over | 676 (100.0%) | 440 (65.1%) |
| Total | 3,387 (22.4%) | 13,079 (86.5%) |
Disability Status by Sex by Age in Chelsea
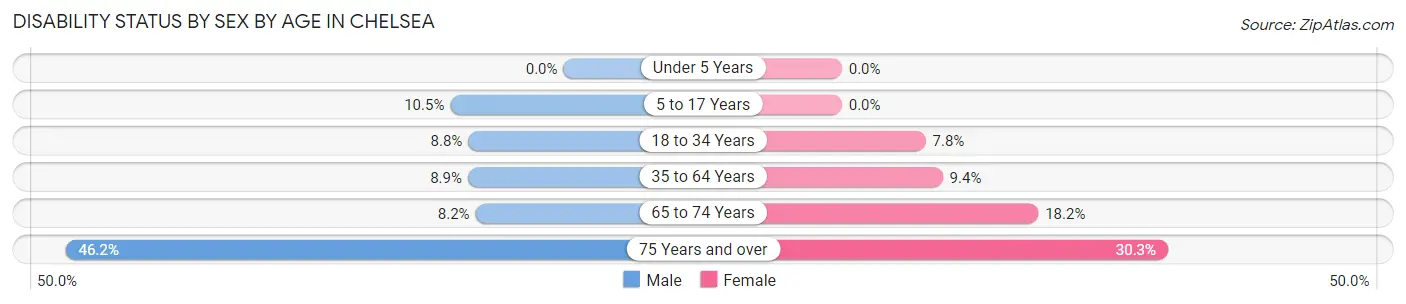
| Age Bracket | Male | Female |
| Under 5 Years | 0 (0.0%) | 0 (0.0%) |
| 5 to 17 Years | 234 (10.5%) | 0 (0.0%) |
| 18 to 34 Years | 114 (8.8%) | 96 (7.8%) |
| 35 to 64 Years | 272 (8.9%) | 281 (9.4%) |
| 65 to 74 Years | 56 (8.2%) | 159 (18.2%) |
| 75 Years and over | 152 (46.2%) | 105 (30.3%) |
Disability Class by Sex by Age in Chelsea
Disability Class: Hearing Difficulty
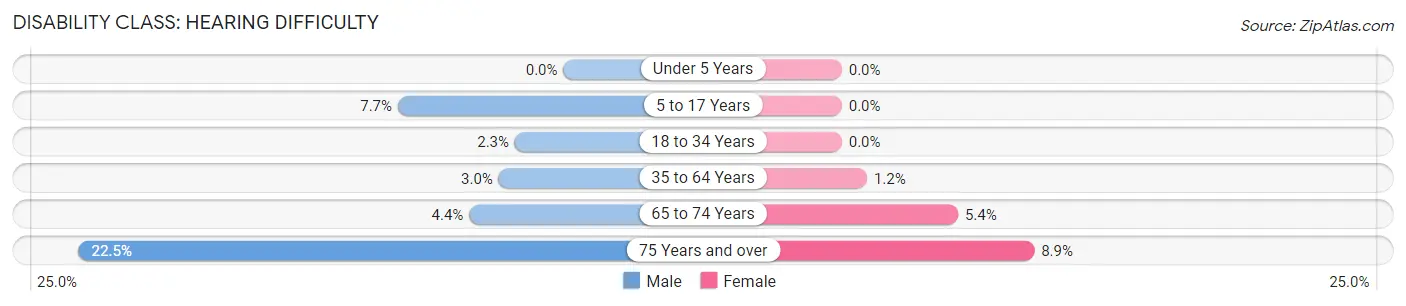
| Age Bracket | Male | Female |
| Under 5 Years | 0 (0.0%) | 0 (0.0%) |
| 5 to 17 Years | 171 (7.7%) | 0 (0.0%) |
| 18 to 34 Years | 29 (2.2%) | 0 (0.0%) |
| 35 to 64 Years | 92 (3.0%) | 35 (1.2%) |
| 65 to 74 Years | 30 (4.4%) | 47 (5.4%) |
| 75 Years and over | 74 (22.5%) | 31 (8.9%) |
Disability Class: Vision Difficulty
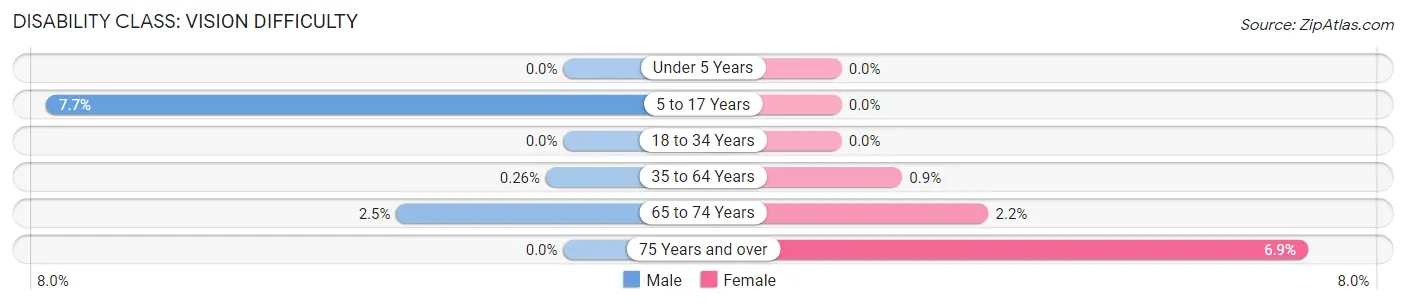
| Age Bracket | Male | Female |
| Under 5 Years | 0 (0.0%) | 0 (0.0%) |
| 5 to 17 Years | 171 (7.7%) | 0 (0.0%) |
| 18 to 34 Years | 0 (0.0%) | 0 (0.0%) |
| 35 to 64 Years | 8 (0.3%) | 27 (0.9%) |
| 65 to 74 Years | 17 (2.5%) | 19 (2.2%) |
| 75 Years and over | 0 (0.0%) | 24 (6.9%) |
Disability Class: Cognitive Difficulty
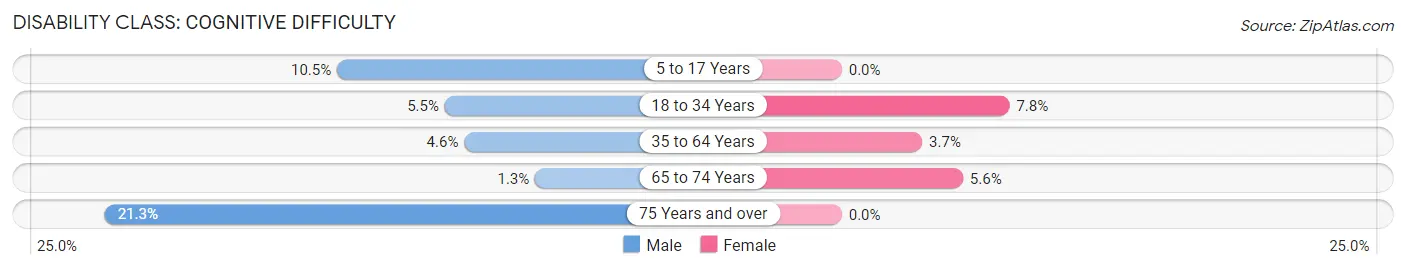
| Age Bracket | Male | Female |
| 5 to 17 Years | 234 (10.5%) | 0 (0.0%) |
| 18 to 34 Years | 71 (5.5%) | 96 (7.8%) |
| 35 to 64 Years | 141 (4.6%) | 112 (3.7%) |
| 65 to 74 Years | 9 (1.3%) | 49 (5.6%) |
| 75 Years and over | 70 (21.3%) | 0 (0.0%) |
Disability Class: Ambulatory Difficulty
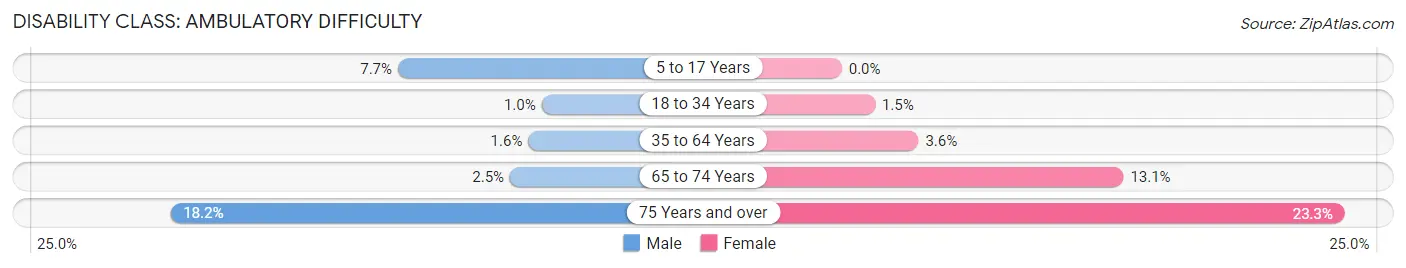
| Age Bracket | Male | Female |
| 5 to 17 Years | 171 (7.7%) | 0 (0.0%) |
| 18 to 34 Years | 13 (1.0%) | 19 (1.5%) |
| 35 to 64 Years | 50 (1.6%) | 107 (3.6%) |
| 65 to 74 Years | 17 (2.5%) | 114 (13.1%) |
| 75 Years and over | 60 (18.2%) | 81 (23.3%) |
Disability Class: Self-Care Difficulty
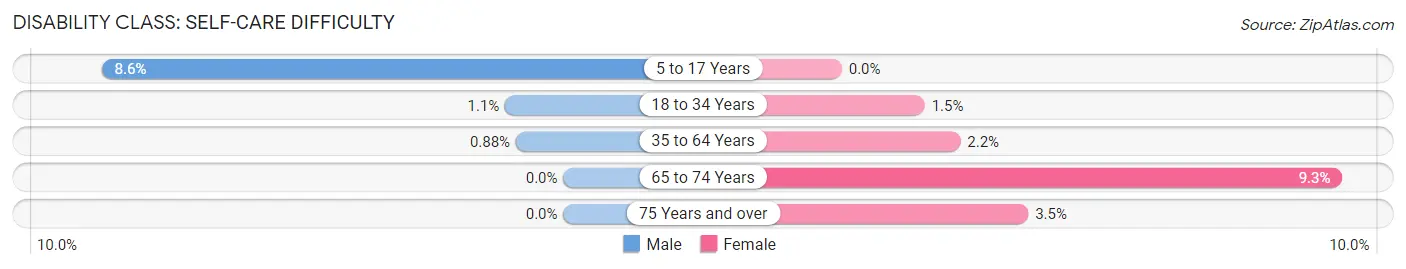
| Age Bracket | Male | Female |
| 5 to 17 Years | 191 (8.6%) | 0 (0.0%) |
| 18 to 34 Years | 14 (1.1%) | 19 (1.5%) |
| 35 to 64 Years | 27 (0.9%) | 66 (2.2%) |
| 65 to 74 Years | 0 (0.0%) | 81 (9.3%) |
| 75 Years and over | 0 (0.0%) | 12 (3.5%) |
Technology Access in Chelsea
Computing Device Access in Chelsea
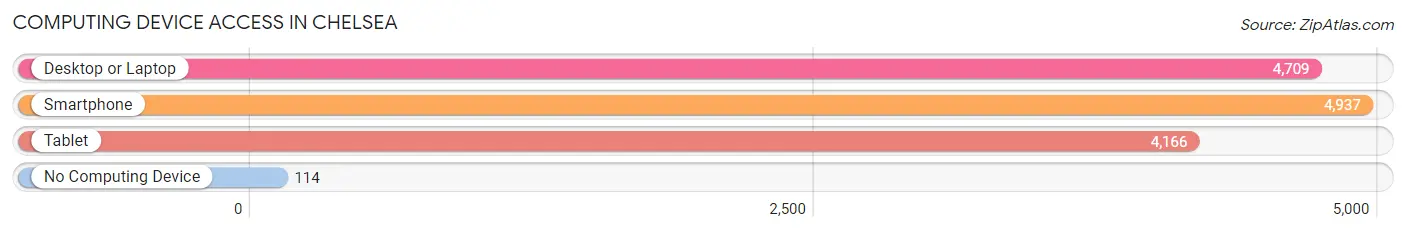
| Device Type | # Households | % Households |
| Desktop or Laptop | 4,709 | 90.4% |
| Smartphone | 4,937 | 94.8% |
| Tablet | 4,166 | 80.0% |
| No Computing Device | 114 | 2.2% |
| Total | 5,209 | 100.0% |
Internet Access in Chelsea
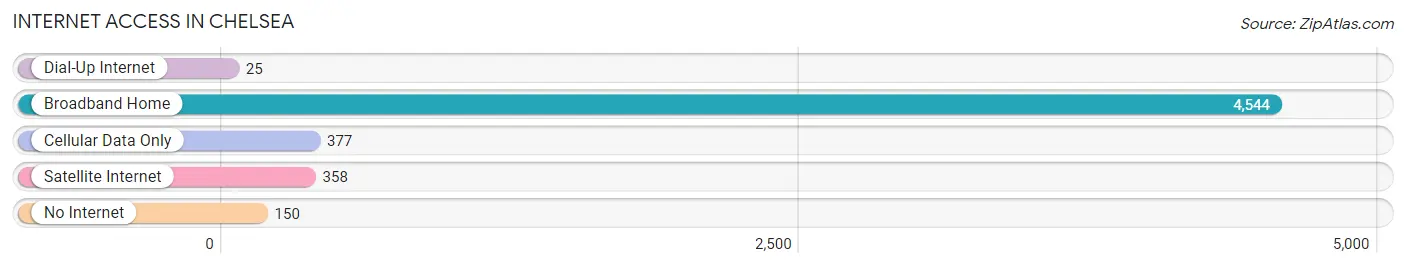
| Internet Type | # Households | % Households |
| Dial-Up Internet | 25 | 0.5% |
| Broadband Home | 4,544 | 87.2% |
| Cellular Data Only | 377 | 7.2% |
| Satellite Internet | 358 | 6.9% |
| No Internet | 150 | 2.9% |
| Total | 5,209 | 100.0% |
Chelsea Summary
Chelsea is a city located in Shelby County, Alabama, United States. It is a suburb of Birmingham and is part of the Birmingham-Hoover Metropolitan Statistical Area. As of the 2010 census, the population of Chelsea was 10,183.
Geography
Chelsea is located at 33°20'45" North, 86°38'45" West (33.3458, -86.6459). According to the U.S. Census Bureau, the city has a total area of 11.2 square miles, of which 11.1 square miles is land and 0.1 square miles is water.
History
The area that is now Chelsea was first settled in the early 1800s by the family of William and Mary Moore. The Moores built a log cabin on the banks of the Cahaba River and named the area Moore’s Crossroads. In 1887, the area was renamed Chelsea after a local postmaster, William H. Chelsea.
The town was incorporated in 1895 and the first mayor was elected in 1896. In the early 1900s, the town was a thriving agricultural community. Cotton was the main crop and the town was home to several cotton gins.
In the 1950s, the town began to experience rapid growth as Birmingham’s suburbs began to expand. The population of Chelsea increased from 1,000 in 1950 to 10,183 in 2010.
Economy
The economy of Chelsea is largely based on retail and services. The city is home to several large retail stores, including Walmart, Target, and Home Depot. There are also several restaurants, banks, and other businesses located in the city.
The city is also home to several industrial and manufacturing companies, including Vulcan Materials, a producer of construction materials, and the Chelsea Foundry, a manufacturer of cast iron products.
Demographics
As of the 2010 census, the population of Chelsea was 10,183. The racial makeup of the city was 87.3% White, 8.2% African American, 0.7% Native American, 1.2% Asian, 0.1% Pacific Islander, 0.9% from other races, and 1.6% from two or more races. Hispanic or Latino of any race were 3.2% of the population.
The median income for a household in the city was $63,945 and the median income for a family was $76,945. The per capita income for the city was $30,945. About 4.2% of families and 5.7% of the population were below the poverty line, including 7.2% of those under age 18 and 4.2% of those age 65 or over.
Conclusion
Chelsea is a city located in Shelby County, Alabama. It is a suburb of Birmingham and is part of the Birmingham-Hoover Metropolitan Statistical Area. The city has a population of 10,183 and is largely based on retail and services. The economy of Chelsea is also supported by several industrial and manufacturing companies. The racial makeup of the city is 87.3% White, 8.2% African American, 0.7% Native American, 1.2% Asian, 0.1% Pacific Islander, 0.9% from other races, and 1.6% from two or more races. The median income for a household in the city was $63,945 and the median income for a family was $76,945.
Common Questions
What is Per Capita Income in Chelsea?
Per Capita income in Chelsea is $43,448.
What is the Median Family Income in Chelsea?
Median Family Income in Chelsea is $114,893.
What is the Median Household income in Chelsea?
Median Household Income in Chelsea is $102,344.
What is Income or Wage Gap in Chelsea?
Income or Wage Gap in Chelsea is 32.8%.
Women in Chelsea earn 67.2 cents for every dollar earned by a man.
What is Family Income Deficit in Chelsea?
Family Income Deficit in Chelsea is $11,035.
Families that are below poverty line in Chelsea earn $11,035 less on average than the poverty threshold level.
What is Inequality or Gini Index in Chelsea?
Inequality or Gini Index in Chelsea is 0.38.
What is the Total Population of Chelsea?
Total Population of Chelsea is 15,201.
What is the Total Male Population of Chelsea?
Total Male Population of Chelsea is 7,884.
What is the Total Female Population of Chelsea?
Total Female Population of Chelsea is 7,317.
What is the Ratio of Males per 100 Females in Chelsea?
There are 107.75 Males per 100 Females in Chelsea.
What is the Ratio of Females per 100 Males in Chelsea?
There are 92.81 Females per 100 Males in Chelsea.
What is the Median Population Age in Chelsea?
Median Population Age in Chelsea is 37.9 Years.
What is the Average Family Size in Chelsea
Average Family Size in Chelsea is 3.3 People.
What is the Average Household Size in Chelsea
Average Household Size in Chelsea is 2.9 People.
How Large is the Labor Force in Chelsea?
There are 7,467 People in the Labor Forcein in Chelsea.
What is the Percentage of People in the Labor Force in Chelsea?
66.4% of People are in the Labor Force in Chelsea.
What is the Unemployment Rate in Chelsea?
Unemployment Rate in Chelsea is 4.1%.