Aventura, FL Map & Demographics
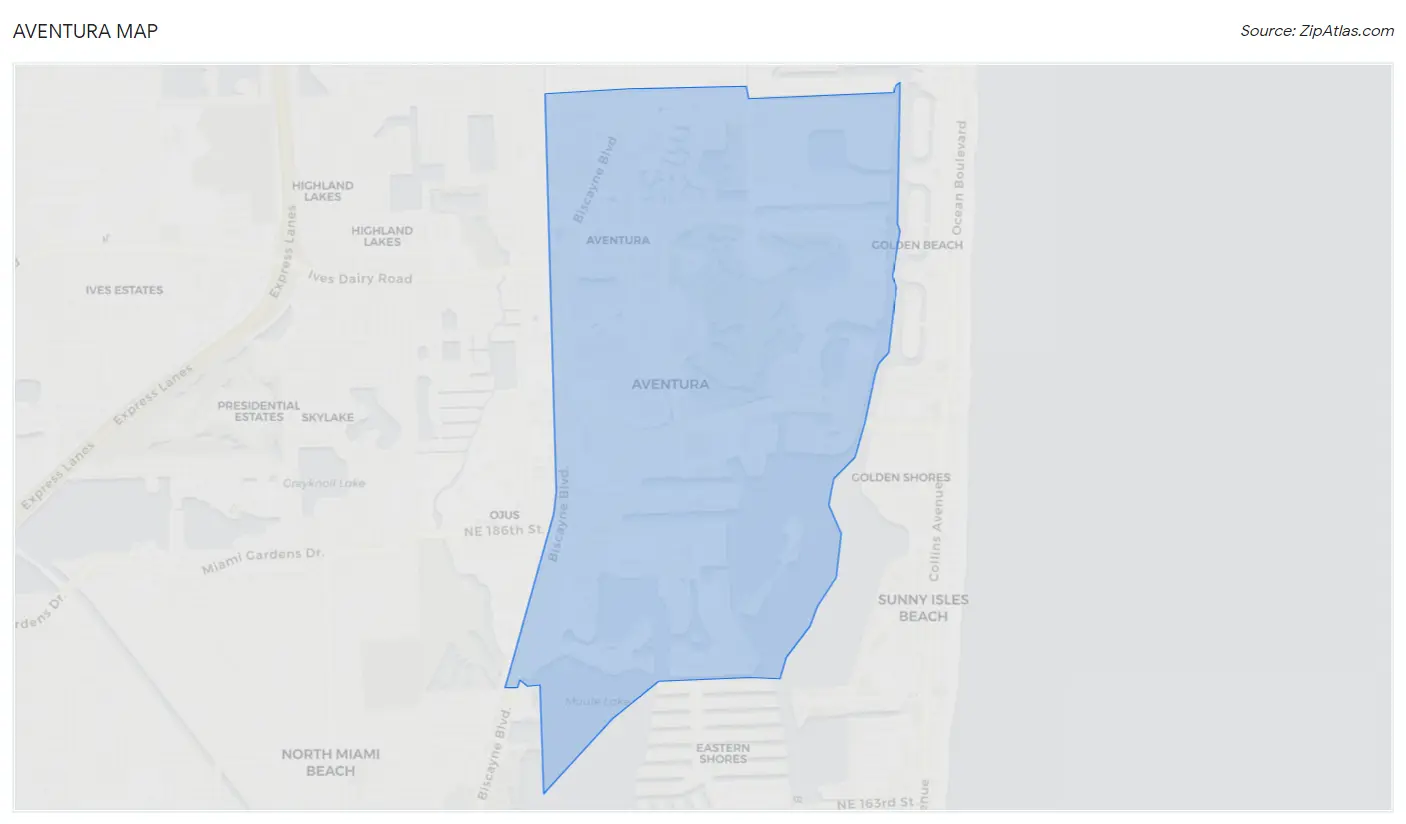
Aventura Map
Aventura Overview
$56,940
PER CAPITA INCOME
$94,253
AVG FAMILY INCOME
$75,211
AVG HOUSEHOLD INCOME
44.7%
WAGE / INCOME GAP [ % ]
55.3¢/ $1
WAGE / INCOME GAP [ $ ]
0.55
INEQUALITY / GINI INDEX
39,621
TOTAL POPULATION
17,672
MALE POPULATION
21,949
FEMALE POPULATION
80.51
MALES / 100 FEMALES
124.20
FEMALES / 100 MALES
49.8
MEDIAN AGE
2.9
AVG FAMILY SIZE
2.1
AVG HOUSEHOLD SIZE
18,336
LABOR FORCE [ PEOPLE ]
55.2%
PERCENT IN LABOR FORCE
4.8%
UNEMPLOYMENT RATE
Income in Aventura
Income Overview in Aventura
Per Capita Income in Aventura is $56,940, while median incomes of families and households are $94,253 and $75,211 respectively.
| Characteristic | Number | Measure |
| Per Capita Income | 39,621 | $56,940 |
| Median Family Income | 10,457 | $94,253 |
| Mean Family Income | 10,457 | $151,893 |
| Median Household Income | 18,403 | $75,211 |
| Mean Household Income | 18,403 | $120,671 |
| Income Deficit | 10,457 | $0 |
| Wage / Income Gap (%) | 39,621 | 44.68% |
| Wage / Income Gap ($) | 39,621 | 55.32¢ per $1 |
| Gini / Inequality Index | 39,621 | 0.55 |
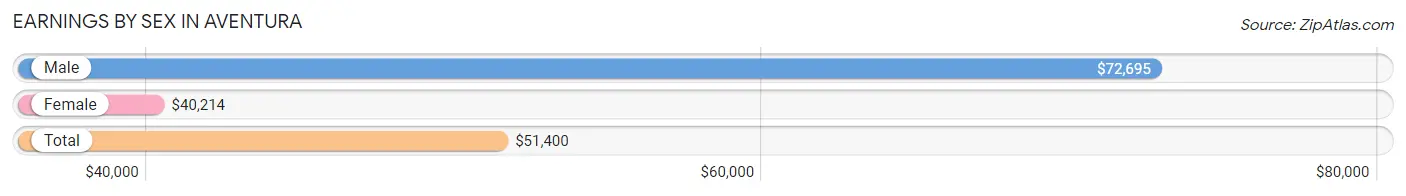
Earnings by Sex in Aventura
Average Earnings in Aventura are $51,400, $72,695 for men and $40,214 for women, a difference of 44.7%.
| Sex | Number | Average Earnings |
| Male | 10,115 (52.9%) | $72,695 |
| Female | 8,994 (47.1%) | $40,214 |
| Total | 19,109 (100.0%) | $51,400 |
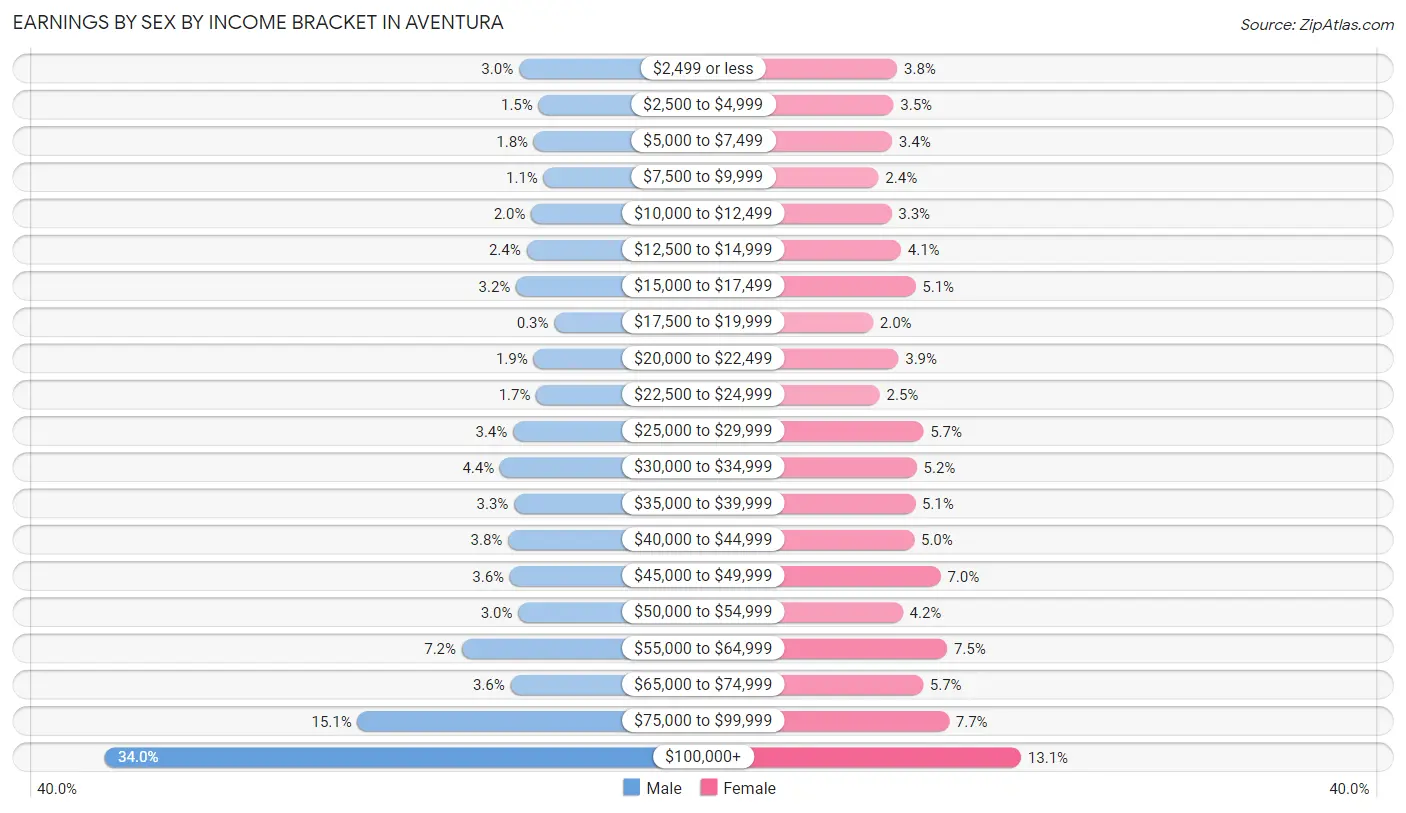
Earnings by Sex by Income Bracket in Aventura
The most common earnings brackets in Aventura are $100,000+ for men (3,435 | 34.0%) and $100,000+ for women (1,174 | 13.1%).
| Income | Male | Female |
| $2,499 or less | 298 (2.9%) | 339 (3.8%) |
| $2,500 to $4,999 | 150 (1.5%) | 314 (3.5%) |
| $5,000 to $7,499 | 185 (1.8%) | 304 (3.4%) |
| $7,500 to $9,999 | 111 (1.1%) | 213 (2.4%) |
| $10,000 to $12,499 | 205 (2.0%) | 300 (3.3%) |
| $12,500 to $14,999 | 241 (2.4%) | 364 (4.1%) |
| $15,000 to $17,499 | 320 (3.2%) | 462 (5.1%) |
| $17,500 to $19,999 | 30 (0.3%) | 175 (1.9%) |
| $20,000 to $22,499 | 188 (1.9%) | 347 (3.9%) |
| $22,500 to $24,999 | 167 (1.7%) | 221 (2.5%) |
| $25,000 to $29,999 | 343 (3.4%) | 515 (5.7%) |
| $30,000 to $34,999 | 442 (4.4%) | 470 (5.2%) |
| $35,000 to $39,999 | 335 (3.3%) | 460 (5.1%) |
| $40,000 to $44,999 | 380 (3.8%) | 453 (5.0%) |
| $45,000 to $49,999 | 367 (3.6%) | 631 (7.0%) |
| $50,000 to $54,999 | 303 (3.0%) | 376 (4.2%) |
| $55,000 to $64,999 | 731 (7.2%) | 675 (7.5%) |
| $65,000 to $74,999 | 362 (3.6%) | 513 (5.7%) |
| $75,000 to $99,999 | 1,522 (15.0%) | 688 (7.6%) |
| $100,000+ | 3,435 (34.0%) | 1,174 (13.1%) |
| Total | 10,115 (100.0%) | 8,994 (100.0%) |
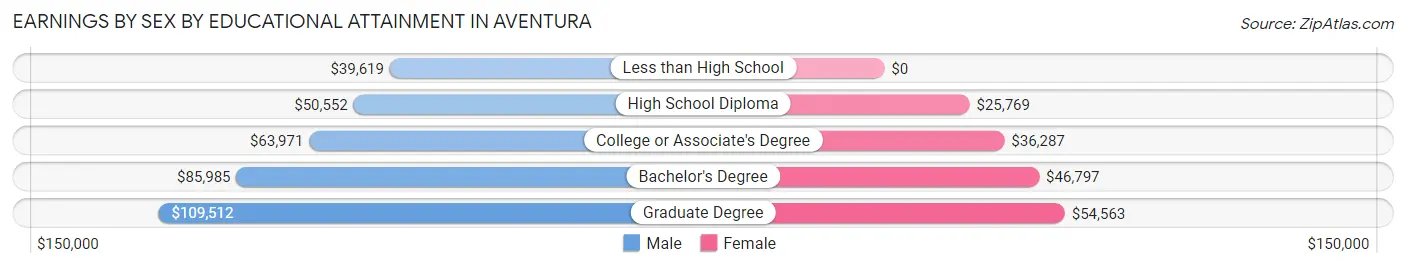
Earnings by Sex by Educational Attainment in Aventura
Average earnings in Aventura are $81,801 for men and $43,480 for women, a difference of 46.9%. Men with an educational attainment of graduate degree enjoy the highest average annual earnings of $109,512, while those with less than high school education earn the least with $39,619. Women with an educational attainment of graduate degree earn the most with the average annual earnings of $54,563, while those with high school diploma education have the smallest earnings of $25,769.
| Educational Attainment | Male Income | Female Income |
| Less than High School | $39,619 | $0 |
| High School Diploma | $50,552 | $25,769 |
| College or Associate's Degree | $63,971 | $36,287 |
| Bachelor's Degree | $85,985 | $46,797 |
| Graduate Degree | $109,512 | $54,563 |
| Total | $81,801 | $43,480 |
Family Income in Aventura
Family Income Brackets in Aventura
According to the Aventura family income data, there are 2,311 families falling into the $200,000+ income range, which is the most common income bracket and makes up 22.1% of all families. Conversely, the $10,000 to $14,999 income bracket is the least frequent group with only 84 families (0.8%) belonging to this category.
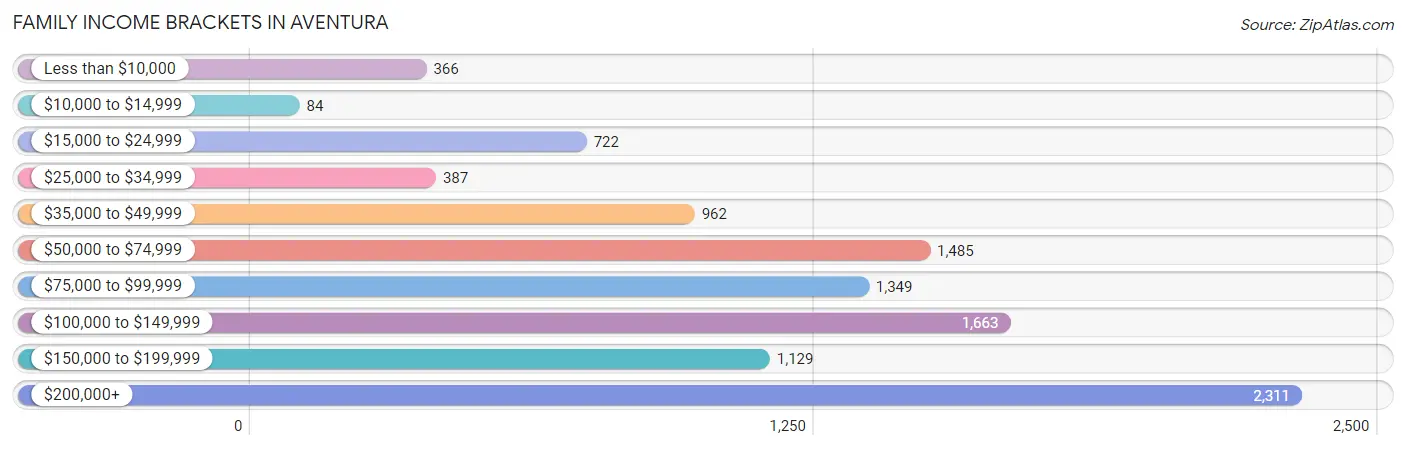
| Income Bracket | # Families | % Families |
| Less than $10,000 | 366 | 3.5% |
| $10,000 to $14,999 | 84 | 0.8% |
| $15,000 to $24,999 | 722 | 6.9% |
| $25,000 to $34,999 | 387 | 3.7% |
| $35,000 to $49,999 | 962 | 9.2% |
| $50,000 to $74,999 | 1,485 | 14.2% |
| $75,000 to $99,999 | 1,349 | 12.9% |
| $100,000 to $149,999 | 1,663 | 15.9% |
| $150,000 to $199,999 | 1,129 | 10.8% |
| $200,000+ | 2,311 | 22.1% |
Family Income by Famaliy Size in Aventura
6-person families (101 | 1.0%) account for the highest median family income in Aventura with $250,001 per family, while 2-person families (6,215 | 59.4%) have the highest median income of $43,330 per family member.
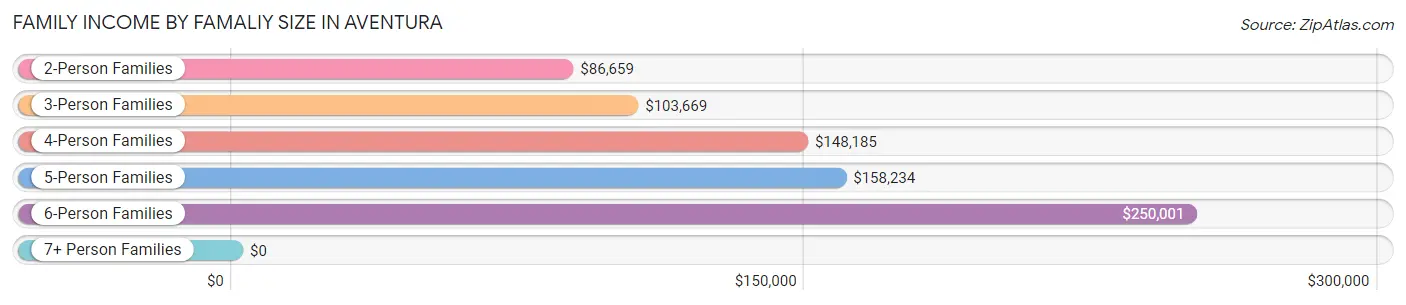
| Income Bracket | # Families | Median Income |
| 2-Person Families | 6,215 (59.4%) | $86,659 |
| 3-Person Families | 2,146 (20.5%) | $103,669 |
| 4-Person Families | 1,541 (14.7%) | $148,185 |
| 5-Person Families | 447 (4.3%) | $158,234 |
| 6-Person Families | 101 (1.0%) | $250,001 |
| 7+ Person Families | 7 (0.1%) | $0 |
| Total | 10,457 (100.0%) | $94,253 |
Family Income by Number of Earners in Aventura
The median family income in Aventura is $94,253, with families comprising 3+ earners (556) having the highest median family income of $223,214, while families with no earners (1,892) have the lowest median family income of $54,493, accounting for 5.3% and 18.1% of families, respectively.
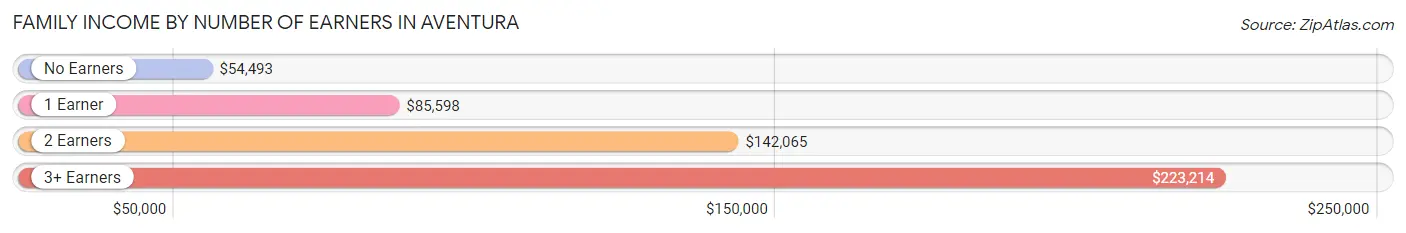
| Number of Earners | # Families | Median Income |
| No Earners | 1,892 (18.1%) | $54,493 |
| 1 Earner | 4,353 (41.6%) | $85,598 |
| 2 Earners | 3,656 (35.0%) | $142,065 |
| 3+ Earners | 556 (5.3%) | $223,214 |
| Total | 10,457 (100.0%) | $94,253 |
Household Income in Aventura
Household Income Brackets in Aventura
With 2,926 households falling in the category, the $200,000+ income range is the most frequent in Aventura, accounting for 15.9% of all households. In contrast, only 736 households (4.0%) fall into the $10,000 to $14,999 income bracket, making it the least populous group.
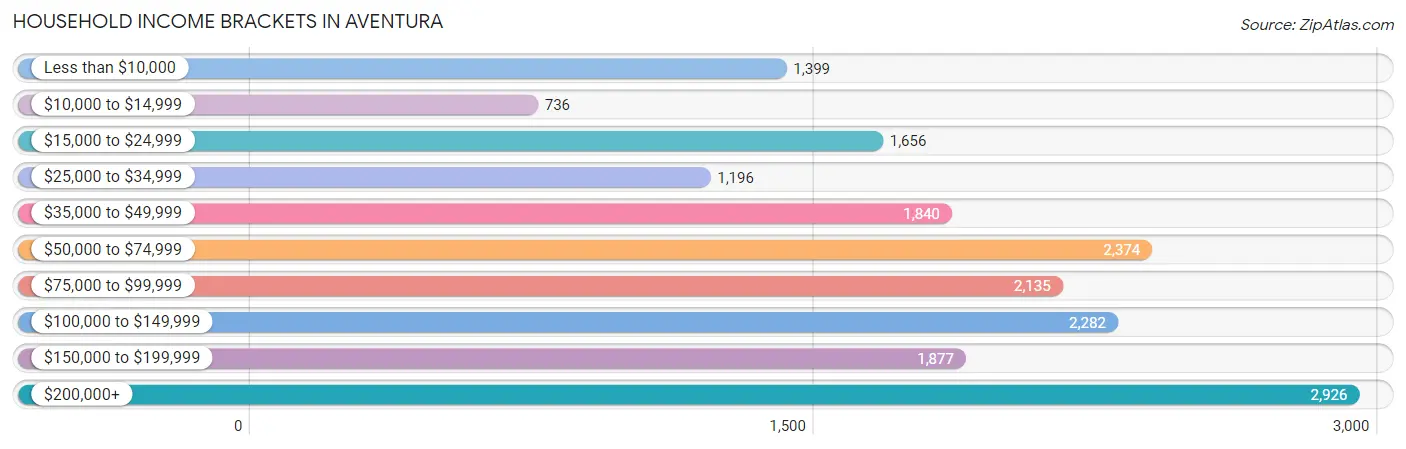
| Income Bracket | # Households | % Households |
| Less than $10,000 | 1,399 | 7.6% |
| $10,000 to $14,999 | 736 | 4.0% |
| $15,000 to $24,999 | 1,656 | 9.0% |
| $25,000 to $34,999 | 1,196 | 6.5% |
| $35,000 to $49,999 | 1,840 | 10.0% |
| $50,000 to $74,999 | 2,374 | 12.9% |
| $75,000 to $99,999 | 2,135 | 11.6% |
| $100,000 to $149,999 | 2,282 | 12.4% |
| $150,000 to $199,999 | 1,877 | 10.2% |
| $200,000+ | 2,926 | 15.9% |
Household Income by Householder Age in Aventura
The median household income in Aventura is $75,211, with the highest median household income of $88,026 found in the 25 to 44 years age bracket for the primary householder. A total of 3,922 households (21.3%) fall into this category. Meanwhile, the 15 to 24 years age bracket for the primary householder has the lowest median household income of $0, with 330 households (1.8%) in this group.
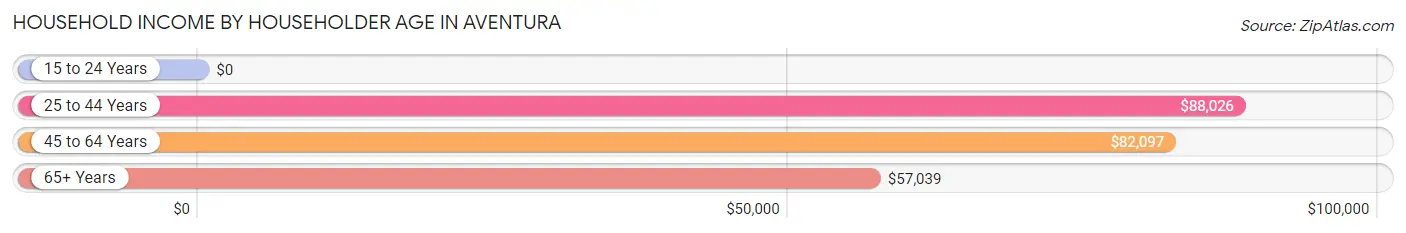
| Income Bracket | # Households | Median Income |
| 15 to 24 Years | 330 (1.8%) | $0 |
| 25 to 44 Years | 3,922 (21.3%) | $88,026 |
| 45 to 64 Years | 6,732 (36.6%) | $82,097 |
| 65+ Years | 7,419 (40.3%) | $57,039 |
| Total | 18,403 (100.0%) | $75,211 |
Poverty in Aventura
Income Below Poverty by Sex and Age in Aventura
With 10.9% poverty level for males and 13.7% for females among the residents of Aventura, 16 and 17 year old males and 15 year old females are the most vulnerable to poverty, with 126 males (32.9%) and 79 females (42.0%) in their respective age groups living below the poverty level.
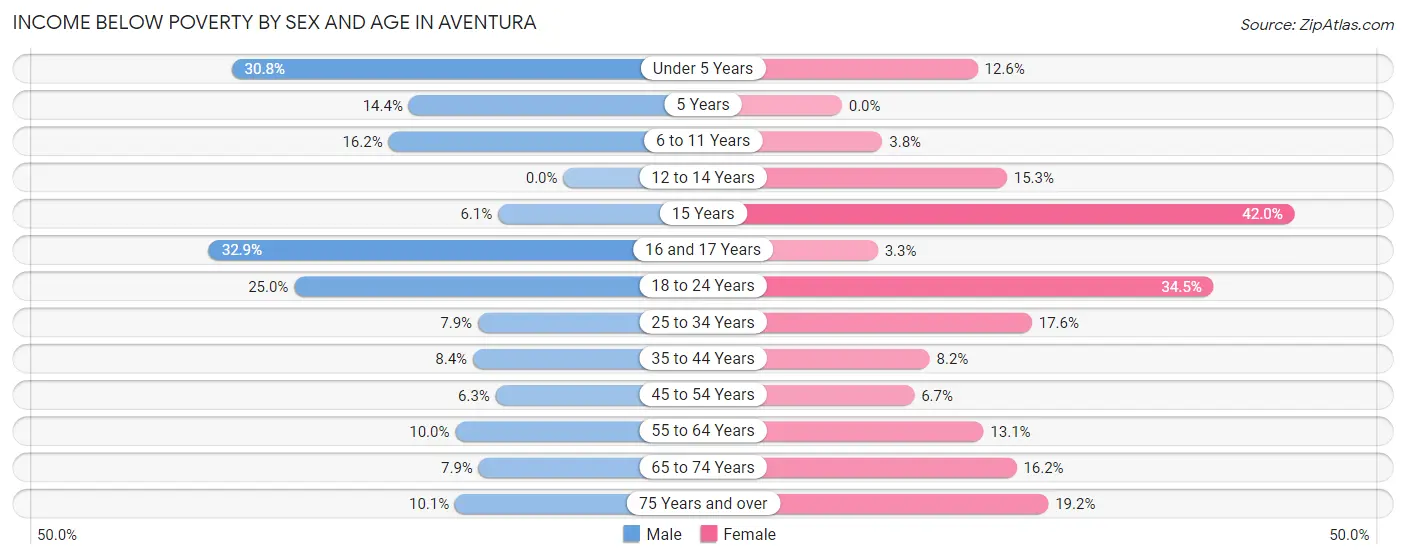
| Age Bracket | Male | Female |
| Under 5 Years | 225 (30.8%) | 130 (12.6%) |
| 5 Years | 30 (14.3%) | 0 (0.0%) |
| 6 to 11 Years | 155 (16.2%) | 50 (3.8%) |
| 12 to 14 Years | 0 (0.0%) | 94 (15.3%) |
| 15 Years | 10 (6.1%) | 79 (42.0%) |
| 16 and 17 Years | 126 (32.9%) | 14 (3.3%) |
| 18 to 24 Years | 252 (25.0%) | 362 (34.5%) |
| 25 to 34 Years | 116 (7.9%) | 318 (17.6%) |
| 35 to 44 Years | 184 (8.4%) | 202 (8.2%) |
| 45 to 54 Years | 168 (6.3%) | 211 (6.7%) |
| 55 to 64 Years | 244 (10.0%) | 386 (13.1%) |
| 65 to 74 Years | 179 (7.9%) | 553 (16.2%) |
| 75 Years and over | 230 (10.1%) | 581 (19.2%) |
| Total | 1,919 (10.9%) | 2,980 (13.7%) |
Income Above Poverty by Sex and Age in Aventura
According to the poverty statistics in Aventura, males aged 12 to 14 years and females aged 5 years are the age groups that are most secure financially, with 100.0% of males and 100.0% of females in these age groups living above the poverty line.
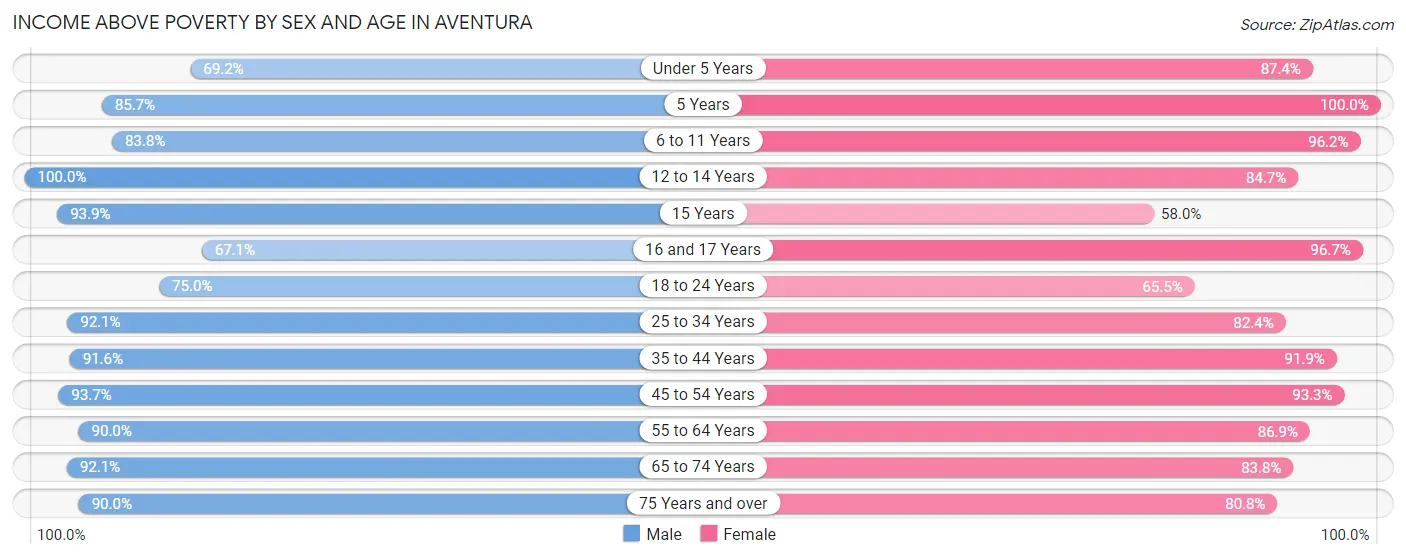
| Age Bracket | Male | Female |
| Under 5 Years | 506 (69.2%) | 902 (87.4%) |
| 5 Years | 179 (85.7%) | 319 (100.0%) |
| 6 to 11 Years | 800 (83.8%) | 1,281 (96.2%) |
| 12 to 14 Years | 830 (100.0%) | 520 (84.7%) |
| 15 Years | 155 (93.9%) | 109 (58.0%) |
| 16 and 17 Years | 257 (67.1%) | 407 (96.7%) |
| 18 to 24 Years | 757 (75.0%) | 687 (65.5%) |
| 25 to 34 Years | 1,346 (92.1%) | 1,486 (82.4%) |
| 35 to 44 Years | 2,009 (91.6%) | 2,277 (91.8%) |
| 45 to 54 Years | 2,509 (93.7%) | 2,927 (93.3%) |
| 55 to 64 Years | 2,189 (90.0%) | 2,552 (86.9%) |
| 65 to 74 Years | 2,099 (92.1%) | 2,859 (83.8%) |
| 75 Years and over | 2,058 (89.9%) | 2,451 (80.8%) |
| Total | 15,694 (89.1%) | 18,777 (86.3%) |
Income Below Poverty Among Married-Couple Families in Aventura
The poverty statistics for married-couple families in Aventura show that 5.1% or 406 of the total 8,041 families live below the poverty line. Families with 3 or 4 children have the highest poverty rate of 7.7%, comprising of 19 families. On the other hand, families with 5 or more children have the lowest poverty rate of 0.0%, which includes 0 families.
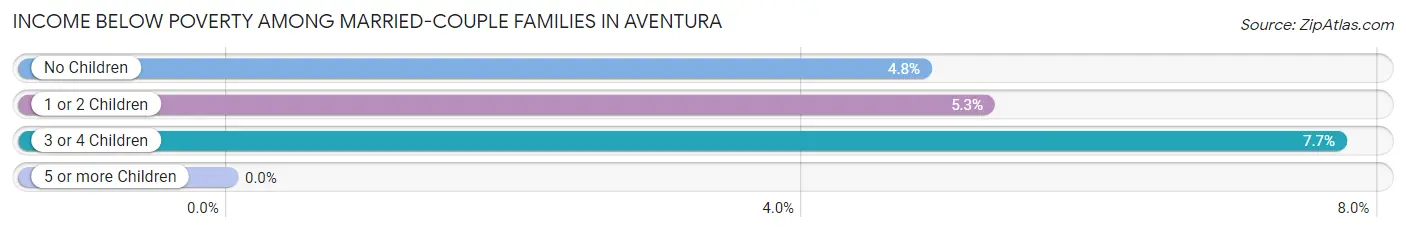
| Children | Above Poverty | Below Poverty |
| No Children | 5,066 (95.2%) | 257 (4.8%) |
| 1 or 2 Children | 2,335 (94.7%) | 130 (5.3%) |
| 3 or 4 Children | 227 (92.3%) | 19 (7.7%) |
| 5 or more Children | 7 (100.0%) | 0 (0.0%) |
| Total | 7,635 (95.0%) | 406 (5.1%) |
Income Below Poverty Among Single-Parent Households in Aventura
According to the poverty data in Aventura, 9.7% or 83 single-father households and 23.9% or 373 single-mother households are living below the poverty line. Among single-father households, those with no children have the highest poverty rate, with 47 households (12.0%) experiencing poverty. Likewise, among single-mother households, those with 1 or 2 children have the highest poverty rate, with 279 households (38.5%) falling below the poverty line.
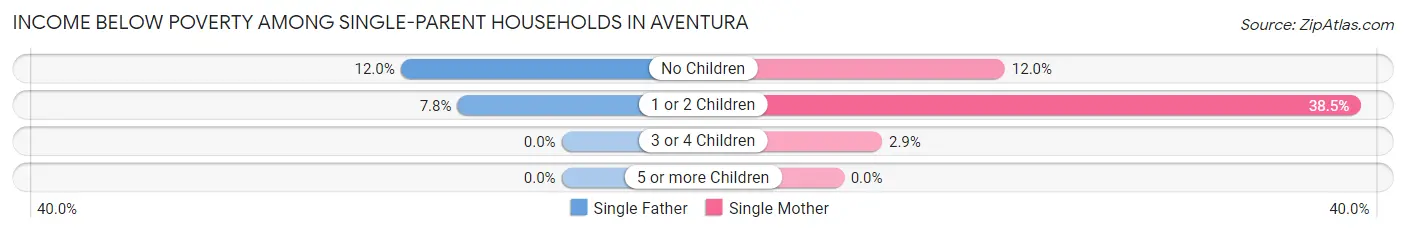
| Children | Single Father | Single Mother |
| No Children | 47 (12.0%) | 92 (12.0%) |
| 1 or 2 Children | 36 (7.8%) | 279 (38.5%) |
| 3 or 4 Children | 0 (0.0%) | 2 (2.9%) |
| 5 or more Children | 0 (0.0%) | 0 (0.0%) |
| Total | 83 (9.7%) | 373 (23.9%) |
Income Below Poverty Among Married-Couple vs Single-Parent Households in Aventura
The poverty data for Aventura shows that 406 of the married-couple family households (5.1%) and 456 of the single-parent households (18.9%) are living below the poverty level. Within the married-couple family households, those with 3 or 4 children have the highest poverty rate, with 19 households (7.7%) falling below the poverty line. Among the single-parent households, those with 1 or 2 children have the highest poverty rate, with 315 household (26.5%) living below poverty.
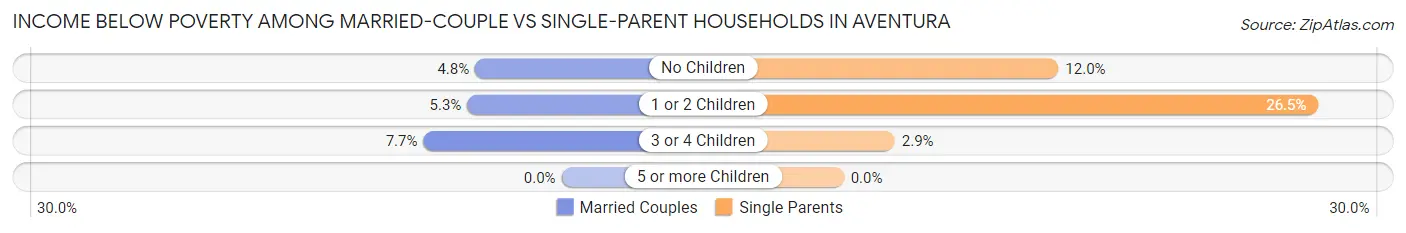
| Children | Married-Couple Families | Single-Parent Households |
| No Children | 257 (4.8%) | 139 (12.0%) |
| 1 or 2 Children | 130 (5.3%) | 315 (26.5%) |
| 3 or 4 Children | 19 (7.7%) | 2 (2.9%) |
| 5 or more Children | 0 (0.0%) | 0 (0.0%) |
| Total | 406 (5.1%) | 456 (18.9%) |
Race in Aventura
The most populous races in Aventura are White / Caucasian (27,525 | 69.5%), Hispanic or Latino (17,685 | 44.6%), and Two or more Races (9,024 | 22.8%).
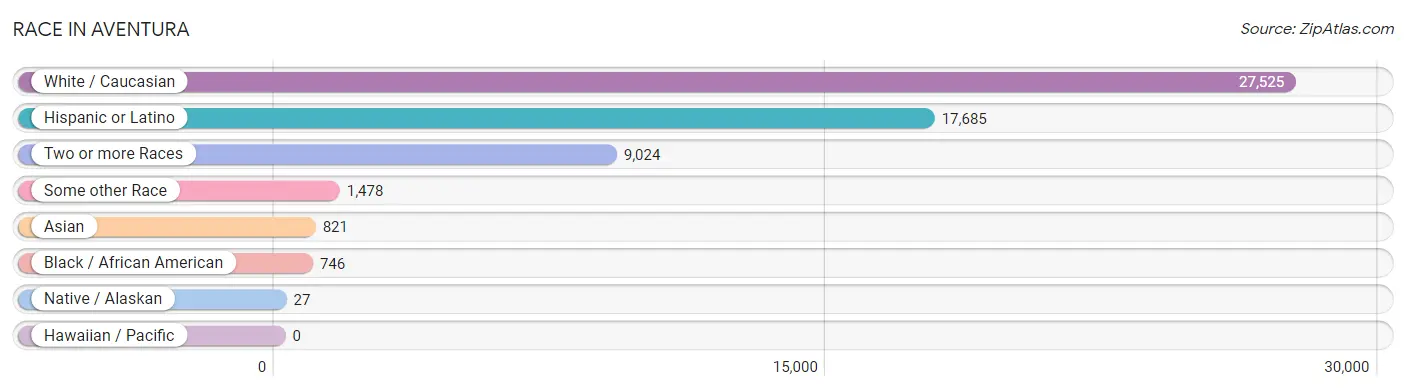
| Race | # Population | % Population |
| Asian | 821 | 2.1% |
| Black / African American | 746 | 1.9% |
| Hawaiian / Pacific | 0 | 0.0% |
| Hispanic or Latino | 17,685 | 44.6% |
| Native / Alaskan | 27 | 0.1% |
| White / Caucasian | 27,525 | 69.5% |
| Two or more Races | 9,024 | 22.8% |
| Some other Race | 1,478 | 3.7% |
| Total | 39,621 | 100.0% |
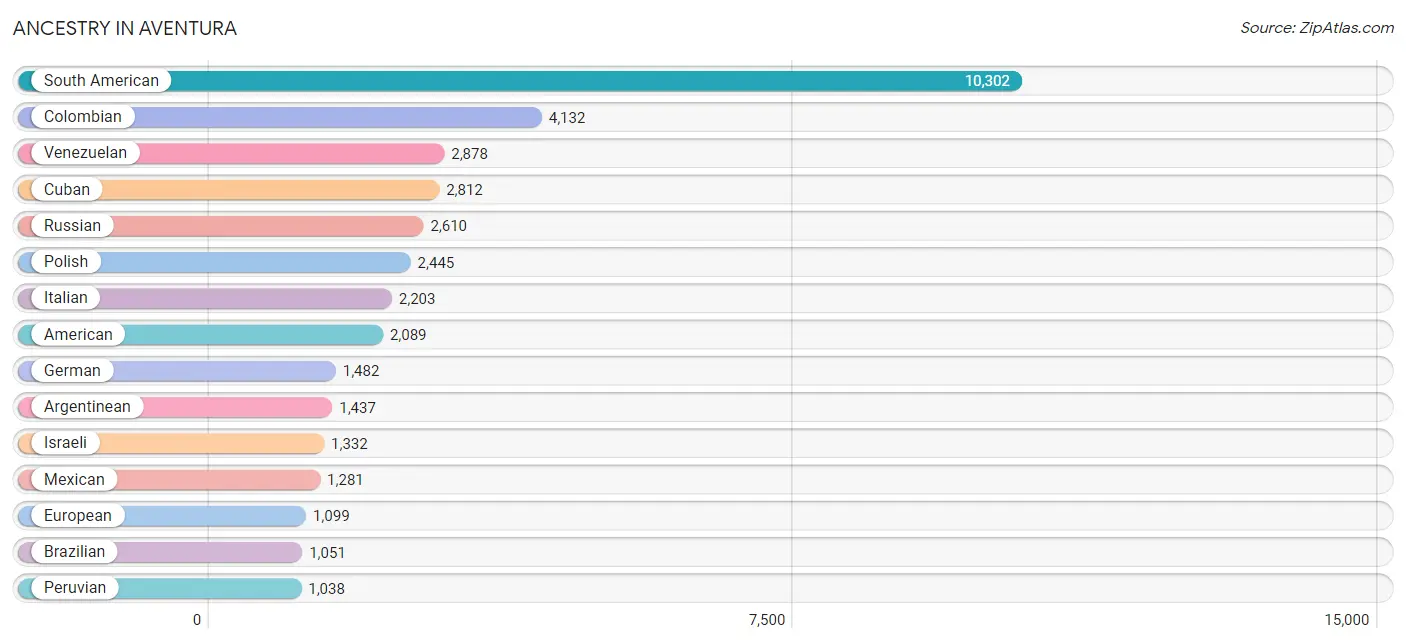
Ancestry in Aventura
The most populous ancestries reported in Aventura are South American (10,302 | 26.0%), Colombian (4,132 | 10.4%), Venezuelan (2,878 | 7.3%), Cuban (2,812 | 7.1%), and Russian (2,610 | 6.6%), together accounting for 57.4% of all Aventura residents.
| Ancestry | # Population | % Population |
| Afghan | 12 | 0.0% |
| African | 12 | 0.0% |
| American | 2,089 | 5.3% |
| Arab | 865 | 2.2% |
| Argentinean | 1,437 | 3.6% |
| Armenian | 9 | 0.0% |
| Australian | 30 | 0.1% |
| Austrian | 254 | 0.6% |
| Basque | 9 | 0.0% |
| Belgian | 12 | 0.0% |
| Belizean | 11 | 0.0% |
| Bhutanese | 47 | 0.1% |
| Bolivian | 83 | 0.2% |
| Brazilian | 1,051 | 2.6% |
| British | 81 | 0.2% |
| Bulgarian | 16 | 0.0% |
| Burmese | 76 | 0.2% |
| Canadian | 219 | 0.5% |
| Central American | 916 | 2.3% |
| Central American Indian | 33 | 0.1% |
| Cherokee | 45 | 0.1% |
| Chilean | 277 | 0.7% |
| Colombian | 4,132 | 10.4% |
| Costa Rican | 76 | 0.2% |
| Creek | 16 | 0.0% |
| Croatian | 14 | 0.0% |
| Cuban | 2,812 | 7.1% |
| Cypriot | 12 | 0.0% |
| Czech | 21 | 0.1% |
| Danish | 20 | 0.1% |
| Dominican | 529 | 1.3% |
| Dutch | 79 | 0.2% |
| Eastern European | 941 | 2.4% |
| Ecuadorian | 216 | 0.5% |
| Egyptian | 36 | 0.1% |
| English | 513 | 1.3% |
| European | 1,099 | 2.8% |
| Filipino | 39 | 0.1% |
| Finnish | 17 | 0.0% |
| French | 610 | 1.5% |
| French Canadian | 12 | 0.0% |
| German | 1,482 | 3.7% |
| Greek | 122 | 0.3% |
| Guatemalan | 316 | 0.8% |
| Haitian | 36 | 0.1% |
| Honduran | 129 | 0.3% |
| Hungarian | 352 | 0.9% |
| Indian (Asian) | 256 | 0.6% |
| Iranian | 180 | 0.4% |
| Iraqi | 37 | 0.1% |
| Irish | 453 | 1.1% |
| Israeli | 1,332 | 3.4% |
| Italian | 2,203 | 5.6% |
| Jamaican | 7 | 0.0% |
| Jordanian | 17 | 0.0% |
| Korean | 124 | 0.3% |
| Latvian | 118 | 0.3% |
| Lebanese | 174 | 0.4% |
| Lithuanian | 87 | 0.2% |
| Maltese | 41 | 0.1% |
| Mexican | 1,281 | 3.2% |
| Moroccan | 192 | 0.5% |
| Nicaraguan | 20 | 0.1% |
| Northern European | 50 | 0.1% |
| Norwegian | 52 | 0.1% |
| Palestinian | 22 | 0.1% |
| Panamanian | 375 | 0.9% |
| Paraguayan | 28 | 0.1% |
| Peruvian | 1,038 | 2.6% |
| Polish | 2,445 | 6.2% |
| Portuguese | 408 | 1.0% |
| Puerto Rican | 870 | 2.2% |
| Romanian | 857 | 2.2% |
| Russian | 2,610 | 6.6% |
| Scotch-Irish | 97 | 0.2% |
| Scottish | 203 | 0.5% |
| Serbian | 100 | 0.3% |
| Slovak | 7 | 0.0% |
| Slovene | 66 | 0.2% |
| South African | 477 | 1.2% |
| South American | 10,302 | 26.0% |
| South American Indian | 27 | 0.1% |
| Spaniard | 336 | 0.9% |
| Spanish | 239 | 0.6% |
| Sri Lankan | 188 | 0.5% |
| Subsaharan African | 489 | 1.2% |
| Swedish | 169 | 0.4% |
| Swiss | 154 | 0.4% |
| Syrian | 133 | 0.3% |
| Thai | 237 | 0.6% |
| Trinidadian and Tobagonian | 81 | 0.2% |
| Turkish | 279 | 0.7% |
| Ukrainian | 741 | 1.9% |
| Uruguayan | 213 | 0.5% |
| Venezuelan | 2,878 | 7.3% |
| Welsh | 79 | 0.2% |
| Yugoslavian | 44 | 0.1% | View All 97 Rows |
Immigrants in Aventura
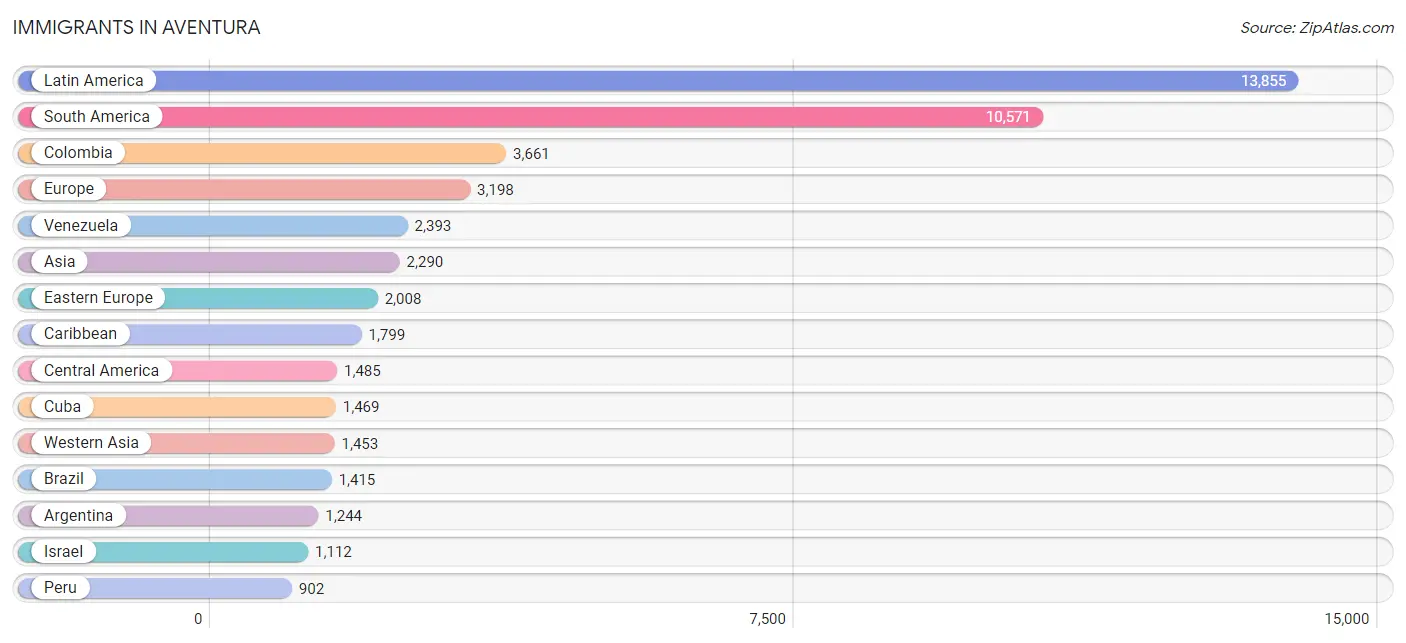
The most numerous immigrant groups reported in Aventura came from Latin America (13,855 | 35.0%), South America (10,571 | 26.7%), Colombia (3,661 | 9.2%), Europe (3,198 | 8.1%), and Venezuela (2,393 | 6.0%), together accounting for 85.0% of all Aventura residents.
| Immigration Origin | # Population | % Population |
| Afghanistan | 12 | 0.0% |
| Africa | 726 | 1.8% |
| Argentina | 1,244 | 3.1% |
| Asia | 2,290 | 5.8% |
| Austria | 54 | 0.1% |
| Belarus | 70 | 0.2% |
| Belgium | 12 | 0.0% |
| Bolivia | 97 | 0.2% |
| Bosnia and Herzegovina | 9 | 0.0% |
| Brazil | 1,415 | 3.6% |
| Bulgaria | 12 | 0.0% |
| Canada | 292 | 0.7% |
| Caribbean | 1,799 | 4.5% |
| Central America | 1,485 | 3.7% |
| Chile | 404 | 1.0% |
| China | 220 | 0.6% |
| Colombia | 3,661 | 9.2% |
| Costa Rica | 102 | 0.3% |
| Croatia | 9 | 0.0% |
| Cuba | 1,469 | 3.7% |
| Czechoslovakia | 7 | 0.0% |
| Denmark | 26 | 0.1% |
| Dominican Republic | 222 | 0.6% |
| Eastern Africa | 14 | 0.0% |
| Eastern Asia | 281 | 0.7% |
| Eastern Europe | 2,008 | 5.1% |
| Ecuador | 259 | 0.6% |
| Egypt | 17 | 0.0% |
| El Salvador | 23 | 0.1% |
| Ethiopia | 14 | 0.0% |
| Europe | 3,198 | 8.1% |
| France | 313 | 0.8% |
| Germany | 222 | 0.6% |
| Greece | 37 | 0.1% |
| Guatemala | 239 | 0.6% |
| Haiti | 63 | 0.2% |
| Honduras | 129 | 0.3% |
| Hong Kong | 44 | 0.1% |
| Hungary | 96 | 0.2% |
| India | 134 | 0.3% |
| Iran | 99 | 0.3% |
| Iraq | 28 | 0.1% |
| Israel | 1,112 | 2.8% |
| Italy | 137 | 0.4% |
| Jamaica | 7 | 0.0% |
| Jordan | 17 | 0.0% |
| Kazakhstan | 107 | 0.3% |
| Korea | 61 | 0.2% |
| Latin America | 13,855 | 35.0% |
| Latvia | 50 | 0.1% |
| Mexico | 595 | 1.5% |
| Middle Africa | 11 | 0.0% |
| Moldova | 117 | 0.3% |
| Morocco | 172 | 0.4% |
| Nicaragua | 20 | 0.1% |
| Northern Africa | 199 | 0.5% |
| Northern Europe | 105 | 0.3% |
| Panama | 377 | 0.9% |
| Peru | 902 | 2.3% |
| Philippines | 84 | 0.2% |
| Poland | 79 | 0.2% |
| Portugal | 18 | 0.1% |
| Romania | 306 | 0.8% |
| Russia | 642 | 1.6% |
| Serbia | 62 | 0.2% |
| Singapore | 51 | 0.1% |
| South Africa | 502 | 1.3% |
| South America | 10,571 | 26.7% |
| South Central Asia | 394 | 1.0% |
| South Eastern Asia | 162 | 0.4% |
| Southern Europe | 377 | 0.9% |
| Spain | 185 | 0.5% |
| Sweden | 34 | 0.1% |
| Switzerland | 107 | 0.3% |
| Syria | 13 | 0.0% |
| Trinidad and Tobago | 38 | 0.1% |
| Turkey | 194 | 0.5% |
| Ukraine | 440 | 1.1% |
| Uruguay | 168 | 0.4% |
| Uzbekistan | 26 | 0.1% |
| Venezuela | 2,393 | 6.0% |
| Vietnam | 27 | 0.1% |
| Western Asia | 1,453 | 3.7% |
| Western Europe | 708 | 1.8% |
| Zaire | 11 | 0.0% | View All 85 Rows |
Sex and Age in Aventura
Sex and Age in Aventura
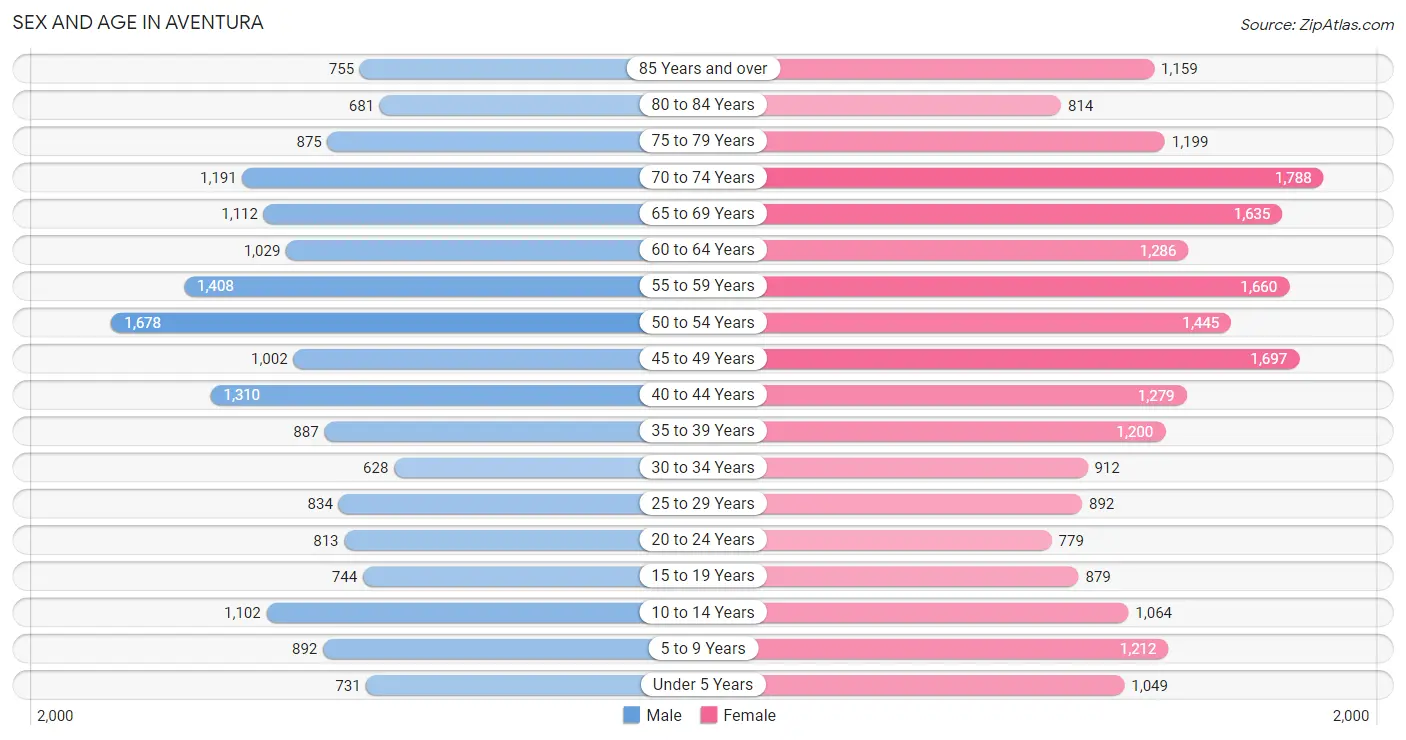
The most populous age groups in Aventura are 50 to 54 Years (1,678 | 9.5%) for men and 70 to 74 Years (1,788 | 8.2%) for women.
| Age Bracket | Male | Female |
| Under 5 Years | 731 (4.1%) | 1,049 (4.8%) |
| 5 to 9 Years | 892 (5.1%) | 1,212 (5.5%) |
| 10 to 14 Years | 1,102 (6.2%) | 1,064 (4.9%) |
| 15 to 19 Years | 744 (4.2%) | 879 (4.0%) |
| 20 to 24 Years | 813 (4.6%) | 779 (3.5%) |
| 25 to 29 Years | 834 (4.7%) | 892 (4.1%) |
| 30 to 34 Years | 628 (3.5%) | 912 (4.2%) |
| 35 to 39 Years | 887 (5.0%) | 1,200 (5.5%) |
| 40 to 44 Years | 1,310 (7.4%) | 1,279 (5.8%) |
| 45 to 49 Years | 1,002 (5.7%) | 1,697 (7.7%) |
| 50 to 54 Years | 1,678 (9.5%) | 1,445 (6.6%) |
| 55 to 59 Years | 1,408 (8.0%) | 1,660 (7.6%) |
| 60 to 64 Years | 1,029 (5.8%) | 1,286 (5.9%) |
| 65 to 69 Years | 1,112 (6.3%) | 1,635 (7.4%) |
| 70 to 74 Years | 1,191 (6.7%) | 1,788 (8.2%) |
| 75 to 79 Years | 875 (5.0%) | 1,199 (5.5%) |
| 80 to 84 Years | 681 (3.8%) | 814 (3.7%) |
| 85 Years and over | 755 (4.3%) | 1,159 (5.3%) |
| Total | 17,672 (100.0%) | 21,949 (100.0%) |
Families and Households in Aventura
Median Family Size in Aventura
The median family size in Aventura is 2.87 persons per family, with married-couple families (8,041 | 76.9%) accounting for the largest median family size of 2.95 persons per family. On the other hand, single male/father families (856 | 8.2%) represent the smallest median family size with 2.26 persons per family.

| Family Type | # Families | Family Size |
| Married-Couple | 8,041 (76.9%) | 2.95 |
| Single Male/Father | 856 (8.2%) | 2.26 |
| Single Female/Mother | 1,560 (14.9%) | 2.75 |
| Total Families | 10,457 (100.0%) | 2.87 |
Median Household Size in Aventura
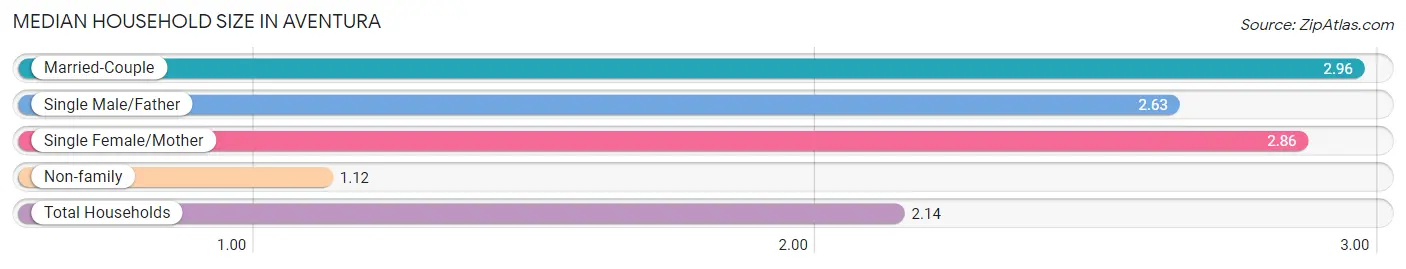
The median household size in Aventura is 2.14 persons per household, with married-couple households (8,041 | 43.7%) accounting for the largest median household size of 2.96 persons per household. non-family households (7,946 | 43.2%) represent the smallest median household size with 1.12 persons per household.
| Household Type | # Households | Household Size |
| Married-Couple | 8,041 (43.7%) | 2.96 |
| Single Male/Father | 856 (4.6%) | 2.63 |
| Single Female/Mother | 1,560 (8.5%) | 2.86 |
| Non-family | 7,946 (43.2%) | 1.12 |
| Total Households | 18,403 (100.0%) | 2.14 |
Household Size by Marriage Status in Aventura
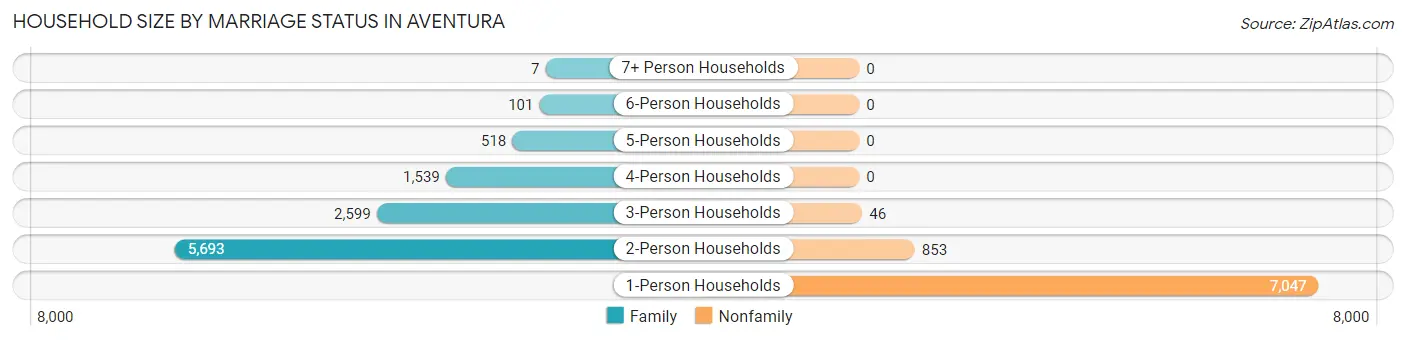
Out of a total of 18,403 households in Aventura, 10,457 (56.8%) are family households, while 7,946 (43.2%) are nonfamily households. The most numerous type of family households are 2-person households, comprising 5,693, and the most common type of nonfamily households are 1-person households, comprising 7,047.
| Household Size | Family Households | Nonfamily Households |
| 1-Person Households | - | 7,047 (38.3%) |
| 2-Person Households | 5,693 (30.9%) | 853 (4.6%) |
| 3-Person Households | 2,599 (14.1%) | 46 (0.3%) |
| 4-Person Households | 1,539 (8.4%) | 0 (0.0%) |
| 5-Person Households | 518 (2.8%) | 0 (0.0%) |
| 6-Person Households | 101 (0.5%) | 0 (0.0%) |
| 7+ Person Households | 7 (0.0%) | 0 (0.0%) |
| Total | 10,457 (56.8%) | 7,946 (43.2%) |
Female Fertility in Aventura
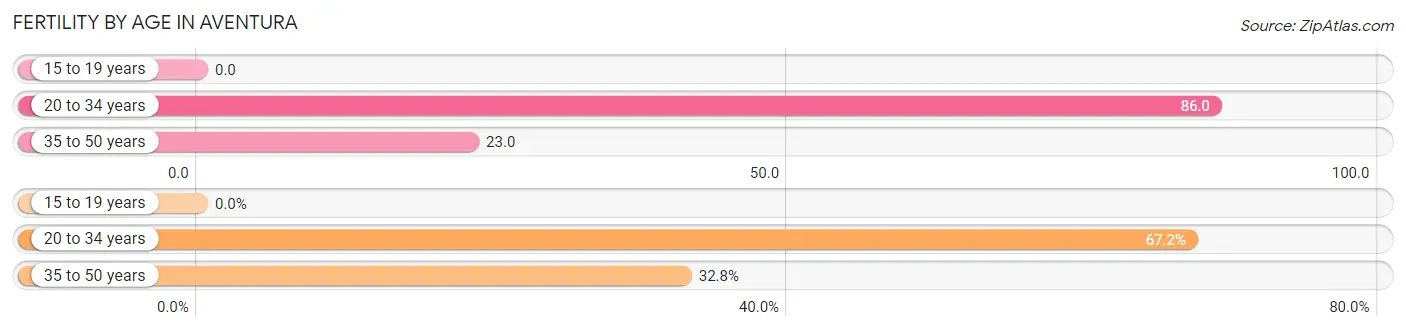
Fertility by Age in Aventura
Average fertility rate in Aventura is 41.0 births per 1,000 women. Women in the age bracket of 20 to 34 years have the highest fertility rate with 86.0 births per 1,000 women. Women in the age bracket of 20 to 34 years acount for 67.2% of all women with births.
| Age Bracket | Women with Births | Births / 1,000 Women |
| 15 to 19 years | 0 (0.0%) | 0.0 |
| 20 to 34 years | 223 (67.2%) | 86.0 |
| 35 to 50 years | 109 (32.8%) | 23.0 |
| Total | 332 (100.0%) | 41.0 |
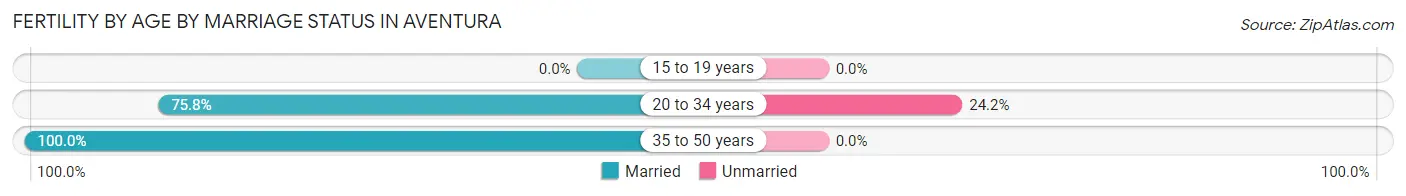
Fertility by Age by Marriage Status in Aventura
83.7% of women with births (332) in Aventura are married. The highest percentage of unmarried women with births falls into 20 to 34 years age bracket with 24.2% of them unmarried at the time of birth, while the lowest percentage of unmarried women with births belong to 35 to 50 years age bracket with 0.0% of them unmarried.
| Age Bracket | Married | Unmarried |
| 15 to 19 years | 0 (0.0%) | 0 (0.0%) |
| 20 to 34 years | 169 (75.8%) | 54 (24.2%) |
| 35 to 50 years | 109 (100.0%) | 0 (0.0%) |
| Total | 278 (83.7%) | 54 (16.3%) |
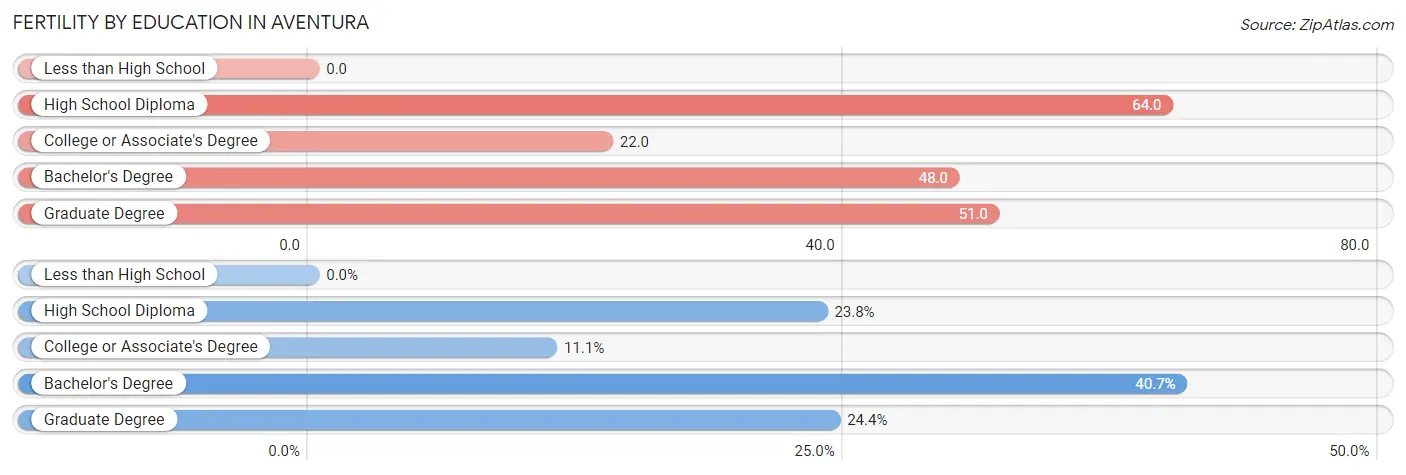
Fertility by Education in Aventura
| Educational Attainment | Women with Births | Births / 1,000 Women |
| Less than High School | 0 (0.0%) | 0.0 |
| High School Diploma | 79 (23.8%) | 64.0 |
| College or Associate's Degree | 37 (11.1%) | 22.0 |
| Bachelor's Degree | 135 (40.7%) | 48.0 |
| Graduate Degree | 81 (24.4%) | 51.0 |
| Total | 332 (100.0%) | 41.0 |
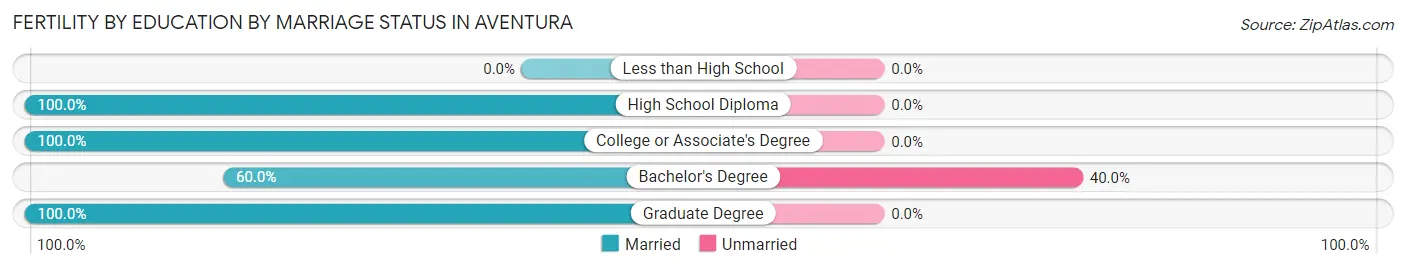
Fertility by Education by Marriage Status in Aventura
16.3% of women with births in Aventura are unmarried. Women with the educational attainment of high school diploma are most likely to be married with 100.0% of them married at childbirth, while women with the educational attainment of bachelor's degree are least likely to be married with 40.0% of them unmarried at childbirth.
| Educational Attainment | Married | Unmarried |
| Less than High School | 0 (0.0%) | 0 (0.0%) |
| High School Diploma | 79 (100.0%) | 0 (0.0%) |
| College or Associate's Degree | 37 (100.0%) | 0 (0.0%) |
| Bachelor's Degree | 81 (60.0%) | 54 (40.0%) |
| Graduate Degree | 81 (100.0%) | 0 (0.0%) |
| Total | 278 (83.7%) | 54 (16.3%) |
Employment Characteristics in Aventura
Employment by Class of Employer in Aventura
Among the 17,102 employed individuals in Aventura, private company employees (11,059 | 64.7%), self-employed (incorporated) (2,157 | 12.6%), and self-employed (not incorporated) (1,499 | 8.8%) make up the most common classes of employment.
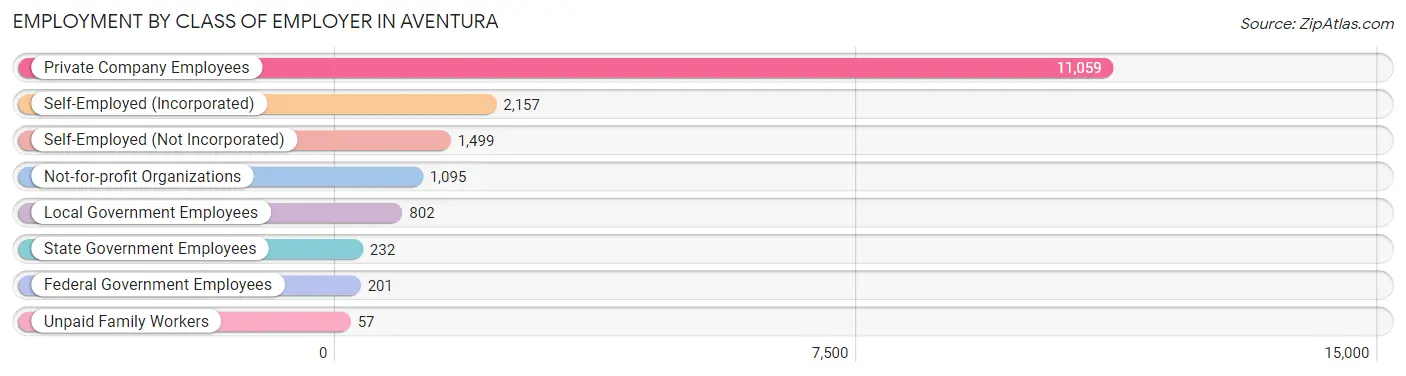
| Employer Class | # Employees | % Employees |
| Private Company Employees | 11,059 | 64.7% |
| Self-Employed (Incorporated) | 2,157 | 12.6% |
| Self-Employed (Not Incorporated) | 1,499 | 8.8% |
| Not-for-profit Organizations | 1,095 | 6.4% |
| Local Government Employees | 802 | 4.7% |
| State Government Employees | 232 | 1.4% |
| Federal Government Employees | 201 | 1.2% |
| Unpaid Family Workers | 57 | 0.3% |
| Total | 17,102 | 100.0% |
Employment Status by Age in Aventura
According to the labor force statistics for Aventura, out of the total population over 16 years of age (33,218), 55.2% or 18,336 individuals are in the labor force, with 4.8% or 880 of them unemployed. The age group with the highest labor force participation rate is 30 to 34 years, with 85.6% or 1,318 individuals in the labor force. Within the labor force, the 16 to 19 years age range has the highest percentage of unemployed individuals, with 45.5% or 145 of them being unemployed.
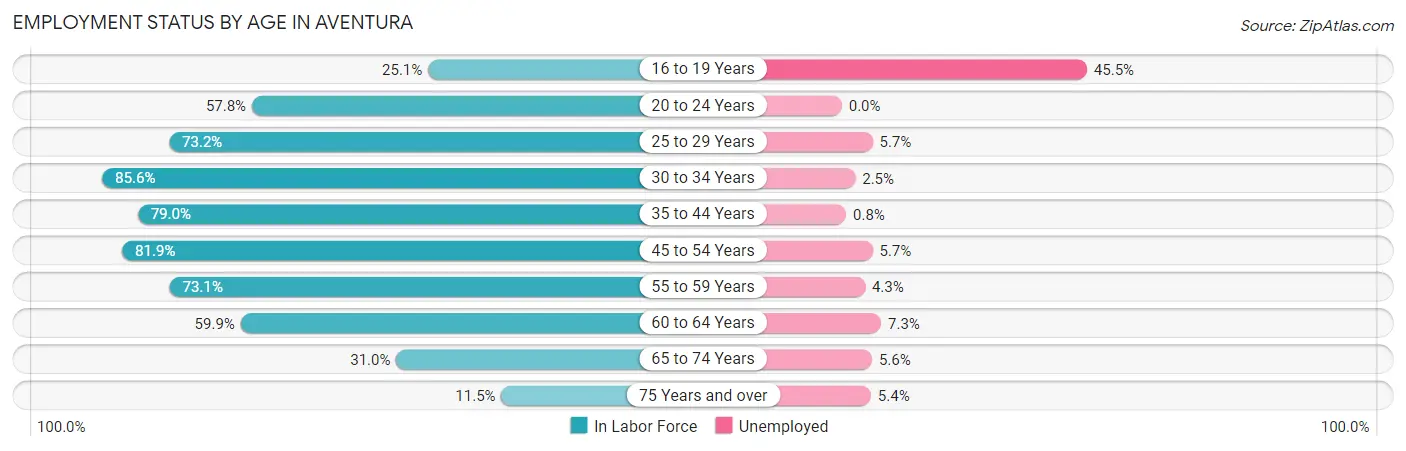
| Age Bracket | In Labor Force | Unemployed |
| 16 to 19 Years | 319 (25.1%) | 145 (45.5%) |
| 20 to 24 Years | 920 (57.8%) | 0 (0.0%) |
| 25 to 29 Years | 1,263 (73.2%) | 72 (5.7%) |
| 30 to 34 Years | 1,318 (85.6%) | 33 (2.5%) |
| 35 to 44 Years | 3,694 (79.0%) | 30 (0.8%) |
| 45 to 54 Years | 4,768 (81.9%) | 272 (5.7%) |
| 55 to 59 Years | 2,243 (73.1%) | 96 (4.3%) |
| 60 to 64 Years | 1,387 (59.9%) | 101 (7.3%) |
| 65 to 74 Years | 1,775 (31.0%) | 99 (5.6%) |
| 75 Years and over | 631 (11.5%) | 34 (5.4%) |
| Total | 18,336 (55.2%) | 880 (4.8%) |
Employment Status by Educational Attainment in Aventura
According to labor force statistics for Aventura, 76.7% of individuals (14,686) out of the total population between 25 and 64 years of age (19,147) are in the labor force, with 4.1% or 602 of them being unemployed. The group with the highest labor force participation rate are those with the educational attainment of bachelor's degree or higher, with 79.2% or 9,121 individuals in the labor force. Within the labor force, individuals with less than high school education have the highest percentage of unemployment, with 11.0% or 44 of them being unemployed.
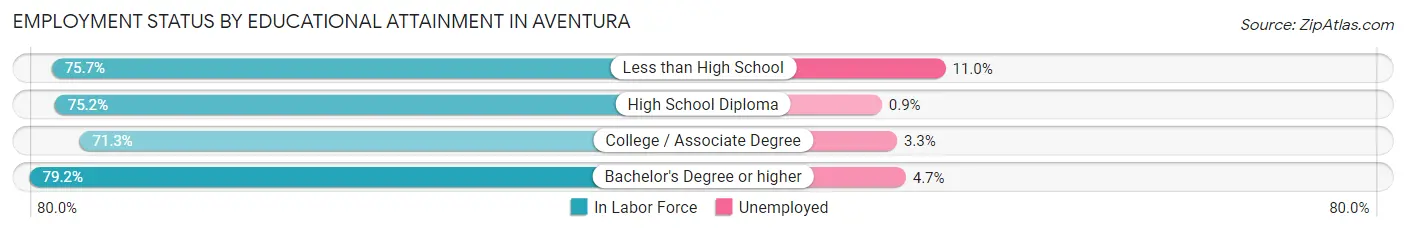
| Educational Attainment | In Labor Force | Unemployed |
| Less than High School | 401 (75.7%) | 58 (11.0%) |
| High School Diploma | 1,676 (75.2%) | 20 (0.9%) |
| College / Associate Degree | 3,473 (71.3%) | 161 (3.3%) |
| Bachelor's Degree or higher | 9,121 (79.2%) | 541 (4.7%) |
| Total | 14,686 (76.7%) | 785 (4.1%) |
Employment Occupations by Sex in Aventura
Management, Business, Science and Arts Occupations
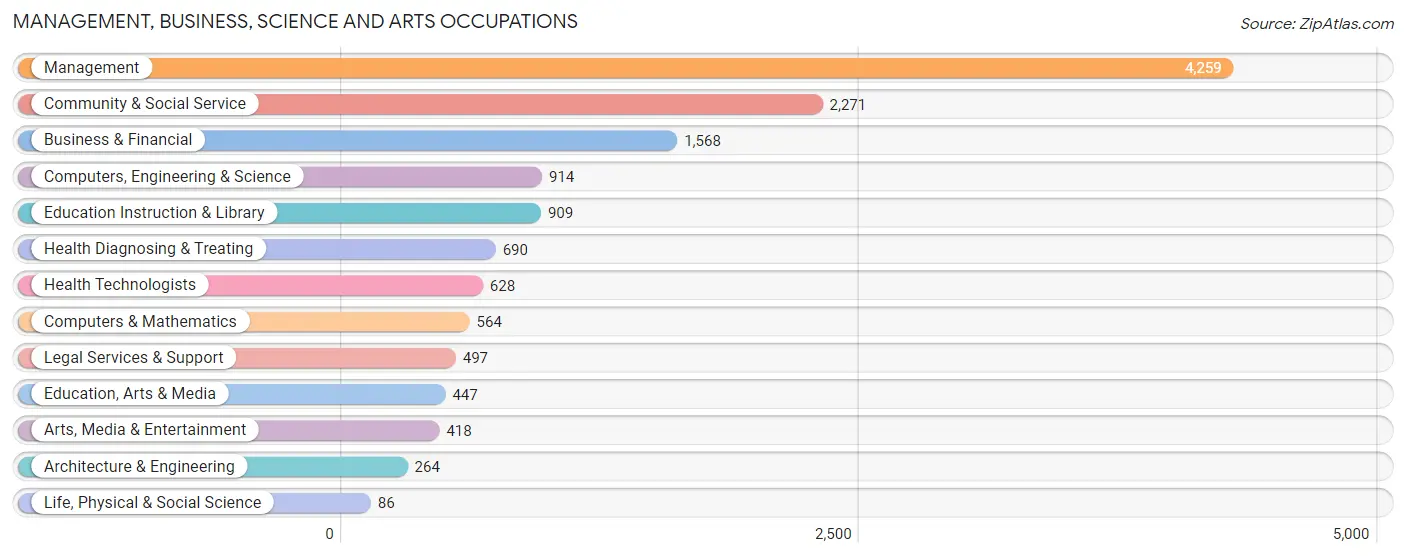
The most common Management, Business, Science and Arts occupations in Aventura are Management (4,259 | 24.4%), Community & Social Service (2,271 | 13.0%), Business & Financial (1,568 | 9.0%), Computers, Engineering & Science (914 | 5.2%), and Education Instruction & Library (909 | 5.2%).
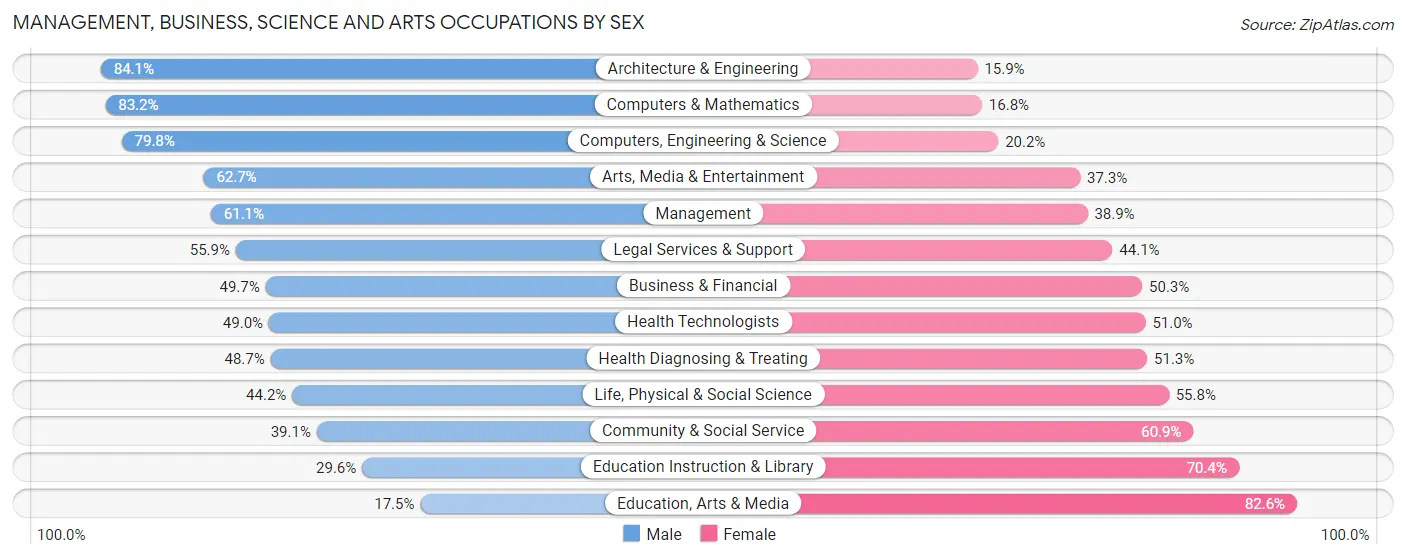
Management, Business, Science and Arts Occupations by Sex
Within the Management, Business, Science and Arts occupations in Aventura, the most male-oriented occupations are Architecture & Engineering (84.1%), Computers & Mathematics (83.2%), and Computers, Engineering & Science (79.8%), while the most female-oriented occupations are Education, Arts & Media (82.6%), Education Instruction & Library (70.4%), and Community & Social Service (60.9%).
| Occupation | Male | Female |
| Management | 2,604 (61.1%) | 1,655 (38.9%) |
| Business & Financial | 780 (49.7%) | 788 (50.3%) |
| Computers, Engineering & Science | 729 (79.8%) | 185 (20.2%) |
| Computers & Mathematics | 469 (83.2%) | 95 (16.8%) |
| Architecture & Engineering | 222 (84.1%) | 42 (15.9%) |
| Life, Physical & Social Science | 38 (44.2%) | 48 (55.8%) |
| Community & Social Service | 887 (39.1%) | 1,384 (60.9%) |
| Education, Arts & Media | 78 (17.4%) | 369 (82.6%) |
| Legal Services & Support | 278 (55.9%) | 219 (44.1%) |
| Education Instruction & Library | 269 (29.6%) | 640 (70.4%) |
| Arts, Media & Entertainment | 262 (62.7%) | 156 (37.3%) |
| Health Diagnosing & Treating | 336 (48.7%) | 354 (51.3%) |
| Health Technologists | 308 (49.0%) | 320 (51.0%) |
| Total (Category) | 5,336 (55.0%) | 4,366 (45.0%) |
| Total (Overall) | 9,508 (54.5%) | 7,933 (45.5%) |
Services Occupations
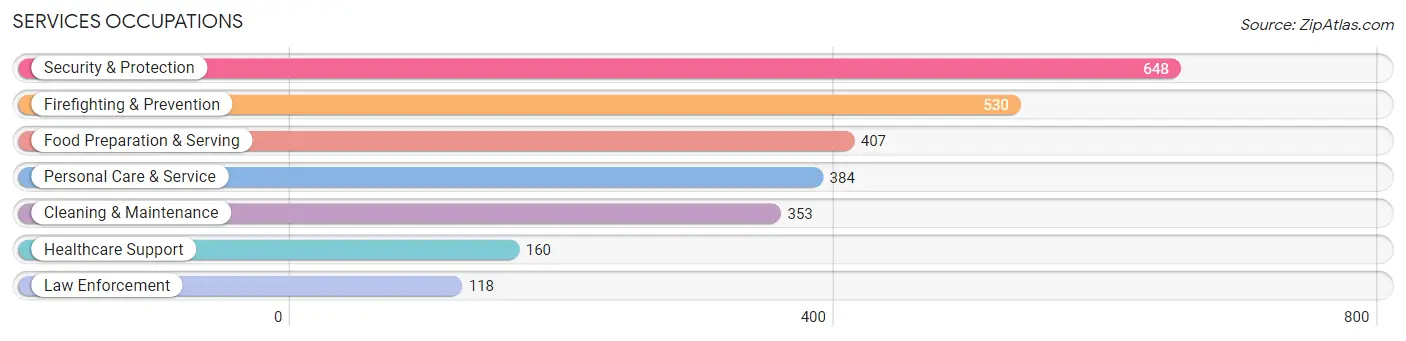
The most common Services occupations in Aventura are Security & Protection (648 | 3.7%), Firefighting & Prevention (530 | 3.0%), Food Preparation & Serving (407 | 2.3%), Personal Care & Service (384 | 2.2%), and Cleaning & Maintenance (353 | 2.0%).
Services Occupations by Sex
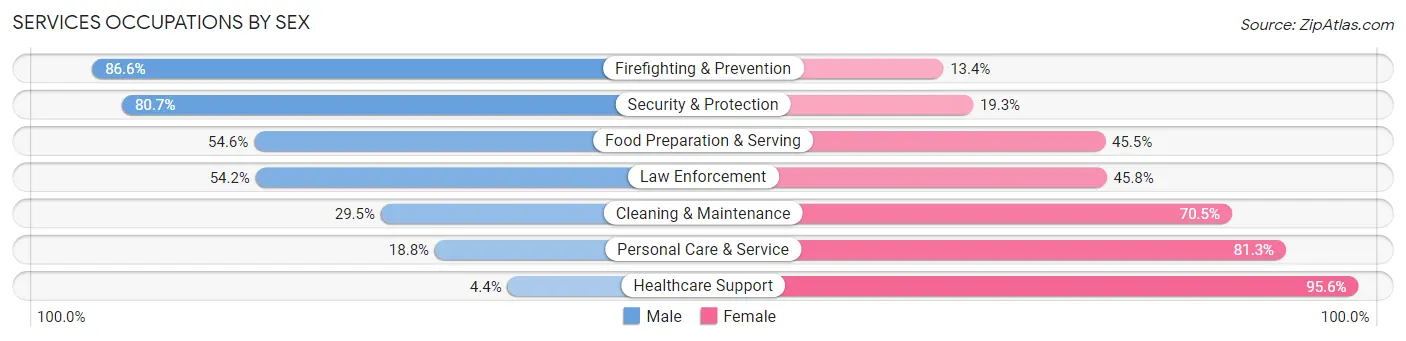
Within the Services occupations in Aventura, the most male-oriented occupations are Firefighting & Prevention (86.6%), Security & Protection (80.7%), and Food Preparation & Serving (54.5%), while the most female-oriented occupations are Healthcare Support (95.6%), Personal Care & Service (81.2%), and Cleaning & Maintenance (70.5%).
| Occupation | Male | Female |
| Healthcare Support | 7 (4.4%) | 153 (95.6%) |
| Security & Protection | 523 (80.7%) | 125 (19.3%) |
| Firefighting & Prevention | 459 (86.6%) | 71 (13.4%) |
| Law Enforcement | 64 (54.2%) | 54 (45.8%) |
| Food Preparation & Serving | 222 (54.5%) | 185 (45.5%) |
| Cleaning & Maintenance | 104 (29.5%) | 249 (70.5%) |
| Personal Care & Service | 72 (18.8%) | 312 (81.2%) |
| Total (Category) | 928 (47.5%) | 1,024 (52.5%) |
| Total (Overall) | 9,508 (54.5%) | 7,933 (45.5%) |
Sales and Office Occupations
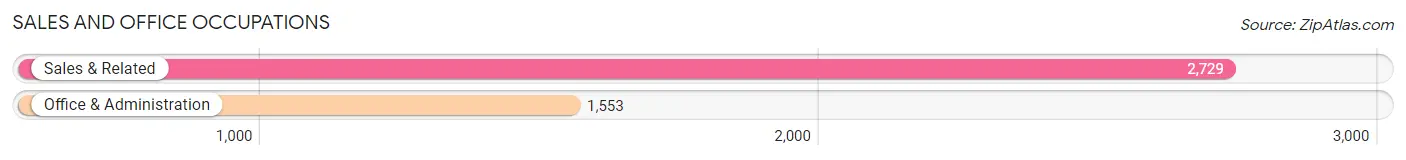
The most common Sales and Office occupations in Aventura are Sales & Related (2,729 | 15.7%), and Office & Administration (1,553 | 8.9%).
Sales and Office Occupations by Sex
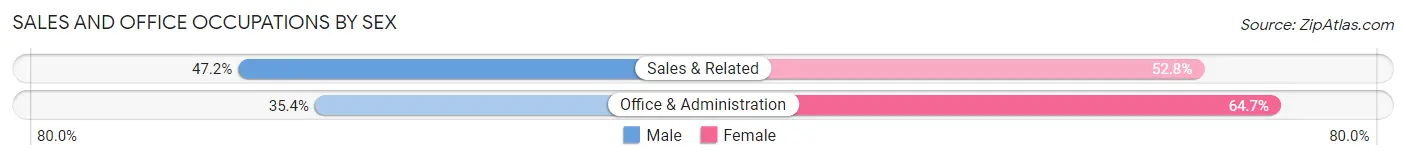
| Occupation | Male | Female |
| Sales & Related | 1,287 (47.2%) | 1,442 (52.8%) |
| Office & Administration | 549 (35.3%) | 1,004 (64.6%) |
| Total (Category) | 1,836 (42.9%) | 2,446 (57.1%) |
| Total (Overall) | 9,508 (54.5%) | 7,933 (45.5%) |
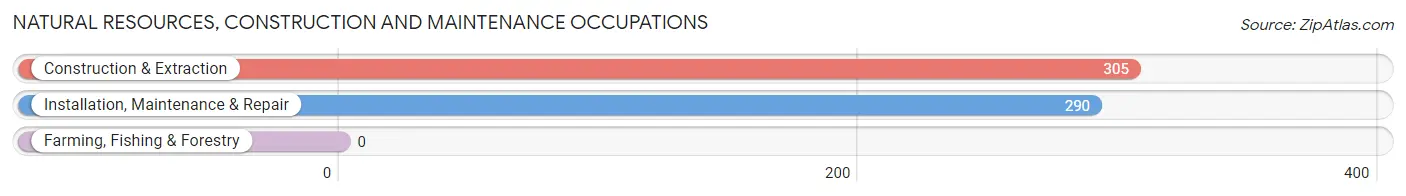
Natural Resources, Construction and Maintenance Occupations
The most common Natural Resources, Construction and Maintenance occupations in Aventura are Construction & Extraction (305 | 1.8%), and Installation, Maintenance & Repair (290 | 1.7%).
Natural Resources, Construction and Maintenance Occupations by Sex
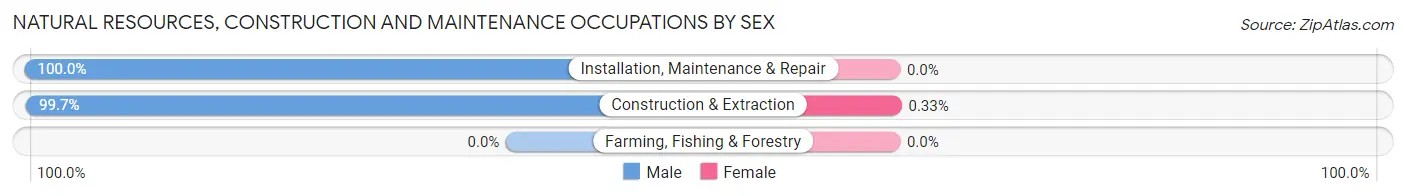
| Occupation | Male | Female |
| Farming, Fishing & Forestry | 0 (0.0%) | 0 (0.0%) |
| Construction & Extraction | 304 (99.7%) | 1 (0.3%) |
| Installation, Maintenance & Repair | 290 (100.0%) | 0 (0.0%) |
| Total (Category) | 594 (99.8%) | 1 (0.2%) |
| Total (Overall) | 9,508 (54.5%) | 7,933 (45.5%) |
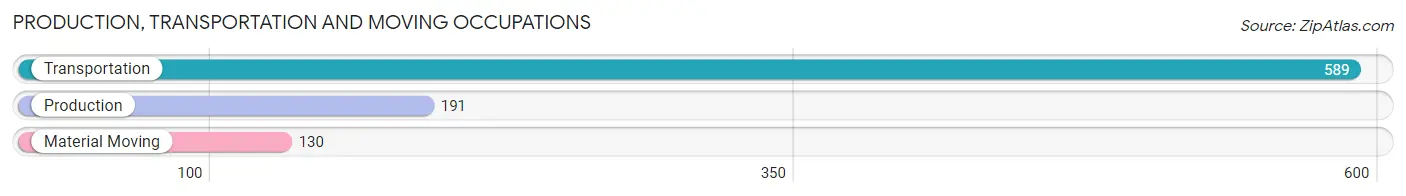
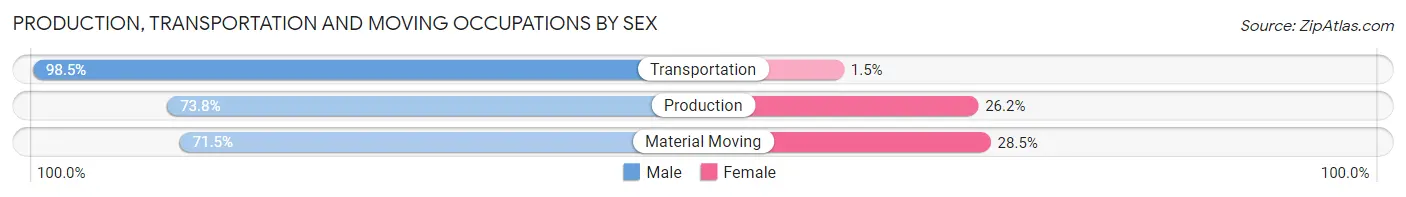
Production, Transportation and Moving Occupations
The most common Production, Transportation and Moving occupations in Aventura are Transportation (589 | 3.4%), Production (191 | 1.1%), and Material Moving (130 | 0.7%).
Production, Transportation and Moving Occupations by Sex
| Occupation | Male | Female |
| Production | 141 (73.8%) | 50 (26.2%) |
| Transportation | 580 (98.5%) | 9 (1.5%) |
| Material Moving | 93 (71.5%) | 37 (28.5%) |
| Total (Category) | 814 (89.4%) | 96 (10.5%) |
| Total (Overall) | 9,508 (54.5%) | 7,933 (45.5%) |
Employment Industries by Sex in Aventura
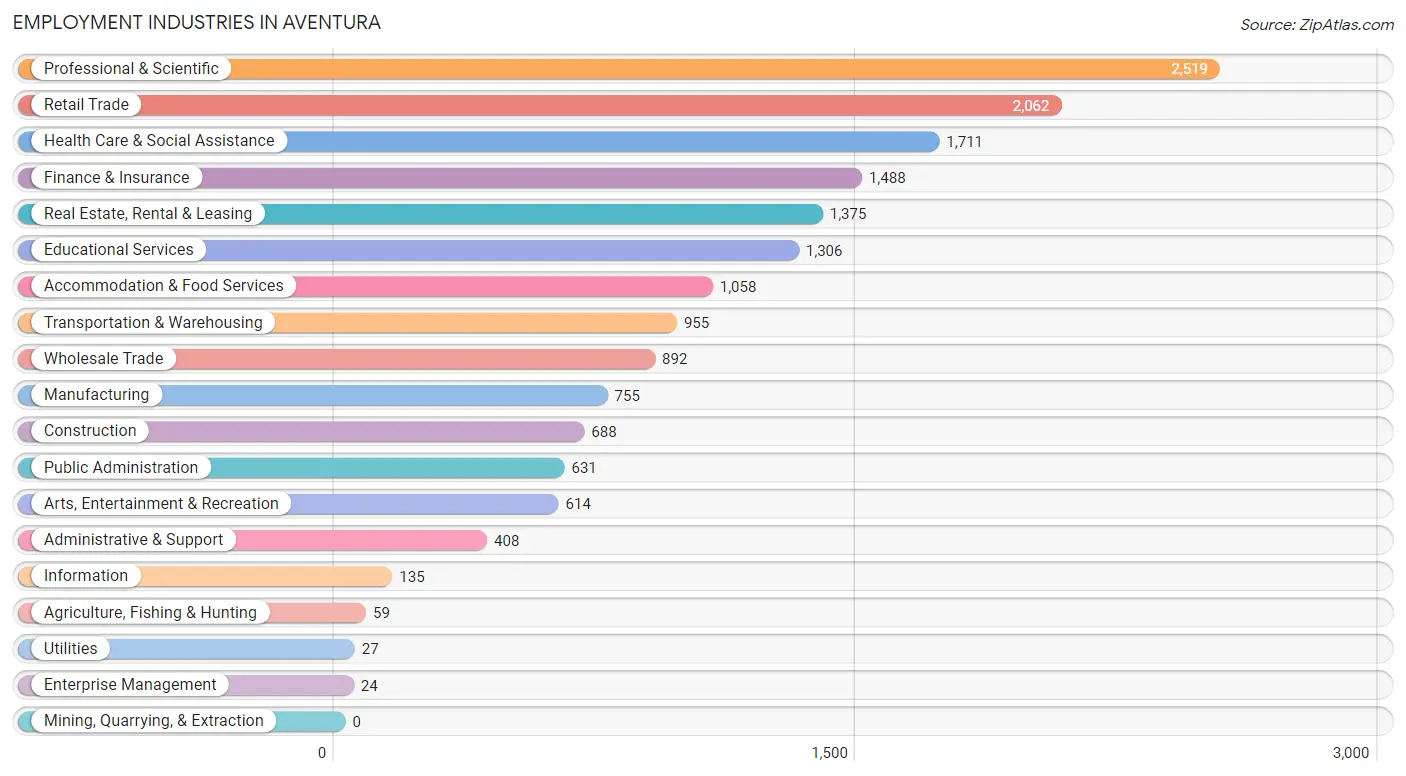
Employment Industries in Aventura
The major employment industries in Aventura include Professional & Scientific (2,519 | 14.4%), Retail Trade (2,062 | 11.8%), Health Care & Social Assistance (1,711 | 9.8%), Finance & Insurance (1,488 | 8.5%), and Real Estate, Rental & Leasing (1,375 | 7.9%).
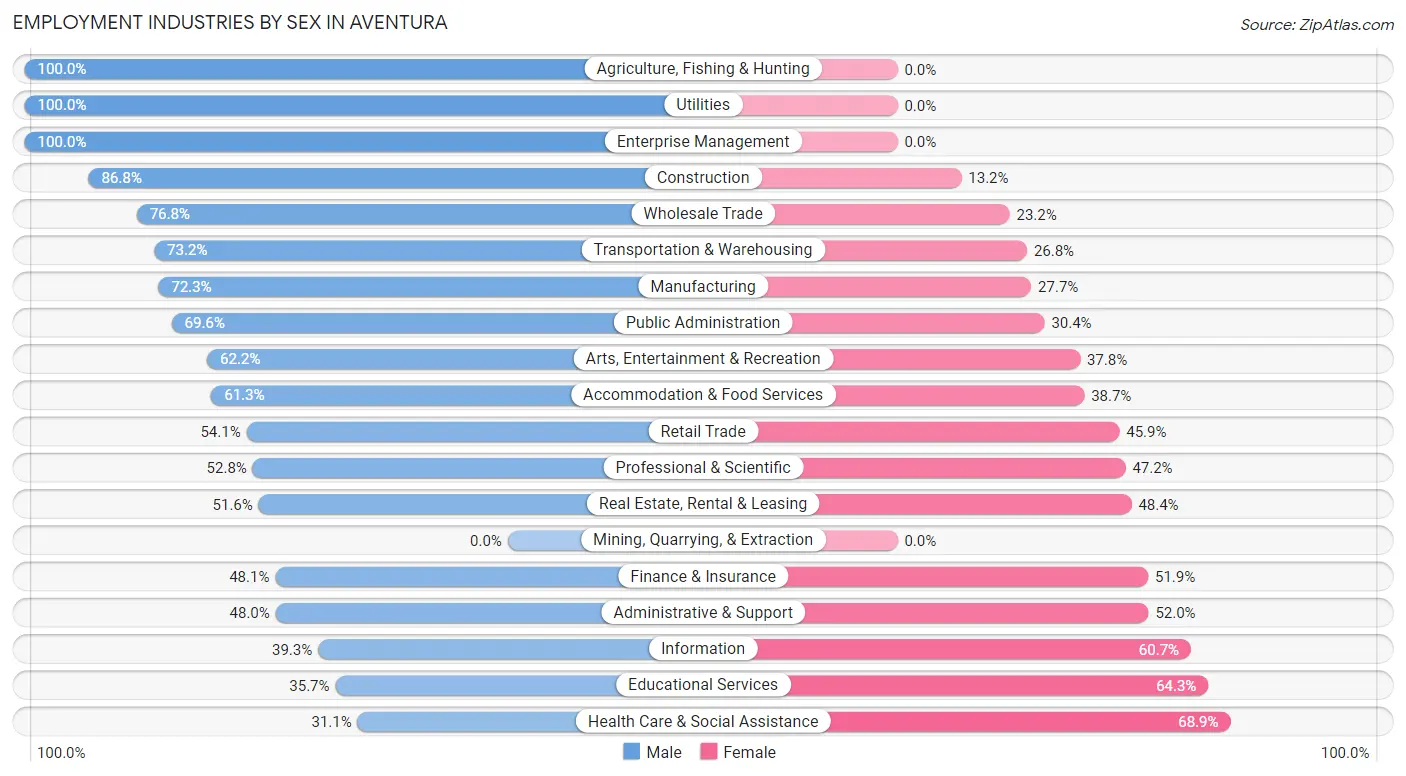
Employment Industries by Sex in Aventura
The Aventura industries that see more men than women are Agriculture, Fishing & Hunting (100.0%), Utilities (100.0%), and Enterprise Management (100.0%), whereas the industries that tend to have a higher number of women are Health Care & Social Assistance (68.9%), Educational Services (64.3%), and Information (60.7%).
| Industry | Male | Female |
| Agriculture, Fishing & Hunting | 59 (100.0%) | 0 (0.0%) |
| Mining, Quarrying, & Extraction | 0 (0.0%) | 0 (0.0%) |
| Construction | 597 (86.8%) | 91 (13.2%) |
| Manufacturing | 546 (72.3%) | 209 (27.7%) |
| Wholesale Trade | 685 (76.8%) | 207 (23.2%) |
| Retail Trade | 1,115 (54.1%) | 947 (45.9%) |
| Transportation & Warehousing | 699 (73.2%) | 256 (26.8%) |
| Utilities | 27 (100.0%) | 0 (0.0%) |
| Information | 53 (39.3%) | 82 (60.7%) |
| Finance & Insurance | 716 (48.1%) | 772 (51.9%) |
| Real Estate, Rental & Leasing | 709 (51.6%) | 666 (48.4%) |
| Professional & Scientific | 1,330 (52.8%) | 1,189 (47.2%) |
| Enterprise Management | 24 (100.0%) | 0 (0.0%) |
| Administrative & Support | 196 (48.0%) | 212 (52.0%) |
| Educational Services | 466 (35.7%) | 840 (64.3%) |
| Health Care & Social Assistance | 532 (31.1%) | 1,179 (68.9%) |
| Arts, Entertainment & Recreation | 382 (62.2%) | 232 (37.8%) |
| Accommodation & Food Services | 649 (61.3%) | 409 (38.7%) |
| Public Administration | 439 (69.6%) | 192 (30.4%) |
| Total | 9,508 (54.5%) | 7,933 (45.5%) |
Education in Aventura
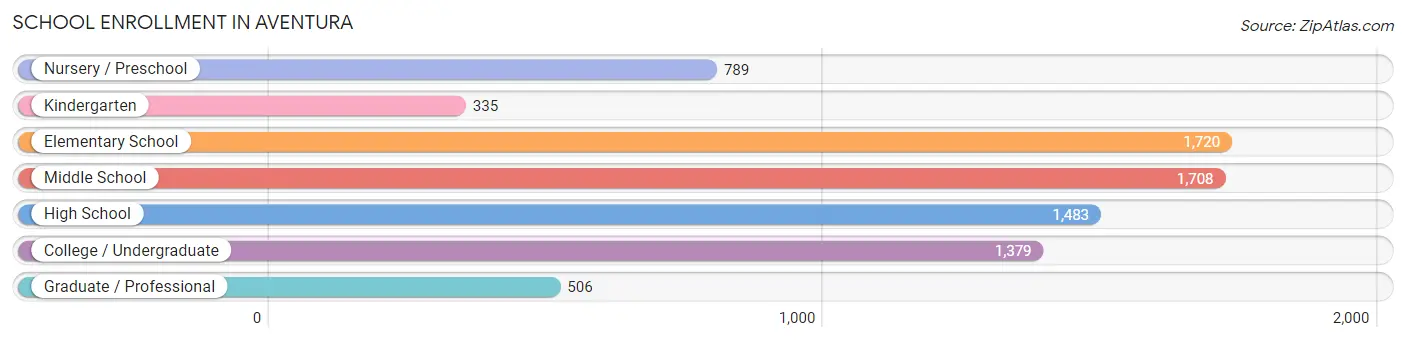
School Enrollment in Aventura
The most common levels of schooling among the 7,920 students in Aventura are elementary school (1,720 | 21.7%), middle school (1,708 | 21.6%), and high school (1,483 | 18.7%).
| School Level | # Students | % Students |
| Nursery / Preschool | 789 | 10.0% |
| Kindergarten | 335 | 4.2% |
| Elementary School | 1,720 | 21.7% |
| Middle School | 1,708 | 21.6% |
| High School | 1,483 | 18.7% |
| College / Undergraduate | 1,379 | 17.4% |
| Graduate / Professional | 506 | 6.4% |
| Total | 7,920 | 100.0% |
School Enrollment by Age by Funding Source in Aventura
Out of a total of 7,920 students who are enrolled in schools in Aventura, 2,400 (30.3%) attend a private institution, while the remaining 5,520 (69.7%) are enrolled in public schools. The age group of 3 to 4 year olds has the highest likelihood of being enrolled in private schools, with 395 (63.7% in the age bracket) enrolled. Conversely, the age group of 10 to 14 year olds has the lowest likelihood of being enrolled in a private school, with 1,702 (81.8% in the age bracket) attending a public institution.
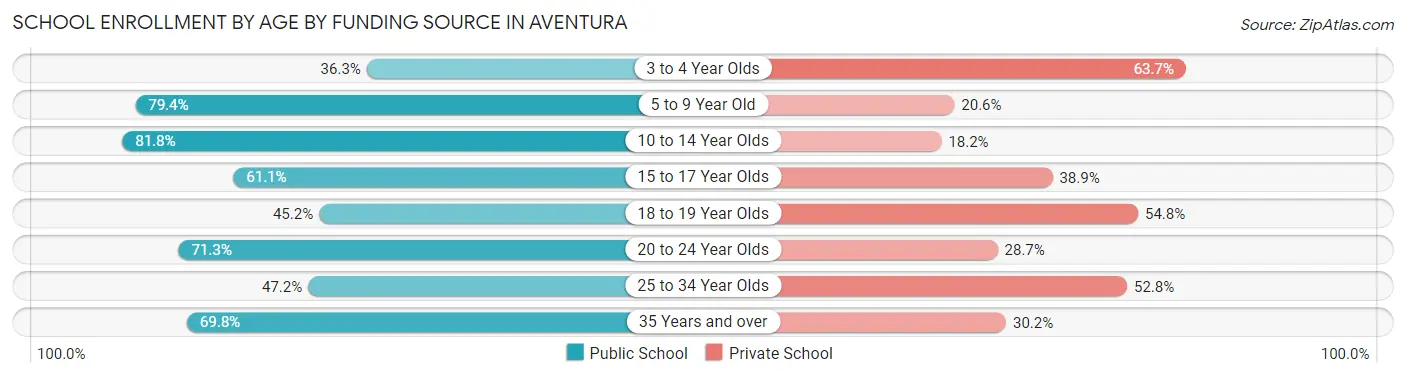
| Age Bracket | Public School | Private School |
| 3 to 4 Year Olds | 225 (36.3%) | 395 (63.7%) |
| 5 to 9 Year Old | 1,609 (79.4%) | 418 (20.6%) |
| 10 to 14 Year Olds | 1,702 (81.8%) | 379 (18.2%) |
| 15 to 17 Year Olds | 707 (61.1%) | 450 (38.9%) |
| 18 to 19 Year Olds | 145 (45.2%) | 176 (54.8%) |
| 20 to 24 Year Olds | 637 (71.3%) | 256 (28.7%) |
| 25 to 34 Year Olds | 169 (47.2%) | 189 (52.8%) |
| 35 Years and over | 323 (69.8%) | 140 (30.2%) |
| Total | 5,520 (69.7%) | 2,400 (30.3%) |
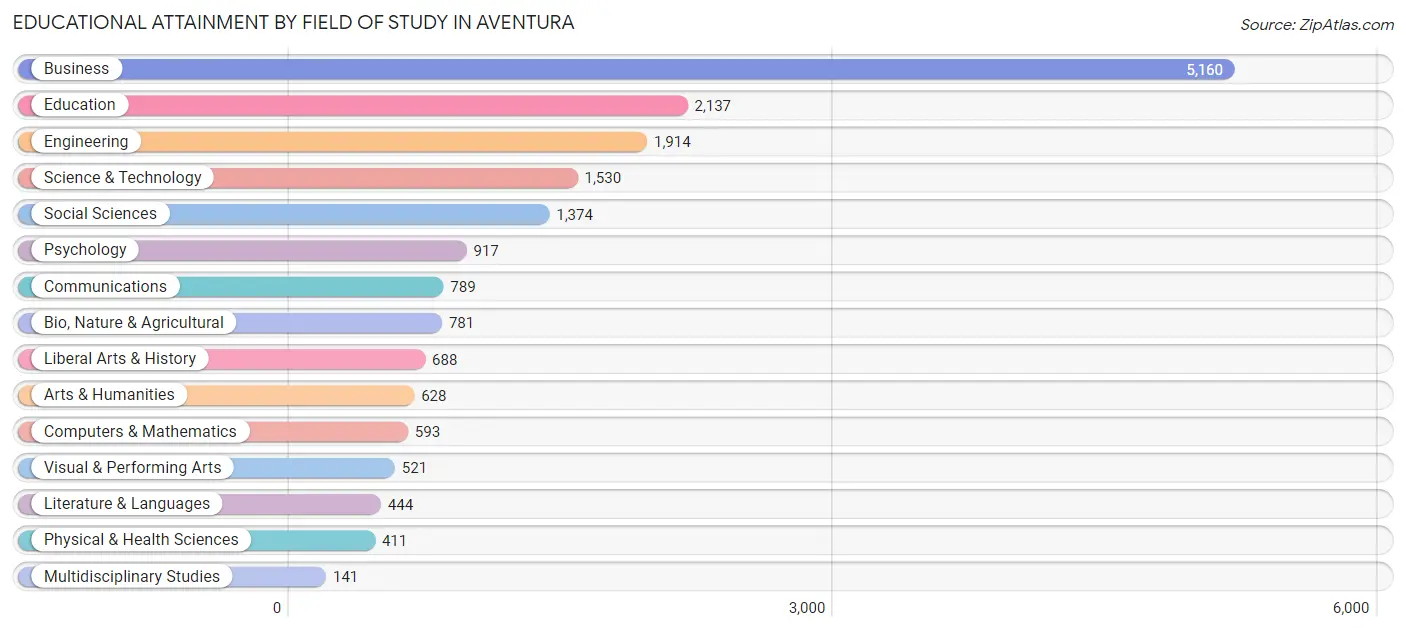
Educational Attainment by Field of Study in Aventura
Business (5,160 | 28.6%), education (2,137 | 11.8%), engineering (1,914 | 10.6%), science & technology (1,530 | 8.5%), and social sciences (1,374 | 7.6%) are the most common fields of study among 18,028 individuals in Aventura who have obtained a bachelor's degree or higher.
| Field of Study | # Graduates | % Graduates |
| Computers & Mathematics | 593 | 3.3% |
| Bio, Nature & Agricultural | 781 | 4.3% |
| Physical & Health Sciences | 411 | 2.3% |
| Psychology | 917 | 5.1% |
| Social Sciences | 1,374 | 7.6% |
| Engineering | 1,914 | 10.6% |
| Multidisciplinary Studies | 141 | 0.8% |
| Science & Technology | 1,530 | 8.5% |
| Business | 5,160 | 28.6% |
| Education | 2,137 | 11.8% |
| Literature & Languages | 444 | 2.5% |
| Liberal Arts & History | 688 | 3.8% |
| Visual & Performing Arts | 521 | 2.9% |
| Communications | 789 | 4.4% |
| Arts & Humanities | 628 | 3.5% |
| Total | 18,028 | 100.0% |
Transportation & Commute in Aventura
Vehicle Availability by Sex in Aventura
The most prevalent vehicle ownership categories in Aventura are males with 2 vehicles (5,111, accounting for 54.6%) and females with 2 vehicles (3,510, making up 66.0%).
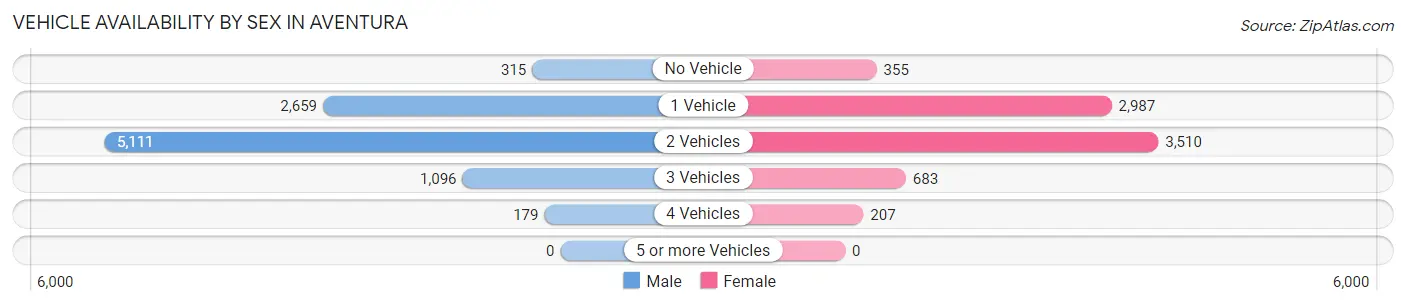
| Vehicles Available | Male | Female |
| No Vehicle | 315 (3.4%) | 355 (4.6%) |
| 1 Vehicle | 2,659 (28.4%) | 2,987 (38.6%) |
| 2 Vehicles | 5,111 (54.6%) | 3,510 (45.3%) |
| 3 Vehicles | 1,096 (11.7%) | 683 (8.8%) |
| 4 Vehicles | 179 (1.9%) | 207 (2.7%) |
| 5 or more Vehicles | 0 (0.0%) | 0 (0.0%) |
| Total | 9,360 (100.0%) | 7,742 (100.0%) |
Commute Time in Aventura
The most frequently occuring commute durations in Aventura are 45 to 59 minutes (2,085 commuters, 15.5%), 15 to 19 minutes (1,887 commuters, 14.1%), and 10 to 14 minutes (1,873 commuters, 14.0%).
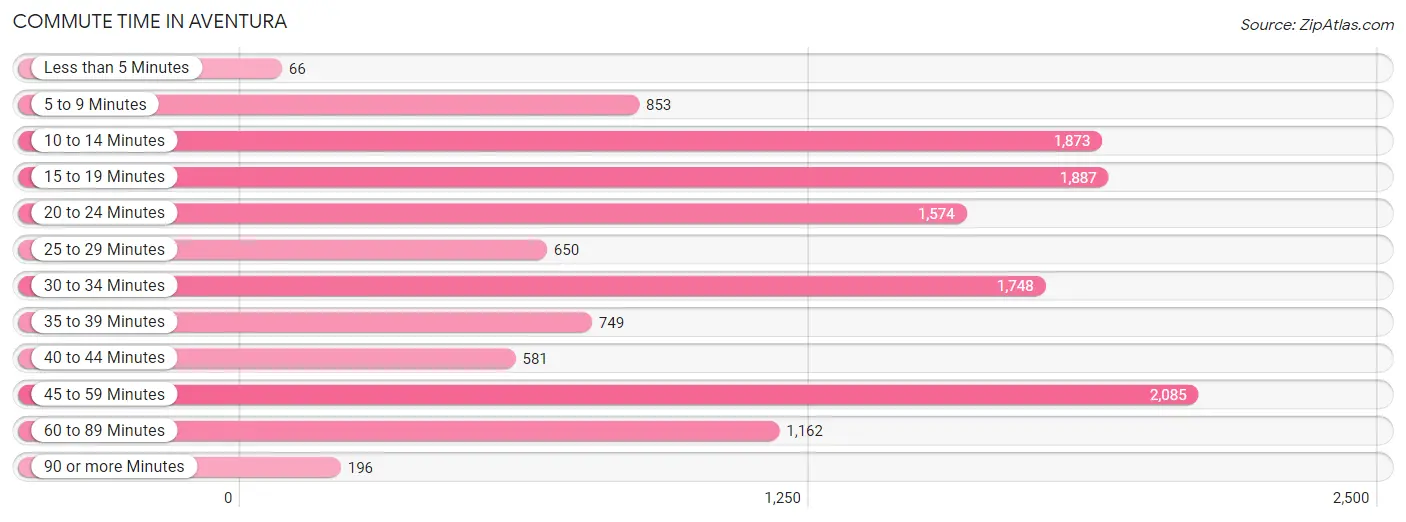
| Commute Time | # Commuters | % Commuters |
| Less than 5 Minutes | 66 | 0.5% |
| 5 to 9 Minutes | 853 | 6.4% |
| 10 to 14 Minutes | 1,873 | 14.0% |
| 15 to 19 Minutes | 1,887 | 14.1% |
| 20 to 24 Minutes | 1,574 | 11.7% |
| 25 to 29 Minutes | 650 | 4.8% |
| 30 to 34 Minutes | 1,748 | 13.0% |
| 35 to 39 Minutes | 749 | 5.6% |
| 40 to 44 Minutes | 581 | 4.3% |
| 45 to 59 Minutes | 2,085 | 15.5% |
| 60 to 89 Minutes | 1,162 | 8.7% |
| 90 or more Minutes | 196 | 1.5% |
Commute Time by Sex in Aventura
The most common commute times in Aventura are 30 to 34 minutes (1,146 commuters, 15.5%) for males and 15 to 19 minutes (1,003 commuters, 16.6%) for females.
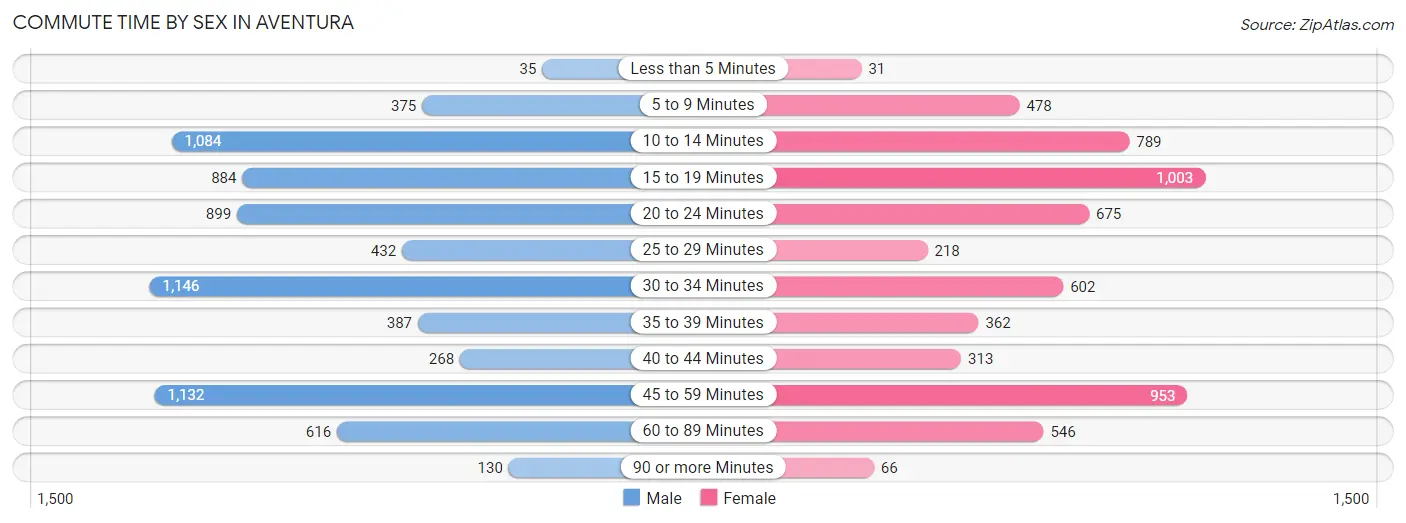
| Commute Time | Male | Female |
| Less than 5 Minutes | 35 (0.5%) | 31 (0.5%) |
| 5 to 9 Minutes | 375 (5.1%) | 478 (7.9%) |
| 10 to 14 Minutes | 1,084 (14.7%) | 789 (13.1%) |
| 15 to 19 Minutes | 884 (12.0%) | 1,003 (16.6%) |
| 20 to 24 Minutes | 899 (12.2%) | 675 (11.2%) |
| 25 to 29 Minutes | 432 (5.9%) | 218 (3.6%) |
| 30 to 34 Minutes | 1,146 (15.5%) | 602 (10.0%) |
| 35 to 39 Minutes | 387 (5.2%) | 362 (6.0%) |
| 40 to 44 Minutes | 268 (3.6%) | 313 (5.2%) |
| 45 to 59 Minutes | 1,132 (15.3%) | 953 (15.8%) |
| 60 to 89 Minutes | 616 (8.3%) | 546 (9.0%) |
| 90 or more Minutes | 130 (1.8%) | 66 (1.1%) |
Time of Departure to Work by Sex in Aventura
The most frequent times of departure to work in Aventura are 8:00 AM to 8:29 AM (1,708, 23.1%) for males and 8:00 AM to 8:29 AM (1,150, 19.1%) for females.
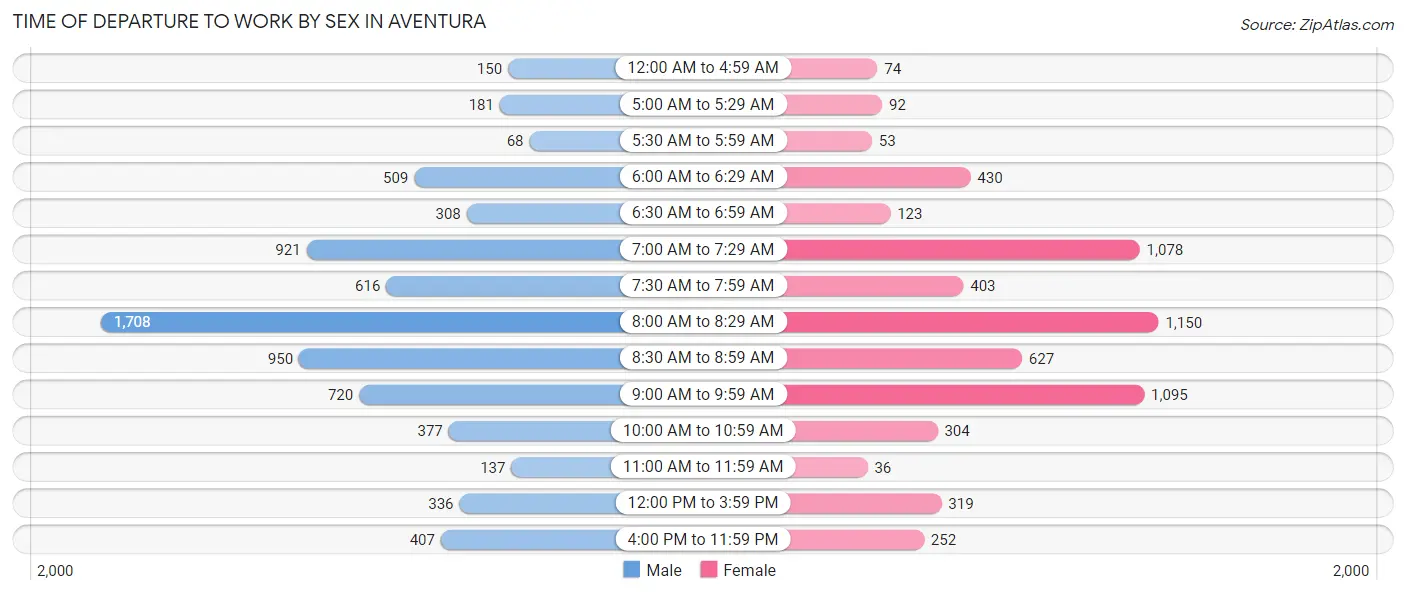
| Time of Departure | Male | Female |
| 12:00 AM to 4:59 AM | 150 (2.0%) | 74 (1.2%) |
| 5:00 AM to 5:29 AM | 181 (2.5%) | 92 (1.5%) |
| 5:30 AM to 5:59 AM | 68 (0.9%) | 53 (0.9%) |
| 6:00 AM to 6:29 AM | 509 (6.9%) | 430 (7.1%) |
| 6:30 AM to 6:59 AM | 308 (4.2%) | 123 (2.0%) |
| 7:00 AM to 7:29 AM | 921 (12.5%) | 1,078 (17.9%) |
| 7:30 AM to 7:59 AM | 616 (8.3%) | 403 (6.7%) |
| 8:00 AM to 8:29 AM | 1,708 (23.1%) | 1,150 (19.1%) |
| 8:30 AM to 8:59 AM | 950 (12.9%) | 627 (10.4%) |
| 9:00 AM to 9:59 AM | 720 (9.8%) | 1,095 (18.1%) |
| 10:00 AM to 10:59 AM | 377 (5.1%) | 304 (5.0%) |
| 11:00 AM to 11:59 AM | 137 (1.8%) | 36 (0.6%) |
| 12:00 PM to 3:59 PM | 336 (4.5%) | 319 (5.3%) |
| 4:00 PM to 11:59 PM | 407 (5.5%) | 252 (4.2%) |
| Total | 7,388 (100.0%) | 6,036 (100.0%) |
Housing Occupancy in Aventura
Occupancy by Ownership in Aventura
Of the total 18,403 dwellings in Aventura, owner-occupied units account for 12,170 (66.1%), while renter-occupied units make up 6,233 (33.9%).
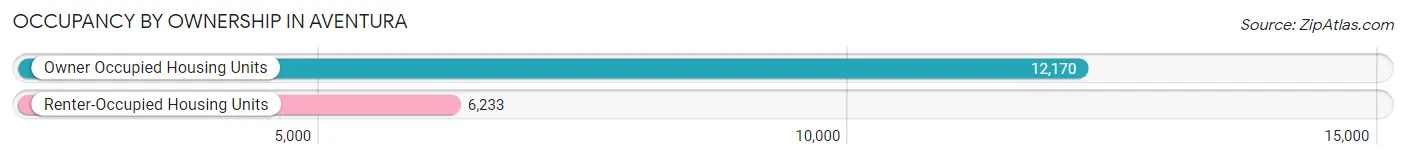
| Occupancy | # Housing Units | % Housing Units |
| Owner Occupied Housing Units | 12,170 | 66.1% |
| Renter-Occupied Housing Units | 6,233 | 33.9% |
| Total Occupied Housing Units | 18,403 | 100.0% |
Occupancy by Household Size in Aventura
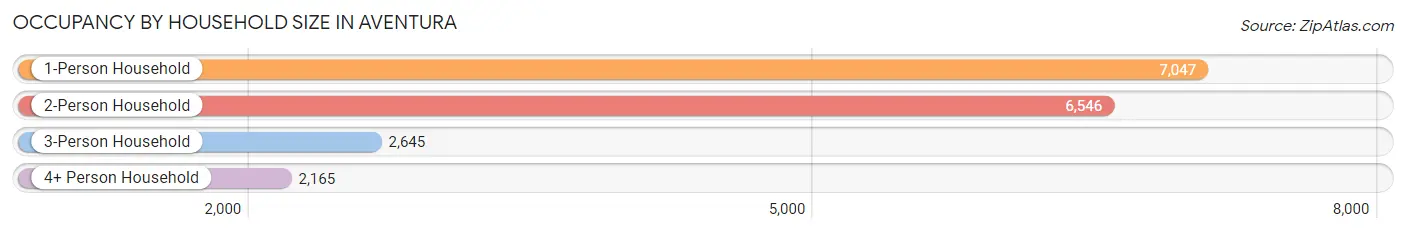
| Household Size | # Housing Units | % Housing Units |
| 1-Person Household | 7,047 | 38.3% |
| 2-Person Household | 6,546 | 35.6% |
| 3-Person Household | 2,645 | 14.4% |
| 4+ Person Household | 2,165 | 11.8% |
| Total Housing Units | 18,403 | 100.0% |
Occupancy by Ownership by Household Size in Aventura
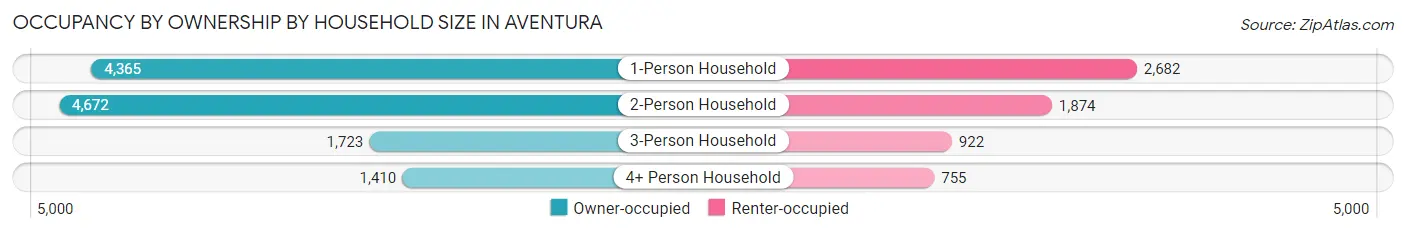
| Household Size | Owner-occupied | Renter-occupied |
| 1-Person Household | 4,365 (61.9%) | 2,682 (38.1%) |
| 2-Person Household | 4,672 (71.4%) | 1,874 (28.6%) |
| 3-Person Household | 1,723 (65.1%) | 922 (34.9%) |
| 4+ Person Household | 1,410 (65.1%) | 755 (34.9%) |
| Total Housing Units | 12,170 (66.1%) | 6,233 (33.9%) |
Occupancy by Educational Attainment in Aventura
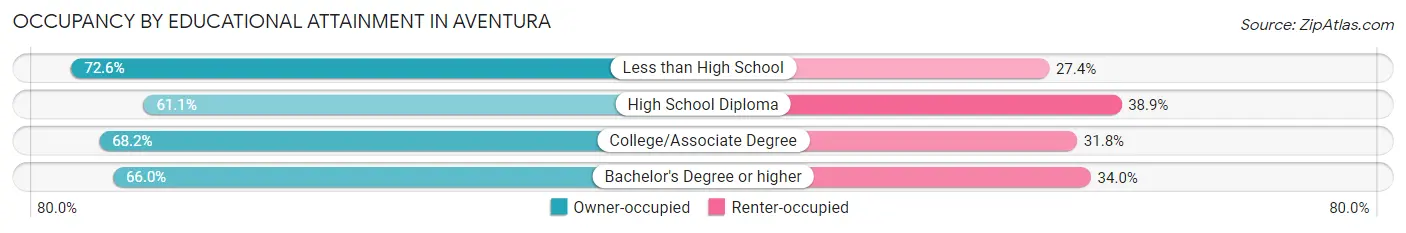
| Household Size | Owner-occupied | Renter-occupied |
| Less than High School | 474 (72.6%) | 179 (27.4%) |
| High School Diploma | 1,493 (61.1%) | 949 (38.9%) |
| College/Associate Degree | 3,213 (68.2%) | 1,501 (31.8%) |
| Bachelor's Degree or higher | 6,990 (66.0%) | 3,604 (34.0%) |
Occupancy by Age of Householder in Aventura
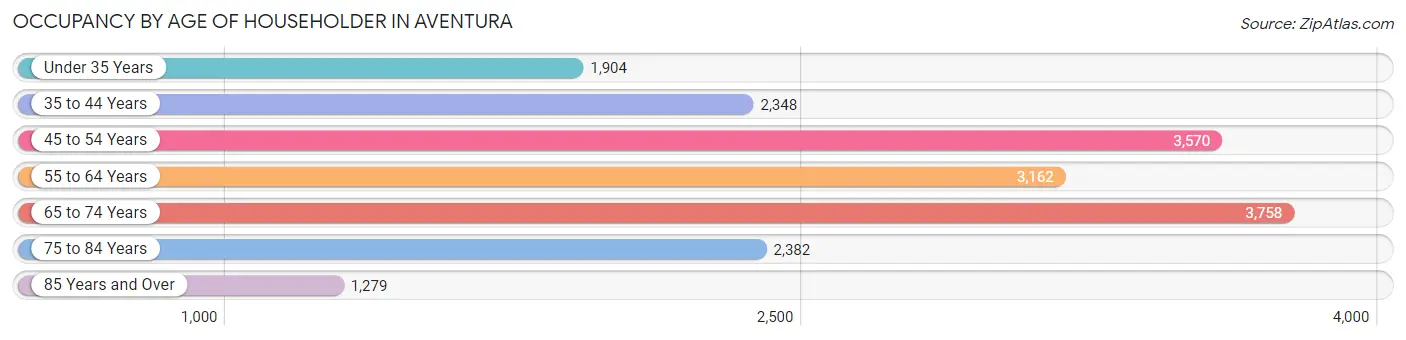
| Age Bracket | # Households | % Households |
| Under 35 Years | 1,904 | 10.3% |
| 35 to 44 Years | 2,348 | 12.8% |
| 45 to 54 Years | 3,570 | 19.4% |
| 55 to 64 Years | 3,162 | 17.2% |
| 65 to 74 Years | 3,758 | 20.4% |
| 75 to 84 Years | 2,382 | 12.9% |
| 85 Years and Over | 1,279 | 7.0% |
| Total | 18,403 | 100.0% |
Housing Finances in Aventura
Median Income by Occupancy in Aventura
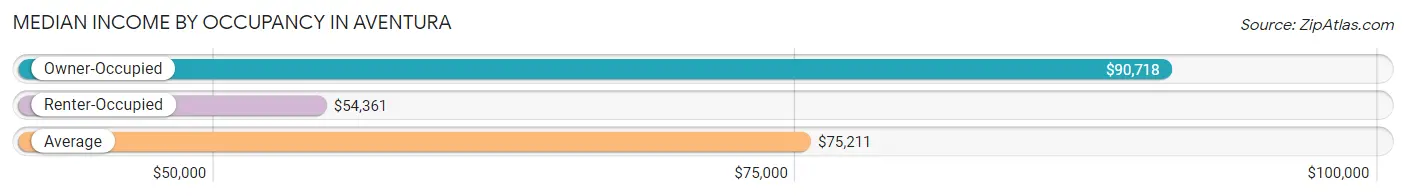
| Occupancy Type | # Households | Median Income |
| Owner-Occupied | 12,170 (66.1%) | $90,718 |
| Renter-Occupied | 6,233 (33.9%) | $54,361 |
| Average | 18,403 (100.0%) | $75,211 |
Occupancy by Householder Income Bracket in Aventura
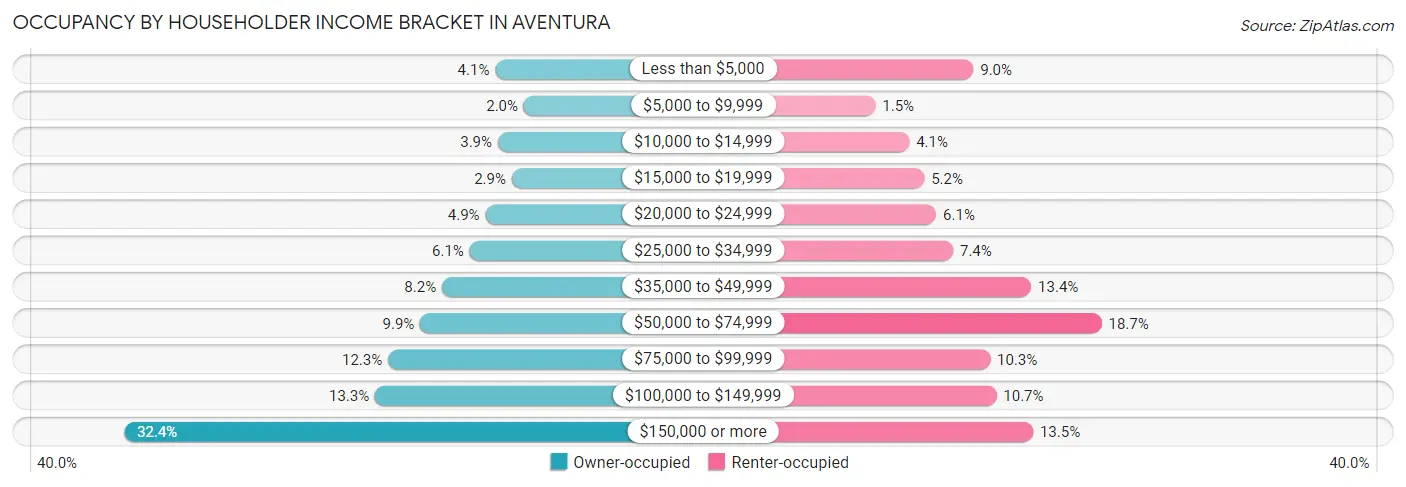
| Income Bracket | Owner-occupied | Renter-occupied |
| Less than $5,000 | 504 (4.1%) | 559 (9.0%) |
| $5,000 to $9,999 | 238 (2.0%) | 94 (1.5%) |
| $10,000 to $14,999 | 479 (3.9%) | 255 (4.1%) |
| $15,000 to $19,999 | 351 (2.9%) | 326 (5.2%) |
| $20,000 to $24,999 | 595 (4.9%) | 383 (6.1%) |
| $25,000 to $34,999 | 741 (6.1%) | 463 (7.4%) |
| $35,000 to $49,999 | 998 (8.2%) | 834 (13.4%) |
| $50,000 to $74,999 | 1,200 (9.9%) | 1,168 (18.7%) |
| $75,000 to $99,999 | 1,498 (12.3%) | 639 (10.2%) |
| $100,000 to $149,999 | 1,619 (13.3%) | 669 (10.7%) |
| $150,000 or more | 3,947 (32.4%) | 843 (13.5%) |
| Total | 12,170 (100.0%) | 6,233 (100.0%) |
Monthly Housing Cost Tiers in Aventura
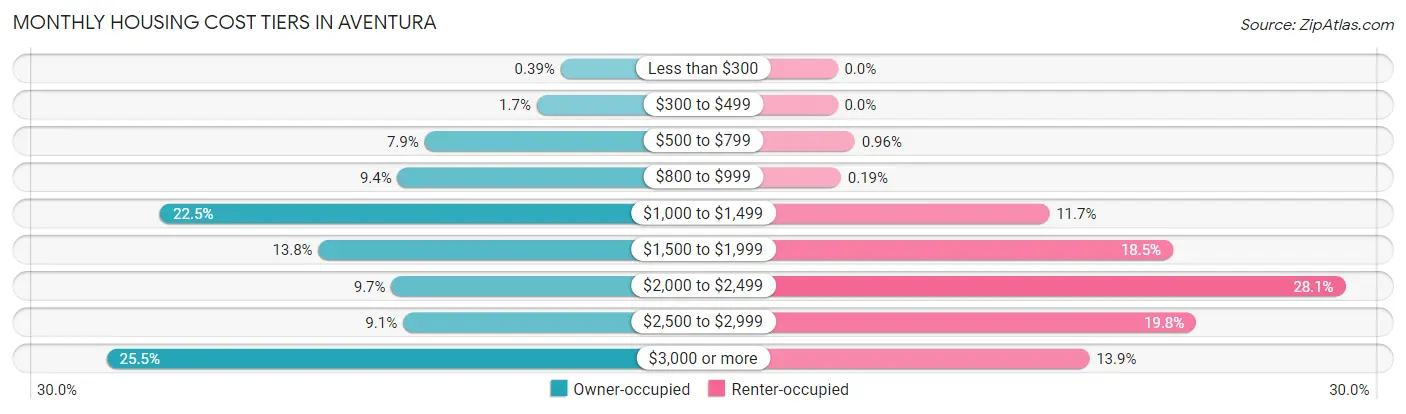
| Monthly Cost | Owner-occupied | Renter-occupied |
| Less than $300 | 47 (0.4%) | 0 (0.0%) |
| $300 to $499 | 208 (1.7%) | 0 (0.0%) |
| $500 to $799 | 963 (7.9%) | 60 (1.0%) |
| $800 to $999 | 1,144 (9.4%) | 12 (0.2%) |
| $1,000 to $1,499 | 2,740 (22.5%) | 729 (11.7%) |
| $1,500 to $1,999 | 1,676 (13.8%) | 1,155 (18.5%) |
| $2,000 to $2,499 | 1,185 (9.7%) | 1,749 (28.1%) |
| $2,500 to $2,999 | 1,107 (9.1%) | 1,235 (19.8%) |
| $3,000 or more | 3,100 (25.5%) | 867 (13.9%) |
| Total | 12,170 (100.0%) | 6,233 (100.0%) |
Physical Housing Characteristics in Aventura
Housing Structures in Aventura
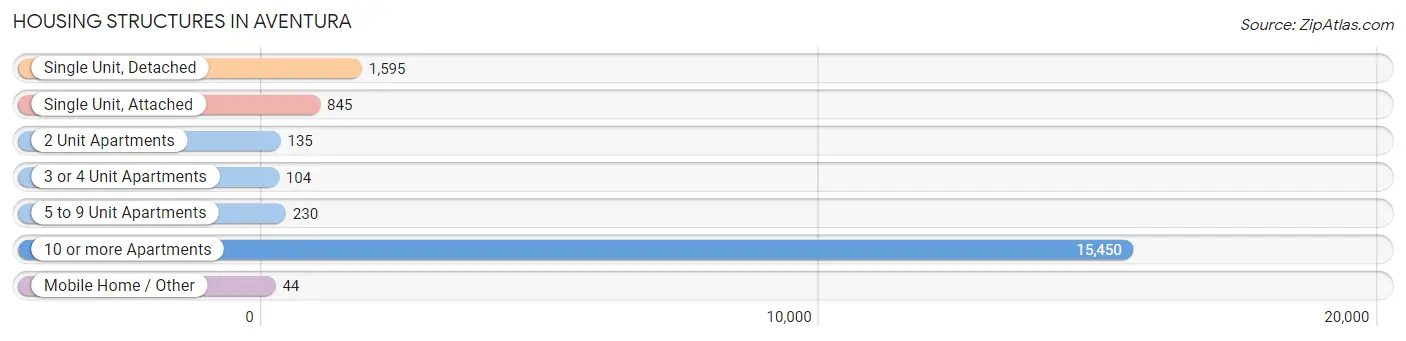
| Structure Type | # Housing Units | % Housing Units |
| Single Unit, Detached | 1,595 | 8.7% |
| Single Unit, Attached | 845 | 4.6% |
| 2 Unit Apartments | 135 | 0.7% |
| 3 or 4 Unit Apartments | 104 | 0.6% |
| 5 to 9 Unit Apartments | 230 | 1.3% |
| 10 or more Apartments | 15,450 | 84.0% |
| Mobile Home / Other | 44 | 0.2% |
| Total | 18,403 | 100.0% |
Housing Structures by Occupancy in Aventura
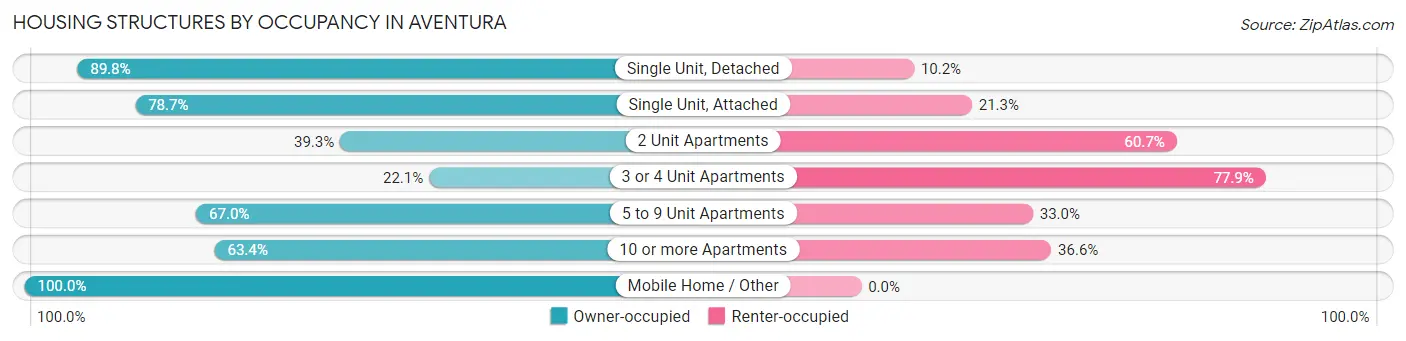
| Structure Type | Owner-occupied | Renter-occupied |
| Single Unit, Detached | 1,433 (89.8%) | 162 (10.2%) |
| Single Unit, Attached | 665 (78.7%) | 180 (21.3%) |
| 2 Unit Apartments | 53 (39.3%) | 82 (60.7%) |
| 3 or 4 Unit Apartments | 23 (22.1%) | 81 (77.9%) |
| 5 to 9 Unit Apartments | 154 (67.0%) | 76 (33.0%) |
| 10 or more Apartments | 9,798 (63.4%) | 5,652 (36.6%) |
| Mobile Home / Other | 44 (100.0%) | 0 (0.0%) |
| Total | 12,170 (66.1%) | 6,233 (33.9%) |
Housing Structures by Number of Rooms in Aventura
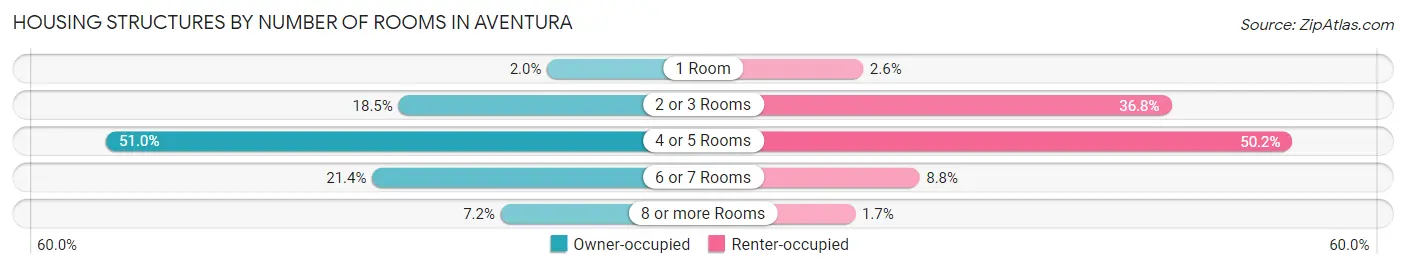
| Number of Rooms | Owner-occupied | Renter-occupied |
| 1 Room | 242 (2.0%) | 159 (2.5%) |
| 2 or 3 Rooms | 2,250 (18.5%) | 2,292 (36.8%) |
| 4 or 5 Rooms | 6,202 (51.0%) | 3,129 (50.2%) |
| 6 or 7 Rooms | 2,606 (21.4%) | 549 (8.8%) |
| 8 or more Rooms | 870 (7.1%) | 104 (1.7%) |
| Total | 12,170 (100.0%) | 6,233 (100.0%) |
Housing Structure by Heating Type in Aventura
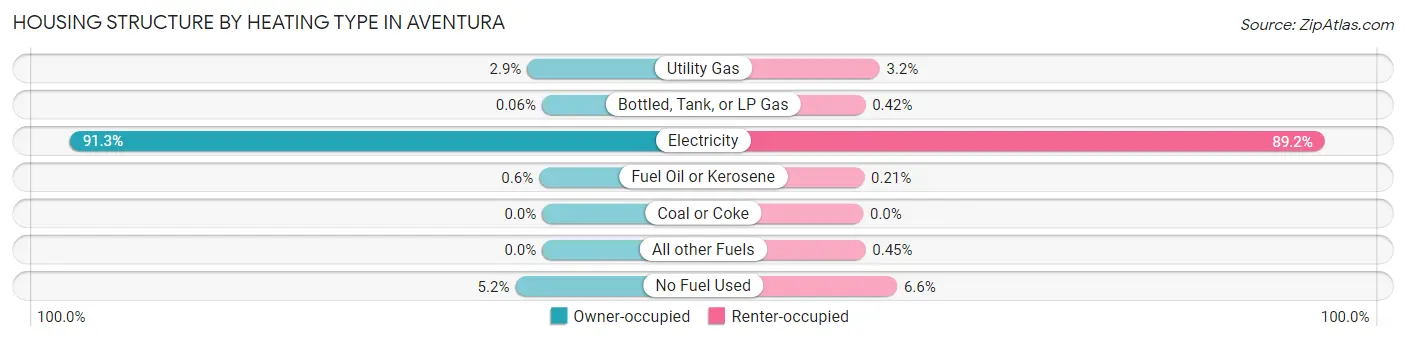
| Heating Type | Owner-occupied | Renter-occupied |
| Utility Gas | 350 (2.9%) | 199 (3.2%) |
| Bottled, Tank, or LP Gas | 7 (0.1%) | 26 (0.4%) |
| Electricity | 11,108 (91.3%) | 5,558 (89.2%) |
| Fuel Oil or Kerosene | 73 (0.6%) | 13 (0.2%) |
| Coal or Coke | 0 (0.0%) | 0 (0.0%) |
| All other Fuels | 0 (0.0%) | 28 (0.4%) |
| No Fuel Used | 632 (5.2%) | 409 (6.6%) |
| Total | 12,170 (100.0%) | 6,233 (100.0%) |
Household Vehicle Usage in Aventura
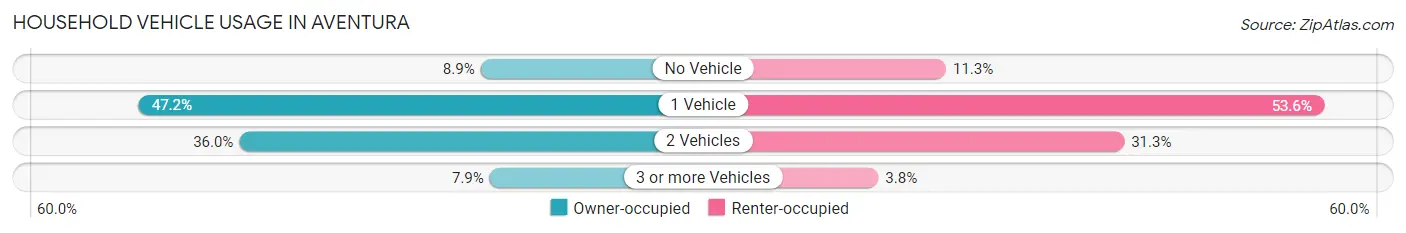
| Vehicles per Household | Owner-occupied | Renter-occupied |
| No Vehicle | 1,087 (8.9%) | 706 (11.3%) |
| 1 Vehicle | 5,744 (47.2%) | 3,343 (53.6%) |
| 2 Vehicles | 4,376 (36.0%) | 1,950 (31.3%) |
| 3 or more Vehicles | 963 (7.9%) | 234 (3.7%) |
| Total | 12,170 (100.0%) | 6,233 (100.0%) |
Real Estate & Mortgages in Aventura
Real Estate and Mortgage Overview in Aventura
| Characteristic | Without Mortgage | With Mortgage |
| Housing Units | 7,200 | 4,970 |
| Median Property Value | $390,800 | $404,900 |
| Median Household Income | $70,769 | $2,265 |
| Monthly Housing Costs | $1,288 | $2,298 |
| Real Estate Taxes | $3,765 | $19 |
Property Value by Mortgage Status in Aventura
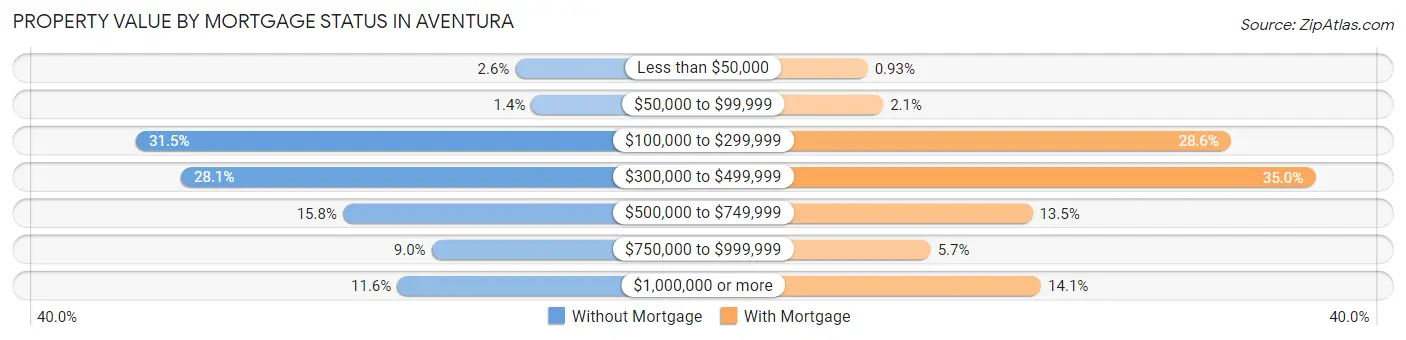
| Property Value | Without Mortgage | With Mortgage |
| Less than $50,000 | 189 (2.6%) | 46 (0.9%) |
| $50,000 to $99,999 | 101 (1.4%) | 105 (2.1%) |
| $100,000 to $299,999 | 2,268 (31.5%) | 1,421 (28.6%) |
| $300,000 to $499,999 | 2,022 (28.1%) | 1,740 (35.0%) |
| $500,000 to $749,999 | 1,135 (15.8%) | 670 (13.5%) |
| $750,000 to $999,999 | 648 (9.0%) | 285 (5.7%) |
| $1,000,000 or more | 837 (11.6%) | 703 (14.1%) |
| Total | 7,200 (100.0%) | 4,970 (100.0%) |
Household Income by Mortgage Status in Aventura
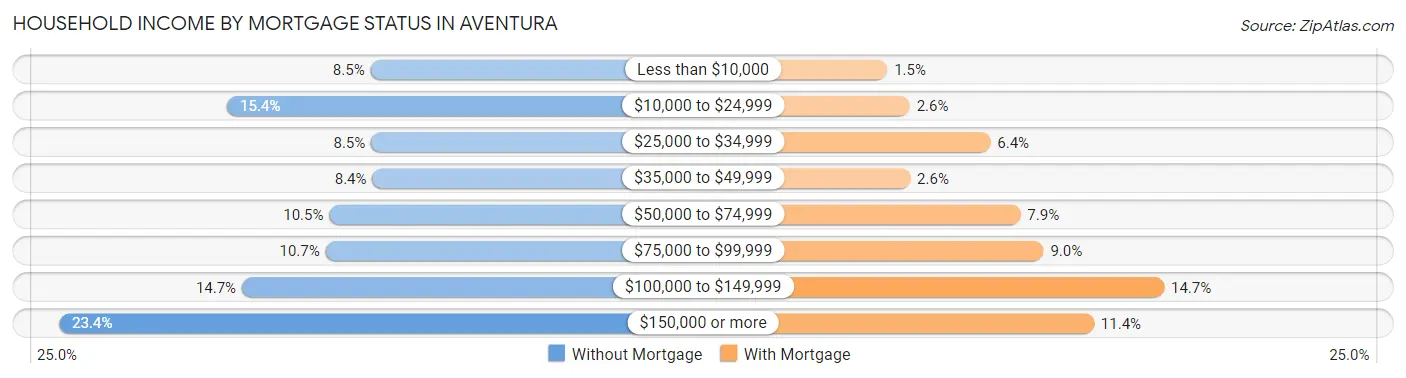
| Household Income | Without Mortgage | With Mortgage |
| Less than $10,000 | 614 (8.5%) | 75 (1.5%) |
| $10,000 to $24,999 | 1,106 (15.4%) | 128 (2.6%) |
| $25,000 to $34,999 | 612 (8.5%) | 319 (6.4%) |
| $35,000 to $49,999 | 608 (8.4%) | 129 (2.6%) |
| $50,000 to $74,999 | 755 (10.5%) | 390 (7.9%) |
| $75,000 to $99,999 | 768 (10.7%) | 445 (8.9%) |
| $100,000 to $149,999 | 1,055 (14.6%) | 730 (14.7%) |
| $150,000 or more | 1,682 (23.4%) | 564 (11.4%) |
| Total | 7,200 (100.0%) | 4,970 (100.0%) |
Property Value to Household Income Ratio in Aventura
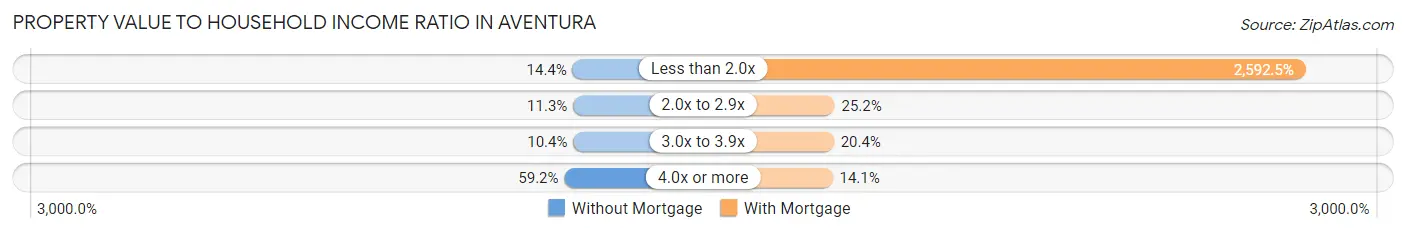
| Value-to-Income Ratio | Without Mortgage | With Mortgage |
| Less than 2.0x | 1,033 (14.3%) | 128,846 (2,592.5%) |
| 2.0x to 2.9x | 816 (11.3%) | 1,250 (25.2%) |
| 3.0x to 3.9x | 748 (10.4%) | 1,016 (20.4%) |
| 4.0x or more | 4,265 (59.2%) | 699 (14.1%) |
| Total | 7,200 (100.0%) | 4,970 (100.0%) |
Real Estate Taxes by Mortgage Status in Aventura
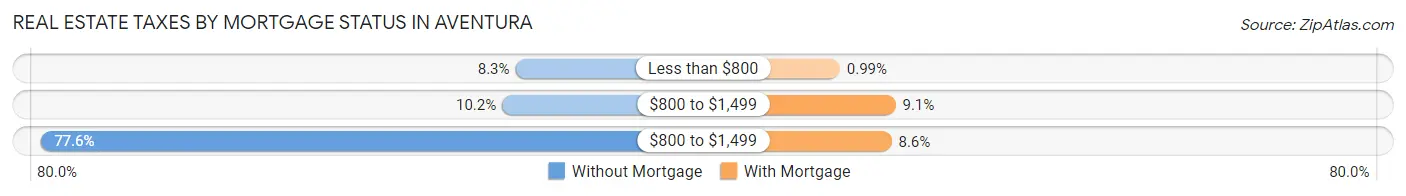
| Property Taxes | Without Mortgage | With Mortgage |
| Less than $800 | 597 (8.3%) | 49 (1.0%) |
| $800 to $1,499 | 737 (10.2%) | 454 (9.1%) |
| $800 to $1,499 | 5,585 (77.6%) | 425 (8.6%) |
| Total | 7,200 (100.0%) | 4,970 (100.0%) |
Health & Disability in Aventura
Health Insurance Coverage by Age in Aventura
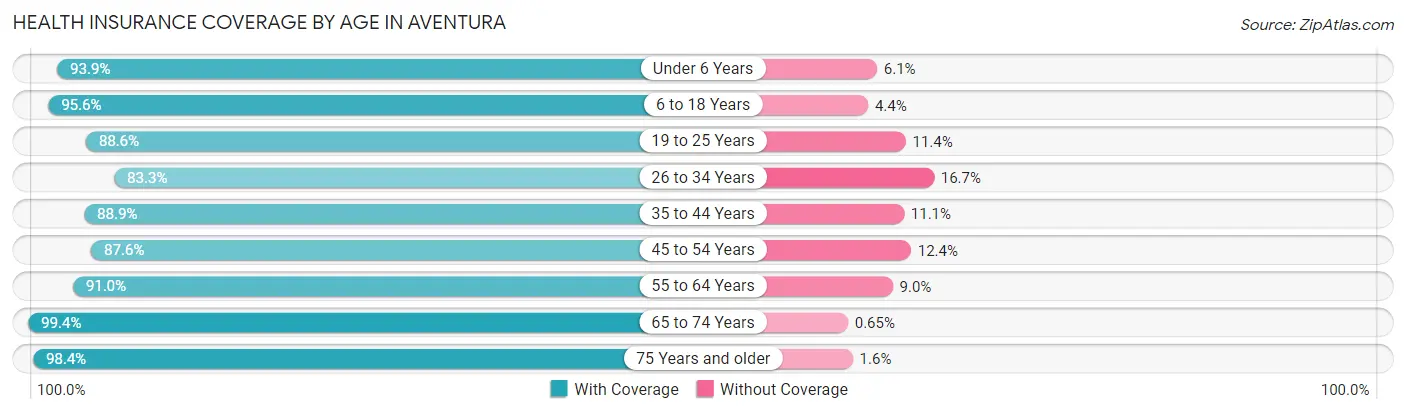
| Age Bracket | With Coverage | Without Coverage |
| Under 6 Years | 2,168 (93.9%) | 140 (6.1%) |
| 6 to 18 Years | 4,839 (95.6%) | 223 (4.4%) |
| 19 to 25 Years | 2,141 (88.6%) | 276 (11.4%) |
| 26 to 34 Years | 2,286 (83.3%) | 458 (16.7%) |
| 35 to 44 Years | 4,153 (88.9%) | 519 (11.1%) |
| 45 to 54 Years | 5,094 (87.6%) | 721 (12.4%) |
| 55 to 64 Years | 4,887 (91.0%) | 484 (9.0%) |
| 65 to 74 Years | 5,653 (99.4%) | 37 (0.6%) |
| 75 Years and older | 5,237 (98.4%) | 83 (1.6%) |
| Total | 36,458 (92.5%) | 2,941 (7.5%) |
Health Insurance Coverage by Citizenship Status in Aventura
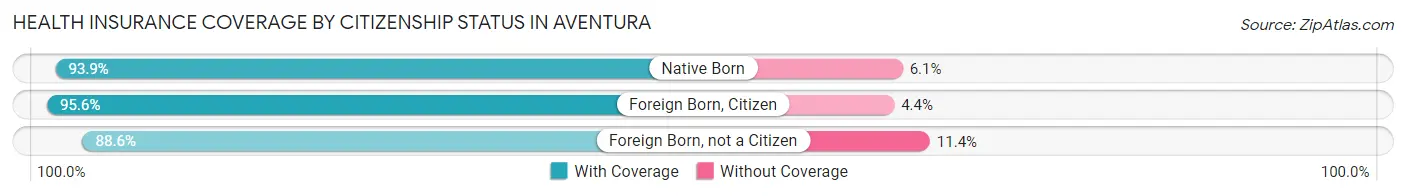
| Citizenship Status | With Coverage | Without Coverage |
| Native Born | 2,168 (93.9%) | 140 (6.1%) |
| Foreign Born, Citizen | 4,839 (95.6%) | 223 (4.4%) |
| Foreign Born, not a Citizen | 2,141 (88.6%) | 276 (11.4%) |
Health Insurance Coverage by Household Income in Aventura
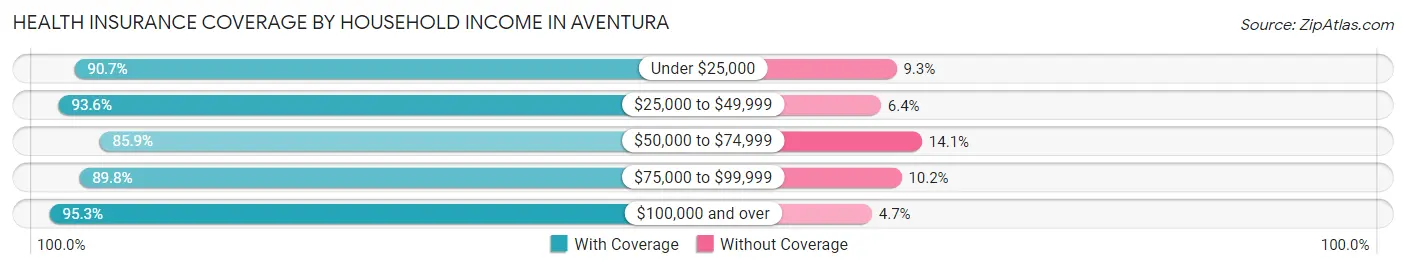
| Household Income | With Coverage | Without Coverage |
| Under $25,000 | 5,554 (90.7%) | 570 (9.3%) |
| $25,000 to $49,999 | 4,860 (93.6%) | 331 (6.4%) |
| $50,000 to $74,999 | 4,252 (85.9%) | 696 (14.1%) |
| $75,000 to $99,999 | 4,147 (89.8%) | 473 (10.2%) |
| $100,000 and over | 17,645 (95.3%) | 871 (4.7%) |
Public vs Private Health Insurance Coverage by Age in Aventura
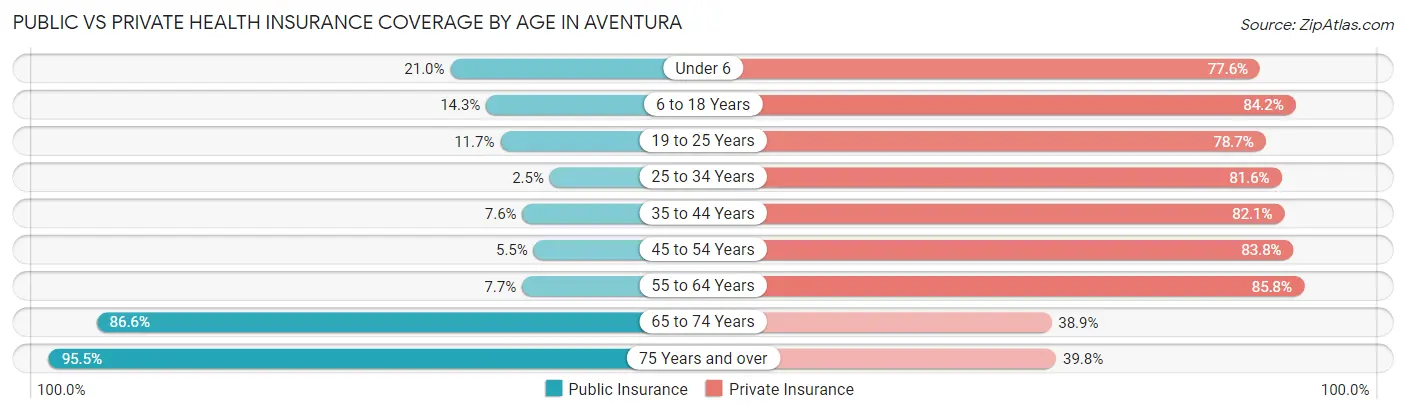
| Age Bracket | Public Insurance | Private Insurance |
| Under 6 | 484 (21.0%) | 1,791 (77.6%) |
| 6 to 18 Years | 725 (14.3%) | 4,263 (84.2%) |
| 19 to 25 Years | 283 (11.7%) | 1,901 (78.6%) |
| 25 to 34 Years | 69 (2.5%) | 2,239 (81.6%) |
| 35 to 44 Years | 355 (7.6%) | 3,837 (82.1%) |
| 45 to 54 Years | 321 (5.5%) | 4,875 (83.8%) |
| 55 to 64 Years | 412 (7.7%) | 4,606 (85.8%) |
| 65 to 74 Years | 4,929 (86.6%) | 2,212 (38.9%) |
| 75 Years and over | 5,081 (95.5%) | 2,116 (39.8%) |
| Total | 12,659 (32.1%) | 27,840 (70.7%) |
Disability Status by Sex by Age in Aventura
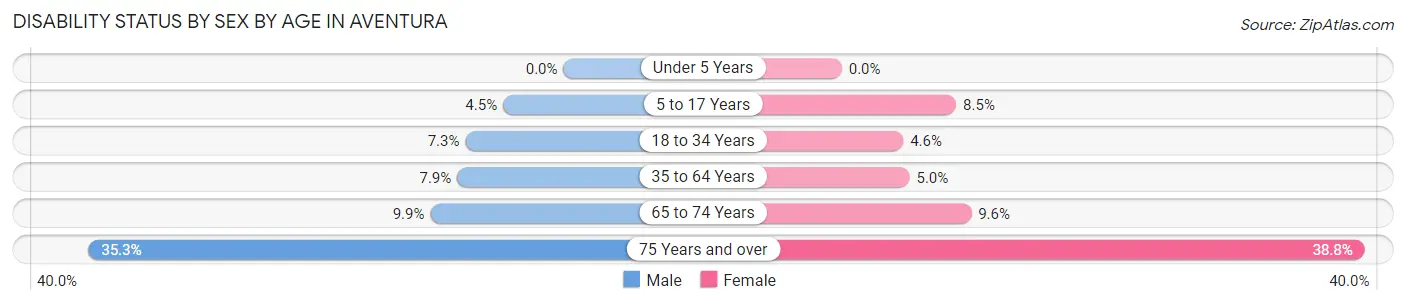
| Age Bracket | Male | Female |
| Under 5 Years | 0 (0.0%) | 0 (0.0%) |
| 5 to 17 Years | 114 (4.5%) | 245 (8.5%) |
| 18 to 34 Years | 180 (7.3%) | 130 (4.6%) |
| 35 to 64 Years | 576 (7.9%) | 430 (5.0%) |
| 65 to 74 Years | 225 (9.9%) | 328 (9.6%) |
| 75 Years and over | 807 (35.3%) | 1,177 (38.8%) |
Disability Class by Sex by Age in Aventura
Disability Class: Hearing Difficulty
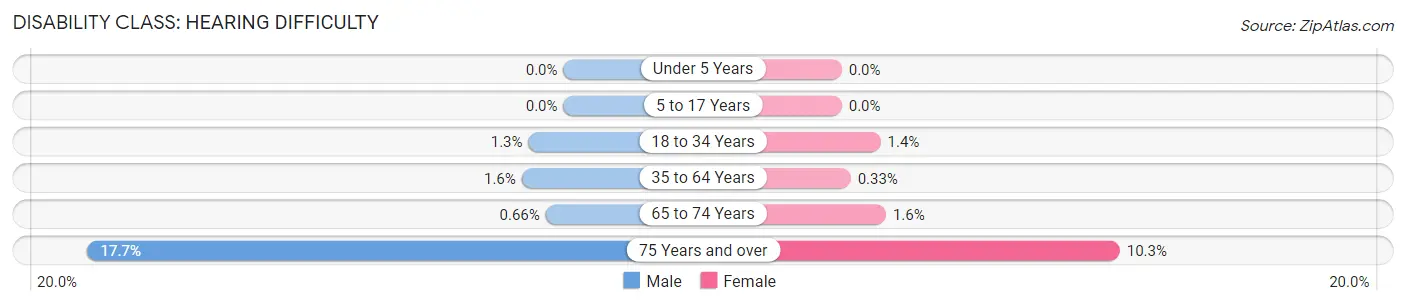
| Age Bracket | Male | Female |
| Under 5 Years | 0 (0.0%) | 0 (0.0%) |
| 5 to 17 Years | 0 (0.0%) | 0 (0.0%) |
| 18 to 34 Years | 32 (1.3%) | 41 (1.4%) |
| 35 to 64 Years | 113 (1.5%) | 28 (0.3%) |
| 65 to 74 Years | 15 (0.7%) | 56 (1.6%) |
| 75 Years and over | 404 (17.7%) | 313 (10.3%) |
Disability Class: Vision Difficulty
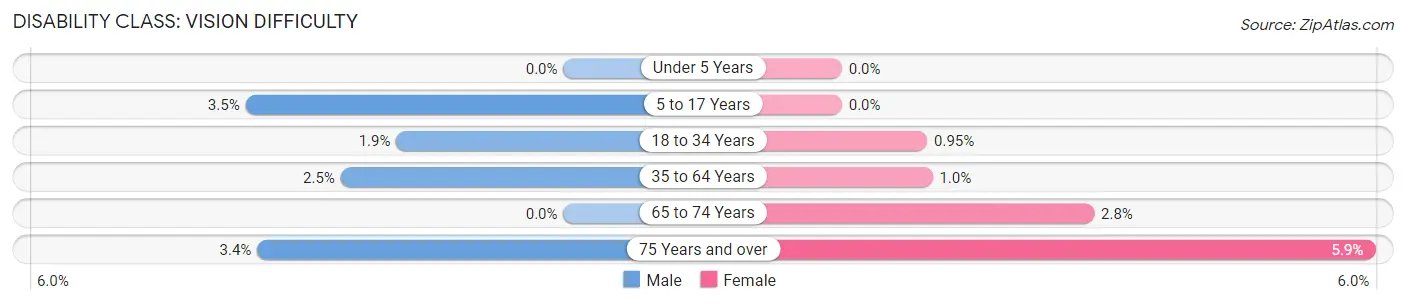
| Age Bracket | Male | Female |
| Under 5 Years | 0 (0.0%) | 0 (0.0%) |
| 5 to 17 Years | 90 (3.5%) | 0 (0.0%) |
| 18 to 34 Years | 46 (1.9%) | 27 (0.9%) |
| 35 to 64 Years | 181 (2.5%) | 86 (1.0%) |
| 65 to 74 Years | 0 (0.0%) | 96 (2.8%) |
| 75 Years and over | 78 (3.4%) | 180 (5.9%) |
Disability Class: Cognitive Difficulty
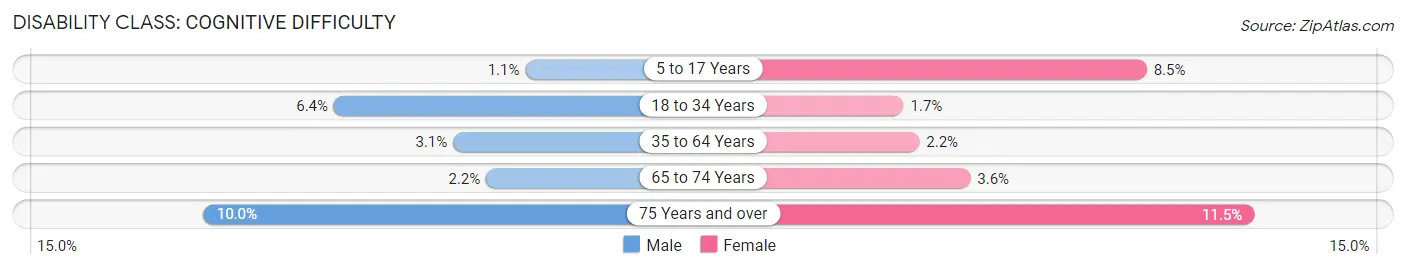
| Age Bracket | Male | Female |
| 5 to 17 Years | 27 (1.1%) | 245 (8.5%) |
| 18 to 34 Years | 158 (6.4%) | 49 (1.7%) |
| 35 to 64 Years | 224 (3.1%) | 185 (2.2%) |
| 65 to 74 Years | 49 (2.1%) | 122 (3.6%) |
| 75 Years and over | 229 (10.0%) | 348 (11.5%) |
Disability Class: Ambulatory Difficulty
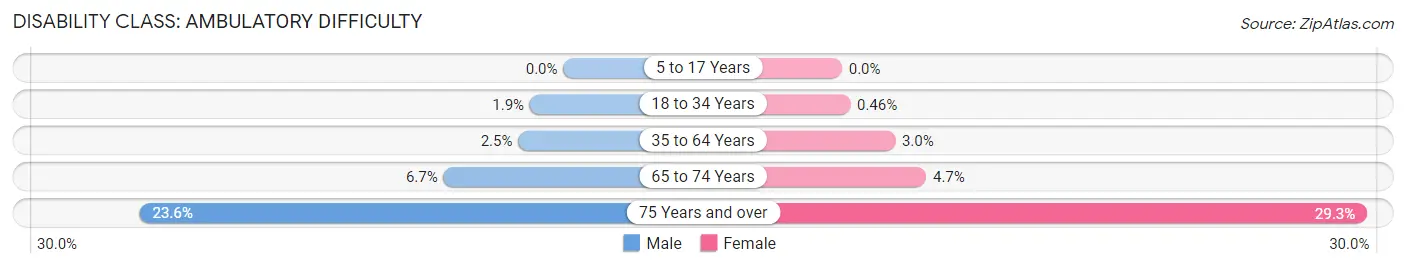
| Age Bracket | Male | Female |
| 5 to 17 Years | 0 (0.0%) | 0 (0.0%) |
| 18 to 34 Years | 46 (1.9%) | 13 (0.5%) |
| 35 to 64 Years | 183 (2.5%) | 253 (3.0%) |
| 65 to 74 Years | 152 (6.7%) | 160 (4.7%) |
| 75 Years and over | 540 (23.6%) | 887 (29.2%) |
Disability Class: Self-Care Difficulty
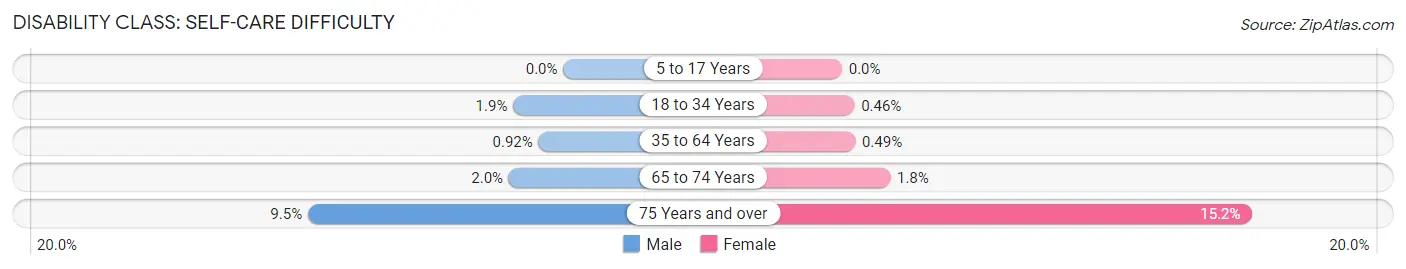
| Age Bracket | Male | Female |
| 5 to 17 Years | 0 (0.0%) | 0 (0.0%) |
| 18 to 34 Years | 46 (1.9%) | 13 (0.5%) |
| 35 to 64 Years | 67 (0.9%) | 42 (0.5%) |
| 65 to 74 Years | 46 (2.0%) | 61 (1.8%) |
| 75 Years and over | 217 (9.5%) | 462 (15.2%) |
Technology Access in Aventura
Computing Device Access in Aventura
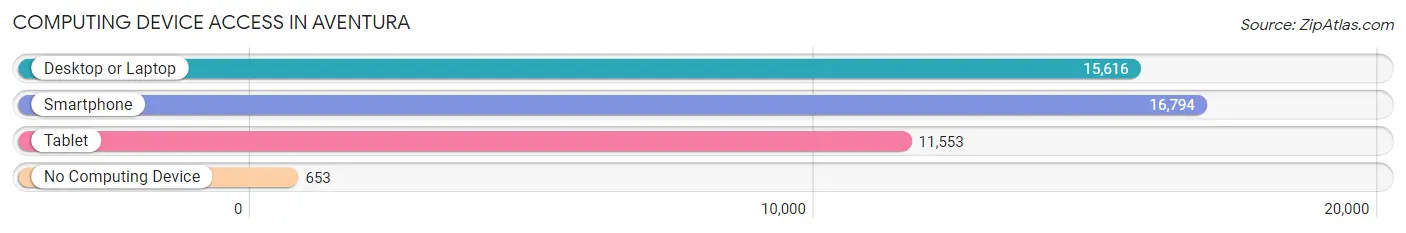
| Device Type | # Households | % Households |
| Desktop or Laptop | 15,616 | 84.9% |
| Smartphone | 16,794 | 91.3% |
| Tablet | 11,553 | 62.8% |
| No Computing Device | 653 | 3.5% |
| Total | 18,403 | 100.0% |
Internet Access in Aventura
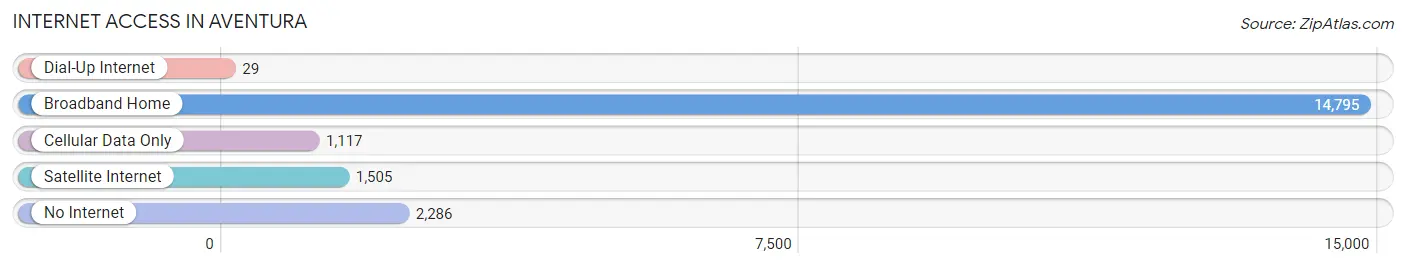
| Internet Type | # Households | % Households |
| Dial-Up Internet | 29 | 0.2% |
| Broadband Home | 14,795 | 80.4% |
| Cellular Data Only | 1,117 | 6.1% |
| Satellite Internet | 1,505 | 8.2% |
| No Internet | 2,286 | 12.4% |
| Total | 18,403 | 100.0% |
Aventura Summary
Aventura, Florida is a city located in Miami-Dade County, Florida, United States. It is located in the northeastern part of the county, just north of the city of Miami. Aventura is a relatively young city, having been incorporated in 1995. It is a popular destination for tourists and locals alike, offering a variety of attractions, activities, and amenities.
Geography
Aventura is located in the northeastern part of Miami-Dade County, just north of the city of Miami. It is bordered by the cities of Sunny Isles Beach to the north, North Miami Beach to the south, and Hallandale Beach to the west. The city covers an area of 4.5 square miles, with a population of 35,462 as of the 2010 census.
The city is situated on the Atlantic Coastal Ridge, a narrow strip of land that runs along the eastern coast of Florida. The ridge is composed of limestone and sandstone, and is the highest elevation in the county. The city is also located near the Everglades National Park, which is located to the west.
Economy
Aventura is home to a variety of businesses and industries. The city is home to the Aventura Mall, one of the largest shopping malls in the United States. The mall is home to over 300 stores and restaurants, and is a popular destination for both tourists and locals.
The city is also home to a number of corporate headquarters, including the headquarters of Carnival Cruise Lines, Royal Caribbean International, and Norwegian Cruise Line. The city is also home to a number of medical facilities, including the Aventura Hospital and Medical Center, and the Mount Sinai Medical Center.
Demographics
As of the 2010 census, Aventura had a population of 35,462. The racial makeup of the city was 70.3% White, 14.3% African American, 0.2% Native American, 8.2% Asian, 0.1% Pacific Islander, 4.2% from other races, and 2.9% from two or more races. Hispanic or Latino of any race were 24.3% of the population.
The median income for a household in the city was $50,945, and the median income for a family was $60,945. The per capita income for the city was $30,945. About 8.2% of families and 10.3% of the population were below the poverty line, including 14.3% of those under age 18 and 8.2% of those age 65 or over.
Conclusion
Aventura, Florida is a relatively young city, having been incorporated in 1995. It is located in the northeastern part of Miami-Dade County, just north of the city of Miami. The city is home to a variety of businesses and industries, including the Aventura Mall, one of the largest shopping malls in the United States. As of the 2010 census, the city had a population of 35,462, with a median household income of $50,945. Aventura is a popular destination for tourists and locals alike, offering a variety of attractions, activities, and amenities.
Common Questions
What is Per Capita Income in Aventura?
Per Capita income in Aventura is $56,940.
What is the Median Family Income in Aventura?
Median Family Income in Aventura is $94,253.
What is the Median Household income in Aventura?
Median Household Income in Aventura is $75,211.
What is Income or Wage Gap in Aventura?
Income or Wage Gap in Aventura is 44.7%.
Women in Aventura earn 55.3 cents for every dollar earned by a man.
What is Inequality or Gini Index in Aventura?
Inequality or Gini Index in Aventura is 0.55.
What is the Total Population of Aventura?
Total Population of Aventura is 39,621.
What is the Total Male Population of Aventura?
Total Male Population of Aventura is 17,672.
What is the Total Female Population of Aventura?
Total Female Population of Aventura is 21,949.
What is the Ratio of Males per 100 Females in Aventura?
There are 80.51 Males per 100 Females in Aventura.
What is the Ratio of Females per 100 Males in Aventura?
There are 124.20 Females per 100 Males in Aventura.
What is the Median Population Age in Aventura?
Median Population Age in Aventura is 49.8 Years.
What is the Average Family Size in Aventura
Average Family Size in Aventura is 2.9 People.
What is the Average Household Size in Aventura
Average Household Size in Aventura is 2.1 People.
How Large is the Labor Force in Aventura?
There are 18,336 People in the Labor Forcein in Aventura.
What is the Percentage of People in the Labor Force in Aventura?
55.2% of People are in the Labor Force in Aventura.
What is the Unemployment Rate in Aventura?
Unemployment Rate in Aventura is 4.8%.