Eugene, OR Map & Demographics
Eugene Map
Eugene Overview
$39,081
PER CAPITA INCOME
$92,629
AVG FAMILY INCOME
$61,481
AVG HOUSEHOLD INCOME
21.4%
WAGE / INCOME GAP [ % ]
78.6¢/ $1
WAGE / INCOME GAP [ $ ]
$9,443
FAMILY INCOME DEFICIT
0.49
INEQUALITY / GINI INDEX
176,755
TOTAL POPULATION
86,169
MALE POPULATION
90,586
FEMALE POPULATION
95.12
MALES / 100 FEMALES
105.13
FEMALES / 100 MALES
35.2
MEDIAN AGE
2.8
AVG FAMILY SIZE
2.2
AVG HOUSEHOLD SIZE
95,464
LABOR FORCE [ PEOPLE ]
62.9%
PERCENT IN LABOR FORCE
7.1%
UNEMPLOYMENT RATE
Income in Eugene
Income Overview in Eugene
Per Capita Income in Eugene is $39,081, while median incomes of families and households are $92,629 and $61,481 respectively.
| Characteristic | Number | Measure |
| Per Capita Income | 176,755 | $39,081 |
| Median Family Income | 36,596 | $92,629 |
| Mean Family Income | 36,596 | $118,128 |
| Median Household Income | 75,532 | $61,481 |
| Mean Household Income | 75,532 | $89,619 |
| Income Deficit | 36,596 | $9,443 |
| Wage / Income Gap (%) | 176,755 | 21.45% |
| Wage / Income Gap ($) | 176,755 | 78.55¢ per $1 |
| Gini / Inequality Index | 176,755 | 0.49 |
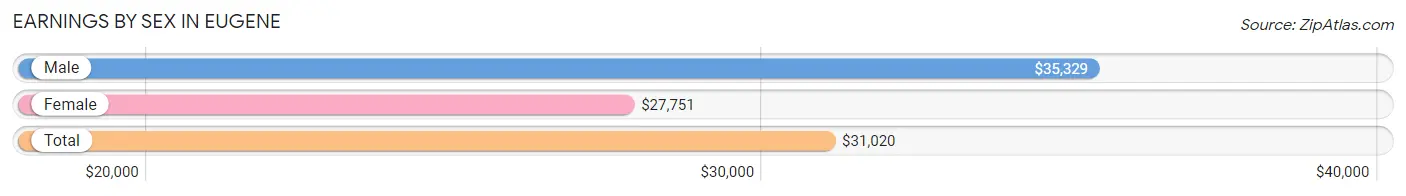
Earnings by Sex in Eugene
Average Earnings in Eugene are $31,020, $35,329 for men and $27,751 for women, a difference of 21.4%.
| Sex | Number | Average Earnings |
| Male | 53,113 (50.7%) | $35,329 |
| Female | 51,694 (49.3%) | $27,751 |
| Total | 104,807 (100.0%) | $31,020 |
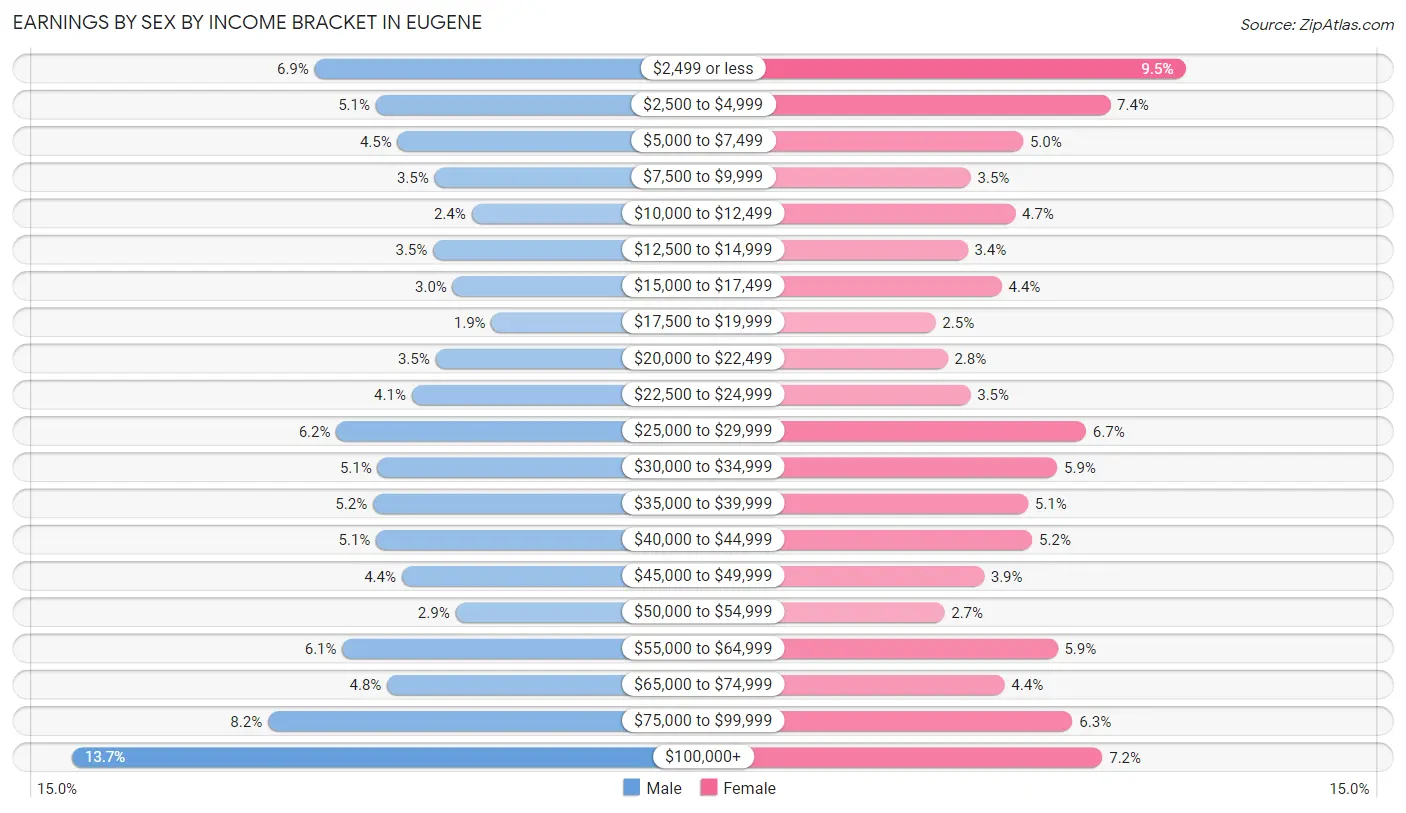
Earnings by Sex by Income Bracket in Eugene
The most common earnings brackets in Eugene are $100,000+ for men (7,259 | 13.7%) and $2,499 or less for women (4,914 | 9.5%).
| Income | Male | Female |
| $2,499 or less | 3,637 (6.9%) | 4,914 (9.5%) |
| $2,500 to $4,999 | 2,724 (5.1%) | 3,825 (7.4%) |
| $5,000 to $7,499 | 2,400 (4.5%) | 2,559 (5.0%) |
| $7,500 to $9,999 | 1,848 (3.5%) | 1,801 (3.5%) |
| $10,000 to $12,499 | 1,295 (2.4%) | 2,443 (4.7%) |
| $12,500 to $14,999 | 1,868 (3.5%) | 1,754 (3.4%) |
| $15,000 to $17,499 | 1,577 (3.0%) | 2,248 (4.3%) |
| $17,500 to $19,999 | 996 (1.9%) | 1,287 (2.5%) |
| $20,000 to $22,499 | 1,834 (3.5%) | 1,464 (2.8%) |
| $22,500 to $24,999 | 2,189 (4.1%) | 1,796 (3.5%) |
| $25,000 to $29,999 | 3,316 (6.2%) | 3,473 (6.7%) |
| $30,000 to $34,999 | 2,700 (5.1%) | 3,057 (5.9%) |
| $35,000 to $39,999 | 2,766 (5.2%) | 2,631 (5.1%) |
| $40,000 to $44,999 | 2,719 (5.1%) | 2,694 (5.2%) |
| $45,000 to $49,999 | 2,335 (4.4%) | 1,990 (3.8%) |
| $50,000 to $54,999 | 1,537 (2.9%) | 1,419 (2.7%) |
| $55,000 to $64,999 | 3,225 (6.1%) | 3,058 (5.9%) |
| $65,000 to $74,999 | 2,554 (4.8%) | 2,292 (4.4%) |
| $75,000 to $99,999 | 4,334 (8.2%) | 3,275 (6.3%) |
| $100,000+ | 7,259 (13.7%) | 3,714 (7.2%) |
| Total | 53,113 (100.0%) | 51,694 (100.0%) |
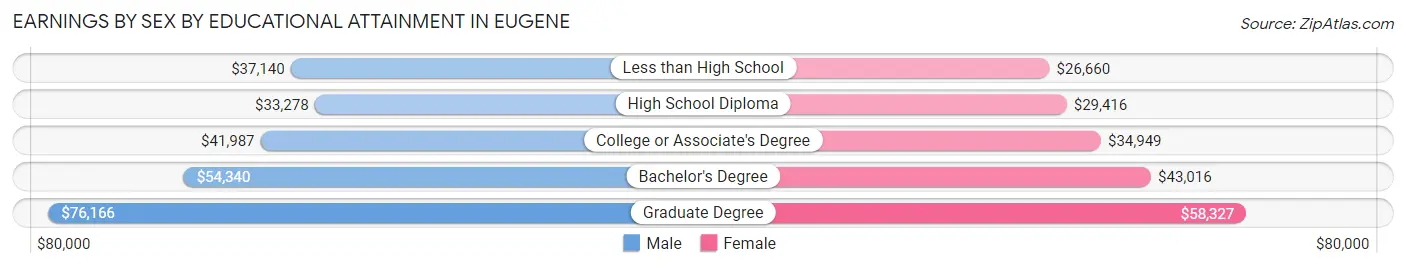
Earnings by Sex by Educational Attainment in Eugene
Average earnings in Eugene are $45,721 for men and $39,660 for women, a difference of 13.3%. Men with an educational attainment of graduate degree enjoy the highest average annual earnings of $76,166, while those with high school diploma education earn the least with $33,278. Women with an educational attainment of graduate degree earn the most with the average annual earnings of $58,327, while those with less than high school education have the smallest earnings of $26,660.
| Educational Attainment | Male Income | Female Income |
| Less than High School | $37,140 | $26,660 |
| High School Diploma | $33,278 | $29,416 |
| College or Associate's Degree | $41,987 | $34,949 |
| Bachelor's Degree | $54,340 | $43,016 |
| Graduate Degree | $76,166 | $58,327 |
| Total | $45,721 | $39,660 |
Family Income in Eugene
Family Income Brackets in Eugene
According to the Eugene family income data, there are 7,941 families falling into the $100,000 to $149,999 income range, which is the most common income bracket and makes up 21.7% of all families. Conversely, the $10,000 to $14,999 income bracket is the least frequent group with only 805 families (2.2%) belonging to this category.
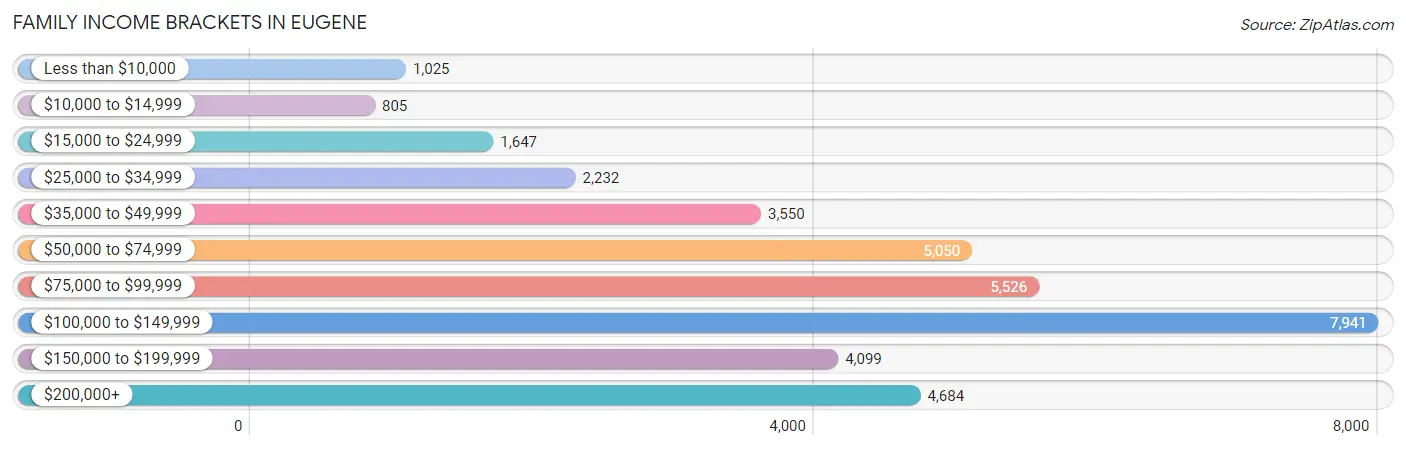
| Income Bracket | # Families | % Families |
| Less than $10,000 | 1,025 | 2.8% |
| $10,000 to $14,999 | 805 | 2.2% |
| $15,000 to $24,999 | 1,647 | 4.5% |
| $25,000 to $34,999 | 2,232 | 6.1% |
| $35,000 to $49,999 | 3,550 | 9.7% |
| $50,000 to $74,999 | 5,050 | 13.8% |
| $75,000 to $99,999 | 5,526 | 15.1% |
| $100,000 to $149,999 | 7,941 | 21.7% |
| $150,000 to $199,999 | 4,099 | 11.2% |
| $200,000+ | 4,684 | 12.8% |
Family Income by Famaliy Size in Eugene
4-person families (5,703 | 15.6%) account for the highest median family income in Eugene with $115,877 per family, while 2-person families (20,138 | 55.0%) have the highest median income of $41,926 per family member.
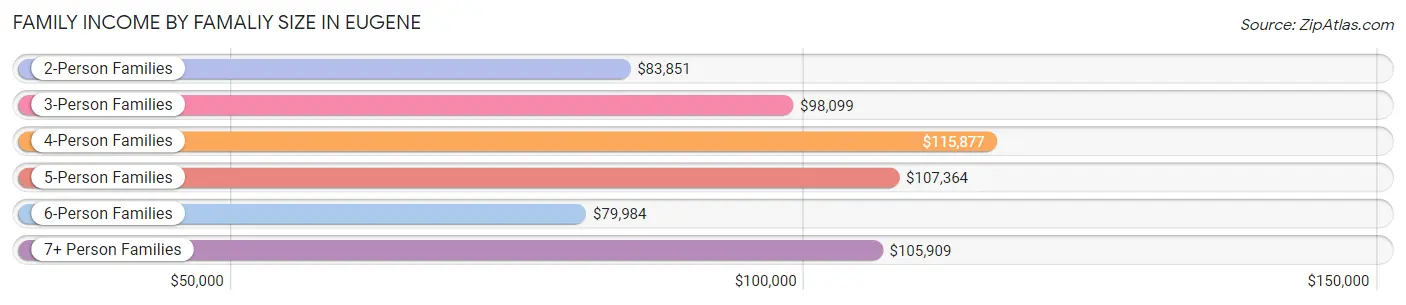
| Income Bracket | # Families | Median Income |
| 2-Person Families | 20,138 (55.0%) | $83,851 |
| 3-Person Families | 7,929 (21.7%) | $98,099 |
| 4-Person Families | 5,703 (15.6%) | $115,877 |
| 5-Person Families | 2,019 (5.5%) | $107,364 |
| 6-Person Families | 683 (1.9%) | $79,984 |
| 7+ Person Families | 124 (0.3%) | $105,909 |
| Total | 36,596 (100.0%) | $92,629 |
Family Income by Number of Earners in Eugene
The median family income in Eugene is $92,629, with families comprising 3+ earners (2,795) having the highest median family income of $156,434, while families with no earners (6,104) have the lowest median family income of $64,778, accounting for 7.6% and 16.7% of families, respectively.
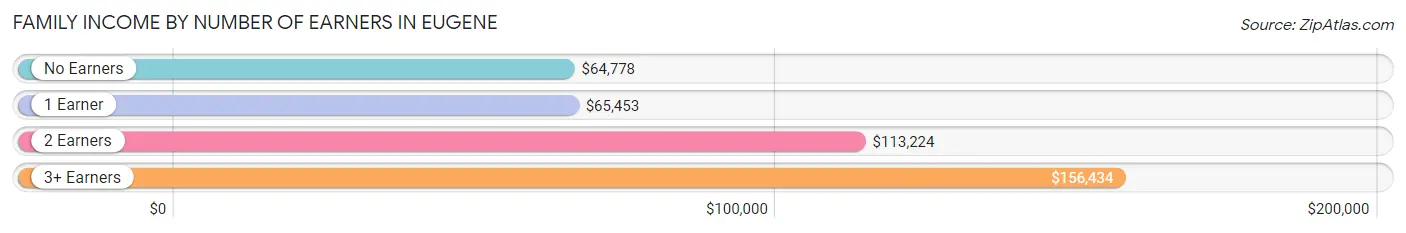
| Number of Earners | # Families | Median Income |
| No Earners | 6,104 (16.7%) | $64,778 |
| 1 Earner | 12,531 (34.2%) | $65,453 |
| 2 Earners | 15,166 (41.4%) | $113,224 |
| 3+ Earners | 2,795 (7.6%) | $156,434 |
| Total | 36,596 (100.0%) | $92,629 |
Household Income in Eugene
Household Income Brackets in Eugene
With 11,707 households falling in the category, the $100,000 to $149,999 income range is the most frequent in Eugene, accounting for 15.5% of all households. In contrast, only 3,852 households (5.1%) fall into the $10,000 to $14,999 income bracket, making it the least populous group.
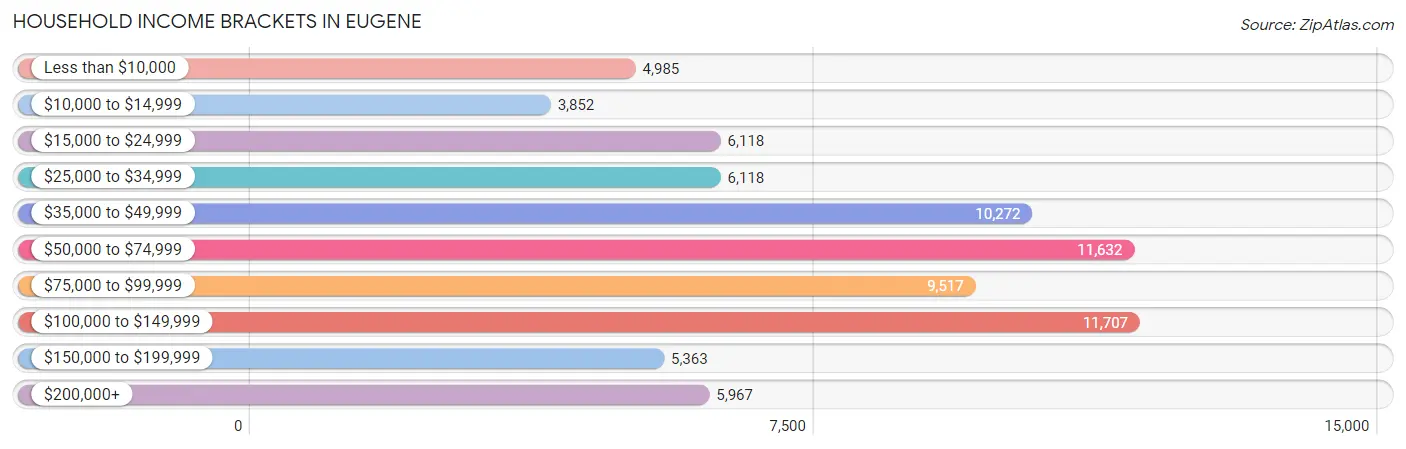
| Income Bracket | # Households | % Households |
| Less than $10,000 | 4,985 | 6.6% |
| $10,000 to $14,999 | 3,852 | 5.1% |
| $15,000 to $24,999 | 6,118 | 8.1% |
| $25,000 to $34,999 | 6,118 | 8.1% |
| $35,000 to $49,999 | 10,272 | 13.6% |
| $50,000 to $74,999 | 11,632 | 15.4% |
| $75,000 to $99,999 | 9,517 | 12.6% |
| $100,000 to $149,999 | 11,707 | 15.5% |
| $150,000 to $199,999 | 5,363 | 7.1% |
| $200,000+ | 5,967 | 7.9% |
Household Income by Householder Age in Eugene
The median household income in Eugene is $61,481, with the highest median household income of $82,834 found in the 45 to 64 years age bracket for the primary householder. A total of 20,871 households (27.6%) fall into this category. Meanwhile, the 15 to 24 years age bracket for the primary householder has the lowest median household income of $27,983, with 9,574 households (12.7%) in this group.
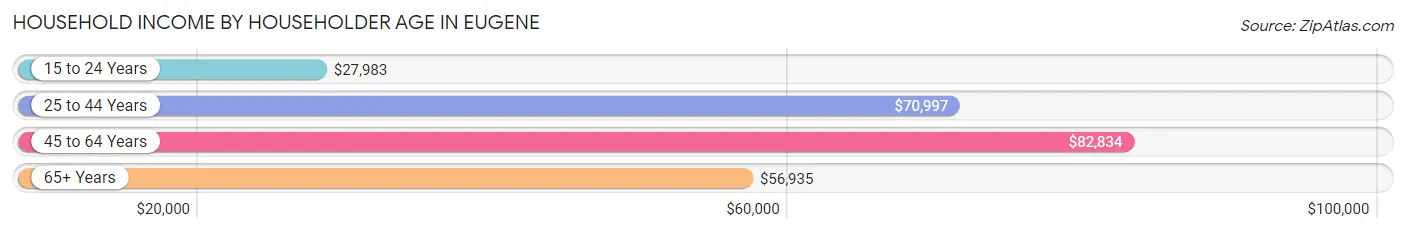
| Income Bracket | # Households | Median Income |
| 15 to 24 Years | 9,574 (12.7%) | $27,983 |
| 25 to 44 Years | 25,381 (33.6%) | $70,997 |
| 45 to 64 Years | 20,871 (27.6%) | $82,834 |
| 65+ Years | 19,706 (26.1%) | $56,935 |
| Total | 75,532 (100.0%) | $61,481 |
Poverty in Eugene
Income Below Poverty by Sex and Age in Eugene
With 18.6% poverty level for males and 20.0% for females among the residents of Eugene, 18 to 24 year old males and 18 to 24 year old females are the most vulnerable to poverty, with 6,120 males (45.8%) and 8,044 females (52.0%) in their respective age groups living below the poverty level.
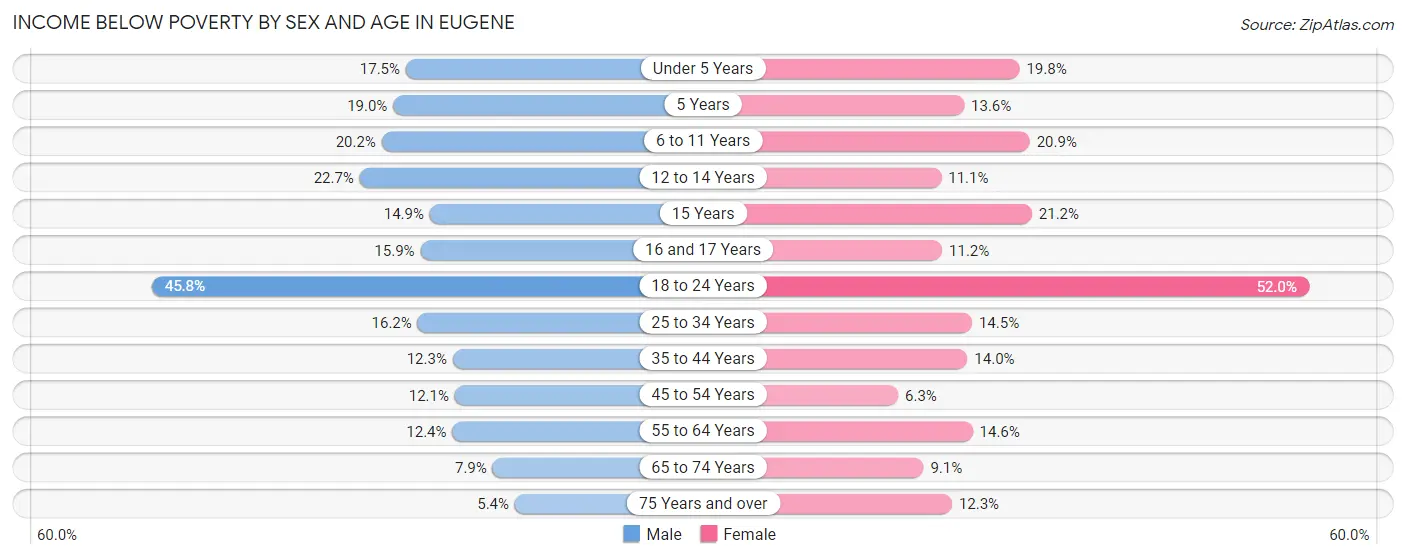
| Age Bracket | Male | Female |
| Under 5 Years | 629 (17.5%) | 649 (19.8%) |
| 5 Years | 115 (19.0%) | 87 (13.6%) |
| 6 to 11 Years | 884 (20.2%) | 1,049 (20.9%) |
| 12 to 14 Years | 601 (22.7%) | 256 (11.1%) |
| 15 Years | 120 (14.9%) | 184 (21.2%) |
| 16 and 17 Years | 262 (15.9%) | 217 (11.2%) |
| 18 to 24 Years | 6,120 (45.8%) | 8,044 (52.0%) |
| 25 to 34 Years | 2,217 (16.2%) | 1,791 (14.5%) |
| 35 to 44 Years | 1,375 (12.3%) | 1,482 (14.0%) |
| 45 to 54 Years | 1,146 (12.1%) | 538 (6.3%) |
| 55 to 64 Years | 1,051 (12.4%) | 1,412 (14.6%) |
| 65 to 74 Years | 644 (7.9%) | 889 (9.1%) |
| 75 Years and over | 279 (5.4%) | 832 (12.3%) |
| Total | 15,443 (18.6%) | 17,430 (20.0%) |
Income Above Poverty by Sex and Age in Eugene
According to the poverty statistics in Eugene, males aged 75 years and over and females aged 45 to 54 years are the age groups that are most secure financially, with 94.6% of males and 93.7% of females in these age groups living above the poverty line.
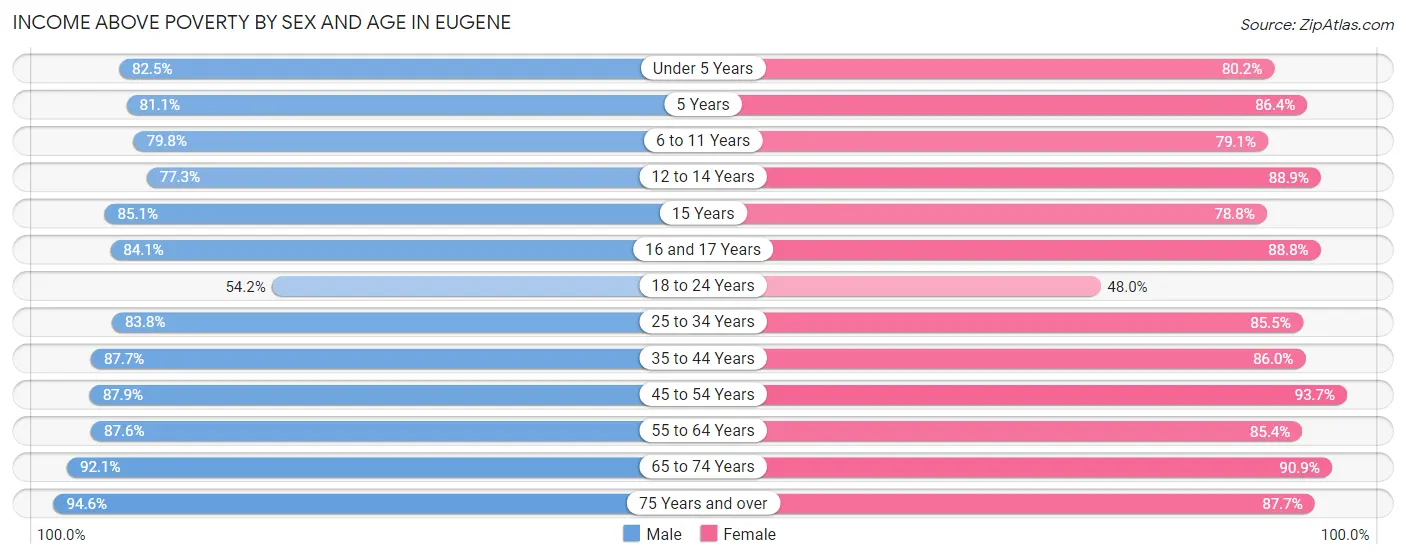
| Age Bracket | Male | Female |
| Under 5 Years | 2,958 (82.5%) | 2,630 (80.2%) |
| 5 Years | 492 (81.0%) | 552 (86.4%) |
| 6 to 11 Years | 3,485 (79.8%) | 3,964 (79.1%) |
| 12 to 14 Years | 2,049 (77.3%) | 2,055 (88.9%) |
| 15 Years | 687 (85.1%) | 685 (78.8%) |
| 16 and 17 Years | 1,384 (84.1%) | 1,725 (88.8%) |
| 18 to 24 Years | 7,233 (54.2%) | 7,424 (48.0%) |
| 25 to 34 Years | 11,444 (83.8%) | 10,564 (85.5%) |
| 35 to 44 Years | 9,783 (87.7%) | 9,108 (86.0%) |
| 45 to 54 Years | 8,330 (87.9%) | 8,045 (93.7%) |
| 55 to 64 Years | 7,449 (87.6%) | 8,282 (85.4%) |
| 65 to 74 Years | 7,530 (92.1%) | 8,882 (90.9%) |
| 75 Years and over | 4,889 (94.6%) | 5,951 (87.7%) |
| Total | 67,713 (81.4%) | 69,867 (80.0%) |
Income Below Poverty Among Married-Couple Families in Eugene
The poverty statistics for married-couple families in Eugene show that 3.2% or 859 of the total 26,561 families live below the poverty line. Families with 5 or more children have the highest poverty rate of 44.2%, comprising of 34 families. On the other hand, families with no children have the lowest poverty rate of 2.1%, which includes 352 families.
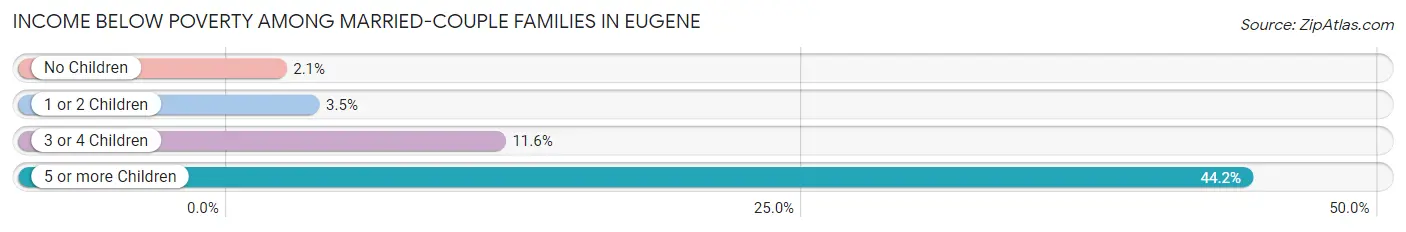
| Children | Above Poverty | Below Poverty |
| No Children | 16,404 (97.9%) | 352 (2.1%) |
| 1 or 2 Children | 7,843 (96.5%) | 287 (3.5%) |
| 3 or 4 Children | 1,412 (88.4%) | 186 (11.6%) |
| 5 or more Children | 43 (55.8%) | 34 (44.2%) |
| Total | 25,702 (96.8%) | 859 (3.2%) |
Income Below Poverty Among Single-Parent Households in Eugene
According to the poverty data in Eugene, 15.7% or 428 single-father households and 25.4% or 1,857 single-mother households are living below the poverty line. Among single-father households, those with 3 or 4 children have the highest poverty rate, with 48 households (34.3%) experiencing poverty. Likewise, among single-mother households, those with 5 or more children have the highest poverty rate, with 26 households (92.9%) falling below the poverty line.
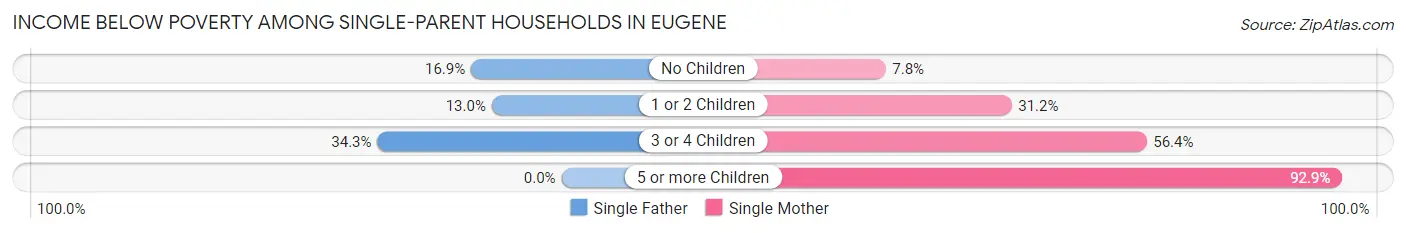
| Children | Single Father | Single Mother |
| No Children | 196 (16.9%) | 186 (7.8%) |
| 1 or 2 Children | 184 (13.0%) | 1,379 (31.2%) |
| 3 or 4 Children | 48 (34.3%) | 266 (56.4%) |
| 5 or more Children | 0 (0.0%) | 26 (92.9%) |
| Total | 428 (15.7%) | 1,857 (25.4%) |
Income Below Poverty Among Married-Couple vs Single-Parent Households in Eugene
The poverty data for Eugene shows that 859 of the married-couple family households (3.2%) and 2,285 of the single-parent households (22.8%) are living below the poverty level. Within the married-couple family households, those with 5 or more children have the highest poverty rate, with 34 households (44.2%) falling below the poverty line. Among the single-parent households, those with 5 or more children have the highest poverty rate, with 26 household (92.9%) living below poverty.
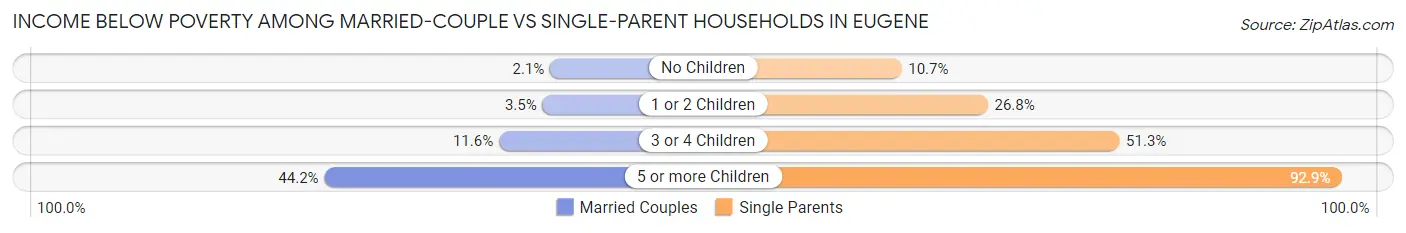
| Children | Married-Couple Families | Single-Parent Households |
| No Children | 352 (2.1%) | 382 (10.7%) |
| 1 or 2 Children | 287 (3.5%) | 1,563 (26.8%) |
| 3 or 4 Children | 186 (11.6%) | 314 (51.3%) |
| 5 or more Children | 34 (44.2%) | 26 (92.9%) |
| Total | 859 (3.2%) | 2,285 (22.8%) |
Race in Eugene
The most populous races in Eugene are White / Caucasian (142,313 | 80.5%), Hispanic or Latino (18,391 | 10.4%), and Two or more Races (17,040 | 9.6%).
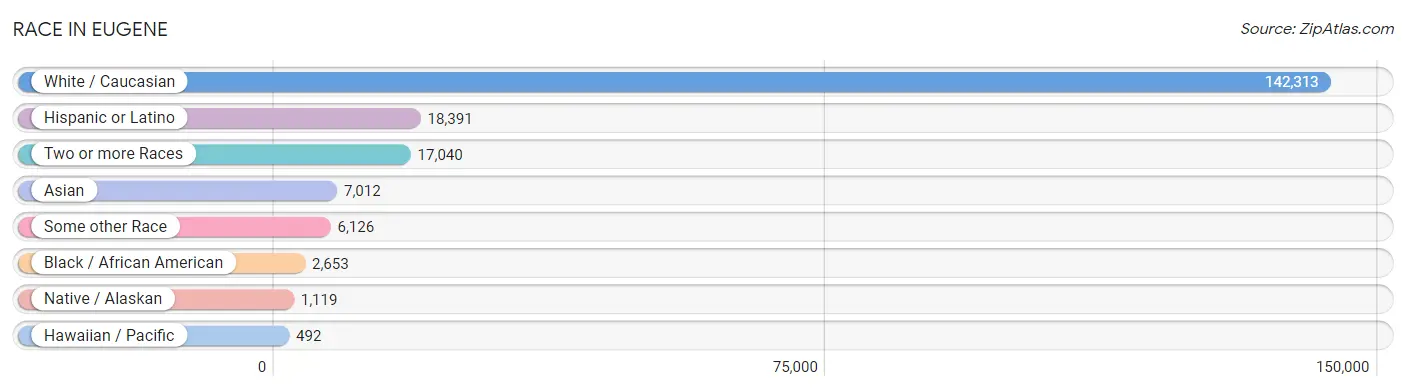
| Race | # Population | % Population |
| Asian | 7,012 | 4.0% |
| Black / African American | 2,653 | 1.5% |
| Hawaiian / Pacific | 492 | 0.3% |
| Hispanic or Latino | 18,391 | 10.4% |
| Native / Alaskan | 1,119 | 0.6% |
| White / Caucasian | 142,313 | 80.5% |
| Two or more Races | 17,040 | 9.6% |
| Some other Race | 6,126 | 3.5% |
| Total | 176,755 | 100.0% |
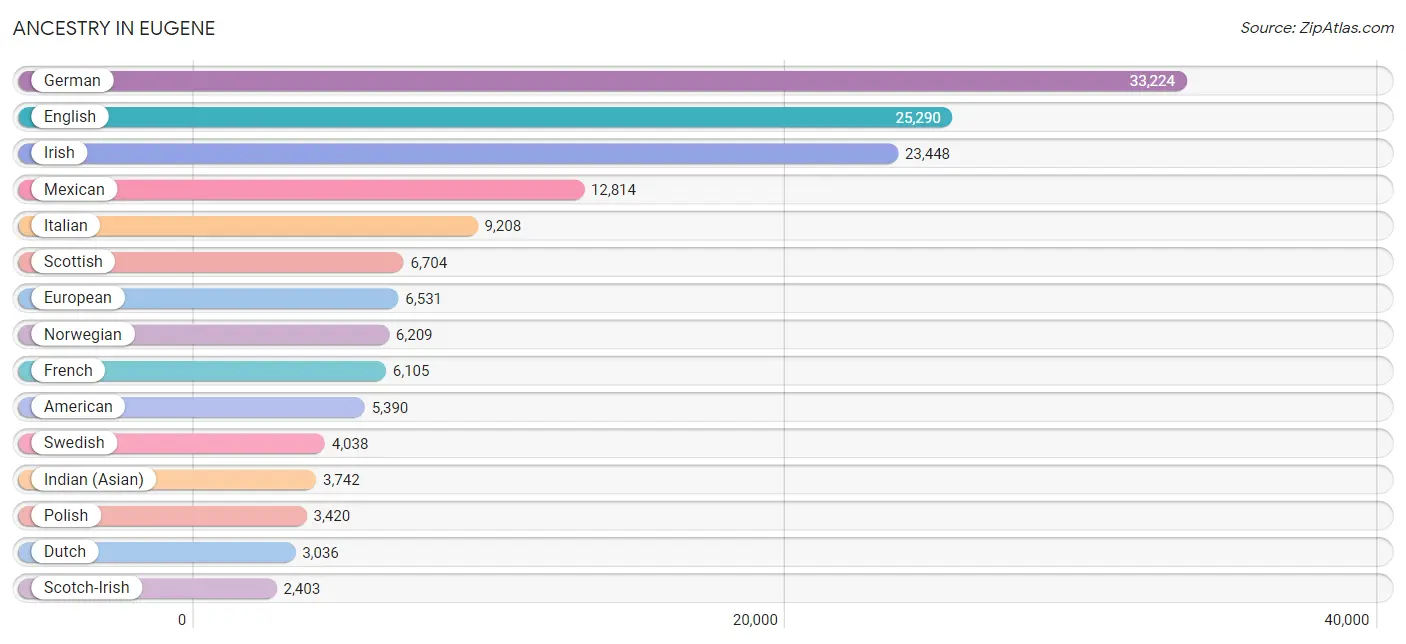
Ancestry in Eugene
The most populous ancestries reported in Eugene are German (33,224 | 18.8%), English (25,290 | 14.3%), Irish (23,448 | 13.3%), Mexican (12,814 | 7.2%), and Italian (9,208 | 5.2%), together accounting for 58.8% of all Eugene residents.
| Ancestry | # Population | % Population |
| Afghan | 65 | 0.0% |
| African | 376 | 0.2% |
| Alaska Native | 10 | 0.0% |
| Alaskan Athabascan | 77 | 0.0% |
| Albanian | 14 | 0.0% |
| Aleut | 84 | 0.1% |
| Alsatian | 22 | 0.0% |
| American | 5,390 | 3.0% |
| Apache | 195 | 0.1% |
| Arab | 617 | 0.4% |
| Argentinean | 67 | 0.0% |
| Armenian | 421 | 0.2% |
| Australian | 175 | 0.1% |
| Austrian | 604 | 0.3% |
| Bangladeshi | 49 | 0.0% |
| Basque | 95 | 0.1% |
| Belgian | 199 | 0.1% |
| Belizean | 18 | 0.0% |
| Bhutanese | 2,075 | 1.2% |
| Blackfeet | 378 | 0.2% |
| Bolivian | 74 | 0.0% |
| Brazilian | 202 | 0.1% |
| British | 2,048 | 1.2% |
| Bulgarian | 29 | 0.0% |
| Burmese | 1,581 | 0.9% |
| Cajun | 128 | 0.1% |
| Canadian | 403 | 0.2% |
| Carpatho Rusyn | 7 | 0.0% |
| Celtic | 20 | 0.0% |
| Central American | 1,399 | 0.8% |
| Central American Indian | 30 | 0.0% |
| Cherokee | 966 | 0.5% |
| Cheyenne | 10 | 0.0% |
| Chickasaw | 24 | 0.0% |
| Chilean | 64 | 0.0% |
| Chinese | 60 | 0.0% |
| Chippewa | 191 | 0.1% |
| Choctaw | 320 | 0.2% |
| Colombian | 478 | 0.3% |
| Comanche | 79 | 0.0% |
| Costa Rican | 190 | 0.1% |
| Cree | 56 | 0.0% |
| Creek | 44 | 0.0% |
| Croatian | 187 | 0.1% |
| Cuban | 298 | 0.2% |
| Czech | 1,097 | 0.6% |
| Czechoslovakian | 150 | 0.1% |
| Danish | 1,757 | 1.0% |
| Delaware | 23 | 0.0% |
| Dominican | 41 | 0.0% |
| Dutch | 3,036 | 1.7% |
| Dutch West Indian | 9 | 0.0% |
| Eastern European | 1,054 | 0.6% |
| Ecuadorian | 116 | 0.1% |
| Egyptian | 95 | 0.1% |
| English | 25,290 | 14.3% |
| Estonian | 60 | 0.0% |
| European | 6,531 | 3.7% |
| Fijian | 58 | 0.0% |
| Filipino | 26 | 0.0% |
| Finnish | 782 | 0.4% |
| French | 6,105 | 3.5% |
| French American Indian | 6 | 0.0% |
| French Canadian | 1,069 | 0.6% |
| German | 33,224 | 18.8% |
| German Russian | 11 | 0.0% |
| Ghanaian | 118 | 0.1% |
| Greek | 873 | 0.5% |
| Guamanian / Chamorro | 107 | 0.1% |
| Guatemalan | 570 | 0.3% |
| Haitian | 8 | 0.0% |
| Honduran | 35 | 0.0% |
| Hopi | 16 | 0.0% |
| Hungarian | 763 | 0.4% |
| Icelander | 109 | 0.1% |
| Indian (Asian) | 3,742 | 2.1% |
| Indonesian | 112 | 0.1% |
| Inupiat | 99 | 0.1% |
| Iranian | 488 | 0.3% |
| Iraqi | 18 | 0.0% |
| Irish | 23,448 | 13.3% |
| Iroquois | 11 | 0.0% |
| Israeli | 230 | 0.1% |
| Italian | 9,208 | 5.2% |
| Jamaican | 38 | 0.0% |
| Japanese | 215 | 0.1% |
| Jordanian | 48 | 0.0% |
| Kenyan | 35 | 0.0% |
| Kiowa | 53 | 0.0% |
| Korean | 2,117 | 1.2% |
| Laotian | 146 | 0.1% |
| Latvian | 88 | 0.1% |
| Lebanese | 134 | 0.1% |
| Lithuanian | 277 | 0.2% |
| Lumbee | 31 | 0.0% |
| Luxembourger | 33 | 0.0% |
| Malaysian | 26 | 0.0% |
| Maltese | 4 | 0.0% |
| Mexican | 12,814 | 7.2% |
| Mexican American Indian | 369 | 0.2% |
| Mongolian | 38 | 0.0% |
| Moroccan | 35 | 0.0% |
| Native Hawaiian | 594 | 0.3% |
| Navajo | 92 | 0.1% |
| Nepalese | 12 | 0.0% |
| New Zealander | 38 | 0.0% |
| Nicaraguan | 55 | 0.0% |
| Nigerian | 180 | 0.1% |
| Northern European | 1,266 | 0.7% |
| Norwegian | 6,209 | 3.5% |
| Okinawan | 21 | 0.0% |
| Osage | 27 | 0.0% |
| Paiute | 11 | 0.0% |
| Pakistani | 215 | 0.1% |
| Palestinian | 68 | 0.0% |
| Panamanian | 156 | 0.1% |
| Pennsylvania German | 44 | 0.0% |
| Peruvian | 205 | 0.1% |
| Polish | 3,420 | 1.9% |
| Portuguese | 1,246 | 0.7% |
| Potawatomi | 176 | 0.1% |
| Pueblo | 1 | 0.0% |
| Puerto Rican | 627 | 0.4% |
| Romanian | 272 | 0.2% |
| Russian | 2,035 | 1.1% |
| Salvadoran | 393 | 0.2% |
| Samoan | 136 | 0.1% |
| Scandinavian | 1,784 | 1.0% |
| Scotch-Irish | 2,403 | 1.4% |
| Scottish | 6,704 | 3.8% |
| Seminole | 30 | 0.0% |
| Serbian | 144 | 0.1% |
| Shoshone | 48 | 0.0% |
| Sioux | 177 | 0.1% |
| Slavic | 274 | 0.2% |
| Slovak | 174 | 0.1% |
| Slovene | 38 | 0.0% |
| South African | 9 | 0.0% |
| South American | 1,060 | 0.6% |
| Spaniard | 522 | 0.3% |
| Spanish | 491 | 0.3% |
| Sri Lankan | 656 | 0.4% |
| Subsaharan African | 981 | 0.6% |
| Swedish | 4,038 | 2.3% |
| Swiss | 867 | 0.5% |
| Syrian | 38 | 0.0% |
| Thai | 910 | 0.5% |
| Tlingit-Haida | 4 | 0.0% |
| Turkish | 80 | 0.1% |
| Ugandan | 53 | 0.0% |
| Ukrainian | 779 | 0.4% |
| Uruguayan | 8 | 0.0% |
| Venezuelan | 48 | 0.0% |
| Welsh | 2,270 | 1.3% |
| West Indian | 60 | 0.0% |
| Yakama | 7 | 0.0% |
| Yaqui | 6 | 0.0% |
| Yugoslavian | 123 | 0.1% | View All 158 Rows |
Immigrants in Eugene
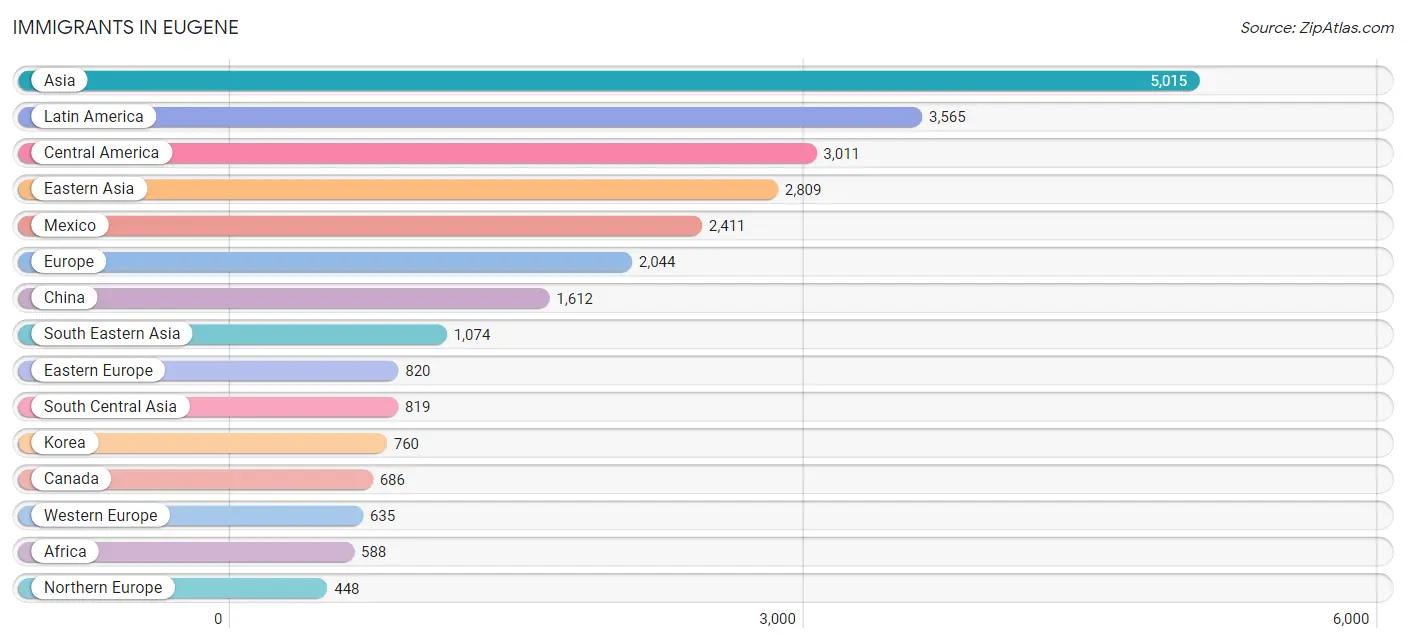
The most numerous immigrant groups reported in Eugene came from Asia (5,015 | 2.8%), Latin America (3,565 | 2.0%), Central America (3,011 | 1.7%), Eastern Asia (2,809 | 1.6%), and Mexico (2,411 | 1.4%), together accounting for 9.5% of all Eugene residents.
| Immigration Origin | # Population | % Population |
| Afghanistan | 109 | 0.1% |
| Africa | 588 | 0.3% |
| Argentina | 28 | 0.0% |
| Asia | 5,015 | 2.8% |
| Australia | 89 | 0.1% |
| Austria | 76 | 0.0% |
| Azores | 9 | 0.0% |
| Bangladesh | 29 | 0.0% |
| Belize | 18 | 0.0% |
| Bolivia | 36 | 0.0% |
| Brazil | 149 | 0.1% |
| Bulgaria | 75 | 0.0% |
| Cambodia | 188 | 0.1% |
| Canada | 686 | 0.4% |
| Caribbean | 126 | 0.1% |
| Central America | 3,011 | 1.7% |
| China | 1,612 | 0.9% |
| Colombia | 29 | 0.0% |
| Costa Rica | 212 | 0.1% |
| Cuba | 84 | 0.1% |
| Czechoslovakia | 3 | 0.0% |
| Denmark | 14 | 0.0% |
| Dominica | 7 | 0.0% |
| Eastern Africa | 94 | 0.1% |
| Eastern Asia | 2,809 | 1.6% |
| Eastern Europe | 820 | 0.5% |
| Ecuador | 42 | 0.0% |
| El Salvador | 131 | 0.1% |
| England | 182 | 0.1% |
| Europe | 2,044 | 1.2% |
| Fiji | 31 | 0.0% |
| France | 126 | 0.1% |
| Germany | 311 | 0.2% |
| Ghana | 161 | 0.1% |
| Greece | 9 | 0.0% |
| Guatemala | 223 | 0.1% |
| Haiti | 23 | 0.0% |
| Hong Kong | 45 | 0.0% |
| Hungary | 41 | 0.0% |
| India | 218 | 0.1% |
| Indonesia | 67 | 0.0% |
| Iran | 274 | 0.2% |
| Iraq | 11 | 0.0% |
| Israel | 103 | 0.1% |
| Italy | 35 | 0.0% |
| Jamaica | 12 | 0.0% |
| Japan | 437 | 0.3% |
| Jordan | 16 | 0.0% |
| Kenya | 27 | 0.0% |
| Korea | 760 | 0.4% |
| Kuwait | 21 | 0.0% |
| Laos | 4 | 0.0% |
| Latin America | 3,565 | 2.0% |
| Lebanon | 18 | 0.0% |
| Malaysia | 86 | 0.1% |
| Mexico | 2,411 | 1.4% |
| Micronesia | 41 | 0.0% |
| Middle Africa | 7 | 0.0% |
| Nepal | 162 | 0.1% |
| Netherlands | 115 | 0.1% |
| Nigeria | 31 | 0.0% |
| Northern Africa | 9 | 0.0% |
| Northern Europe | 448 | 0.3% |
| Norway | 38 | 0.0% |
| Oceania | 222 | 0.1% |
| Pakistan | 27 | 0.0% |
| Panama | 16 | 0.0% |
| Peru | 101 | 0.1% |
| Philippines | 417 | 0.2% |
| Poland | 144 | 0.1% |
| Portugal | 29 | 0.0% |
| Romania | 81 | 0.1% |
| Russia | 296 | 0.2% |
| Saudi Arabia | 53 | 0.0% |
| Scotland | 14 | 0.0% |
| Serbia | 22 | 0.0% |
| Singapore | 72 | 0.0% |
| South Africa | 147 | 0.1% |
| South America | 428 | 0.2% |
| South Central Asia | 819 | 0.5% |
| South Eastern Asia | 1,074 | 0.6% |
| Southern Europe | 141 | 0.1% |
| Spain | 68 | 0.0% |
| Sweden | 9 | 0.0% |
| Switzerland | 7 | 0.0% |
| Taiwan | 86 | 0.1% |
| Thailand | 59 | 0.0% |
| Turkey | 5 | 0.0% |
| Uganda | 67 | 0.0% |
| Ukraine | 138 | 0.1% |
| Uruguay | 13 | 0.0% |
| Venezuela | 30 | 0.0% |
| Vietnam | 160 | 0.1% |
| Western Africa | 331 | 0.2% |
| Western Asia | 291 | 0.2% |
| Western Europe | 635 | 0.4% | View All 96 Rows |
Sex and Age in Eugene
Sex and Age in Eugene
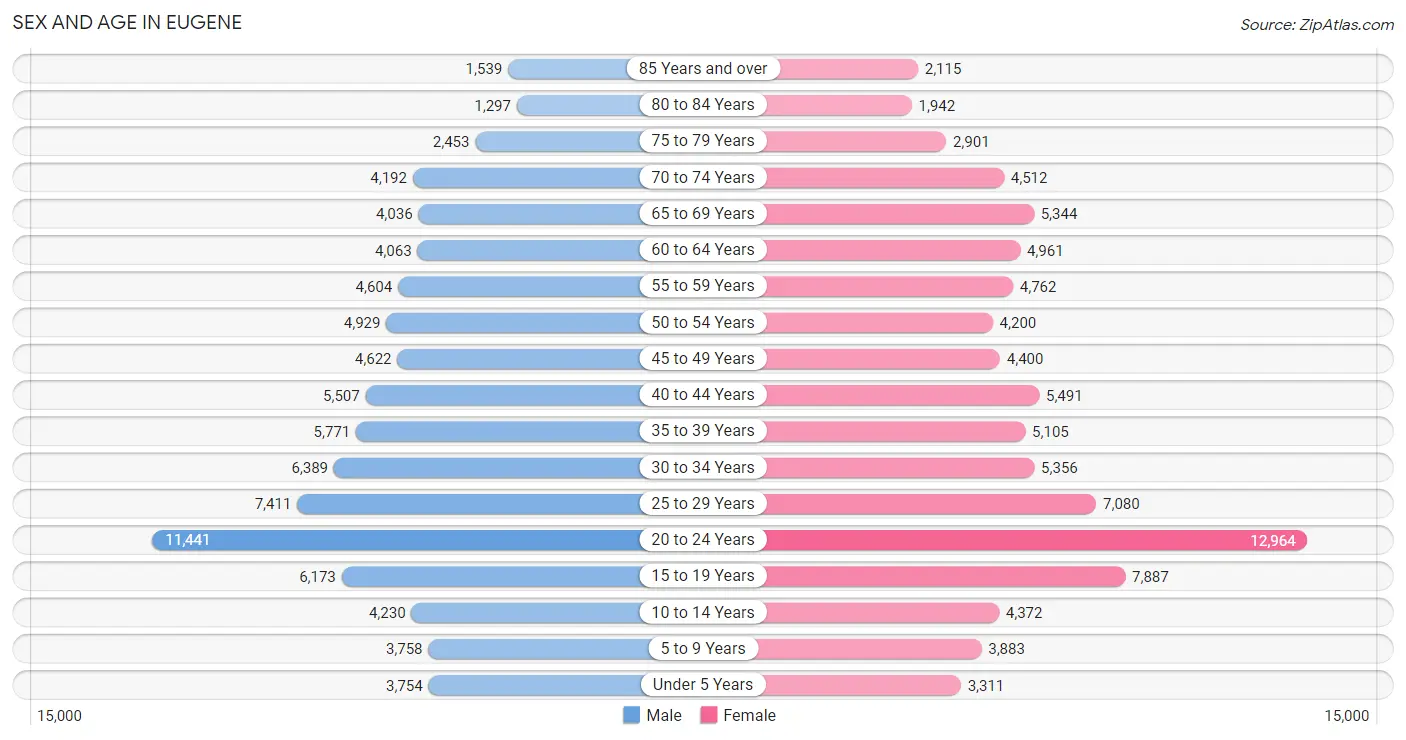
The most populous age groups in Eugene are 20 to 24 Years (11,441 | 13.3%) for men and 20 to 24 Years (12,964 | 14.3%) for women.
| Age Bracket | Male | Female |
| Under 5 Years | 3,754 (4.4%) | 3,311 (3.7%) |
| 5 to 9 Years | 3,758 (4.4%) | 3,883 (4.3%) |
| 10 to 14 Years | 4,230 (4.9%) | 4,372 (4.8%) |
| 15 to 19 Years | 6,173 (7.2%) | 7,887 (8.7%) |
| 20 to 24 Years | 11,441 (13.3%) | 12,964 (14.3%) |
| 25 to 29 Years | 7,411 (8.6%) | 7,080 (7.8%) |
| 30 to 34 Years | 6,389 (7.4%) | 5,356 (5.9%) |
| 35 to 39 Years | 5,771 (6.7%) | 5,105 (5.6%) |
| 40 to 44 Years | 5,507 (6.4%) | 5,491 (6.1%) |
| 45 to 49 Years | 4,622 (5.4%) | 4,400 (4.9%) |
| 50 to 54 Years | 4,929 (5.7%) | 4,200 (4.6%) |
| 55 to 59 Years | 4,604 (5.3%) | 4,762 (5.3%) |
| 60 to 64 Years | 4,063 (4.7%) | 4,961 (5.5%) |
| 65 to 69 Years | 4,036 (4.7%) | 5,344 (5.9%) |
| 70 to 74 Years | 4,192 (4.9%) | 4,512 (5.0%) |
| 75 to 79 Years | 2,453 (2.9%) | 2,901 (3.2%) |
| 80 to 84 Years | 1,297 (1.5%) | 1,942 (2.1%) |
| 85 Years and over | 1,539 (1.8%) | 2,115 (2.3%) |
| Total | 86,169 (100.0%) | 90,586 (100.0%) |
Families and Households in Eugene
Median Family Size in Eugene
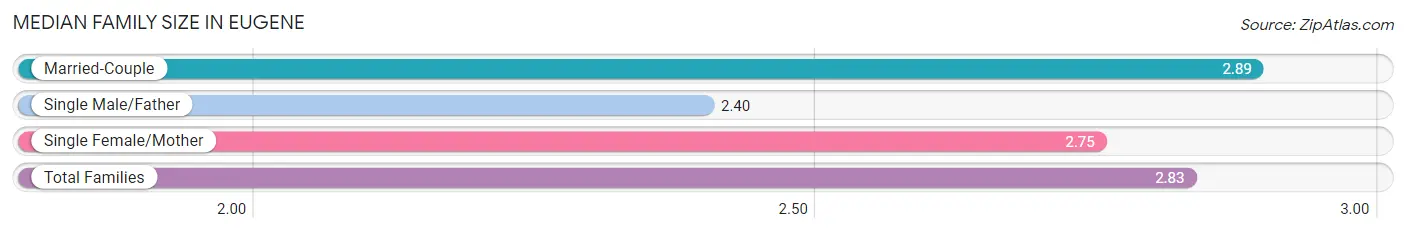
The median family size in Eugene is 2.83 persons per family, with married-couple families (26,561 | 72.6%) accounting for the largest median family size of 2.89 persons per family. On the other hand, single male/father families (2,720 | 7.4%) represent the smallest median family size with 2.40 persons per family.
| Family Type | # Families | Family Size |
| Married-Couple | 26,561 (72.6%) | 2.89 |
| Single Male/Father | 2,720 (7.4%) | 2.40 |
| Single Female/Mother | 7,315 (20.0%) | 2.75 |
| Total Families | 36,596 (100.0%) | 2.83 |
Median Household Size in Eugene
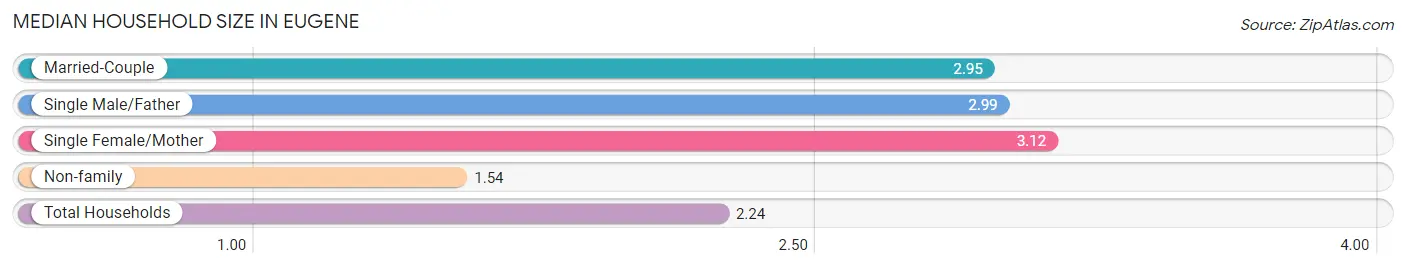
The median household size in Eugene is 2.24 persons per household, with single female/mother households (7,315 | 9.7%) accounting for the largest median household size of 3.12 persons per household. non-family households (38,936 | 51.5%) represent the smallest median household size with 1.54 persons per household.
| Household Type | # Households | Household Size |
| Married-Couple | 26,561 (35.2%) | 2.95 |
| Single Male/Father | 2,720 (3.6%) | 2.99 |
| Single Female/Mother | 7,315 (9.7%) | 3.12 |
| Non-family | 38,936 (51.5%) | 1.54 |
| Total Households | 75,532 (100.0%) | 2.24 |
Household Size by Marriage Status in Eugene
Out of a total of 75,532 households in Eugene, 36,596 (48.4%) are family households, while 38,936 (51.5%) are nonfamily households. The most numerous type of family households are 2-person households, comprising 18,095, and the most common type of nonfamily households are 1-person households, comprising 26,090.
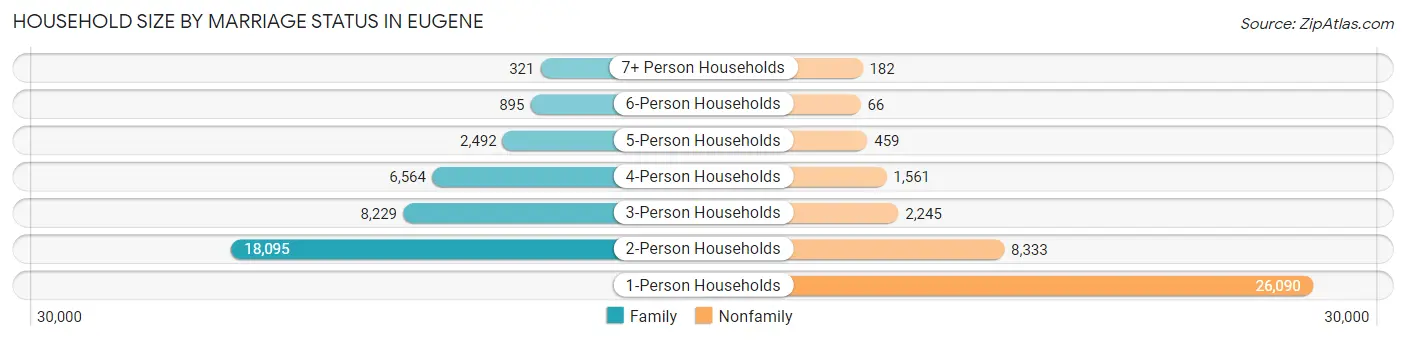
| Household Size | Family Households | Nonfamily Households |
| 1-Person Households | - | 26,090 (34.5%) |
| 2-Person Households | 18,095 (24.0%) | 8,333 (11.0%) |
| 3-Person Households | 8,229 (10.9%) | 2,245 (3.0%) |
| 4-Person Households | 6,564 (8.7%) | 1,561 (2.1%) |
| 5-Person Households | 2,492 (3.3%) | 459 (0.6%) |
| 6-Person Households | 895 (1.2%) | 66 (0.1%) |
| 7+ Person Households | 321 (0.4%) | 182 (0.2%) |
| Total | 36,596 (48.4%) | 38,936 (51.5%) |
Female Fertility in Eugene
Fertility by Age in Eugene
Average fertility rate in Eugene is 33.0 births per 1,000 women. Women in the age bracket of 20 to 34 years have the highest fertility rate with 42.0 births per 1,000 women. Women in the age bracket of 20 to 34 years acount for 66.3% of all women with births.
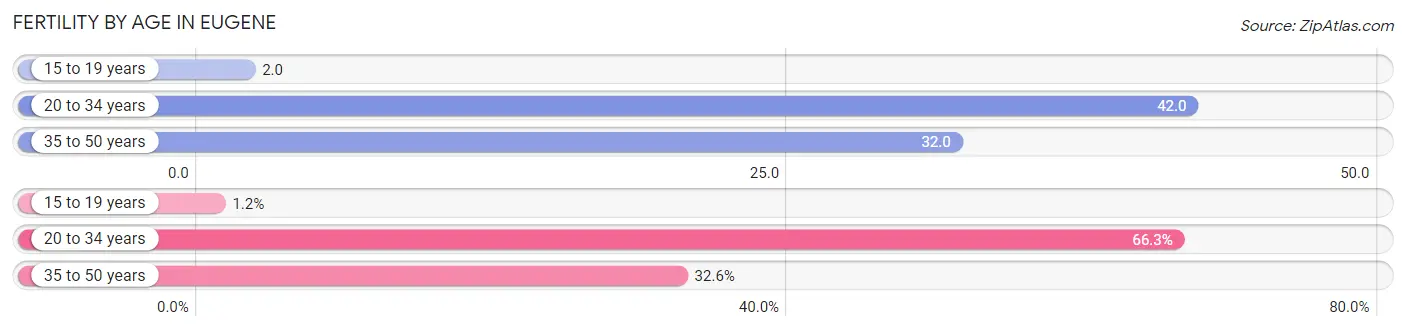
| Age Bracket | Women with Births | Births / 1,000 Women |
| 15 to 19 years | 19 (1.2%) | 2.0 |
| 20 to 34 years | 1,065 (66.3%) | 42.0 |
| 35 to 50 years | 523 (32.6%) | 32.0 |
| Total | 1,607 (100.0%) | 33.0 |
Fertility by Age by Marriage Status in Eugene
69.3% of women with births (1,607) in Eugene are married. The highest percentage of unmarried women with births falls into 15 to 19 years age bracket with 100.0% of them unmarried at the time of birth, while the lowest percentage of unmarried women with births belong to 35 to 50 years age bracket with 11.9% of them unmarried.
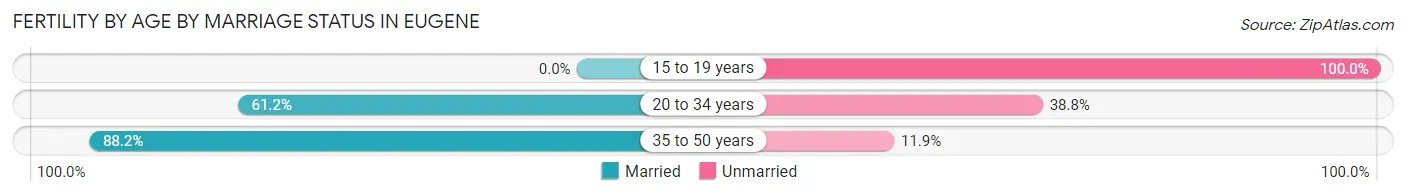
| Age Bracket | Married | Unmarried |
| 15 to 19 years | 0 (0.0%) | 19 (100.0%) |
| 20 to 34 years | 652 (61.2%) | 413 (38.8%) |
| 35 to 50 years | 461 (88.1%) | 62 (11.8%) |
| Total | 1,114 (69.3%) | 493 (30.7%) |
Fertility by Education in Eugene
Average fertility rate in Eugene is 33.0 births per 1,000 women. Women with the education attainment of graduate degree have the highest fertility rate of 66.0 births per 1,000 women, while women with the education attainment of college or associate's degree have the lowest fertility at 19.0 births per 1,000 women. Women with the education attainment of graduate degree represent 26.7% of all women with births.
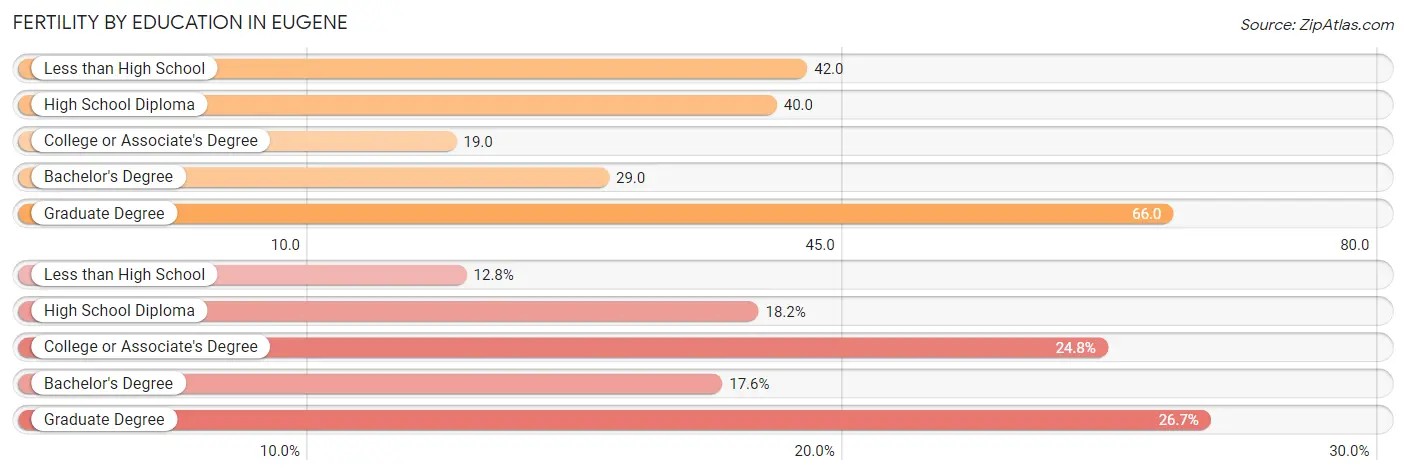
| Educational Attainment | Women with Births | Births / 1,000 Women |
| Less than High School | 205 (12.8%) | 42.0 |
| High School Diploma | 293 (18.2%) | 40.0 |
| College or Associate's Degree | 398 (24.8%) | 19.0 |
| Bachelor's Degree | 282 (17.5%) | 29.0 |
| Graduate Degree | 429 (26.7%) | 66.0 |
| Total | 1,607 (100.0%) | 33.0 |
Fertility by Education by Marriage Status in Eugene
30.7% of women with births in Eugene are unmarried. Women with the educational attainment of graduate degree are most likely to be married with 99.5% of them married at childbirth, while women with the educational attainment of high school diploma are least likely to be married with 75.1% of them unmarried at childbirth.
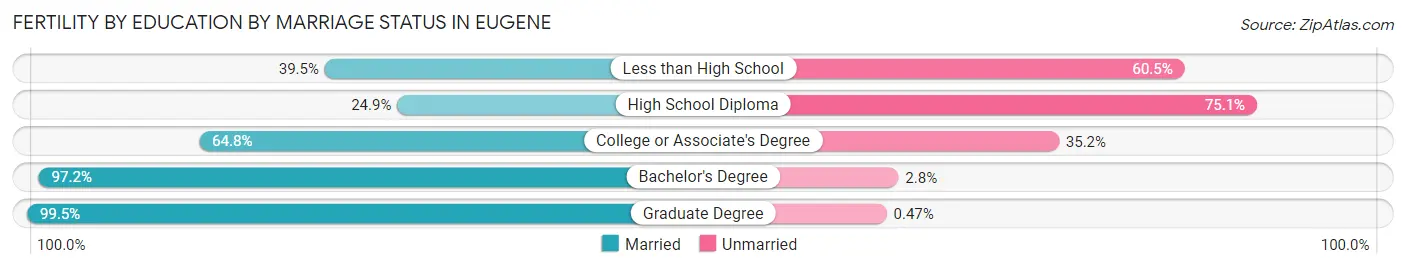
| Educational Attainment | Married | Unmarried |
| Less than High School | 81 (39.5%) | 124 (60.5%) |
| High School Diploma | 73 (24.9%) | 220 (75.1%) |
| College or Associate's Degree | 258 (64.8%) | 140 (35.2%) |
| Bachelor's Degree | 274 (97.2%) | 8 (2.8%) |
| Graduate Degree | 427 (99.5%) | 2 (0.5%) |
| Total | 1,114 (69.3%) | 493 (30.7%) |
Employment Characteristics in Eugene
Employment by Class of Employer in Eugene
Among the 87,182 employed individuals in Eugene, private company employees (52,199 | 59.9%), not-for-profit organizations (9,201 | 10.5%), and state government employees (8,686 | 10.0%) make up the most common classes of employment.
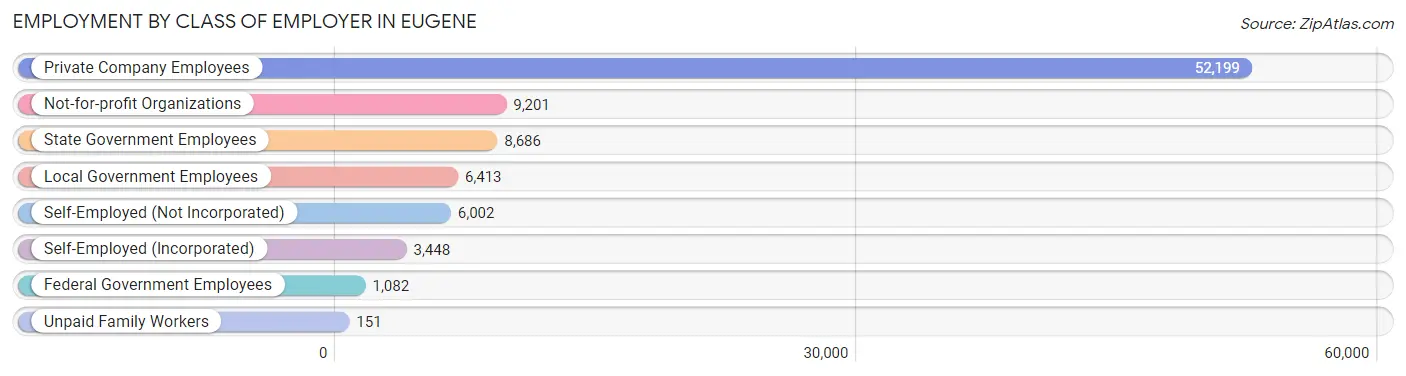
| Employer Class | # Employees | % Employees |
| Private Company Employees | 52,199 | 59.9% |
| Self-Employed (Incorporated) | 3,448 | 4.0% |
| Self-Employed (Not Incorporated) | 6,002 | 6.9% |
| Not-for-profit Organizations | 9,201 | 10.5% |
| Local Government Employees | 6,413 | 7.4% |
| State Government Employees | 8,686 | 10.0% |
| Federal Government Employees | 1,082 | 1.2% |
| Unpaid Family Workers | 151 | 0.2% |
| Total | 87,182 | 100.0% |
Employment Status by Age in Eugene
According to the labor force statistics for Eugene, out of the total population over 16 years of age (151,771), 62.9% or 95,464 individuals are in the labor force, with 7.1% or 6,778 of them unemployed. The age group with the highest labor force participation rate is 30 to 34 years, with 87.3% or 10,253 individuals in the labor force. Within the labor force, the 16 to 19 years age range has the highest percentage of unemployed individuals, with 22.1% or 1,067 of them being unemployed.
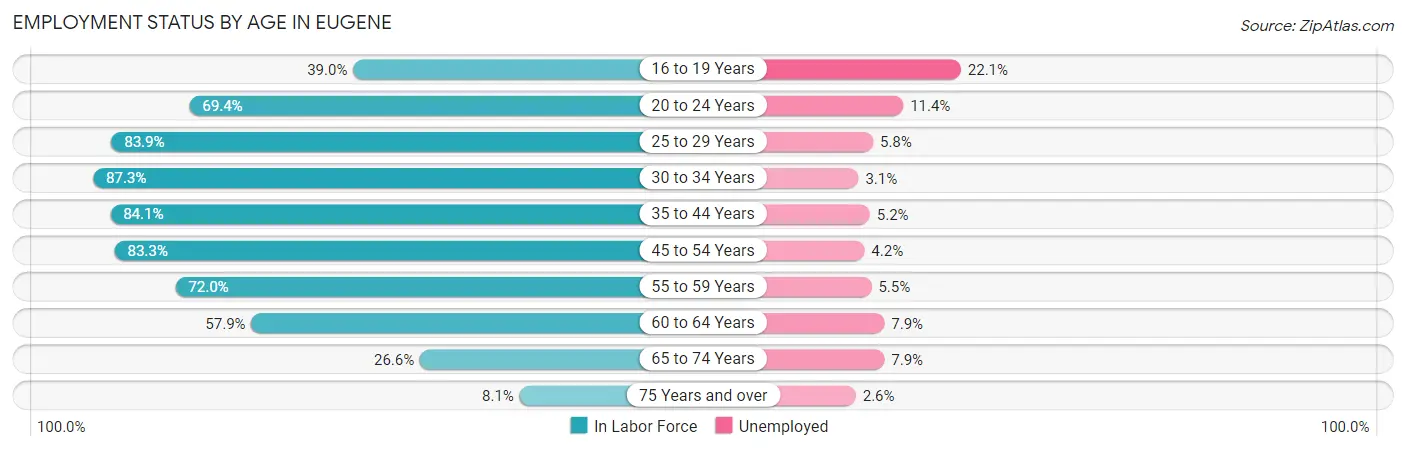
| Age Bracket | In Labor Force | Unemployed |
| 16 to 19 Years | 4,830 (39.0%) | 1,067 (22.1%) |
| 20 to 24 Years | 16,937 (69.4%) | 1,931 (11.4%) |
| 25 to 29 Years | 12,158 (83.9%) | 705 (5.8%) |
| 30 to 34 Years | 10,253 (87.3%) | 318 (3.1%) |
| 35 to 44 Years | 18,396 (84.1%) | 957 (5.2%) |
| 45 to 54 Years | 15,120 (83.3%) | 635 (4.2%) |
| 55 to 59 Years | 6,744 (72.0%) | 371 (5.5%) |
| 60 to 64 Years | 5,225 (57.9%) | 413 (7.9%) |
| 65 to 74 Years | 4,810 (26.6%) | 380 (7.9%) |
| 75 Years and over | 992 (8.1%) | 26 (2.6%) |
| Total | 95,464 (62.9%) | 6,778 (7.1%) |
Employment Status by Educational Attainment in Eugene
According to labor force statistics for Eugene, 80.2% of individuals (67,890) out of the total population between 25 and 64 years of age (84,651) are in the labor force, with 5.0% or 3,394 of them being unemployed. The group with the highest labor force participation rate are those with the educational attainment of bachelor's degree or higher, with 86.5% or 31,617 individuals in the labor force. Within the labor force, individuals with high school diploma education have the highest percentage of unemployment, with 6.8% or 718 of them being unemployed.
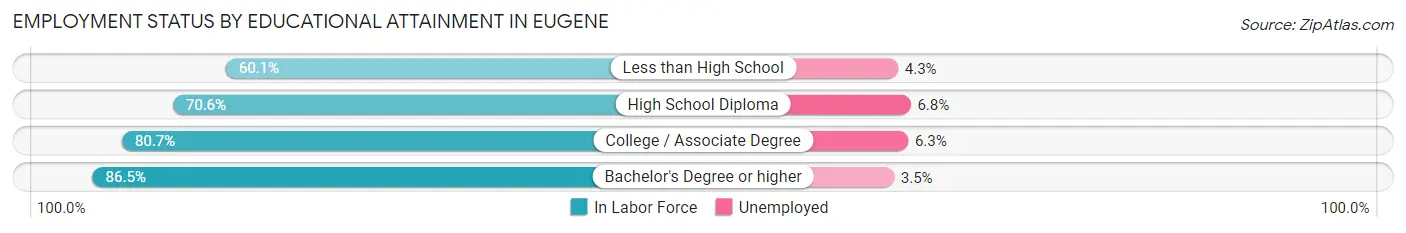
| Educational Attainment | In Labor Force | Unemployed |
| Less than High School | 2,944 (60.1%) | 211 (4.3%) |
| High School Diploma | 10,553 (70.6%) | 1,016 (6.8%) |
| College / Associate Degree | 22,802 (80.7%) | 1,780 (6.3%) |
| Bachelor's Degree or higher | 31,617 (86.5%) | 1,279 (3.5%) |
| Total | 67,890 (80.2%) | 4,233 (5.0%) |
Employment Occupations by Sex in Eugene
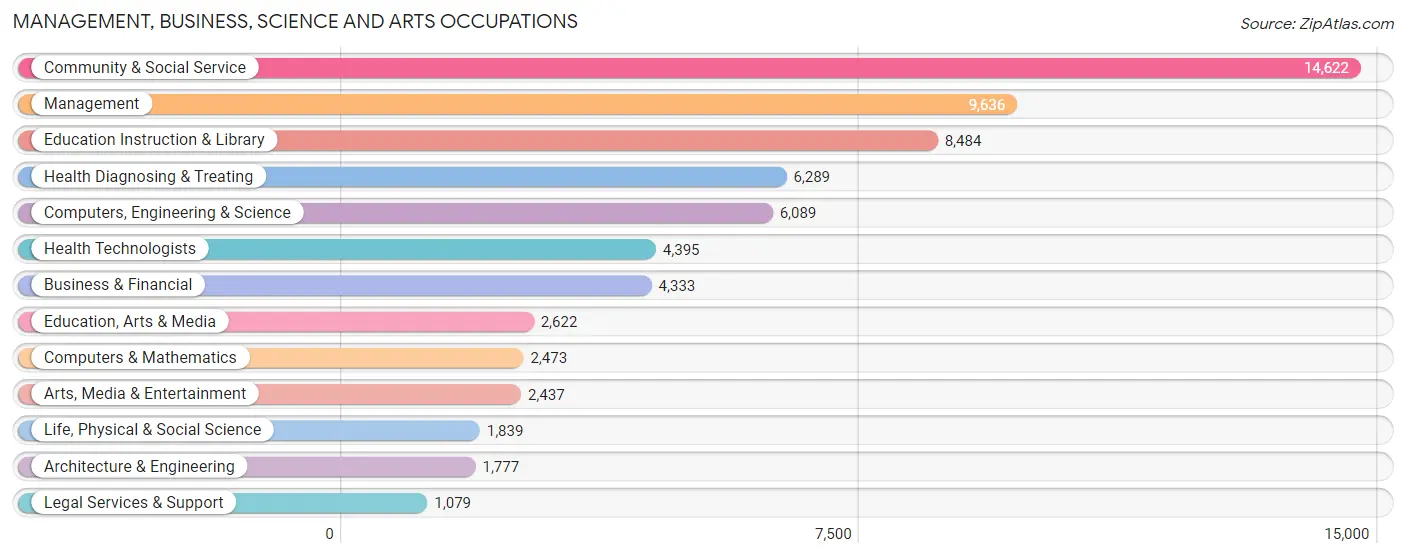
Management, Business, Science and Arts Occupations
The most common Management, Business, Science and Arts occupations in Eugene are Community & Social Service (14,622 | 16.5%), Management (9,636 | 10.9%), Education Instruction & Library (8,484 | 9.6%), Health Diagnosing & Treating (6,289 | 7.1%), and Computers, Engineering & Science (6,089 | 6.9%).
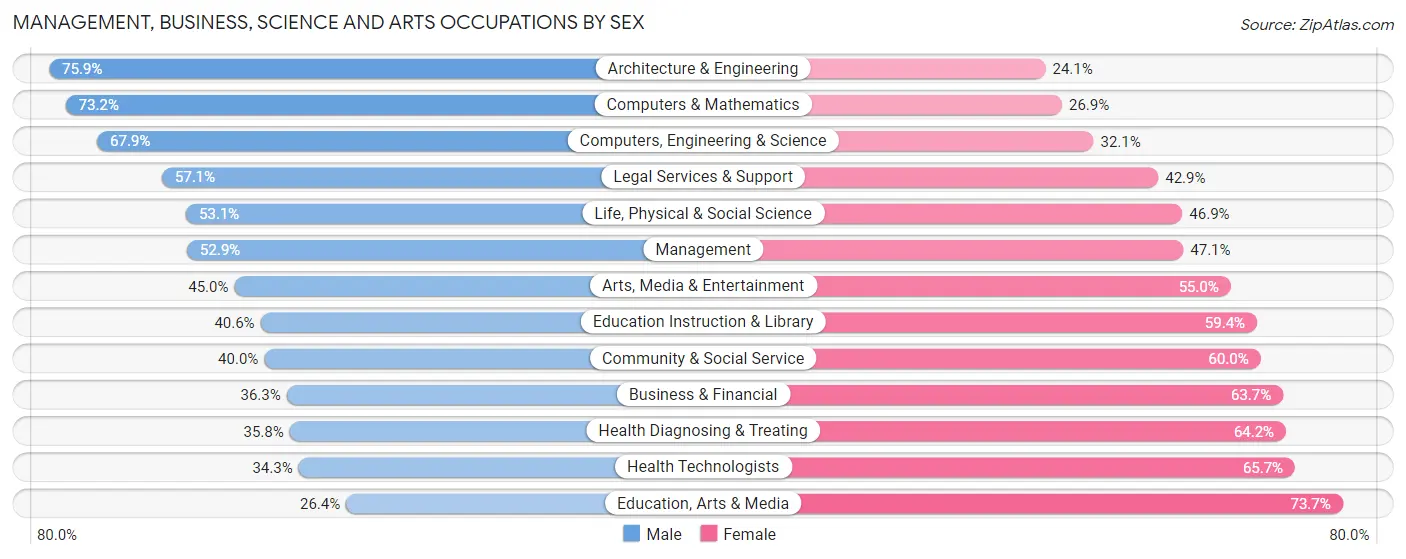
Management, Business, Science and Arts Occupations by Sex
Within the Management, Business, Science and Arts occupations in Eugene, the most male-oriented occupations are Architecture & Engineering (75.9%), Computers & Mathematics (73.2%), and Computers, Engineering & Science (67.9%), while the most female-oriented occupations are Education, Arts & Media (73.7%), Health Technologists (65.7%), and Health Diagnosing & Treating (64.2%).
| Occupation | Male | Female |
| Management | 5,098 (52.9%) | 4,538 (47.1%) |
| Business & Financial | 1,572 (36.3%) | 2,761 (63.7%) |
| Computers, Engineering & Science | 4,134 (67.9%) | 1,955 (32.1%) |
| Computers & Mathematics | 1,809 (73.2%) | 664 (26.9%) |
| Architecture & Engineering | 1,349 (75.9%) | 428 (24.1%) |
| Life, Physical & Social Science | 976 (53.1%) | 863 (46.9%) |
| Community & Social Service | 5,852 (40.0%) | 8,770 (60.0%) |
| Education, Arts & Media | 691 (26.4%) | 1,931 (73.7%) |
| Legal Services & Support | 616 (57.1%) | 463 (42.9%) |
| Education Instruction & Library | 3,448 (40.6%) | 5,036 (59.4%) |
| Arts, Media & Entertainment | 1,097 (45.0%) | 1,340 (55.0%) |
| Health Diagnosing & Treating | 2,251 (35.8%) | 4,038 (64.2%) |
| Health Technologists | 1,507 (34.3%) | 2,888 (65.7%) |
| Total (Category) | 18,907 (46.2%) | 22,062 (53.8%) |
| Total (Overall) | 44,813 (50.5%) | 43,841 (49.4%) |
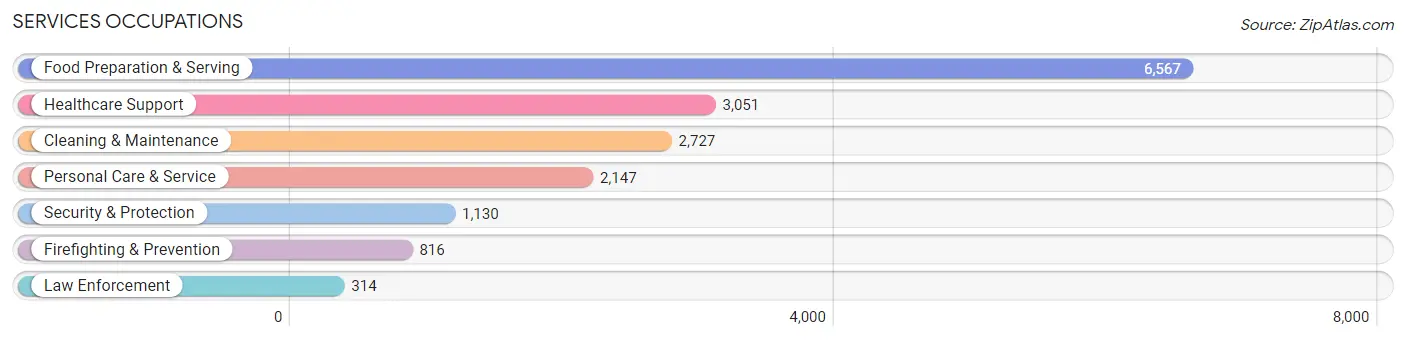
Services Occupations
The most common Services occupations in Eugene are Food Preparation & Serving (6,567 | 7.4%), Healthcare Support (3,051 | 3.4%), Cleaning & Maintenance (2,727 | 3.1%), Personal Care & Service (2,147 | 2.4%), and Security & Protection (1,130 | 1.3%).
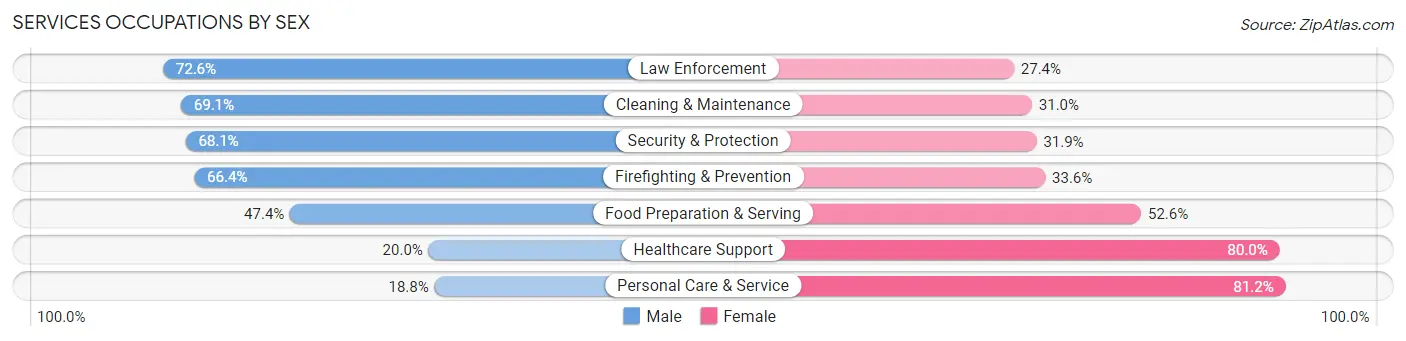
Services Occupations by Sex
Within the Services occupations in Eugene, the most male-oriented occupations are Law Enforcement (72.6%), Cleaning & Maintenance (69.1%), and Security & Protection (68.1%), while the most female-oriented occupations are Personal Care & Service (81.2%), Healthcare Support (80.0%), and Food Preparation & Serving (52.6%).
| Occupation | Male | Female |
| Healthcare Support | 610 (20.0%) | 2,441 (80.0%) |
| Security & Protection | 770 (68.1%) | 360 (31.9%) |
| Firefighting & Prevention | 542 (66.4%) | 274 (33.6%) |
| Law Enforcement | 228 (72.6%) | 86 (27.4%) |
| Food Preparation & Serving | 3,114 (47.4%) | 3,453 (52.6%) |
| Cleaning & Maintenance | 1,883 (69.1%) | 844 (30.9%) |
| Personal Care & Service | 404 (18.8%) | 1,743 (81.2%) |
| Total (Category) | 6,781 (43.4%) | 8,841 (56.6%) |
| Total (Overall) | 44,813 (50.5%) | 43,841 (49.4%) |
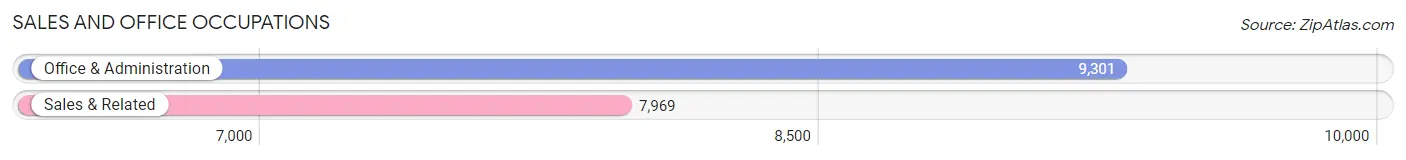
Sales and Office Occupations
The most common Sales and Office occupations in Eugene are Office & Administration (9,301 | 10.5%), and Sales & Related (7,969 | 9.0%).
Sales and Office Occupations by Sex
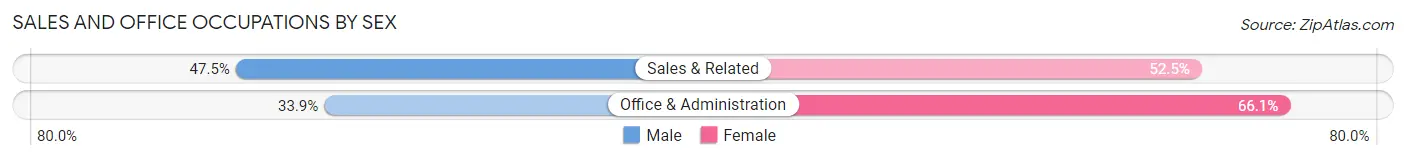
| Occupation | Male | Female |
| Sales & Related | 3,788 (47.5%) | 4,181 (52.5%) |
| Office & Administration | 3,156 (33.9%) | 6,145 (66.1%) |
| Total (Category) | 6,944 (40.2%) | 10,326 (59.8%) |
| Total (Overall) | 44,813 (50.5%) | 43,841 (49.4%) |
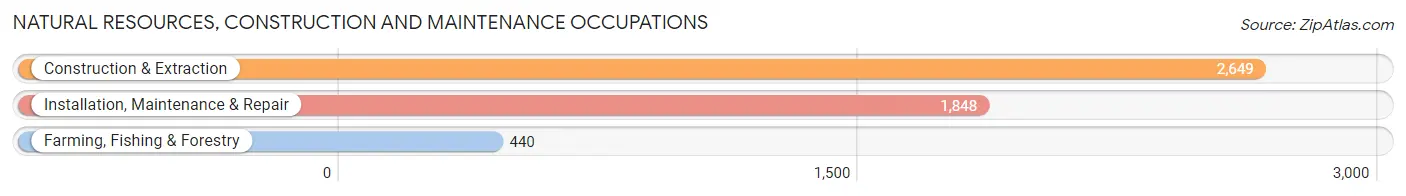
Natural Resources, Construction and Maintenance Occupations
The most common Natural Resources, Construction and Maintenance occupations in Eugene are Construction & Extraction (2,649 | 3.0%), Installation, Maintenance & Repair (1,848 | 2.1%), and Farming, Fishing & Forestry (440 | 0.5%).
Natural Resources, Construction and Maintenance Occupations by Sex
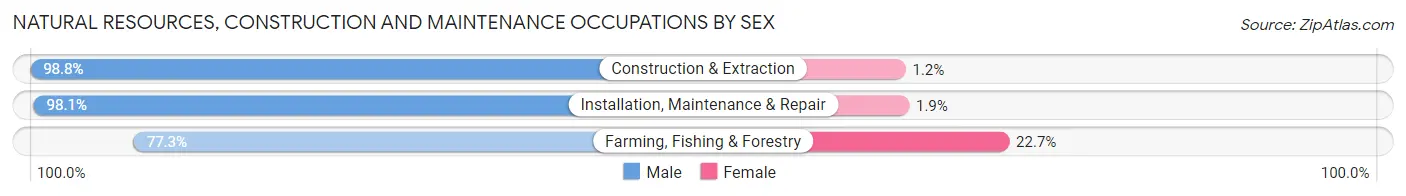
| Occupation | Male | Female |
| Farming, Fishing & Forestry | 340 (77.3%) | 100 (22.7%) |
| Construction & Extraction | 2,618 (98.8%) | 31 (1.2%) |
| Installation, Maintenance & Repair | 1,813 (98.1%) | 35 (1.9%) |
| Total (Category) | 4,771 (96.6%) | 166 (3.4%) |
| Total (Overall) | 44,813 (50.5%) | 43,841 (49.4%) |
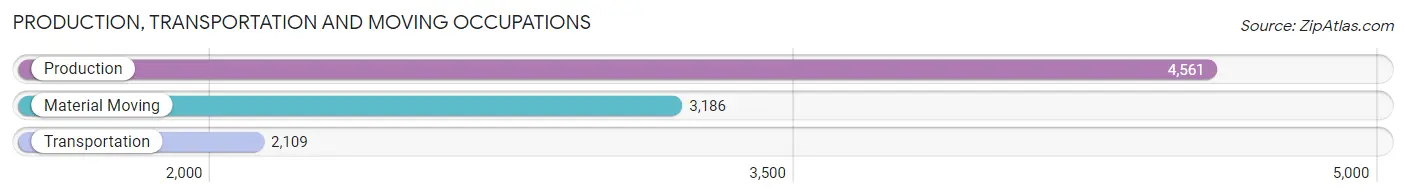
Production, Transportation and Moving Occupations
The most common Production, Transportation and Moving occupations in Eugene are Production (4,561 | 5.1%), Material Moving (3,186 | 3.6%), and Transportation (2,109 | 2.4%).
Production, Transportation and Moving Occupations by Sex
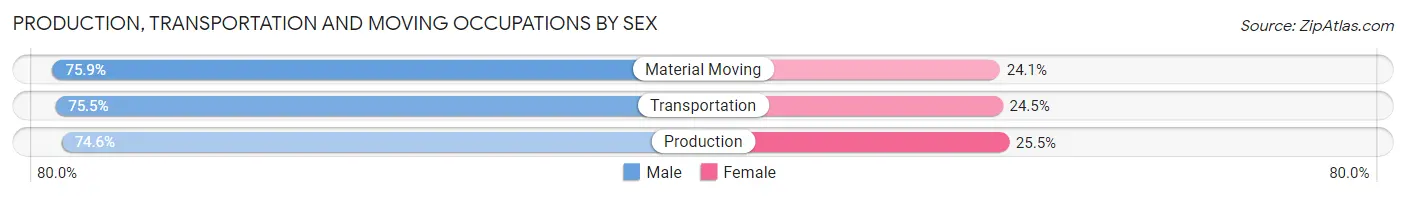
| Occupation | Male | Female |
| Production | 3,400 (74.6%) | 1,161 (25.5%) |
| Transportation | 1,592 (75.5%) | 517 (24.5%) |
| Material Moving | 2,418 (75.9%) | 768 (24.1%) |
| Total (Category) | 7,410 (75.2%) | 2,446 (24.8%) |
| Total (Overall) | 44,813 (50.5%) | 43,841 (49.4%) |
Employment Industries by Sex in Eugene
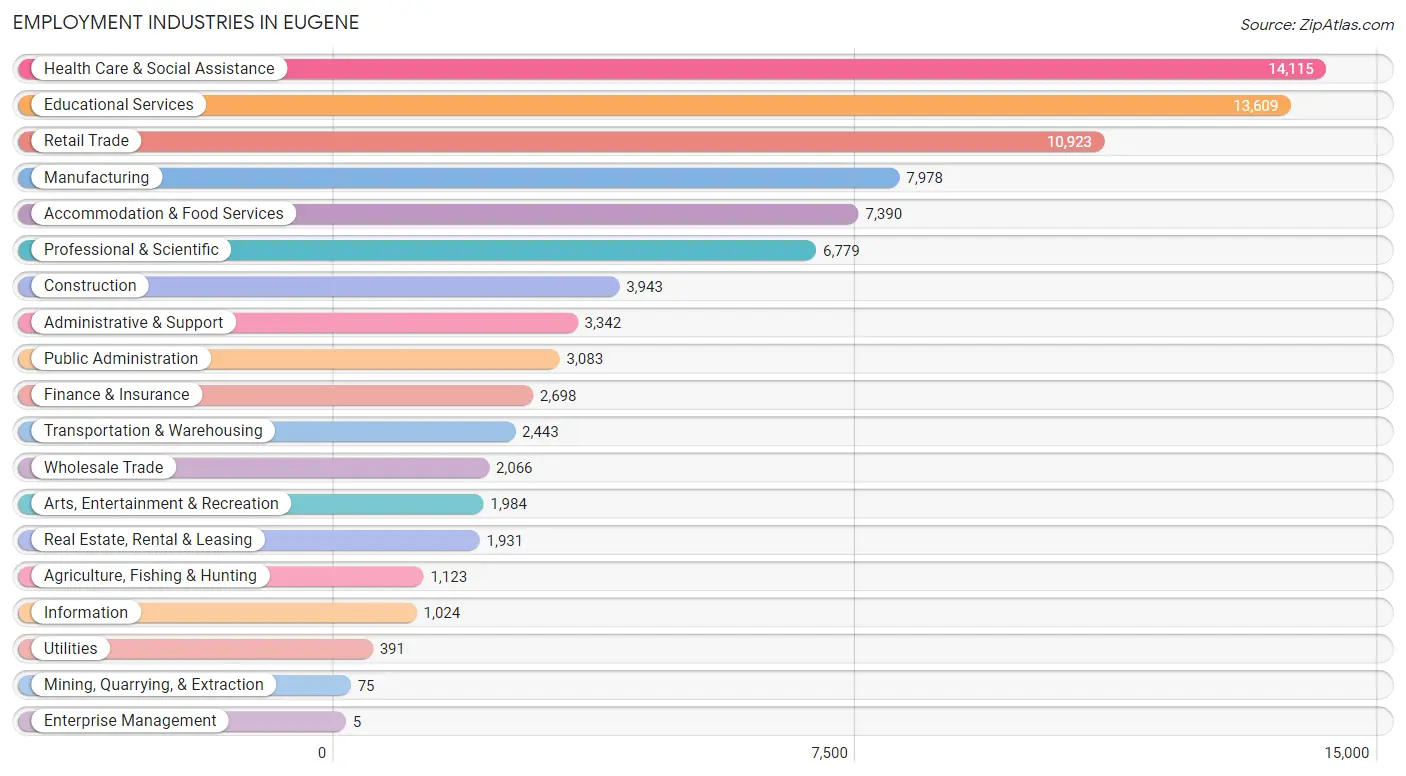
Employment Industries in Eugene
The major employment industries in Eugene include Health Care & Social Assistance (14,115 | 15.9%), Educational Services (13,609 | 15.3%), Retail Trade (10,923 | 12.3%), Manufacturing (7,978 | 9.0%), and Accommodation & Food Services (7,390 | 8.3%).
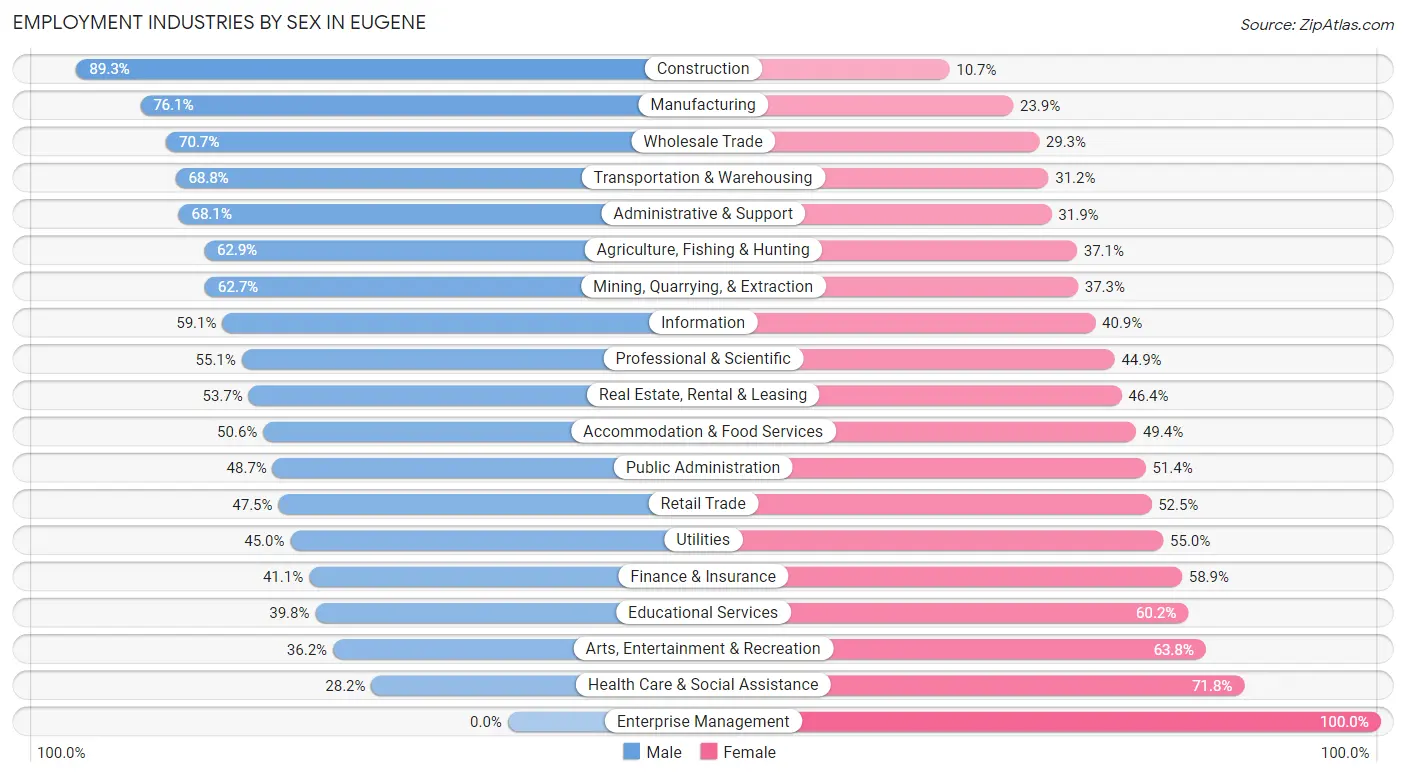
Employment Industries by Sex in Eugene
The Eugene industries that see more men than women are Construction (89.3%), Manufacturing (76.1%), and Wholesale Trade (70.7%), whereas the industries that tend to have a higher number of women are Enterprise Management (100.0%), Health Care & Social Assistance (71.8%), and Arts, Entertainment & Recreation (63.8%).
| Industry | Male | Female |
| Agriculture, Fishing & Hunting | 706 (62.9%) | 417 (37.1%) |
| Mining, Quarrying, & Extraction | 47 (62.7%) | 28 (37.3%) |
| Construction | 3,520 (89.3%) | 423 (10.7%) |
| Manufacturing | 6,068 (76.1%) | 1,910 (23.9%) |
| Wholesale Trade | 1,461 (70.7%) | 605 (29.3%) |
| Retail Trade | 5,185 (47.5%) | 5,738 (52.5%) |
| Transportation & Warehousing | 1,680 (68.8%) | 763 (31.2%) |
| Utilities | 176 (45.0%) | 215 (55.0%) |
| Information | 605 (59.1%) | 419 (40.9%) |
| Finance & Insurance | 1,110 (41.1%) | 1,588 (58.9%) |
| Real Estate, Rental & Leasing | 1,036 (53.6%) | 895 (46.4%) |
| Professional & Scientific | 3,734 (55.1%) | 3,045 (44.9%) |
| Enterprise Management | 0 (0.0%) | 5 (100.0%) |
| Administrative & Support | 2,277 (68.1%) | 1,065 (31.9%) |
| Educational Services | 5,420 (39.8%) | 8,189 (60.2%) |
| Health Care & Social Assistance | 3,984 (28.2%) | 10,131 (71.8%) |
| Arts, Entertainment & Recreation | 718 (36.2%) | 1,266 (63.8%) |
| Accommodation & Food Services | 3,741 (50.6%) | 3,649 (49.4%) |
| Public Administration | 1,500 (48.6%) | 1,583 (51.3%) |
| Total | 44,813 (50.5%) | 43,841 (49.4%) |
Education in Eugene
School Enrollment in Eugene
The most common levels of schooling among the 51,515 students in Eugene are college / undergraduate (23,659 | 45.9%), high school (7,071 | 13.7%), and middle school (6,622 | 12.9%).
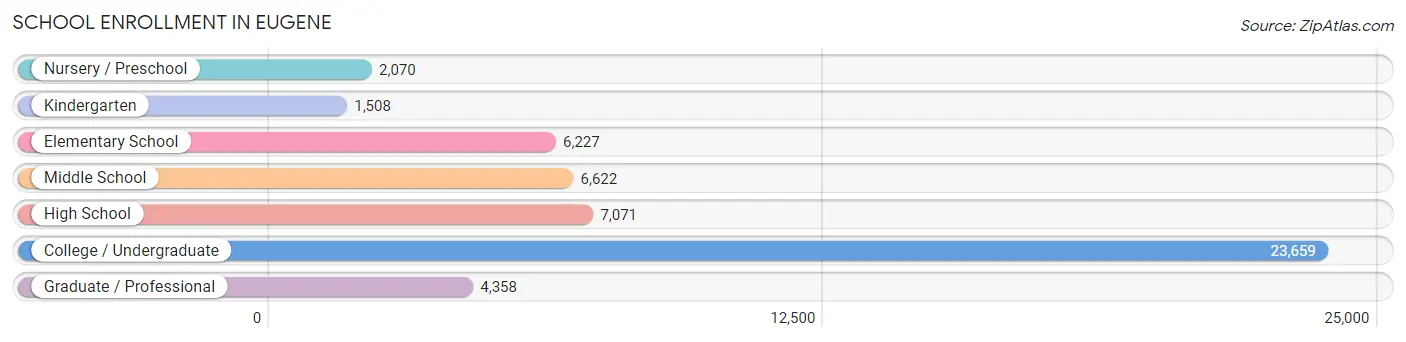
| School Level | # Students | % Students |
| Nursery / Preschool | 2,070 | 4.0% |
| Kindergarten | 1,508 | 2.9% |
| Elementary School | 6,227 | 12.1% |
| Middle School | 6,622 | 12.9% |
| High School | 7,071 | 13.7% |
| College / Undergraduate | 23,659 | 45.9% |
| Graduate / Professional | 4,358 | 8.5% |
| Total | 51,515 | 100.0% |
School Enrollment by Age by Funding Source in Eugene
Out of a total of 51,515 students who are enrolled in schools in Eugene, 4,791 (9.3%) attend a private institution, while the remaining 46,724 (90.7%) are enrolled in public schools. The age group of 3 to 4 year olds has the highest likelihood of being enrolled in private schools, with 716 (45.3% in the age bracket) enrolled. Conversely, the age group of 18 to 19 year olds has the lowest likelihood of being enrolled in a private school, with 6,797 (94.4% in the age bracket) attending a public institution.
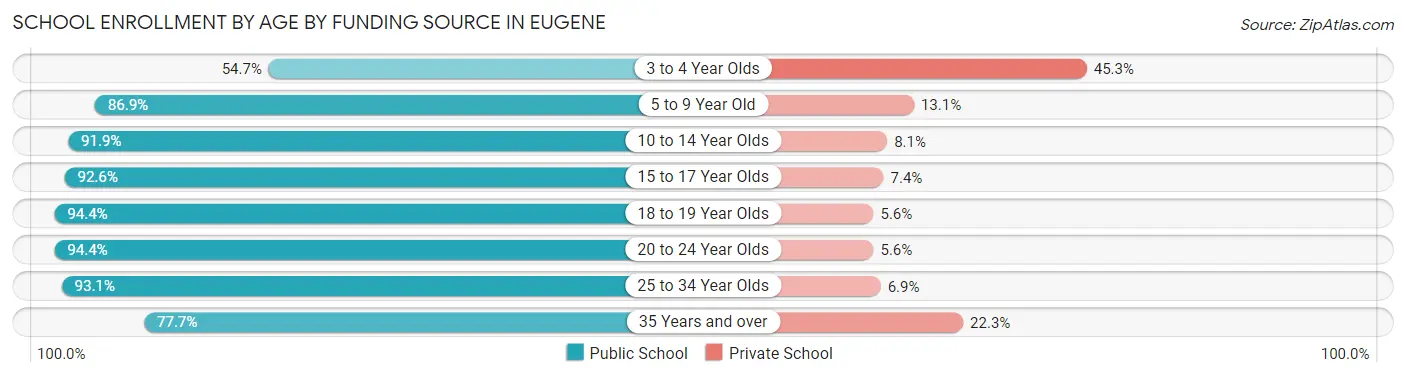
| Age Bracket | Public School | Private School |
| 3 to 4 Year Olds | 865 (54.7%) | 716 (45.3%) |
| 5 to 9 Year Old | 6,315 (86.9%) | 952 (13.1%) |
| 10 to 14 Year Olds | 7,815 (91.9%) | 690 (8.1%) |
| 15 to 17 Year Olds | 4,801 (92.6%) | 386 (7.4%) |
| 18 to 19 Year Olds | 6,797 (94.4%) | 400 (5.6%) |
| 20 to 24 Year Olds | 14,141 (94.4%) | 833 (5.6%) |
| 25 to 34 Year Olds | 4,155 (93.1%) | 308 (6.9%) |
| 35 Years and over | 1,820 (77.7%) | 521 (22.3%) |
| Total | 46,724 (90.7%) | 4,791 (9.3%) |
Educational Attainment by Field of Study in Eugene
Social sciences (7,018 | 12.3%), business (5,958 | 10.5%), bio, nature & agricultural (5,075 | 8.9%), education (4,991 | 8.8%), and literature & languages (4,813 | 8.5%) are the most common fields of study among 56,926 individuals in Eugene who have obtained a bachelor's degree or higher.
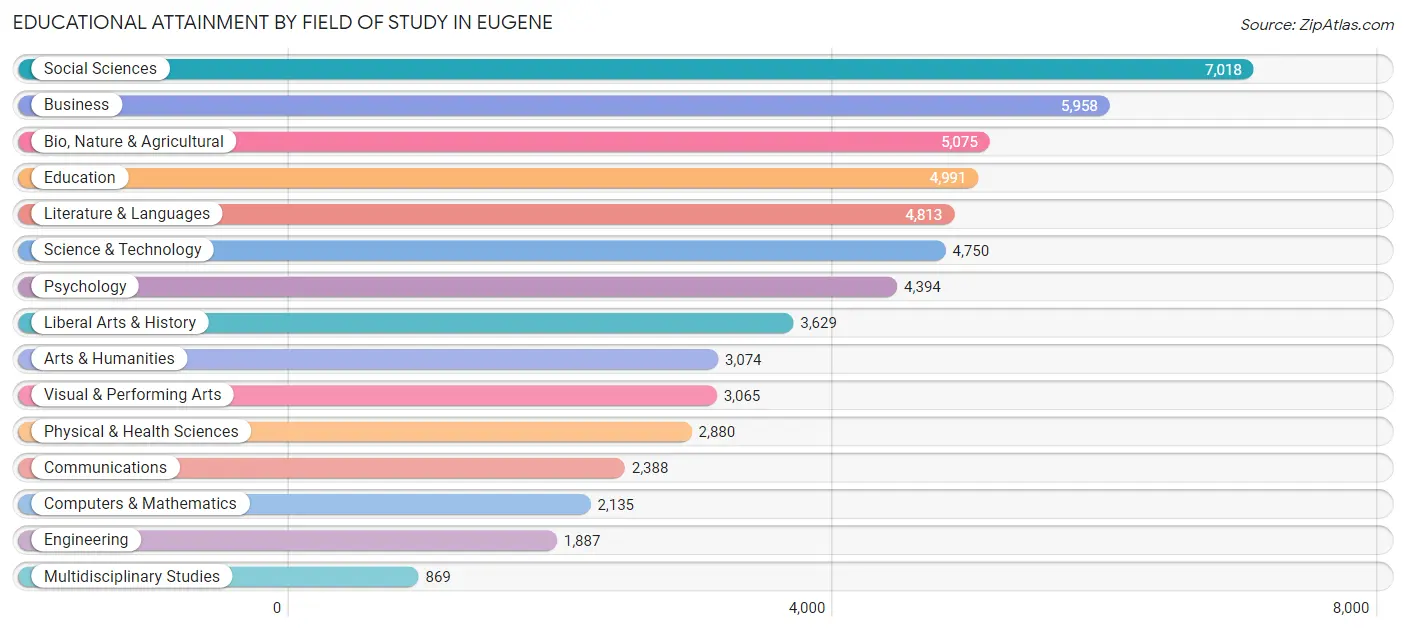
| Field of Study | # Graduates | % Graduates |
| Computers & Mathematics | 2,135 | 3.7% |
| Bio, Nature & Agricultural | 5,075 | 8.9% |
| Physical & Health Sciences | 2,880 | 5.1% |
| Psychology | 4,394 | 7.7% |
| Social Sciences | 7,018 | 12.3% |
| Engineering | 1,887 | 3.3% |
| Multidisciplinary Studies | 869 | 1.5% |
| Science & Technology | 4,750 | 8.3% |
| Business | 5,958 | 10.5% |
| Education | 4,991 | 8.8% |
| Literature & Languages | 4,813 | 8.5% |
| Liberal Arts & History | 3,629 | 6.4% |
| Visual & Performing Arts | 3,065 | 5.4% |
| Communications | 2,388 | 4.2% |
| Arts & Humanities | 3,074 | 5.4% |
| Total | 56,926 | 100.0% |
Transportation & Commute in Eugene
Vehicle Availability by Sex in Eugene
The most prevalent vehicle ownership categories in Eugene are males with 2 vehicles (18,118, accounting for 41.3%) and females with 2 vehicles (17,115, making up 42.8%).
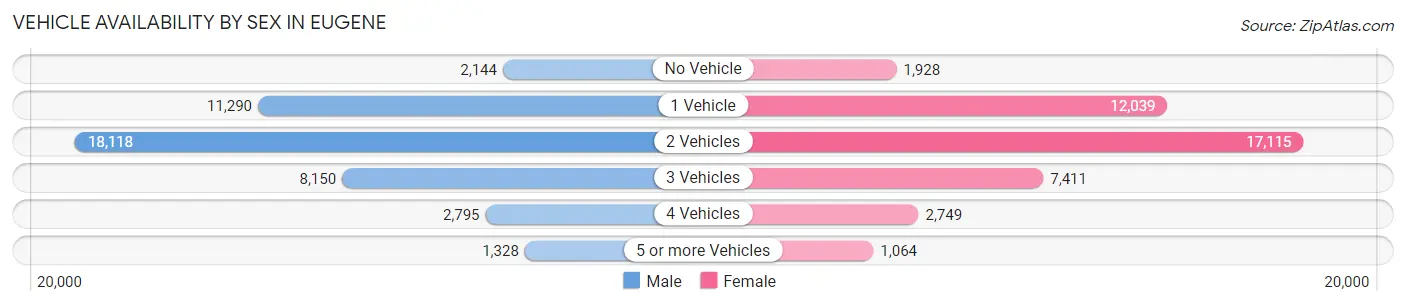
| Vehicles Available | Male | Female |
| No Vehicle | 2,144 (4.9%) | 1,928 (4.6%) |
| 1 Vehicle | 11,290 (25.8%) | 12,039 (28.5%) |
| 2 Vehicles | 18,118 (41.3%) | 17,115 (40.5%) |
| 3 Vehicles | 8,150 (18.6%) | 7,411 (17.5%) |
| 4 Vehicles | 2,795 (6.4%) | 2,749 (6.5%) |
| 5 or more Vehicles | 1,328 (3.0%) | 1,064 (2.5%) |
| Total | 43,825 (100.0%) | 42,306 (100.0%) |
Commute Time in Eugene
The most frequently occuring commute durations in Eugene are 15 to 19 minutes (19,747 commuters, 26.3%), 10 to 14 minutes (18,047 commuters, 24.0%), and 20 to 24 minutes (11,101 commuters, 14.8%).
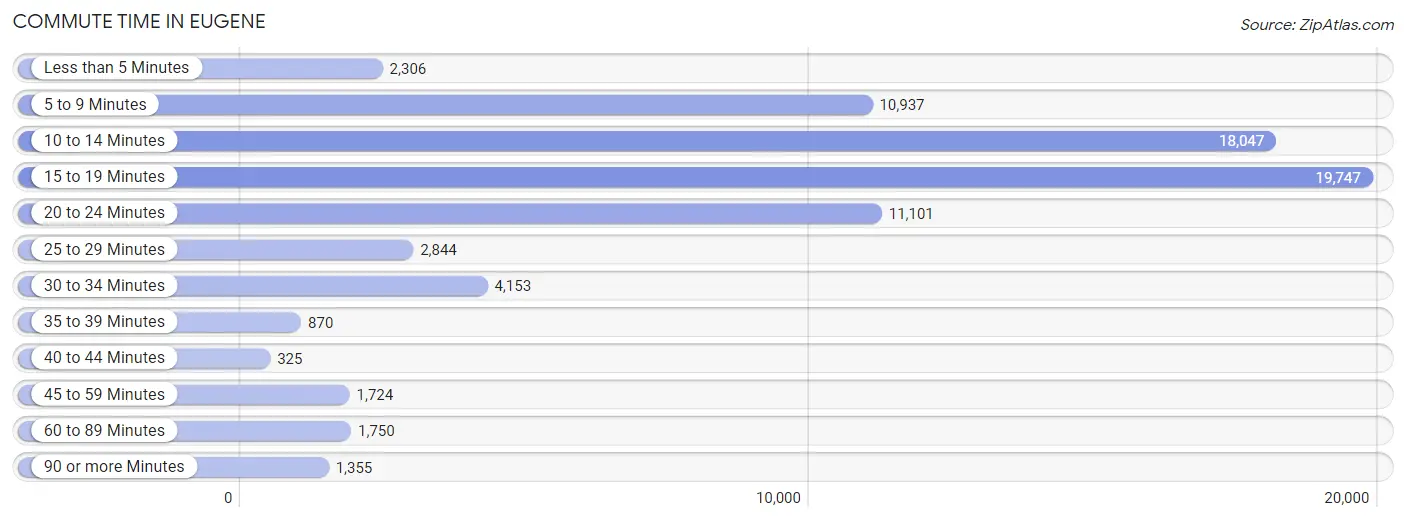
| Commute Time | # Commuters | % Commuters |
| Less than 5 Minutes | 2,306 | 3.1% |
| 5 to 9 Minutes | 10,937 | 14.5% |
| 10 to 14 Minutes | 18,047 | 24.0% |
| 15 to 19 Minutes | 19,747 | 26.3% |
| 20 to 24 Minutes | 11,101 | 14.8% |
| 25 to 29 Minutes | 2,844 | 3.8% |
| 30 to 34 Minutes | 4,153 | 5.5% |
| 35 to 39 Minutes | 870 | 1.2% |
| 40 to 44 Minutes | 325 | 0.4% |
| 45 to 59 Minutes | 1,724 | 2.3% |
| 60 to 89 Minutes | 1,750 | 2.3% |
| 90 or more Minutes | 1,355 | 1.8% |
Commute Time by Sex in Eugene
The most common commute times in Eugene are 15 to 19 minutes (10,272 commuters, 26.3%) for males and 15 to 19 minutes (9,475 commuters, 26.3%) for females.
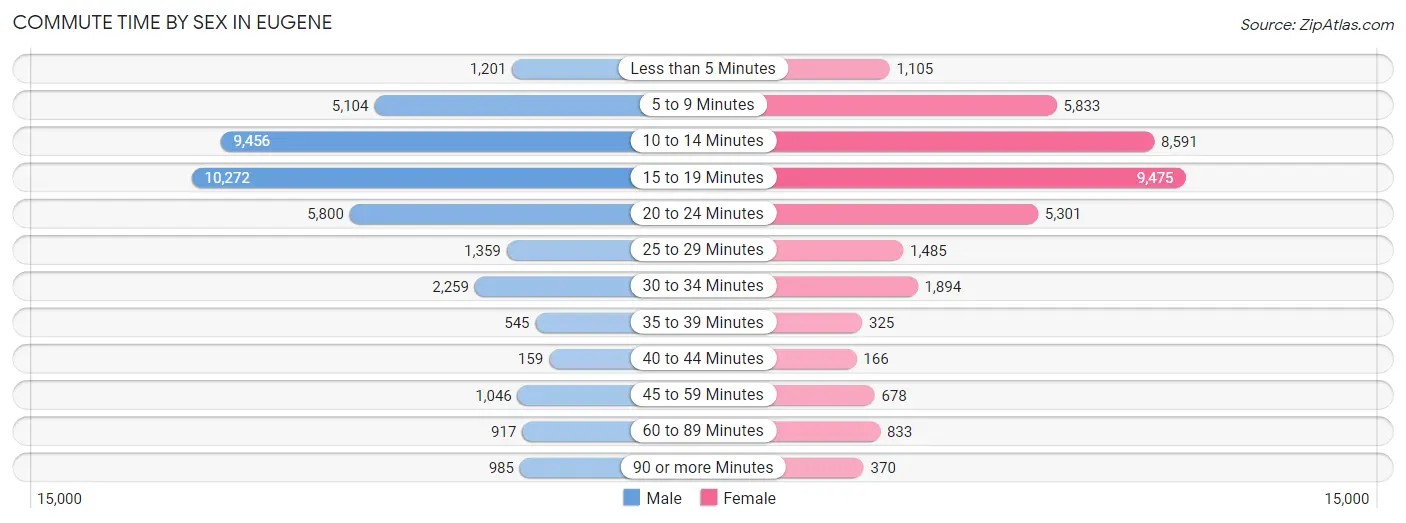
| Commute Time | Male | Female |
| Less than 5 Minutes | 1,201 (3.1%) | 1,105 (3.1%) |
| 5 to 9 Minutes | 5,104 (13.1%) | 5,833 (16.2%) |
| 10 to 14 Minutes | 9,456 (24.2%) | 8,591 (23.8%) |
| 15 to 19 Minutes | 10,272 (26.3%) | 9,475 (26.3%) |
| 20 to 24 Minutes | 5,800 (14.8%) | 5,301 (14.7%) |
| 25 to 29 Minutes | 1,359 (3.5%) | 1,485 (4.1%) |
| 30 to 34 Minutes | 2,259 (5.8%) | 1,894 (5.2%) |
| 35 to 39 Minutes | 545 (1.4%) | 325 (0.9%) |
| 40 to 44 Minutes | 159 (0.4%) | 166 (0.5%) |
| 45 to 59 Minutes | 1,046 (2.7%) | 678 (1.9%) |
| 60 to 89 Minutes | 917 (2.4%) | 833 (2.3%) |
| 90 or more Minutes | 985 (2.5%) | 370 (1.0%) |
Time of Departure to Work by Sex in Eugene
The most frequent times of departure to work in Eugene are 7:30 AM to 7:59 AM (5,972, 15.3%) for males and 7:30 AM to 7:59 AM (6,218, 17.2%) for females.
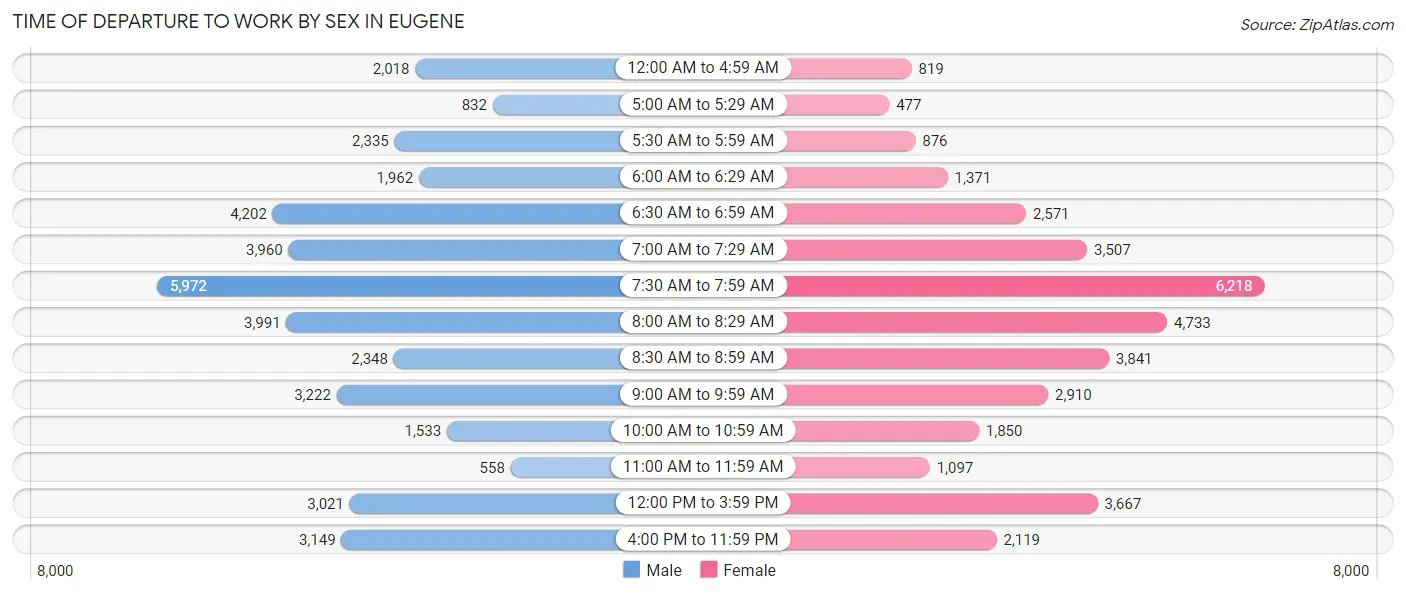
| Time of Departure | Male | Female |
| 12:00 AM to 4:59 AM | 2,018 (5.2%) | 819 (2.3%) |
| 5:00 AM to 5:29 AM | 832 (2.1%) | 477 (1.3%) |
| 5:30 AM to 5:59 AM | 2,335 (6.0%) | 876 (2.4%) |
| 6:00 AM to 6:29 AM | 1,962 (5.0%) | 1,371 (3.8%) |
| 6:30 AM to 6:59 AM | 4,202 (10.7%) | 2,571 (7.1%) |
| 7:00 AM to 7:29 AM | 3,960 (10.1%) | 3,507 (9.7%) |
| 7:30 AM to 7:59 AM | 5,972 (15.3%) | 6,218 (17.2%) |
| 8:00 AM to 8:29 AM | 3,991 (10.2%) | 4,733 (13.1%) |
| 8:30 AM to 8:59 AM | 2,348 (6.0%) | 3,841 (10.6%) |
| 9:00 AM to 9:59 AM | 3,222 (8.2%) | 2,910 (8.1%) |
| 10:00 AM to 10:59 AM | 1,533 (3.9%) | 1,850 (5.1%) |
| 11:00 AM to 11:59 AM | 558 (1.4%) | 1,097 (3.0%) |
| 12:00 PM to 3:59 PM | 3,021 (7.7%) | 3,667 (10.2%) |
| 4:00 PM to 11:59 PM | 3,149 (8.1%) | 2,119 (5.9%) |
| Total | 39,103 (100.0%) | 36,056 (100.0%) |
Housing Occupancy in Eugene
Occupancy by Ownership in Eugene
Of the total 75,532 dwellings in Eugene, owner-occupied units account for 36,131 (47.8%), while renter-occupied units make up 39,401 (52.2%).
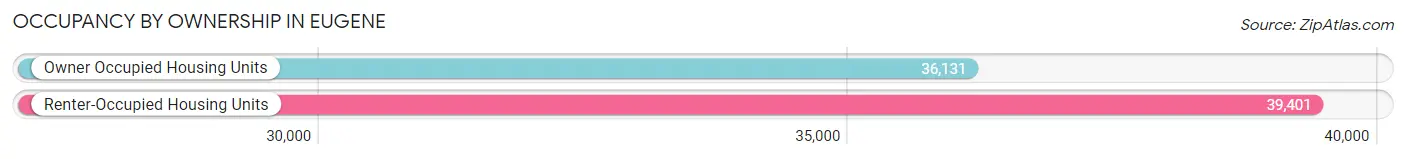
| Occupancy | # Housing Units | % Housing Units |
| Owner Occupied Housing Units | 36,131 | 47.8% |
| Renter-Occupied Housing Units | 39,401 | 52.2% |
| Total Occupied Housing Units | 75,532 | 100.0% |
Occupancy by Household Size in Eugene
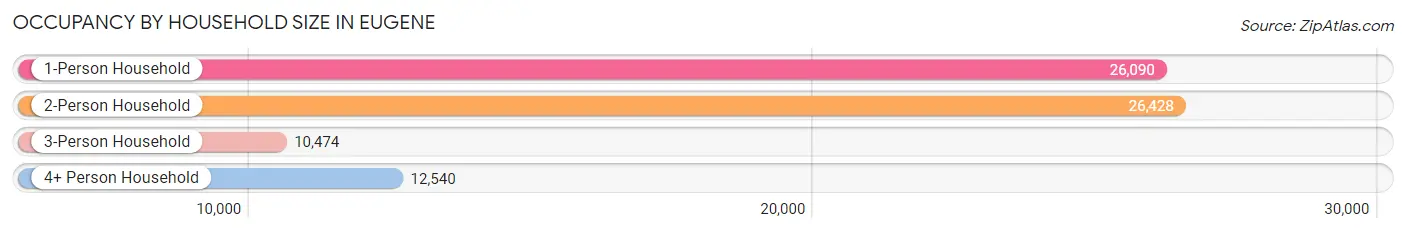
| Household Size | # Housing Units | % Housing Units |
| 1-Person Household | 26,090 | 34.5% |
| 2-Person Household | 26,428 | 35.0% |
| 3-Person Household | 10,474 | 13.9% |
| 4+ Person Household | 12,540 | 16.6% |
| Total Housing Units | 75,532 | 100.0% |
Occupancy by Ownership by Household Size in Eugene
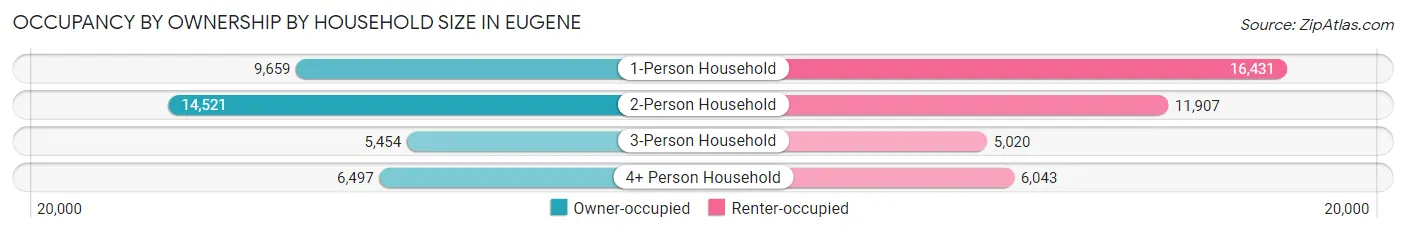
| Household Size | Owner-occupied | Renter-occupied |
| 1-Person Household | 9,659 (37.0%) | 16,431 (63.0%) |
| 2-Person Household | 14,521 (54.9%) | 11,907 (45.1%) |
| 3-Person Household | 5,454 (52.1%) | 5,020 (47.9%) |
| 4+ Person Household | 6,497 (51.8%) | 6,043 (48.2%) |
| Total Housing Units | 36,131 (47.8%) | 39,401 (52.2%) |
Occupancy by Educational Attainment in Eugene
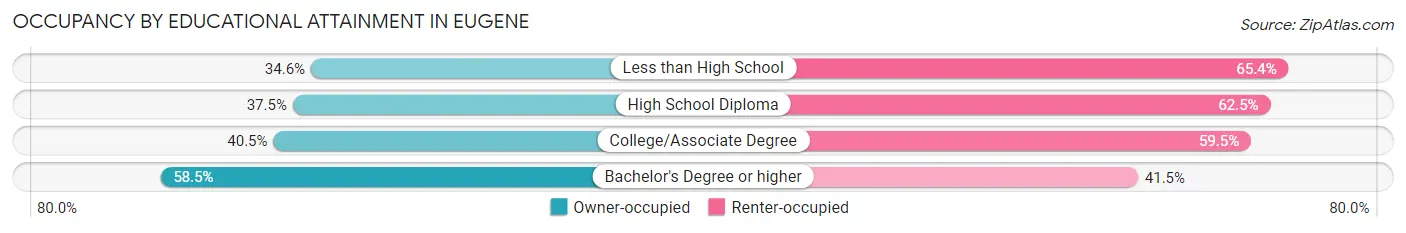
| Household Size | Owner-occupied | Renter-occupied |
| Less than High School | 1,099 (34.6%) | 2,078 (65.4%) |
| High School Diploma | 3,935 (37.5%) | 6,566 (62.5%) |
| College/Associate Degree | 11,472 (40.5%) | 16,829 (59.5%) |
| Bachelor's Degree or higher | 19,625 (58.5%) | 13,928 (41.5%) |
Occupancy by Age of Householder in Eugene
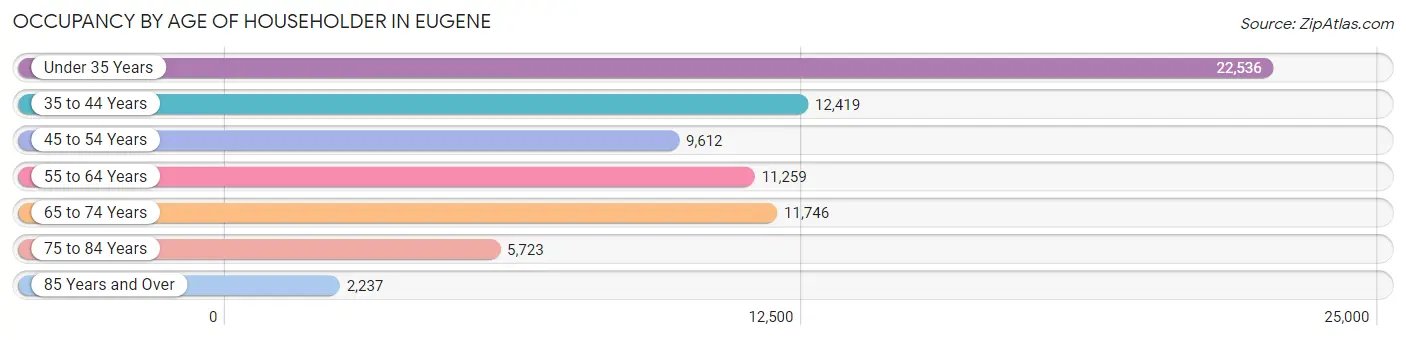
| Age Bracket | # Households | % Households |
| Under 35 Years | 22,536 | 29.8% |
| 35 to 44 Years | 12,419 | 16.4% |
| 45 to 54 Years | 9,612 | 12.7% |
| 55 to 64 Years | 11,259 | 14.9% |
| 65 to 74 Years | 11,746 | 15.5% |
| 75 to 84 Years | 5,723 | 7.6% |
| 85 Years and Over | 2,237 | 3.0% |
| Total | 75,532 | 100.0% |
Housing Finances in Eugene
Median Income by Occupancy in Eugene
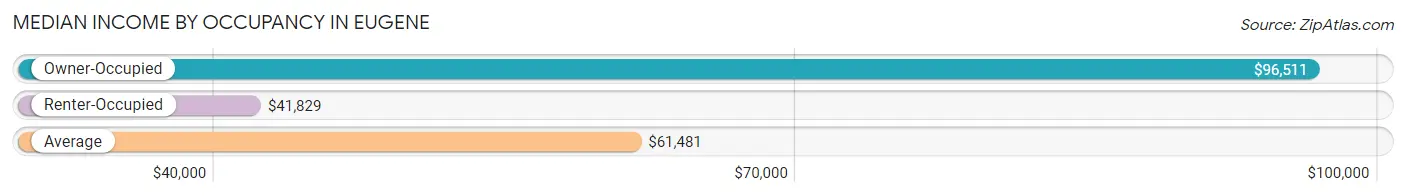
| Occupancy Type | # Households | Median Income |
| Owner-Occupied | 36,131 (47.8%) | $96,511 |
| Renter-Occupied | 39,401 (52.2%) | $41,829 |
| Average | 75,532 (100.0%) | $61,481 |
Occupancy by Householder Income Bracket in Eugene
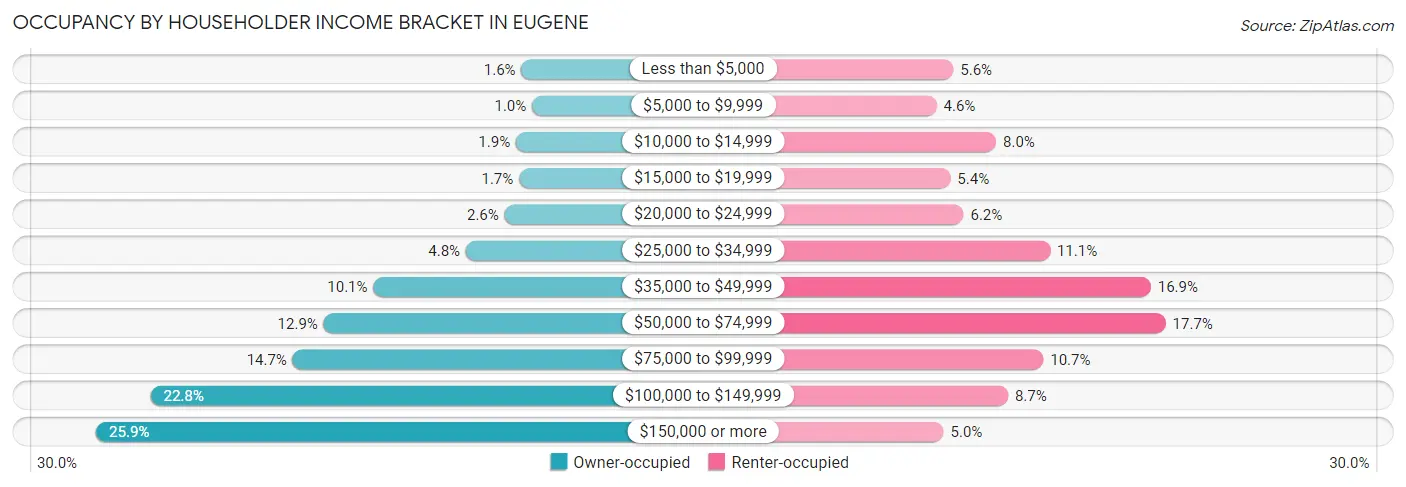
| Income Bracket | Owner-occupied | Renter-occupied |
| Less than $5,000 | 580 (1.6%) | 2,202 (5.6%) |
| $5,000 to $9,999 | 361 (1.0%) | 1,824 (4.6%) |
| $10,000 to $14,999 | 695 (1.9%) | 3,163 (8.0%) |
| $15,000 to $19,999 | 630 (1.7%) | 2,135 (5.4%) |
| $20,000 to $24,999 | 927 (2.6%) | 2,430 (6.2%) |
| $25,000 to $34,999 | 1,728 (4.8%) | 4,377 (11.1%) |
| $35,000 to $49,999 | 3,639 (10.1%) | 6,648 (16.9%) |
| $50,000 to $74,999 | 4,666 (12.9%) | 6,982 (17.7%) |
| $75,000 to $99,999 | 5,304 (14.7%) | 4,227 (10.7%) |
| $100,000 to $149,999 | 8,239 (22.8%) | 3,433 (8.7%) |
| $150,000 or more | 9,362 (25.9%) | 1,980 (5.0%) |
| Total | 36,131 (100.0%) | 39,401 (100.0%) |
Monthly Housing Cost Tiers in Eugene
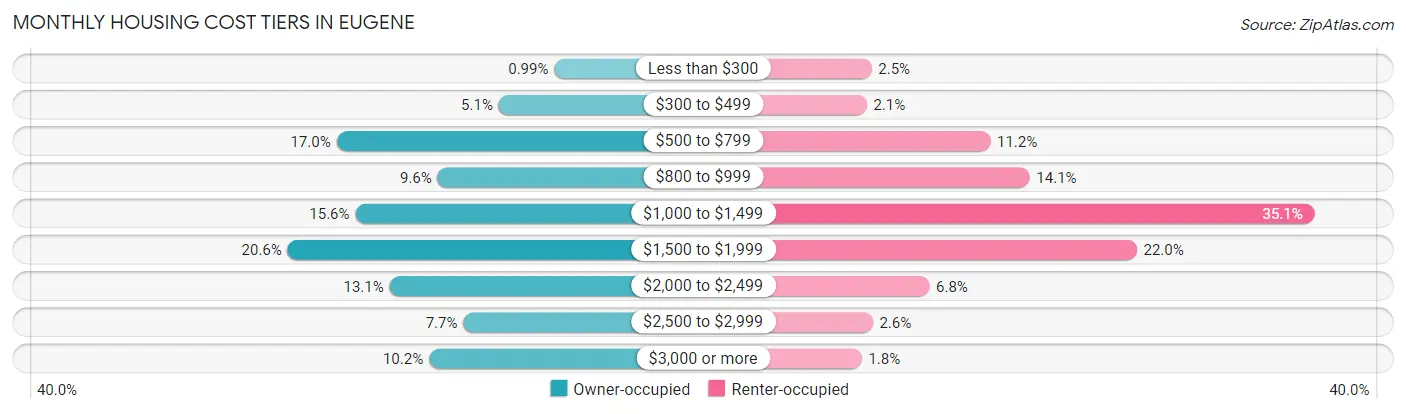
| Monthly Cost | Owner-occupied | Renter-occupied |
| Less than $300 | 359 (1.0%) | 985 (2.5%) |
| $300 to $499 | 1,837 (5.1%) | 842 (2.1%) |
| $500 to $799 | 6,153 (17.0%) | 4,427 (11.2%) |
| $800 to $999 | 3,463 (9.6%) | 5,573 (14.1%) |
| $1,000 to $1,499 | 5,652 (15.6%) | 13,844 (35.1%) |
| $1,500 to $1,999 | 7,453 (20.6%) | 8,679 (22.0%) |
| $2,000 to $2,499 | 4,741 (13.1%) | 2,660 (6.8%) |
| $2,500 to $2,999 | 2,780 (7.7%) | 1,015 (2.6%) |
| $3,000 or more | 3,693 (10.2%) | 696 (1.8%) |
| Total | 36,131 (100.0%) | 39,401 (100.0%) |
Physical Housing Characteristics in Eugene
Housing Structures in Eugene
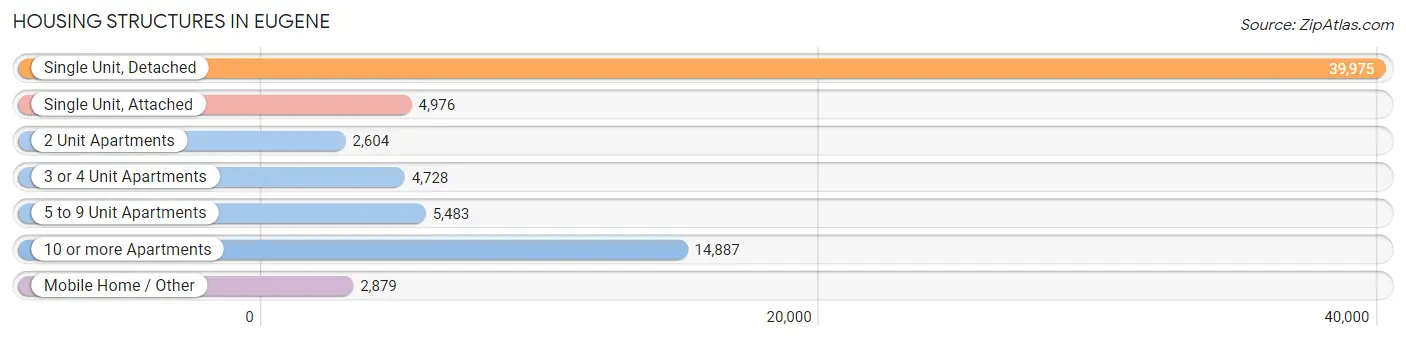
| Structure Type | # Housing Units | % Housing Units |
| Single Unit, Detached | 39,975 | 52.9% |
| Single Unit, Attached | 4,976 | 6.6% |
| 2 Unit Apartments | 2,604 | 3.5% |
| 3 or 4 Unit Apartments | 4,728 | 6.3% |
| 5 to 9 Unit Apartments | 5,483 | 7.3% |
| 10 or more Apartments | 14,887 | 19.7% |
| Mobile Home / Other | 2,879 | 3.8% |
| Total | 75,532 | 100.0% |
Housing Structures by Occupancy in Eugene
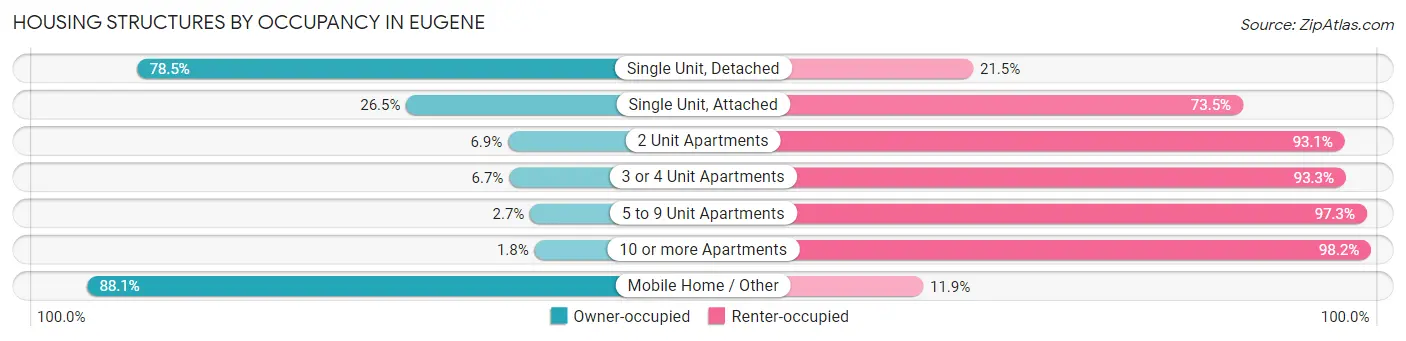
| Structure Type | Owner-occupied | Renter-occupied |
| Single Unit, Detached | 31,363 (78.5%) | 8,612 (21.5%) |
| Single Unit, Attached | 1,319 (26.5%) | 3,657 (73.5%) |
| 2 Unit Apartments | 180 (6.9%) | 2,424 (93.1%) |
| 3 or 4 Unit Apartments | 317 (6.7%) | 4,411 (93.3%) |
| 5 to 9 Unit Apartments | 146 (2.7%) | 5,337 (97.3%) |
| 10 or more Apartments | 270 (1.8%) | 14,617 (98.2%) |
| Mobile Home / Other | 2,536 (88.1%) | 343 (11.9%) |
| Total | 36,131 (47.8%) | 39,401 (52.2%) |
Housing Structures by Number of Rooms in Eugene
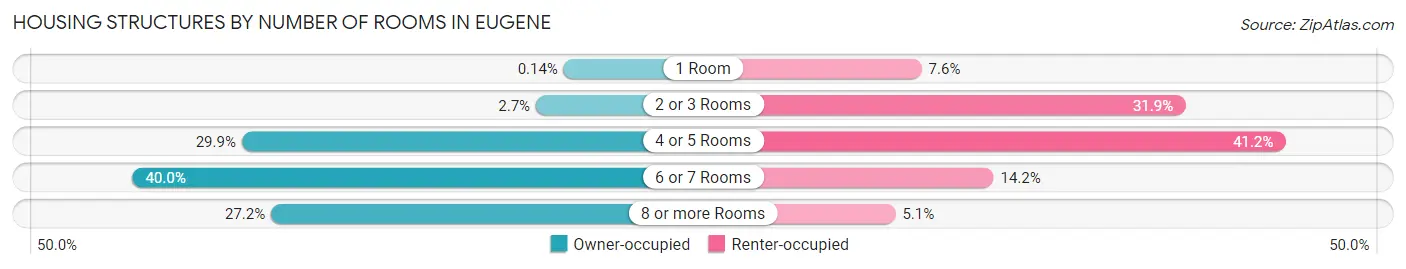
| Number of Rooms | Owner-occupied | Renter-occupied |
| 1 Room | 50 (0.1%) | 2,978 (7.6%) |
| 2 or 3 Rooms | 979 (2.7%) | 12,573 (31.9%) |
| 4 or 5 Rooms | 10,811 (29.9%) | 16,227 (41.2%) |
| 6 or 7 Rooms | 14,460 (40.0%) | 5,597 (14.2%) |
| 8 or more Rooms | 9,831 (27.2%) | 2,026 (5.1%) |
| Total | 36,131 (100.0%) | 39,401 (100.0%) |
Housing Structure by Heating Type in Eugene
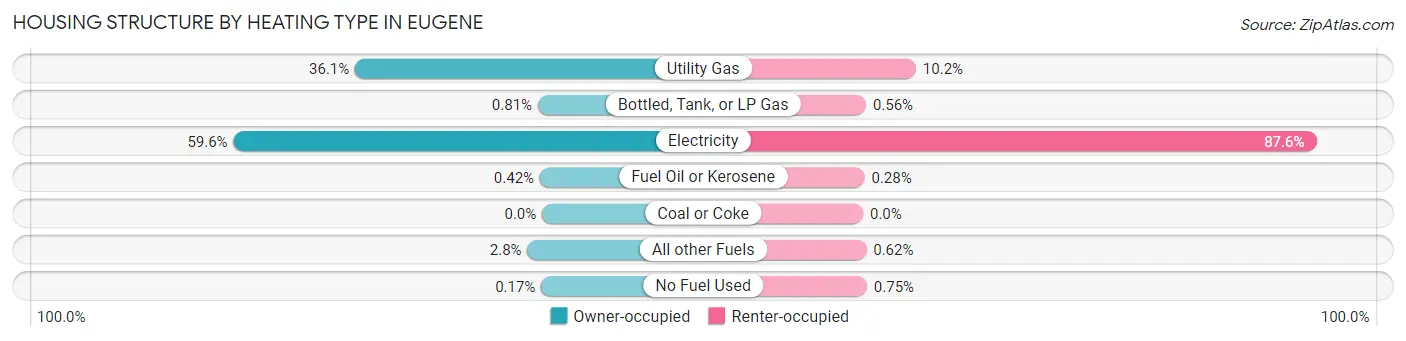
| Heating Type | Owner-occupied | Renter-occupied |
| Utility Gas | 13,054 (36.1%) | 4,027 (10.2%) |
| Bottled, Tank, or LP Gas | 294 (0.8%) | 220 (0.6%) |
| Electricity | 21,549 (59.6%) | 34,505 (87.6%) |
| Fuel Oil or Kerosene | 150 (0.4%) | 111 (0.3%) |
| Coal or Coke | 0 (0.0%) | 0 (0.0%) |
| All other Fuels | 1,022 (2.8%) | 243 (0.6%) |
| No Fuel Used | 62 (0.2%) | 295 (0.7%) |
| Total | 36,131 (100.0%) | 39,401 (100.0%) |
Household Vehicle Usage in Eugene
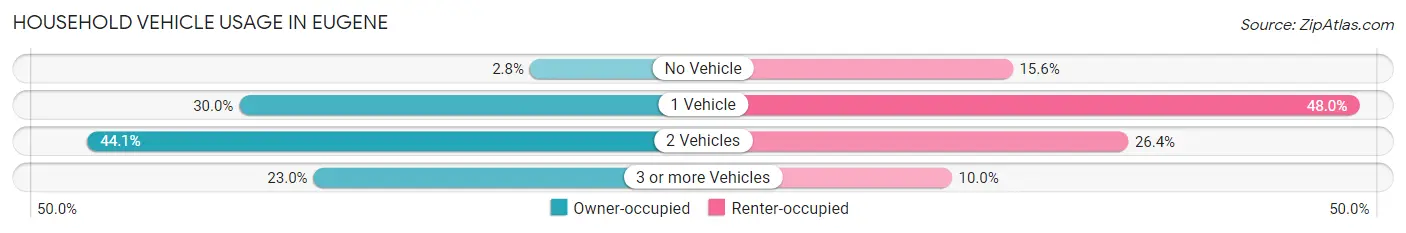
| Vehicles per Household | Owner-occupied | Renter-occupied |
| No Vehicle | 1,027 (2.8%) | 6,161 (15.6%) |
| 1 Vehicle | 10,828 (30.0%) | 18,909 (48.0%) |
| 2 Vehicles | 15,950 (44.1%) | 10,409 (26.4%) |
| 3 or more Vehicles | 8,326 (23.0%) | 3,922 (10.0%) |
| Total | 36,131 (100.0%) | 39,401 (100.0%) |
Real Estate & Mortgages in Eugene
Real Estate and Mortgage Overview in Eugene
| Characteristic | Without Mortgage | With Mortgage |
| Housing Units | 12,772 | 23,359 |
| Median Property Value | $371,900 | $422,600 |
| Median Household Income | $75,342 | $7,221 |
| Monthly Housing Costs | $713 | $3,678 |
| Real Estate Taxes | $4,207 | $383 |
Property Value by Mortgage Status in Eugene
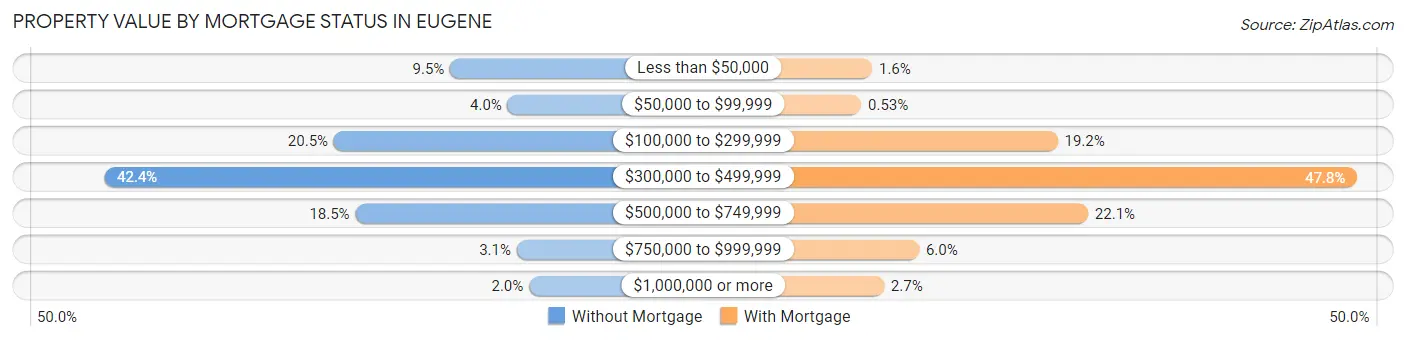
| Property Value | Without Mortgage | With Mortgage |
| Less than $50,000 | 1,210 (9.5%) | 367 (1.6%) |
| $50,000 to $99,999 | 509 (4.0%) | 124 (0.5%) |
| $100,000 to $299,999 | 2,623 (20.5%) | 4,495 (19.2%) |
| $300,000 to $499,999 | 5,420 (42.4%) | 11,162 (47.8%) |
| $500,000 to $749,999 | 2,362 (18.5%) | 5,170 (22.1%) |
| $750,000 to $999,999 | 399 (3.1%) | 1,410 (6.0%) |
| $1,000,000 or more | 249 (1.9%) | 631 (2.7%) |
| Total | 12,772 (100.0%) | 23,359 (100.0%) |
Household Income by Mortgage Status in Eugene
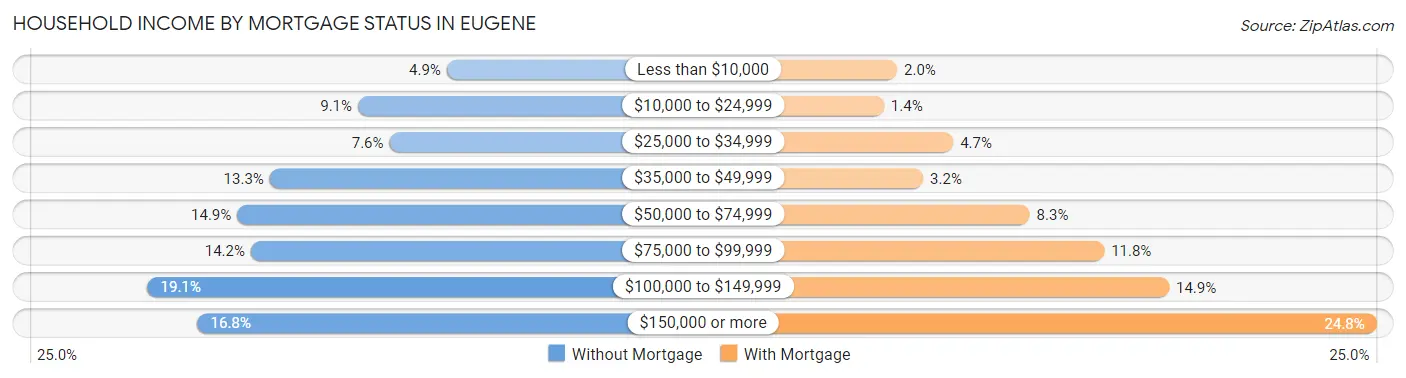
| Household Income | Without Mortgage | With Mortgage |
| Less than $10,000 | 626 (4.9%) | 463 (2.0%) |
| $10,000 to $24,999 | 1,166 (9.1%) | 315 (1.3%) |
| $25,000 to $34,999 | 975 (7.6%) | 1,086 (4.6%) |
| $35,000 to $49,999 | 1,702 (13.3%) | 753 (3.2%) |
| $50,000 to $74,999 | 1,901 (14.9%) | 1,937 (8.3%) |
| $75,000 to $99,999 | 1,817 (14.2%) | 2,765 (11.8%) |
| $100,000 to $149,999 | 2,444 (19.1%) | 3,487 (14.9%) |
| $150,000 or more | 2,141 (16.8%) | 5,795 (24.8%) |
| Total | 12,772 (100.0%) | 23,359 (100.0%) |
Property Value to Household Income Ratio in Eugene

| Value-to-Income Ratio | Without Mortgage | With Mortgage |
| Less than 2.0x | 2,238 (17.5%) | 109,756 (469.9%) |
| 2.0x to 2.9x | 2,012 (15.8%) | 2,911 (12.5%) |
| 3.0x to 3.9x | 1,488 (11.7%) | 5,135 (22.0%) |
| 4.0x or more | 6,792 (53.2%) | 4,749 (20.3%) |
| Total | 12,772 (100.0%) | 23,359 (100.0%) |
Real Estate Taxes by Mortgage Status in Eugene
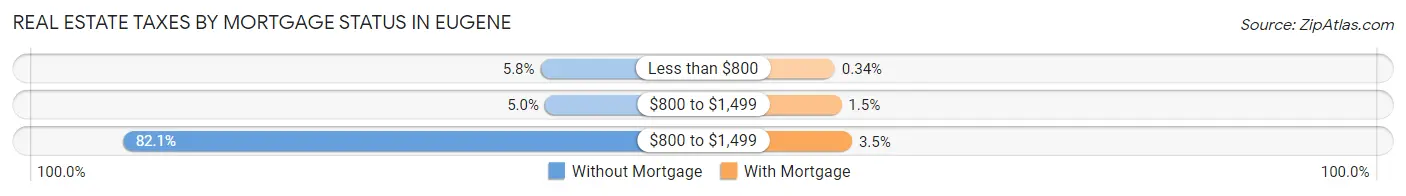
| Property Taxes | Without Mortgage | With Mortgage |
| Less than $800 | 739 (5.8%) | 80 (0.3%) |
| $800 to $1,499 | 637 (5.0%) | 357 (1.5%) |
| $800 to $1,499 | 10,483 (82.1%) | 805 (3.5%) |
| Total | 12,772 (100.0%) | 23,359 (100.0%) |
Health & Disability in Eugene
Health Insurance Coverage by Age in Eugene
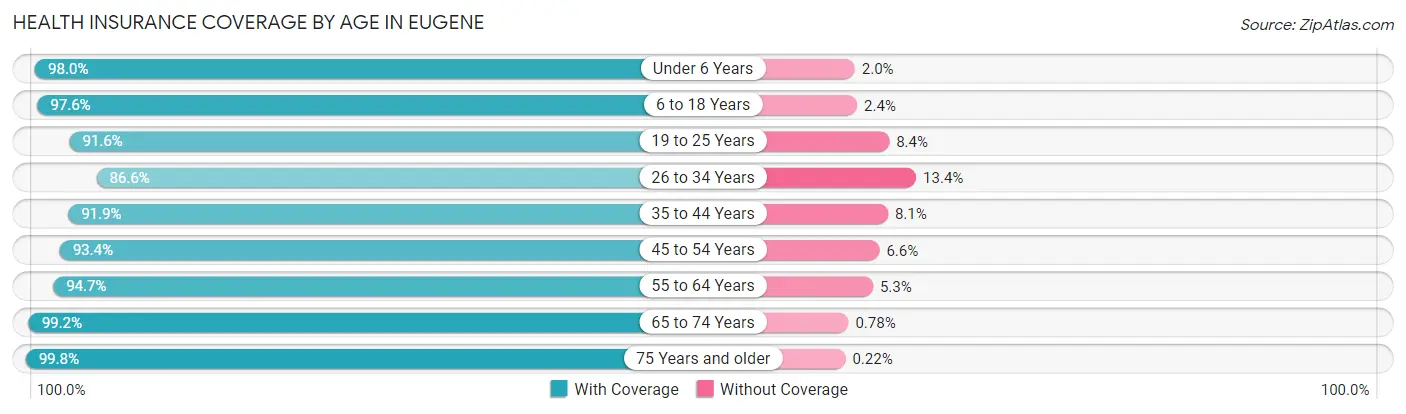
| Age Bracket | With Coverage | Without Coverage |
| Under 6 Years | 8,156 (98.0%) | 164 (2.0%) |
| 6 to 18 Years | 23,474 (97.6%) | 578 (2.4%) |
| 19 to 25 Years | 29,293 (91.6%) | 2,676 (8.4%) |
| 26 to 34 Years | 20,277 (86.6%) | 3,138 (13.4%) |
| 35 to 44 Years | 19,971 (91.9%) | 1,769 (8.1%) |
| 45 to 54 Years | 16,875 (93.4%) | 1,184 (6.6%) |
| 55 to 64 Years | 17,223 (94.7%) | 971 (5.3%) |
| 65 to 74 Years | 17,805 (99.2%) | 140 (0.8%) |
| 75 Years and older | 11,925 (99.8%) | 26 (0.2%) |
| Total | 164,999 (93.9%) | 10,646 (6.1%) |
Health Insurance Coverage by Citizenship Status in Eugene
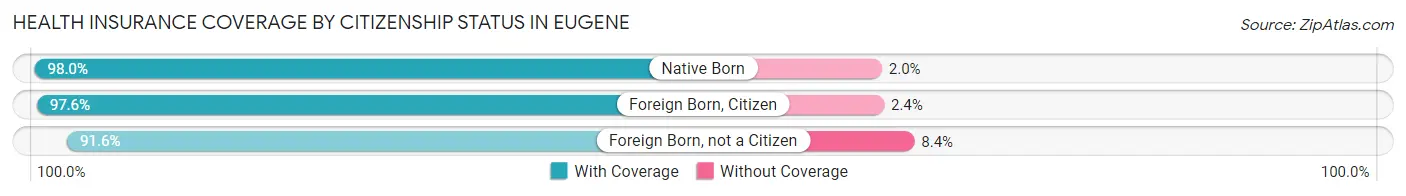
| Citizenship Status | With Coverage | Without Coverage |
| Native Born | 8,156 (98.0%) | 164 (2.0%) |
| Foreign Born, Citizen | 23,474 (97.6%) | 578 (2.4%) |
| Foreign Born, not a Citizen | 29,293 (91.6%) | 2,676 (8.4%) |
Health Insurance Coverage by Household Income in Eugene
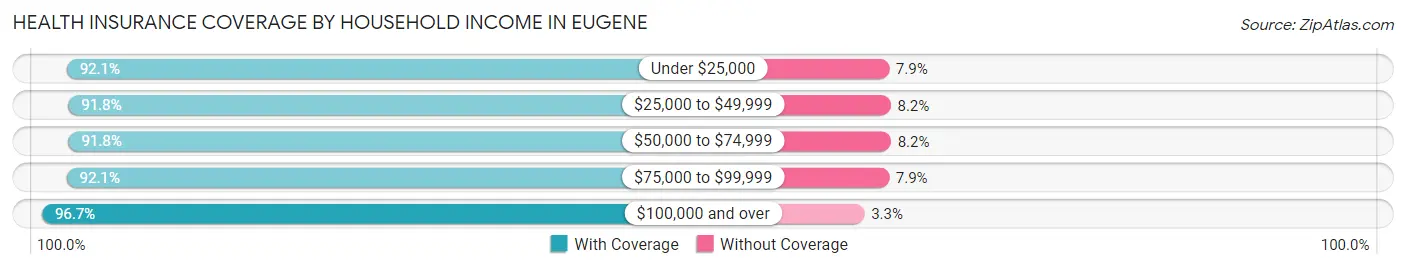
| Household Income | With Coverage | Without Coverage |
| Under $25,000 | 22,485 (92.1%) | 1,925 (7.9%) |
| $25,000 to $49,999 | 28,738 (91.8%) | 2,567 (8.2%) |
| $50,000 to $74,999 | 22,672 (91.8%) | 2,034 (8.2%) |
| $75,000 to $99,999 | 22,221 (92.1%) | 1,902 (7.9%) |
| $100,000 and over | 62,672 (96.7%) | 2,113 (3.3%) |
Public vs Private Health Insurance Coverage by Age in Eugene
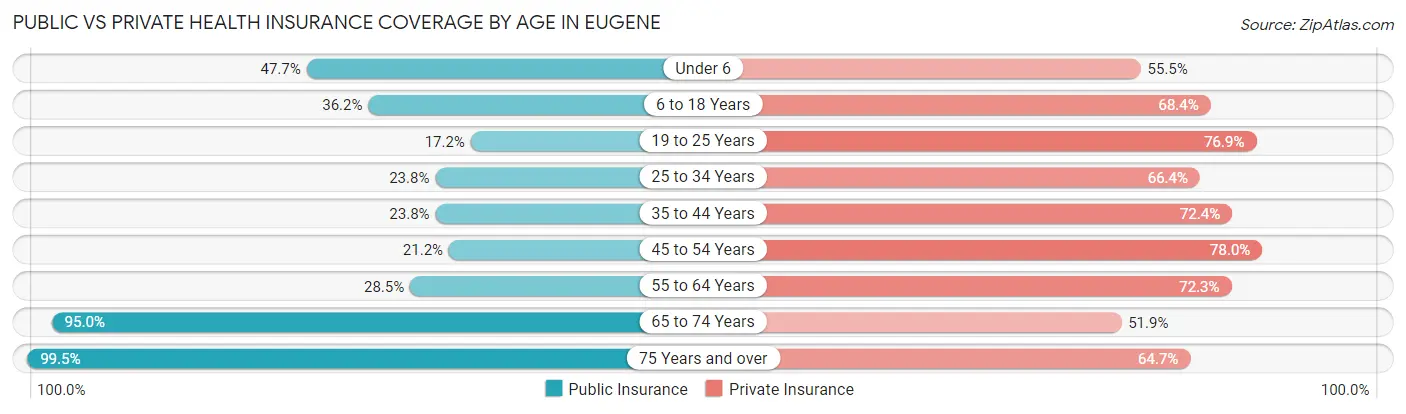
| Age Bracket | Public Insurance | Private Insurance |
| Under 6 | 3,966 (47.7%) | 4,614 (55.5%) |
| 6 to 18 Years | 8,707 (36.2%) | 16,461 (68.4%) |
| 19 to 25 Years | 5,499 (17.2%) | 24,592 (76.9%) |
| 25 to 34 Years | 5,567 (23.8%) | 15,557 (66.4%) |
| 35 to 44 Years | 5,163 (23.7%) | 15,745 (72.4%) |
| 45 to 54 Years | 3,835 (21.2%) | 14,090 (78.0%) |
| 55 to 64 Years | 5,178 (28.5%) | 13,155 (72.3%) |
| 65 to 74 Years | 17,043 (95.0%) | 9,308 (51.9%) |
| 75 Years and over | 11,891 (99.5%) | 7,726 (64.6%) |
| Total | 66,849 (38.1%) | 121,248 (69.0%) |
Disability Status by Sex by Age in Eugene
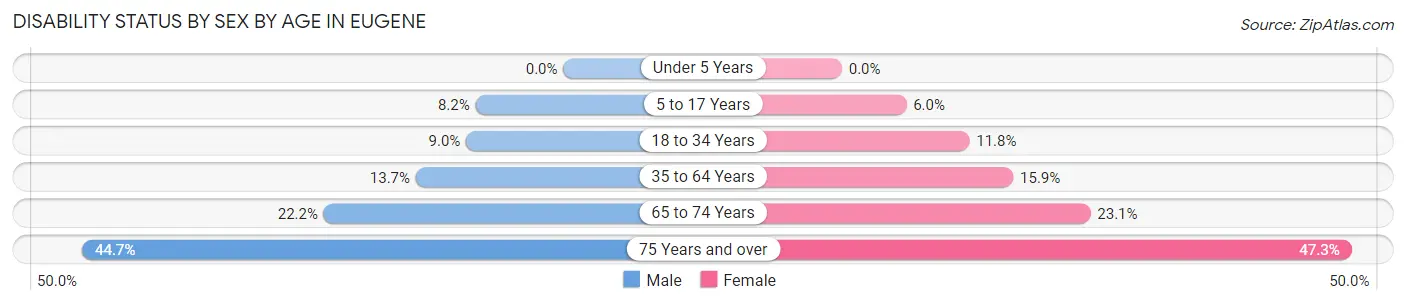
| Age Bracket | Male | Female |
| Under 5 Years | 0 (0.0%) | 0 (0.0%) |
| 5 to 17 Years | 855 (8.2%) | 667 (6.0%) |
| 18 to 34 Years | 2,586 (9.0%) | 3,594 (11.8%) |
| 35 to 64 Years | 3,988 (13.7%) | 4,591 (15.9%) |
| 65 to 74 Years | 1,817 (22.2%) | 2,254 (23.1%) |
| 75 Years and over | 2,308 (44.7%) | 3,209 (47.3%) |
Disability Class by Sex by Age in Eugene
Disability Class: Hearing Difficulty
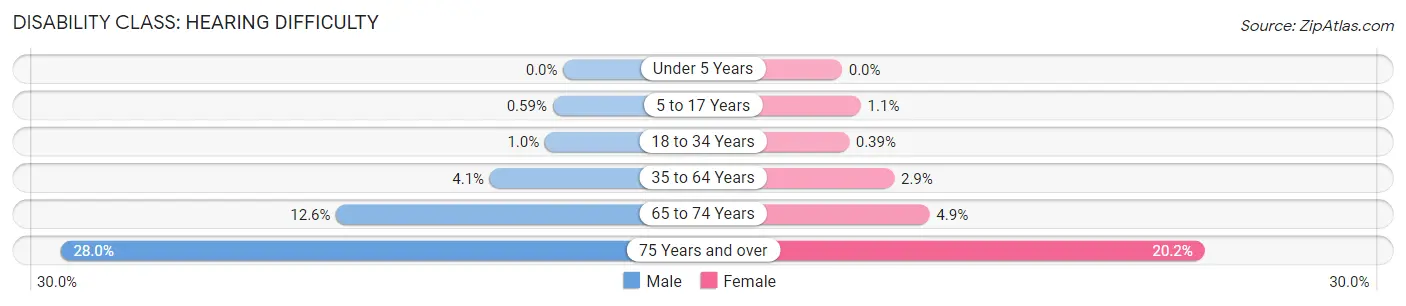
| Age Bracket | Male | Female |
| Under 5 Years | 0 (0.0%) | 0 (0.0%) |
| 5 to 17 Years | 62 (0.6%) | 117 (1.1%) |
| 18 to 34 Years | 294 (1.0%) | 117 (0.4%) |
| 35 to 64 Years | 1,192 (4.1%) | 839 (2.9%) |
| 65 to 74 Years | 1,033 (12.6%) | 477 (4.9%) |
| 75 Years and over | 1,447 (28.0%) | 1,370 (20.2%) |
Disability Class: Vision Difficulty
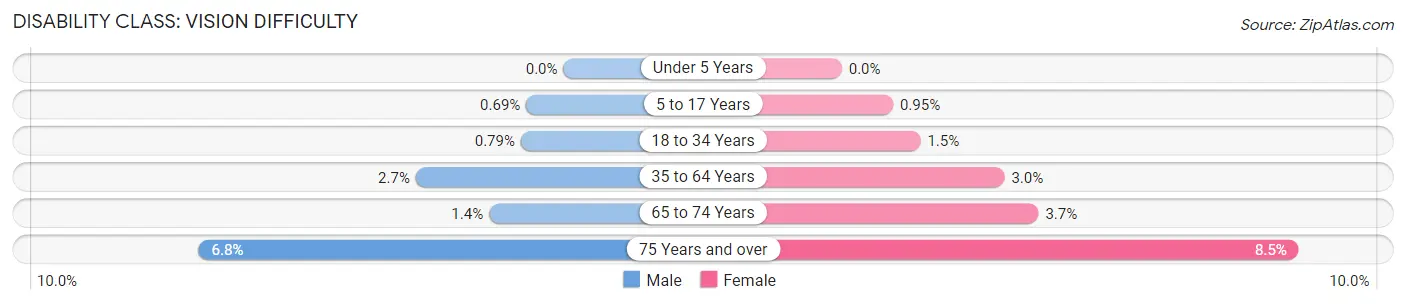
| Age Bracket | Male | Female |
| Under 5 Years | 0 (0.0%) | 0 (0.0%) |
| 5 to 17 Years | 72 (0.7%) | 106 (0.9%) |
| 18 to 34 Years | 228 (0.8%) | 444 (1.5%) |
| 35 to 64 Years | 797 (2.7%) | 872 (3.0%) |
| 65 to 74 Years | 113 (1.4%) | 357 (3.6%) |
| 75 Years and over | 350 (6.8%) | 575 (8.5%) |
Disability Class: Cognitive Difficulty
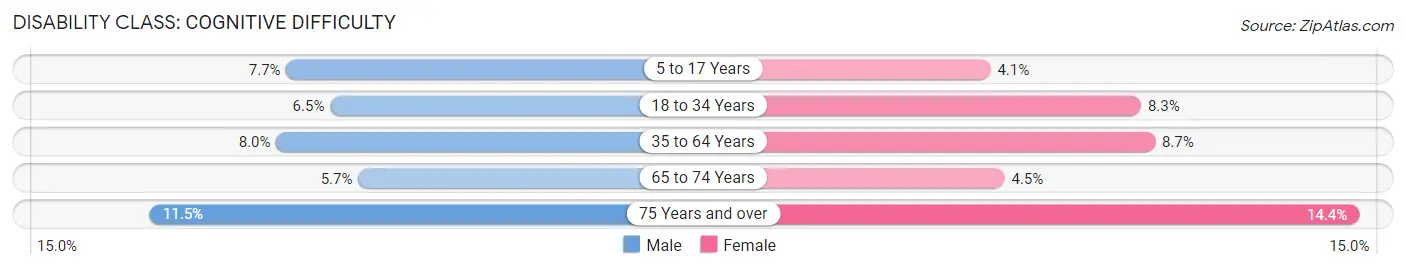
| Age Bracket | Male | Female |
| 5 to 17 Years | 809 (7.7%) | 461 (4.1%) |
| 18 to 34 Years | 1,862 (6.5%) | 2,529 (8.3%) |
| 35 to 64 Years | 2,328 (8.0%) | 2,517 (8.7%) |
| 65 to 74 Years | 467 (5.7%) | 443 (4.5%) |
| 75 Years and over | 595 (11.5%) | 977 (14.4%) |
Disability Class: Ambulatory Difficulty
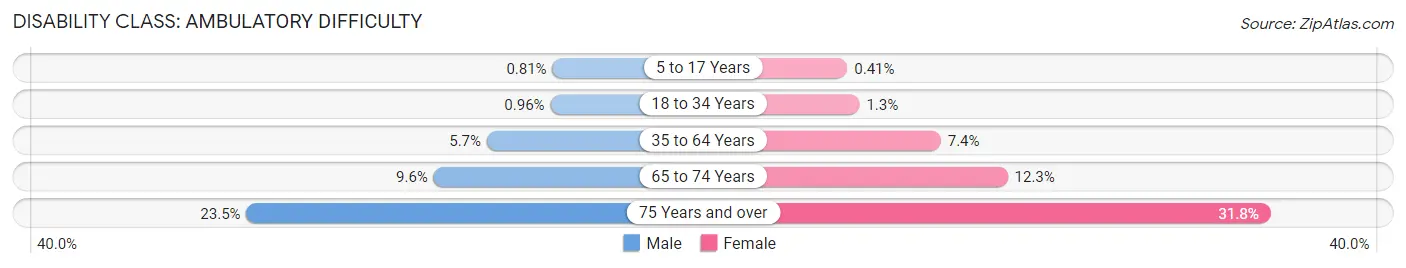
| Age Bracket | Male | Female |
| 5 to 17 Years | 85 (0.8%) | 46 (0.4%) |
| 18 to 34 Years | 275 (1.0%) | 399 (1.3%) |
| 35 to 64 Years | 1,655 (5.7%) | 2,122 (7.3%) |
| 65 to 74 Years | 787 (9.6%) | 1,203 (12.3%) |
| 75 Years and over | 1,216 (23.5%) | 2,160 (31.8%) |
Disability Class: Self-Care Difficulty
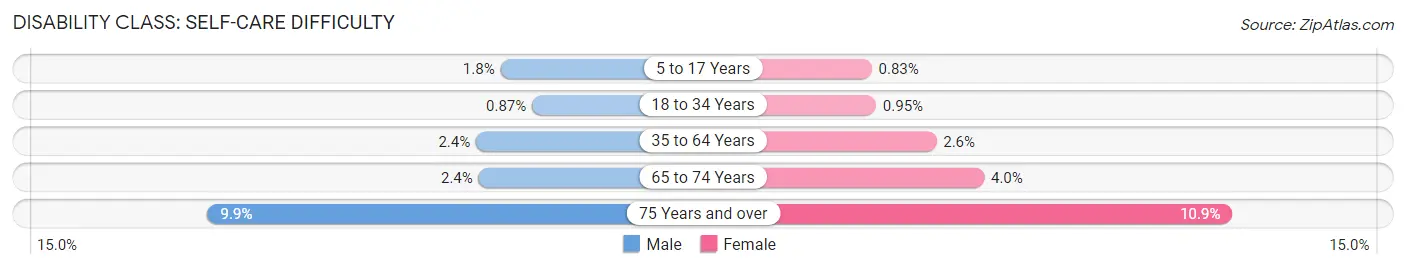
| Age Bracket | Male | Female |
| 5 to 17 Years | 184 (1.8%) | 93 (0.8%) |
| 18 to 34 Years | 249 (0.9%) | 288 (0.9%) |
| 35 to 64 Years | 707 (2.4%) | 760 (2.6%) |
| 65 to 74 Years | 193 (2.4%) | 387 (4.0%) |
| 75 Years and over | 512 (9.9%) | 737 (10.9%) |
Technology Access in Eugene
Computing Device Access in Eugene
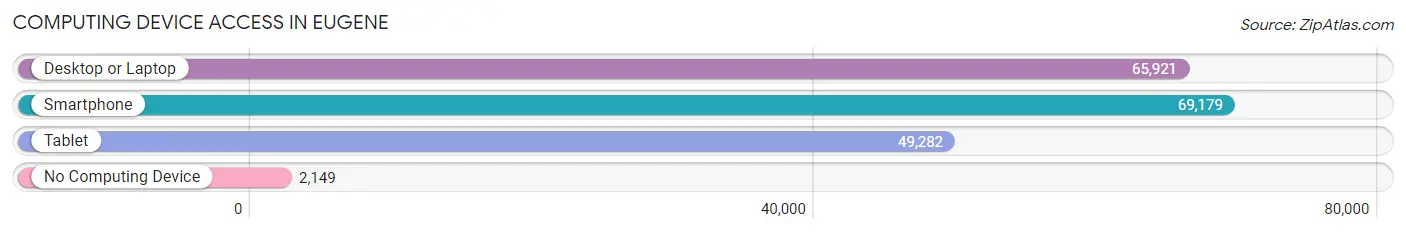
| Device Type | # Households | % Households |
| Desktop or Laptop | 65,921 | 87.3% |
| Smartphone | 69,179 | 91.6% |
| Tablet | 49,282 | 65.2% |
| No Computing Device | 2,149 | 2.9% |
| Total | 75,532 | 100.0% |
Internet Access in Eugene
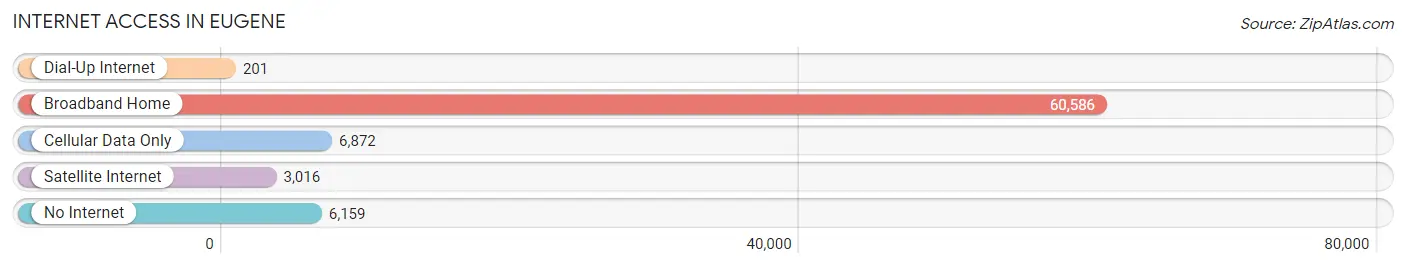
| Internet Type | # Households | % Households |
| Dial-Up Internet | 201 | 0.3% |
| Broadband Home | 60,586 | 80.2% |
| Cellular Data Only | 6,872 | 9.1% |
| Satellite Internet | 3,016 | 4.0% |
| No Internet | 6,159 | 8.2% |
| Total | 75,532 | 100.0% |
Eugene Summary
Eugene, Oregon is a city located in the Willamette Valley of the Pacific Northwest. It is the second-largest city in the state of Oregon, with a population of 156,185 as of the 2010 census. Eugene is the county seat of Lane County and is home to the University of Oregon. The city is known for its natural beauty, outdoor recreation, and progressive culture.
History
The area that is now Eugene was inhabited by the Kalapuya people for thousands of years before the arrival of European settlers. The first Europeans to settle in the area were fur traders in the early 1800s. In 1846, Eugene Franklin Skinner established a trading post near the present-day location of Eugene. The city was officially incorporated in 1862 and named after Skinner’s middle name.
In the late 1800s, Eugene became a center for timber and agricultural production. The city was also home to several industries, including a woolen mill, a paper mill, and a cannery. In the early 1900s, Eugene was a major stop on the Southern Pacific Railroad.
Geography
Eugene is located in the Willamette Valley of the Pacific Northwest. The city is situated on the Willamette River, which flows through the city from north to south. Eugene is surrounded by mountains, including the Cascade Range to the east and the Coast Range to the west. The city is located about 50 miles east of the Oregon Coast.
Eugene has a mild climate, with warm summers and cool winters. The average high temperature in July is 85°F, and the average low temperature in January is 33°F. The city receives an average of 37 inches of precipitation per year.
Economy
Eugene’s economy is largely based on education, healthcare, and government services. The University of Oregon is the largest employer in the city, with over 10,000 employees. Other major employers include PeaceHealth, the Eugene School District, and the City of Eugene.
The city is also home to several manufacturing companies, including Cascade Steel Rolling Mills, Oregon Freeze Dry, and Oregon Cherry Growers. Eugene is also a major center for the timber industry, with several lumber mills located in the city.
Demographics
As of the 2010 census, Eugene had a population of 156,185. The racial makeup of the city was 79.2% White, 4.2% African American, 1.3% Native American, 6.2% Asian, 0.3% Pacific Islander, and 8.0% from other races. The median household income was $41,837, and the median family income was $51,837.
Eugene is home to a diverse population, with a variety of religious and cultural backgrounds. The city is also home to a large LGBT community.
Conclusion
Eugene, Oregon is a vibrant city located in the Willamette Valley of the Pacific Northwest. The city is known for its natural beauty, outdoor recreation, and progressive culture. Eugene’s economy is largely based on education, healthcare, and government services, and the city is home to a diverse population. Eugene is a great place to live, work, and play.
Common Questions
What is Per Capita Income in Eugene?
Per Capita income in Eugene is $39,081.
What is the Median Family Income in Eugene?
Median Family Income in Eugene is $92,629.
What is the Median Household income in Eugene?
Median Household Income in Eugene is $61,481.
What is Income or Wage Gap in Eugene?
Income or Wage Gap in Eugene is 21.4%.
Women in Eugene earn 78.6 cents for every dollar earned by a man.
What is Family Income Deficit in Eugene?
Family Income Deficit in Eugene is $9,443.
Families that are below poverty line in Eugene earn $9,443 less on average than the poverty threshold level.
What is Inequality or Gini Index in Eugene?
Inequality or Gini Index in Eugene is 0.49.
What is the Total Population of Eugene?
Total Population of Eugene is 176,755.
What is the Total Male Population of Eugene?
Total Male Population of Eugene is 86,169.
What is the Total Female Population of Eugene?
Total Female Population of Eugene is 90,586.
What is the Ratio of Males per 100 Females in Eugene?
There are 95.12 Males per 100 Females in Eugene.
What is the Ratio of Females per 100 Males in Eugene?
There are 105.13 Females per 100 Males in Eugene.
What is the Median Population Age in Eugene?
Median Population Age in Eugene is 35.2 Years.
What is the Average Family Size in Eugene
Average Family Size in Eugene is 2.8 People.
What is the Average Household Size in Eugene
Average Household Size in Eugene is 2.2 People.
How Large is the Labor Force in Eugene?
There are 95,464 People in the Labor Forcein in Eugene.
What is the Percentage of People in the Labor Force in Eugene?
62.9% of People are in the Labor Force in Eugene.
What is the Unemployment Rate in Eugene?
Unemployment Rate in Eugene is 7.1%.