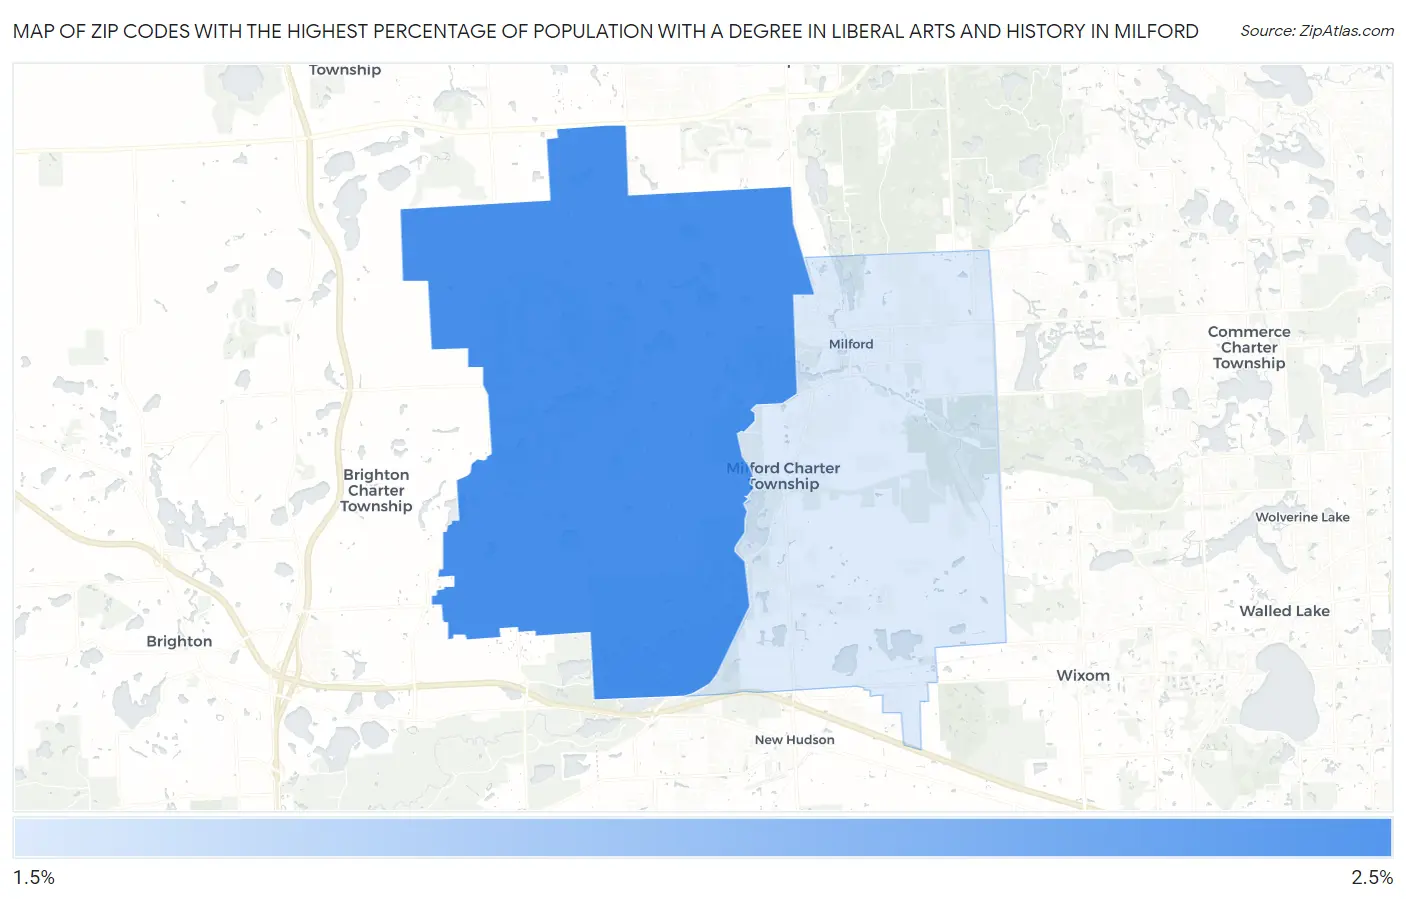
Zip Codes with the Highest Percentage of Population with a Degree in Liberal Arts and History in Milford, MI
RELATED REPORTS & OPTIONS
Liberal Arts and History
Milford
Compare Zip Codes
Map of Zip Codes with the Highest Percentage of Population with a Degree in Liberal Arts and History in Milford
1.8%
2.1%
Zip Codes with the Highest Percentage of Population with a Degree in Liberal Arts and History in Milford, MI
| Zip Code | % Graduates | vs State | vs National | |
| 1. | 48380 | 2.1% | 4.0%(-1.88)#716 | 4.9%(-2.77)#21,075 |
| 2. | 48381 | 1.8% | 4.0%(-2.14)#749 | 4.9%(-3.03)#21,737 |
1
Common Questions
What are the Top Zip Codes with the Highest Percentage of Population with a Degree in Liberal Arts and History in Milford, MI?
Top Zip Codes with the Highest Percentage of Population with a Degree in Liberal Arts and History in Milford, MI are:
What zip code has the Highest Percentage of Population with a Degree in Liberal Arts and History in Milford, MI?
48380 has the Highest Percentage of Population with a Degree in Liberal Arts and History in Milford, MI with 2.1%.
What is the Percentage of Population with a Degree in Liberal Arts and History in Milford, MI?
Percentage of Population with a Degree in Liberal Arts and History in Milford is 2.9%.
What is the Percentage of Population with a Degree in Liberal Arts and History in Michigan?
Percentage of Population with a Degree in Liberal Arts and History in Michigan is 4.0%.
What is the Percentage of Population with a Degree in Liberal Arts and History in the United States?
Percentage of Population with a Degree in Liberal Arts and History in the United States is 4.9%.