Zip Codes with the Highest Percentage of Population with a Degree in Liberal Arts and History in Farmington, MI
RELATED REPORTS & OPTIONS
Liberal Arts and History
Farmington
Compare Zip Codes
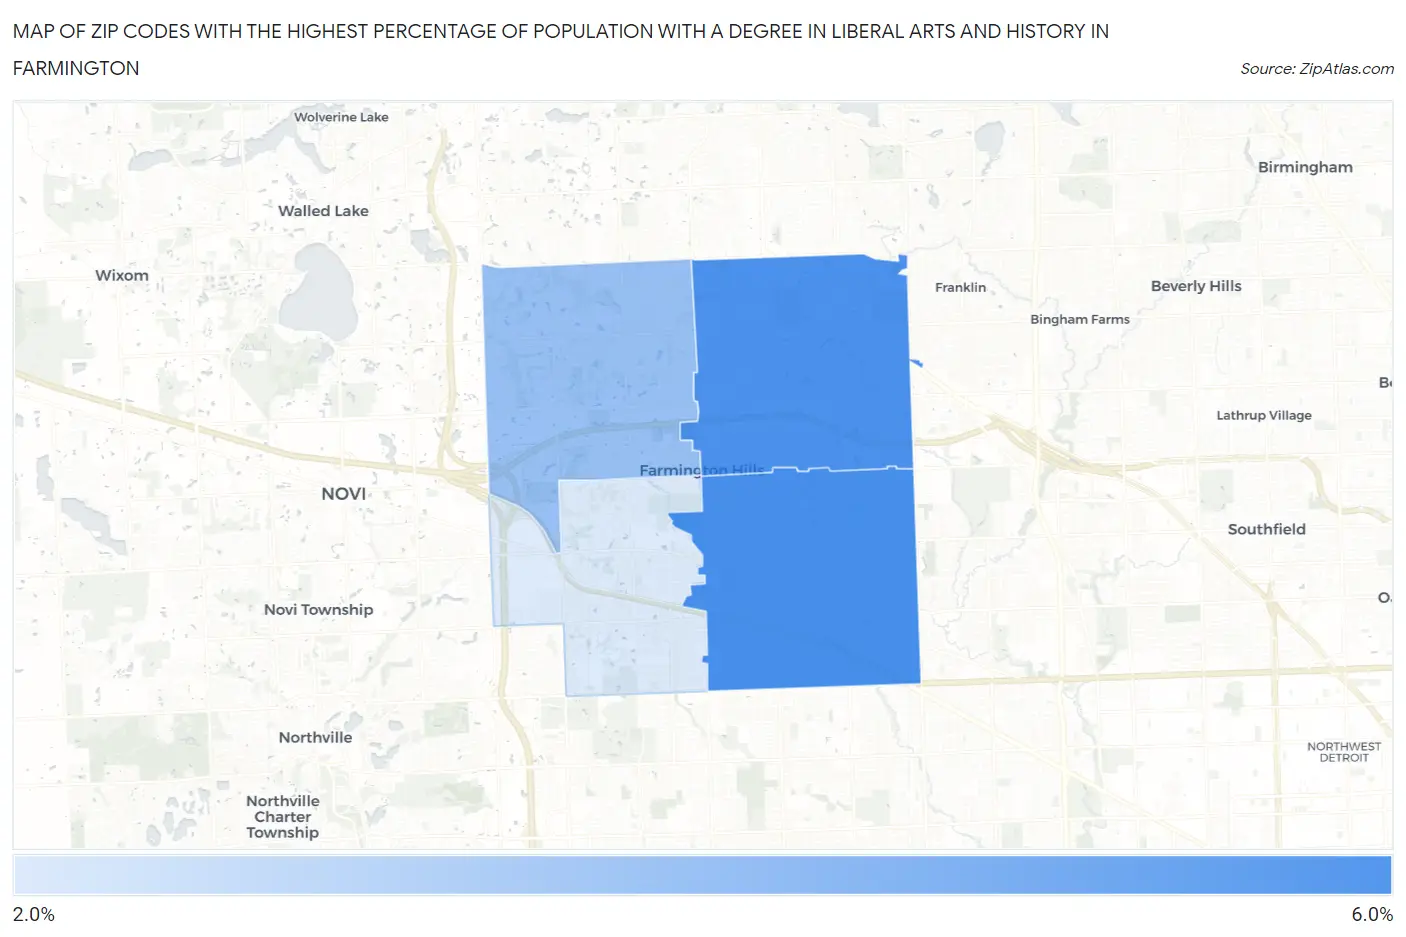
Map of Zip Codes with the Highest Percentage of Population with a Degree in Liberal Arts and History in Farmington
2.1%
5.3%
Zip Codes with the Highest Percentage of Population with a Degree in Liberal Arts and History in Farmington, MI
| Zip Code | % Graduates | vs State | vs National | |
| 1. | 48336 | 5.3% | 4.0%(+1.31)#255 | 4.9%(+0.417)#10,470 |
| 2. | 48334 | 5.2% | 4.0%(+1.20)#262 | 4.9%(+0.308)#10,778 |
| 3. | 48331 | 3.5% | 4.0%(-0.468)#495 | 4.9%(-1.36)#16,537 |
| 4. | 48335 | 2.1% | 4.0%(-1.92)#729 | 4.9%(-2.81)#21,213 |
1
Common Questions
What are the Top 3 Zip Codes with the Highest Percentage of Population with a Degree in Liberal Arts and History in Farmington, MI?
Top 3 Zip Codes with the Highest Percentage of Population with a Degree in Liberal Arts and History in Farmington, MI are:
What zip code has the Highest Percentage of Population with a Degree in Liberal Arts and History in Farmington, MI?
48336 has the Highest Percentage of Population with a Degree in Liberal Arts and History in Farmington, MI with 5.3%.
What is the Percentage of Population with a Degree in Liberal Arts and History in Farmington, MI?
Percentage of Population with a Degree in Liberal Arts and History in Farmington is 3.7%.
What is the Percentage of Population with a Degree in Liberal Arts and History in Michigan?
Percentage of Population with a Degree in Liberal Arts and History in Michigan is 4.0%.
What is the Percentage of Population with a Degree in Liberal Arts and History in the United States?
Percentage of Population with a Degree in Liberal Arts and History in the United States is 4.9%.