Zip Codes with the Highest Percentage of Population with a Degree in Liberal Arts and History in Michigan
RELATED REPORTS & OPTIONS
Liberal Arts and History
Michigan
Compare Zip Codes
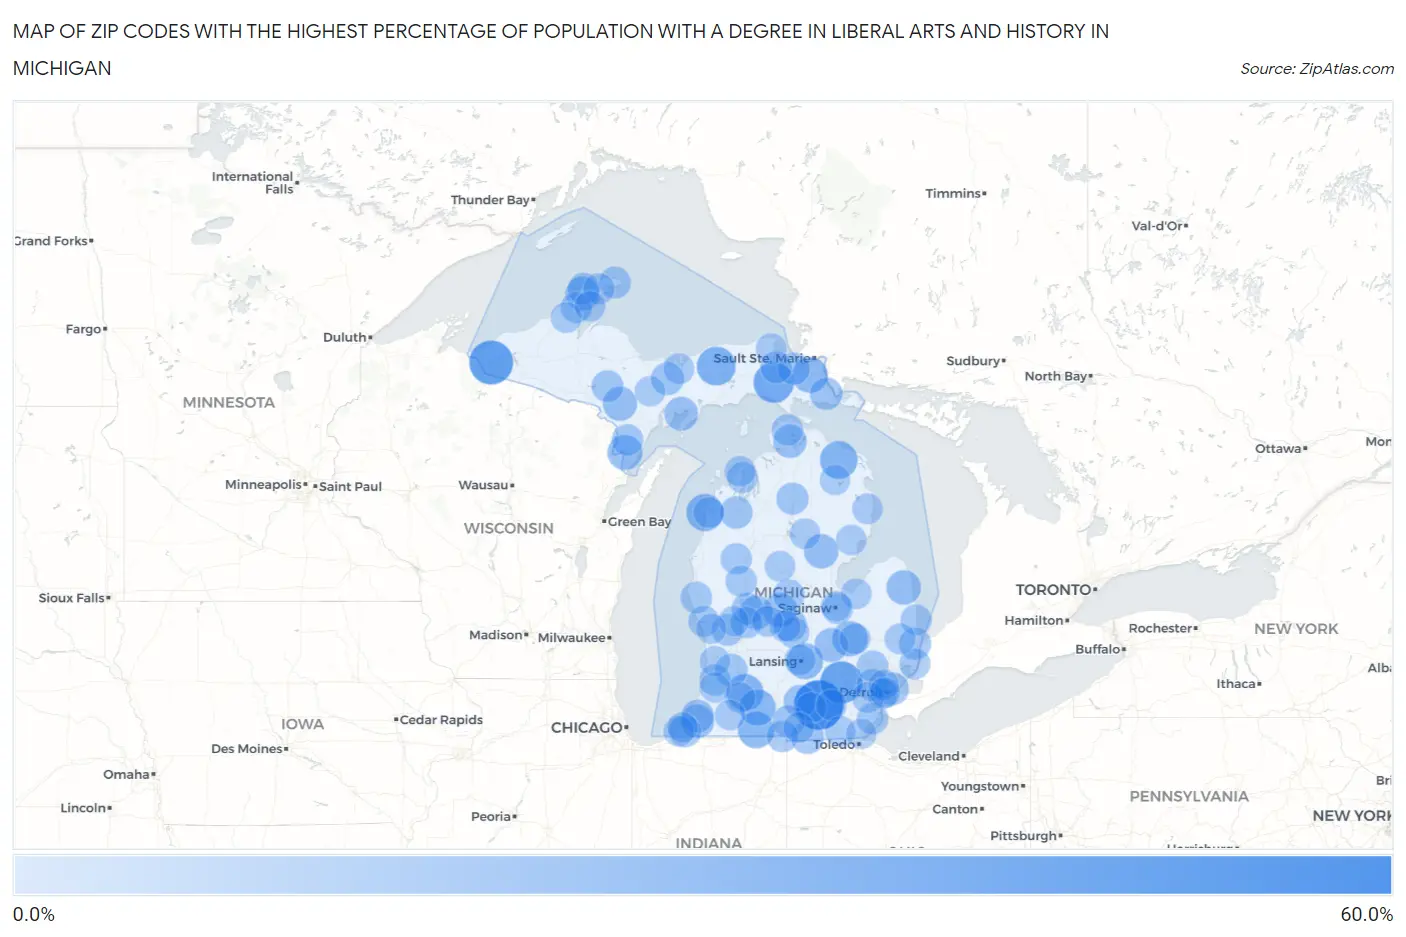
Map of Zip Codes with the Highest Percentage of Population with a Degree in Liberal Arts and History in Michigan
0.0%
60.0%
Zip Codes with the Highest Percentage of Population with a Degree in Liberal Arts and History in Michigan
| Zip Code | % Graduates | vs State | vs National | |
| 1. | 49261 | 51.2% | 4.0%(+47.2)#1 | 4.9%(+46.3)#138 |
| 2. | 49959 | 38.1% | 4.0%(+34.1)#2 | 4.9%(+33.2)#268 |
| 3. | 48143 | 34.5% | 4.0%(+30.5)#3 | 4.9%(+29.6)#325 |
| 4. | 49793 | 30.4% | 4.0%(+26.5)#4 | 4.9%(+25.6)#410 |
| 5. | 49883 | 26.3% | 4.0%(+22.3)#5 | 4.9%(+21.4)#523 |
| 6. | 49743 | 23.9% | 4.0%(+19.9)#6 | 4.9%(+19.0)#635 |
| 7. | 49628 | 23.3% | 4.0%(+19.3)#7 | 4.9%(+18.4)#661 |
| 8. | 49074 | 22.2% | 4.0%(+18.2)#8 | 4.9%(+17.4)#724 |
| 9. | 49030 | 21.7% | 4.0%(+17.7)#9 | 4.9%(+16.8)#754 |
| 10. | 49052 | 21.2% | 4.0%(+17.3)#10 | 4.9%(+16.4)#781 |
| 11. | 48825 | 20.5% | 4.0%(+16.5)#11 | 4.9%(+15.6)#828 |
| 12. | 49724 | 19.7% | 4.0%(+15.7)#12 | 4.9%(+14.8)#887 |
| 13. | 48502 | 19.2% | 4.0%(+15.2)#13 | 4.9%(+14.3)#921 |
| 14. | 49848 | 18.2% | 4.0%(+14.2)#14 | 4.9%(+13.3)#1,018 |
| 15. | 48456 | 17.0% | 4.0%(+13.0)#15 | 4.9%(+12.1)#1,131 |
| 16. | 48610 | 17.0% | 4.0%(+13.0)#16 | 4.9%(+12.1)#1,134 |
| 17. | 48891 | 16.5% | 4.0%(+12.5)#17 | 4.9%(+11.6)#1,188 |
| 18. | 49901 | 16.4% | 4.0%(+12.5)#18 | 4.9%(+11.6)#1,196 |
| 19. | 49834 | 16.4% | 4.0%(+12.4)#19 | 4.9%(+11.5)#1,211 |
| 20. | 49322 | 15.7% | 4.0%(+11.7)#20 | 4.9%(+10.8)#1,309 |
| 21. | 48476 | 15.4% | 4.0%(+11.4)#21 | 4.9%(+10.5)#1,347 |
| 22. | 49864 | 15.4% | 4.0%(+11.4)#22 | 4.9%(+10.5)#1,361 |
| 23. | 49716 | 14.9% | 4.0%(+11.0)#23 | 4.9%(+10.1)#1,437 |
| 24. | 49103 | 14.5% | 4.0%(+10.6)#24 | 4.9%(+9.67)#1,518 |
| 25. | 48856 | 14.4% | 4.0%(+10.5)#25 | 4.9%(+9.57)#1,532 |
| 26. | 49126 | 13.8% | 4.0%(+9.86)#26 | 4.9%(+8.97)#1,670 |
| 27. | 49816 | 13.5% | 4.0%(+9.55)#27 | 4.9%(+8.66)#1,756 |
| 28. | 49288 | 13.5% | 4.0%(+9.53)#28 | 4.9%(+8.64)#1,763 |
| 29. | 48215 | 13.1% | 4.0%(+9.13)#29 | 4.9%(+8.24)#1,873 |
| 30. | 49637 | 13.0% | 4.0%(+9.02)#30 | 4.9%(+8.13)#1,908 |
| 31. | 49283 | 12.8% | 4.0%(+8.78)#31 | 4.9%(+7.89)#1,969 |
| 32. | 49736 | 12.7% | 4.0%(+8.69)#32 | 4.9%(+7.80)#1,994 |
| 33. | 49328 | 12.6% | 4.0%(+8.65)#33 | 4.9%(+7.76)#2,002 |
| 34. | 49227 | 12.4% | 4.0%(+8.41)#34 | 4.9%(+7.52)#2,083 |
| 35. | 49715 | 12.2% | 4.0%(+8.20)#35 | 4.9%(+7.31)#2,146 |
| 36. | 49733 | 12.1% | 4.0%(+8.14)#36 | 4.9%(+7.25)#2,163 |
| 37. | 49128 | 11.9% | 4.0%(+7.89)#37 | 4.9%(+7.00)#2,246 |
| 38. | 48074 | 11.7% | 4.0%(+7.68)#38 | 4.9%(+6.79)#2,313 |
| 39. | 49918 | 11.6% | 4.0%(+7.65)#39 | 4.9%(+6.76)#2,321 |
| 40. | 49815 | 11.5% | 4.0%(+7.56)#40 | 4.9%(+6.67)#2,350 |
| 41. | 49403 | 11.4% | 4.0%(+7.37)#41 | 4.9%(+6.48)#2,424 |
| 42. | 49728 | 11.1% | 4.0%(+7.13)#42 | 4.9%(+6.24)#2,514 |
| 43. | 49805 | 11.0% | 4.0%(+7.05)#43 | 4.9%(+6.16)#2,543 |
| 44. | 48240 | 11.0% | 4.0%(+7.05)#44 | 4.9%(+6.16)#2,544 |
| 45. | 49255 | 11.0% | 4.0%(+7.04)#45 | 4.9%(+6.15)#2,547 |
| 46. | 49329 | 10.9% | 4.0%(+6.96)#46 | 4.9%(+6.07)#2,591 |
| 47. | 49446 | 10.8% | 4.0%(+6.80)#47 | 4.9%(+5.92)#2,651 |
| 48. | 49319 | 10.7% | 4.0%(+6.75)#48 | 4.9%(+5.86)#2,673 |
| 49. | 49821 | 10.7% | 4.0%(+6.71)#49 | 4.9%(+5.82)#2,703 |
| 50. | 49450 | 10.6% | 4.0%(+6.63)#50 | 4.9%(+5.74)#2,754 |
| 51. | 48859 | 10.6% | 4.0%(+6.62)#51 | 4.9%(+5.73)#2,758 |
| 52. | 48166 | 10.5% | 4.0%(+6.49)#52 | 4.9%(+5.60)#2,829 |
| 53. | 49755 | 10.4% | 4.0%(+6.41)#53 | 4.9%(+5.52)#2,870 |
| 54. | 48340 | 10.2% | 4.0%(+6.24)#54 | 4.9%(+5.35)#2,984 |
| 55. | 49656 | 10.1% | 4.0%(+6.14)#55 | 4.9%(+5.25)#3,042 |
| 56. | 49950 | 10.0% | 4.0%(+6.02)#56 | 4.9%(+5.13)#3,109 |
| 57. | 48853 | 10.0% | 4.0%(+6.02)#57 | 4.9%(+5.13)#3,113 |
| 58. | 49440 | 9.9% | 4.0%(+5.95)#58 | 4.9%(+5.06)#3,147 |
| 59. | 49338 | 9.9% | 4.0%(+5.94)#59 | 4.9%(+5.05)#3,149 |
| 60. | 48450 | 9.8% | 4.0%(+5.84)#60 | 4.9%(+4.95)#3,221 |
| 61. | 49922 | 9.6% | 4.0%(+5.66)#61 | 4.9%(+4.77)#3,342 |
| 62. | 48811 | 9.6% | 4.0%(+5.62)#62 | 4.9%(+4.73)#3,371 |
| 63. | 48184 | 9.5% | 4.0%(+5.56)#63 | 4.9%(+4.67)#3,423 |
| 64. | 49674 | 9.4% | 4.0%(+5.44)#64 | 4.9%(+4.55)#3,515 |
| 65. | 48915 | 9.3% | 4.0%(+5.33)#65 | 4.9%(+4.44)#3,595 |
| 66. | 48039 | 9.3% | 4.0%(+5.31)#66 | 4.9%(+4.42)#3,607 |
| 67. | 48601 | 9.3% | 4.0%(+5.28)#67 | 4.9%(+4.39)#3,632 |
| 68. | 48509 | 9.2% | 4.0%(+5.18)#68 | 4.9%(+4.29)#3,703 |
| 69. | 48022 | 9.1% | 4.0%(+5.11)#69 | 4.9%(+4.22)#3,751 |
| 70. | 49955 | 9.1% | 4.0%(+5.11)#70 | 4.9%(+4.22)#3,771 |
| 71. | 49768 | 9.1% | 4.0%(+5.11)#71 | 4.9%(+4.22)#3,772 |
| 72. | 49670 | 9.1% | 4.0%(+5.09)#72 | 4.9%(+4.20)#3,790 |
| 73. | 49862 | 8.9% | 4.0%(+4.90)#73 | 4.9%(+4.01)#3,960 |
| 74. | 49635 | 8.9% | 4.0%(+4.88)#74 | 4.9%(+3.99)#3,976 |
| 75. | 49234 | 8.8% | 4.0%(+4.83)#75 | 4.9%(+3.94)#4,017 |
| 76. | 48158 | 8.8% | 4.0%(+4.83)#76 | 4.9%(+3.94)#4,018 |
| 77. | 49945 | 8.8% | 4.0%(+4.79)#77 | 4.9%(+3.90)#4,063 |
| 78. | 48740 | 8.8% | 4.0%(+4.79)#78 | 4.9%(+3.90)#4,064 |
| 79. | 49242 | 8.8% | 4.0%(+4.78)#79 | 4.9%(+3.89)#4,067 |
| 80. | 48701 | 8.7% | 4.0%(+4.68)#80 | 4.9%(+3.79)#4,161 |
| 81. | 48885 | 8.6% | 4.0%(+4.66)#81 | 4.9%(+3.77)#4,177 |
| 82. | 48209 | 8.6% | 4.0%(+4.66)#82 | 4.9%(+3.77)#4,180 |
| 83. | 48656 | 8.6% | 4.0%(+4.64)#83 | 4.9%(+3.75)#4,201 |
| 84. | 49008 | 8.5% | 4.0%(+4.51)#84 | 4.9%(+3.62)#4,345 |
| 85. | 49067 | 8.5% | 4.0%(+4.49)#85 | 4.9%(+3.60)#4,365 |
| 86. | 49228 | 8.5% | 4.0%(+4.48)#86 | 4.9%(+3.59)#4,372 |
| 87. | 48748 | 8.4% | 4.0%(+4.39)#87 | 4.9%(+3.50)#4,470 |
| 88. | 48633 | 8.3% | 4.0%(+4.35)#88 | 4.9%(+3.46)#4,528 |
| 89. | 49423 | 8.3% | 4.0%(+4.34)#89 | 4.9%(+3.45)#4,532 |
| 90. | 48203 | 8.3% | 4.0%(+4.33)#90 | 4.9%(+3.44)#4,546 |
| 91. | 49746 | 8.2% | 4.0%(+4.24)#91 | 4.9%(+3.35)#4,634 |
| 92. | 48607 | 8.2% | 4.0%(+4.19)#92 | 4.9%(+3.30)#4,688 |
| 93. | 49330 | 8.2% | 4.0%(+4.17)#93 | 4.9%(+3.28)#4,716 |
| 94. | 48216 | 8.1% | 4.0%(+4.14)#94 | 4.9%(+3.25)#4,756 |
| 95. | 49129 | 8.1% | 4.0%(+4.10)#95 | 4.9%(+3.21)#4,797 |
| 96. | 48133 | 8.1% | 4.0%(+4.10)#96 | 4.9%(+3.21)#4,803 |
| 97. | 49415 | 8.1% | 4.0%(+4.10)#97 | 4.9%(+3.21)#4,808 |
| 98. | 49056 | 8.0% | 4.0%(+4.05)#98 | 4.9%(+3.16)#4,855 |
| 99. | 49115 | 8.0% | 4.0%(+3.99)#99 | 4.9%(+3.10)#4,935 |
| 100. | 49880 | 7.9% | 4.0%(+3.91)#100 | 4.9%(+3.02)#5,042 |
Common Questions
What are the Top 10 Zip Codes with the Highest Percentage of Population with a Degree in Liberal Arts and History in Michigan?
Top 10 Zip Codes with the Highest Percentage of Population with a Degree in Liberal Arts and History in Michigan are:
What zip code has the Highest Percentage of Population with a Degree in Liberal Arts and History in Michigan?
49261 has the Highest Percentage of Population with a Degree in Liberal Arts and History in Michigan with 51.2%.
What is the Percentage of Population with a Degree in Liberal Arts and History in the State of Michigan?
Percentage of Population with a Degree in Liberal Arts and History in Michigan is 4.0%.
What is the Percentage of Population with a Degree in Liberal Arts and History in the United States?
Percentage of Population with a Degree in Liberal Arts and History in the United States is 4.9%.