Skidway Lake, MI Map & Demographics
Skidway Lake Map
Skidway Lake Overview
$18,156
PER CAPITA INCOME
$36,814
AVG FAMILY INCOME
$33,503
AVG HOUSEHOLD INCOME
10.3%
WAGE / INCOME GAP [ % ]
89.7¢/ $1
WAGE / INCOME GAP [ $ ]
0.41
INEQUALITY / GINI INDEX
2,880
TOTAL POPULATION
1,421
MALE POPULATION
1,459
FEMALE POPULATION
97.40
MALES / 100 FEMALES
102.67
FEMALES / 100 MALES
43.4
MEDIAN AGE
2.8
AVG FAMILY SIZE
2.3
AVG HOUSEHOLD SIZE
898
LABOR FORCE [ PEOPLE ]
38.7%
PERCENT IN LABOR FORCE
15.1%
UNEMPLOYMENT RATE
Income in Skidway Lake
Income Overview in Skidway Lake
Per Capita Income in Skidway Lake is $18,156, while median incomes of families and households are $36,814 and $33,503 respectively.
| Characteristic | Number | Measure |
| Per Capita Income | 2,880 | $18,156 |
| Median Family Income | 732 | $36,814 |
| Mean Family Income | 732 | $49,845 |
| Median Household Income | 1,255 | $33,503 |
| Mean Household Income | 1,255 | $42,029 |
| Income Deficit | 732 | $0 |
| Wage / Income Gap (%) | 2,880 | 10.34% |
| Wage / Income Gap ($) | 2,880 | 89.66¢ per $1 |
| Gini / Inequality Index | 2,880 | 0.41 |
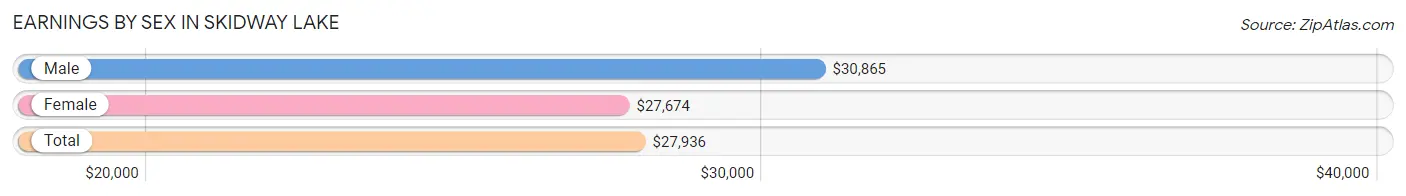
Earnings by Sex in Skidway Lake
Average Earnings in Skidway Lake are $27,936, $30,865 for men and $27,674 for women, a difference of 10.3%.
| Sex | Number | Average Earnings |
| Male | 431 (49.3%) | $30,865 |
| Female | 444 (50.7%) | $27,674 |
| Total | 875 (100.0%) | $27,936 |
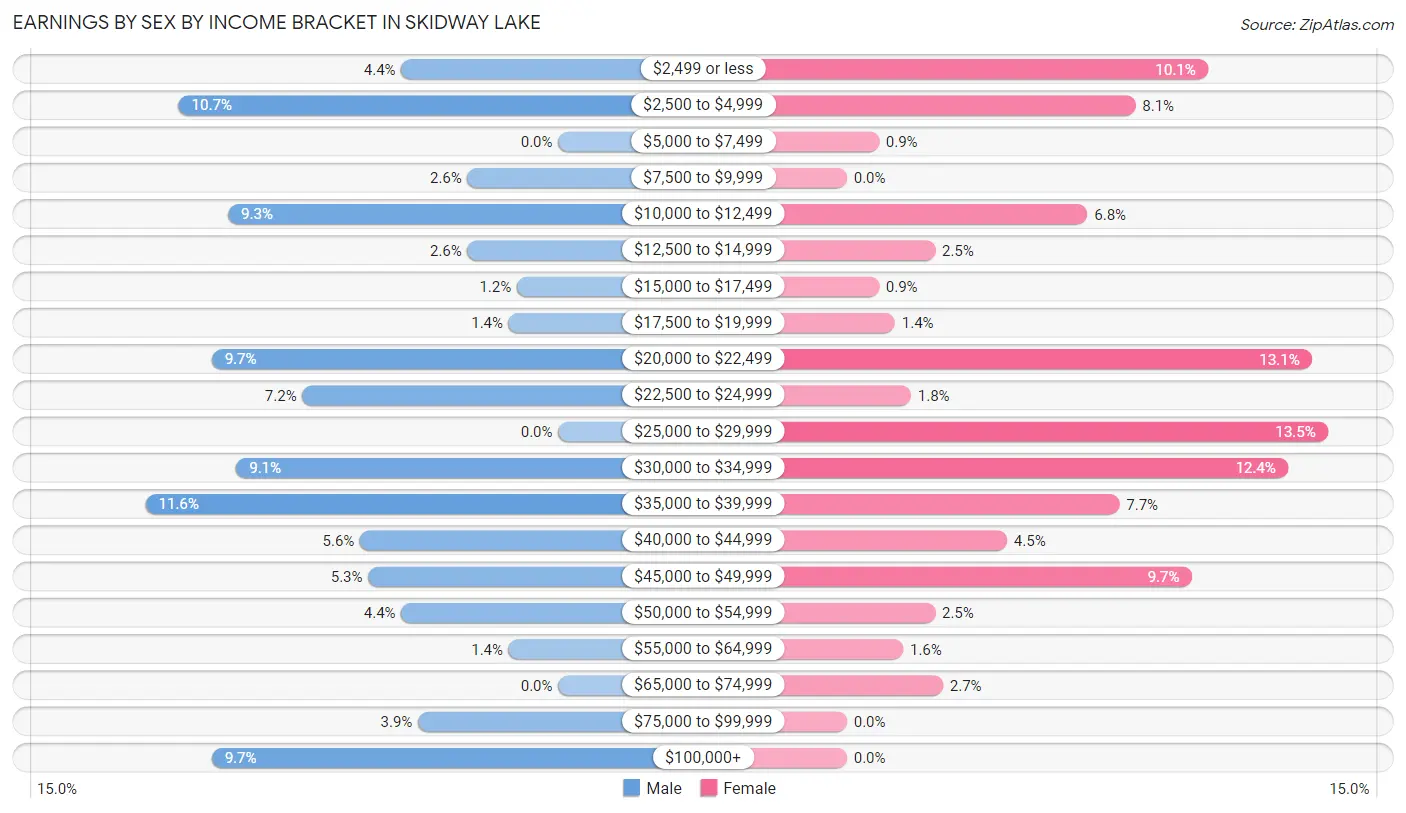
Earnings by Sex by Income Bracket in Skidway Lake
The most common earnings brackets in Skidway Lake are $35,000 to $39,999 for men (50 | 11.6%) and $25,000 to $29,999 for women (60 | 13.5%).
| Income | Male | Female |
| $2,499 or less | 19 (4.4%) | 45 (10.1%) |
| $2,500 to $4,999 | 46 (10.7%) | 36 (8.1%) |
| $5,000 to $7,499 | 0 (0.0%) | 4 (0.9%) |
| $7,500 to $9,999 | 11 (2.5%) | 0 (0.0%) |
| $10,000 to $12,499 | 40 (9.3%) | 30 (6.8%) |
| $12,500 to $14,999 | 11 (2.5%) | 11 (2.5%) |
| $15,000 to $17,499 | 5 (1.2%) | 4 (0.9%) |
| $17,500 to $19,999 | 6 (1.4%) | 6 (1.3%) |
| $20,000 to $22,499 | 42 (9.7%) | 58 (13.1%) |
| $22,500 to $24,999 | 31 (7.2%) | 8 (1.8%) |
| $25,000 to $29,999 | 0 (0.0%) | 60 (13.5%) |
| $30,000 to $34,999 | 39 (9.0%) | 55 (12.4%) |
| $35,000 to $39,999 | 50 (11.6%) | 34 (7.7%) |
| $40,000 to $44,999 | 24 (5.6%) | 20 (4.5%) |
| $45,000 to $49,999 | 23 (5.3%) | 43 (9.7%) |
| $50,000 to $54,999 | 19 (4.4%) | 11 (2.5%) |
| $55,000 to $64,999 | 6 (1.4%) | 7 (1.6%) |
| $65,000 to $74,999 | 0 (0.0%) | 12 (2.7%) |
| $75,000 to $99,999 | 17 (3.9%) | 0 (0.0%) |
| $100,000+ | 42 (9.7%) | 0 (0.0%) |
| Total | 431 (100.0%) | 444 (100.0%) |
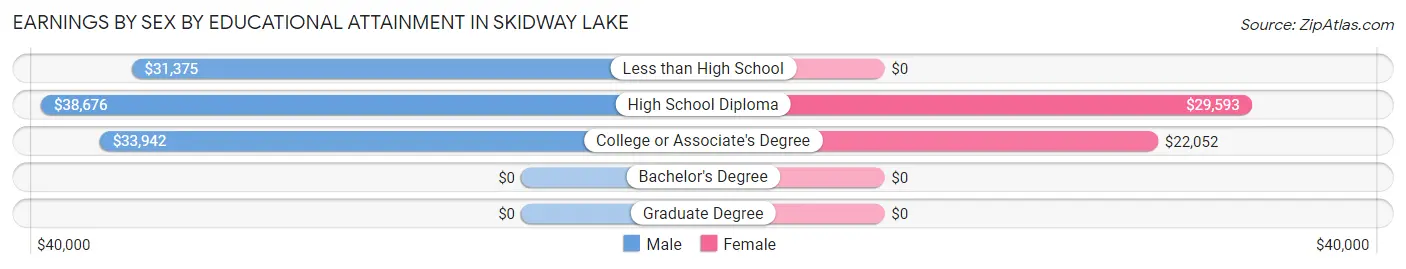
Earnings by Sex by Educational Attainment in Skidway Lake
Average earnings in Skidway Lake are $35,859 for men and $28,663 for women, a difference of 20.1%. Men with an educational attainment of high school diploma enjoy the highest average annual earnings of $38,676, while those with less than high school education earn the least with $31,375. Women with an educational attainment of high school diploma earn the most with the average annual earnings of $29,593, while those with college or associate's degree education have the smallest earnings of $22,052.
| Educational Attainment | Male Income | Female Income |
| Less than High School | $31,375 | $0 |
| High School Diploma | $38,676 | $29,593 |
| College or Associate's Degree | $33,942 | $22,052 |
| Bachelor's Degree | - | - |
| Graduate Degree | - | - |
| Total | $35,859 | $28,663 |
Family Income in Skidway Lake
Family Income Brackets in Skidway Lake
According to the Skidway Lake family income data, there are 132 families falling into the $50,000 to $74,999 income range, which is the most common income bracket and makes up 18.0% of all families.
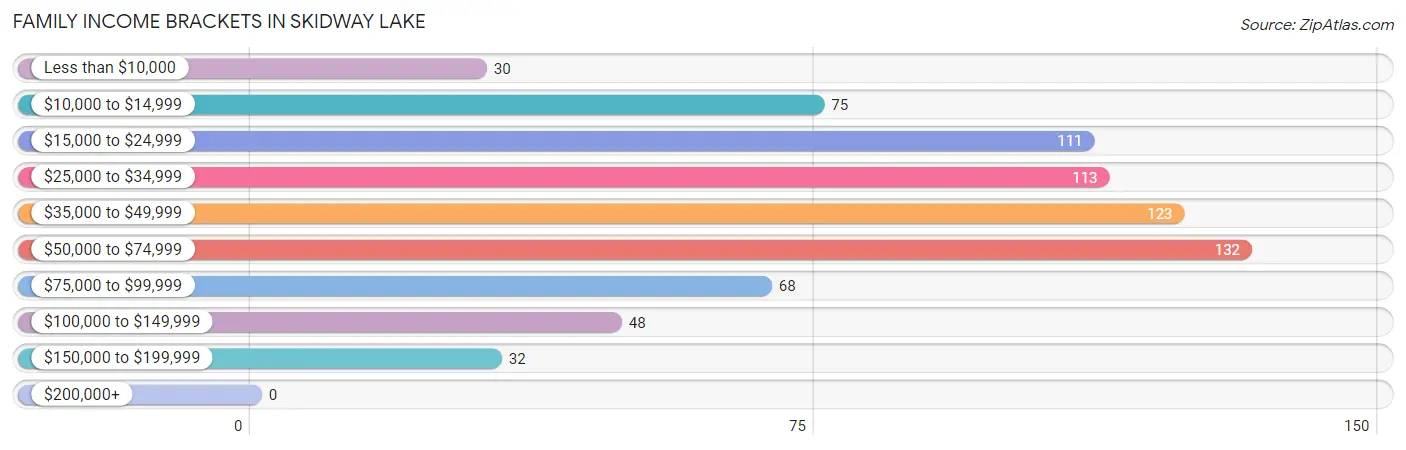
| Income Bracket | # Families | % Families |
| Less than $10,000 | 30 | 4.1% |
| $10,000 to $14,999 | 75 | 10.2% |
| $15,000 to $24,999 | 111 | 15.2% |
| $25,000 to $34,999 | 113 | 15.4% |
| $35,000 to $49,999 | 123 | 16.8% |
| $50,000 to $74,999 | 132 | 18.0% |
| $75,000 to $99,999 | 68 | 9.3% |
| $100,000 to $149,999 | 48 | 6.6% |
| $150,000 to $199,999 | 32 | 4.4% |
| $200,000+ | 0 | 0.0% |
Family Income by Famaliy Size in Skidway Lake
3-person families (156 | 21.3%) account for the highest median family income in Skidway Lake with $64,286 per family, while 3-person families (156 | 21.3%) have the highest median income of $21,429 per family member.
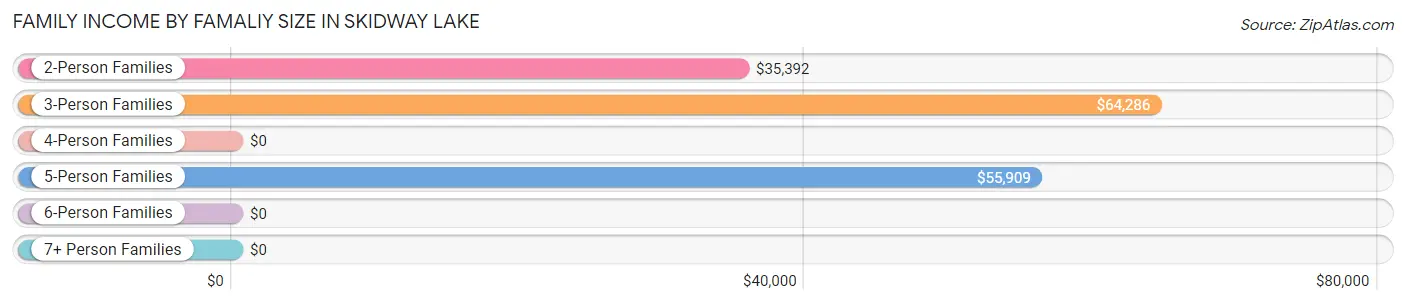
| Income Bracket | # Families | Median Income |
| 2-Person Families | 442 (60.4%) | $35,392 |
| 3-Person Families | 156 (21.3%) | $64,286 |
| 4-Person Families | 72 (9.8%) | $0 |
| 5-Person Families | 30 (4.1%) | $55,909 |
| 6-Person Families | 29 (4.0%) | $0 |
| 7+ Person Families | 3 (0.4%) | $0 |
| Total | 732 (100.0%) | $36,814 |
Family Income by Number of Earners in Skidway Lake
The median family income in Skidway Lake is $36,814, with families comprising 3+ earners (64) having the highest median family income of $95,938, while families with no earners (311) have the lowest median family income of $24,547, accounting for 8.7% and 42.5% of families, respectively.
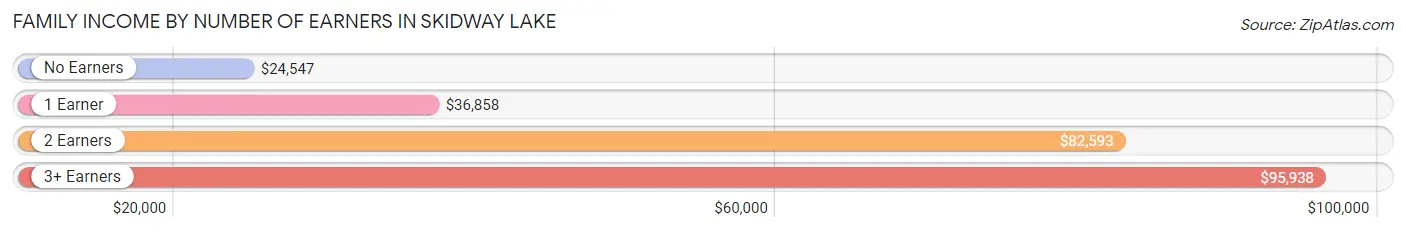
| Number of Earners | # Families | Median Income |
| No Earners | 311 (42.5%) | $24,547 |
| 1 Earner | 225 (30.7%) | $36,858 |
| 2 Earners | 132 (18.0%) | $82,593 |
| 3+ Earners | 64 (8.7%) | $95,938 |
| Total | 732 (100.0%) | $36,814 |
Household Income in Skidway Lake
Household Income Brackets in Skidway Lake
With 246 households falling in the category, the $15,000 to $24,999 income range is the most frequent in Skidway Lake, accounting for 19.6% of all households.
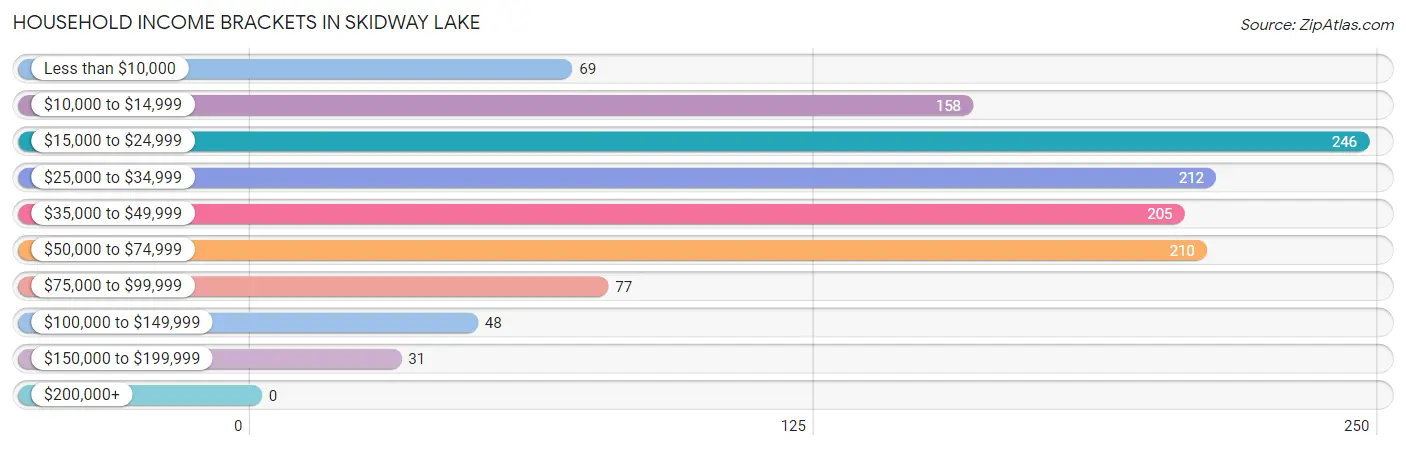
| Income Bracket | # Households | % Households |
| Less than $10,000 | 69 | 5.5% |
| $10,000 to $14,999 | 158 | 12.6% |
| $15,000 to $24,999 | 246 | 19.6% |
| $25,000 to $34,999 | 212 | 16.9% |
| $35,000 to $49,999 | 205 | 16.3% |
| $50,000 to $74,999 | 210 | 16.7% |
| $75,000 to $99,999 | 77 | 6.1% |
| $100,000 to $149,999 | 48 | 3.8% |
| $150,000 to $199,999 | 31 | 2.5% |
| $200,000+ | 0 | 0.0% |
Household Income by Householder Age in Skidway Lake
The median household income in Skidway Lake is $33,503, with the highest median household income of $36,250 found in the 45 to 64 years age bracket for the primary householder. A total of 498 households (39.7%) fall into this category. Meanwhile, the 15 to 24 years age bracket for the primary householder has the lowest median household income of $0, with 6 households (0.5%) in this group.
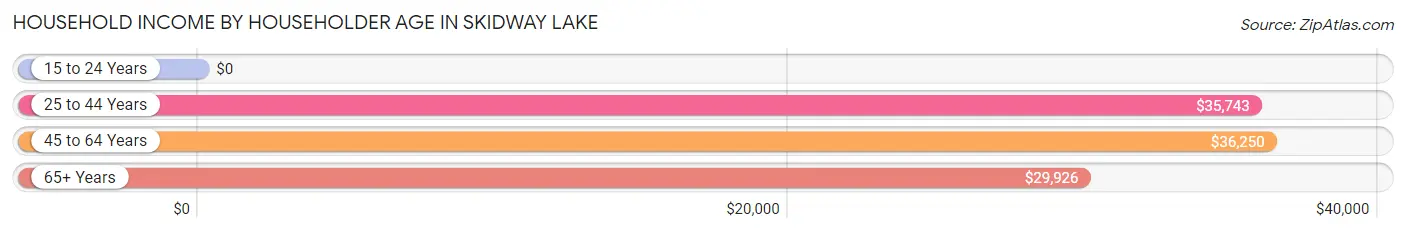
| Income Bracket | # Households | Median Income |
| 15 to 24 Years | 6 (0.5%) | $0 |
| 25 to 44 Years | 390 (31.1%) | $35,743 |
| 45 to 64 Years | 498 (39.7%) | $36,250 |
| 65+ Years | 361 (28.8%) | $29,926 |
| Total | 1,255 (100.0%) | $33,503 |
Poverty in Skidway Lake
Income Below Poverty by Sex and Age in Skidway Lake
With 32.3% poverty level for males and 39.9% for females among the residents of Skidway Lake, 12 to 14 year old males and 5 year old females are the most vulnerable to poverty, with 71 males (84.5%) and 20 females (100.0%) in their respective age groups living below the poverty level.
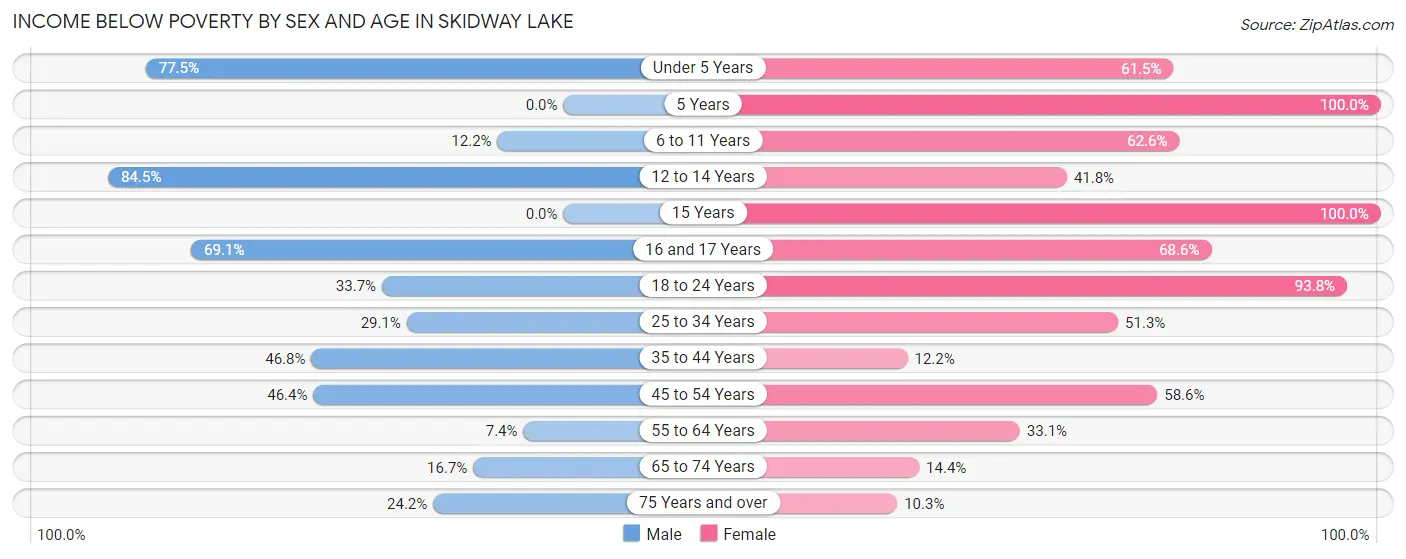
| Age Bracket | Male | Female |
| Under 5 Years | 31 (77.5%) | 80 (61.5%) |
| 5 Years | 0 (0.0%) | 20 (100.0%) |
| 6 to 11 Years | 6 (12.2%) | 57 (62.6%) |
| 12 to 14 Years | 71 (84.5%) | 28 (41.8%) |
| 15 Years | 0 (0.0%) | 7 (100.0%) |
| 16 and 17 Years | 38 (69.1%) | 24 (68.6%) |
| 18 to 24 Years | 32 (33.7%) | 60 (93.8%) |
| 25 to 34 Years | 57 (29.1%) | 79 (51.3%) |
| 35 to 44 Years | 51 (46.8%) | 30 (12.2%) |
| 45 to 54 Years | 71 (46.4%) | 82 (58.6%) |
| 55 to 64 Years | 19 (7.4%) | 80 (33.1%) |
| 65 to 74 Years | 37 (16.7%) | 28 (14.4%) |
| 75 Years and over | 22 (24.2%) | 7 (10.3%) |
| Total | 435 (32.3%) | 582 (39.9%) |
Income Above Poverty by Sex and Age in Skidway Lake
According to the poverty statistics in Skidway Lake, males aged 55 to 64 years and females aged 75 years and over are the age groups that are most secure financially, with 92.6% of males and 89.7% of females in these age groups living above the poverty line.
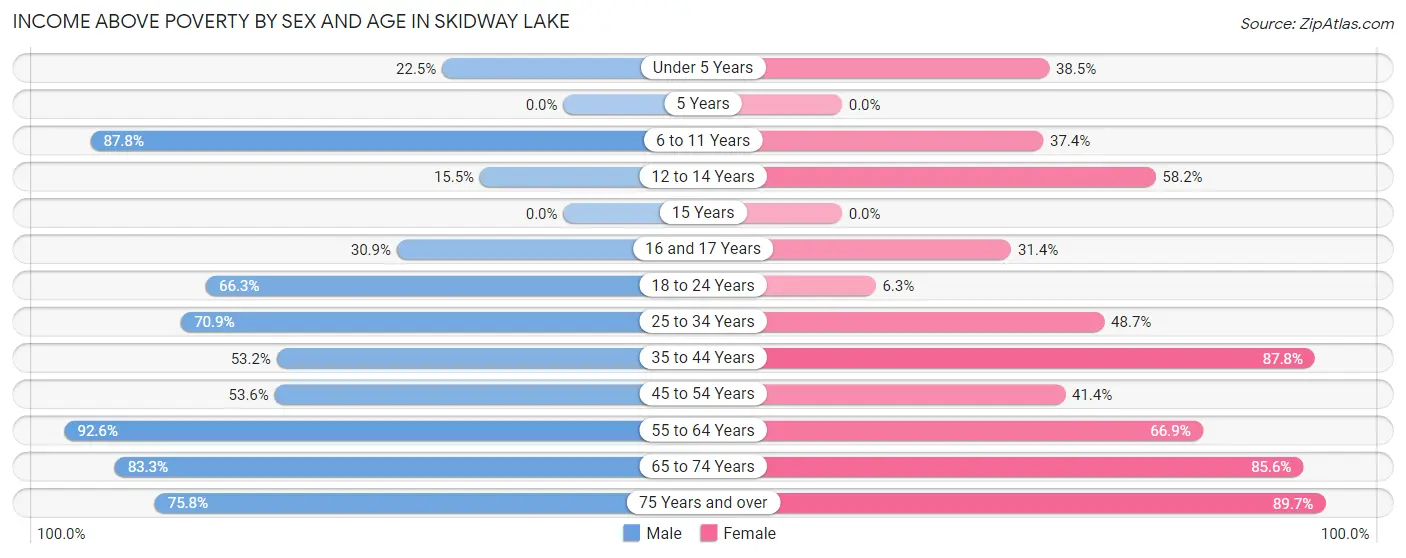
| Age Bracket | Male | Female |
| Under 5 Years | 9 (22.5%) | 50 (38.5%) |
| 5 Years | 0 (0.0%) | 0 (0.0%) |
| 6 to 11 Years | 43 (87.8%) | 34 (37.4%) |
| 12 to 14 Years | 13 (15.5%) | 39 (58.2%) |
| 15 Years | 0 (0.0%) | 0 (0.0%) |
| 16 and 17 Years | 17 (30.9%) | 11 (31.4%) |
| 18 to 24 Years | 63 (66.3%) | 4 (6.2%) |
| 25 to 34 Years | 139 (70.9%) | 75 (48.7%) |
| 35 to 44 Years | 58 (53.2%) | 216 (87.8%) |
| 45 to 54 Years | 82 (53.6%) | 58 (41.4%) |
| 55 to 64 Years | 237 (92.6%) | 162 (66.9%) |
| 65 to 74 Years | 184 (83.3%) | 167 (85.6%) |
| 75 Years and over | 69 (75.8%) | 61 (89.7%) |
| Total | 914 (67.7%) | 877 (60.1%) |
Income Below Poverty Among Married-Couple Families in Skidway Lake
The poverty statistics for married-couple families in Skidway Lake show that 10.3% or 38 of the total 370 families live below the poverty line. Families with 1 or 2 children have the highest poverty rate of 23.4%, comprising of 11 families. On the other hand, families with 3 or 4 children have the lowest poverty rate of 0.0%, which includes 0 families.
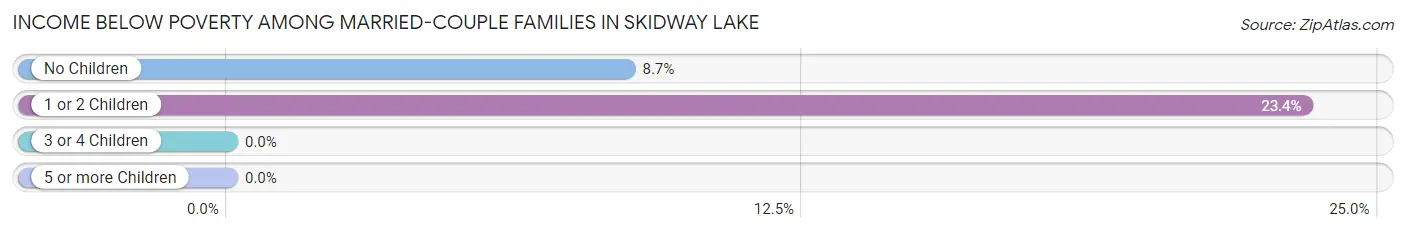
| Children | Above Poverty | Below Poverty |
| No Children | 285 (91.3%) | 27 (8.6%) |
| 1 or 2 Children | 36 (76.6%) | 11 (23.4%) |
| 3 or 4 Children | 11 (100.0%) | 0 (0.0%) |
| 5 or more Children | 0 (0.0%) | 0 (0.0%) |
| Total | 332 (89.7%) | 38 (10.3%) |
Income Below Poverty Among Single-Parent Households in Skidway Lake
According to the poverty data in Skidway Lake, 26.2% or 32 single-father households and 40.8% or 98 single-mother households are living below the poverty line. Among single-father households, those with 5 or more children have the highest poverty rate, with 32 households (100.0%) experiencing poverty. Likewise, among single-mother households, those with 3 or 4 children have the highest poverty rate, with 19 households (100.0%) falling below the poverty line.
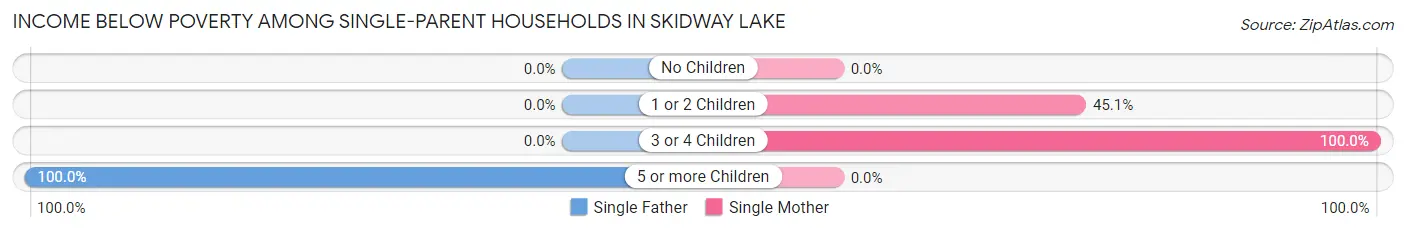
| Children | Single Father | Single Mother |
| No Children | 0 (0.0%) | 0 (0.0%) |
| 1 or 2 Children | 0 (0.0%) | 79 (45.1%) |
| 3 or 4 Children | 0 (0.0%) | 19 (100.0%) |
| 5 or more Children | 32 (100.0%) | 0 (0.0%) |
| Total | 32 (26.2%) | 98 (40.8%) |
Income Below Poverty Among Married-Couple vs Single-Parent Households in Skidway Lake
The poverty data for Skidway Lake shows that 38 of the married-couple family households (10.3%) and 130 of the single-parent households (35.9%) are living below the poverty level. Within the married-couple family households, those with 1 or 2 children have the highest poverty rate, with 11 households (23.4%) falling below the poverty line. Among the single-parent households, those with 3 or 4 children have the highest poverty rate, with 19 household (100.0%) living below poverty.
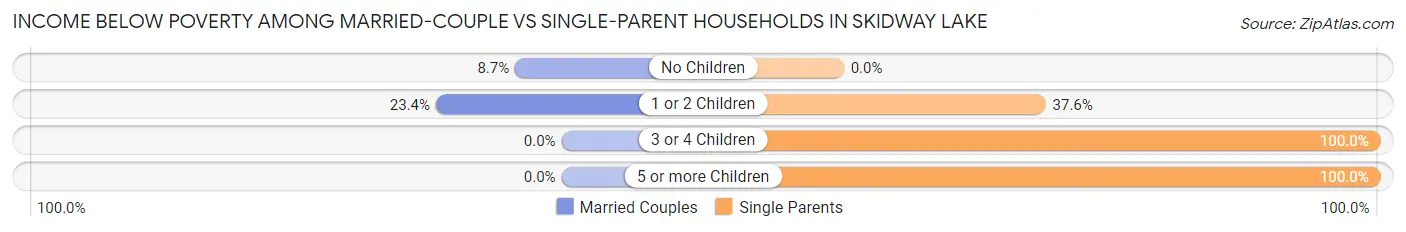
| Children | Married-Couple Families | Single-Parent Households |
| No Children | 27 (8.6%) | 0 (0.0%) |
| 1 or 2 Children | 11 (23.4%) | 79 (37.6%) |
| 3 or 4 Children | 0 (0.0%) | 19 (100.0%) |
| 5 or more Children | 0 (0.0%) | 32 (100.0%) |
| Total | 38 (10.3%) | 130 (35.9%) |
Race in Skidway Lake
The most populous races in Skidway Lake are White / Caucasian (2,730 | 94.8%), Two or more Races (119 | 4.1%), and Hispanic or Latino (73 | 2.5%).
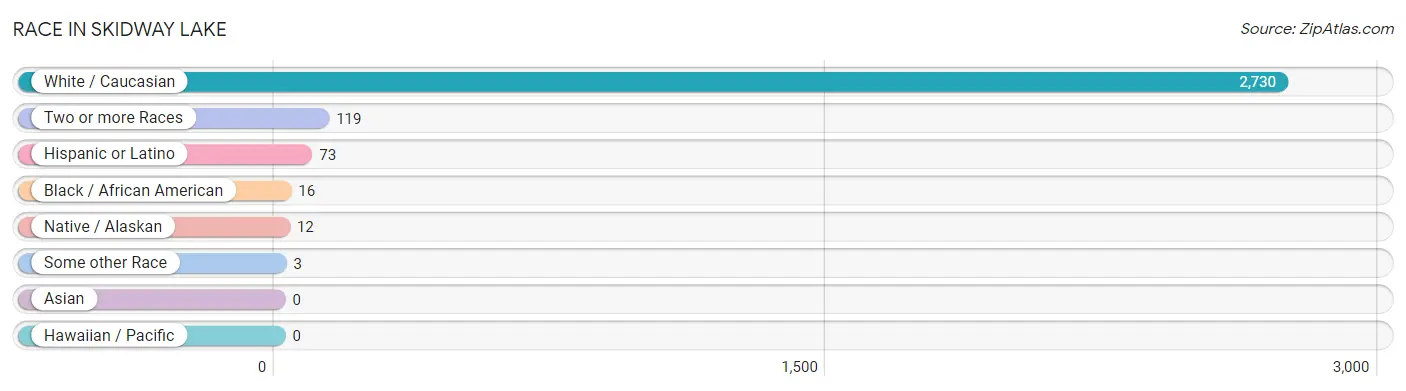
| Race | # Population | % Population |
| Asian | 0 | 0.0% |
| Black / African American | 16 | 0.6% |
| Hawaiian / Pacific | 0 | 0.0% |
| Hispanic or Latino | 73 | 2.5% |
| Native / Alaskan | 12 | 0.4% |
| White / Caucasian | 2,730 | 94.8% |
| Two or more Races | 119 | 4.1% |
| Some other Race | 3 | 0.1% |
| Total | 2,880 | 100.0% |
Ancestry in Skidway Lake
The most populous ancestries reported in Skidway Lake are German (929 | 32.3%), English (331 | 11.5%), Irish (330 | 11.5%), Polish (253 | 8.8%), and French (143 | 5.0%), together accounting for 69.0% of all Skidway Lake residents.
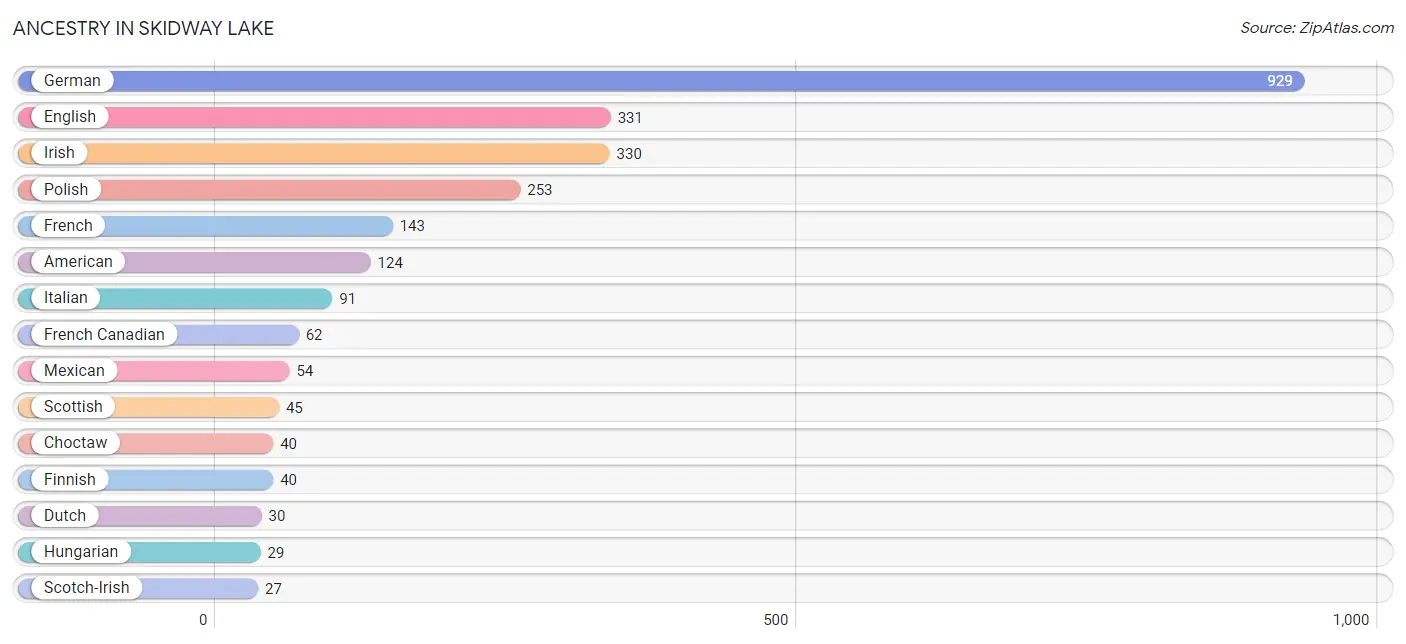
| Ancestry | # Population | % Population |
| American | 124 | 4.3% |
| Belgian | 7 | 0.2% |
| Canadian | 6 | 0.2% |
| Cherokee | 9 | 0.3% |
| Chippewa | 8 | 0.3% |
| Choctaw | 40 | 1.4% |
| Cuban | 19 | 0.7% |
| Dutch | 30 | 1.0% |
| English | 331 | 11.5% |
| Finnish | 40 | 1.4% |
| French | 143 | 5.0% |
| French Canadian | 62 | 2.1% |
| German | 929 | 32.3% |
| Greek | 24 | 0.8% |
| Hungarian | 29 | 1.0% |
| Irish | 330 | 11.5% |
| Italian | 91 | 3.2% |
| Maltese | 26 | 0.9% |
| Mexican | 54 | 1.9% |
| Ottawa | 8 | 0.3% |
| Pennsylvania German | 14 | 0.5% |
| Polish | 253 | 8.8% |
| Scotch-Irish | 27 | 0.9% |
| Scottish | 45 | 1.6% |
| Shoshone | 17 | 0.6% |
| Slavic | 11 | 0.4% | View All 26 Rows |
Immigrants in Skidway Lake

| Immigration Origin | # Population | % Population | View All 0 Rows |
Sex and Age in Skidway Lake
Sex and Age in Skidway Lake
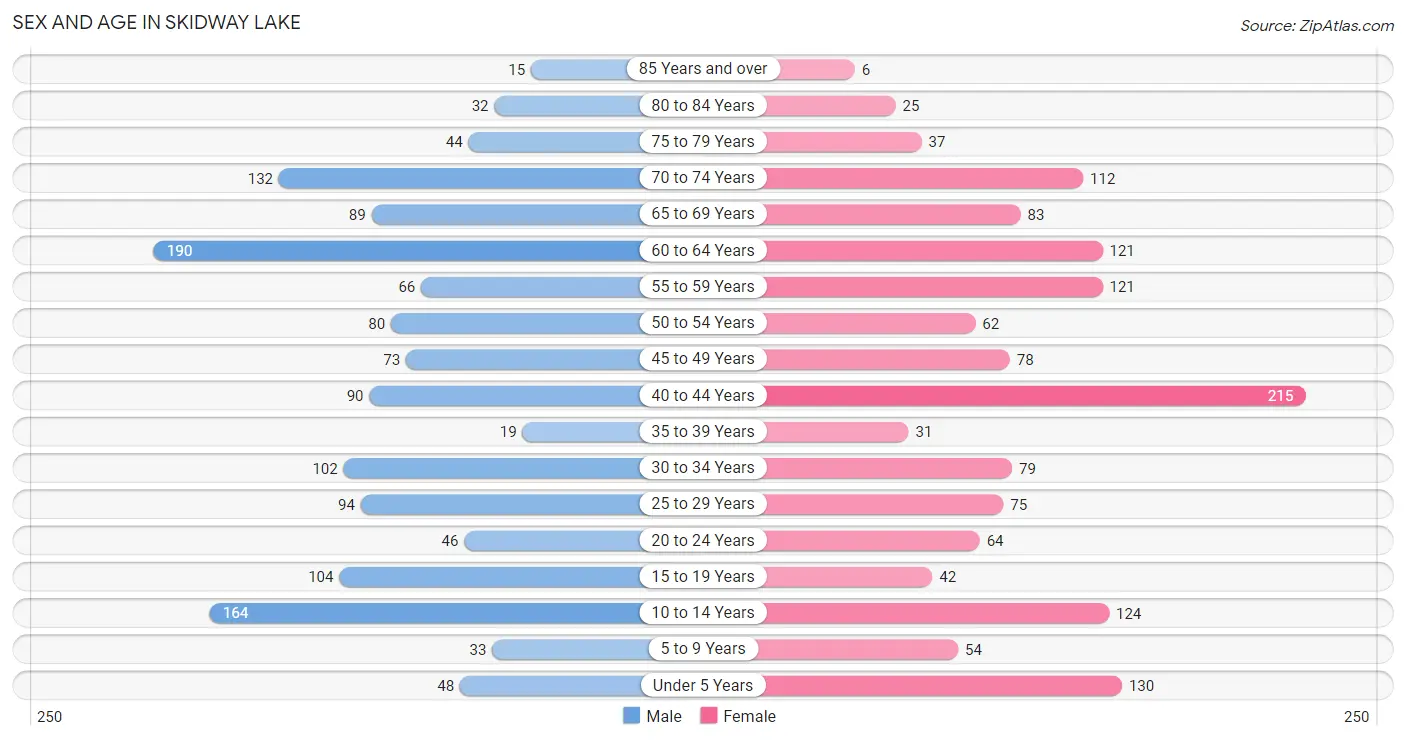
The most populous age groups in Skidway Lake are 60 to 64 Years (190 | 13.4%) for men and 40 to 44 Years (215 | 14.7%) for women.
| Age Bracket | Male | Female |
| Under 5 Years | 48 (3.4%) | 130 (8.9%) |
| 5 to 9 Years | 33 (2.3%) | 54 (3.7%) |
| 10 to 14 Years | 164 (11.5%) | 124 (8.5%) |
| 15 to 19 Years | 104 (7.3%) | 42 (2.9%) |
| 20 to 24 Years | 46 (3.2%) | 64 (4.4%) |
| 25 to 29 Years | 94 (6.6%) | 75 (5.1%) |
| 30 to 34 Years | 102 (7.2%) | 79 (5.4%) |
| 35 to 39 Years | 19 (1.3%) | 31 (2.1%) |
| 40 to 44 Years | 90 (6.3%) | 215 (14.7%) |
| 45 to 49 Years | 73 (5.1%) | 78 (5.3%) |
| 50 to 54 Years | 80 (5.6%) | 62 (4.3%) |
| 55 to 59 Years | 66 (4.6%) | 121 (8.3%) |
| 60 to 64 Years | 190 (13.4%) | 121 (8.3%) |
| 65 to 69 Years | 89 (6.3%) | 83 (5.7%) |
| 70 to 74 Years | 132 (9.3%) | 112 (7.7%) |
| 75 to 79 Years | 44 (3.1%) | 37 (2.5%) |
| 80 to 84 Years | 32 (2.2%) | 25 (1.7%) |
| 85 Years and over | 15 (1.1%) | 6 (0.4%) |
| Total | 1,421 (100.0%) | 1,459 (100.0%) |
Families and Households in Skidway Lake
Median Family Size in Skidway Lake
The median family size in Skidway Lake is 2.75 persons per family, with single male/father families (122 | 16.7%) accounting for the largest median family size of 3.5 persons per family. On the other hand, married-couple families (370 | 50.5%) represent the smallest median family size with 2.44 persons per family.
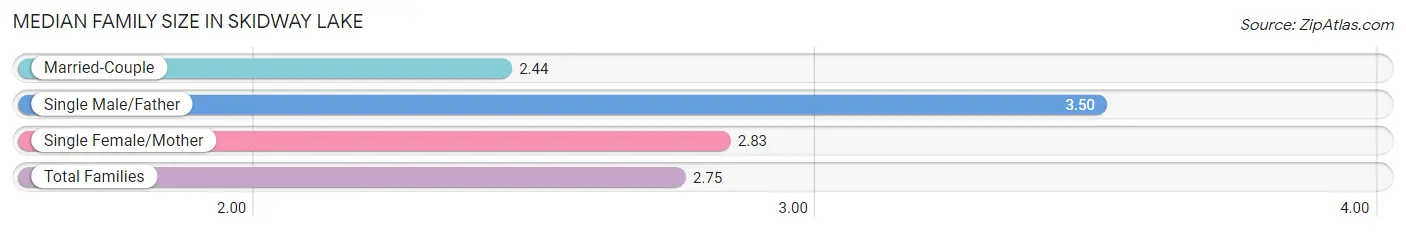
| Family Type | # Families | Family Size |
| Married-Couple | 370 (50.5%) | 2.44 |
| Single Male/Father | 122 (16.7%) | 3.50 |
| Single Female/Mother | 240 (32.8%) | 2.83 |
| Total Families | 732 (100.0%) | 2.75 |
Median Household Size in Skidway Lake
The median household size in Skidway Lake is 2.29 persons per household, with single male/father households (122 | 9.7%) accounting for the largest median household size of 3.93 persons per household. non-family households (523 | 41.7%) represent the smallest median household size with 1.37 persons per household.
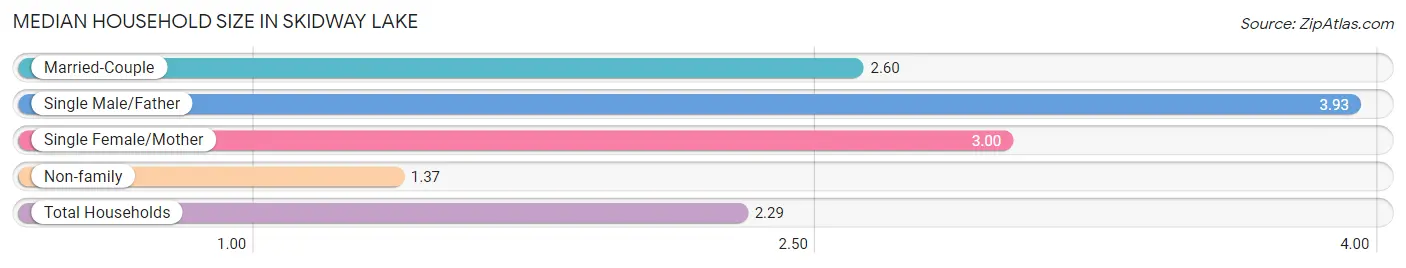
| Household Type | # Households | Household Size |
| Married-Couple | 370 (29.5%) | 2.60 |
| Single Male/Father | 122 (9.7%) | 3.93 |
| Single Female/Mother | 240 (19.1%) | 3.00 |
| Non-family | 523 (41.7%) | 1.37 |
| Total Households | 1,255 (100.0%) | 2.29 |
Household Size by Marriage Status in Skidway Lake
Out of a total of 1,255 households in Skidway Lake, 732 (58.3%) are family households, while 523 (41.7%) are nonfamily households. The most numerous type of family households are 2-person households, comprising 394, and the most common type of nonfamily households are 1-person households, comprising 381.
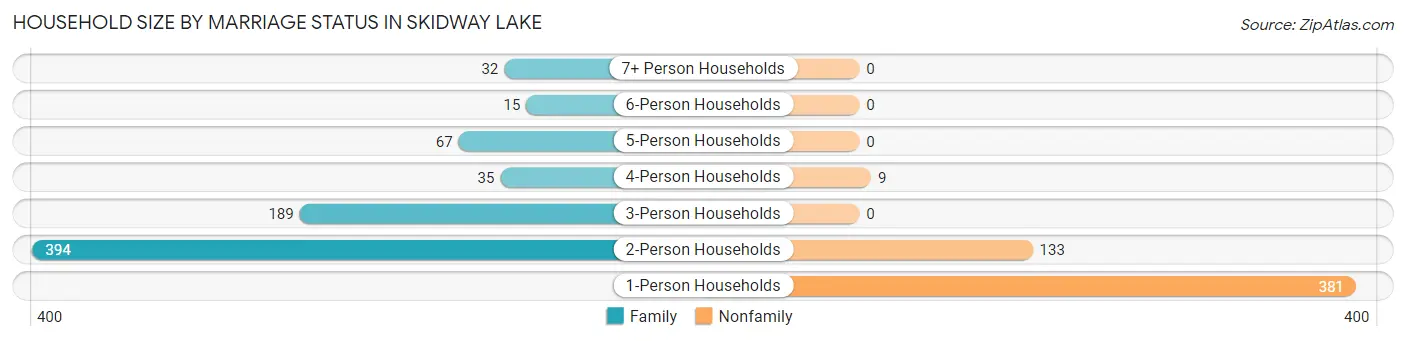
| Household Size | Family Households | Nonfamily Households |
| 1-Person Households | - | 381 (30.4%) |
| 2-Person Households | 394 (31.4%) | 133 (10.6%) |
| 3-Person Households | 189 (15.1%) | 0 (0.0%) |
| 4-Person Households | 35 (2.8%) | 9 (0.7%) |
| 5-Person Households | 67 (5.3%) | 0 (0.0%) |
| 6-Person Households | 15 (1.2%) | 0 (0.0%) |
| 7+ Person Households | 32 (2.5%) | 0 (0.0%) |
| Total | 732 (58.3%) | 523 (41.7%) |
Female Fertility in Skidway Lake
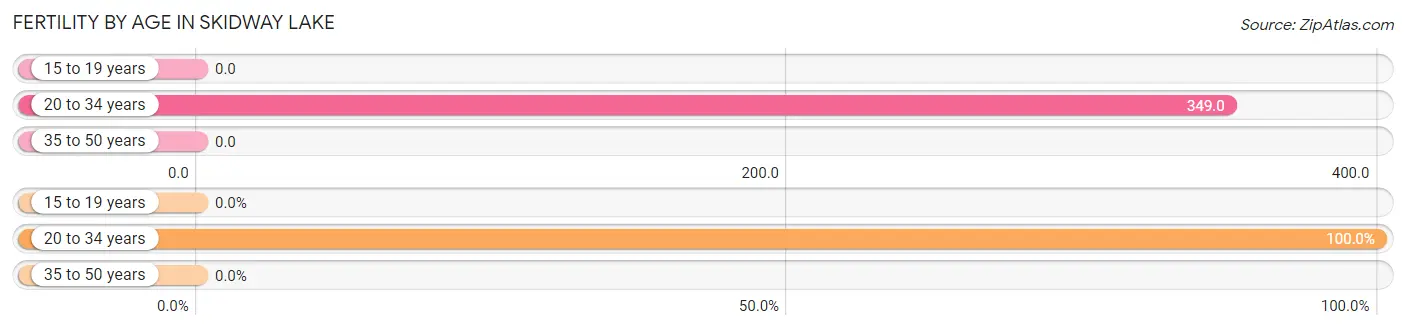
Fertility by Age in Skidway Lake
Average fertility rate in Skidway Lake is 130.0 births per 1,000 women. Women in the age bracket of 20 to 34 years have the highest fertility rate with 349.0 births per 1,000 women. Women in the age bracket of 20 to 34 years acount for 100.0% of all women with births.
| Age Bracket | Women with Births | Births / 1,000 Women |
| 15 to 19 years | 0 (0.0%) | 0.0 |
| 20 to 34 years | 76 (100.0%) | 349.0 |
| 35 to 50 years | 0 (0.0%) | 0.0 |
| Total | 76 (100.0%) | 130.0 |
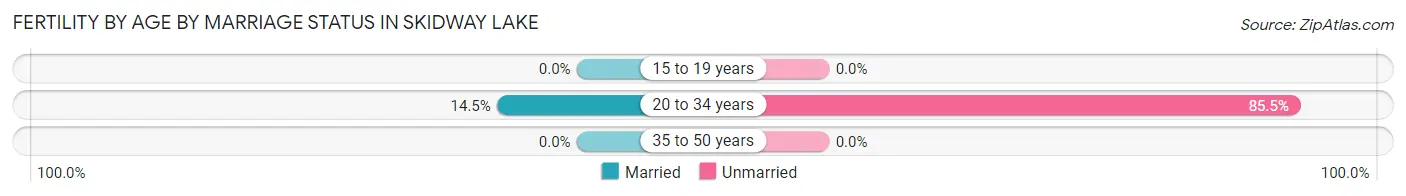
Fertility by Age by Marriage Status in Skidway Lake
14.5% of women with births (76) in Skidway Lake are married. The highest percentage of unmarried women with births falls into 20 to 34 years age bracket with 85.5% of them unmarried at the time of birth, while the lowest percentage of unmarried women with births belong to 20 to 34 years age bracket with 85.5% of them unmarried.
| Age Bracket | Married | Unmarried |
| 15 to 19 years | 0 (0.0%) | 0 (0.0%) |
| 20 to 34 years | 11 (14.5%) | 65 (85.5%) |
| 35 to 50 years | 0 (0.0%) | 0 (0.0%) |
| Total | 11 (14.5%) | 65 (85.5%) |
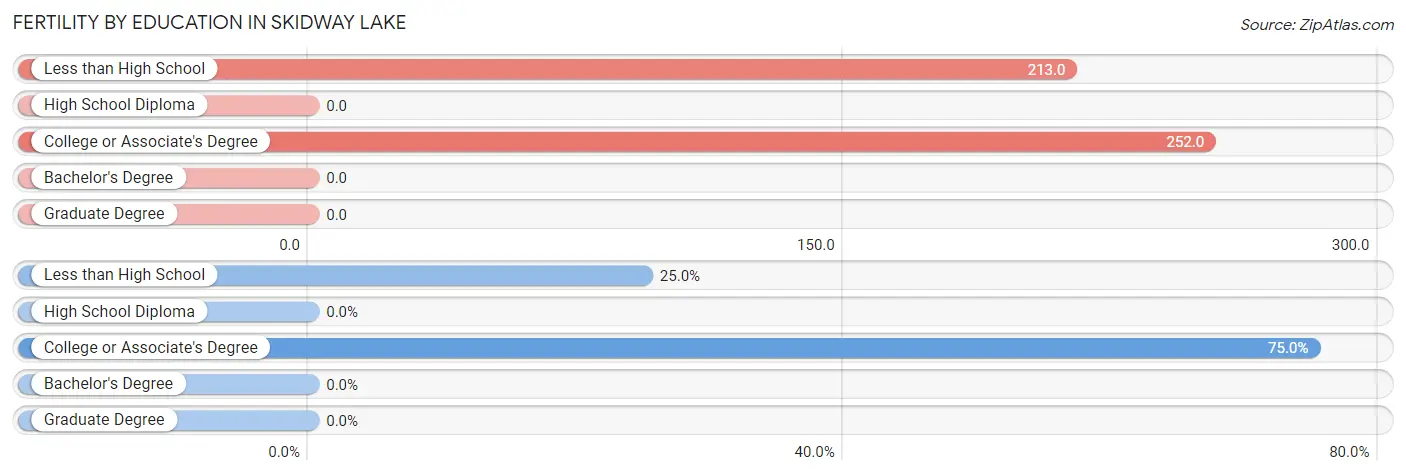
Fertility by Education in Skidway Lake
| Educational Attainment | Women with Births | Births / 1,000 Women |
| Less than High School | 19 (25.0%) | 213.0 |
| High School Diploma | 0 (0.0%) | 0.0 |
| College or Associate's Degree | 57 (75.0%) | 252.0 |
| Bachelor's Degree | 0 (0.0%) | 0.0 |
| Graduate Degree | 0 (0.0%) | 0.0 |
| Total | 76 (100.0%) | 130.0 |
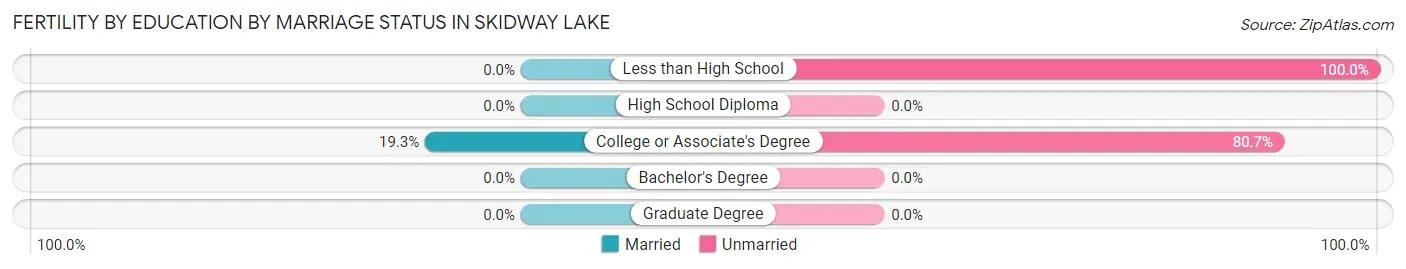
Fertility by Education by Marriage Status in Skidway Lake
85.5% of women with births in Skidway Lake are unmarried. Women with the educational attainment of college or associate's degree are most likely to be married with 19.3% of them married at childbirth, while women with the educational attainment of less than high school are least likely to be married with 100.0% of them unmarried at childbirth.
| Educational Attainment | Married | Unmarried |
| Less than High School | 0 (0.0%) | 19 (100.0%) |
| High School Diploma | 0 (0.0%) | 0 (0.0%) |
| College or Associate's Degree | 11 (19.3%) | 46 (80.7%) |
| Bachelor's Degree | 0 (0.0%) | 0 (0.0%) |
| Graduate Degree | 0 (0.0%) | 0 (0.0%) |
| Total | 11 (14.5%) | 65 (85.5%) |
Employment Characteristics in Skidway Lake
Employment by Class of Employer in Skidway Lake
Among the 738 employed individuals in Skidway Lake, private company employees (483 | 65.4%), not-for-profit organizations (97 | 13.1%), and self-employed (not incorporated) (63 | 8.5%) make up the most common classes of employment.
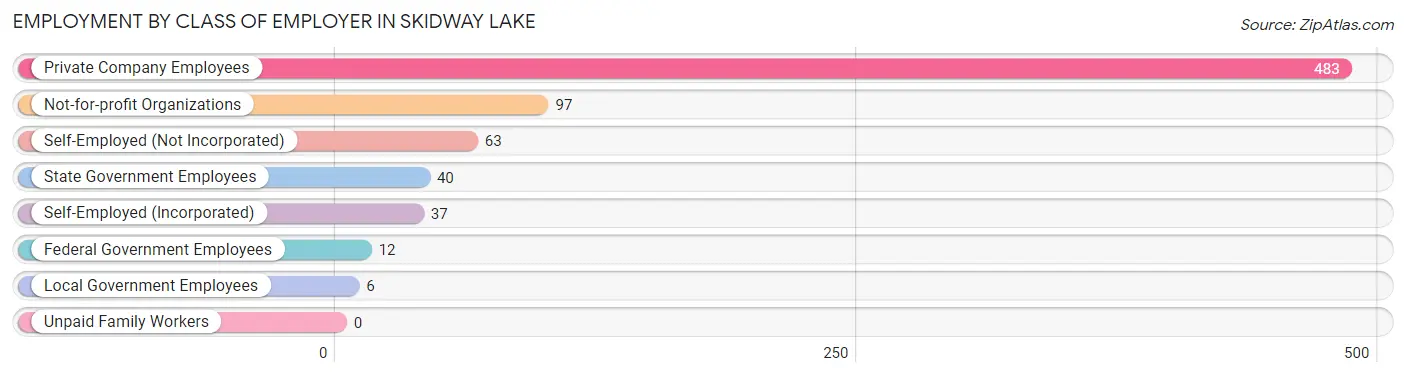
| Employer Class | # Employees | % Employees |
| Private Company Employees | 483 | 65.4% |
| Self-Employed (Incorporated) | 37 | 5.0% |
| Self-Employed (Not Incorporated) | 63 | 8.5% |
| Not-for-profit Organizations | 97 | 13.1% |
| Local Government Employees | 6 | 0.8% |
| State Government Employees | 40 | 5.4% |
| Federal Government Employees | 12 | 1.6% |
| Unpaid Family Workers | 0 | 0.0% |
| Total | 738 | 100.0% |
Employment Status by Age in Skidway Lake
According to the labor force statistics for Skidway Lake, out of the total population over 16 years of age (2,320), 38.7% or 898 individuals are in the labor force, with 15.1% or 136 of them unemployed. The age group with the highest labor force participation rate is 25 to 29 years, with 91.7% or 155 individuals in the labor force. Within the labor force, the 45 to 54 years age range has the highest percentage of unemployed individuals, with 74.5% or 79 of them being unemployed.
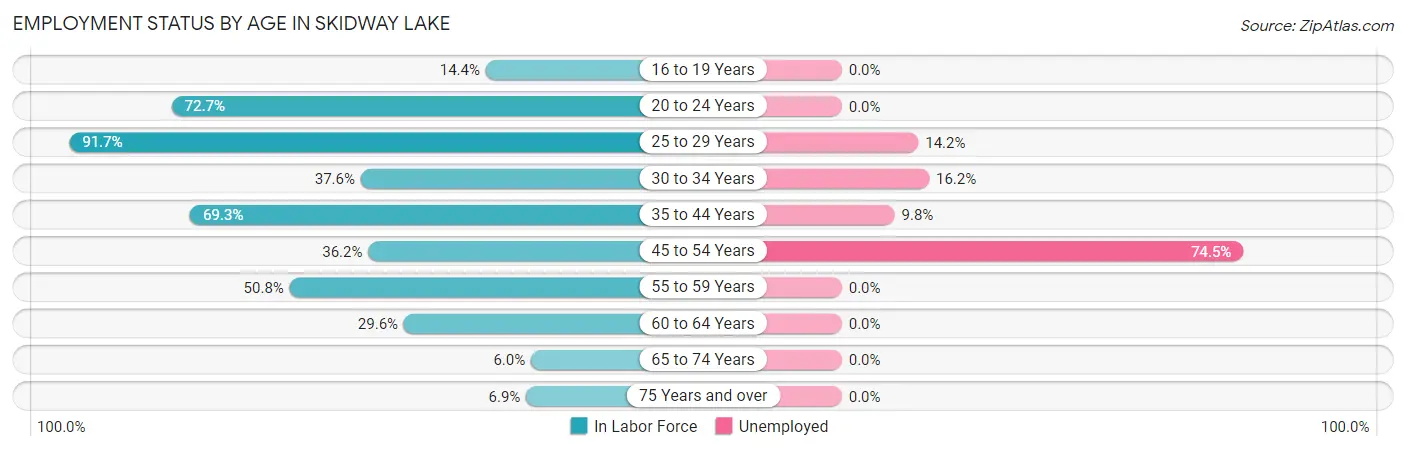
| Age Bracket | In Labor Force | Unemployed |
| 16 to 19 Years | 20 (14.4%) | 0 (0.0%) |
| 20 to 24 Years | 80 (72.7%) | 0 (0.0%) |
| 25 to 29 Years | 155 (91.7%) | 22 (14.2%) |
| 30 to 34 Years | 68 (37.6%) | 11 (16.2%) |
| 35 to 44 Years | 246 (69.3%) | 24 (9.8%) |
| 45 to 54 Years | 106 (36.2%) | 79 (74.5%) |
| 55 to 59 Years | 95 (50.8%) | 0 (0.0%) |
| 60 to 64 Years | 92 (29.6%) | 0 (0.0%) |
| 65 to 74 Years | 25 (6.0%) | 0 (0.0%) |
| 75 Years and over | 11 (6.9%) | 0 (0.0%) |
| Total | 898 (38.7%) | 136 (15.1%) |
Employment Status by Educational Attainment in Skidway Lake
According to labor force statistics for Skidway Lake, 50.9% of individuals (761) out of the total population between 25 and 64 years of age (1,496) are in the labor force, with 17.8% or 135 of them being unemployed. The group with the highest labor force participation rate are those with the educational attainment of bachelor's degree or higher, with 79.3% or 65 individuals in the labor force. Within the labor force, individuals with bachelor's degree or higher education have the highest percentage of unemployment, with 36.9% or 24 of them being unemployed.
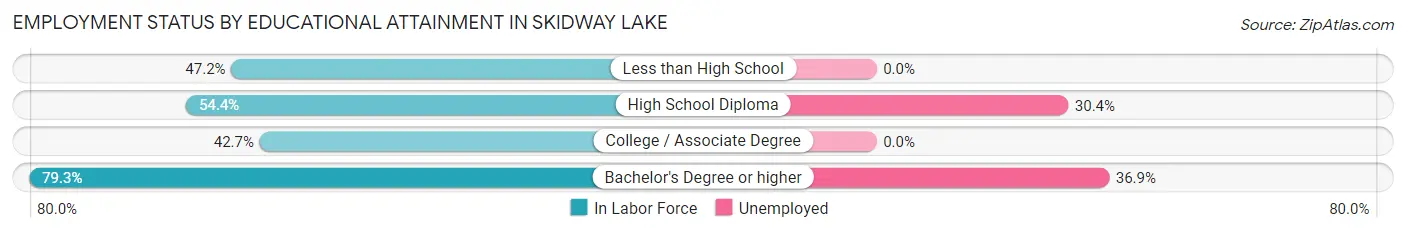
| Educational Attainment | In Labor Force | Unemployed |
| Less than High School | 144 (47.2%) | 0 (0.0%) |
| High School Diploma | 368 (54.4%) | 206 (30.4%) |
| College / Associate Degree | 185 (42.7%) | 0 (0.0%) |
| Bachelor's Degree or higher | 65 (79.3%) | 30 (36.9%) |
| Total | 761 (50.9%) | 266 (17.8%) |
Employment Occupations by Sex in Skidway Lake
Management, Business, Science and Arts Occupations
The most common Management, Business, Science and Arts occupations in Skidway Lake are Management (52 | 6.8%), Community & Social Service (22 | 2.9%), Education Instruction & Library (15 | 2.0%), Health Diagnosing & Treating (14 | 1.8%), and Arts, Media & Entertainment (7 | 0.9%).
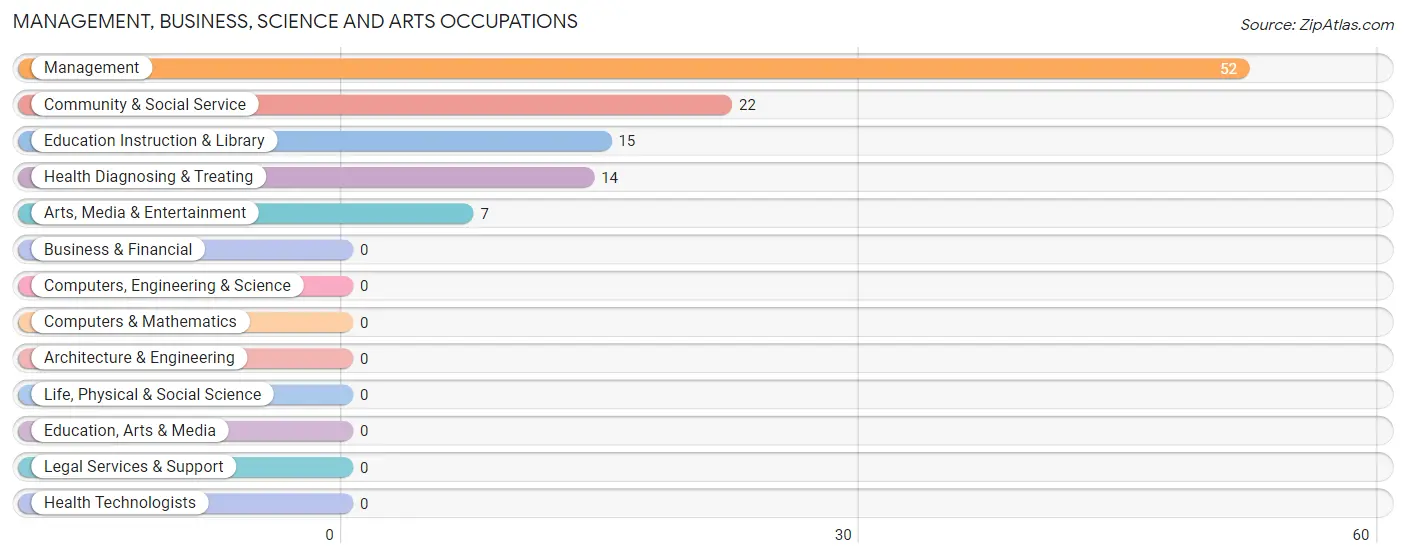
Management, Business, Science and Arts Occupations by Sex
Within the Management, Business, Science and Arts occupations in Skidway Lake, the most male-oriented occupations are Education Instruction & Library (100.0%), Management (71.2%), and Community & Social Service (68.2%), while the most female-oriented occupations are Arts, Media & Entertainment (100.0%), Health Diagnosing & Treating (100.0%), and Community & Social Service (31.8%).
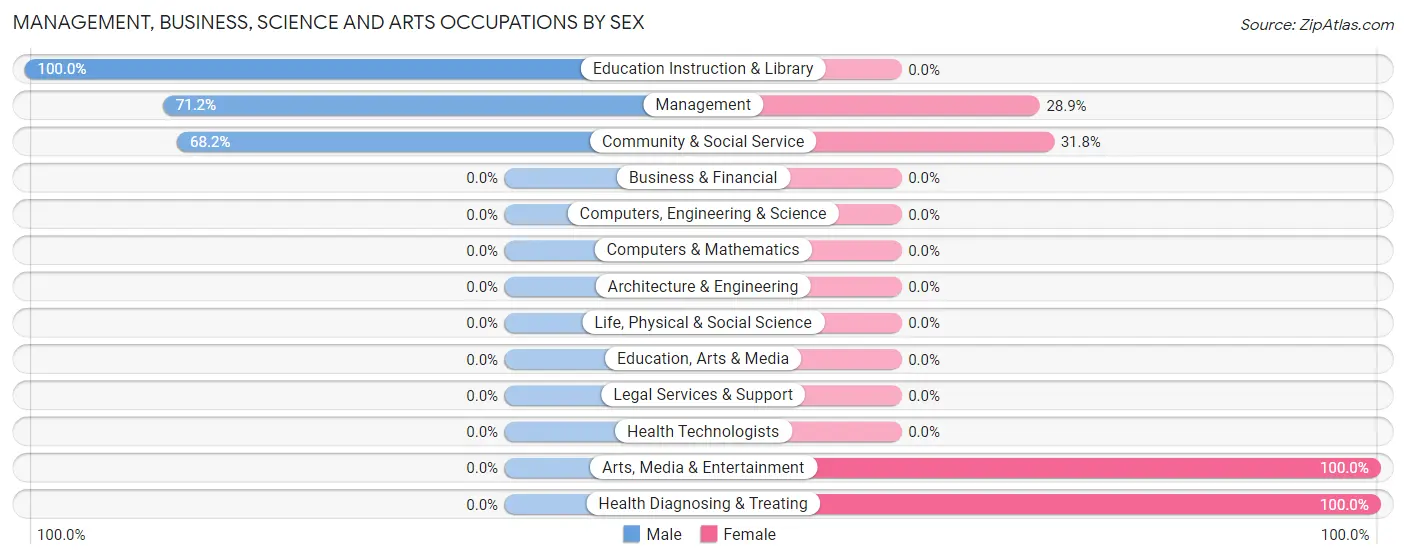
| Occupation | Male | Female |
| Management | 37 (71.2%) | 15 (28.8%) |
| Business & Financial | 0 (0.0%) | 0 (0.0%) |
| Computers, Engineering & Science | 0 (0.0%) | 0 (0.0%) |
| Computers & Mathematics | 0 (0.0%) | 0 (0.0%) |
| Architecture & Engineering | 0 (0.0%) | 0 (0.0%) |
| Life, Physical & Social Science | 0 (0.0%) | 0 (0.0%) |
| Community & Social Service | 15 (68.2%) | 7 (31.8%) |
| Education, Arts & Media | 0 (0.0%) | 0 (0.0%) |
| Legal Services & Support | 0 (0.0%) | 0 (0.0%) |
| Education Instruction & Library | 15 (100.0%) | 0 (0.0%) |
| Arts, Media & Entertainment | 0 (0.0%) | 7 (100.0%) |
| Health Diagnosing & Treating | 0 (0.0%) | 14 (100.0%) |
| Health Technologists | 0 (0.0%) | 0 (0.0%) |
| Total (Category) | 52 (59.1%) | 36 (40.9%) |
| Total (Overall) | 334 (43.8%) | 428 (56.2%) |
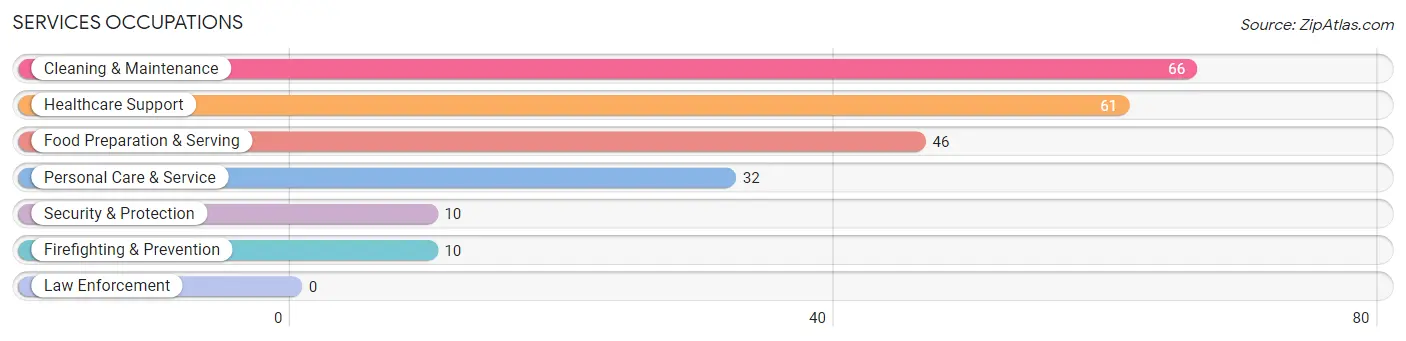
Services Occupations
The most common Services occupations in Skidway Lake are Cleaning & Maintenance (66 | 8.7%), Healthcare Support (61 | 8.0%), Food Preparation & Serving (46 | 6.0%), Personal Care & Service (32 | 4.2%), and Security & Protection (10 | 1.3%).
Services Occupations by Sex
Within the Services occupations in Skidway Lake, the most male-oriented occupations are Security & Protection (100.0%), Firefighting & Prevention (100.0%), and Food Preparation & Serving (58.7%), while the most female-oriented occupations are Personal Care & Service (100.0%), Healthcare Support (82.0%), and Cleaning & Maintenance (56.1%).
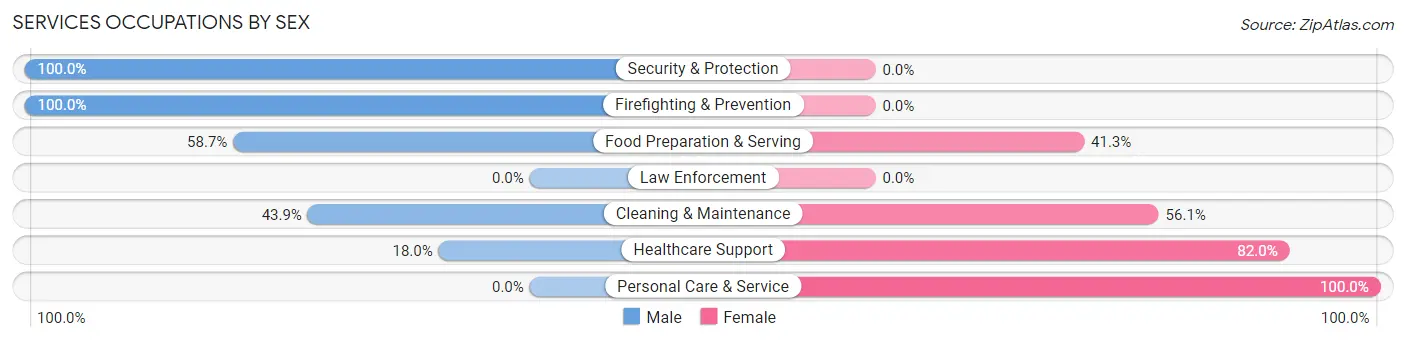
| Occupation | Male | Female |
| Healthcare Support | 11 (18.0%) | 50 (82.0%) |
| Security & Protection | 10 (100.0%) | 0 (0.0%) |
| Firefighting & Prevention | 10 (100.0%) | 0 (0.0%) |
| Law Enforcement | 0 (0.0%) | 0 (0.0%) |
| Food Preparation & Serving | 27 (58.7%) | 19 (41.3%) |
| Cleaning & Maintenance | 29 (43.9%) | 37 (56.1%) |
| Personal Care & Service | 0 (0.0%) | 32 (100.0%) |
| Total (Category) | 77 (35.8%) | 138 (64.2%) |
| Total (Overall) | 334 (43.8%) | 428 (56.2%) |
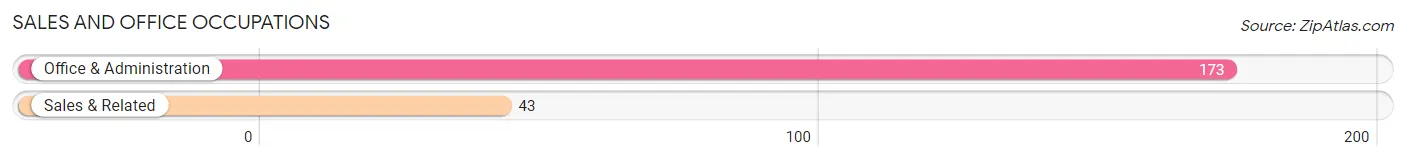
Sales and Office Occupations
The most common Sales and Office occupations in Skidway Lake are Office & Administration (173 | 22.7%), and Sales & Related (43 | 5.6%).
Sales and Office Occupations by Sex
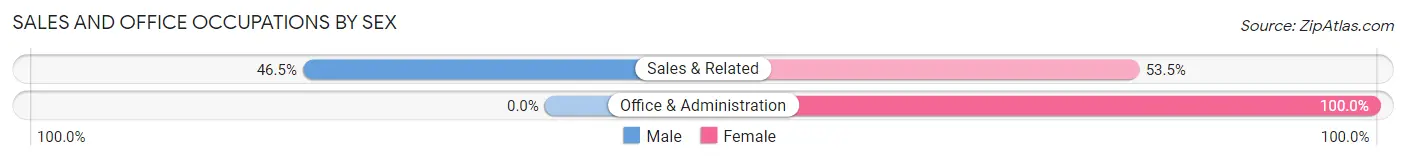
| Occupation | Male | Female |
| Sales & Related | 20 (46.5%) | 23 (53.5%) |
| Office & Administration | 0 (0.0%) | 173 (100.0%) |
| Total (Category) | 20 (9.3%) | 196 (90.7%) |
| Total (Overall) | 334 (43.8%) | 428 (56.2%) |
Natural Resources, Construction and Maintenance Occupations
The most common Natural Resources, Construction and Maintenance occupations in Skidway Lake are Installation, Maintenance & Repair (54 | 7.1%), and Construction & Extraction (13 | 1.7%).
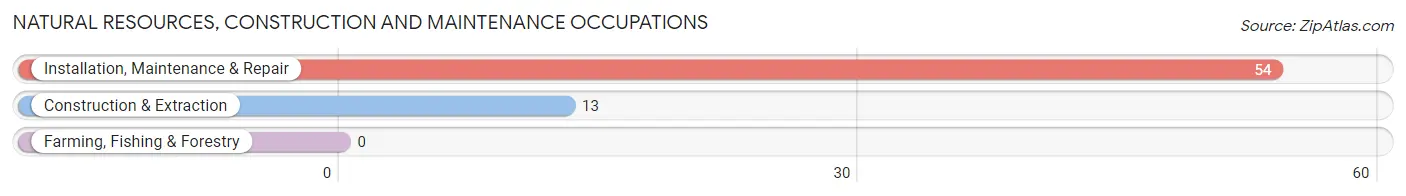
Natural Resources, Construction and Maintenance Occupations by Sex
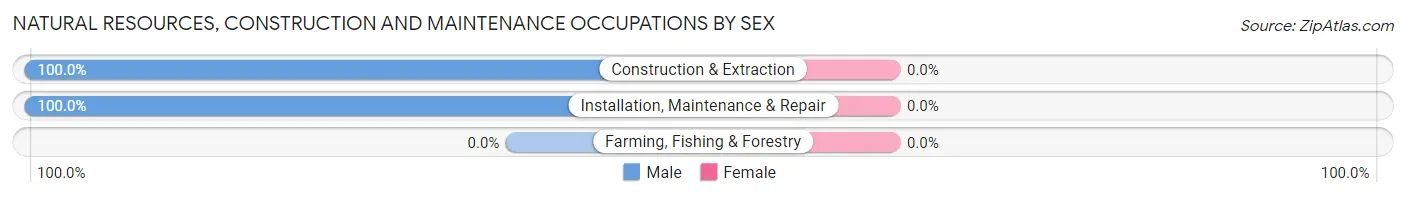
| Occupation | Male | Female |
| Farming, Fishing & Forestry | 0 (0.0%) | 0 (0.0%) |
| Construction & Extraction | 13 (100.0%) | 0 (0.0%) |
| Installation, Maintenance & Repair | 54 (100.0%) | 0 (0.0%) |
| Total (Category) | 67 (100.0%) | 0 (0.0%) |
| Total (Overall) | 334 (43.8%) | 428 (56.2%) |
Production, Transportation and Moving Occupations
The most common Production, Transportation and Moving occupations in Skidway Lake are Production (73 | 9.6%), Material Moving (69 | 9.1%), and Transportation (34 | 4.5%).
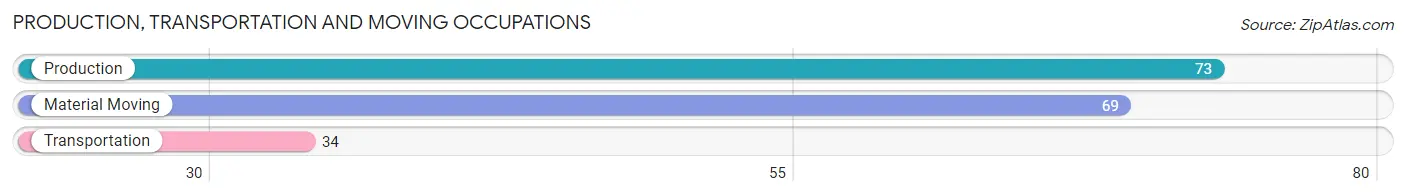
Production, Transportation and Moving Occupations by Sex
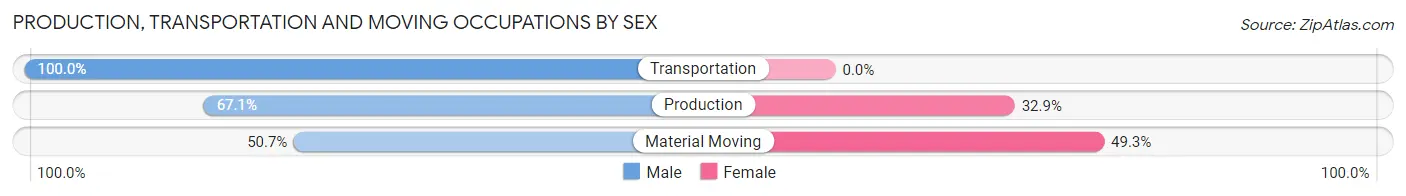
| Occupation | Male | Female |
| Production | 49 (67.1%) | 24 (32.9%) |
| Transportation | 34 (100.0%) | 0 (0.0%) |
| Material Moving | 35 (50.7%) | 34 (49.3%) |
| Total (Category) | 118 (67.0%) | 58 (33.0%) |
| Total (Overall) | 334 (43.8%) | 428 (56.2%) |
Employment Industries by Sex in Skidway Lake
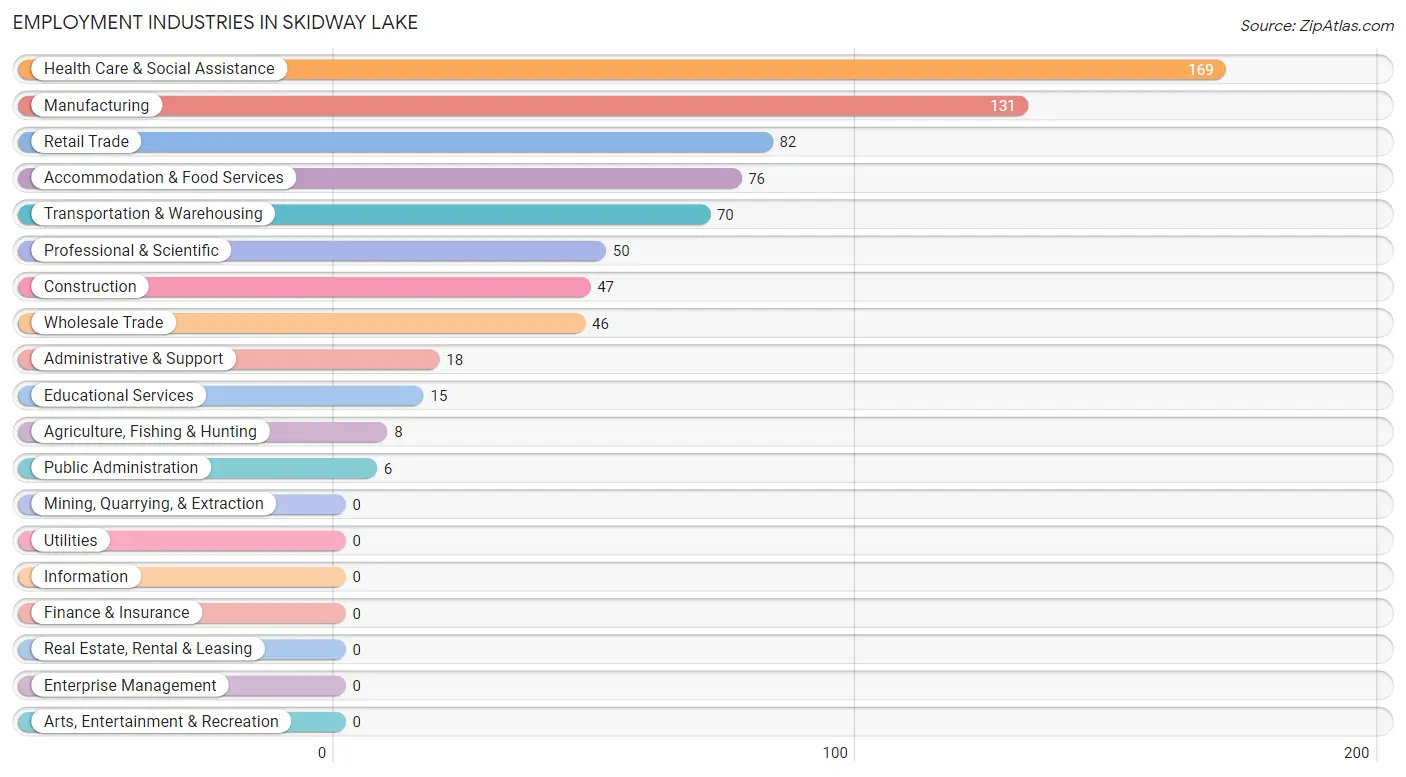
Employment Industries in Skidway Lake
The major employment industries in Skidway Lake include Health Care & Social Assistance (169 | 22.2%), Manufacturing (131 | 17.2%), Retail Trade (82 | 10.8%), Accommodation & Food Services (76 | 10.0%), and Transportation & Warehousing (70 | 9.2%).
Employment Industries by Sex in Skidway Lake
The Skidway Lake industries that see more men than women are Agriculture, Fishing & Hunting (100.0%), Wholesale Trade (100.0%), and Administrative & Support (100.0%), whereas the industries that tend to have a higher number of women are Public Administration (100.0%), Health Care & Social Assistance (93.5%), and Manufacturing (64.9%).
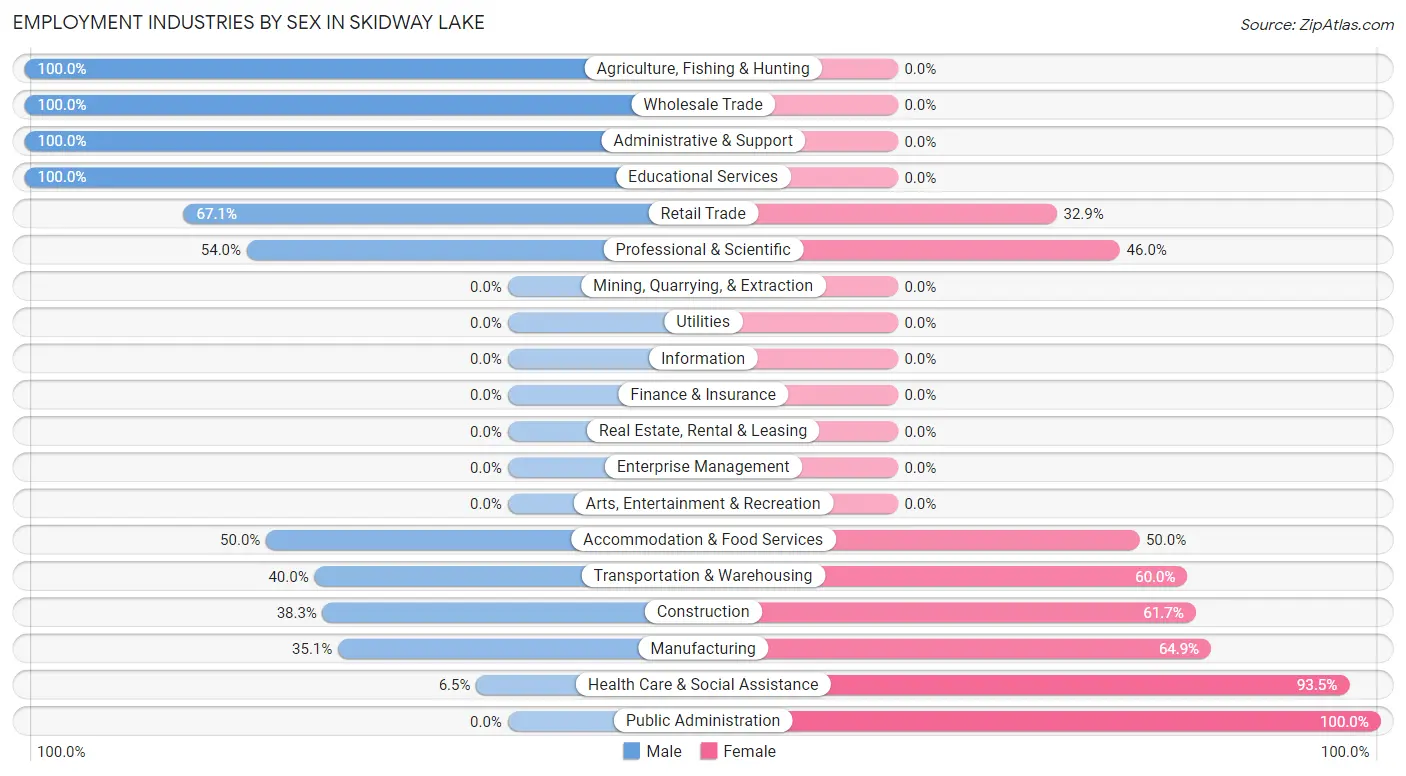
| Industry | Male | Female |
| Agriculture, Fishing & Hunting | 8 (100.0%) | 0 (0.0%) |
| Mining, Quarrying, & Extraction | 0 (0.0%) | 0 (0.0%) |
| Construction | 18 (38.3%) | 29 (61.7%) |
| Manufacturing | 46 (35.1%) | 85 (64.9%) |
| Wholesale Trade | 46 (100.0%) | 0 (0.0%) |
| Retail Trade | 55 (67.1%) | 27 (32.9%) |
| Transportation & Warehousing | 28 (40.0%) | 42 (60.0%) |
| Utilities | 0 (0.0%) | 0 (0.0%) |
| Information | 0 (0.0%) | 0 (0.0%) |
| Finance & Insurance | 0 (0.0%) | 0 (0.0%) |
| Real Estate, Rental & Leasing | 0 (0.0%) | 0 (0.0%) |
| Professional & Scientific | 27 (54.0%) | 23 (46.0%) |
| Enterprise Management | 0 (0.0%) | 0 (0.0%) |
| Administrative & Support | 18 (100.0%) | 0 (0.0%) |
| Educational Services | 15 (100.0%) | 0 (0.0%) |
| Health Care & Social Assistance | 11 (6.5%) | 158 (93.5%) |
| Arts, Entertainment & Recreation | 0 (0.0%) | 0 (0.0%) |
| Accommodation & Food Services | 38 (50.0%) | 38 (50.0%) |
| Public Administration | 0 (0.0%) | 6 (100.0%) |
| Total | 334 (43.8%) | 428 (56.2%) |
Education in Skidway Lake
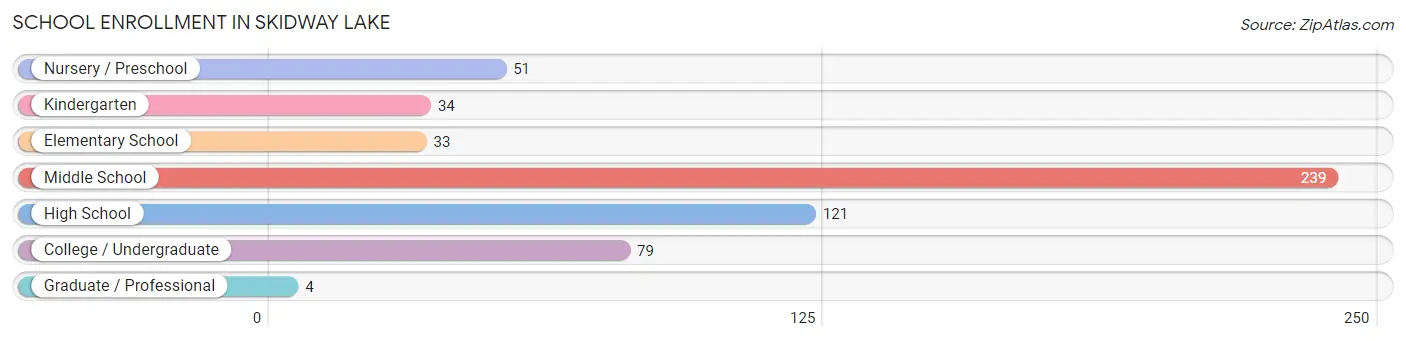
School Enrollment in Skidway Lake
The most common levels of schooling among the 561 students in Skidway Lake are middle school (239 | 42.6%), high school (121 | 21.6%), and college / undergraduate (79 | 14.1%).
| School Level | # Students | % Students |
| Nursery / Preschool | 51 | 9.1% |
| Kindergarten | 34 | 6.1% |
| Elementary School | 33 | 5.9% |
| Middle School | 239 | 42.6% |
| High School | 121 | 21.6% |
| College / Undergraduate | 79 | 14.1% |
| Graduate / Professional | 4 | 0.7% |
| Total | 561 | 100.0% |
School Enrollment by Age by Funding Source in Skidway Lake
Out of a total of 561 students who are enrolled in schools in Skidway Lake, 45 (8.0%) attend a private institution, while the remaining 516 (92.0%) are enrolled in public schools. The age group of 15 to 17 year olds has the highest likelihood of being enrolled in private schools, with 24 (36.4% in the age bracket) enrolled. Conversely, the age group of 3 to 4 year olds has the lowest likelihood of being enrolled in a private school, with 31 (100.0% in the age bracket) attending a public institution.
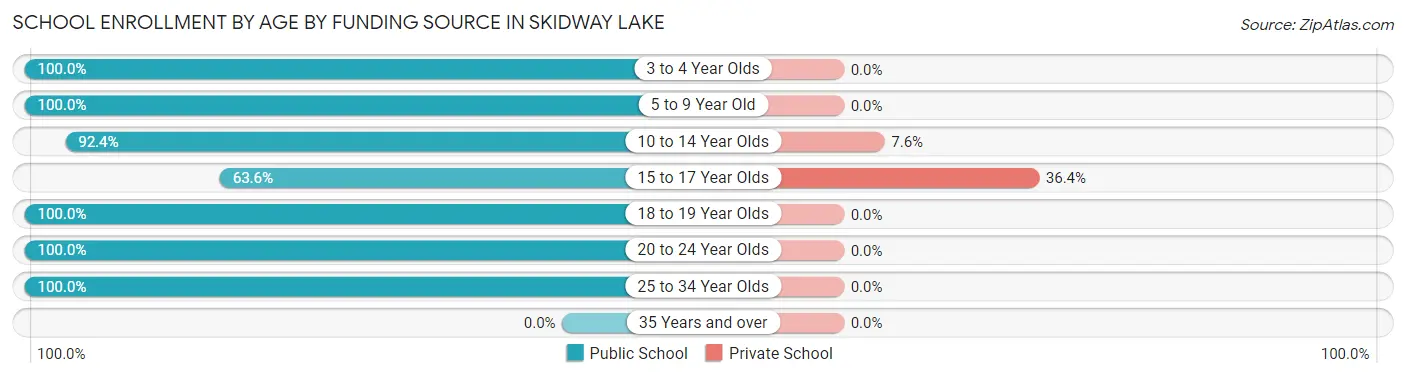
| Age Bracket | Public School | Private School |
| 3 to 4 Year Olds | 31 (100.0%) | 0 (0.0%) |
| 5 to 9 Year Old | 87 (100.0%) | 0 (0.0%) |
| 10 to 14 Year Olds | 256 (92.4%) | 21 (7.6%) |
| 15 to 17 Year Olds | 42 (63.6%) | 24 (36.4%) |
| 18 to 19 Year Olds | 17 (100.0%) | 0 (0.0%) |
| 20 to 24 Year Olds | 34 (100.0%) | 0 (0.0%) |
| 25 to 34 Year Olds | 49 (100.0%) | 0 (0.0%) |
| 35 Years and over | 0 (0.0%) | 0 (0.0%) |
| Total | 516 (92.0%) | 45 (8.0%) |
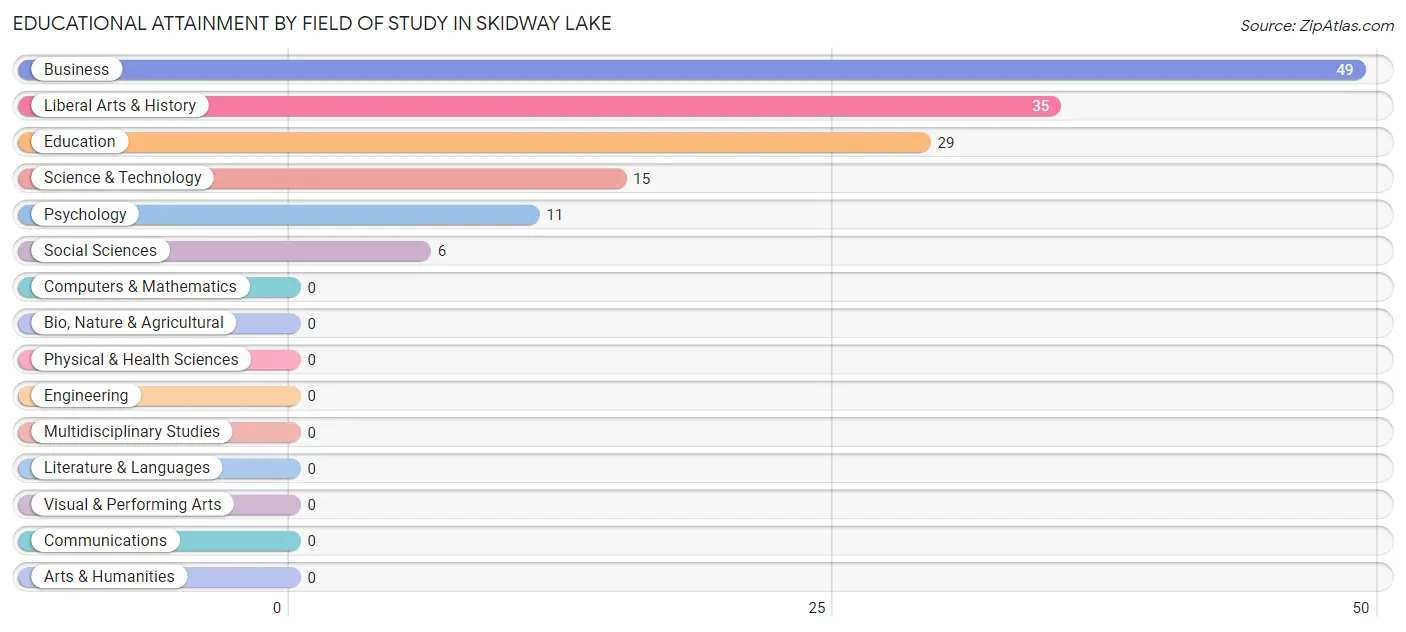
Educational Attainment by Field of Study in Skidway Lake
Business (49 | 33.8%), liberal arts & history (35 | 24.1%), education (29 | 20.0%), science & technology (15 | 10.3%), and psychology (11 | 7.6%) are the most common fields of study among 145 individuals in Skidway Lake who have obtained a bachelor's degree or higher.
| Field of Study | # Graduates | % Graduates |
| Computers & Mathematics | 0 | 0.0% |
| Bio, Nature & Agricultural | 0 | 0.0% |
| Physical & Health Sciences | 0 | 0.0% |
| Psychology | 11 | 7.6% |
| Social Sciences | 6 | 4.1% |
| Engineering | 0 | 0.0% |
| Multidisciplinary Studies | 0 | 0.0% |
| Science & Technology | 15 | 10.3% |
| Business | 49 | 33.8% |
| Education | 29 | 20.0% |
| Literature & Languages | 0 | 0.0% |
| Liberal Arts & History | 35 | 24.1% |
| Visual & Performing Arts | 0 | 0.0% |
| Communications | 0 | 0.0% |
| Arts & Humanities | 0 | 0.0% |
| Total | 145 | 100.0% |
Transportation & Commute in Skidway Lake
Vehicle Availability by Sex in Skidway Lake
The most prevalent vehicle ownership categories in Skidway Lake are males with 2 vehicles (138, accounting for 42.7%) and females with 2 vehicles (112, making up 33.3%).
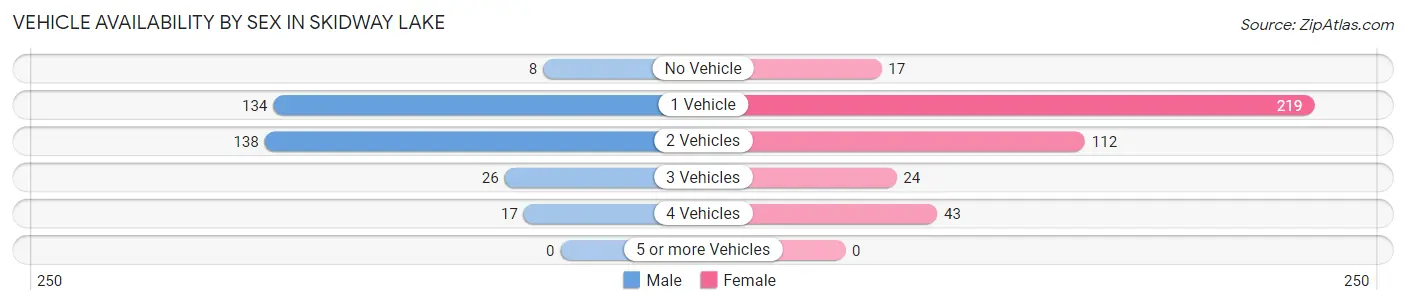
| Vehicles Available | Male | Female |
| No Vehicle | 8 (2.5%) | 17 (4.1%) |
| 1 Vehicle | 134 (41.5%) | 219 (52.8%) |
| 2 Vehicles | 138 (42.7%) | 112 (27.0%) |
| 3 Vehicles | 26 (8.1%) | 24 (5.8%) |
| 4 Vehicles | 17 (5.3%) | 43 (10.4%) |
| 5 or more Vehicles | 0 (0.0%) | 0 (0.0%) |
| Total | 323 (100.0%) | 415 (100.0%) |
Commute Time in Skidway Lake
The most frequently occuring commute durations in Skidway Lake are 20 to 24 minutes (169 commuters, 24.3%), 10 to 14 minutes (107 commuters, 15.4%), and 60 to 89 minutes (91 commuters, 13.1%).
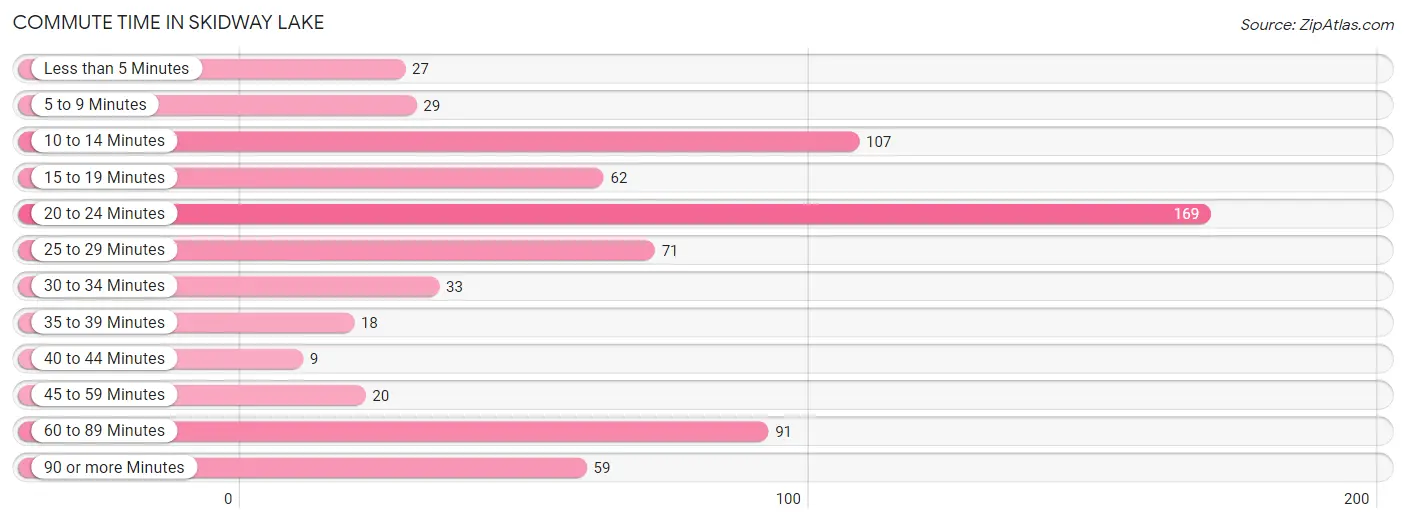
| Commute Time | # Commuters | % Commuters |
| Less than 5 Minutes | 27 | 3.9% |
| 5 to 9 Minutes | 29 | 4.2% |
| 10 to 14 Minutes | 107 | 15.4% |
| 15 to 19 Minutes | 62 | 8.9% |
| 20 to 24 Minutes | 169 | 24.3% |
| 25 to 29 Minutes | 71 | 10.2% |
| 30 to 34 Minutes | 33 | 4.8% |
| 35 to 39 Minutes | 18 | 2.6% |
| 40 to 44 Minutes | 9 | 1.3% |
| 45 to 59 Minutes | 20 | 2.9% |
| 60 to 89 Minutes | 91 | 13.1% |
| 90 or more Minutes | 59 | 8.5% |
Commute Time by Sex in Skidway Lake
The most common commute times in Skidway Lake are 10 to 14 minutes (87 commuters, 27.9%) for males and 20 to 24 minutes (121 commuters, 31.6%) for females.
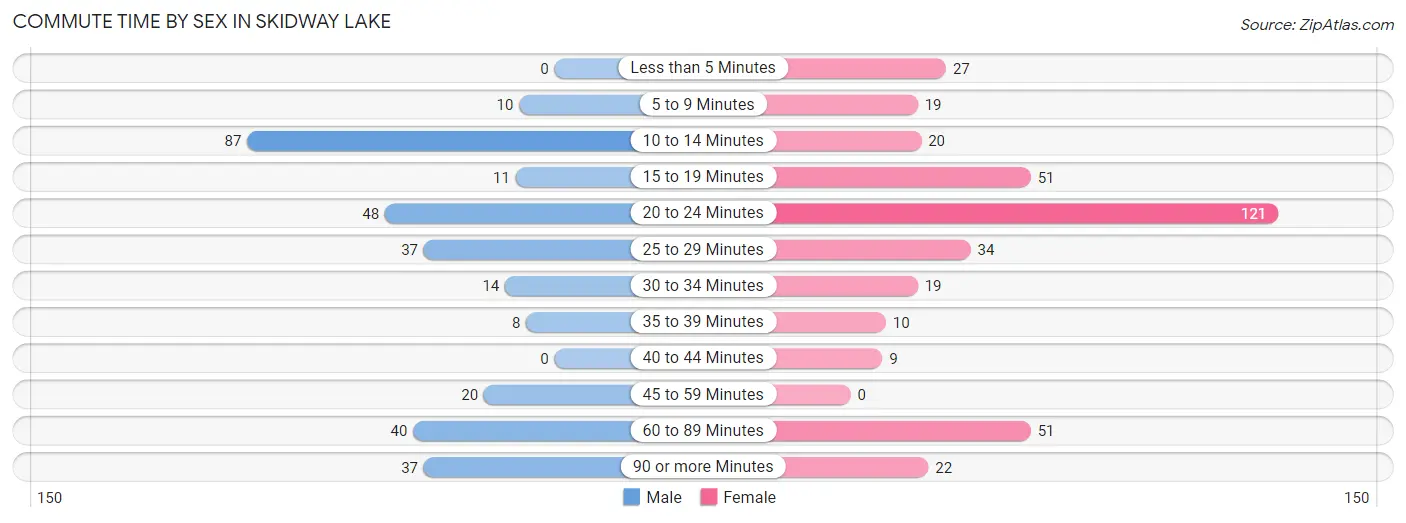
| Commute Time | Male | Female |
| Less than 5 Minutes | 0 (0.0%) | 27 (7.0%) |
| 5 to 9 Minutes | 10 (3.2%) | 19 (5.0%) |
| 10 to 14 Minutes | 87 (27.9%) | 20 (5.2%) |
| 15 to 19 Minutes | 11 (3.5%) | 51 (13.3%) |
| 20 to 24 Minutes | 48 (15.4%) | 121 (31.6%) |
| 25 to 29 Minutes | 37 (11.9%) | 34 (8.9%) |
| 30 to 34 Minutes | 14 (4.5%) | 19 (5.0%) |
| 35 to 39 Minutes | 8 (2.6%) | 10 (2.6%) |
| 40 to 44 Minutes | 0 (0.0%) | 9 (2.4%) |
| 45 to 59 Minutes | 20 (6.4%) | 0 (0.0%) |
| 60 to 89 Minutes | 40 (12.8%) | 51 (13.3%) |
| 90 or more Minutes | 37 (11.9%) | 22 (5.7%) |
Time of Departure to Work by Sex in Skidway Lake
The most frequent times of departure to work in Skidway Lake are 4:00 PM to 11:59 PM (68, 21.8%) for males and 6:30 AM to 6:59 AM (82, 21.4%) for females.
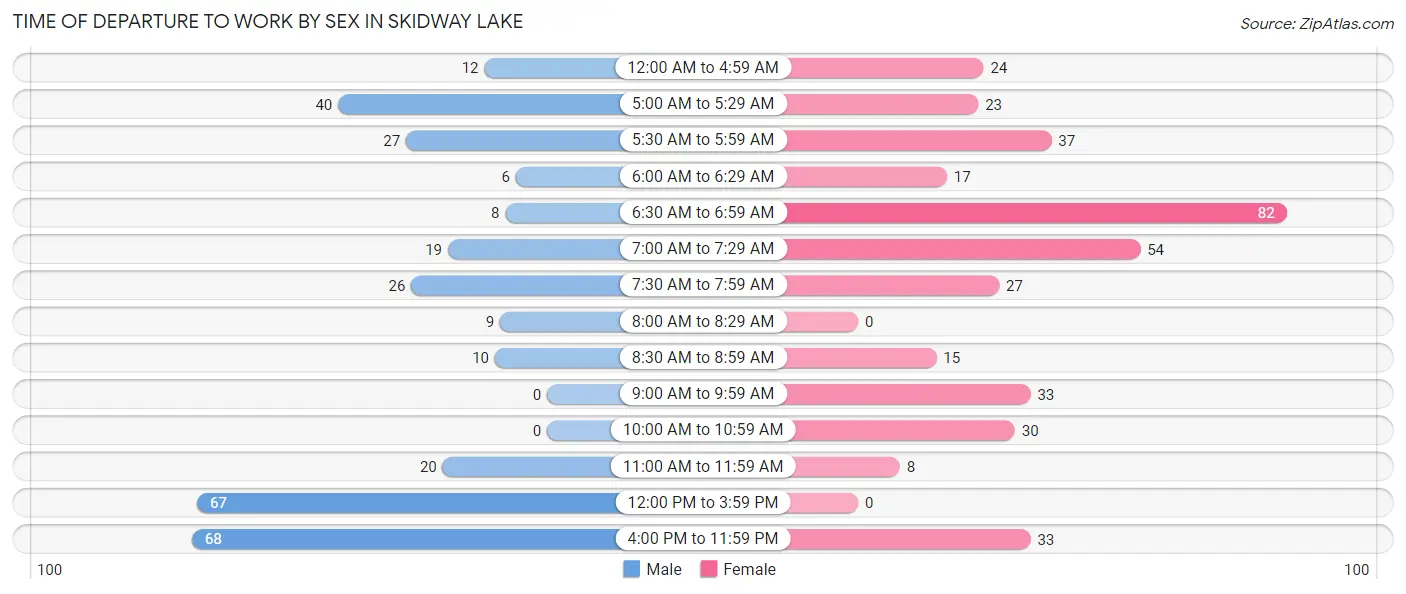
| Time of Departure | Male | Female |
| 12:00 AM to 4:59 AM | 12 (3.8%) | 24 (6.3%) |
| 5:00 AM to 5:29 AM | 40 (12.8%) | 23 (6.0%) |
| 5:30 AM to 5:59 AM | 27 (8.6%) | 37 (9.7%) |
| 6:00 AM to 6:29 AM | 6 (1.9%) | 17 (4.4%) |
| 6:30 AM to 6:59 AM | 8 (2.6%) | 82 (21.4%) |
| 7:00 AM to 7:29 AM | 19 (6.1%) | 54 (14.1%) |
| 7:30 AM to 7:59 AM | 26 (8.3%) | 27 (7.0%) |
| 8:00 AM to 8:29 AM | 9 (2.9%) | 0 (0.0%) |
| 8:30 AM to 8:59 AM | 10 (3.2%) | 15 (3.9%) |
| 9:00 AM to 9:59 AM | 0 (0.0%) | 33 (8.6%) |
| 10:00 AM to 10:59 AM | 0 (0.0%) | 30 (7.8%) |
| 11:00 AM to 11:59 AM | 20 (6.4%) | 8 (2.1%) |
| 12:00 PM to 3:59 PM | 67 (21.5%) | 0 (0.0%) |
| 4:00 PM to 11:59 PM | 68 (21.8%) | 33 (8.6%) |
| Total | 312 (100.0%) | 383 (100.0%) |
Housing Occupancy in Skidway Lake
Occupancy by Ownership in Skidway Lake
Of the total 1,255 dwellings in Skidway Lake, owner-occupied units account for 1,010 (80.5%), while renter-occupied units make up 245 (19.5%).
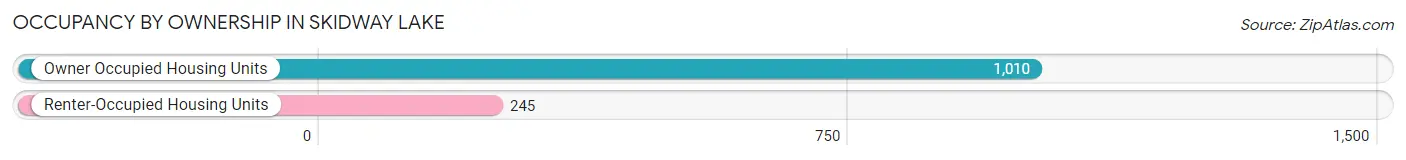
| Occupancy | # Housing Units | % Housing Units |
| Owner Occupied Housing Units | 1,010 | 80.5% |
| Renter-Occupied Housing Units | 245 | 19.5% |
| Total Occupied Housing Units | 1,255 | 100.0% |
Occupancy by Household Size in Skidway Lake
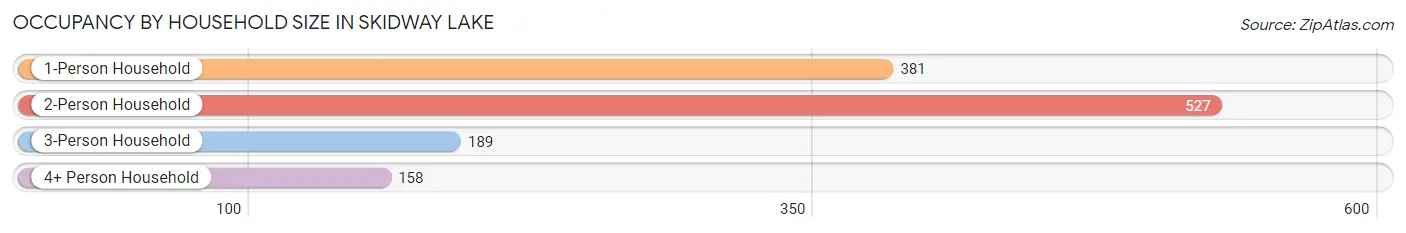
| Household Size | # Housing Units | % Housing Units |
| 1-Person Household | 381 | 30.4% |
| 2-Person Household | 527 | 42.0% |
| 3-Person Household | 189 | 15.1% |
| 4+ Person Household | 158 | 12.6% |
| Total Housing Units | 1,255 | 100.0% |
Occupancy by Ownership by Household Size in Skidway Lake
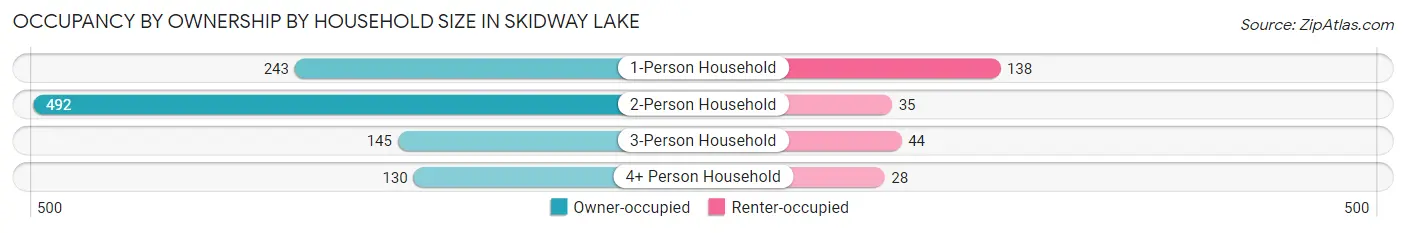
| Household Size | Owner-occupied | Renter-occupied |
| 1-Person Household | 243 (63.8%) | 138 (36.2%) |
| 2-Person Household | 492 (93.4%) | 35 (6.6%) |
| 3-Person Household | 145 (76.7%) | 44 (23.3%) |
| 4+ Person Household | 130 (82.3%) | 28 (17.7%) |
| Total Housing Units | 1,010 (80.5%) | 245 (19.5%) |
Occupancy by Educational Attainment in Skidway Lake
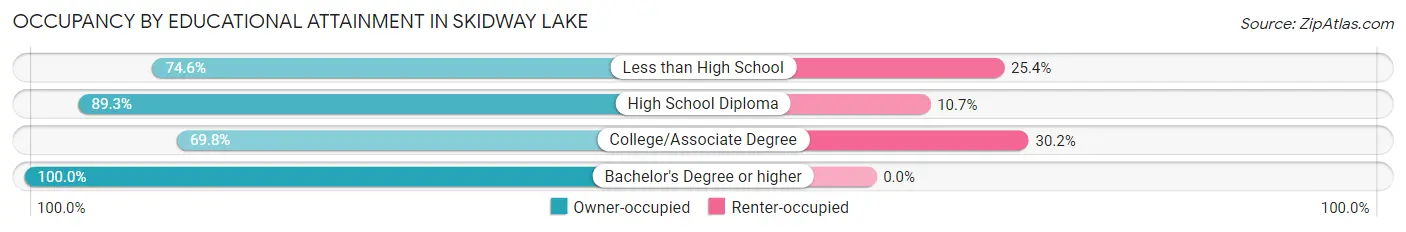
| Household Size | Owner-occupied | Renter-occupied |
| Less than High School | 150 (74.6%) | 51 (25.4%) |
| High School Diploma | 433 (89.3%) | 52 (10.7%) |
| College/Associate Degree | 328 (69.8%) | 142 (30.2%) |
| Bachelor's Degree or higher | 99 (100.0%) | 0 (0.0%) |
Occupancy by Age of Householder in Skidway Lake
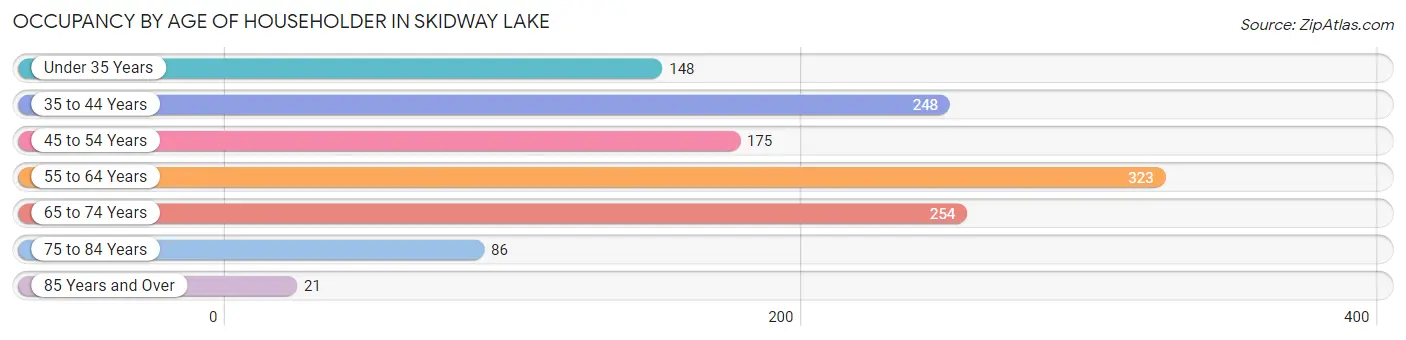
| Age Bracket | # Households | % Households |
| Under 35 Years | 148 | 11.8% |
| 35 to 44 Years | 248 | 19.8% |
| 45 to 54 Years | 175 | 13.9% |
| 55 to 64 Years | 323 | 25.7% |
| 65 to 74 Years | 254 | 20.2% |
| 75 to 84 Years | 86 | 6.9% |
| 85 Years and Over | 21 | 1.7% |
| Total | 1,255 | 100.0% |
Housing Finances in Skidway Lake
Median Income by Occupancy in Skidway Lake
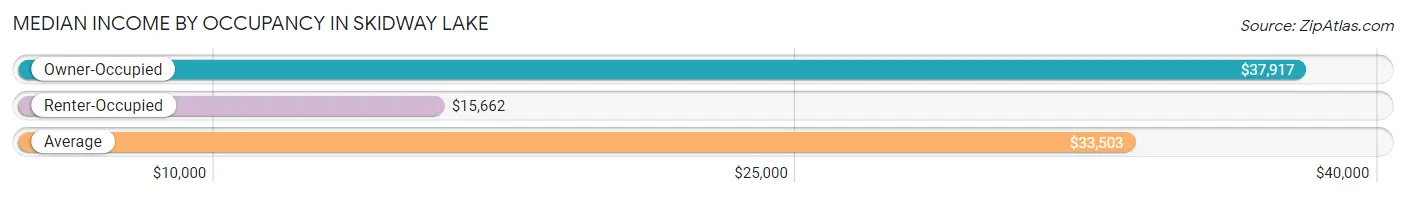
| Occupancy Type | # Households | Median Income |
| Owner-Occupied | 1,010 (80.5%) | $37,917 |
| Renter-Occupied | 245 (19.5%) | $15,662 |
| Average | 1,255 (100.0%) | $33,503 |
Occupancy by Householder Income Bracket in Skidway Lake
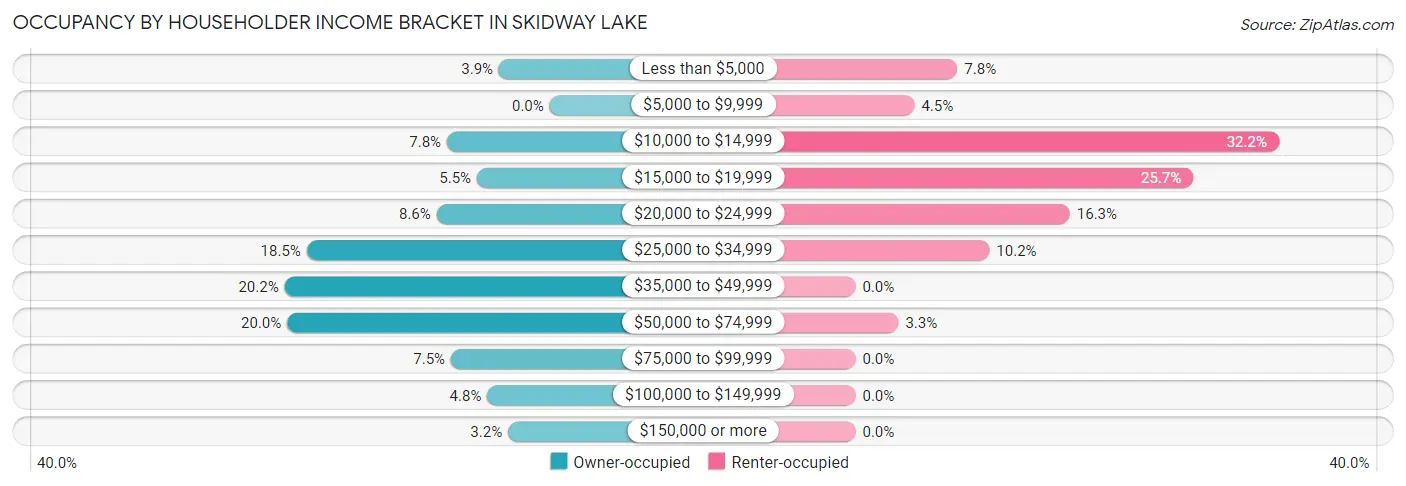
| Income Bracket | Owner-occupied | Renter-occupied |
| Less than $5,000 | 39 (3.9%) | 19 (7.8%) |
| $5,000 to $9,999 | 0 (0.0%) | 11 (4.5%) |
| $10,000 to $14,999 | 79 (7.8%) | 79 (32.2%) |
| $15,000 to $19,999 | 56 (5.5%) | 63 (25.7%) |
| $20,000 to $24,999 | 87 (8.6%) | 40 (16.3%) |
| $25,000 to $34,999 | 187 (18.5%) | 25 (10.2%) |
| $35,000 to $49,999 | 204 (20.2%) | 0 (0.0%) |
| $50,000 to $74,999 | 202 (20.0%) | 8 (3.3%) |
| $75,000 to $99,999 | 76 (7.5%) | 0 (0.0%) |
| $100,000 to $149,999 | 48 (4.8%) | 0 (0.0%) |
| $150,000 or more | 32 (3.2%) | 0 (0.0%) |
| Total | 1,010 (100.0%) | 245 (100.0%) |
Monthly Housing Cost Tiers in Skidway Lake
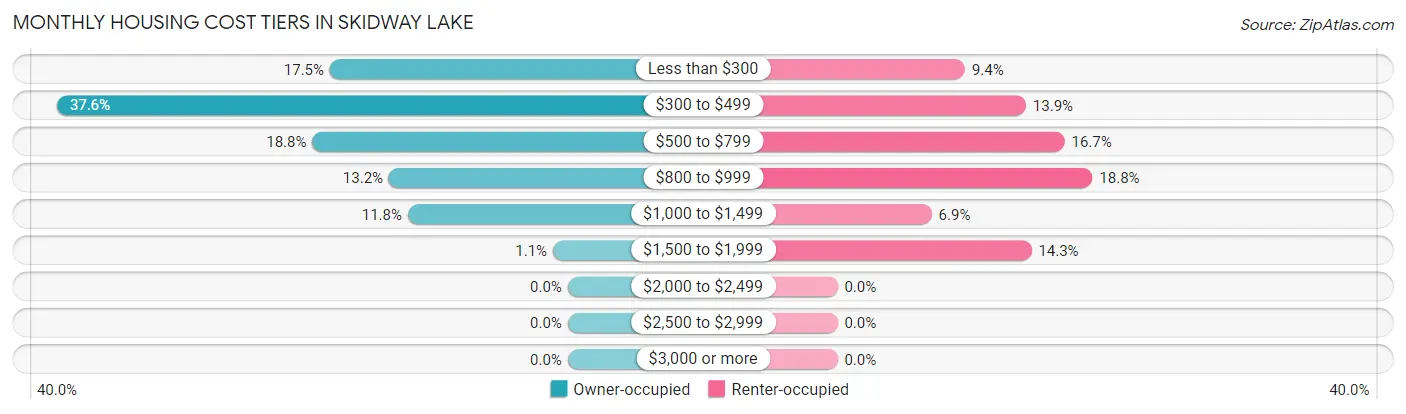
| Monthly Cost | Owner-occupied | Renter-occupied |
| Less than $300 | 177 (17.5%) | 23 (9.4%) |
| $300 to $499 | 380 (37.6%) | 34 (13.9%) |
| $500 to $799 | 190 (18.8%) | 41 (16.7%) |
| $800 to $999 | 133 (13.2%) | 46 (18.8%) |
| $1,000 to $1,499 | 119 (11.8%) | 17 (6.9%) |
| $1,500 to $1,999 | 11 (1.1%) | 35 (14.3%) |
| $2,000 to $2,499 | 0 (0.0%) | 0 (0.0%) |
| $2,500 to $2,999 | 0 (0.0%) | 0 (0.0%) |
| $3,000 or more | 0 (0.0%) | 0 (0.0%) |
| Total | 1,010 (100.0%) | 245 (100.0%) |
Physical Housing Characteristics in Skidway Lake
Housing Structures in Skidway Lake
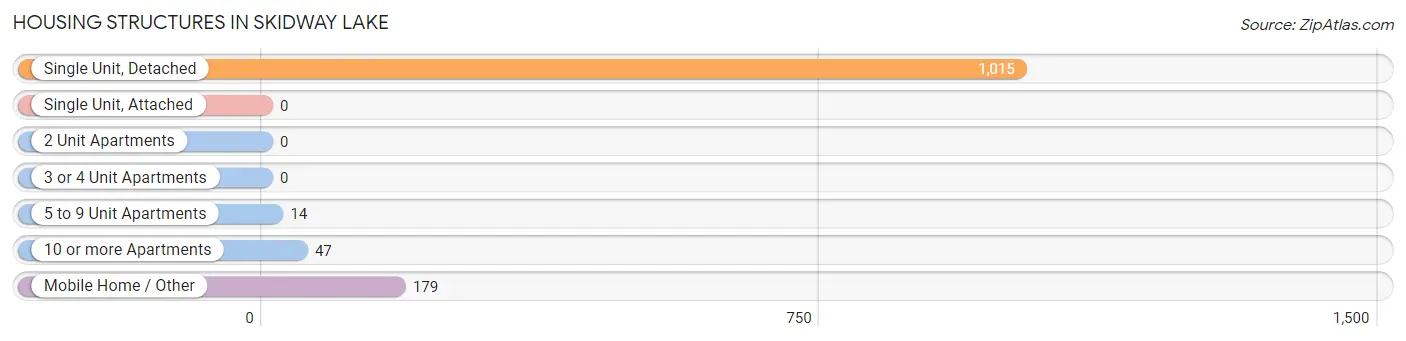
| Structure Type | # Housing Units | % Housing Units |
| Single Unit, Detached | 1,015 | 80.9% |
| Single Unit, Attached | 0 | 0.0% |
| 2 Unit Apartments | 0 | 0.0% |
| 3 or 4 Unit Apartments | 0 | 0.0% |
| 5 to 9 Unit Apartments | 14 | 1.1% |
| 10 or more Apartments | 47 | 3.7% |
| Mobile Home / Other | 179 | 14.3% |
| Total | 1,255 | 100.0% |
Housing Structures by Occupancy in Skidway Lake
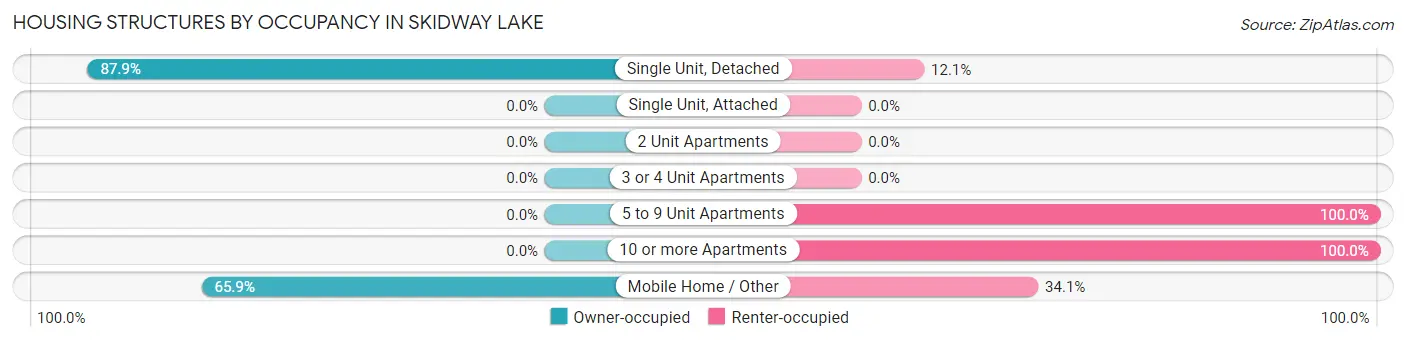
| Structure Type | Owner-occupied | Renter-occupied |
| Single Unit, Detached | 892 (87.9%) | 123 (12.1%) |
| Single Unit, Attached | 0 (0.0%) | 0 (0.0%) |
| 2 Unit Apartments | 0 (0.0%) | 0 (0.0%) |
| 3 or 4 Unit Apartments | 0 (0.0%) | 0 (0.0%) |
| 5 to 9 Unit Apartments | 0 (0.0%) | 14 (100.0%) |
| 10 or more Apartments | 0 (0.0%) | 47 (100.0%) |
| Mobile Home / Other | 118 (65.9%) | 61 (34.1%) |
| Total | 1,010 (80.5%) | 245 (19.5%) |
Housing Structures by Number of Rooms in Skidway Lake
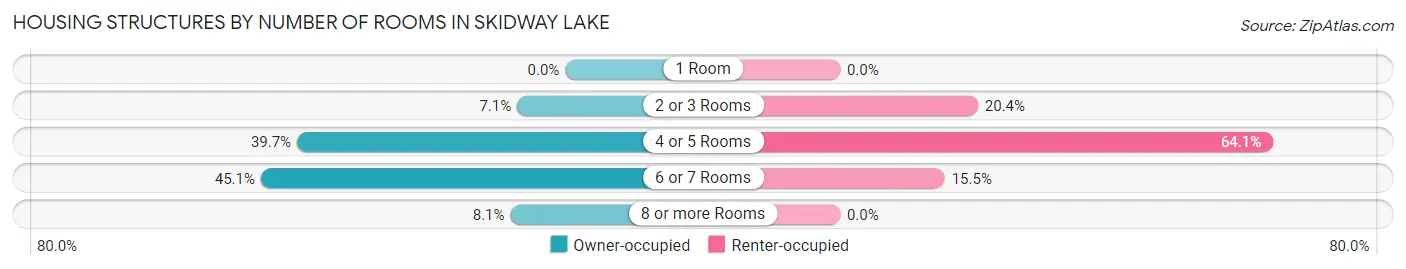
| Number of Rooms | Owner-occupied | Renter-occupied |
| 1 Room | 0 (0.0%) | 0 (0.0%) |
| 2 or 3 Rooms | 72 (7.1%) | 50 (20.4%) |
| 4 or 5 Rooms | 401 (39.7%) | 157 (64.1%) |
| 6 or 7 Rooms | 455 (45.1%) | 38 (15.5%) |
| 8 or more Rooms | 82 (8.1%) | 0 (0.0%) |
| Total | 1,010 (100.0%) | 245 (100.0%) |
Housing Structure by Heating Type in Skidway Lake
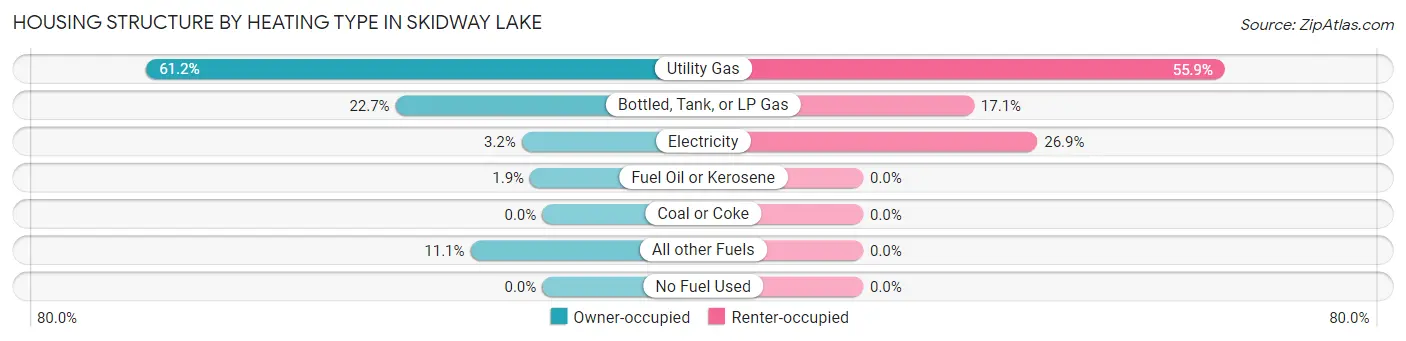
| Heating Type | Owner-occupied | Renter-occupied |
| Utility Gas | 618 (61.2%) | 137 (55.9%) |
| Bottled, Tank, or LP Gas | 229 (22.7%) | 42 (17.1%) |
| Electricity | 32 (3.2%) | 66 (26.9%) |
| Fuel Oil or Kerosene | 19 (1.9%) | 0 (0.0%) |
| Coal or Coke | 0 (0.0%) | 0 (0.0%) |
| All other Fuels | 112 (11.1%) | 0 (0.0%) |
| No Fuel Used | 0 (0.0%) | 0 (0.0%) |
| Total | 1,010 (100.0%) | 245 (100.0%) |
Household Vehicle Usage in Skidway Lake
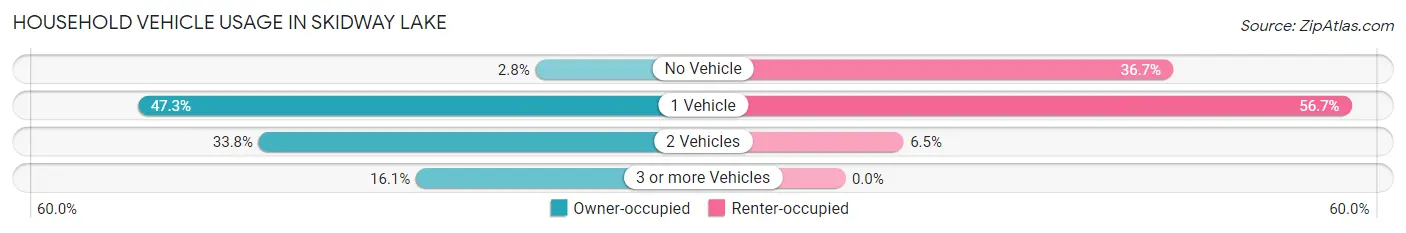
| Vehicles per Household | Owner-occupied | Renter-occupied |
| No Vehicle | 28 (2.8%) | 90 (36.7%) |
| 1 Vehicle | 478 (47.3%) | 139 (56.7%) |
| 2 Vehicles | 341 (33.8%) | 16 (6.5%) |
| 3 or more Vehicles | 163 (16.1%) | 0 (0.0%) |
| Total | 1,010 (100.0%) | 245 (100.0%) |
Real Estate & Mortgages in Skidway Lake
Real Estate and Mortgage Overview in Skidway Lake
| Characteristic | Without Mortgage | With Mortgage |
| Housing Units | 561 | 449 |
| Median Property Value | $47,500 | $48,300 |
| Median Household Income | $33,565 | $17 |
| Monthly Housing Costs | $346 | $0 |
| Real Estate Taxes | $729 | $14 |
Property Value by Mortgage Status in Skidway Lake
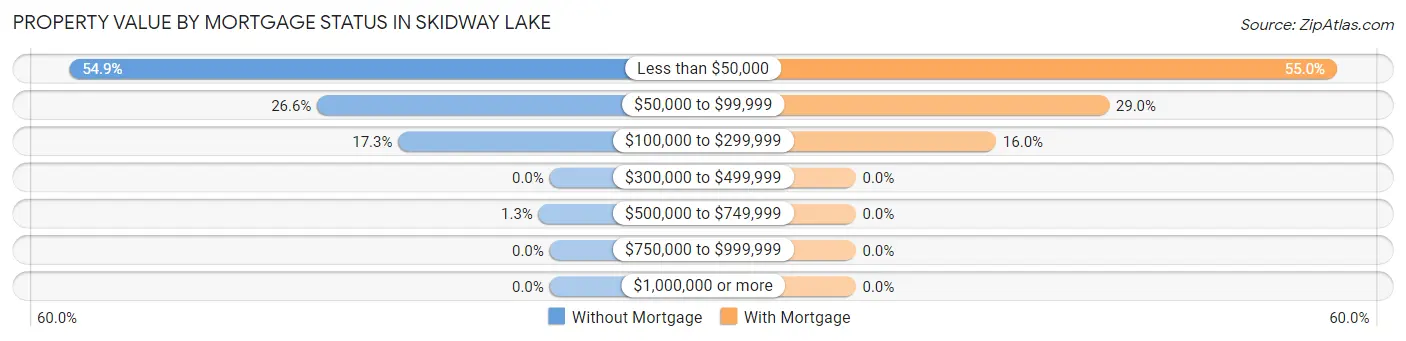
| Property Value | Without Mortgage | With Mortgage |
| Less than $50,000 | 308 (54.9%) | 247 (55.0%) |
| $50,000 to $99,999 | 149 (26.6%) | 130 (28.9%) |
| $100,000 to $299,999 | 97 (17.3%) | 72 (16.0%) |
| $300,000 to $499,999 | 0 (0.0%) | 0 (0.0%) |
| $500,000 to $749,999 | 7 (1.3%) | 0 (0.0%) |
| $750,000 to $999,999 | 0 (0.0%) | 0 (0.0%) |
| $1,000,000 or more | 0 (0.0%) | 0 (0.0%) |
| Total | 561 (100.0%) | 449 (100.0%) |
Household Income by Mortgage Status in Skidway Lake
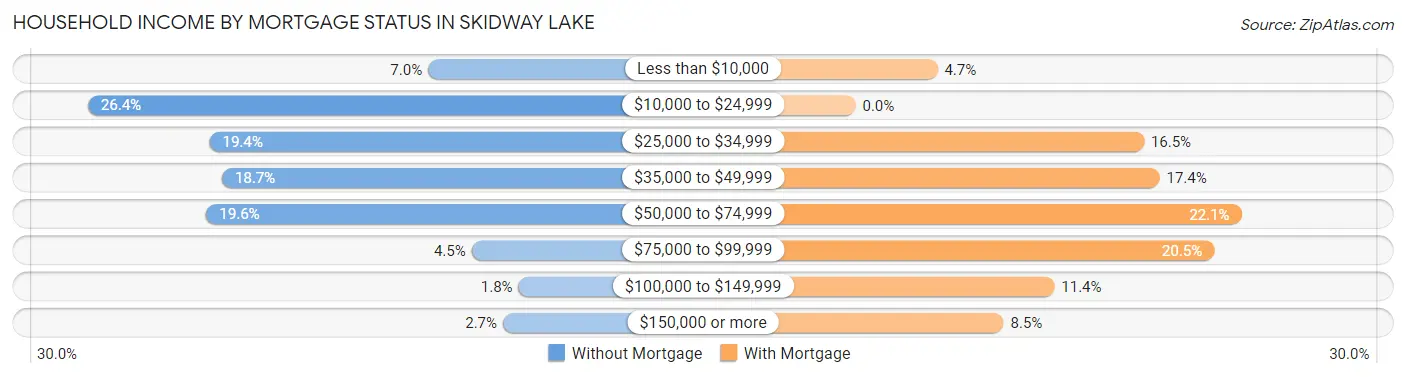
| Household Income | Without Mortgage | With Mortgage |
| Less than $10,000 | 39 (7.0%) | 21 (4.7%) |
| $10,000 to $24,999 | 148 (26.4%) | 0 (0.0%) |
| $25,000 to $34,999 | 109 (19.4%) | 74 (16.5%) |
| $35,000 to $49,999 | 105 (18.7%) | 78 (17.4%) |
| $50,000 to $74,999 | 110 (19.6%) | 99 (22.1%) |
| $75,000 to $99,999 | 25 (4.5%) | 92 (20.5%) |
| $100,000 to $149,999 | 10 (1.8%) | 51 (11.4%) |
| $150,000 or more | 15 (2.7%) | 38 (8.5%) |
| Total | 561 (100.0%) | 449 (100.0%) |
Property Value to Household Income Ratio in Skidway Lake
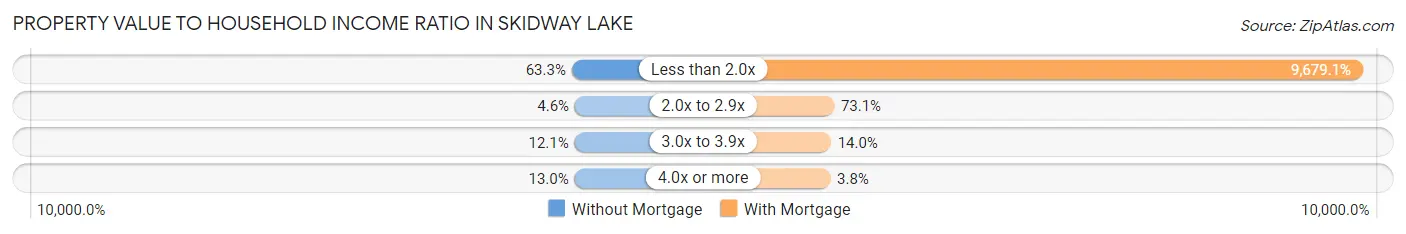
| Value-to-Income Ratio | Without Mortgage | With Mortgage |
| Less than 2.0x | 355 (63.3%) | 43,459 (9,679.1%) |
| 2.0x to 2.9x | 26 (4.6%) | 328 (73.1%) |
| 3.0x to 3.9x | 68 (12.1%) | 63 (14.0%) |
| 4.0x or more | 73 (13.0%) | 17 (3.8%) |
| Total | 561 (100.0%) | 449 (100.0%) |
Real Estate Taxes by Mortgage Status in Skidway Lake
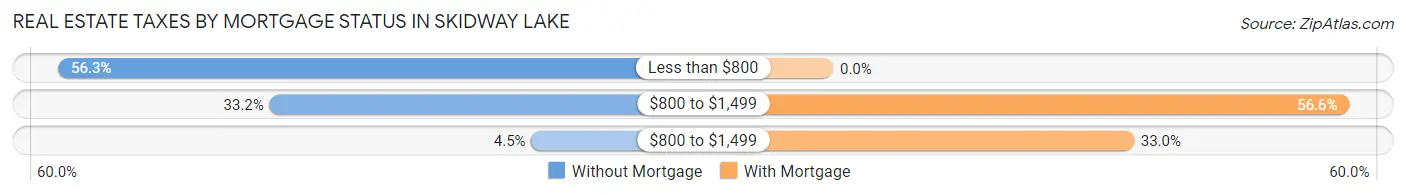
| Property Taxes | Without Mortgage | With Mortgage |
| Less than $800 | 316 (56.3%) | 0 (0.0%) |
| $800 to $1,499 | 186 (33.2%) | 254 (56.6%) |
| $800 to $1,499 | 25 (4.5%) | 148 (33.0%) |
| Total | 561 (100.0%) | 449 (100.0%) |
Health & Disability in Skidway Lake
Health Insurance Coverage by Age in Skidway Lake
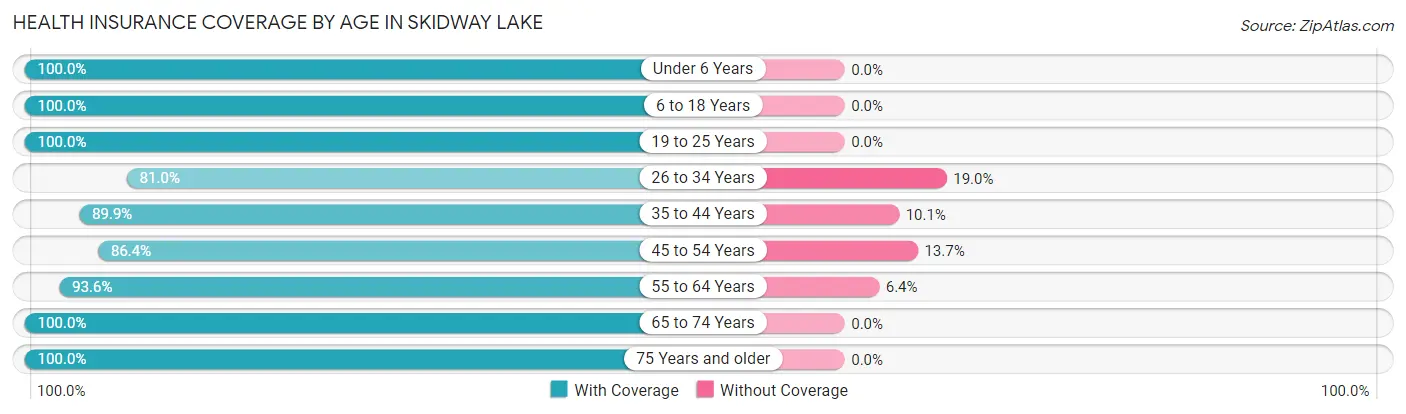
| Age Bracket | With Coverage | Without Coverage |
| Under 6 Years | 198 (100.0%) | 0 (0.0%) |
| 6 to 18 Years | 469 (100.0%) | 0 (0.0%) |
| 19 to 25 Years | 145 (100.0%) | 0 (0.0%) |
| 26 to 34 Years | 281 (81.0%) | 66 (19.0%) |
| 35 to 44 Years | 319 (89.9%) | 36 (10.1%) |
| 45 to 54 Years | 253 (86.4%) | 40 (13.7%) |
| 55 to 64 Years | 466 (93.6%) | 32 (6.4%) |
| 65 to 74 Years | 416 (100.0%) | 0 (0.0%) |
| 75 Years and older | 159 (100.0%) | 0 (0.0%) |
| Total | 2,706 (94.0%) | 174 (6.0%) |
Health Insurance Coverage by Citizenship Status in Skidway Lake
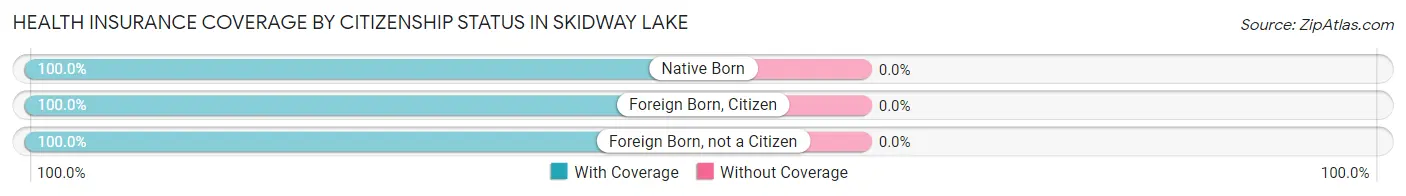
| Citizenship Status | With Coverage | Without Coverage |
| Native Born | 198 (100.0%) | 0 (0.0%) |
| Foreign Born, Citizen | 469 (100.0%) | 0 (0.0%) |
| Foreign Born, not a Citizen | 145 (100.0%) | 0 (0.0%) |
Health Insurance Coverage by Household Income in Skidway Lake
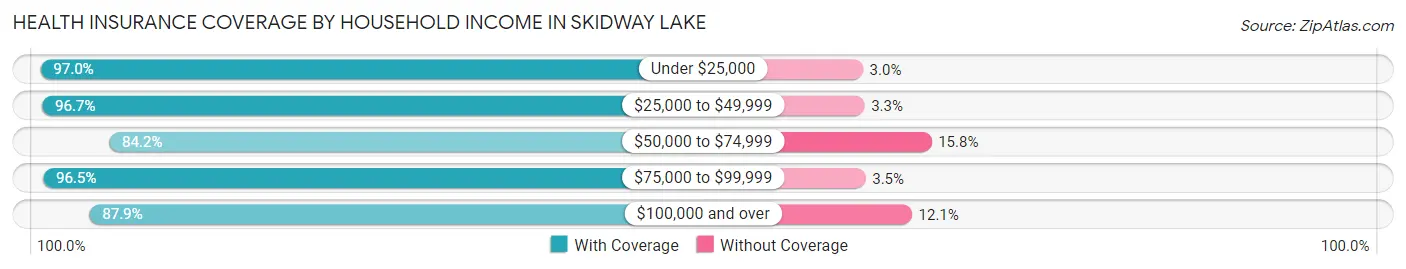
| Household Income | With Coverage | Without Coverage |
| Under $25,000 | 849 (97.0%) | 26 (3.0%) |
| $25,000 to $49,999 | 1,035 (96.7%) | 35 (3.3%) |
| $50,000 to $74,999 | 447 (84.2%) | 84 (15.8%) |
| $75,000 to $99,999 | 223 (96.5%) | 8 (3.5%) |
| $100,000 and over | 152 (87.9%) | 21 (12.1%) |
Public vs Private Health Insurance Coverage by Age in Skidway Lake
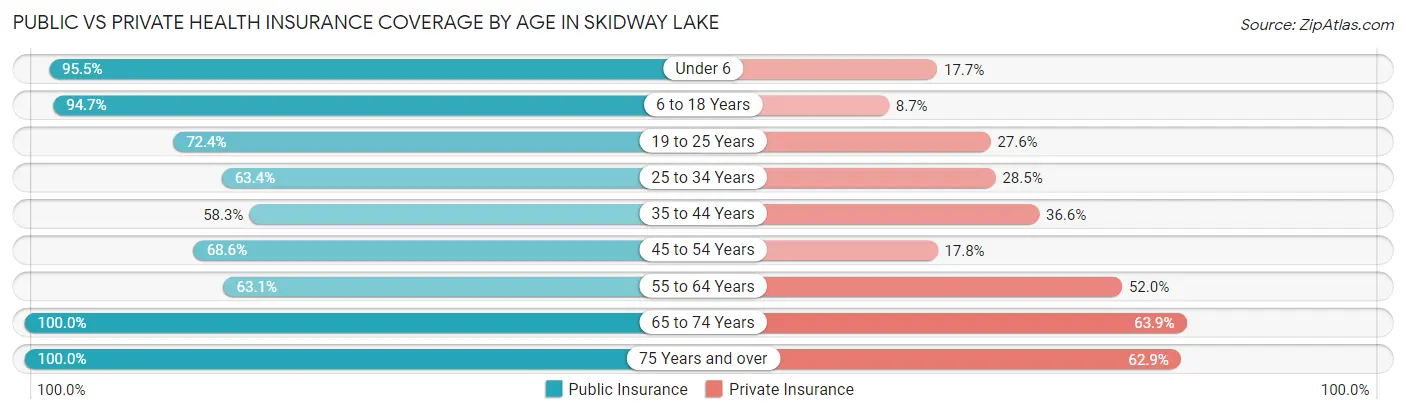
| Age Bracket | Public Insurance | Private Insurance |
| Under 6 | 189 (95.5%) | 35 (17.7%) |
| 6 to 18 Years | 444 (94.7%) | 41 (8.7%) |
| 19 to 25 Years | 105 (72.4%) | 40 (27.6%) |
| 25 to 34 Years | 220 (63.4%) | 99 (28.5%) |
| 35 to 44 Years | 207 (58.3%) | 130 (36.6%) |
| 45 to 54 Years | 201 (68.6%) | 52 (17.7%) |
| 55 to 64 Years | 314 (63.0%) | 259 (52.0%) |
| 65 to 74 Years | 416 (100.0%) | 266 (63.9%) |
| 75 Years and over | 159 (100.0%) | 100 (62.9%) |
| Total | 2,255 (78.3%) | 1,022 (35.5%) |
Disability Status by Sex by Age in Skidway Lake
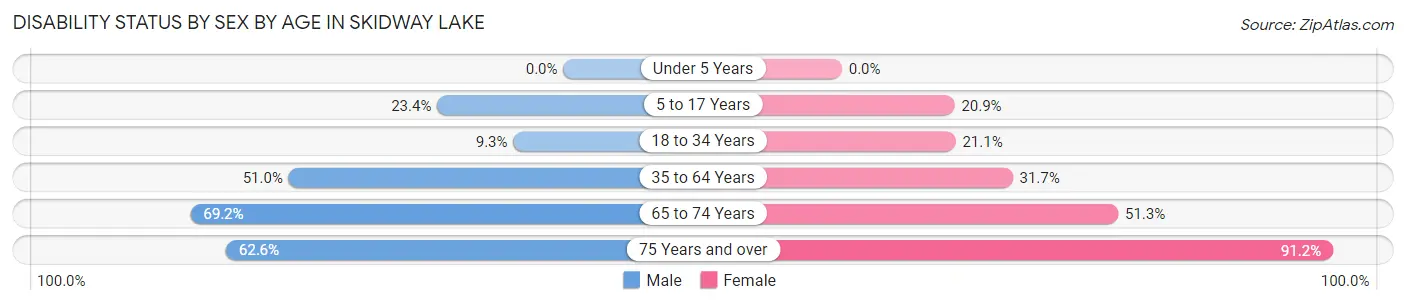
| Age Bracket | Male | Female |
| Under 5 Years | 0 (0.0%) | 0 (0.0%) |
| 5 to 17 Years | 59 (23.4%) | 46 (20.9%) |
| 18 to 34 Years | 27 (9.3%) | 46 (21.1%) |
| 35 to 64 Years | 264 (51.0%) | 199 (31.7%) |
| 65 to 74 Years | 153 (69.2%) | 100 (51.3%) |
| 75 Years and over | 57 (62.6%) | 62 (91.2%) |
Disability Class by Sex by Age in Skidway Lake
Disability Class: Hearing Difficulty
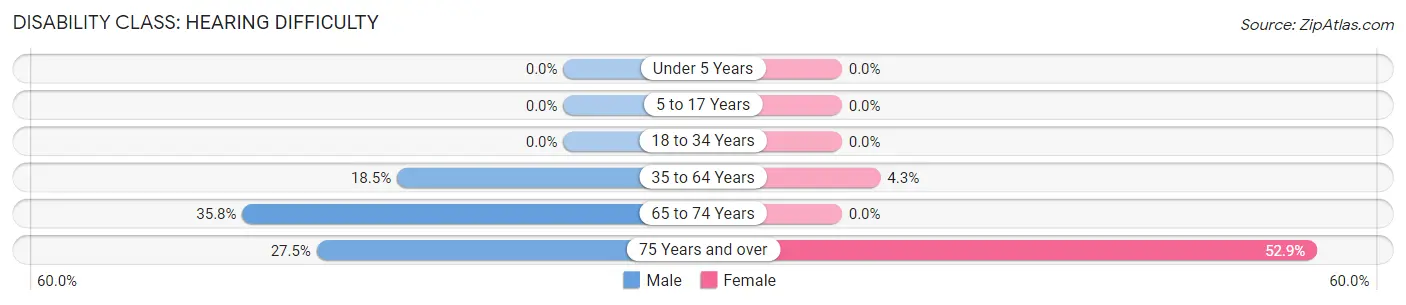
| Age Bracket | Male | Female |
| Under 5 Years | 0 (0.0%) | 0 (0.0%) |
| 5 to 17 Years | 0 (0.0%) | 0 (0.0%) |
| 18 to 34 Years | 0 (0.0%) | 0 (0.0%) |
| 35 to 64 Years | 96 (18.5%) | 27 (4.3%) |
| 65 to 74 Years | 79 (35.7%) | 0 (0.0%) |
| 75 Years and over | 25 (27.5%) | 36 (52.9%) |
Disability Class: Vision Difficulty
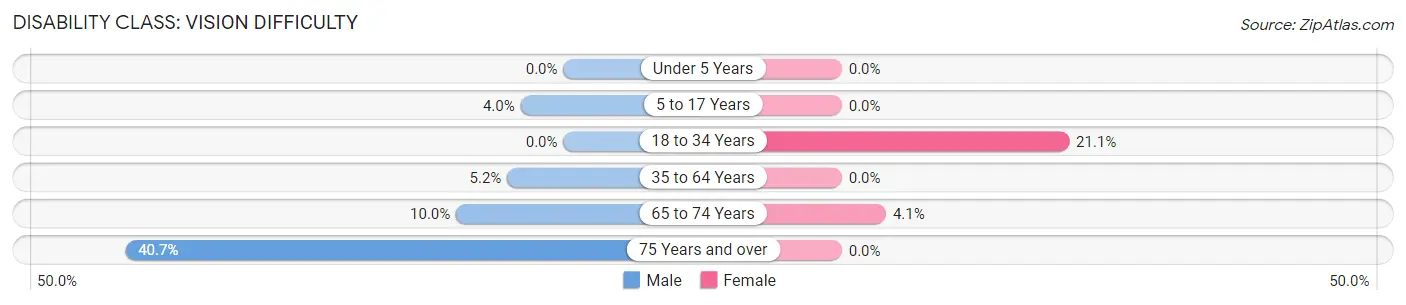
| Age Bracket | Male | Female |
| Under 5 Years | 0 (0.0%) | 0 (0.0%) |
| 5 to 17 Years | 10 (4.0%) | 0 (0.0%) |
| 18 to 34 Years | 0 (0.0%) | 46 (21.1%) |
| 35 to 64 Years | 27 (5.2%) | 0 (0.0%) |
| 65 to 74 Years | 22 (10.0%) | 8 (4.1%) |
| 75 Years and over | 37 (40.7%) | 0 (0.0%) |
Disability Class: Cognitive Difficulty
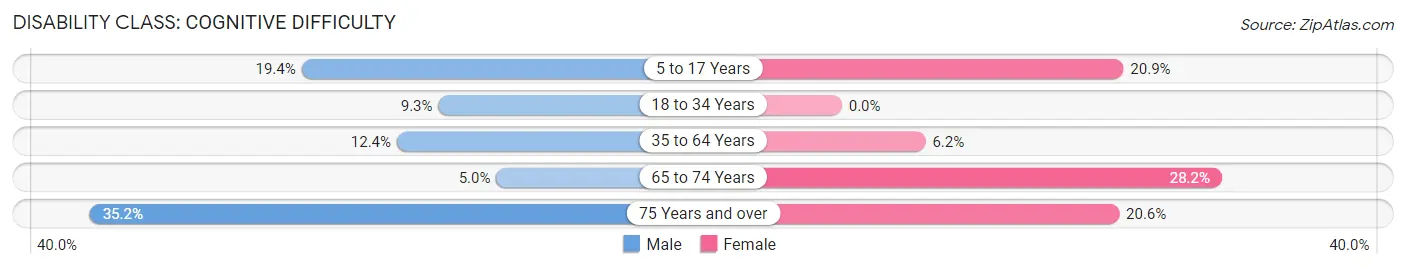
| Age Bracket | Male | Female |
| 5 to 17 Years | 49 (19.4%) | 46 (20.9%) |
| 18 to 34 Years | 27 (9.3%) | 0 (0.0%) |
| 35 to 64 Years | 64 (12.4%) | 39 (6.2%) |
| 65 to 74 Years | 11 (5.0%) | 55 (28.2%) |
| 75 Years and over | 32 (35.2%) | 14 (20.6%) |
Disability Class: Ambulatory Difficulty
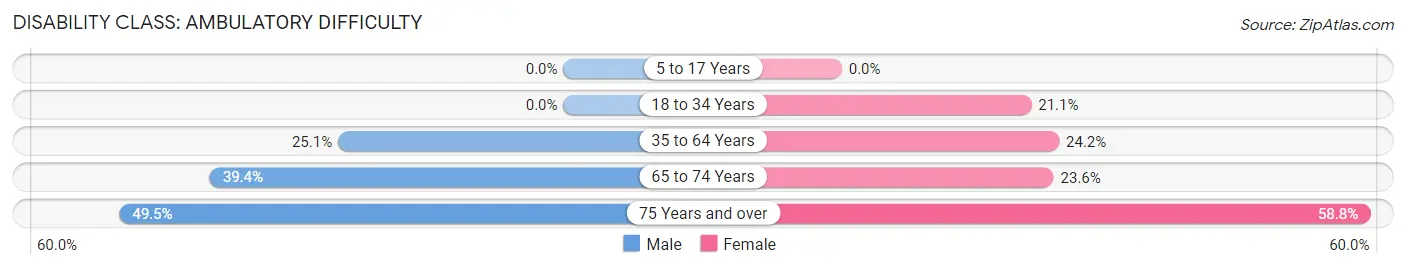
| Age Bracket | Male | Female |
| 5 to 17 Years | 0 (0.0%) | 0 (0.0%) |
| 18 to 34 Years | 0 (0.0%) | 46 (21.1%) |
| 35 to 64 Years | 130 (25.1%) | 152 (24.2%) |
| 65 to 74 Years | 87 (39.4%) | 46 (23.6%) |
| 75 Years and over | 45 (49.4%) | 40 (58.8%) |
Disability Class: Self-Care Difficulty
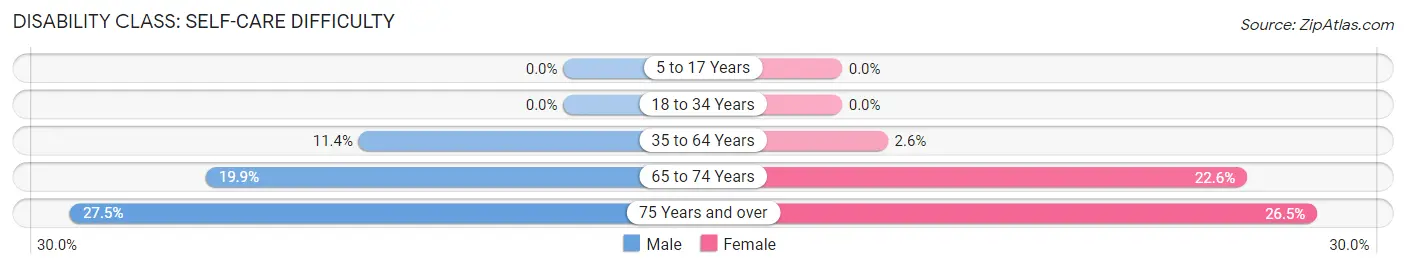
| Age Bracket | Male | Female |
| 5 to 17 Years | 0 (0.0%) | 0 (0.0%) |
| 18 to 34 Years | 0 (0.0%) | 0 (0.0%) |
| 35 to 64 Years | 59 (11.4%) | 16 (2.5%) |
| 65 to 74 Years | 44 (19.9%) | 44 (22.6%) |
| 75 Years and over | 25 (27.5%) | 18 (26.5%) |
Technology Access in Skidway Lake
Computing Device Access in Skidway Lake
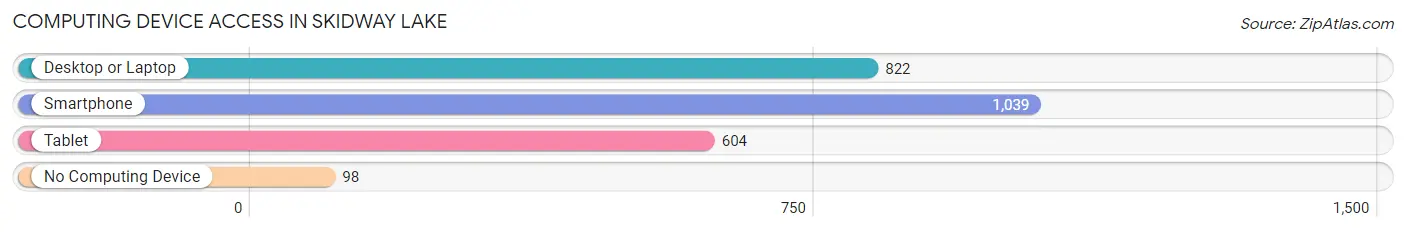
| Device Type | # Households | % Households |
| Desktop or Laptop | 822 | 65.5% |
| Smartphone | 1,039 | 82.8% |
| Tablet | 604 | 48.1% |
| No Computing Device | 98 | 7.8% |
| Total | 1,255 | 100.0% |
Internet Access in Skidway Lake
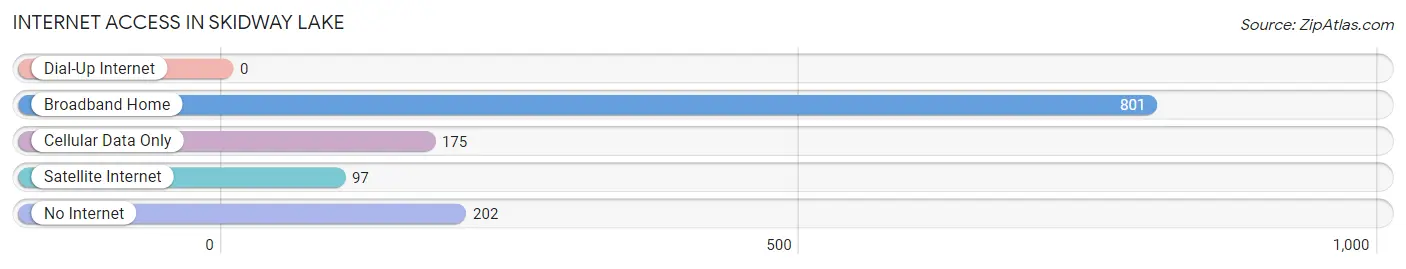
| Internet Type | # Households | % Households |
| Dial-Up Internet | 0 | 0.0% |
| Broadband Home | 801 | 63.8% |
| Cellular Data Only | 175 | 13.9% |
| Satellite Internet | 97 | 7.7% |
| No Internet | 202 | 16.1% |
| Total | 1,255 | 100.0% |
Skidway Lake Summary
Skidway Lake is a small unincorporated community located in the northeastern corner of Michigan’s Lower Peninsula. It is situated in the northern part of Montmorency County, approximately 20 miles south of the Mackinac Bridge. The community is surrounded by the Huron National Forest and is home to a variety of wildlife, including deer, bear, and bald eagles.
History
Skidway Lake was first settled in the late 1800s by a group of lumberjacks who were attracted to the area by the abundance of timber. The lumberjacks built a sawmill and a small village, which eventually became known as Skidway Lake. The name is derived from the fact that the lake was used to skid logs from the surrounding forests to the sawmill.
The village grew slowly over the years, and by the early 1900s, it had become a popular destination for vacationers. The area was known for its excellent fishing, and the lake was stocked with a variety of species, including bass, walleye, and northern pike.
In the 1920s, the village was connected to the rest of the state by a railroad line, which allowed for the transport of lumber and other goods. The railroad also brought tourists to the area, and the village began to grow.
In the 1950s, the village was incorporated as a village, and the population began to increase. The village was home to a variety of businesses, including a general store, a post office, and a gas station.
Geography
Skidway Lake is located in the northeastern corner of Michigan’s Lower Peninsula. It is situated in the northern part of Montmorency County, approximately 20 miles south of the Mackinac Bridge. The community is surrounded by the Huron National Forest and is home to a variety of wildlife, including deer, bear, and bald eagles.
The lake itself is approximately 1,000 acres in size and is fed by several small streams. The lake is a popular destination for fishing, boating, and swimming. The lake is also home to a variety of fish, including bass, walleye, and northern pike.
Economy
Skidway Lake is a small, rural community with a population of approximately 500 people. The economy of the village is largely based on tourism and recreation. The village is home to a variety of businesses, including a general store, a post office, and a gas station.
The village is also home to several resorts and campgrounds, which attract visitors from all over the state. The lake is a popular destination for fishing, boating, and swimming, and the surrounding forests are popular for hunting and hiking.
Demographics
As of the 2010 census, the population of Skidway Lake was 498 people. The racial makeup of the village was 97.2% White, 0.2% African American, 0.2% Native American, 0.2% Asian, 0.2% from other races, and 1.8% from two or more races. Hispanic or Latino of any race were 0.8% of the population.
The median income for a household in the village was $31,250, and the median income for a family was $37,500. The per capita income for the village was $17,818. About 11.2% of families and 14.2% of the population were below the poverty line, including 18.2% of those under age 18 and none of those age 65 or over.
Skidway Lake is a small, rural community with a population of approximately 500 people. The economy of the village is largely based on tourism and recreation, and the village is home to a variety of businesses, including a general store, a post office, and a gas station. The lake is a popular destination for fishing, boating, and swimming, and the surrounding forests are popular for hunting and hiking. The village is also home to several resorts and campgrounds, which attract visitors from all over the state.
Common Questions
What is Per Capita Income in Skidway Lake?
Per Capita income in Skidway Lake is $18,156.
What is the Median Family Income in Skidway Lake?
Median Family Income in Skidway Lake is $36,814.
What is the Median Household income in Skidway Lake?
Median Household Income in Skidway Lake is $33,503.
What is Income or Wage Gap in Skidway Lake?
Income or Wage Gap in Skidway Lake is 10.3%.
Women in Skidway Lake earn 89.7 cents for every dollar earned by a man.
What is Inequality or Gini Index in Skidway Lake?
Inequality or Gini Index in Skidway Lake is 0.41.
What is the Total Population of Skidway Lake?
Total Population of Skidway Lake is 2,880.
What is the Total Male Population of Skidway Lake?
Total Male Population of Skidway Lake is 1,421.
What is the Total Female Population of Skidway Lake?
Total Female Population of Skidway Lake is 1,459.
What is the Ratio of Males per 100 Females in Skidway Lake?
There are 97.40 Males per 100 Females in Skidway Lake.
What is the Ratio of Females per 100 Males in Skidway Lake?
There are 102.67 Females per 100 Males in Skidway Lake.
What is the Median Population Age in Skidway Lake?
Median Population Age in Skidway Lake is 43.4 Years.
What is the Average Family Size in Skidway Lake
Average Family Size in Skidway Lake is 2.8 People.
What is the Average Household Size in Skidway Lake
Average Household Size in Skidway Lake is 2.3 People.
How Large is the Labor Force in Skidway Lake?
There are 898 People in the Labor Forcein in Skidway Lake.
What is the Percentage of People in the Labor Force in Skidway Lake?
38.7% of People are in the Labor Force in Skidway Lake.
What is the Unemployment Rate in Skidway Lake?
Unemployment Rate in Skidway Lake is 15.1%.