Zip Codes with the Highest Percentage of Population with a Degree in Liberal Arts and History in Muskegon, MI
RELATED REPORTS & OPTIONS
Liberal Arts and History
Muskegon
Compare Zip Codes
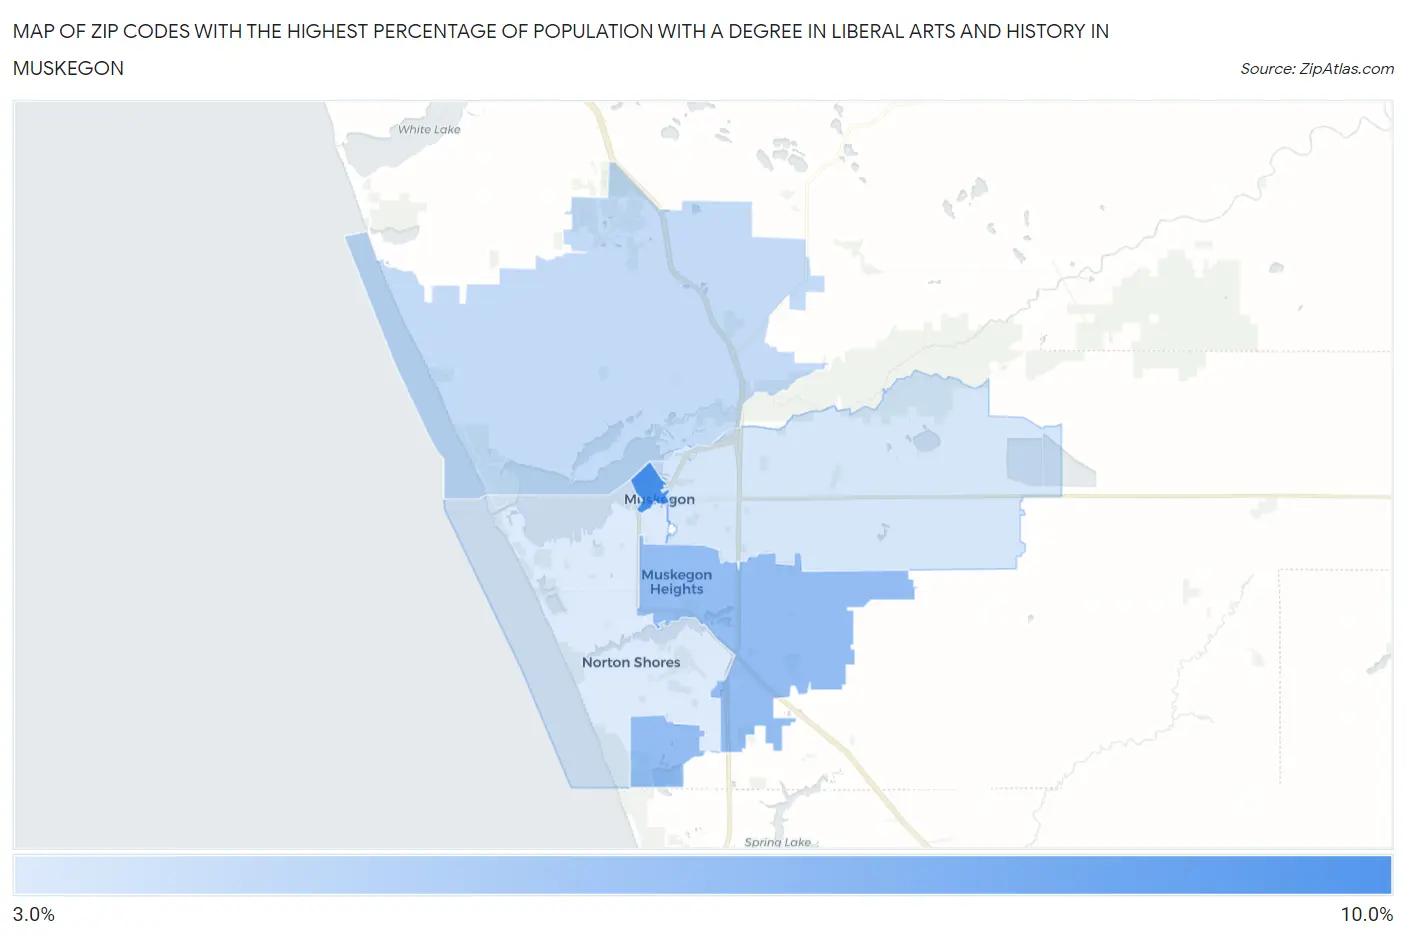
Map of Zip Codes with the Highest Percentage of Population with a Degree in Liberal Arts and History in Muskegon
3.0%
9.9%
Zip Codes with the Highest Percentage of Population with a Degree in Liberal Arts and History in Muskegon, MI
| Zip Code | % Graduates | vs State | vs National | |
| 1. | 49440 | 9.9% | 4.0%(+5.95)#58 | 4.9%(+5.06)#3,147 |
| 2. | 49444 | 6.4% | 4.0%(+2.41)#167 | 4.9%(+1.52)#7,581 |
| 3. | 49445 | 4.1% | 4.0%(+0.129)#395 | 4.9%(-0.761)#14,357 |
| 4. | 49442 | 3.3% | 4.0%(-0.705)#535 | 4.9%(-1.60)#17,399 |
| 5. | 49441 | 3.0% | 4.0%(-0.969)#586 | 4.9%(-1.86)#18,313 |
1
Common Questions
What are the Top 3 Zip Codes with the Highest Percentage of Population with a Degree in Liberal Arts and History in Muskegon, MI?
Top 3 Zip Codes with the Highest Percentage of Population with a Degree in Liberal Arts and History in Muskegon, MI are:
What zip code has the Highest Percentage of Population with a Degree in Liberal Arts and History in Muskegon, MI?
49440 has the Highest Percentage of Population with a Degree in Liberal Arts and History in Muskegon, MI with 9.9%.
What is the Percentage of Population with a Degree in Liberal Arts and History in Muskegon, MI?
Percentage of Population with a Degree in Liberal Arts and History in Muskegon is 4.9%.
What is the Percentage of Population with a Degree in Liberal Arts and History in Michigan?
Percentage of Population with a Degree in Liberal Arts and History in Michigan is 4.0%.
What is the Percentage of Population with a Degree in Liberal Arts and History in the United States?
Percentage of Population with a Degree in Liberal Arts and History in the United States is 4.9%.