Conway, MI Map & Demographics
Conway Map
Conway Overview
$23,717
PER CAPITA INCOME
$79,750
AVG FAMILY INCOME
$56,094
AVG HOUSEHOLD INCOME
0.32
INEQUALITY / GINI INDEX
149
TOTAL POPULATION
50
MALE POPULATION
99
FEMALE POPULATION
50.51
MALES / 100 FEMALES
198.00
FEMALES / 100 MALES
71.6
MEDIAN AGE
3.2
AVG FAMILY SIZE
2.0
AVG HOUSEHOLD SIZE
20
LABOR FORCE [ PEOPLE ]
17.4%
PERCENT IN LABOR FORCE
35.0%
UNEMPLOYMENT RATE
Conway Zip Codes
Conway Area Codes
Income in Conway
Income Overview in Conway
Per Capita Income in Conway is $23,717, while median incomes of families and households are $79,750 and $56,094 respectively.
| Characteristic | Number | Measure |
| Per Capita Income | 149 | $23,717 |
| Median Family Income | 33 | $79,750 |
| Mean Family Income | 33 | $65,197 |
| Median Household Income | 75 | $56,094 |
| Mean Household Income | 75 | $50,453 |
| Income Deficit | 33 | $0 |
| Wage / Income Gap (%) | 149 | 0.00% |
| Wage / Income Gap ($) | 149 | 100.00¢ per $1 |
| Gini / Inequality Index | 149 | 0.32 |
Earnings by Sex in Conway
| Sex | Number | Average Earnings |
| Male | 9 (52.9%) | $0 |
| Female | 8 (47.1%) | $0 |
| Total | 17 (100.0%) | $0 |
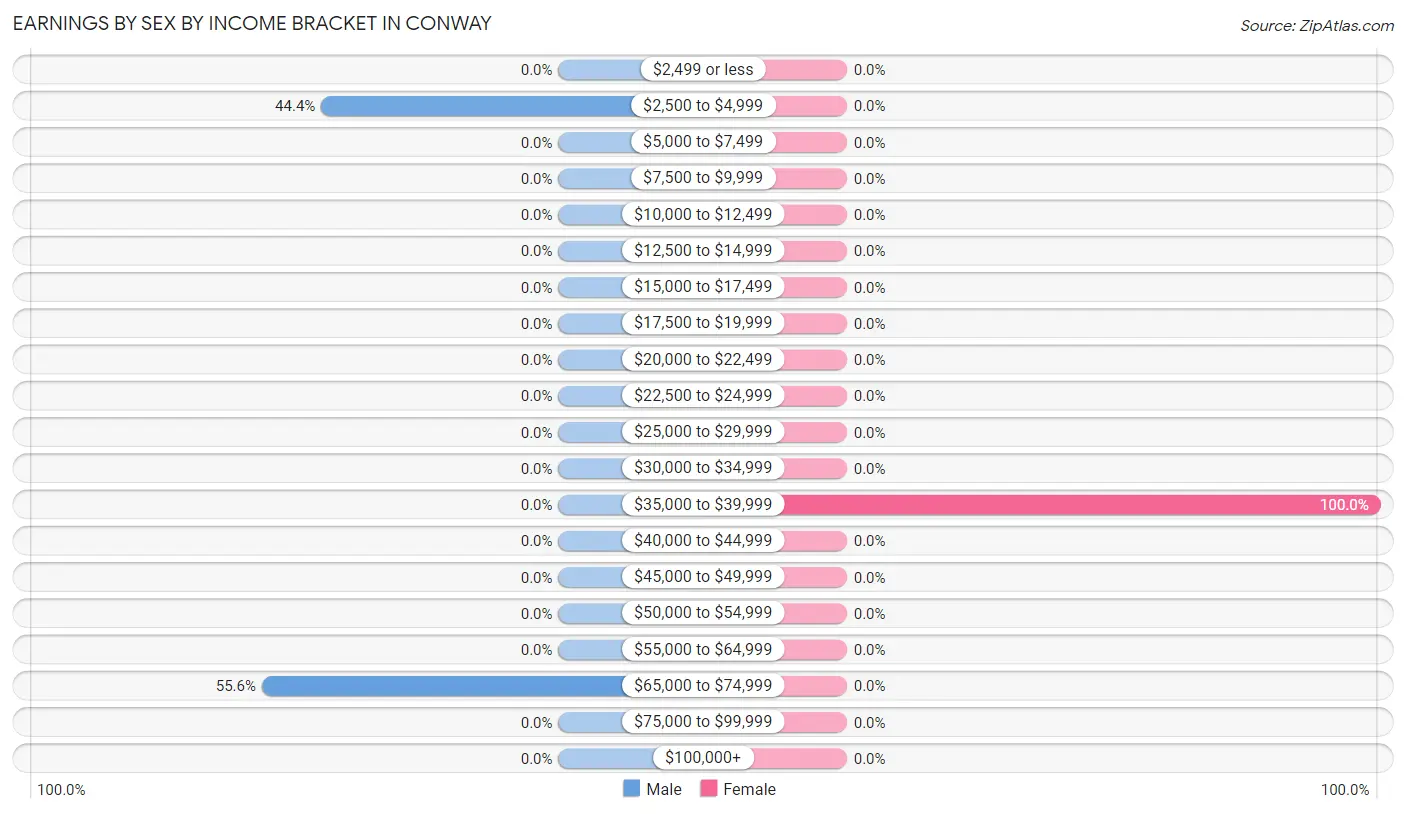
Earnings by Sex by Income Bracket in Conway
The most common earnings brackets in Conway are $65,000 to $74,999 for men (5 | 55.6%) and $35,000 to $39,999 for women (8 | 100.0%).
| Income | Male | Female |
| $2,499 or less | 0 (0.0%) | 0 (0.0%) |
| $2,500 to $4,999 | 4 (44.4%) | 0 (0.0%) |
| $5,000 to $7,499 | 0 (0.0%) | 0 (0.0%) |
| $7,500 to $9,999 | 0 (0.0%) | 0 (0.0%) |
| $10,000 to $12,499 | 0 (0.0%) | 0 (0.0%) |
| $12,500 to $14,999 | 0 (0.0%) | 0 (0.0%) |
| $15,000 to $17,499 | 0 (0.0%) | 0 (0.0%) |
| $17,500 to $19,999 | 0 (0.0%) | 0 (0.0%) |
| $20,000 to $22,499 | 0 (0.0%) | 0 (0.0%) |
| $22,500 to $24,999 | 0 (0.0%) | 0 (0.0%) |
| $25,000 to $29,999 | 0 (0.0%) | 0 (0.0%) |
| $30,000 to $34,999 | 0 (0.0%) | 0 (0.0%) |
| $35,000 to $39,999 | 0 (0.0%) | 8 (100.0%) |
| $40,000 to $44,999 | 0 (0.0%) | 0 (0.0%) |
| $45,000 to $49,999 | 0 (0.0%) | 0 (0.0%) |
| $50,000 to $54,999 | 0 (0.0%) | 0 (0.0%) |
| $55,000 to $64,999 | 0 (0.0%) | 0 (0.0%) |
| $65,000 to $74,999 | 5 (55.6%) | 0 (0.0%) |
| $75,000 to $99,999 | 0 (0.0%) | 0 (0.0%) |
| $100,000+ | 0 (0.0%) | 0 (0.0%) |
| Total | 9 (100.0%) | 8 (100.0%) |
Earnings by Sex by Educational Attainment in Conway
| Educational Attainment | Male Income | Female Income |
| Less than High School | - | - |
| High School Diploma | - | - |
| College or Associate's Degree | - | - |
| Bachelor's Degree | - | - |
| Graduate Degree | - | - |
| Total | - | - |
Family Income in Conway
Family Income Brackets in Conway
According to the Conway family income data, there are 21 families falling into the $75,000 to $99,999 income range, which is the most common income bracket and makes up 63.6% of all families.
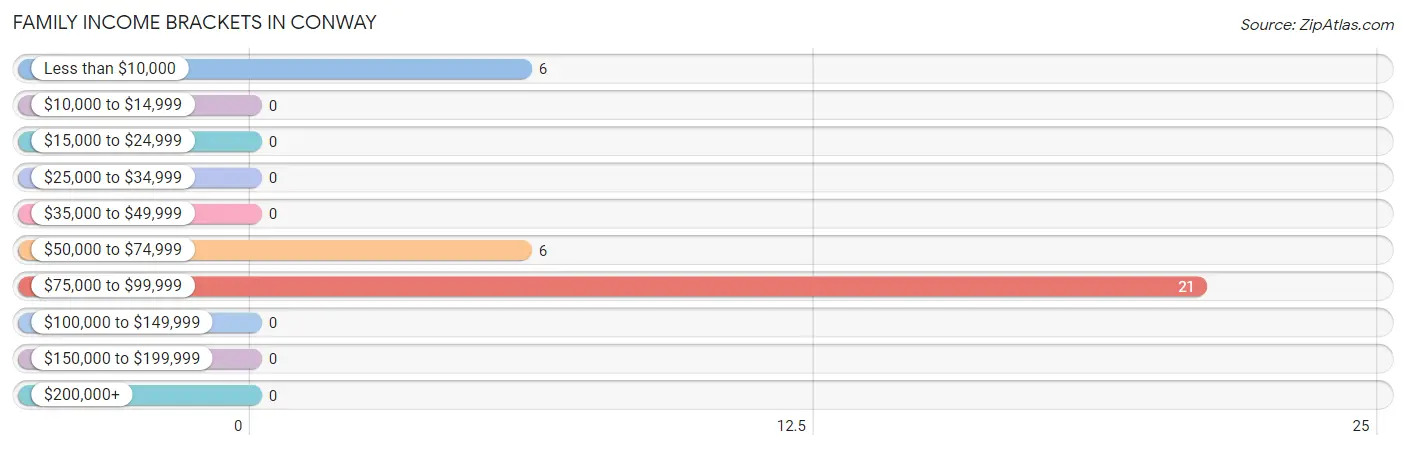
| Income Bracket | # Families | % Families |
| Less than $10,000 | 6 | 18.2% |
| $10,000 to $14,999 | 0 | 0.0% |
| $15,000 to $24,999 | 0 | 0.0% |
| $25,000 to $34,999 | 0 | 0.0% |
| $35,000 to $49,999 | 0 | 0.0% |
| $50,000 to $74,999 | 6 | 18.2% |
| $75,000 to $99,999 | 21 | 63.6% |
| $100,000 to $149,999 | 0 | 0.0% |
| $150,000 to $199,999 | 0 | 0.0% |
| $200,000+ | 0 | 0.0% |
Family Income by Famaliy Size in Conway
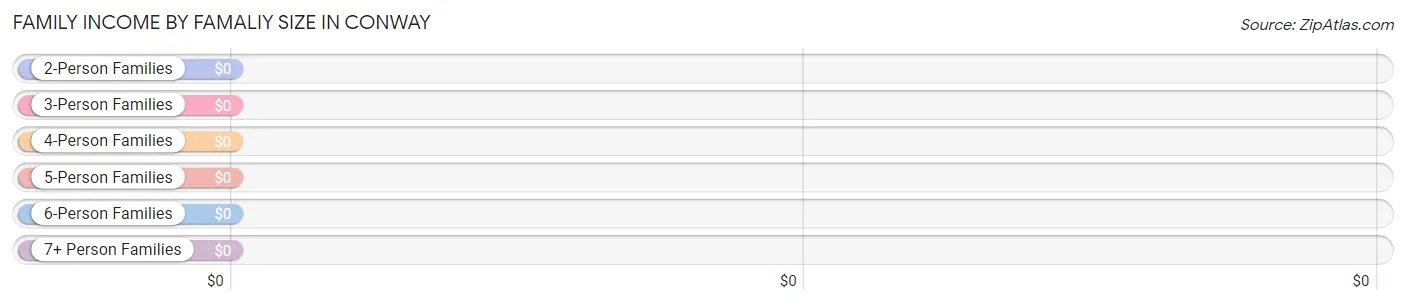
| Income Bracket | # Families | Median Income |
| 2-Person Families | 12 (36.4%) | $0 |
| 3-Person Families | 16 (48.5%) | $0 |
| 4-Person Families | 0 (0.0%) | $0 |
| 5-Person Families | 0 (0.0%) | $0 |
| 6-Person Families | 0 (0.0%) | $0 |
| 7+ Person Families | 5 (15.1%) | $0 |
| Total | 33 (100.0%) | $79,750 |
Family Income by Number of Earners in Conway
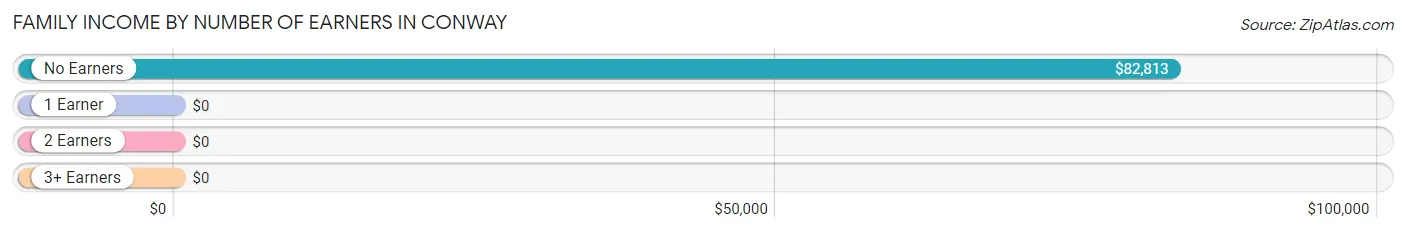
| Number of Earners | # Families | Median Income |
| No Earners | 28 (84.9%) | $82,813 |
| 1 Earner | 5 (15.1%) | $0 |
| 2 Earners | 0 (0.0%) | $0 |
| 3+ Earners | 0 (0.0%) | $0 |
| Total | 33 (100.0%) | $79,750 |
Household Income in Conway
Household Income Brackets in Conway
With 21 households falling in the category, the $75,000 to $99,999 income range is the most frequent in Conway, accounting for 28.0% of all households.
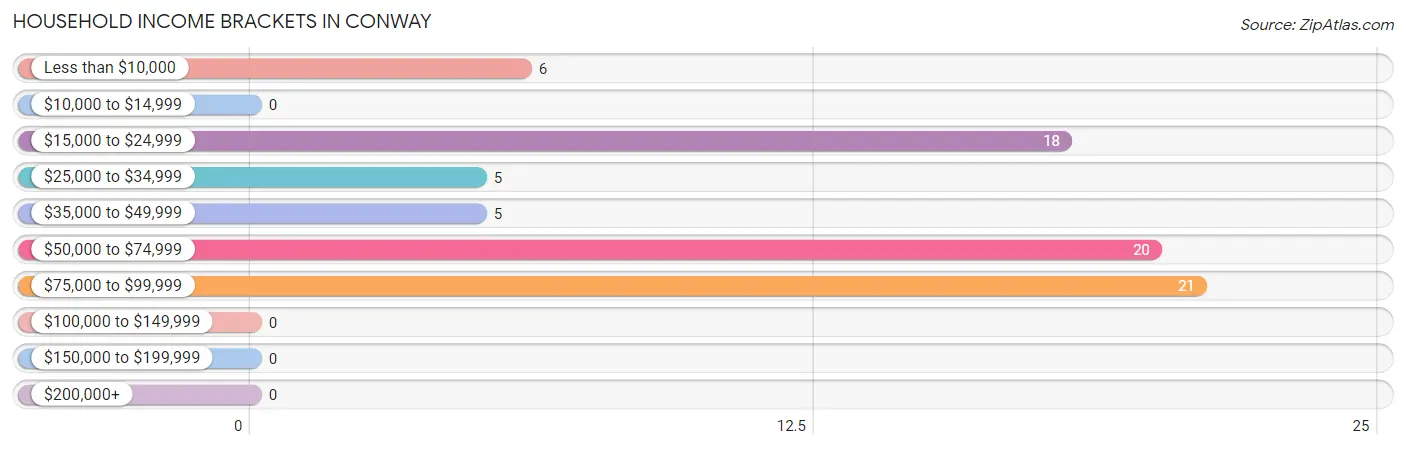
| Income Bracket | # Households | % Households |
| Less than $10,000 | 6 | 8.0% |
| $10,000 to $14,999 | 0 | 0.0% |
| $15,000 to $24,999 | 18 | 24.0% |
| $25,000 to $34,999 | 5 | 6.7% |
| $35,000 to $49,999 | 5 | 6.7% |
| $50,000 to $74,999 | 20 | 26.7% |
| $75,000 to $99,999 | 21 | 28.0% |
| $100,000 to $149,999 | 0 | 0.0% |
| $150,000 to $199,999 | 0 | 0.0% |
| $200,000+ | 0 | 0.0% |
Household Income by Householder Age in Conway
The median household income in Conway is $56,094, with the highest median household income of $55,313 found in the 65+ years age bracket for the primary householder. A total of 70 households (93.3%) fall into this category.
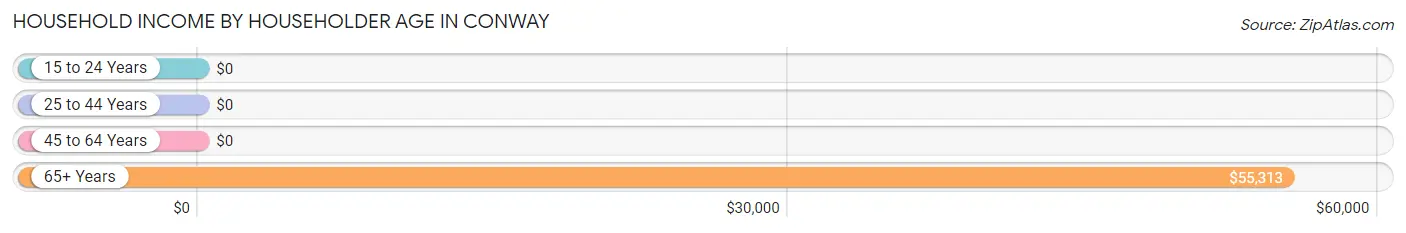
| Income Bracket | # Households | Median Income |
| 15 to 24 Years | 0 (0.0%) | $0 |
| 25 to 44 Years | 5 (6.7%) | $0 |
| 45 to 64 Years | 0 (0.0%) | $0 |
| 65+ Years | 70 (93.3%) | $55,313 |
| Total | 75 (100.0%) | $56,094 |
Poverty in Conway
Income Below Poverty by Sex and Age in Conway
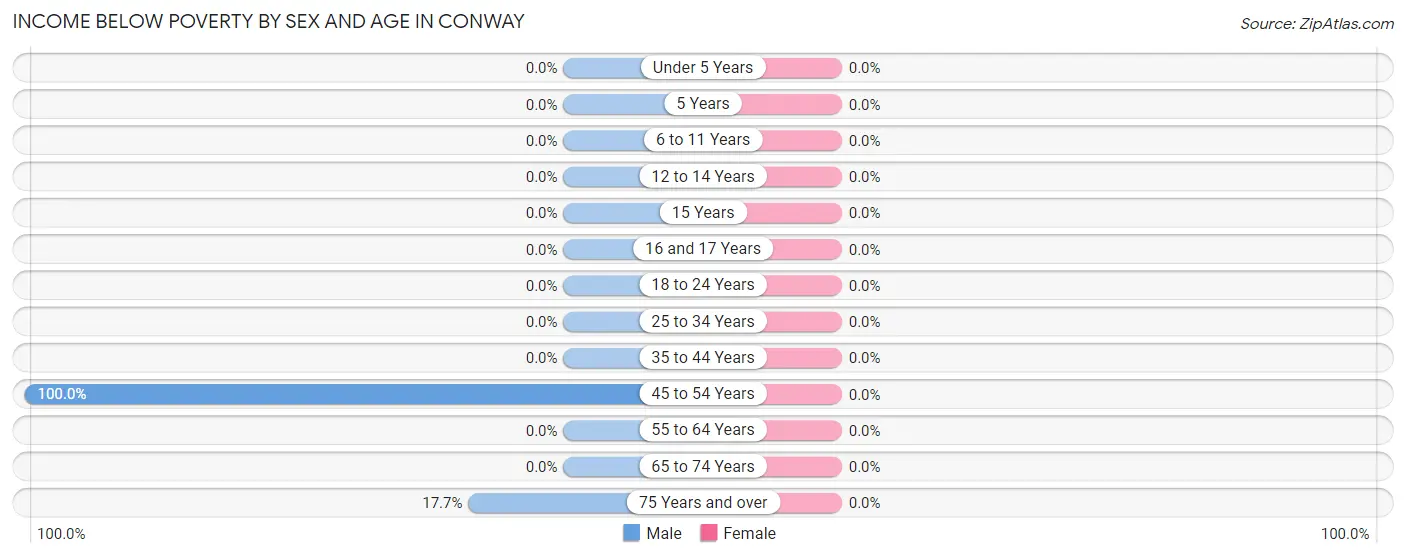
| Age Bracket | Male | Female |
| Under 5 Years | 0 (0.0%) | 0 (0.0%) |
| 5 Years | 0 (0.0%) | 0 (0.0%) |
| 6 to 11 Years | 0 (0.0%) | 0 (0.0%) |
| 12 to 14 Years | 0 (0.0%) | 0 (0.0%) |
| 15 Years | 0 (0.0%) | 0 (0.0%) |
| 16 and 17 Years | 0 (0.0%) | 0 (0.0%) |
| 18 to 24 Years | 0 (0.0%) | 0 (0.0%) |
| 25 to 34 Years | 0 (0.0%) | 0 (0.0%) |
| 35 to 44 Years | 0 (0.0%) | 0 (0.0%) |
| 45 to 54 Years | 7 (100.0%) | 0 (0.0%) |
| 55 to 64 Years | 0 (0.0%) | 0 (0.0%) |
| 65 to 74 Years | 0 (0.0%) | 0 (0.0%) |
| 75 Years and over | 6 (17.6%) | 0 (0.0%) |
| Total | 13 (26.0%) | 0 (0.0%) |
Income Above Poverty by Sex and Age in Conway
According to the poverty statistics in Conway, males aged 25 to 34 years and females aged under 5 years are the age groups that are most secure financially, with 100.0% of males and 100.0% of females in these age groups living above the poverty line.
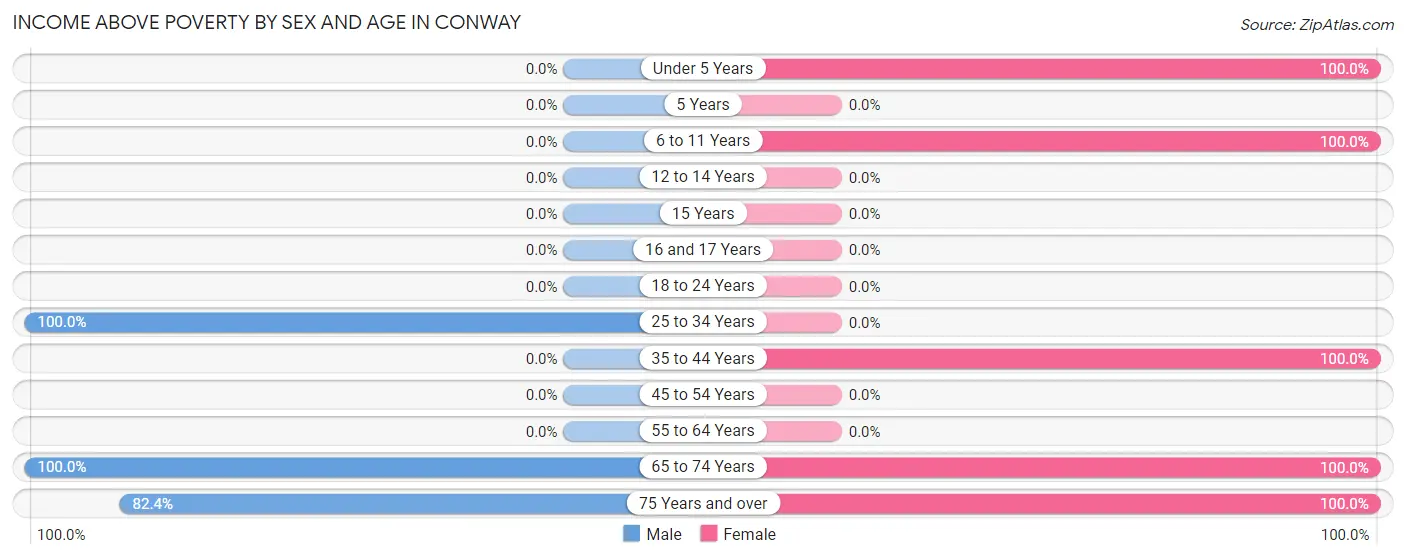
| Age Bracket | Male | Female |
| Under 5 Years | 0 (0.0%) | 16 (100.0%) |
| 5 Years | 0 (0.0%) | 0 (0.0%) |
| 6 to 11 Years | 0 (0.0%) | 18 (100.0%) |
| 12 to 14 Years | 0 (0.0%) | 0 (0.0%) |
| 15 Years | 0 (0.0%) | 0 (0.0%) |
| 16 and 17 Years | 0 (0.0%) | 0 (0.0%) |
| 18 to 24 Years | 0 (0.0%) | 0 (0.0%) |
| 25 to 34 Years | 5 (100.0%) | 0 (0.0%) |
| 35 to 44 Years | 0 (0.0%) | 5 (100.0%) |
| 45 to 54 Years | 0 (0.0%) | 0 (0.0%) |
| 55 to 64 Years | 0 (0.0%) | 0 (0.0%) |
| 65 to 74 Years | 4 (100.0%) | 24 (100.0%) |
| 75 Years and over | 28 (82.4%) | 36 (100.0%) |
| Total | 37 (74.0%) | 99 (100.0%) |
Income Below Poverty Among Married-Couple Families in Conway
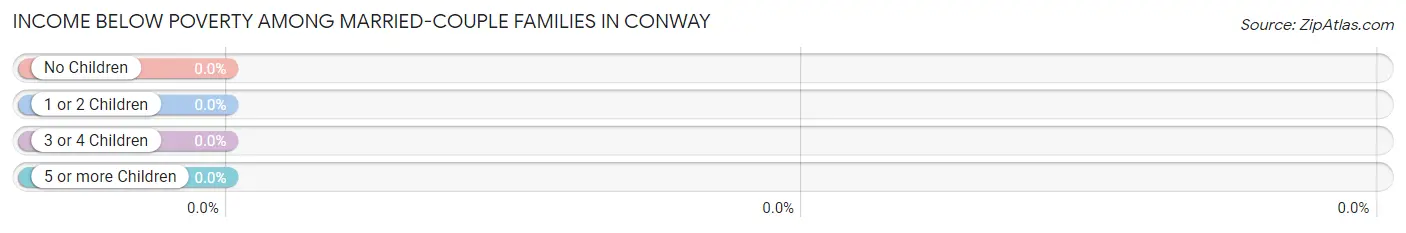
| Children | Above Poverty | Below Poverty |
| No Children | 22 (100.0%) | 0 (0.0%) |
| 1 or 2 Children | 0 (0.0%) | 0 (0.0%) |
| 3 or 4 Children | 0 (0.0%) | 0 (0.0%) |
| 5 or more Children | 5 (100.0%) | 0 (0.0%) |
| Total | 27 (100.0%) | 0 (0.0%) |
Income Below Poverty Among Single-Parent Households in Conway
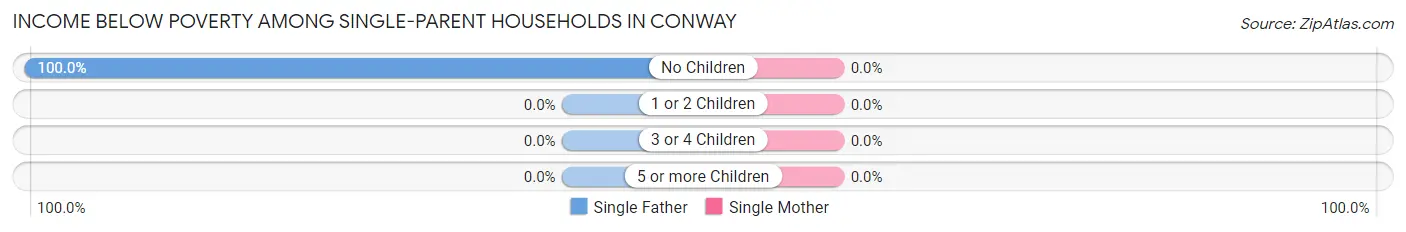
| Children | Single Father | Single Mother |
| No Children | 6 (100.0%) | 0 (0.0%) |
| 1 or 2 Children | 0 (0.0%) | 0 (0.0%) |
| 3 or 4 Children | 0 (0.0%) | 0 (0.0%) |
| 5 or more Children | 0 (0.0%) | 0 (0.0%) |
| Total | 6 (100.0%) | 0 (0.0%) |
Income Below Poverty Among Married-Couple vs Single-Parent Households in Conway
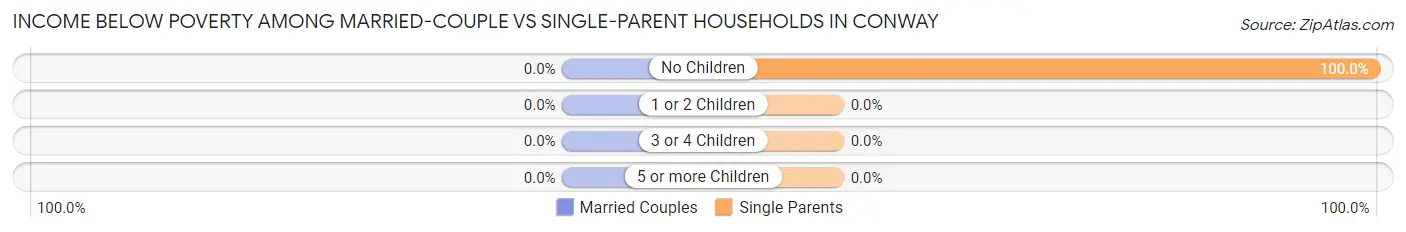
| Children | Married-Couple Families | Single-Parent Households |
| No Children | 0 (0.0%) | 6 (100.0%) |
| 1 or 2 Children | 0 (0.0%) | 0 (0.0%) |
| 3 or 4 Children | 0 (0.0%) | 0 (0.0%) |
| 5 or more Children | 0 (0.0%) | 0 (0.0%) |
| Total | 0 (0.0%) | 6 (100.0%) |
Race in Conway
The most populous races in Conway are , and White / Caucasian (149 | 100.0%).
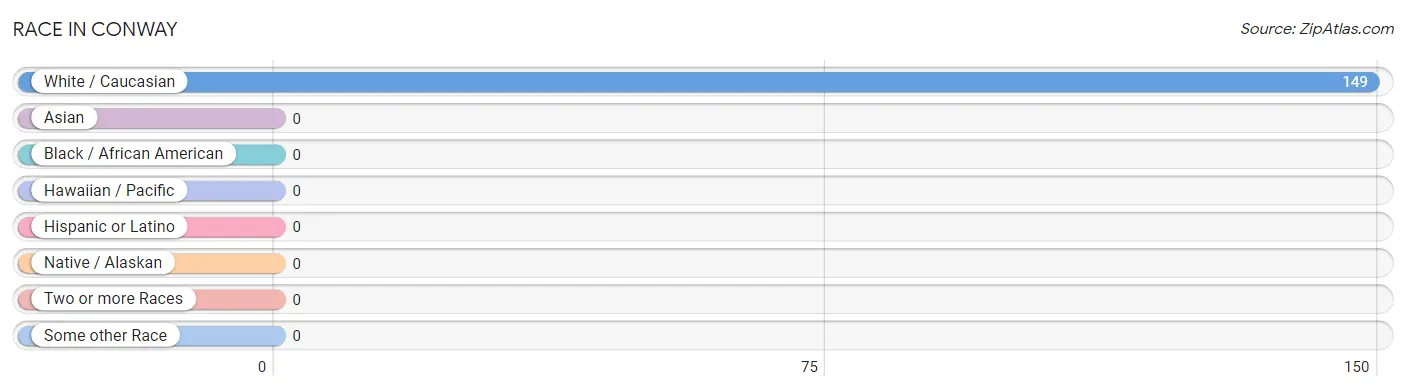
| Race | # Population | % Population |
| Asian | 0 | 0.0% |
| Black / African American | 0 | 0.0% |
| Hawaiian / Pacific | 0 | 0.0% |
| Hispanic or Latino | 0 | 0.0% |
| Native / Alaskan | 0 | 0.0% |
| White / Caucasian | 149 | 100.0% |
| Two or more Races | 0 | 0.0% |
| Some other Race | 0 | 0.0% |
| Total | 149 | 100.0% |
Ancestry in Conway
The most populous ancestries reported in Conway are German (71 | 47.6%), Swedish (46 | 30.9%), English (34 | 22.8%), Dutch (11 | 7.4%), and Scottish (8 | 5.4%), together accounting for 114.1% of all Conway residents.
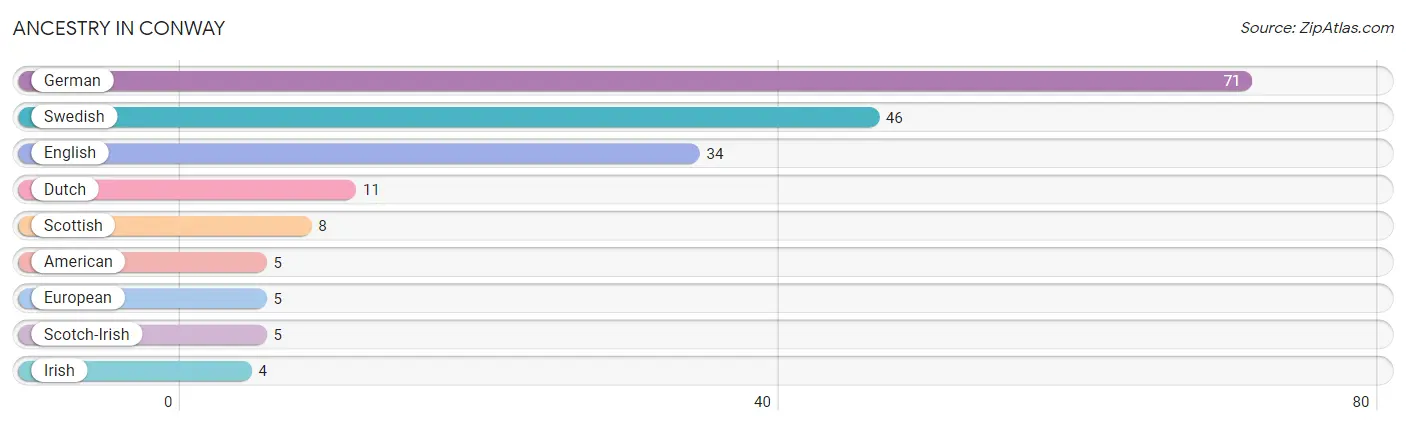
| Ancestry | # Population | % Population |
| American | 5 | 3.4% |
| Dutch | 11 | 7.4% |
| English | 34 | 22.8% |
| European | 5 | 3.4% |
| German | 71 | 47.6% |
| Irish | 4 | 2.7% |
| Scotch-Irish | 5 | 3.4% |
| Scottish | 8 | 5.4% |
| Swedish | 46 | 30.9% | View All 9 Rows |
Immigrants in Conway

| Immigration Origin | # Population | % Population | View All 0 Rows |
Sex and Age in Conway
Sex and Age in Conway
The most populous age groups in Conway are 75 to 79 Years (34 | 68.0%) for men and 75 to 79 Years (36 | 36.4%) for women.
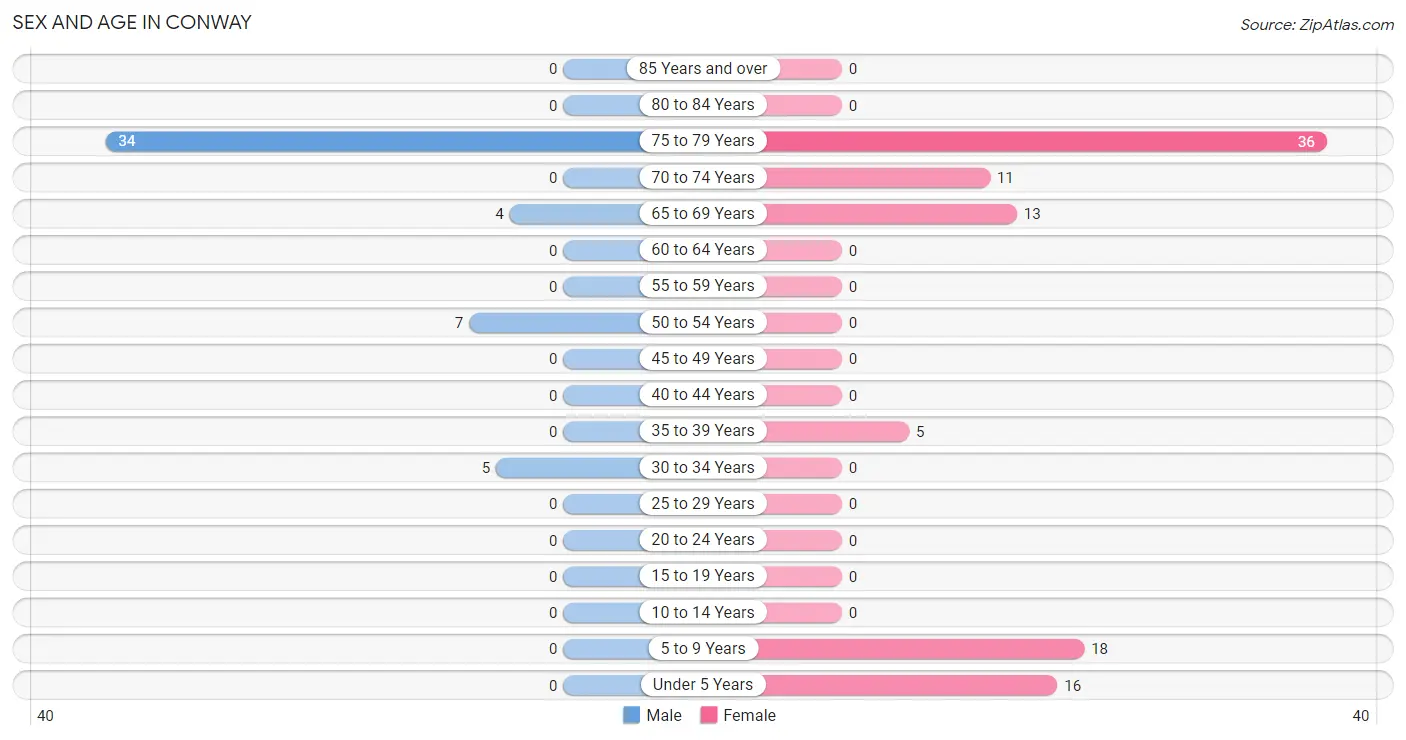
| Age Bracket | Male | Female |
| Under 5 Years | 0 (0.0%) | 16 (16.2%) |
| 5 to 9 Years | 0 (0.0%) | 18 (18.2%) |
| 10 to 14 Years | 0 (0.0%) | 0 (0.0%) |
| 15 to 19 Years | 0 (0.0%) | 0 (0.0%) |
| 20 to 24 Years | 0 (0.0%) | 0 (0.0%) |
| 25 to 29 Years | 0 (0.0%) | 0 (0.0%) |
| 30 to 34 Years | 5 (10.0%) | 0 (0.0%) |
| 35 to 39 Years | 0 (0.0%) | 5 (5.1%) |
| 40 to 44 Years | 0 (0.0%) | 0 (0.0%) |
| 45 to 49 Years | 0 (0.0%) | 0 (0.0%) |
| 50 to 54 Years | 7 (14.0%) | 0 (0.0%) |
| 55 to 59 Years | 0 (0.0%) | 0 (0.0%) |
| 60 to 64 Years | 0 (0.0%) | 0 (0.0%) |
| 65 to 69 Years | 4 (8.0%) | 13 (13.1%) |
| 70 to 74 Years | 0 (0.0%) | 11 (11.1%) |
| 75 to 79 Years | 34 (68.0%) | 36 (36.4%) |
| 80 to 84 Years | 0 (0.0%) | 0 (0.0%) |
| 85 Years and over | 0 (0.0%) | 0 (0.0%) |
| Total | 50 (100.0%) | 99 (100.0%) |
Families and Households in Conway
Median Family Size in Conway
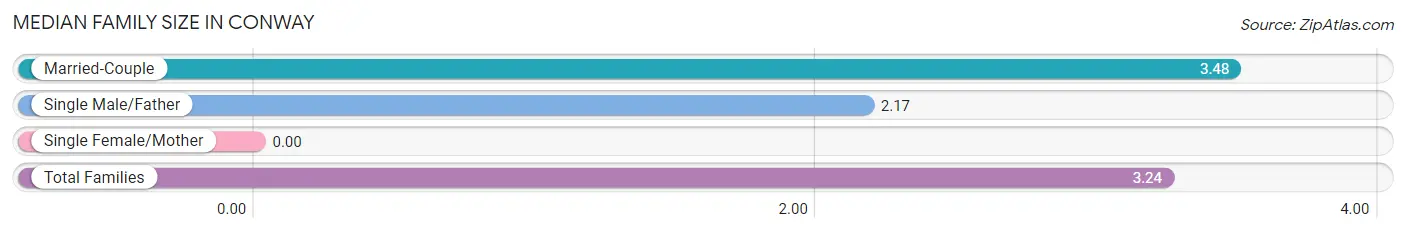
| Family Type | # Families | Family Size |
| Married-Couple | 27 (81.8%) | 3.48 |
| Single Male/Father | 6 (18.2%) | 2.17 |
| Single Female/Mother | 0 (0.0%) | - |
| Total Families | 33 (100.0%) | 3.24 |
Median Household Size in Conway
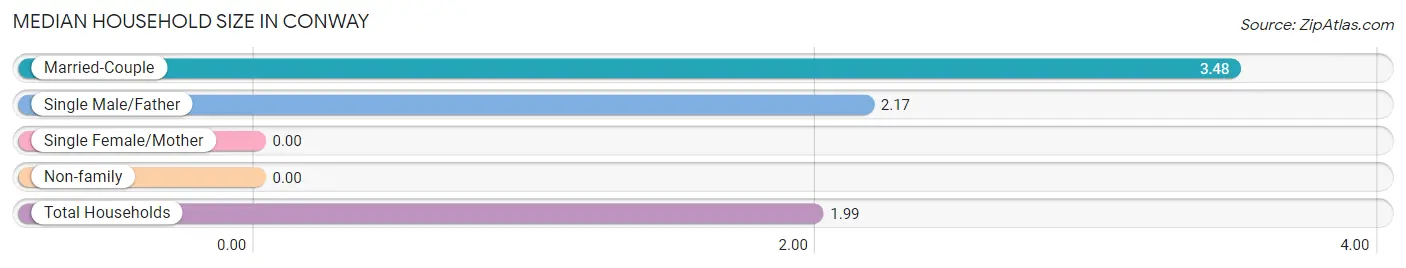
| Household Type | # Households | Household Size |
| Married-Couple | 27 (36.0%) | 3.48 |
| Single Male/Father | 6 (8.0%) | 2.17 |
| Single Female/Mother | 0 (0.0%) | - |
| Non-family | 42 (56.0%) | - |
| Total Households | 75 (100.0%) | 1.99 |
Household Size by Marriage Status in Conway
Out of a total of 75 households in Conway, 33 (44.0%) are family households, while 42 (56.0%) are nonfamily households. The most numerous type of family households are 3-person households, comprising 16, and the most common type of nonfamily households are 1-person households, comprising 42.
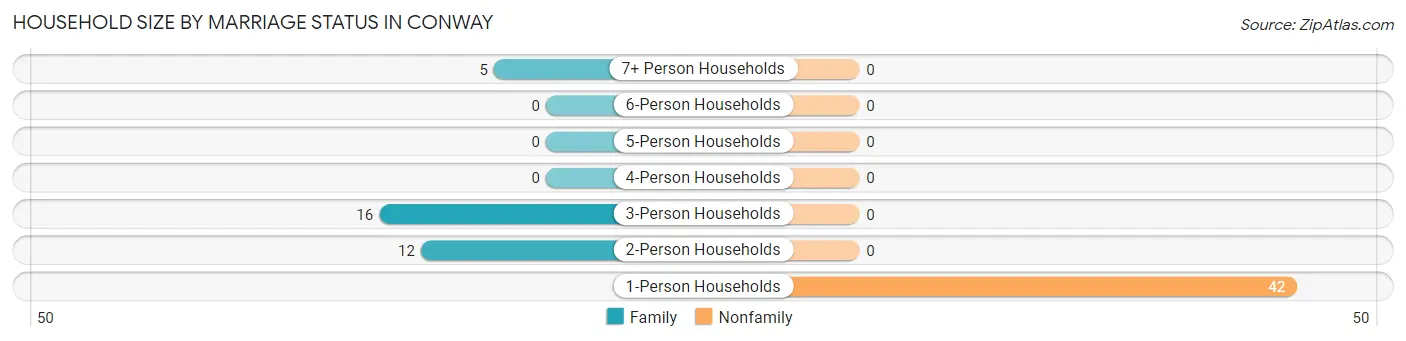
| Household Size | Family Households | Nonfamily Households |
| 1-Person Households | - | 42 (56.0%) |
| 2-Person Households | 12 (16.0%) | 0 (0.0%) |
| 3-Person Households | 16 (21.3%) | 0 (0.0%) |
| 4-Person Households | 0 (0.0%) | 0 (0.0%) |
| 5-Person Households | 0 (0.0%) | 0 (0.0%) |
| 6-Person Households | 0 (0.0%) | 0 (0.0%) |
| 7+ Person Households | 5 (6.7%) | 0 (0.0%) |
| Total | 33 (44.0%) | 42 (56.0%) |
Female Fertility in Conway
Fertility by Age in Conway
| Age Bracket | Women with Births | Births / 1,000 Women |
| 15 to 19 years | 0 (0.0%) | 0.0 |
| 20 to 34 years | 0 (0.0%) | 0.0 |
| 35 to 50 years | 0 (0.0%) | 0.0 |
| Total | 0 (0.0%) | 0.0 |
Fertility by Age by Marriage Status in Conway
| Age Bracket | Married | Unmarried |
| 15 to 19 years | 0 (0.0%) | 0 (0.0%) |
| 20 to 34 years | 0 (0.0%) | 0 (0.0%) |
| 35 to 50 years | 0 (0.0%) | 0 (0.0%) |
| Total | 0 (0.0%) | 0 (0.0%) |
Fertility by Education in Conway
| Educational Attainment | Women with Births | Births / 1,000 Women |
| Less than High School | 0 (0.0%) | 0.0 |
| High School Diploma | 0 (0.0%) | 0.0 |
| College or Associate's Degree | 0 (0.0%) | 0.0 |
| Bachelor's Degree | 0 (0.0%) | 0.0 |
| Graduate Degree | 0 (0.0%) | 0.0 |
| Total | 0 (0.0%) | 0.0 |
Fertility by Education by Marriage Status in Conway
| Educational Attainment | Married | Unmarried |
| Less than High School | 0 (0.0%) | 0 (0.0%) |
| High School Diploma | 0 (0.0%) | 0 (0.0%) |
| College or Associate's Degree | 0 (0.0%) | 0 (0.0%) |
| Bachelor's Degree | 0 (0.0%) | 0 (0.0%) |
| Graduate Degree | 0 (0.0%) | 0 (0.0%) |
| Total | 0 (0.0%) | 0 (0.0%) |
Employment Characteristics in Conway
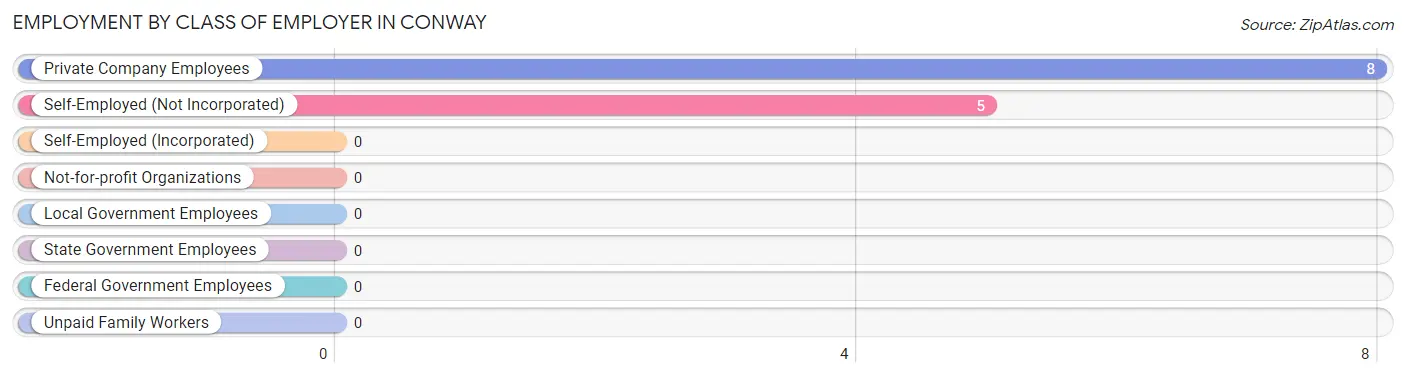
Employment by Class of Employer in Conway
Among the 13 employed individuals in Conway, private company employees (8 | 61.5%), and self-employed (not incorporated) (5 | 38.5%) make up the most common classes of employment.
| Employer Class | # Employees | % Employees |
| Private Company Employees | 8 | 61.5% |
| Self-Employed (Incorporated) | 0 | 0.0% |
| Self-Employed (Not Incorporated) | 5 | 38.5% |
| Not-for-profit Organizations | 0 | 0.0% |
| Local Government Employees | 0 | 0.0% |
| State Government Employees | 0 | 0.0% |
| Federal Government Employees | 0 | 0.0% |
| Unpaid Family Workers | 0 | 0.0% |
| Total | 13 | 100.0% |
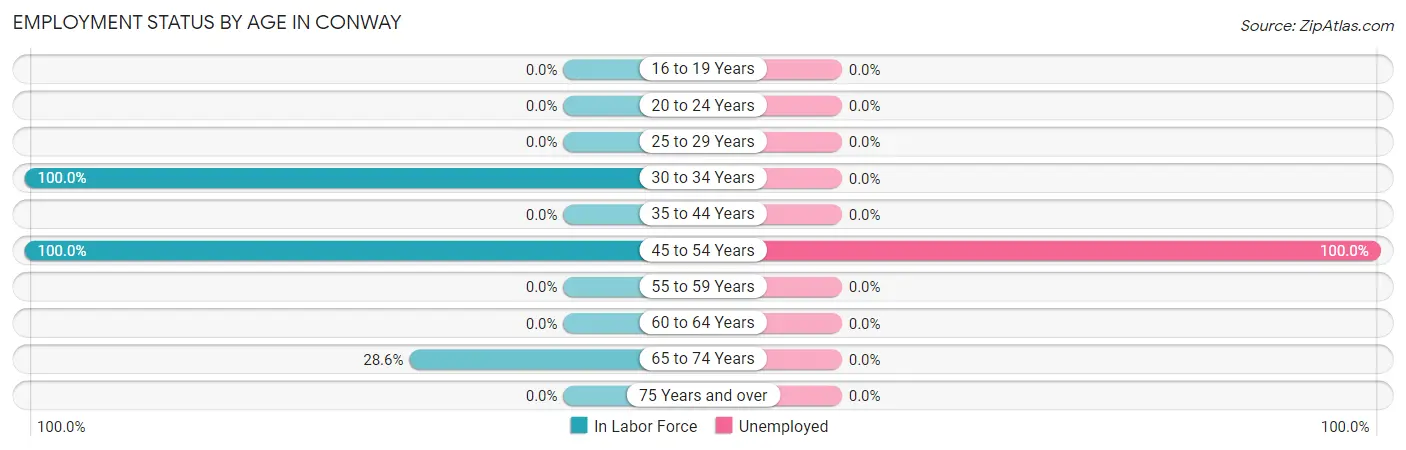
Employment Status by Age in Conway
According to the labor force statistics for Conway, out of the total population over 16 years of age (115), 17.4% or 20 individuals are in the labor force, with 35.0% or 7 of them unemployed. The age group with the highest labor force participation rate is 30 to 34 years, with 100.0% or 5 individuals in the labor force. Within the labor force, the 45 to 54 years age range has the highest percentage of unemployed individuals, with 100.0% or 7 of them being unemployed.
| Age Bracket | In Labor Force | Unemployed |
| 16 to 19 Years | 0 (0.0%) | 0 (0.0%) |
| 20 to 24 Years | 0 (0.0%) | 0 (0.0%) |
| 25 to 29 Years | 0 (0.0%) | 0 (0.0%) |
| 30 to 34 Years | 5 (100.0%) | 0 (0.0%) |
| 35 to 44 Years | 0 (0.0%) | 0 (0.0%) |
| 45 to 54 Years | 7 (100.0%) | 7 (100.0%) |
| 55 to 59 Years | 0 (0.0%) | 0 (0.0%) |
| 60 to 64 Years | 0 (0.0%) | 0 (0.0%) |
| 65 to 74 Years | 8 (28.6%) | 0 (0.0%) |
| 75 Years and over | 0 (0.0%) | 0 (0.0%) |
| Total | 20 (17.4%) | 7 (35.0%) |
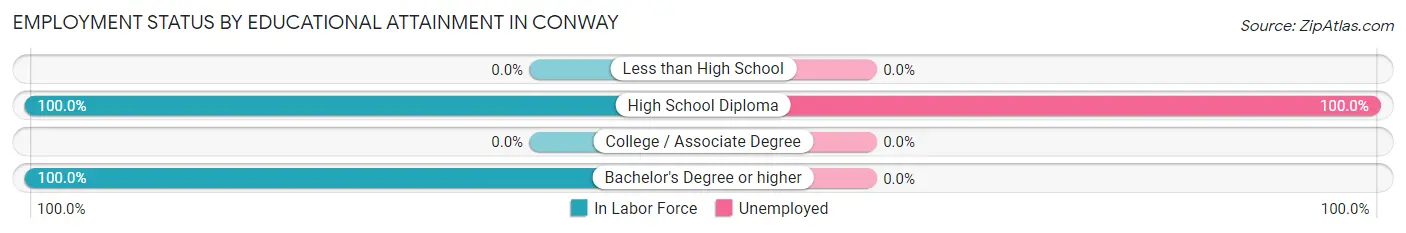
Employment Status by Educational Attainment in Conway
According to labor force statistics for Conway, 70.6% of individuals (12) out of the total population between 25 and 64 years of age (17) are in the labor force, with 58.3% or 7 of them being unemployed. The group with the highest labor force participation rate are those with the educational attainment of high school diploma, with 100.0% or 7 individuals in the labor force. Within the labor force, individuals with high school diploma education have the highest percentage of unemployment, with 100.0% or 7 of them being unemployed.
| Educational Attainment | In Labor Force | Unemployed |
| Less than High School | 0 (0.0%) | 0 (0.0%) |
| High School Diploma | 7 (100.0%) | 7 (100.0%) |
| College / Associate Degree | 0 (0.0%) | 0 (0.0%) |
| Bachelor's Degree or higher | 5 (100.0%) | 0 (0.0%) |
| Total | 12 (70.6%) | 10 (58.3%) |
Employment Occupations by Sex in Conway
Management, Business, Science and Arts Occupations
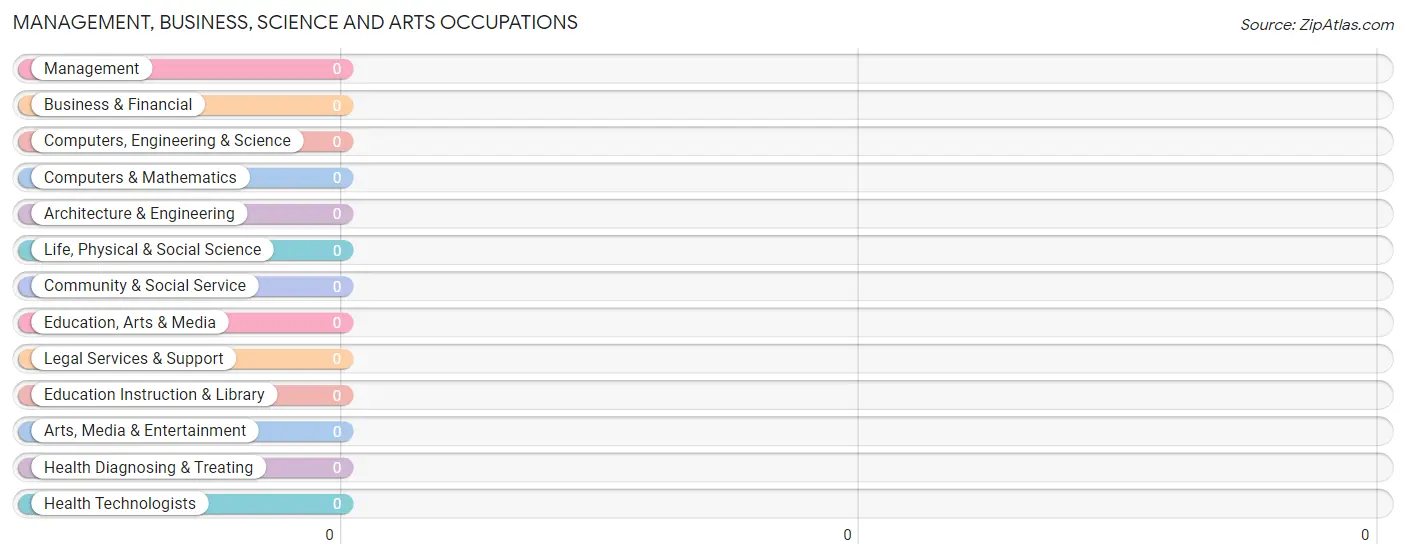
Management, Business, Science and Arts Occupations by Sex
| Occupation | Male | Female |
| Management | 0 (0.0%) | 0 (0.0%) |
| Business & Financial | 0 (0.0%) | 0 (0.0%) |
| Computers, Engineering & Science | 0 (0.0%) | 0 (0.0%) |
| Computers & Mathematics | 0 (0.0%) | 0 (0.0%) |
| Architecture & Engineering | 0 (0.0%) | 0 (0.0%) |
| Life, Physical & Social Science | 0 (0.0%) | 0 (0.0%) |
| Community & Social Service | 0 (0.0%) | 0 (0.0%) |
| Education, Arts & Media | 0 (0.0%) | 0 (0.0%) |
| Legal Services & Support | 0 (0.0%) | 0 (0.0%) |
| Education Instruction & Library | 0 (0.0%) | 0 (0.0%) |
| Arts, Media & Entertainment | 0 (0.0%) | 0 (0.0%) |
| Health Diagnosing & Treating | 0 (0.0%) | 0 (0.0%) |
| Health Technologists | 0 (0.0%) | 0 (0.0%) |
| Total (Category) | 0 (0.0%) | 0 (0.0%) |
| Total (Overall) | 5 (38.5%) | 8 (61.5%) |
Services Occupations
The most common Services occupations in Conway are , and Healthcare Support (8 | 61.5%).
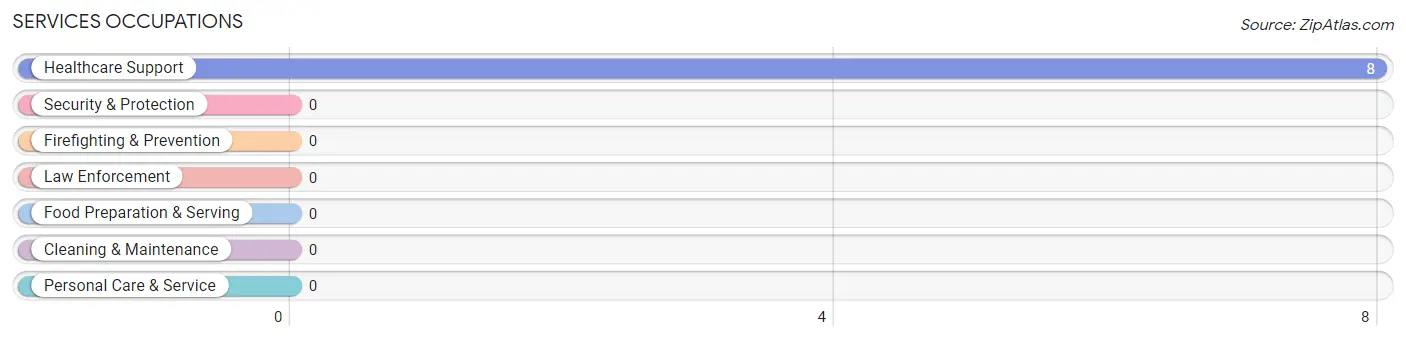
Services Occupations by Sex
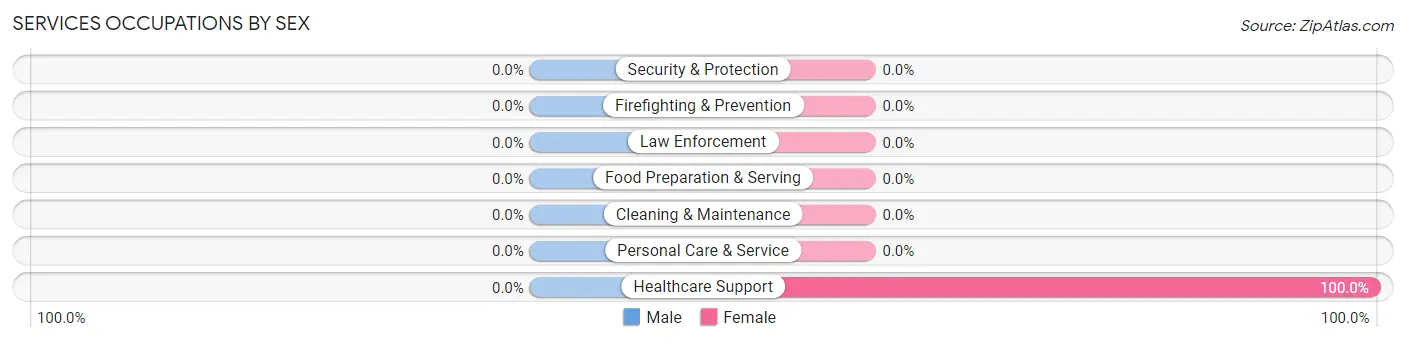
| Occupation | Male | Female |
| Healthcare Support | 0 (0.0%) | 8 (100.0%) |
| Security & Protection | 0 (0.0%) | 0 (0.0%) |
| Firefighting & Prevention | 0 (0.0%) | 0 (0.0%) |
| Law Enforcement | 0 (0.0%) | 0 (0.0%) |
| Food Preparation & Serving | 0 (0.0%) | 0 (0.0%) |
| Cleaning & Maintenance | 0 (0.0%) | 0 (0.0%) |
| Personal Care & Service | 0 (0.0%) | 0 (0.0%) |
| Total (Category) | 0 (0.0%) | 8 (100.0%) |
| Total (Overall) | 5 (38.5%) | 8 (61.5%) |
Sales and Office Occupations

Sales and Office Occupations by Sex

| Occupation | Male | Female |
| Sales & Related | 0 (0.0%) | 0 (0.0%) |
| Office & Administration | 0 (0.0%) | 0 (0.0%) |
| Total (Category) | 0 (0.0%) | 0 (0.0%) |
| Total (Overall) | 5 (38.5%) | 8 (61.5%) |
Natural Resources, Construction and Maintenance Occupations
The most common Natural Resources, Construction and Maintenance occupations in Conway are , and Installation, Maintenance & Repair (5 | 38.5%).
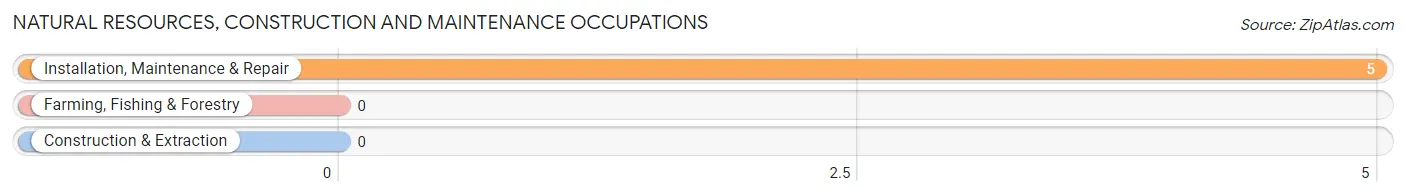
Natural Resources, Construction and Maintenance Occupations by Sex

| Occupation | Male | Female |
| Farming, Fishing & Forestry | 0 (0.0%) | 0 (0.0%) |
| Construction & Extraction | 0 (0.0%) | 0 (0.0%) |
| Installation, Maintenance & Repair | 5 (100.0%) | 0 (0.0%) |
| Total (Category) | 5 (100.0%) | 0 (0.0%) |
| Total (Overall) | 5 (38.5%) | 8 (61.5%) |
Production, Transportation and Moving Occupations
Production, Transportation and Moving Occupations by Sex
| Occupation | Male | Female |
| Production | 0 (0.0%) | 0 (0.0%) |
| Transportation | 0 (0.0%) | 0 (0.0%) |
| Material Moving | 0 (0.0%) | 0 (0.0%) |
| Total (Category) | 0 (0.0%) | 0 (0.0%) |
| Total (Overall) | 5 (38.5%) | 8 (61.5%) |
Employment Industries by Sex in Conway
Employment Industries in Conway
The major employment industries in Conway include , and Health Care & Social Assistance (8 | 61.5%).
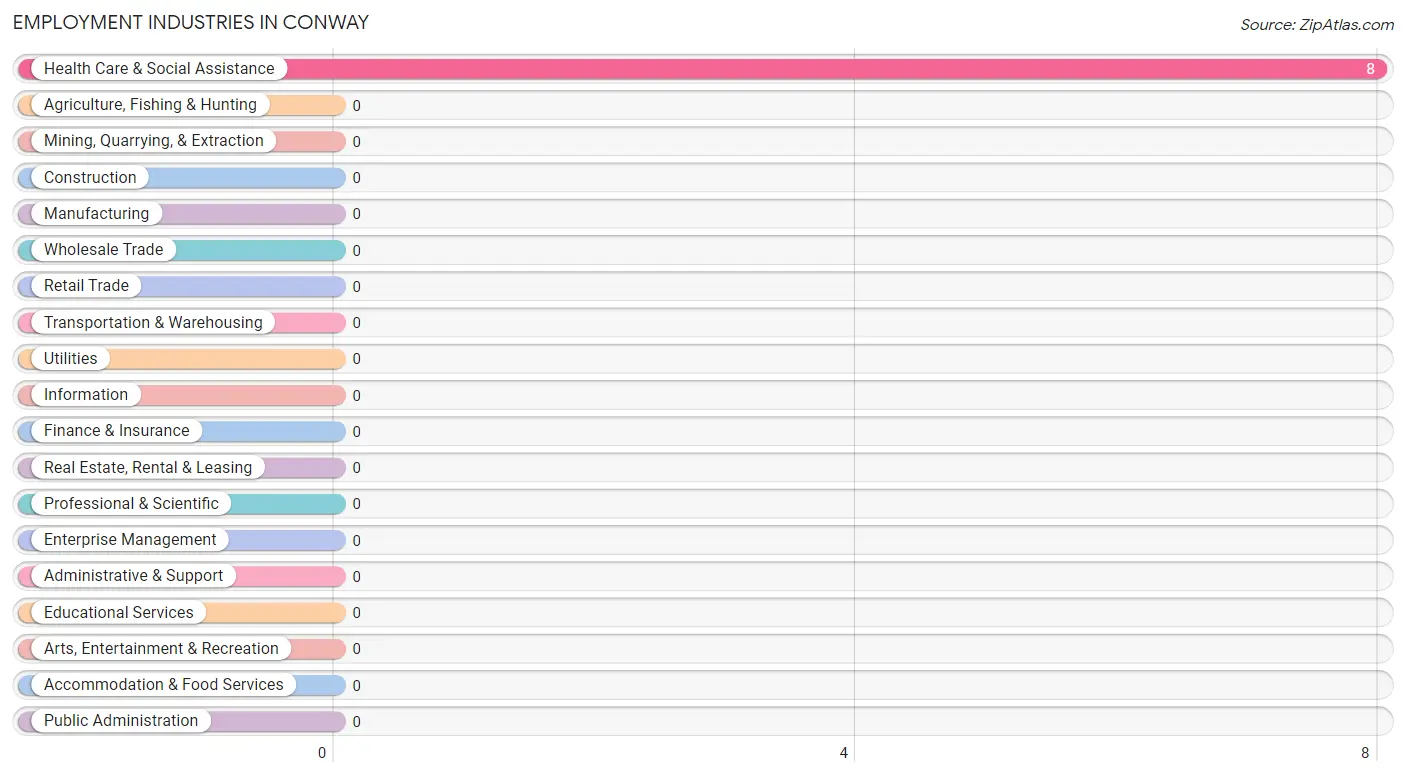
Employment Industries by Sex in Conway
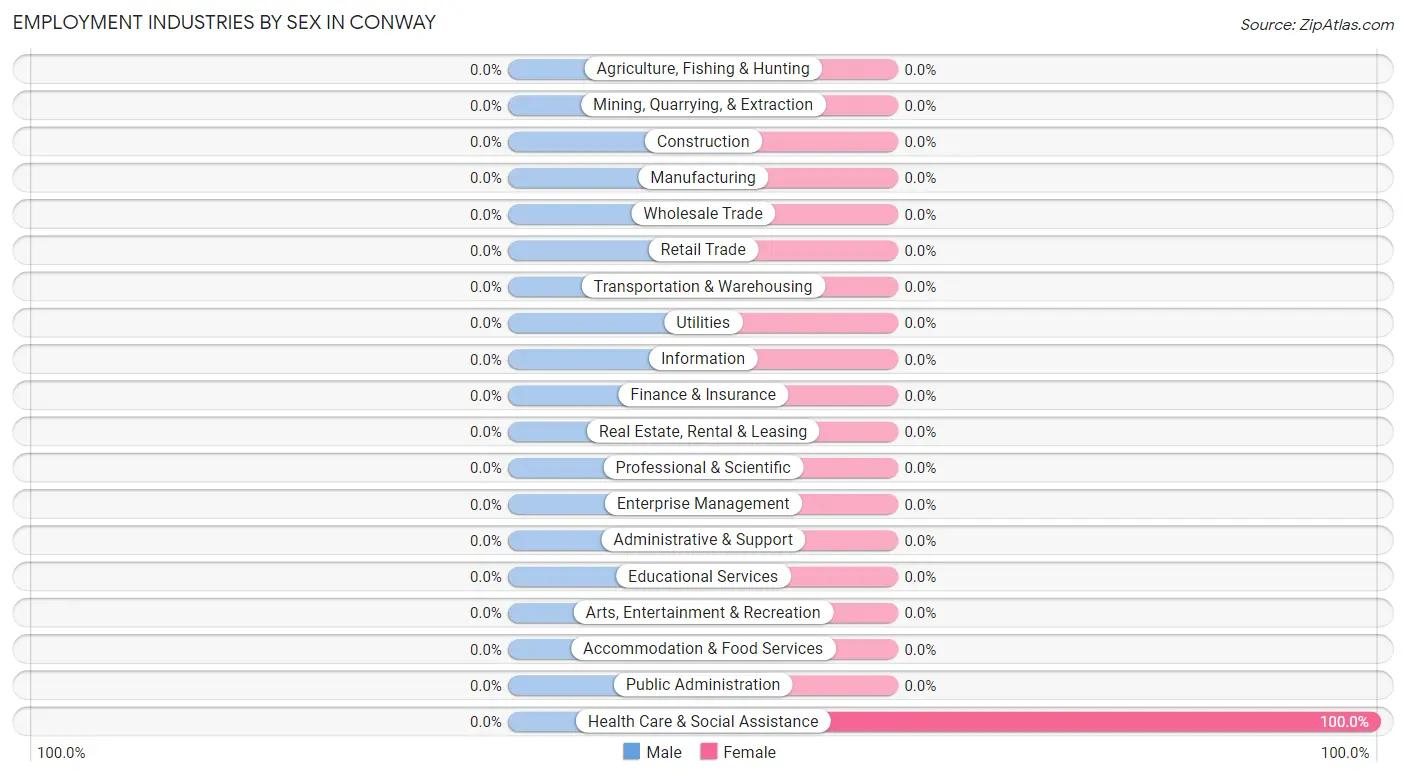
| Industry | Male | Female |
| Agriculture, Fishing & Hunting | 0 (0.0%) | 0 (0.0%) |
| Mining, Quarrying, & Extraction | 0 (0.0%) | 0 (0.0%) |
| Construction | 0 (0.0%) | 0 (0.0%) |
| Manufacturing | 0 (0.0%) | 0 (0.0%) |
| Wholesale Trade | 0 (0.0%) | 0 (0.0%) |
| Retail Trade | 0 (0.0%) | 0 (0.0%) |
| Transportation & Warehousing | 0 (0.0%) | 0 (0.0%) |
| Utilities | 0 (0.0%) | 0 (0.0%) |
| Information | 0 (0.0%) | 0 (0.0%) |
| Finance & Insurance | 0 (0.0%) | 0 (0.0%) |
| Real Estate, Rental & Leasing | 0 (0.0%) | 0 (0.0%) |
| Professional & Scientific | 0 (0.0%) | 0 (0.0%) |
| Enterprise Management | 0 (0.0%) | 0 (0.0%) |
| Administrative & Support | 0 (0.0%) | 0 (0.0%) |
| Educational Services | 0 (0.0%) | 0 (0.0%) |
| Health Care & Social Assistance | 0 (0.0%) | 8 (100.0%) |
| Arts, Entertainment & Recreation | 0 (0.0%) | 0 (0.0%) |
| Accommodation & Food Services | 0 (0.0%) | 0 (0.0%) |
| Public Administration | 0 (0.0%) | 0 (0.0%) |
| Total | 5 (38.5%) | 8 (61.5%) |
Education in Conway
School Enrollment in Conway
The most common levels of schooling among the 44 students in Conway are elementary school (18 | 40.9%), graduate / professional (16 | 36.4%), and nursery / preschool (10 | 22.7%).
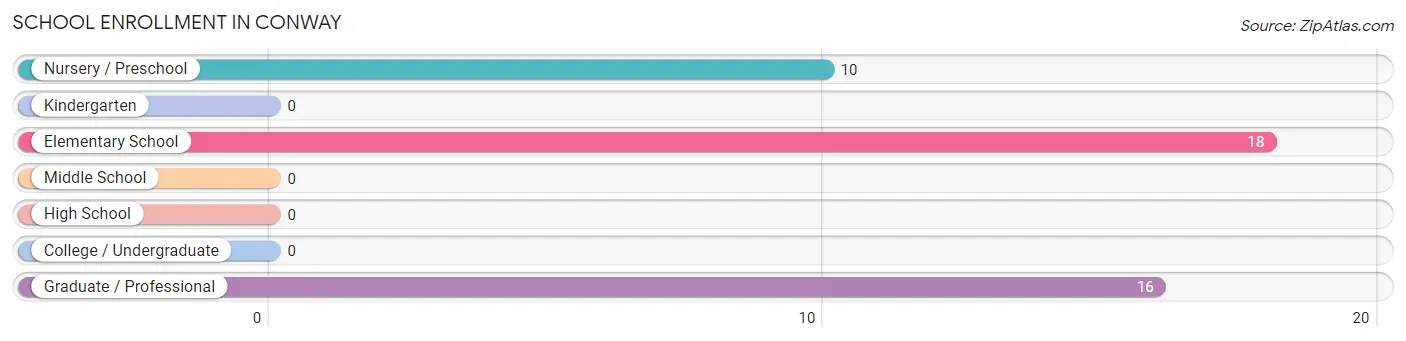
| School Level | # Students | % Students |
| Nursery / Preschool | 10 | 22.7% |
| Kindergarten | 0 | 0.0% |
| Elementary School | 18 | 40.9% |
| Middle School | 0 | 0.0% |
| High School | 0 | 0.0% |
| College / Undergraduate | 0 | 0.0% |
| Graduate / Professional | 16 | 36.4% |
| Total | 44 | 100.0% |
School Enrollment by Age by Funding Source in Conway
Out of a total of 44 students who are enrolled in schools in Conway, 18 (40.9%) attend a private institution, while the remaining 26 (59.1%) are enrolled in public schools. The age group of 5 to 9 year old has the highest likelihood of being enrolled in private schools, with 18 (100.0% in the age bracket) enrolled. Conversely, the age group of 3 to 4 year olds has the lowest likelihood of being enrolled in a private school, with 10 (100.0% in the age bracket) attending a public institution.
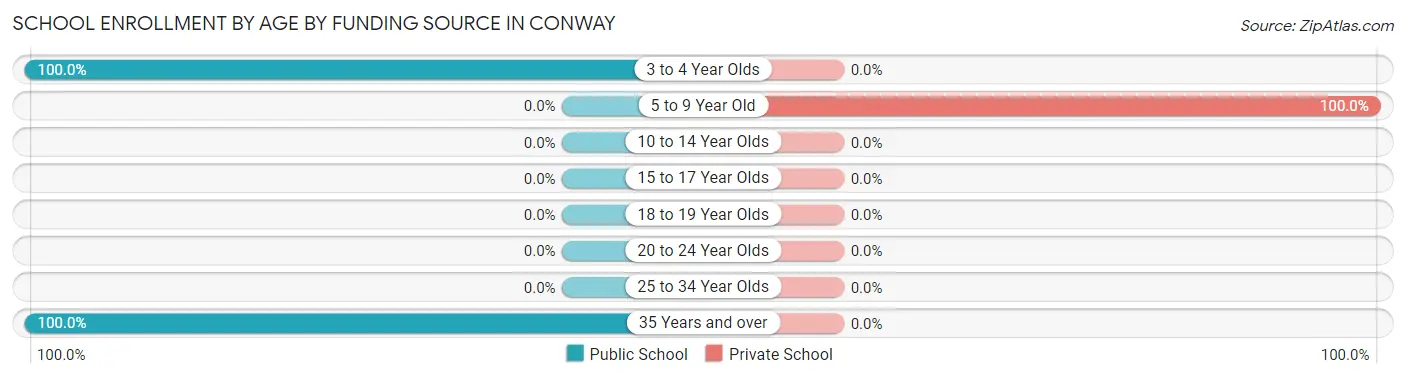
| Age Bracket | Public School | Private School |
| 3 to 4 Year Olds | 10 (100.0%) | 0 (0.0%) |
| 5 to 9 Year Old | 0 (0.0%) | 18 (100.0%) |
| 10 to 14 Year Olds | 0 (0.0%) | 0 (0.0%) |
| 15 to 17 Year Olds | 0 (0.0%) | 0 (0.0%) |
| 18 to 19 Year Olds | 0 (0.0%) | 0 (0.0%) |
| 20 to 24 Year Olds | 0 (0.0%) | 0 (0.0%) |
| 25 to 34 Year Olds | 0 (0.0%) | 0 (0.0%) |
| 35 Years and over | 16 (100.0%) | 0 (0.0%) |
| Total | 26 (59.1%) | 18 (40.9%) |
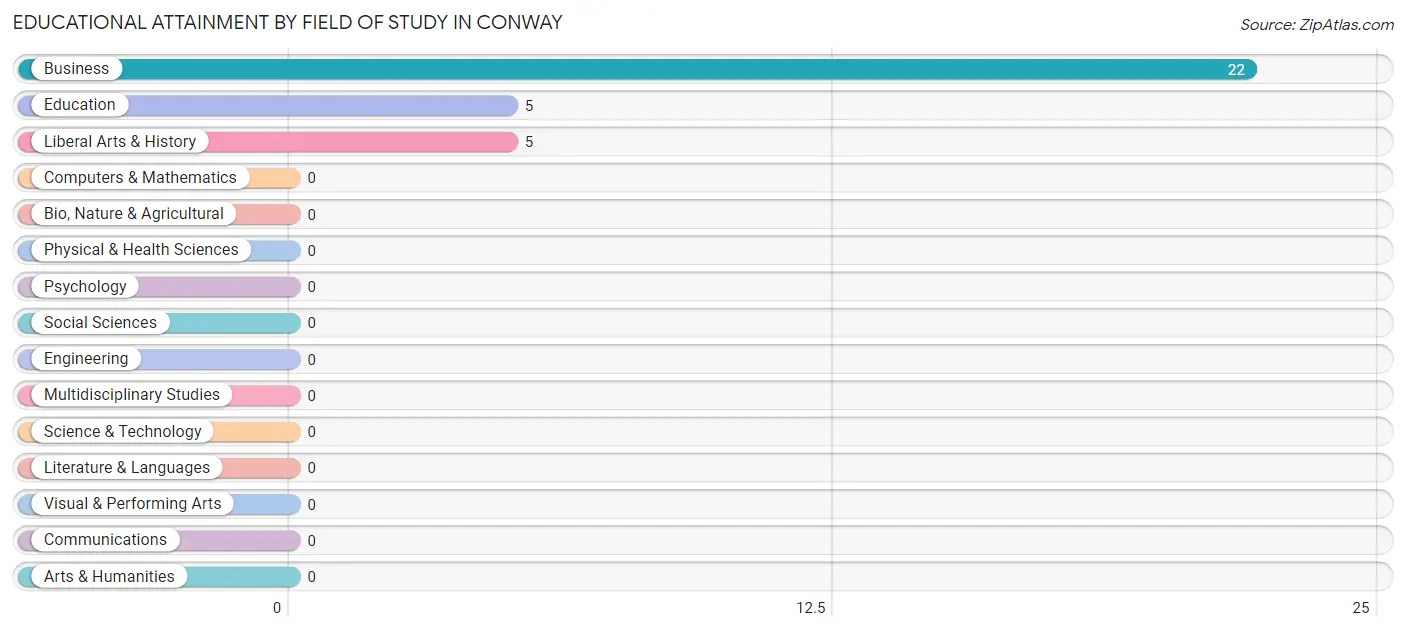
Educational Attainment by Field of Study in Conway
Business (22 | 68.8%), education (5 | 15.6%), and liberal arts & history (5 | 15.6%) are the most common fields of study among 32 individuals in Conway who have obtained a bachelor's degree or higher.
| Field of Study | # Graduates | % Graduates |
| Computers & Mathematics | 0 | 0.0% |
| Bio, Nature & Agricultural | 0 | 0.0% |
| Physical & Health Sciences | 0 | 0.0% |
| Psychology | 0 | 0.0% |
| Social Sciences | 0 | 0.0% |
| Engineering | 0 | 0.0% |
| Multidisciplinary Studies | 0 | 0.0% |
| Science & Technology | 0 | 0.0% |
| Business | 22 | 68.8% |
| Education | 5 | 15.6% |
| Literature & Languages | 0 | 0.0% |
| Liberal Arts & History | 5 | 15.6% |
| Visual & Performing Arts | 0 | 0.0% |
| Communications | 0 | 0.0% |
| Arts & Humanities | 0 | 0.0% |
| Total | 32 | 100.0% |
Transportation & Commute in Conway
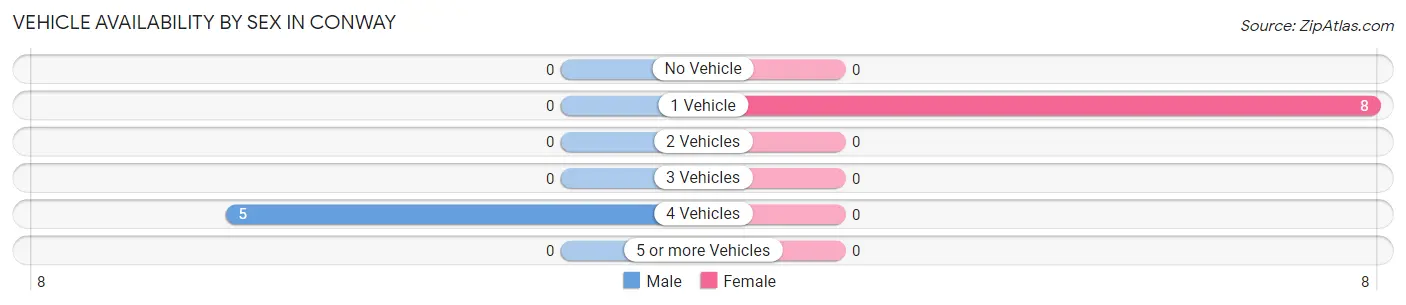
Vehicle Availability by Sex in Conway
The most prevalent vehicle ownership categories in Conway are males with 4 vehicles (5, accounting for 100.0%) and females with 4 vehicles (0, making up 62.5%).
| Vehicles Available | Male | Female |
| No Vehicle | 0 (0.0%) | 0 (0.0%) |
| 1 Vehicle | 0 (0.0%) | 8 (100.0%) |
| 2 Vehicles | 0 (0.0%) | 0 (0.0%) |
| 3 Vehicles | 0 (0.0%) | 0 (0.0%) |
| 4 Vehicles | 5 (100.0%) | 0 (0.0%) |
| 5 or more Vehicles | 0 (0.0%) | 0 (0.0%) |
| Total | 5 (100.0%) | 8 (100.0%) |
Commute Time in Conway
The most frequently occuring commute durations in Conway are 15 to 19 minutes (8 commuters, 61.5%), 10 to 14 minutes (5 commuters, 38.5%), and less than 5 minutes (0 commuters, 0.0%).
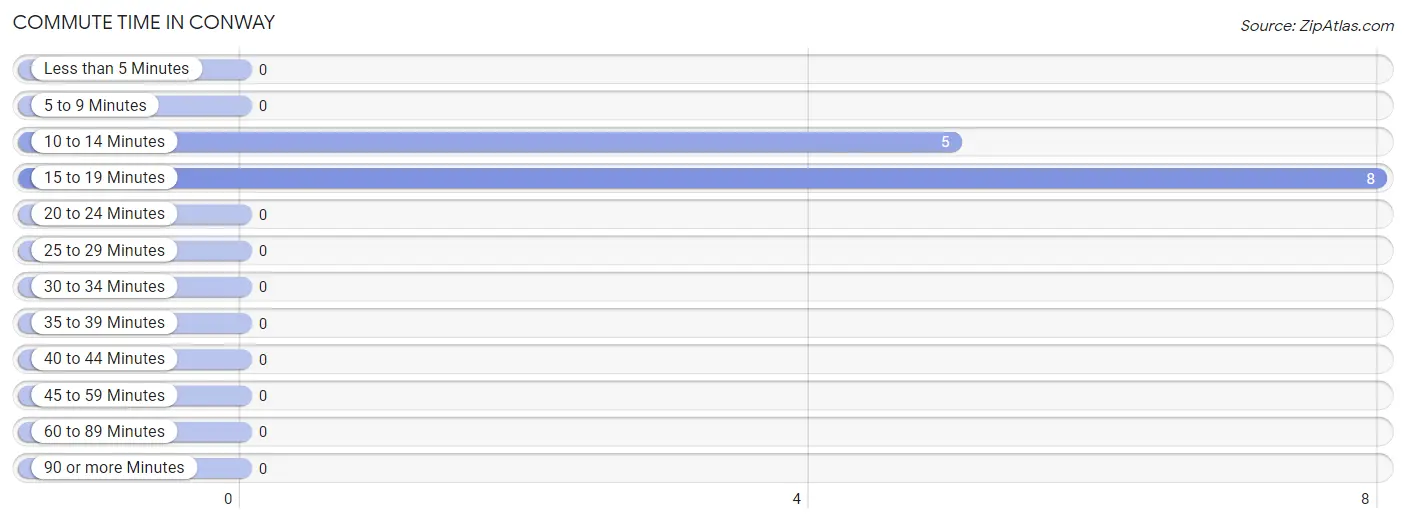
| Commute Time | # Commuters | % Commuters |
| Less than 5 Minutes | 0 | 0.0% |
| 5 to 9 Minutes | 0 | 0.0% |
| 10 to 14 Minutes | 5 | 38.5% |
| 15 to 19 Minutes | 8 | 61.5% |
| 20 to 24 Minutes | 0 | 0.0% |
| 25 to 29 Minutes | 0 | 0.0% |
| 30 to 34 Minutes | 0 | 0.0% |
| 35 to 39 Minutes | 0 | 0.0% |
| 40 to 44 Minutes | 0 | 0.0% |
| 45 to 59 Minutes | 0 | 0.0% |
| 60 to 89 Minutes | 0 | 0.0% |
| 90 or more Minutes | 0 | 0.0% |
Commute Time by Sex in Conway
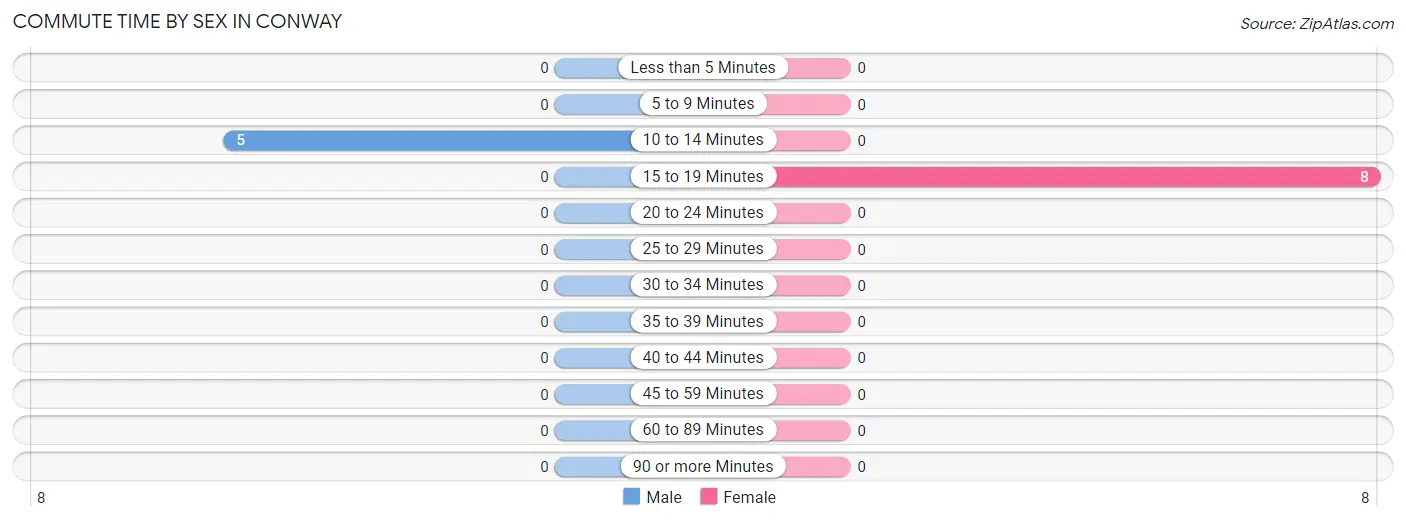
The most common commute times in Conway are 10 to 14 minutes (5 commuters, 100.0%) for males and 15 to 19 minutes (8 commuters, 100.0%) for females.
| Commute Time | Male | Female |
| Less than 5 Minutes | 0 (0.0%) | 0 (0.0%) |
| 5 to 9 Minutes | 0 (0.0%) | 0 (0.0%) |
| 10 to 14 Minutes | 5 (100.0%) | 0 (0.0%) |
| 15 to 19 Minutes | 0 (0.0%) | 8 (100.0%) |
| 20 to 24 Minutes | 0 (0.0%) | 0 (0.0%) |
| 25 to 29 Minutes | 0 (0.0%) | 0 (0.0%) |
| 30 to 34 Minutes | 0 (0.0%) | 0 (0.0%) |
| 35 to 39 Minutes | 0 (0.0%) | 0 (0.0%) |
| 40 to 44 Minutes | 0 (0.0%) | 0 (0.0%) |
| 45 to 59 Minutes | 0 (0.0%) | 0 (0.0%) |
| 60 to 89 Minutes | 0 (0.0%) | 0 (0.0%) |
| 90 or more Minutes | 0 (0.0%) | 0 (0.0%) |
Time of Departure to Work by Sex in Conway
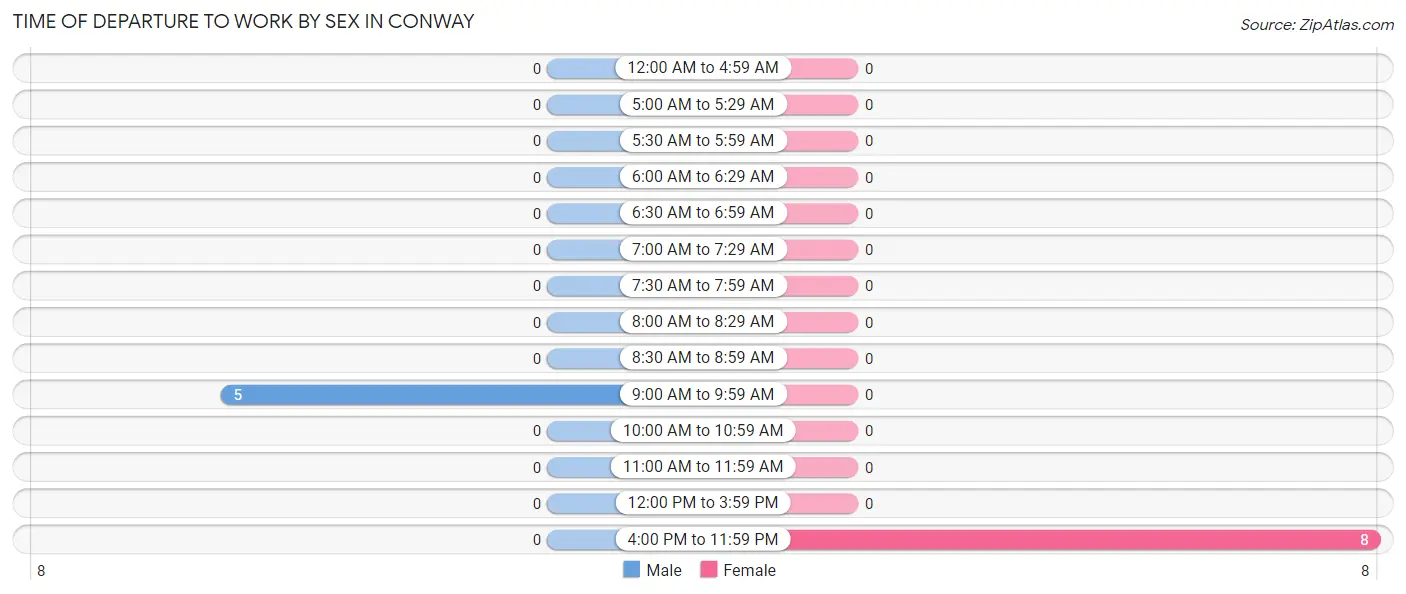
The most frequent times of departure to work in Conway are 9:00 AM to 9:59 AM (5, 100.0%) for males and 4:00 PM to 11:59 PM (8, 100.0%) for females.
| Time of Departure | Male | Female |
| 12:00 AM to 4:59 AM | 0 (0.0%) | 0 (0.0%) |
| 5:00 AM to 5:29 AM | 0 (0.0%) | 0 (0.0%) |
| 5:30 AM to 5:59 AM | 0 (0.0%) | 0 (0.0%) |
| 6:00 AM to 6:29 AM | 0 (0.0%) | 0 (0.0%) |
| 6:30 AM to 6:59 AM | 0 (0.0%) | 0 (0.0%) |
| 7:00 AM to 7:29 AM | 0 (0.0%) | 0 (0.0%) |
| 7:30 AM to 7:59 AM | 0 (0.0%) | 0 (0.0%) |
| 8:00 AM to 8:29 AM | 0 (0.0%) | 0 (0.0%) |
| 8:30 AM to 8:59 AM | 0 (0.0%) | 0 (0.0%) |
| 9:00 AM to 9:59 AM | 5 (100.0%) | 0 (0.0%) |
| 10:00 AM to 10:59 AM | 0 (0.0%) | 0 (0.0%) |
| 11:00 AM to 11:59 AM | 0 (0.0%) | 0 (0.0%) |
| 12:00 PM to 3:59 PM | 0 (0.0%) | 0 (0.0%) |
| 4:00 PM to 11:59 PM | 0 (0.0%) | 8 (100.0%) |
| Total | 5 (100.0%) | 8 (100.0%) |
Housing Occupancy in Conway
Occupancy by Ownership in Conway
Of the total 75 dwellings in Conway, owner-occupied units account for 67 (89.3%), while renter-occupied units make up 8 (10.7%).
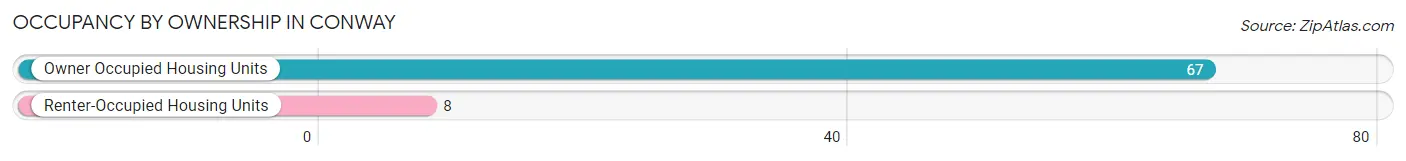
| Occupancy | # Housing Units | % Housing Units |
| Owner Occupied Housing Units | 67 | 89.3% |
| Renter-Occupied Housing Units | 8 | 10.7% |
| Total Occupied Housing Units | 75 | 100.0% |
Occupancy by Household Size in Conway
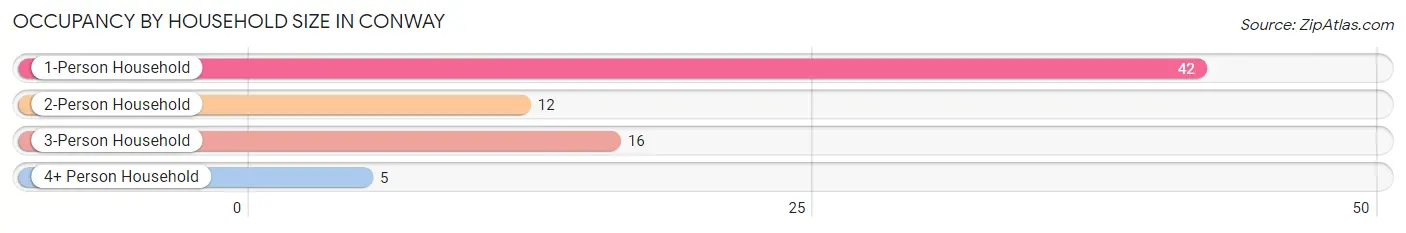
| Household Size | # Housing Units | % Housing Units |
| 1-Person Household | 42 | 56.0% |
| 2-Person Household | 12 | 16.0% |
| 3-Person Household | 16 | 21.3% |
| 4+ Person Household | 5 | 6.7% |
| Total Housing Units | 75 | 100.0% |
Occupancy by Ownership by Household Size in Conway
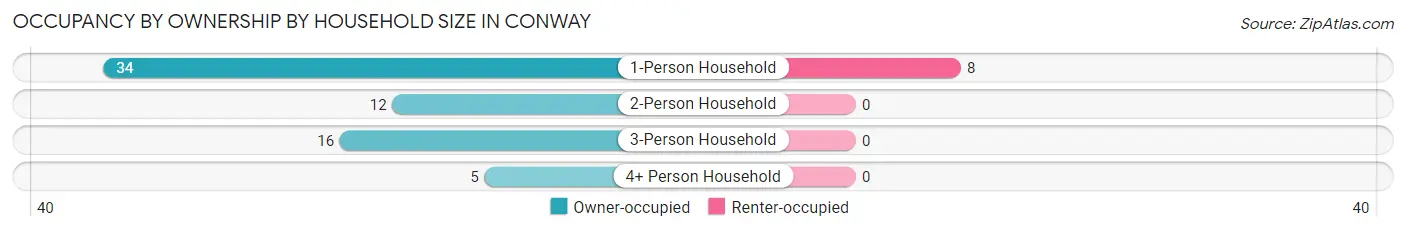
| Household Size | Owner-occupied | Renter-occupied |
| 1-Person Household | 34 (80.9%) | 8 (19.1%) |
| 2-Person Household | 12 (100.0%) | 0 (0.0%) |
| 3-Person Household | 16 (100.0%) | 0 (0.0%) |
| 4+ Person Household | 5 (100.0%) | 0 (0.0%) |
| Total Housing Units | 67 (89.3%) | 8 (10.7%) |
Occupancy by Educational Attainment in Conway
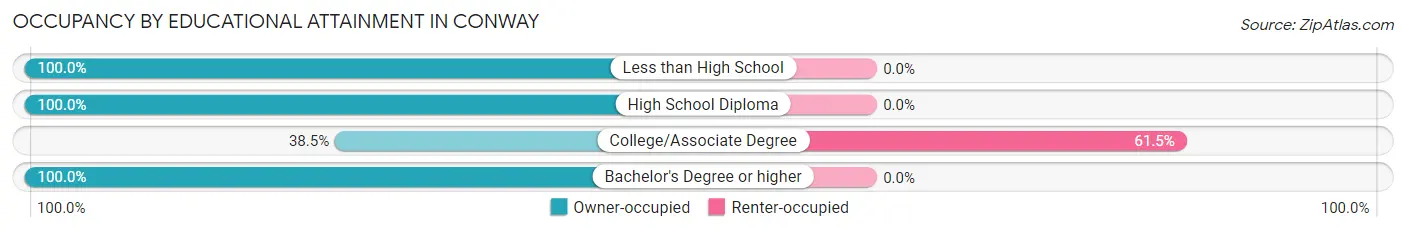
| Household Size | Owner-occupied | Renter-occupied |
| Less than High School | 5 (100.0%) | 0 (0.0%) |
| High School Diploma | 30 (100.0%) | 0 (0.0%) |
| College/Associate Degree | 5 (38.5%) | 8 (61.5%) |
| Bachelor's Degree or higher | 27 (100.0%) | 0 (0.0%) |
Occupancy by Age of Householder in Conway
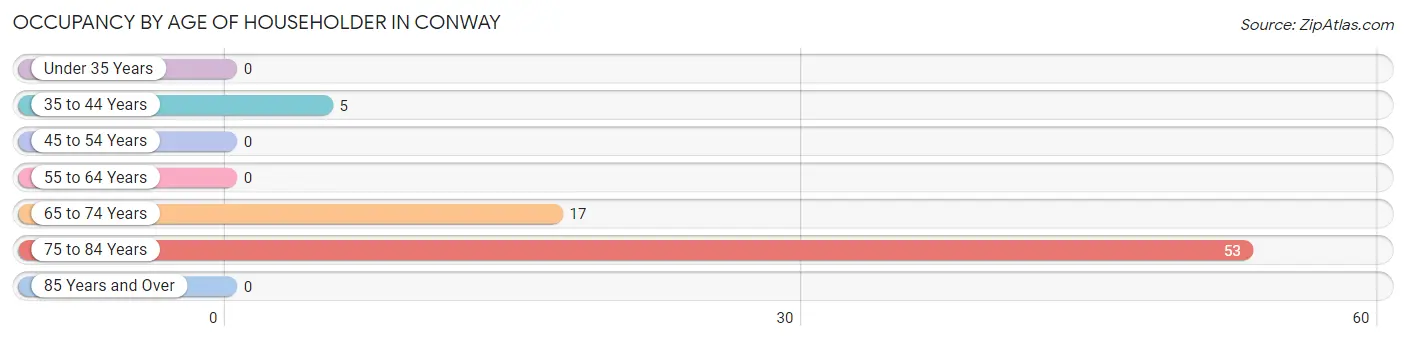
| Age Bracket | # Households | % Households |
| Under 35 Years | 0 | 0.0% |
| 35 to 44 Years | 5 | 6.7% |
| 45 to 54 Years | 0 | 0.0% |
| 55 to 64 Years | 0 | 0.0% |
| 65 to 74 Years | 17 | 22.7% |
| 75 to 84 Years | 53 | 70.7% |
| 85 Years and Over | 0 | 0.0% |
| Total | 75 | 100.0% |
Housing Finances in Conway
Median Income by Occupancy in Conway
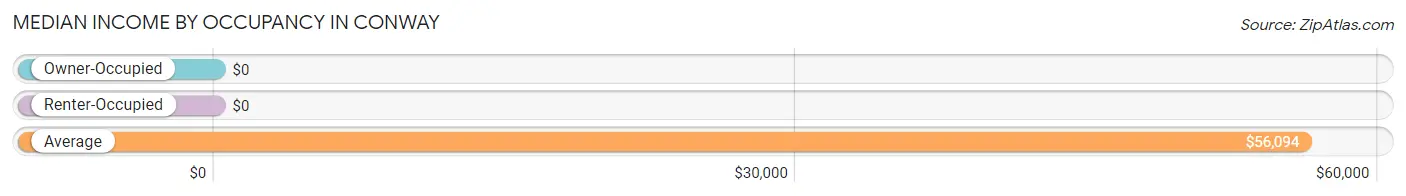
| Occupancy Type | # Households | Median Income |
| Owner-Occupied | 67 (89.3%) | $0 |
| Renter-Occupied | 8 (10.7%) | $0 |
| Average | 75 (100.0%) | $56,094 |
Occupancy by Householder Income Bracket in Conway
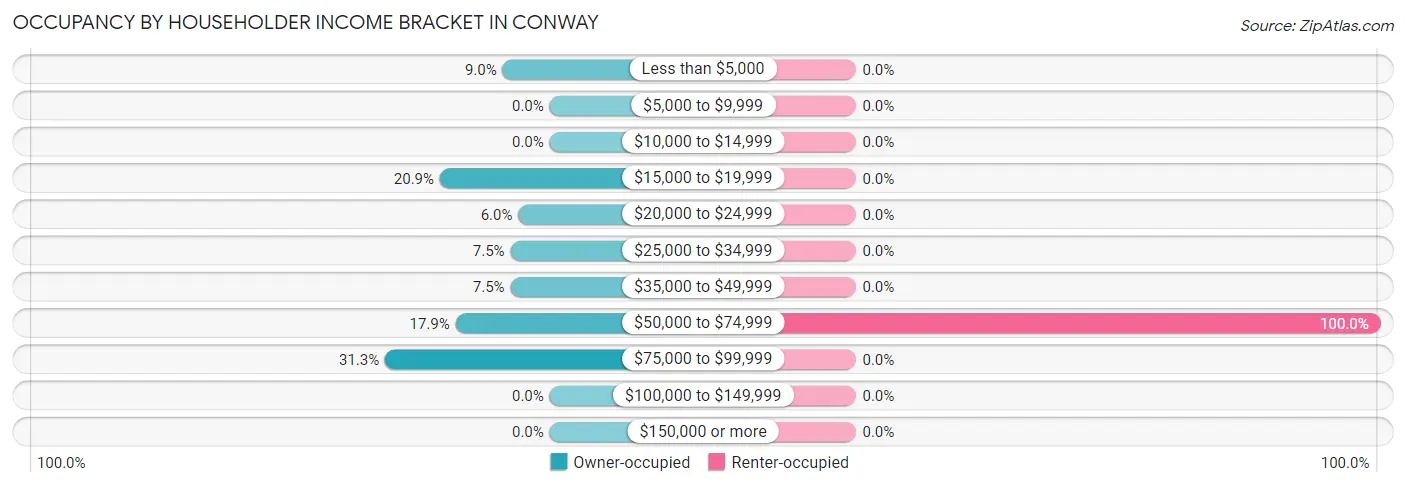
| Income Bracket | Owner-occupied | Renter-occupied |
| Less than $5,000 | 6 (9.0%) | 0 (0.0%) |
| $5,000 to $9,999 | 0 (0.0%) | 0 (0.0%) |
| $10,000 to $14,999 | 0 (0.0%) | 0 (0.0%) |
| $15,000 to $19,999 | 14 (20.9%) | 0 (0.0%) |
| $20,000 to $24,999 | 4 (6.0%) | 0 (0.0%) |
| $25,000 to $34,999 | 5 (7.5%) | 0 (0.0%) |
| $35,000 to $49,999 | 5 (7.5%) | 0 (0.0%) |
| $50,000 to $74,999 | 12 (17.9%) | 8 (100.0%) |
| $75,000 to $99,999 | 21 (31.3%) | 0 (0.0%) |
| $100,000 to $149,999 | 0 (0.0%) | 0 (0.0%) |
| $150,000 or more | 0 (0.0%) | 0 (0.0%) |
| Total | 67 (100.0%) | 8 (100.0%) |
Monthly Housing Cost Tiers in Conway
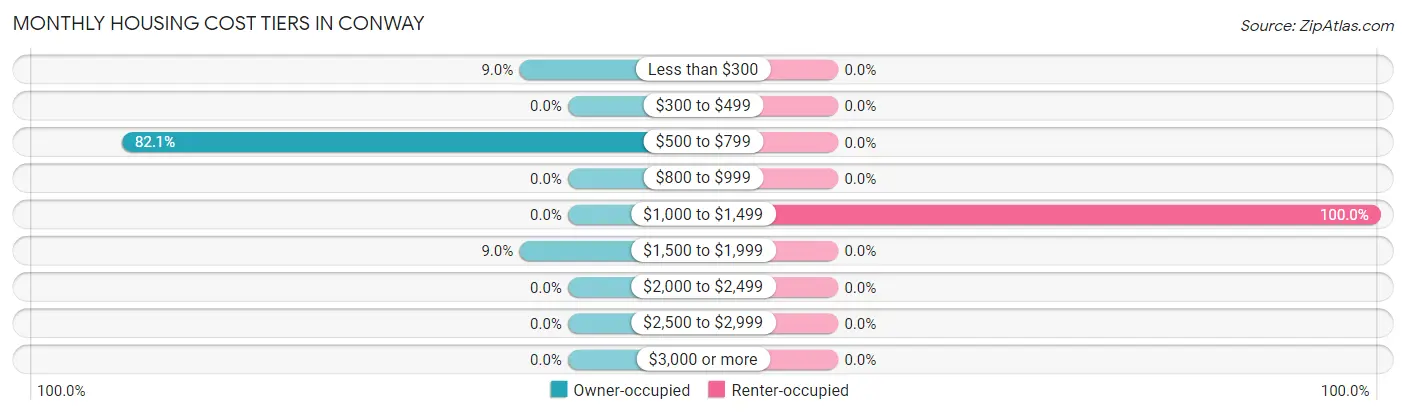
| Monthly Cost | Owner-occupied | Renter-occupied |
| Less than $300 | 6 (9.0%) | 0 (0.0%) |
| $300 to $499 | 0 (0.0%) | 0 (0.0%) |
| $500 to $799 | 55 (82.1%) | 0 (0.0%) |
| $800 to $999 | 0 (0.0%) | 0 (0.0%) |
| $1,000 to $1,499 | 0 (0.0%) | 8 (100.0%) |
| $1,500 to $1,999 | 6 (9.0%) | 0 (0.0%) |
| $2,000 to $2,499 | 0 (0.0%) | 0 (0.0%) |
| $2,500 to $2,999 | 0 (0.0%) | 0 (0.0%) |
| $3,000 or more | 0 (0.0%) | 0 (0.0%) |
| Total | 67 (100.0%) | 8 (100.0%) |
Physical Housing Characteristics in Conway
Housing Structures in Conway
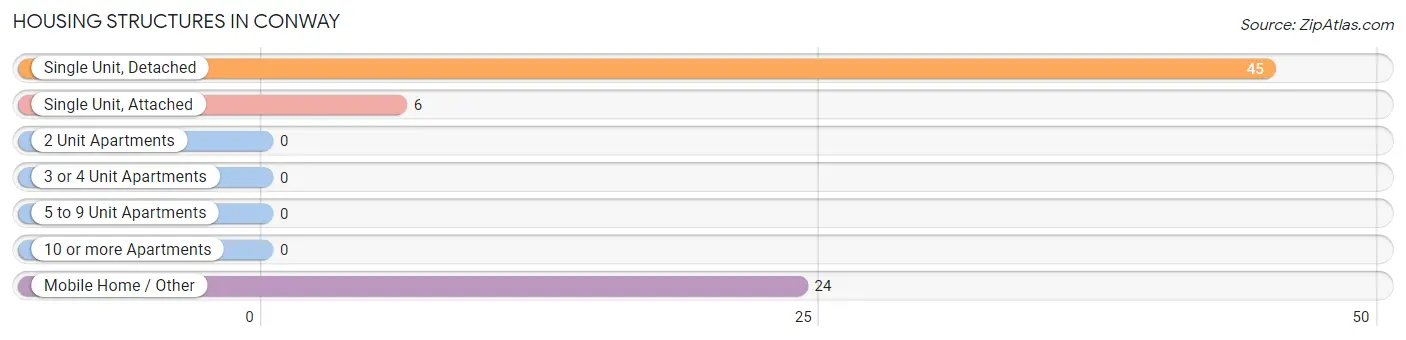
| Structure Type | # Housing Units | % Housing Units |
| Single Unit, Detached | 45 | 60.0% |
| Single Unit, Attached | 6 | 8.0% |
| 2 Unit Apartments | 0 | 0.0% |
| 3 or 4 Unit Apartments | 0 | 0.0% |
| 5 to 9 Unit Apartments | 0 | 0.0% |
| 10 or more Apartments | 0 | 0.0% |
| Mobile Home / Other | 24 | 32.0% |
| Total | 75 | 100.0% |
Housing Structures by Occupancy in Conway

| Structure Type | Owner-occupied | Renter-occupied |
| Single Unit, Detached | 45 (100.0%) | 0 (0.0%) |
| Single Unit, Attached | 6 (100.0%) | 0 (0.0%) |
| 2 Unit Apartments | 0 (0.0%) | 0 (0.0%) |
| 3 or 4 Unit Apartments | 0 (0.0%) | 0 (0.0%) |
| 5 to 9 Unit Apartments | 0 (0.0%) | 0 (0.0%) |
| 10 or more Apartments | 0 (0.0%) | 0 (0.0%) |
| Mobile Home / Other | 16 (66.7%) | 8 (33.3%) |
| Total | 67 (89.3%) | 8 (10.7%) |
Housing Structures by Number of Rooms in Conway
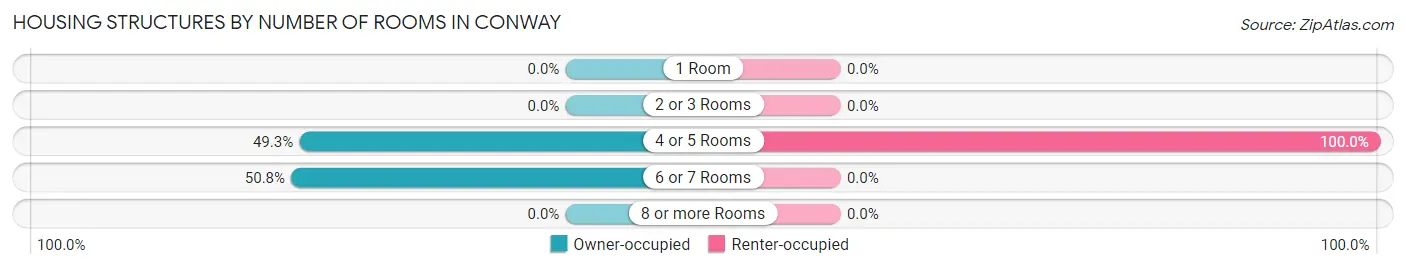
| Number of Rooms | Owner-occupied | Renter-occupied |
| 1 Room | 0 (0.0%) | 0 (0.0%) |
| 2 or 3 Rooms | 0 (0.0%) | 0 (0.0%) |
| 4 or 5 Rooms | 33 (49.2%) | 8 (100.0%) |
| 6 or 7 Rooms | 34 (50.7%) | 0 (0.0%) |
| 8 or more Rooms | 0 (0.0%) | 0 (0.0%) |
| Total | 67 (100.0%) | 8 (100.0%) |
Housing Structure by Heating Type in Conway
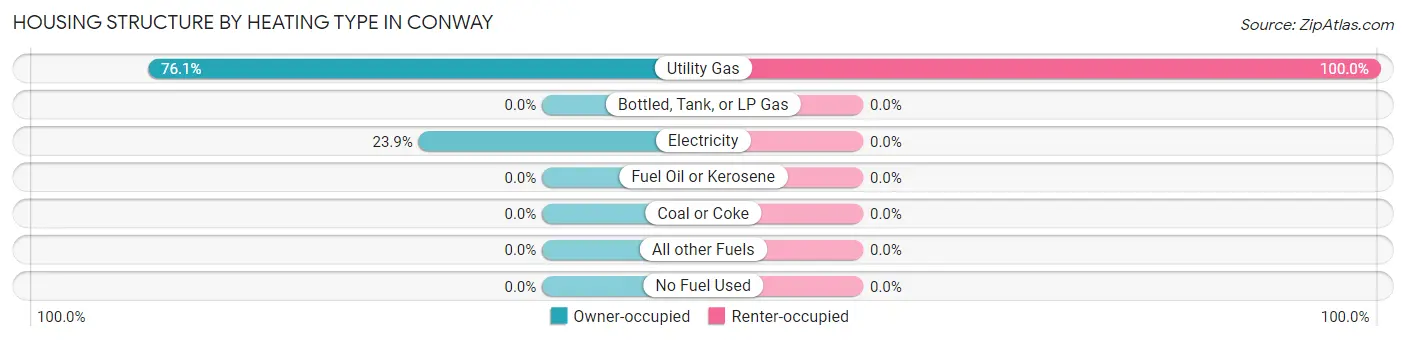
| Heating Type | Owner-occupied | Renter-occupied |
| Utility Gas | 51 (76.1%) | 8 (100.0%) |
| Bottled, Tank, or LP Gas | 0 (0.0%) | 0 (0.0%) |
| Electricity | 16 (23.9%) | 0 (0.0%) |
| Fuel Oil or Kerosene | 0 (0.0%) | 0 (0.0%) |
| Coal or Coke | 0 (0.0%) | 0 (0.0%) |
| All other Fuels | 0 (0.0%) | 0 (0.0%) |
| No Fuel Used | 0 (0.0%) | 0 (0.0%) |
| Total | 67 (100.0%) | 8 (100.0%) |
Household Vehicle Usage in Conway
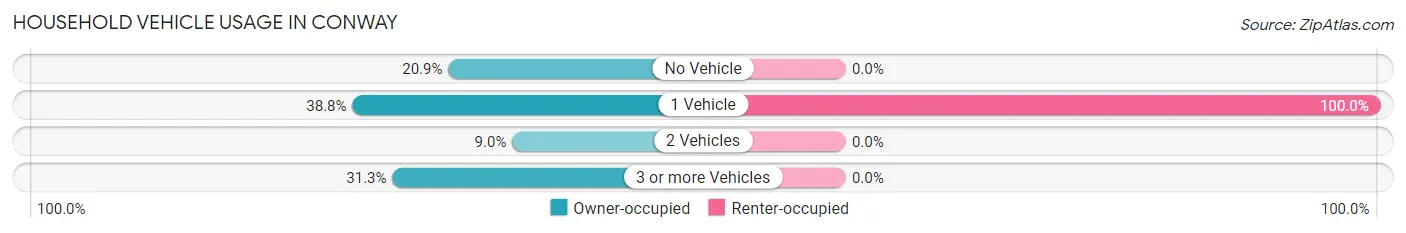
| Vehicles per Household | Owner-occupied | Renter-occupied |
| No Vehicle | 14 (20.9%) | 0 (0.0%) |
| 1 Vehicle | 26 (38.8%) | 8 (100.0%) |
| 2 Vehicles | 6 (9.0%) | 0 (0.0%) |
| 3 or more Vehicles | 21 (31.3%) | 0 (0.0%) |
| Total | 67 (100.0%) | 8 (100.0%) |
Real Estate & Mortgages in Conway
Real Estate and Mortgage Overview in Conway
| Characteristic | Without Mortgage | With Mortgage |
| Housing Units | 37 | 30 |
| Median Property Value | - | - |
| Median Household Income | $78,750 | $0 |
| Monthly Housing Costs | $650 | $0 |
| Real Estate Taxes | - | - |
Property Value by Mortgage Status in Conway
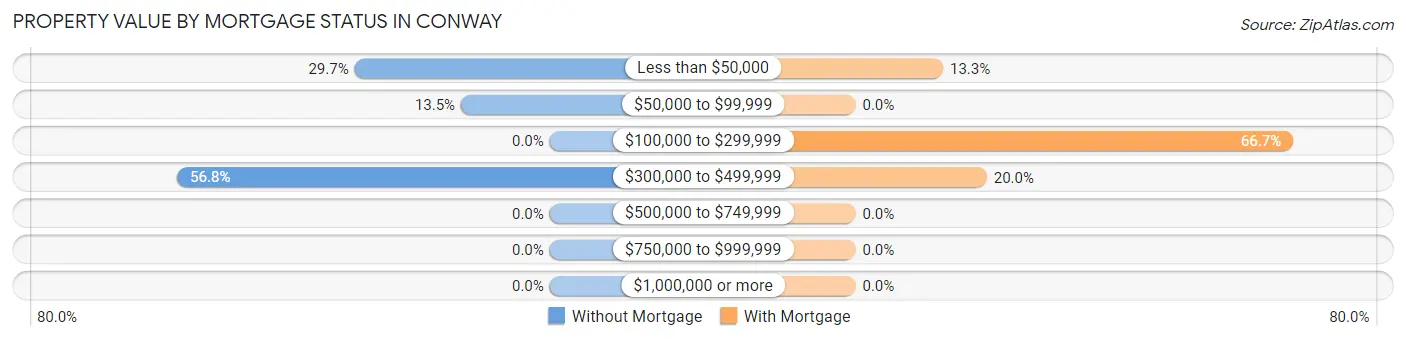
| Property Value | Without Mortgage | With Mortgage |
| Less than $50,000 | 11 (29.7%) | 4 (13.3%) |
| $50,000 to $99,999 | 5 (13.5%) | 0 (0.0%) |
| $100,000 to $299,999 | 0 (0.0%) | 20 (66.7%) |
| $300,000 to $499,999 | 21 (56.8%) | 6 (20.0%) |
| $500,000 to $749,999 | 0 (0.0%) | 0 (0.0%) |
| $750,000 to $999,999 | 0 (0.0%) | 0 (0.0%) |
| $1,000,000 or more | 0 (0.0%) | 0 (0.0%) |
| Total | 37 (100.0%) | 30 (100.0%) |
Household Income by Mortgage Status in Conway
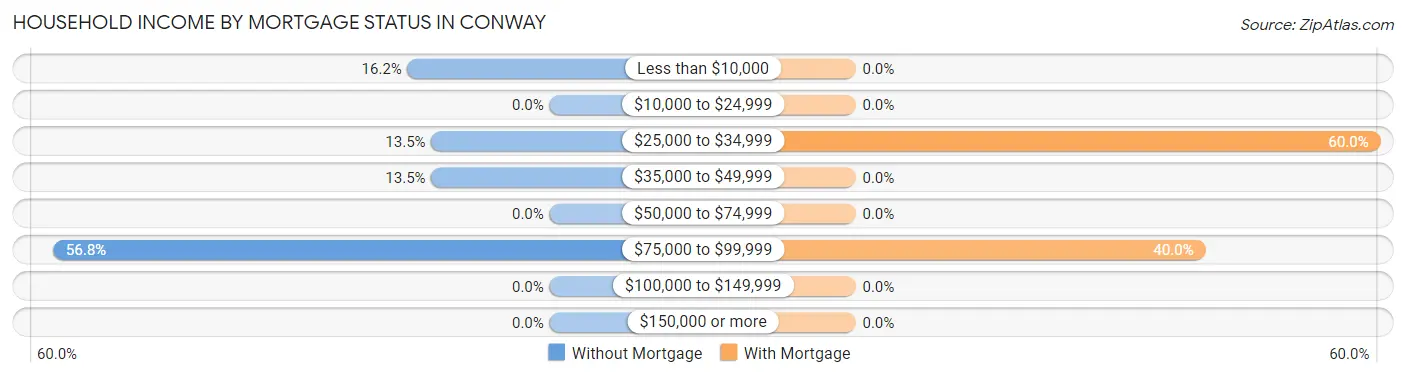
| Household Income | Without Mortgage | With Mortgage |
| Less than $10,000 | 6 (16.2%) | 0 (0.0%) |
| $10,000 to $24,999 | 0 (0.0%) | 0 (0.0%) |
| $25,000 to $34,999 | 5 (13.5%) | 18 (60.0%) |
| $35,000 to $49,999 | 5 (13.5%) | 0 (0.0%) |
| $50,000 to $74,999 | 0 (0.0%) | 0 (0.0%) |
| $75,000 to $99,999 | 21 (56.8%) | 12 (40.0%) |
| $100,000 to $149,999 | 0 (0.0%) | 0 (0.0%) |
| $150,000 or more | 0 (0.0%) | 0 (0.0%) |
| Total | 37 (100.0%) | 30 (100.0%) |
Property Value to Household Income Ratio in Conway
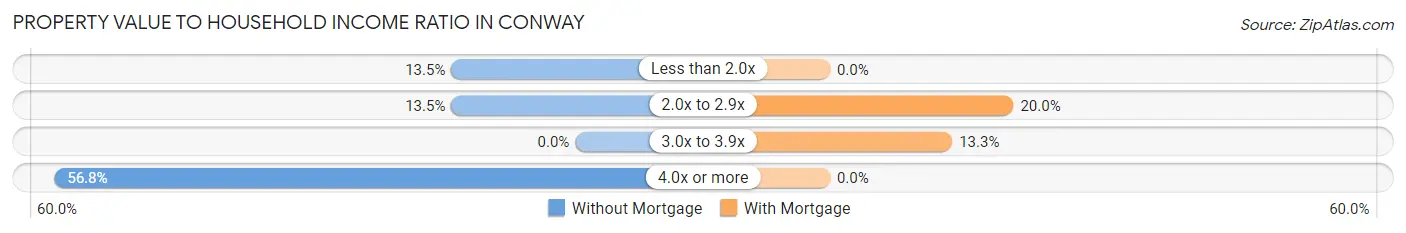
| Value-to-Income Ratio | Without Mortgage | With Mortgage |
| Less than 2.0x | 5 (13.5%) | 0 (0.0%) |
| 2.0x to 2.9x | 5 (13.5%) | 6 (20.0%) |
| 3.0x to 3.9x | 0 (0.0%) | 4 (13.3%) |
| 4.0x or more | 21 (56.8%) | 0 (0.0%) |
| Total | 37 (100.0%) | 30 (100.0%) |
Real Estate Taxes by Mortgage Status in Conway
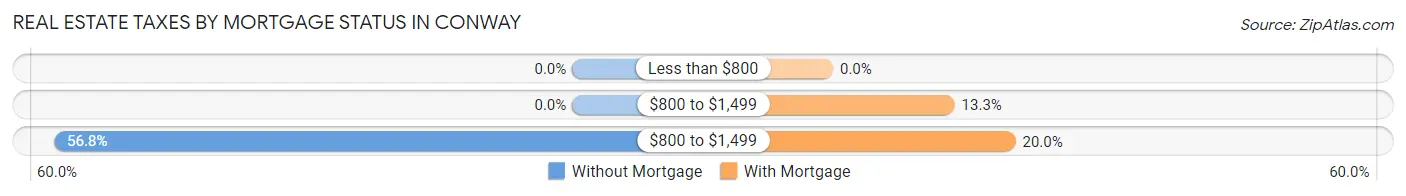
| Property Taxes | Without Mortgage | With Mortgage |
| Less than $800 | 0 (0.0%) | 0 (0.0%) |
| $800 to $1,499 | 0 (0.0%) | 4 (13.3%) |
| $800 to $1,499 | 21 (56.8%) | 6 (20.0%) |
| Total | 37 (100.0%) | 30 (100.0%) |
Health & Disability in Conway
Health Insurance Coverage by Age in Conway
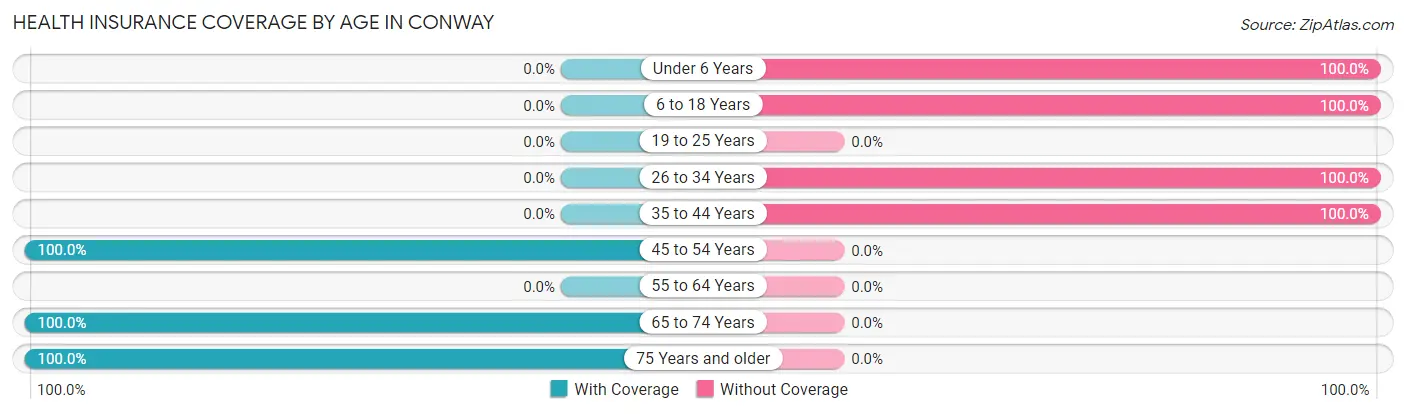
| Age Bracket | With Coverage | Without Coverage |
| Under 6 Years | 0 (0.0%) | 16 (100.0%) |
| 6 to 18 Years | 0 (0.0%) | 18 (100.0%) |
| 19 to 25 Years | 0 (0.0%) | 0 (0.0%) |
| 26 to 34 Years | 0 (0.0%) | 5 (100.0%) |
| 35 to 44 Years | 0 (0.0%) | 5 (100.0%) |
| 45 to 54 Years | 7 (100.0%) | 0 (0.0%) |
| 55 to 64 Years | 0 (0.0%) | 0 (0.0%) |
| 65 to 74 Years | 28 (100.0%) | 0 (0.0%) |
| 75 Years and older | 70 (100.0%) | 0 (0.0%) |
| Total | 105 (70.5%) | 44 (29.5%) |
Health Insurance Coverage by Citizenship Status in Conway
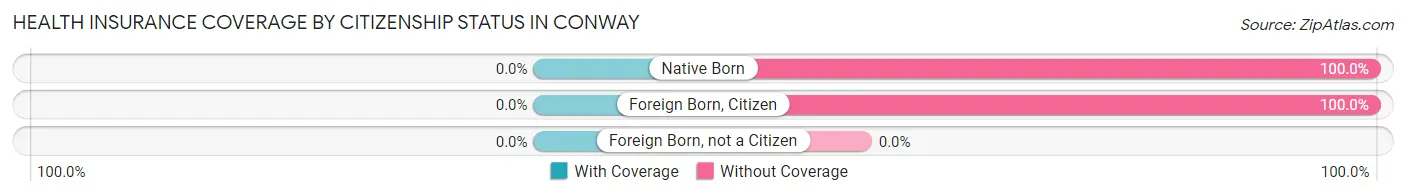
| Citizenship Status | With Coverage | Without Coverage |
| Native Born | 0 (0.0%) | 16 (100.0%) |
| Foreign Born, Citizen | 0 (0.0%) | 18 (100.0%) |
| Foreign Born, not a Citizen | 0 (0.0%) | 0 (0.0%) |
Health Insurance Coverage by Household Income in Conway
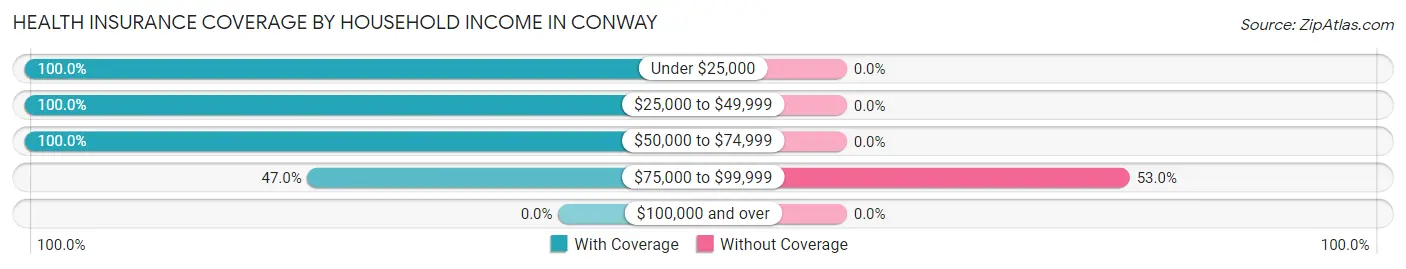
| Household Income | With Coverage | Without Coverage |
| Under $25,000 | 31 (100.0%) | 0 (0.0%) |
| $25,000 to $49,999 | 10 (100.0%) | 0 (0.0%) |
| $50,000 to $74,999 | 25 (100.0%) | 0 (0.0%) |
| $75,000 to $99,999 | 39 (47.0%) | 44 (53.0%) |
| $100,000 and over | 0 (0.0%) | 0 (0.0%) |
Public vs Private Health Insurance Coverage by Age in Conway
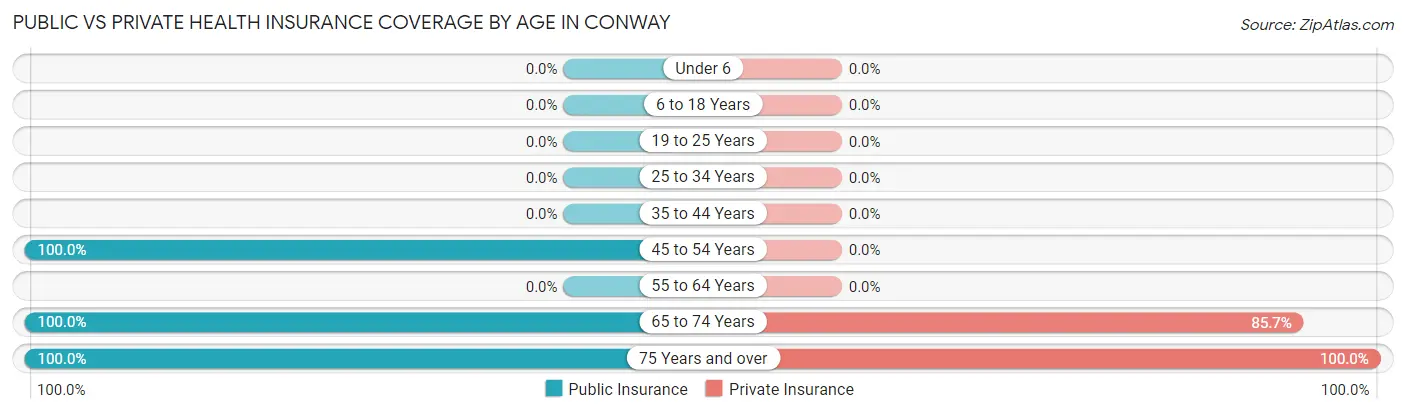
| Age Bracket | Public Insurance | Private Insurance |
| Under 6 | 0 (0.0%) | 0 (0.0%) |
| 6 to 18 Years | 0 (0.0%) | 0 (0.0%) |
| 19 to 25 Years | 0 (0.0%) | 0 (0.0%) |
| 25 to 34 Years | 0 (0.0%) | 0 (0.0%) |
| 35 to 44 Years | 0 (0.0%) | 0 (0.0%) |
| 45 to 54 Years | 7 (100.0%) | 0 (0.0%) |
| 55 to 64 Years | 0 (0.0%) | 0 (0.0%) |
| 65 to 74 Years | 28 (100.0%) | 24 (85.7%) |
| 75 Years and over | 70 (100.0%) | 70 (100.0%) |
| Total | 105 (70.5%) | 94 (63.1%) |
Disability Status by Sex by Age in Conway
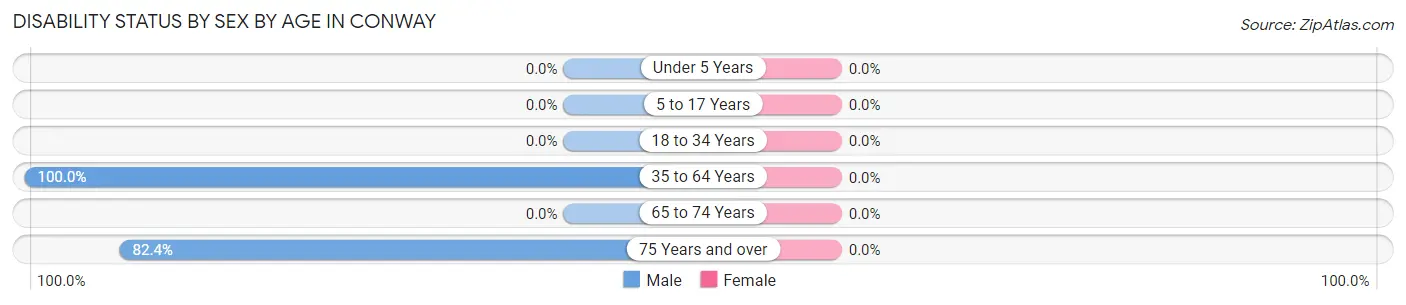
| Age Bracket | Male | Female |
| Under 5 Years | 0 (0.0%) | 0 (0.0%) |
| 5 to 17 Years | 0 (0.0%) | 0 (0.0%) |
| 18 to 34 Years | 0 (0.0%) | 0 (0.0%) |
| 35 to 64 Years | 7 (100.0%) | 0 (0.0%) |
| 65 to 74 Years | 0 (0.0%) | 0 (0.0%) |
| 75 Years and over | 28 (82.4%) | 0 (0.0%) |
Disability Class by Sex by Age in Conway
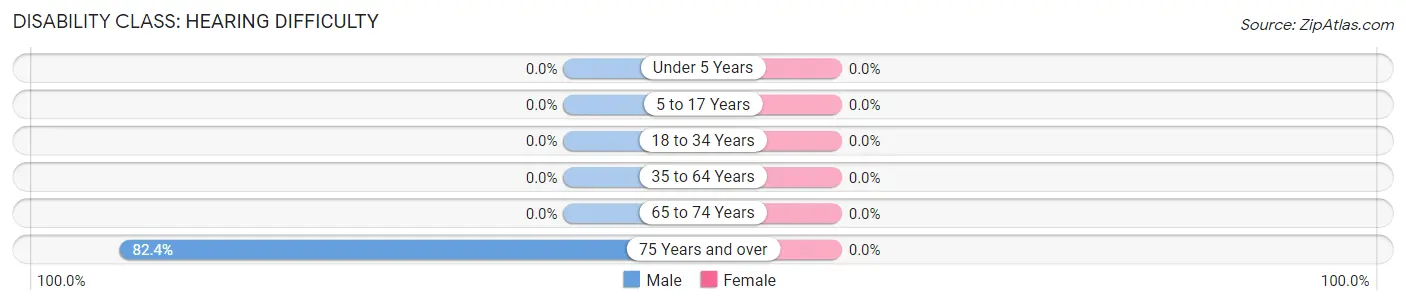
Disability Class: Hearing Difficulty
| Age Bracket | Male | Female |
| Under 5 Years | 0 (0.0%) | 0 (0.0%) |
| 5 to 17 Years | 0 (0.0%) | 0 (0.0%) |
| 18 to 34 Years | 0 (0.0%) | 0 (0.0%) |
| 35 to 64 Years | 0 (0.0%) | 0 (0.0%) |
| 65 to 74 Years | 0 (0.0%) | 0 (0.0%) |
| 75 Years and over | 28 (82.4%) | 0 (0.0%) |
Disability Class: Vision Difficulty
| Age Bracket | Male | Female |
| Under 5 Years | 0 (0.0%) | 0 (0.0%) |
| 5 to 17 Years | 0 (0.0%) | 0 (0.0%) |
| 18 to 34 Years | 0 (0.0%) | 0 (0.0%) |
| 35 to 64 Years | 0 (0.0%) | 0 (0.0%) |
| 65 to 74 Years | 0 (0.0%) | 0 (0.0%) |
| 75 Years and over | 0 (0.0%) | 0 (0.0%) |
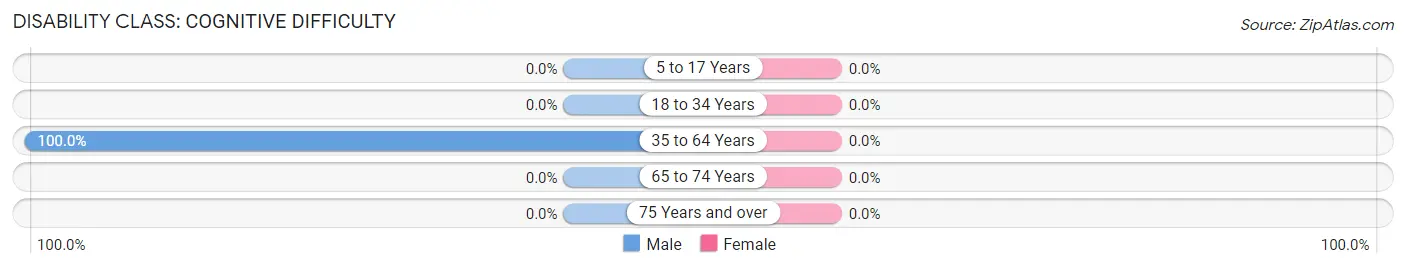
Disability Class: Cognitive Difficulty
| Age Bracket | Male | Female |
| 5 to 17 Years | 0 (0.0%) | 0 (0.0%) |
| 18 to 34 Years | 0 (0.0%) | 0 (0.0%) |
| 35 to 64 Years | 7 (100.0%) | 0 (0.0%) |
| 65 to 74 Years | 0 (0.0%) | 0 (0.0%) |
| 75 Years and over | 0 (0.0%) | 0 (0.0%) |
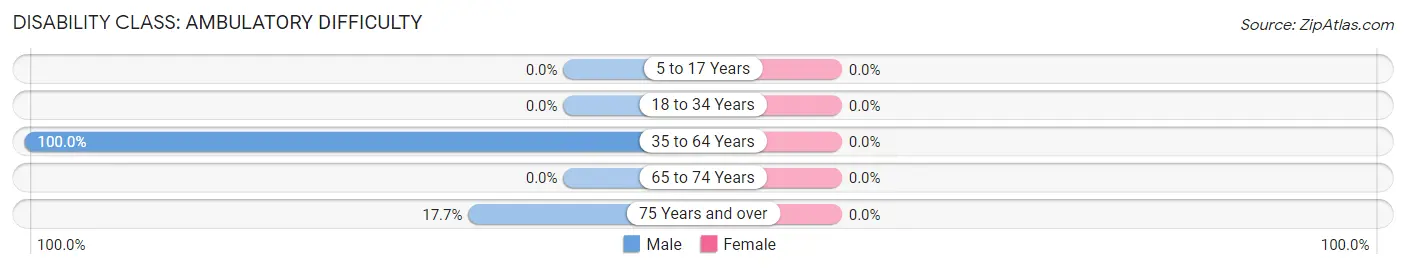
Disability Class: Ambulatory Difficulty
| Age Bracket | Male | Female |
| 5 to 17 Years | 0 (0.0%) | 0 (0.0%) |
| 18 to 34 Years | 0 (0.0%) | 0 (0.0%) |
| 35 to 64 Years | 7 (100.0%) | 0 (0.0%) |
| 65 to 74 Years | 0 (0.0%) | 0 (0.0%) |
| 75 Years and over | 6 (17.6%) | 0 (0.0%) |
Disability Class: Self-Care Difficulty
| Age Bracket | Male | Female |
| 5 to 17 Years | 0 (0.0%) | 0 (0.0%) |
| 18 to 34 Years | 0 (0.0%) | 0 (0.0%) |
| 35 to 64 Years | 0 (0.0%) | 0 (0.0%) |
| 65 to 74 Years | 0 (0.0%) | 0 (0.0%) |
| 75 Years and over | 0 (0.0%) | 0 (0.0%) |
Technology Access in Conway
Computing Device Access in Conway
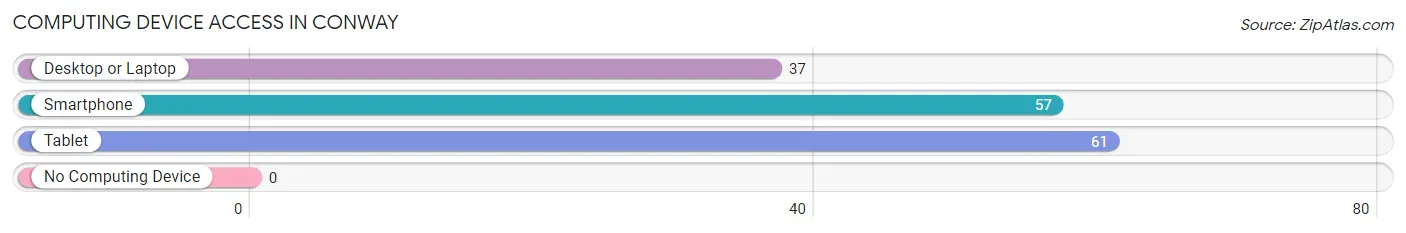
| Device Type | # Households | % Households |
| Desktop or Laptop | 37 | 49.3% |
| Smartphone | 57 | 76.0% |
| Tablet | 61 | 81.3% |
| No Computing Device | 0 | 0.0% |
| Total | 75 | 100.0% |
Internet Access in Conway
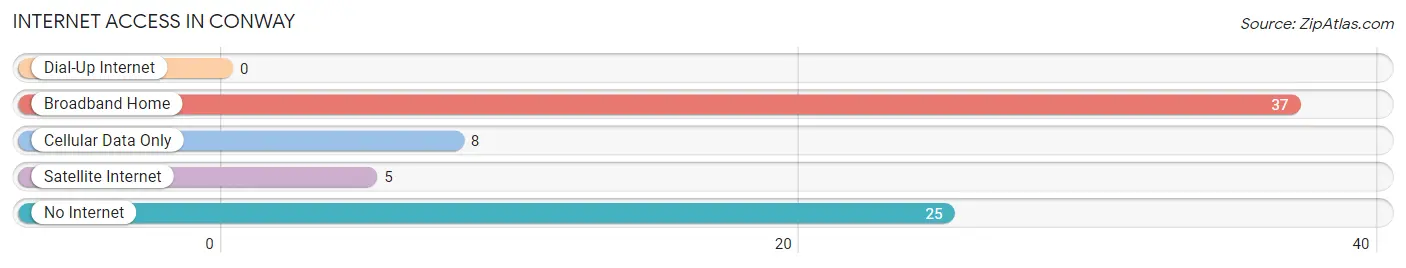
| Internet Type | # Households | % Households |
| Dial-Up Internet | 0 | 0.0% |
| Broadband Home | 37 | 49.3% |
| Cellular Data Only | 8 | 10.7% |
| Satellite Internet | 5 | 6.7% |
| No Internet | 25 | 33.3% |
| Total | 75 | 100.0% |
Conway Summary
Conway is a small unincorporated community located in the northern part of Michigan’s Lower Peninsula. It is situated in the center of Grand Traverse County, approximately 10 miles south of Traverse City. The community is surrounded by rolling hills, forests, and farmland, and is home to a population of just over 1,000 people.
History
The area that is now Conway was first settled in the early 1800s by a group of French-Canadian fur traders. The settlement was originally known as “La Petite Riviere”, or “Little River”, and was located along the banks of the Boardman River. In 1837, the settlement was renamed “Conway” after the first postmaster, William Conway.
The area was primarily an agricultural community for much of its history, with the main crops being wheat, oats, and potatoes. In the late 1800s, the lumber industry began to take off in the area, and the town became a hub for the lumber trade. The lumber industry continued to be a major part of the local economy until the early 1900s, when the industry began to decline.
Geography
Conway is located in the northern part of Michigan’s Lower Peninsula, approximately 10 miles south of Traverse City. The community is situated in the center of Grand Traverse County, and is surrounded by rolling hills, forests, and farmland. The Boardman River runs through the town, and is a popular spot for fishing and canoeing.
The climate in Conway is typical of the northern Midwest, with cold winters and warm summers. The average temperature in the winter months is around 20 degrees Fahrenheit, while the average temperature in the summer months is around 70 degrees Fahrenheit.
Economy
The economy of Conway is largely based on agriculture and tourism. The town is home to several small farms, which produce a variety of crops, including wheat, oats, and potatoes. The town is also home to several wineries, which produce a variety of wines.
In addition to agriculture, tourism is a major part of the local economy. The town is home to several popular attractions, including the Boardman River Nature Center, the Grand Traverse Lighthouse Museum, and the Grand Traverse Bay. The town is also home to several popular restaurants and shops, which attract visitors from all over the region.
Demographics
As of the 2010 census, the population of Conway was 1,072. The racial makeup of the town was 97.2% White, 0.7% African American, 0.3% Native American, 0.3% Asian, 0.1% Pacific Islander, 0.3% from other races, and 1.2% from two or more races. Hispanic or Latino of any race were 1.2% of the population.
The median household income in Conway was $45,000, and the median family income was $50,000. The per capita income for the town was $20,000. About 10.3% of families and 13.2% of the population were below the poverty line, including 17.2% of those under age 18 and 8.3% of those age 65 or over.
Conway is a small, rural community with a rich history and a strong sense of community. The town is home to a variety of businesses and attractions, and is a popular destination for tourists from all over the region. The town is also home to a diverse population, with a variety of backgrounds and cultures.
Common Questions
What is Per Capita Income in Conway?
Per Capita income in Conway is $23,717.
What is the Median Family Income in Conway?
Median Family Income in Conway is $79,750.
What is the Median Household income in Conway?
Median Household Income in Conway is $56,094.
What is Inequality or Gini Index in Conway?
Inequality or Gini Index in Conway is 0.32.
What is the Total Population of Conway?
Total Population of Conway is 149.
What is the Total Male Population of Conway?
Total Male Population of Conway is 50.
What is the Total Female Population of Conway?
Total Female Population of Conway is 99.
What is the Ratio of Males per 100 Females in Conway?
There are 50.51 Males per 100 Females in Conway.
What is the Ratio of Females per 100 Males in Conway?
There are 198.00 Females per 100 Males in Conway.
What is the Median Population Age in Conway?
Median Population Age in Conway is 71.6 Years.
What is the Average Family Size in Conway
Average Family Size in Conway is 3.2 People.
What is the Average Household Size in Conway
Average Household Size in Conway is 2.0 People.
How Large is the Labor Force in Conway?
There are 20 People in the Labor Forcein in Conway.
What is the Percentage of People in the Labor Force in Conway?
17.4% of People are in the Labor Force in Conway.
What is the Unemployment Rate in Conway?
Unemployment Rate in Conway is 35.0%.