Zip Codes with the Highest Percentage of Population with a Degree in Liberal Arts and History in Royal Oak, MI
RELATED REPORTS & OPTIONS
Liberal Arts and History
Royal Oak
Compare Zip Codes
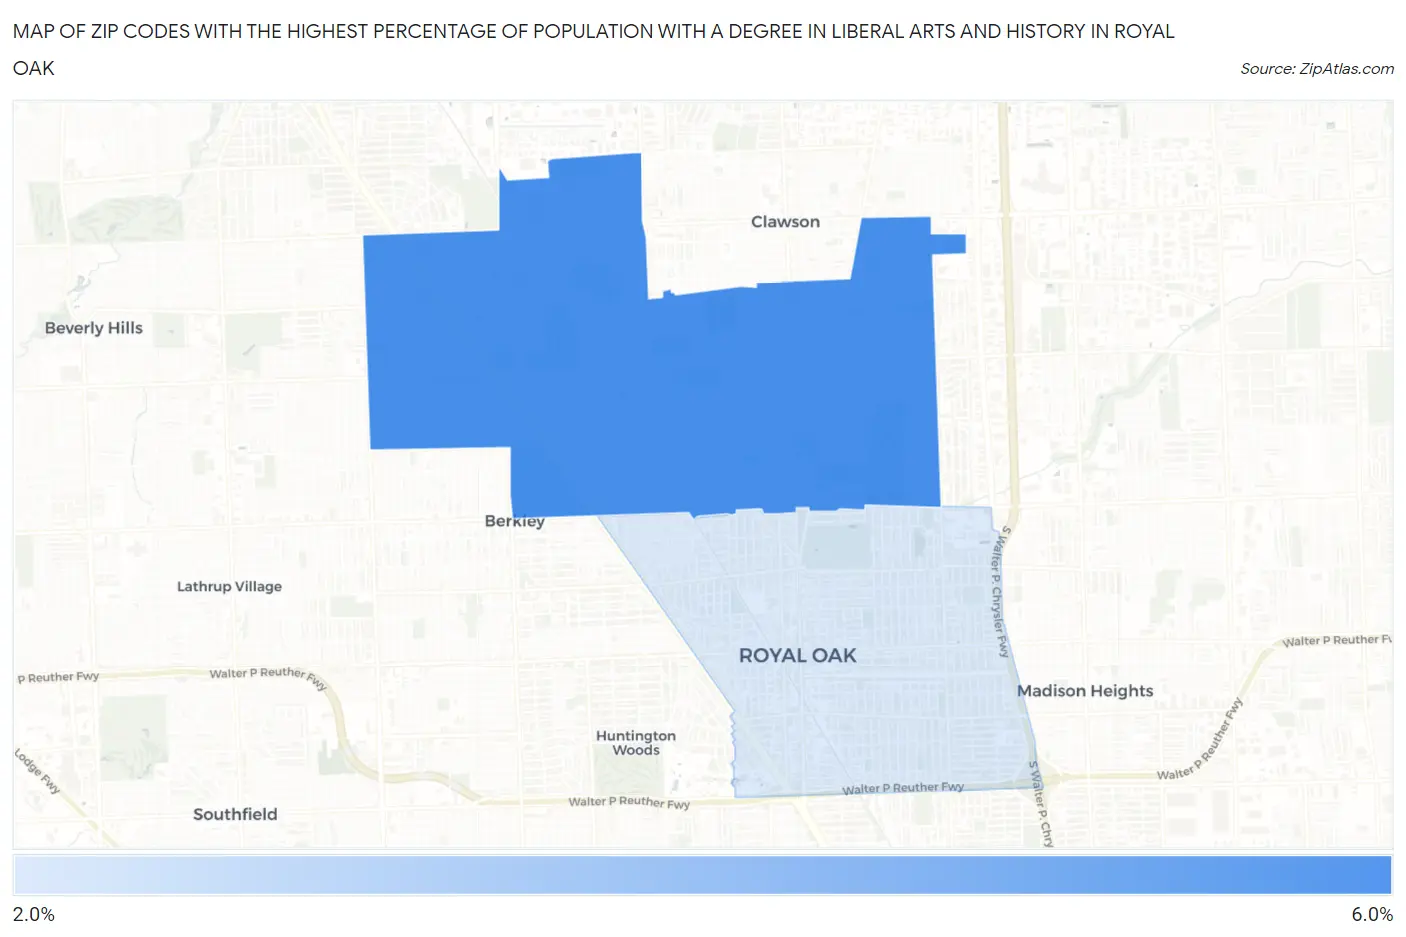
Map of Zip Codes with the Highest Percentage of Population with a Degree in Liberal Arts and History in Royal Oak
2.8%
5.8%
Zip Codes with the Highest Percentage of Population with a Degree in Liberal Arts and History in Royal Oak, MI
| Zip Code | % Graduates | vs State | vs National | |
| 1. | 48073 | 5.8% | 4.0%(+1.80)#215 | 4.9%(+0.914)#9,071 |
| 2. | 48067 | 2.8% | 4.0%(-1.17)#613 | 4.9%(-2.06)#18,971 |
1
Common Questions
What are the Top Zip Codes with the Highest Percentage of Population with a Degree in Liberal Arts and History in Royal Oak, MI?
Top Zip Codes with the Highest Percentage of Population with a Degree in Liberal Arts and History in Royal Oak, MI are:
What zip code has the Highest Percentage of Population with a Degree in Liberal Arts and History in Royal Oak, MI?
48073 has the Highest Percentage of Population with a Degree in Liberal Arts and History in Royal Oak, MI with 5.8%.
What is the Percentage of Population with a Degree in Liberal Arts and History in Royal Oak, MI?
Percentage of Population with a Degree in Liberal Arts and History in Royal Oak is 4.4%.
What is the Percentage of Population with a Degree in Liberal Arts and History in Michigan?
Percentage of Population with a Degree in Liberal Arts and History in Michigan is 4.0%.
What is the Percentage of Population with a Degree in Liberal Arts and History in the United States?
Percentage of Population with a Degree in Liberal Arts and History in the United States is 4.9%.