Paw Paw, MI Map & Demographics
Paw Paw Map
Paw Paw Overview
$24,053
PER CAPITA INCOME
$59,683
AVG FAMILY INCOME
$46,516
AVG HOUSEHOLD INCOME
29.4%
WAGE / INCOME GAP [ % ]
70.6¢/ $1
WAGE / INCOME GAP [ $ ]
0.45
INEQUALITY / GINI INDEX
3,318
TOTAL POPULATION
1,726
MALE POPULATION
1,592
FEMALE POPULATION
108.42
MALES / 100 FEMALES
92.24
FEMALES / 100 MALES
35.4
MEDIAN AGE
3.1
AVG FAMILY SIZE
2.3
AVG HOUSEHOLD SIZE
1,384
LABOR FORCE [ PEOPLE ]
56.6%
PERCENT IN LABOR FORCE
6.6%
UNEMPLOYMENT RATE
Paw Paw Zip Codes
Paw Paw Area Codes
Income in Paw Paw
Income Overview in Paw Paw
Per Capita Income in Paw Paw is $24,053, while median incomes of families and households are $59,683 and $46,516 respectively.
| Characteristic | Number | Measure |
| Per Capita Income | 3,318 | $24,053 |
| Median Family Income | 809 | $59,683 |
| Mean Family Income | 809 | $72,271 |
| Median Household Income | 1,369 | $46,516 |
| Mean Household Income | 1,369 | $54,461 |
| Income Deficit | 809 | $0 |
| Wage / Income Gap (%) | 3,318 | 29.39% |
| Wage / Income Gap ($) | 3,318 | 70.61¢ per $1 |
| Gini / Inequality Index | 3,318 | 0.45 |
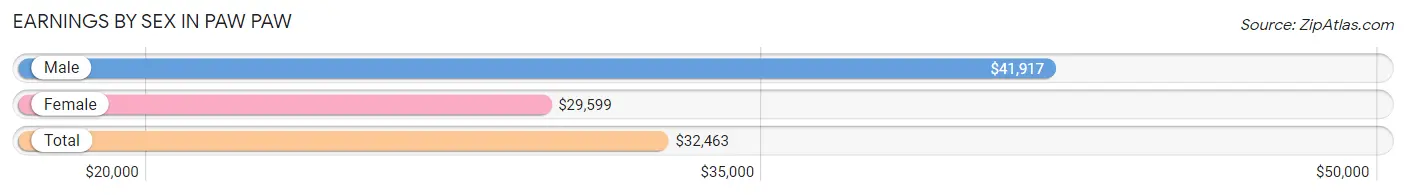
Earnings by Sex in Paw Paw
Average Earnings in Paw Paw are $32,463, $41,917 for men and $29,599 for women, a difference of 29.4%.
| Sex | Number | Average Earnings |
| Male | 831 (55.2%) | $41,917 |
| Female | 673 (44.8%) | $29,599 |
| Total | 1,504 (100.0%) | $32,463 |
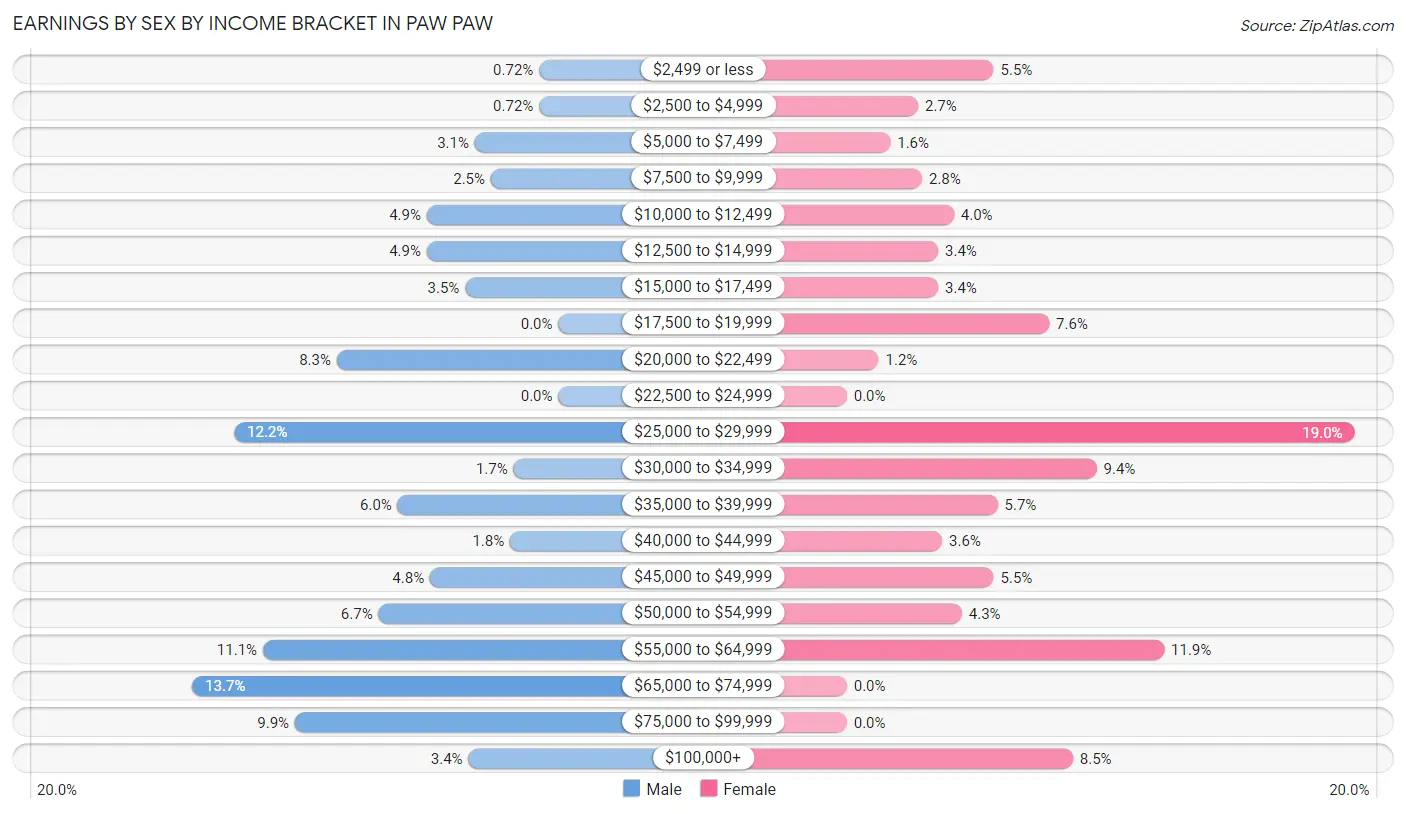
Earnings by Sex by Income Bracket in Paw Paw
The most common earnings brackets in Paw Paw are $65,000 to $74,999 for men (114 | 13.7%) and $25,000 to $29,999 for women (128 | 19.0%).
| Income | Male | Female |
| $2,499 or less | 6 (0.7%) | 37 (5.5%) |
| $2,500 to $4,999 | 6 (0.7%) | 18 (2.7%) |
| $5,000 to $7,499 | 26 (3.1%) | 11 (1.6%) |
| $7,500 to $9,999 | 21 (2.5%) | 19 (2.8%) |
| $10,000 to $12,499 | 41 (4.9%) | 27 (4.0%) |
| $12,500 to $14,999 | 41 (4.9%) | 23 (3.4%) |
| $15,000 to $17,499 | 29 (3.5%) | 23 (3.4%) |
| $17,500 to $19,999 | 0 (0.0%) | 51 (7.6%) |
| $20,000 to $22,499 | 69 (8.3%) | 8 (1.2%) |
| $22,500 to $24,999 | 0 (0.0%) | 0 (0.0%) |
| $25,000 to $29,999 | 101 (12.1%) | 128 (19.0%) |
| $30,000 to $34,999 | 14 (1.7%) | 63 (9.4%) |
| $35,000 to $39,999 | 50 (6.0%) | 38 (5.7%) |
| $40,000 to $44,999 | 15 (1.8%) | 24 (3.6%) |
| $45,000 to $49,999 | 40 (4.8%) | 37 (5.5%) |
| $50,000 to $54,999 | 56 (6.7%) | 29 (4.3%) |
| $55,000 to $64,999 | 92 (11.1%) | 80 (11.9%) |
| $65,000 to $74,999 | 114 (13.7%) | 0 (0.0%) |
| $75,000 to $99,999 | 82 (9.9%) | 0 (0.0%) |
| $100,000+ | 28 (3.4%) | 57 (8.5%) |
| Total | 831 (100.0%) | 673 (100.0%) |
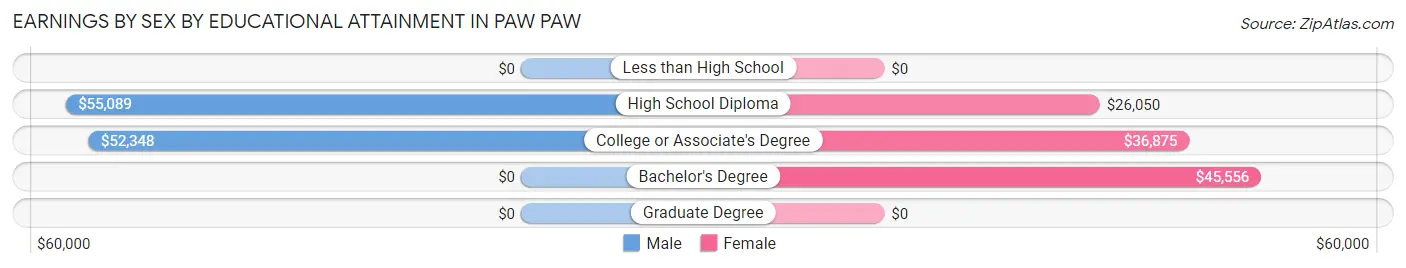
Earnings by Sex by Educational Attainment in Paw Paw
Average earnings in Paw Paw are $51,677 for men and $31,369 for women, a difference of 39.3%. Men with an educational attainment of high school diploma enjoy the highest average annual earnings of $55,089, while those with college or associate's degree education earn the least with $52,348. Women with an educational attainment of bachelor's degree earn the most with the average annual earnings of $45,556, while those with high school diploma education have the smallest earnings of $26,050.
| Educational Attainment | Male Income | Female Income |
| Less than High School | - | - |
| High School Diploma | $55,089 | $26,050 |
| College or Associate's Degree | $52,348 | $36,875 |
| Bachelor's Degree | - | - |
| Graduate Degree | - | - |
| Total | $51,677 | $31,369 |
Family Income in Paw Paw
Family Income Brackets in Paw Paw
According to the Paw Paw family income data, there are 213 families falling into the $100,000 to $149,999 income range, which is the most common income bracket and makes up 26.3% of all families.
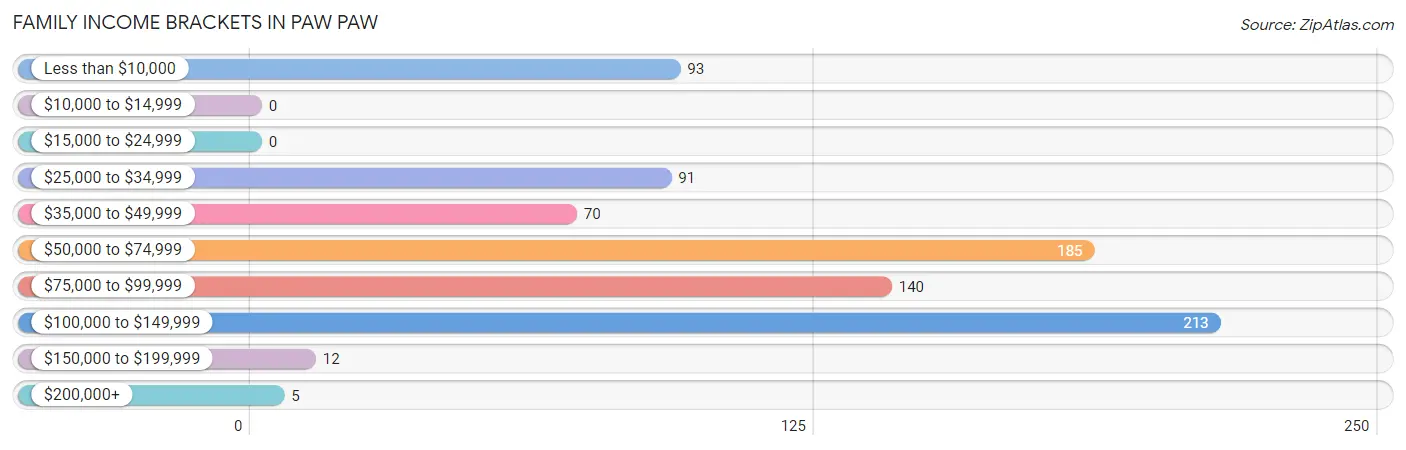
| Income Bracket | # Families | % Families |
| Less than $10,000 | 93 | 11.5% |
| $10,000 to $14,999 | 0 | 0.0% |
| $15,000 to $24,999 | 0 | 0.0% |
| $25,000 to $34,999 | 91 | 11.2% |
| $35,000 to $49,999 | 70 | 8.7% |
| $50,000 to $74,999 | 185 | 22.9% |
| $75,000 to $99,999 | 140 | 17.3% |
| $100,000 to $149,999 | 213 | 26.3% |
| $150,000 to $199,999 | 12 | 1.5% |
| $200,000+ | 5 | 0.6% |
Family Income by Famaliy Size in Paw Paw
5-person families (89 | 11.0%) account for the highest median family income in Paw Paw with $81,458 per family, while 2-person families (346 | 42.8%) have the highest median income of $28,594 per family member.
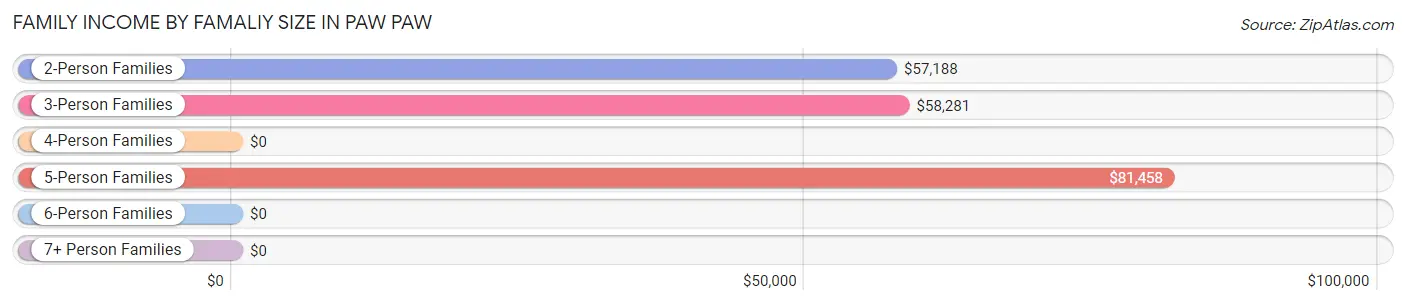
| Income Bracket | # Families | Median Income |
| 2-Person Families | 346 (42.8%) | $57,188 |
| 3-Person Families | 162 (20.0%) | $58,281 |
| 4-Person Families | 190 (23.5%) | $0 |
| 5-Person Families | 89 (11.0%) | $81,458 |
| 6-Person Families | 17 (2.1%) | $0 |
| 7+ Person Families | 5 (0.6%) | $0 |
| Total | 809 (100.0%) | $59,683 |
Family Income by Number of Earners in Paw Paw
The median family income in Paw Paw is $59,683, with families comprising 2 earners (281) having the highest median family income of $107,521, while families with no earners (171) have the lowest median family income of $2,499, accounting for 34.7% and 21.1% of families, respectively.
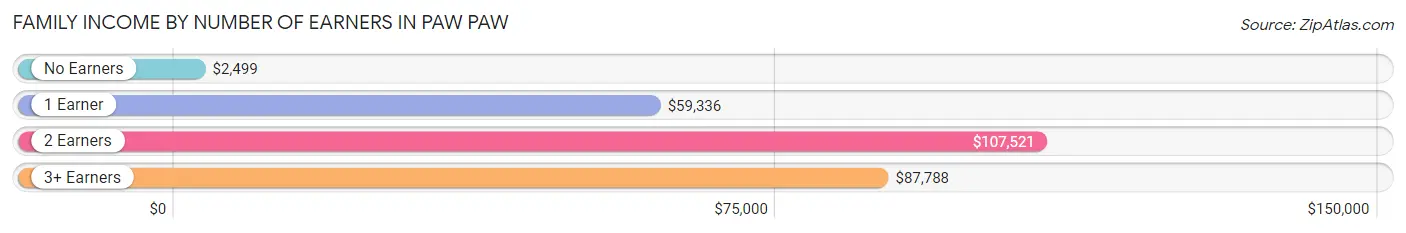
| Number of Earners | # Families | Median Income |
| No Earners | 171 (21.1%) | $2,499 |
| 1 Earner | 286 (35.3%) | $59,336 |
| 2 Earners | 281 (34.7%) | $107,521 |
| 3+ Earners | 71 (8.8%) | $87,788 |
| Total | 809 (100.0%) | $59,683 |
Household Income in Paw Paw
Household Income Brackets in Paw Paw
With 252 households falling in the category, the $50,000 to $74,999 income range is the most frequent in Paw Paw, accounting for 18.4% of all households. In contrast, only 5 households (0.4%) fall into the $200,000+ income bracket, making it the least populous group.
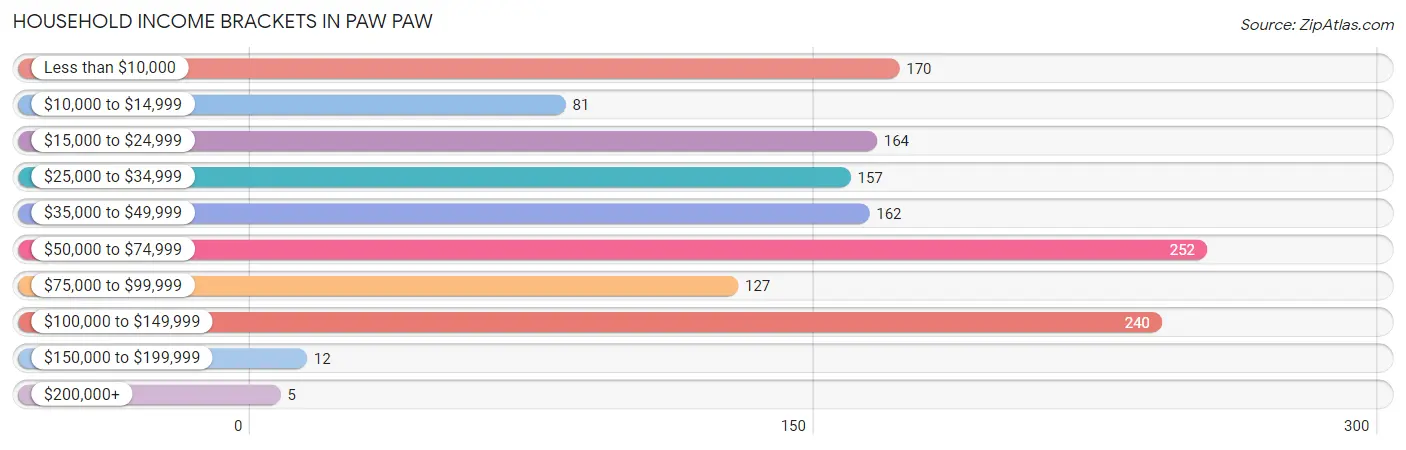
| Income Bracket | # Households | % Households |
| Less than $10,000 | 170 | 12.4% |
| $10,000 to $14,999 | 81 | 5.9% |
| $15,000 to $24,999 | 164 | 12.0% |
| $25,000 to $34,999 | 157 | 11.5% |
| $35,000 to $49,999 | 162 | 11.8% |
| $50,000 to $74,999 | 252 | 18.4% |
| $75,000 to $99,999 | 127 | 9.3% |
| $100,000 to $149,999 | 240 | 17.5% |
| $150,000 to $199,999 | 12 | 0.9% |
| $200,000+ | 5 | 0.4% |
Household Income by Householder Age in Paw Paw
The median household income in Paw Paw is $46,516, with the highest median household income of $52,450 found in the 25 to 44 years age bracket for the primary householder. A total of 518 households (37.8%) fall into this category. Meanwhile, the 15 to 24 years age bracket for the primary householder has the lowest median household income of $32,781, with 71 households (5.2%) in this group.
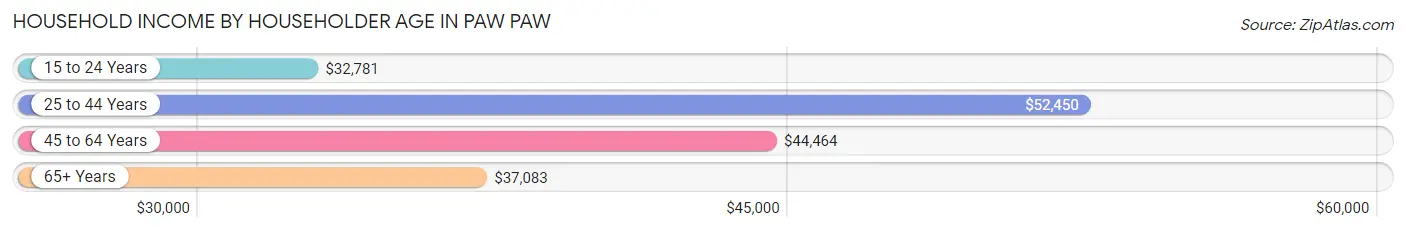
| Income Bracket | # Households | Median Income |
| 15 to 24 Years | 71 (5.2%) | $32,781 |
| 25 to 44 Years | 518 (37.8%) | $52,450 |
| 45 to 64 Years | 384 (28.1%) | $44,464 |
| 65+ Years | 396 (28.9%) | $37,083 |
| Total | 1,369 (100.0%) | $46,516 |
Poverty in Paw Paw
Income Below Poverty by Sex and Age in Paw Paw
With 12.0% poverty level for males and 16.3% for females among the residents of Paw Paw, under 5 year old males and 25 to 34 year old females are the most vulnerable to poverty, with 102 males (52.8%) and 93 females (35.6%) in their respective age groups living below the poverty level.
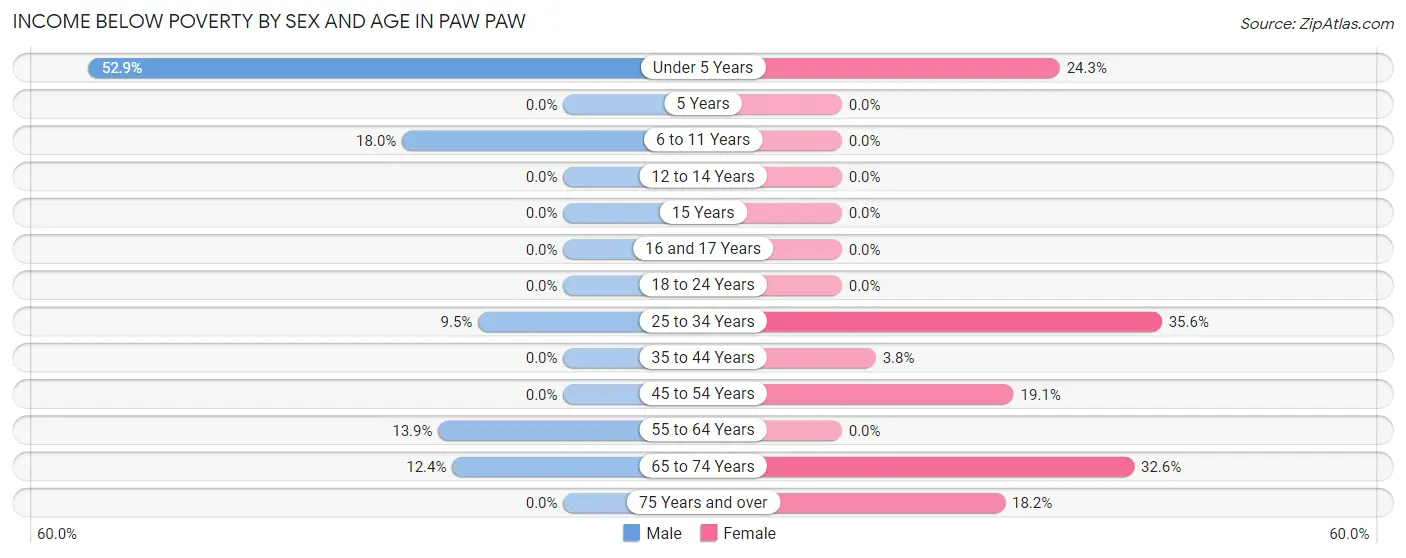
| Age Bracket | Male | Female |
| Under 5 Years | 102 (52.8%) | 25 (24.3%) |
| 5 Years | 0 (0.0%) | 0 (0.0%) |
| 6 to 11 Years | 49 (17.9%) | 0 (0.0%) |
| 12 to 14 Years | 0 (0.0%) | 0 (0.0%) |
| 15 Years | 0 (0.0%) | 0 (0.0%) |
| 16 and 17 Years | 0 (0.0%) | 0 (0.0%) |
| 18 to 24 Years | 0 (0.0%) | 0 (0.0%) |
| 25 to 34 Years | 13 (9.5%) | 93 (35.6%) |
| 35 to 44 Years | 0 (0.0%) | 9 (3.8%) |
| 45 to 54 Years | 0 (0.0%) | 31 (19.1%) |
| 55 to 64 Years | 17 (13.9%) | 0 (0.0%) |
| 65 to 74 Years | 12 (12.4%) | 69 (32.6%) |
| 75 Years and over | 0 (0.0%) | 24 (18.2%) |
| Total | 193 (12.0%) | 251 (16.3%) |
Income Above Poverty by Sex and Age in Paw Paw
According to the poverty statistics in Paw Paw, males aged 5 years and females aged 5 years are the age groups that are most secure financially, with 100.0% of males and 100.0% of females in these age groups living above the poverty line.
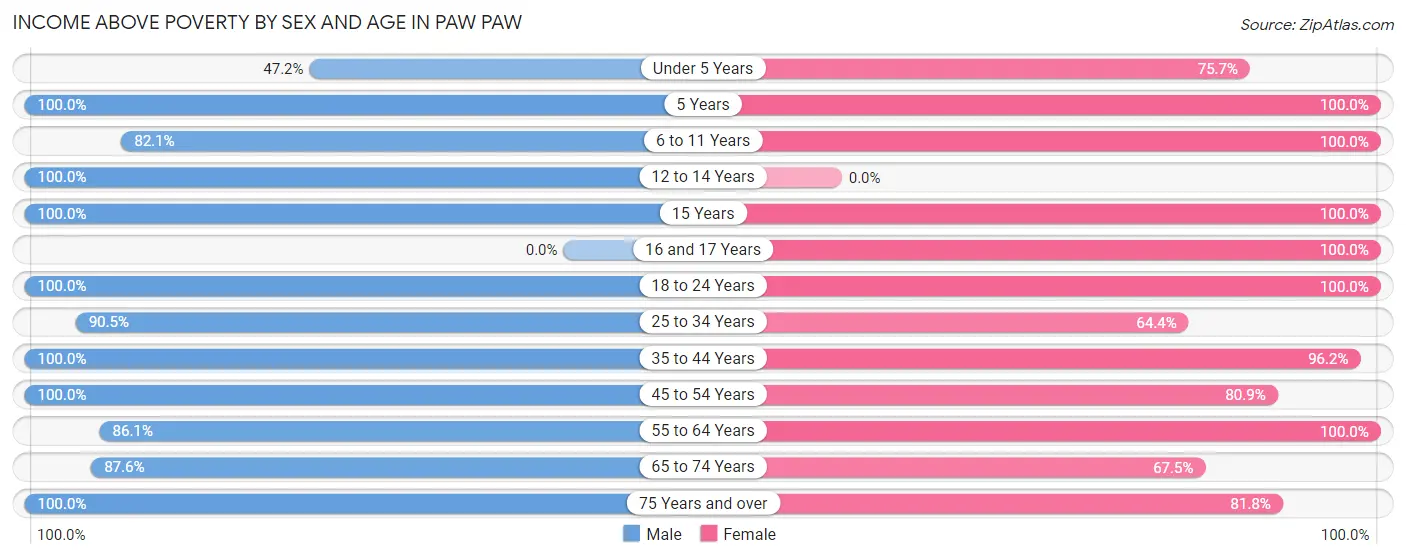
| Age Bracket | Male | Female |
| Under 5 Years | 91 (47.1%) | 78 (75.7%) |
| 5 Years | 83 (100.0%) | 34 (100.0%) |
| 6 to 11 Years | 224 (82.1%) | 141 (100.0%) |
| 12 to 14 Years | 14 (100.0%) | 0 (0.0%) |
| 15 Years | 9 (100.0%) | 21 (100.0%) |
| 16 and 17 Years | 0 (0.0%) | 20 (100.0%) |
| 18 to 24 Years | 164 (100.0%) | 94 (100.0%) |
| 25 to 34 Years | 124 (90.5%) | 168 (64.4%) |
| 35 to 44 Years | 285 (100.0%) | 229 (96.2%) |
| 45 to 54 Years | 159 (100.0%) | 131 (80.9%) |
| 55 to 64 Years | 105 (86.1%) | 121 (100.0%) |
| 65 to 74 Years | 85 (87.6%) | 143 (67.4%) |
| 75 Years and over | 78 (100.0%) | 108 (81.8%) |
| Total | 1,421 (88.0%) | 1,288 (83.7%) |
Income Below Poverty Among Married-Couple Families in Paw Paw
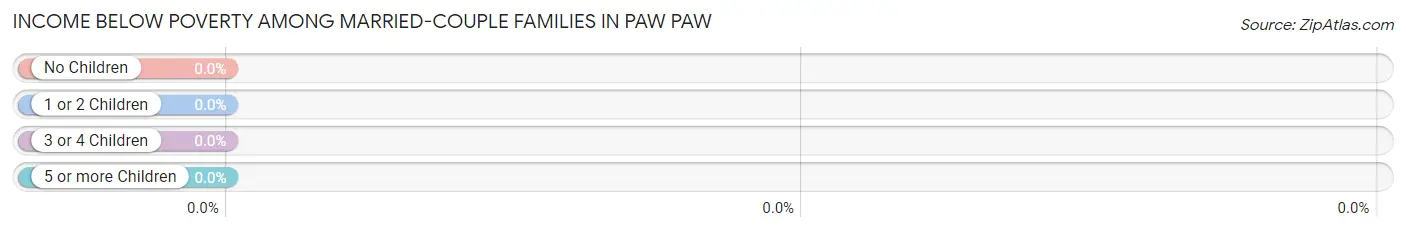
| Children | Above Poverty | Below Poverty |
| No Children | 162 (100.0%) | 0 (0.0%) |
| 1 or 2 Children | 121 (100.0%) | 0 (0.0%) |
| 3 or 4 Children | 70 (100.0%) | 0 (0.0%) |
| 5 or more Children | 0 (0.0%) | 0 (0.0%) |
| Total | 353 (100.0%) | 0 (0.0%) |
Income Below Poverty Among Single-Parent Households in Paw Paw
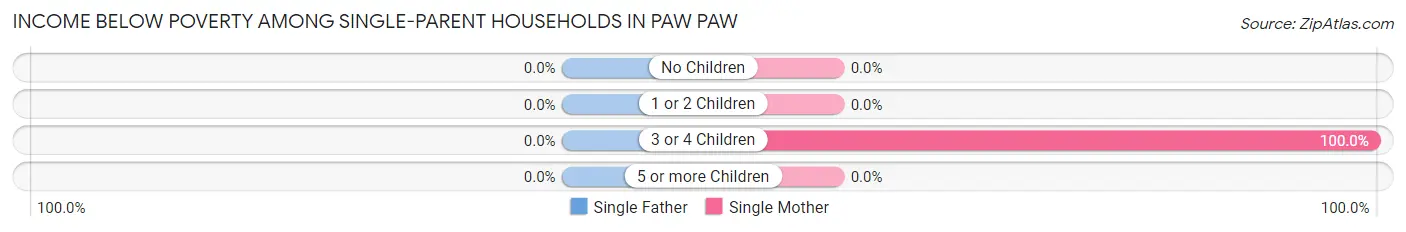
| Children | Single Father | Single Mother |
| No Children | 0 (0.0%) | 0 (0.0%) |
| 1 or 2 Children | 0 (0.0%) | 0 (0.0%) |
| 3 or 4 Children | 0 (0.0%) | 93 (100.0%) |
| 5 or more Children | 0 (0.0%) | 0 (0.0%) |
| Total | 0 (0.0%) | 93 (29.1%) |
Income Below Poverty Among Married-Couple vs Single-Parent Households in Paw Paw
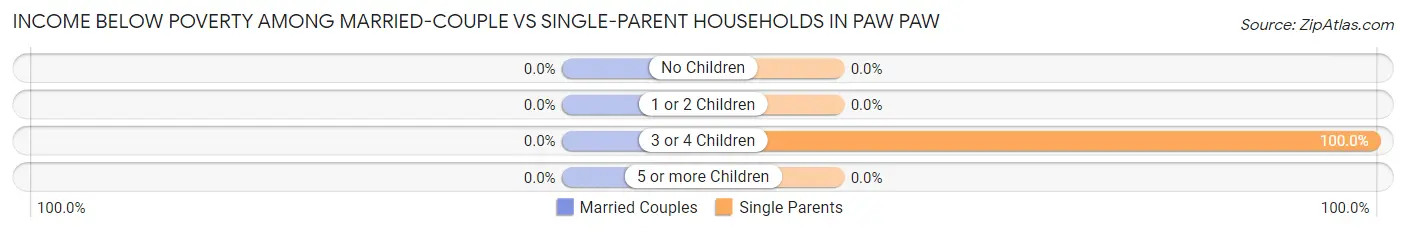
| Children | Married-Couple Families | Single-Parent Households |
| No Children | 0 (0.0%) | 0 (0.0%) |
| 1 or 2 Children | 0 (0.0%) | 0 (0.0%) |
| 3 or 4 Children | 0 (0.0%) | 93 (100.0%) |
| 5 or more Children | 0 (0.0%) | 0 (0.0%) |
| Total | 0 (0.0%) | 93 (20.4%) |
Race in Paw Paw
The most populous races in Paw Paw are White / Caucasian (2,887 | 87.0%), Hispanic or Latino (421 | 12.7%), and Two or more Races (337 | 10.2%).
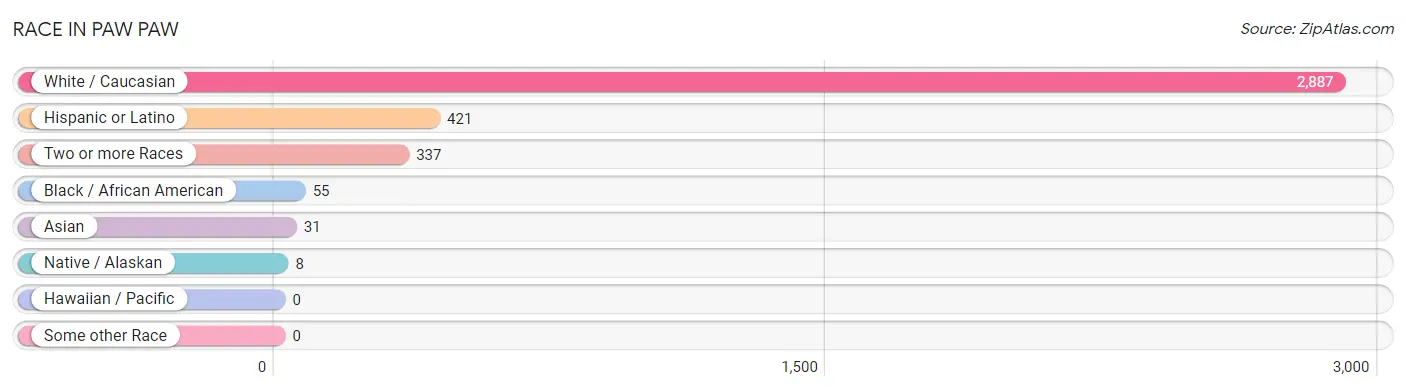
| Race | # Population | % Population |
| Asian | 31 | 0.9% |
| Black / African American | 55 | 1.7% |
| Hawaiian / Pacific | 0 | 0.0% |
| Hispanic or Latino | 421 | 12.7% |
| Native / Alaskan | 8 | 0.2% |
| White / Caucasian | 2,887 | 87.0% |
| Two or more Races | 337 | 10.2% |
| Some other Race | 0 | 0.0% |
| Total | 3,318 | 100.0% |
Ancestry in Paw Paw
The most populous ancestries reported in Paw Paw are German (774 | 23.3%), Irish (427 | 12.9%), Mexican (329 | 9.9%), English (311 | 9.4%), and French (230 | 6.9%), together accounting for 62.4% of all Paw Paw residents.
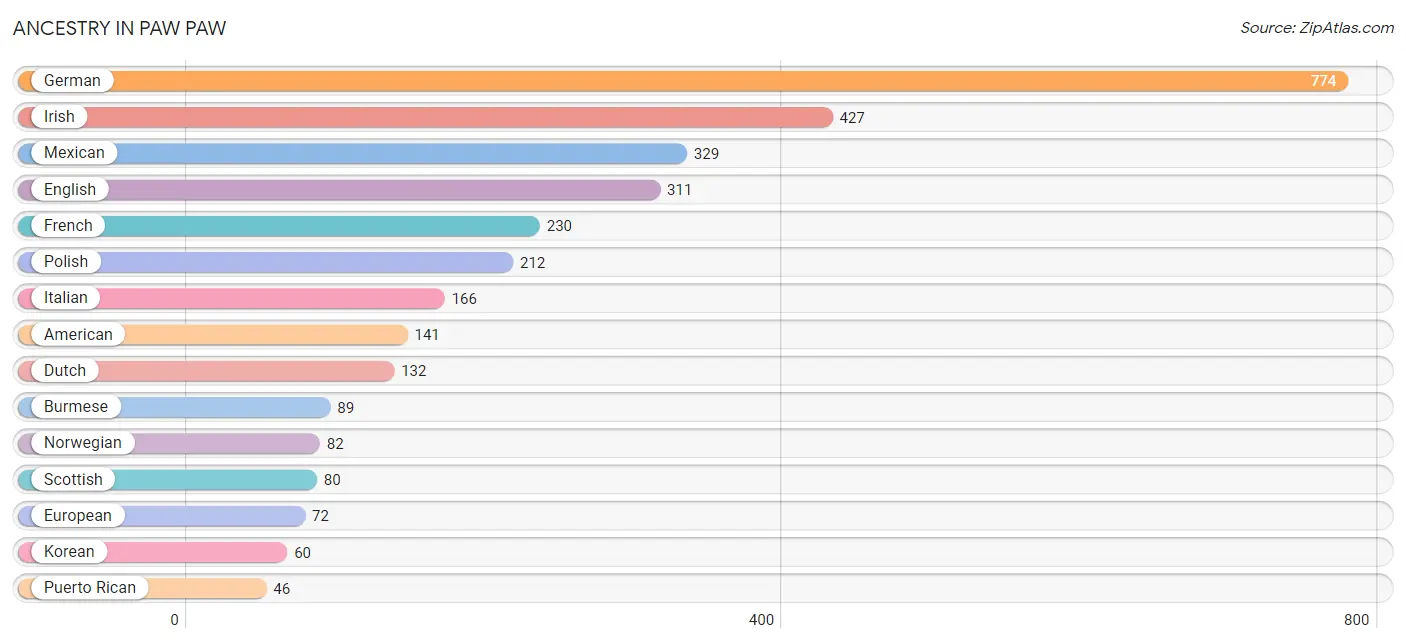
| Ancestry | # Population | % Population |
| American | 141 | 4.3% |
| Arab | 7 | 0.2% |
| Australian | 40 | 1.2% |
| Blackfeet | 13 | 0.4% |
| British | 10 | 0.3% |
| Burmese | 89 | 2.7% |
| Cherokee | 13 | 0.4% |
| Chippewa | 6 | 0.2% |
| Cuban | 34 | 1.0% |
| Czech | 7 | 0.2% |
| Czechoslovakian | 10 | 0.3% |
| Danish | 13 | 0.4% |
| Dutch | 132 | 4.0% |
| English | 311 | 9.4% |
| European | 72 | 2.2% |
| Finnish | 9 | 0.3% |
| French | 230 | 6.9% |
| German | 774 | 23.3% |
| Hungarian | 39 | 1.2% |
| Indian (Asian) | 17 | 0.5% |
| Irish | 427 | 12.9% |
| Italian | 166 | 5.0% |
| Korean | 60 | 1.8% |
| Mexican | 329 | 9.9% |
| Moroccan | 7 | 0.2% |
| Norwegian | 82 | 2.5% |
| Polish | 212 | 6.4% |
| Potawatomi | 8 | 0.2% |
| Puerto Rican | 46 | 1.4% |
| Scottish | 80 | 2.4% |
| Spaniard | 12 | 0.4% |
| Swedish | 32 | 1.0% | View All 32 Rows |
Immigrants in Paw Paw
The most numerous immigrant groups reported in Paw Paw came from Australia (40 | 1.2%), Oceania (40 | 1.2%), Asia (31 | 0.9%), Central America (31 | 0.9%), and Latin America (31 | 0.9%), together accounting for 5.2% of all Paw Paw residents.
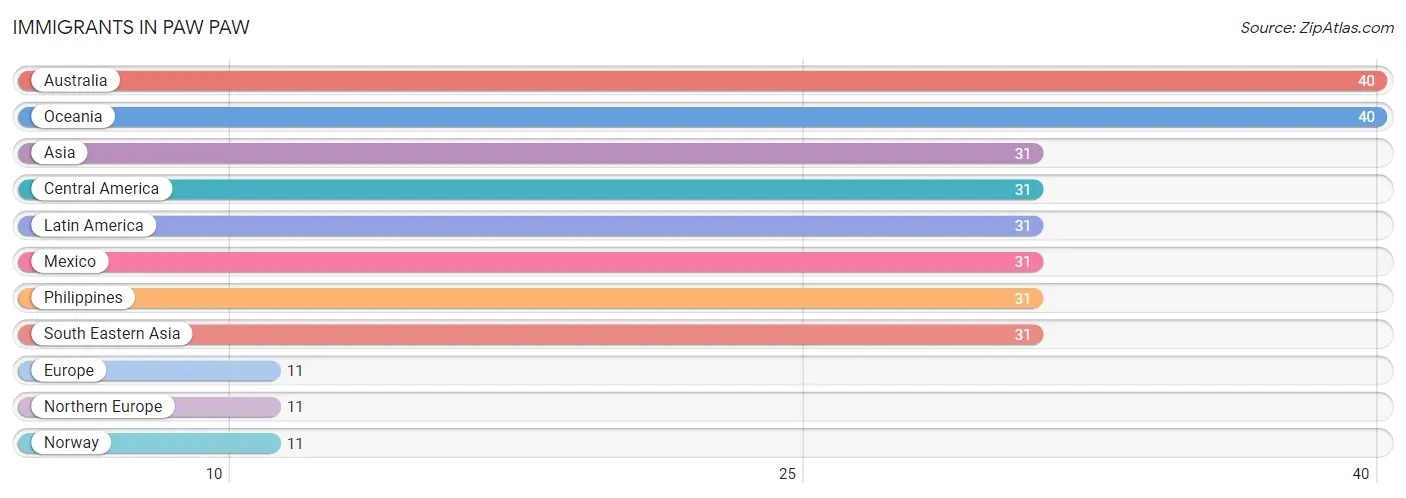
| Immigration Origin | # Population | % Population |
| Asia | 31 | 0.9% |
| Australia | 40 | 1.2% |
| Central America | 31 | 0.9% |
| Europe | 11 | 0.3% |
| Latin America | 31 | 0.9% |
| Mexico | 31 | 0.9% |
| Northern Europe | 11 | 0.3% |
| Norway | 11 | 0.3% |
| Oceania | 40 | 1.2% |
| Philippines | 31 | 0.9% |
| South Eastern Asia | 31 | 0.9% | View All 11 Rows |
Sex and Age in Paw Paw
Sex and Age in Paw Paw
The most populous age groups in Paw Paw are 35 to 39 Years (269 | 15.6%) for men and 25 to 29 Years (192 | 12.1%) for women.
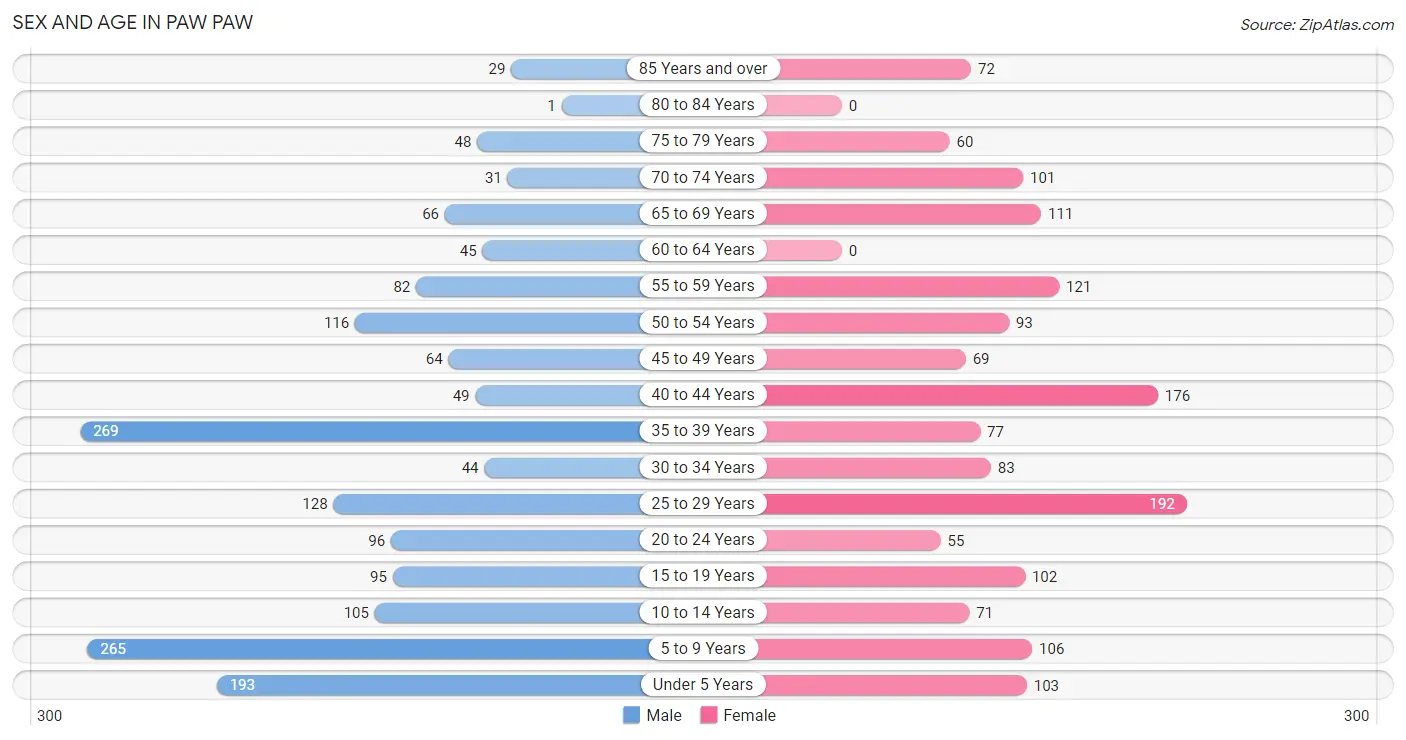
| Age Bracket | Male | Female |
| Under 5 Years | 193 (11.2%) | 103 (6.5%) |
| 5 to 9 Years | 265 (15.3%) | 106 (6.7%) |
| 10 to 14 Years | 105 (6.1%) | 71 (4.5%) |
| 15 to 19 Years | 95 (5.5%) | 102 (6.4%) |
| 20 to 24 Years | 96 (5.6%) | 55 (3.5%) |
| 25 to 29 Years | 128 (7.4%) | 192 (12.1%) |
| 30 to 34 Years | 44 (2.5%) | 83 (5.2%) |
| 35 to 39 Years | 269 (15.6%) | 77 (4.8%) |
| 40 to 44 Years | 49 (2.8%) | 176 (11.1%) |
| 45 to 49 Years | 64 (3.7%) | 69 (4.3%) |
| 50 to 54 Years | 116 (6.7%) | 93 (5.8%) |
| 55 to 59 Years | 82 (4.8%) | 121 (7.6%) |
| 60 to 64 Years | 45 (2.6%) | 0 (0.0%) |
| 65 to 69 Years | 66 (3.8%) | 111 (7.0%) |
| 70 to 74 Years | 31 (1.8%) | 101 (6.3%) |
| 75 to 79 Years | 48 (2.8%) | 60 (3.8%) |
| 80 to 84 Years | 1 (0.1%) | 0 (0.0%) |
| 85 Years and over | 29 (1.7%) | 72 (4.5%) |
| Total | 1,726 (100.0%) | 1,592 (100.0%) |
Families and Households in Paw Paw
Median Family Size in Paw Paw
The median family size in Paw Paw is 3.11 persons per family, with married-couple families (353 | 43.6%) accounting for the largest median family size of 3.81 persons per family. On the other hand, single male/father families (137 | 16.9%) represent the smallest median family size with 2.21 persons per family.
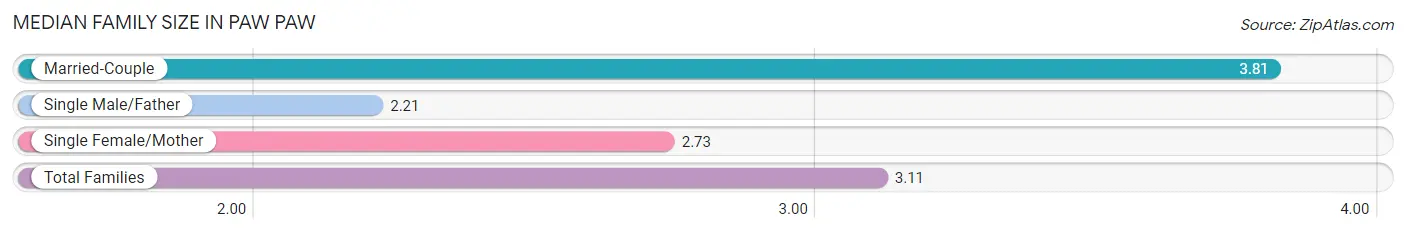
| Family Type | # Families | Family Size |
| Married-Couple | 353 (43.6%) | 3.81 |
| Single Male/Father | 137 (16.9%) | 2.21 |
| Single Female/Mother | 319 (39.4%) | 2.73 |
| Total Families | 809 (100.0%) | 3.11 |
Median Household Size in Paw Paw
The median household size in Paw Paw is 2.30 persons per household, with married-couple households (353 | 25.8%) accounting for the largest median household size of 3.88 persons per household. non-family households (560 | 40.9%) represent the smallest median household size with 1.05 persons per household.
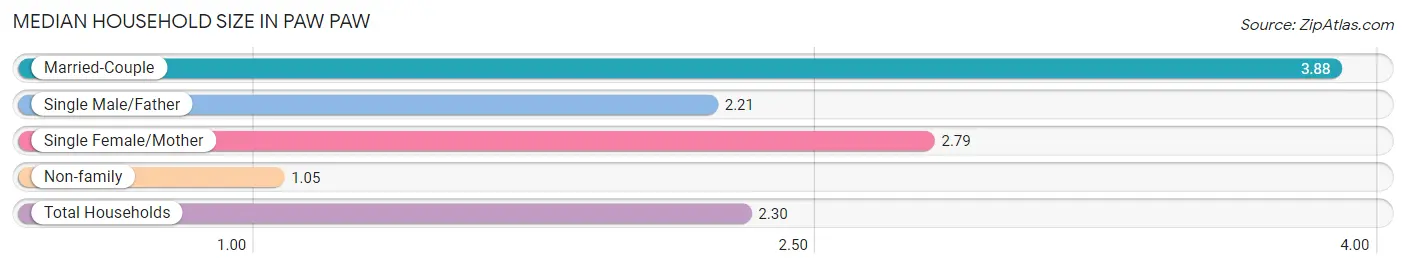
| Household Type | # Households | Household Size |
| Married-Couple | 353 (25.8%) | 3.88 |
| Single Male/Father | 137 (10.0%) | 2.21 |
| Single Female/Mother | 319 (23.3%) | 2.79 |
| Non-family | 560 (40.9%) | 1.05 |
| Total Households | 1,369 (100.0%) | 2.30 |
Household Size by Marriage Status in Paw Paw
Out of a total of 1,369 households in Paw Paw, 809 (59.1%) are family households, while 560 (40.9%) are nonfamily households. The most numerous type of family households are 2-person households, comprising 331, and the most common type of nonfamily households are 1-person households, comprising 531.
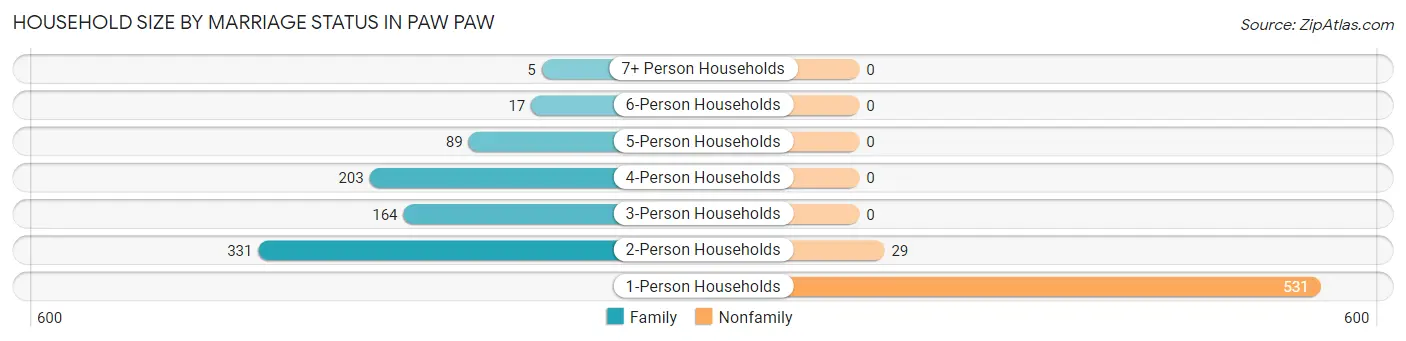
| Household Size | Family Households | Nonfamily Households |
| 1-Person Households | - | 531 (38.8%) |
| 2-Person Households | 331 (24.2%) | 29 (2.1%) |
| 3-Person Households | 164 (12.0%) | 0 (0.0%) |
| 4-Person Households | 203 (14.8%) | 0 (0.0%) |
| 5-Person Households | 89 (6.5%) | 0 (0.0%) |
| 6-Person Households | 17 (1.2%) | 0 (0.0%) |
| 7+ Person Households | 5 (0.4%) | 0 (0.0%) |
| Total | 809 (59.1%) | 560 (40.9%) |
Female Fertility in Paw Paw
Fertility by Age in Paw Paw
Average fertility rate in Paw Paw is 33.0 births per 1,000 women. Women in the age bracket of 15 to 19 years have the highest fertility rate with 176.0 births per 1,000 women. Women in the age bracket of 15 to 19 years acount for 72.0% of all women with births.
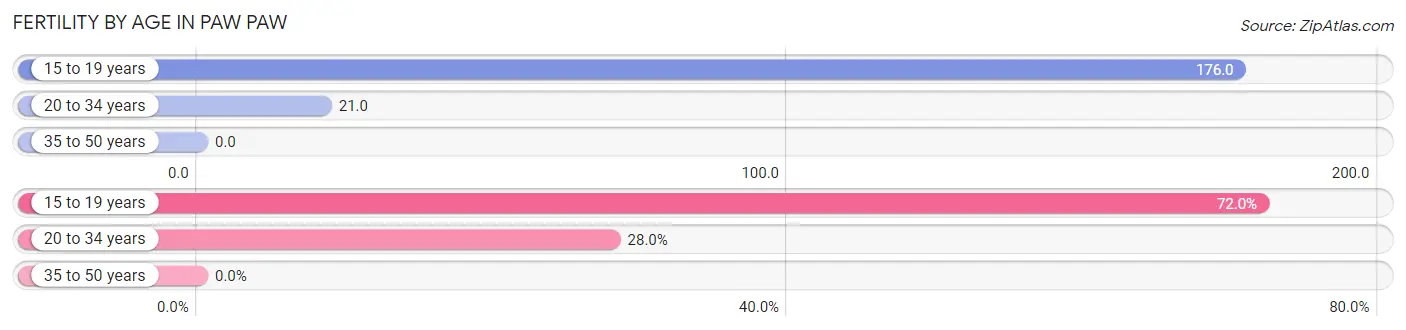
| Age Bracket | Women with Births | Births / 1,000 Women |
| 15 to 19 years | 18 (72.0%) | 176.0 |
| 20 to 34 years | 7 (28.0%) | 21.0 |
| 35 to 50 years | 0 (0.0%) | 0.0 |
| Total | 25 (100.0%) | 33.0 |
Fertility by Age by Marriage Status in Paw Paw
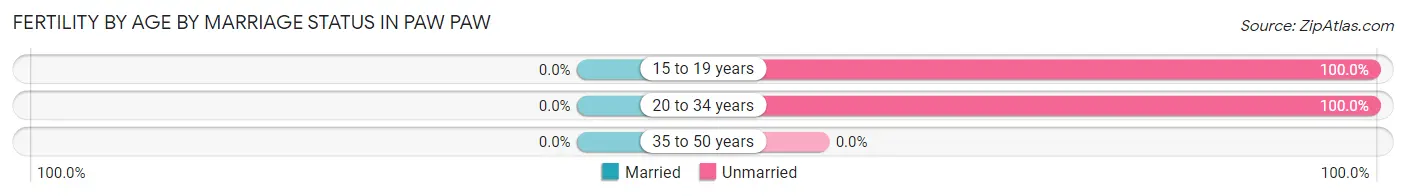
| Age Bracket | Married | Unmarried |
| 15 to 19 years | 0 (0.0%) | 18 (100.0%) |
| 20 to 34 years | 0 (0.0%) | 7 (100.0%) |
| 35 to 50 years | 0 (0.0%) | 0 (0.0%) |
| Total | 0 (0.0%) | 25 (100.0%) |
Fertility by Education in Paw Paw
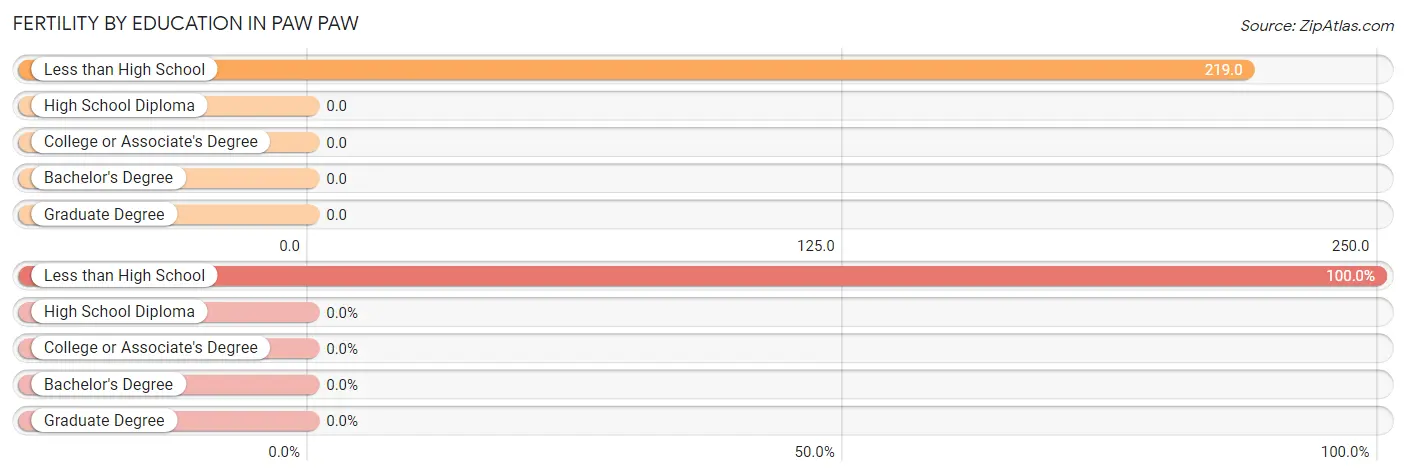
| Educational Attainment | Women with Births | Births / 1,000 Women |
| Less than High School | 25 (100.0%) | 219.0 |
| High School Diploma | 0 (0.0%) | 0.0 |
| College or Associate's Degree | 0 (0.0%) | 0.0 |
| Bachelor's Degree | 0 (0.0%) | 0.0 |
| Graduate Degree | 0 (0.0%) | 0.0 |
| Total | 25 (100.0%) | 33.0 |
Fertility by Education by Marriage Status in Paw Paw
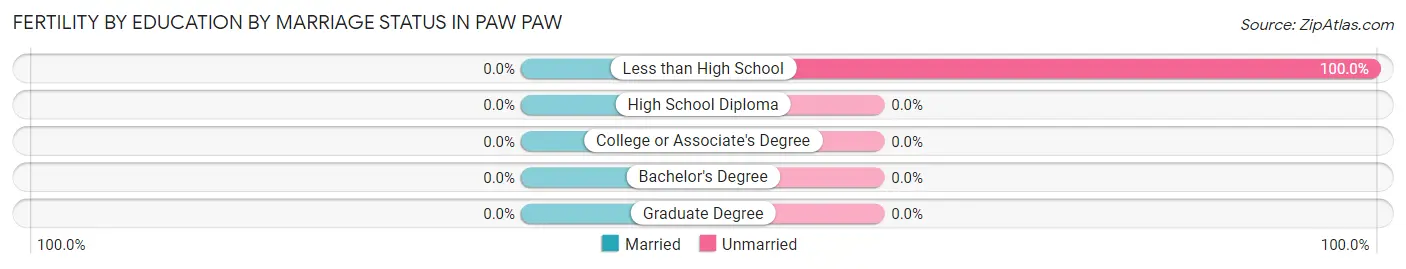
| Educational Attainment | Married | Unmarried |
| Less than High School | 0 (0.0%) | 25 (100.0%) |
| High School Diploma | 0 (0.0%) | 0 (0.0%) |
| College or Associate's Degree | 0 (0.0%) | 0 (0.0%) |
| Bachelor's Degree | 0 (0.0%) | 0 (0.0%) |
| Graduate Degree | 0 (0.0%) | 0 (0.0%) |
| Total | 0 (0.0%) | 25 (100.0%) |
Employment Characteristics in Paw Paw
Employment by Class of Employer in Paw Paw
Among the 1,293 employed individuals in Paw Paw, private company employees (1,031 | 79.7%), self-employed (not incorporated) (75 | 5.8%), and not-for-profit organizations (59 | 4.6%) make up the most common classes of employment.
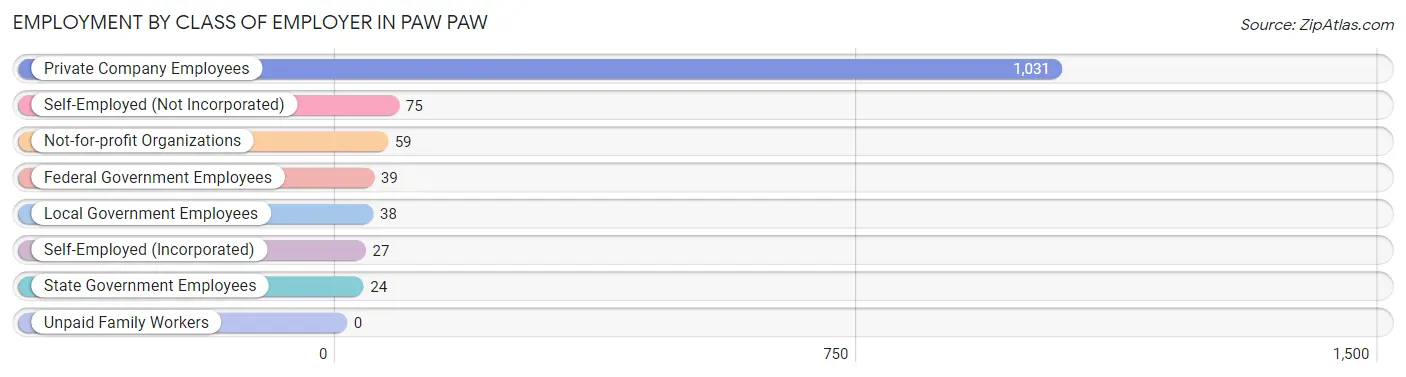
| Employer Class | # Employees | % Employees |
| Private Company Employees | 1,031 | 79.7% |
| Self-Employed (Incorporated) | 27 | 2.1% |
| Self-Employed (Not Incorporated) | 75 | 5.8% |
| Not-for-profit Organizations | 59 | 4.6% |
| Local Government Employees | 38 | 2.9% |
| State Government Employees | 24 | 1.9% |
| Federal Government Employees | 39 | 3.0% |
| Unpaid Family Workers | 0 | 0.0% |
| Total | 1,293 | 100.0% |
Employment Status by Age in Paw Paw
According to the labor force statistics for Paw Paw, out of the total population over 16 years of age (2,445), 56.6% or 1,384 individuals are in the labor force, with 6.6% or 91 of them unemployed. The age group with the highest labor force participation rate is 20 to 24 years, with 86.1% or 130 individuals in the labor force. Within the labor force, the 30 to 34 years age range has the highest percentage of unemployed individuals, with 17.4% or 15 of them being unemployed.
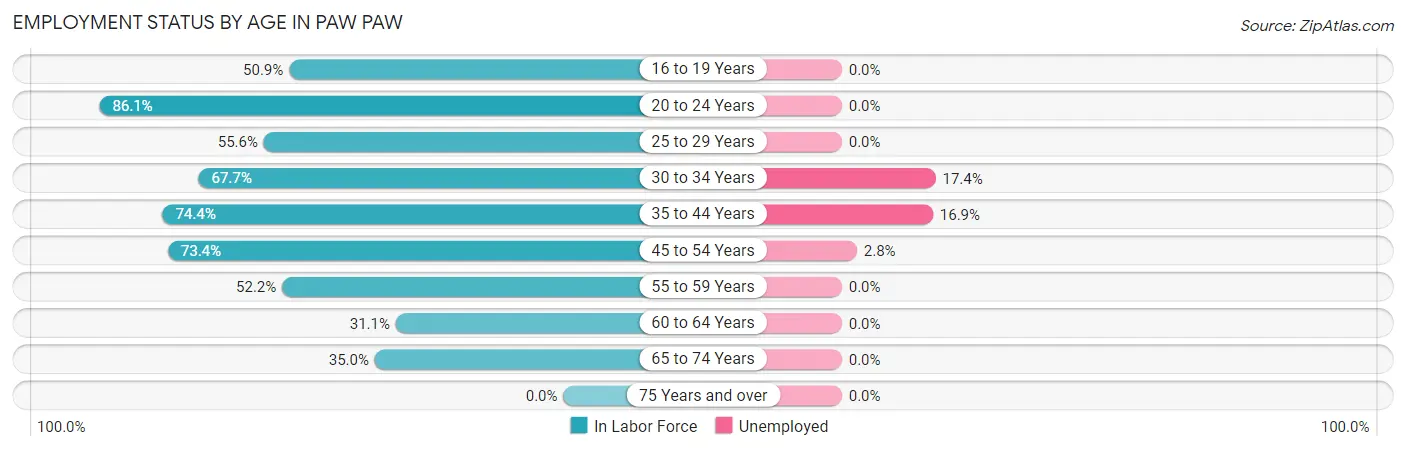
| Age Bracket | In Labor Force | Unemployed |
| 16 to 19 Years | 85 (50.9%) | 0 (0.0%) |
| 20 to 24 Years | 130 (86.1%) | 0 (0.0%) |
| 25 to 29 Years | 178 (55.6%) | 0 (0.0%) |
| 30 to 34 Years | 86 (67.7%) | 15 (17.4%) |
| 35 to 44 Years | 425 (74.4%) | 72 (16.9%) |
| 45 to 54 Years | 251 (73.4%) | 7 (2.8%) |
| 55 to 59 Years | 106 (52.2%) | 0 (0.0%) |
| 60 to 64 Years | 14 (31.1%) | 0 (0.0%) |
| 65 to 74 Years | 108 (35.0%) | 0 (0.0%) |
| 75 Years and over | 0 (0.0%) | 0 (0.0%) |
| Total | 1,384 (56.6%) | 91 (6.6%) |
Employment Status by Educational Attainment in Paw Paw
According to labor force statistics for Paw Paw, 65.9% of individuals (1,060) out of the total population between 25 and 64 years of age (1,608) are in the labor force, with 8.7% or 92 of them being unemployed. The group with the highest labor force participation rate are those with the educational attainment of college / associate degree, with 70.9% or 466 individuals in the labor force. Within the labor force, individuals with high school diploma education have the highest percentage of unemployment, with 13.0% or 57 of them being unemployed.
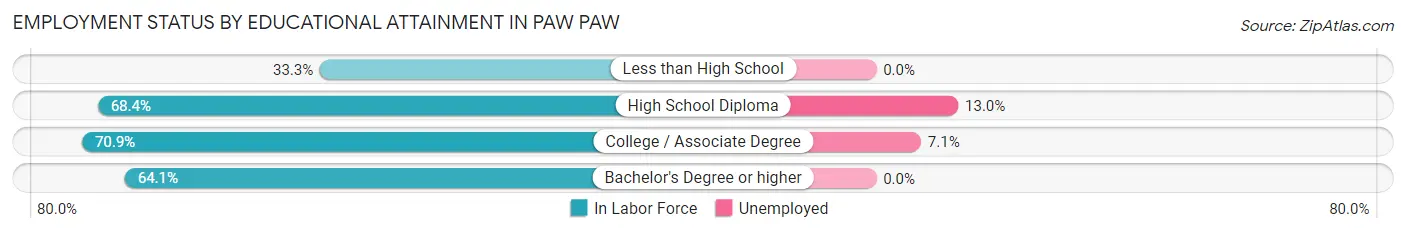
| Educational Attainment | In Labor Force | Unemployed |
| Less than High School | 47 (33.3%) | 0 (0.0%) |
| High School Diploma | 438 (68.4%) | 83 (13.0%) |
| College / Associate Degree | 466 (70.9%) | 47 (7.1%) |
| Bachelor's Degree or higher | 109 (64.1%) | 0 (0.0%) |
| Total | 1,060 (65.9%) | 140 (8.7%) |
Employment Occupations by Sex in Paw Paw
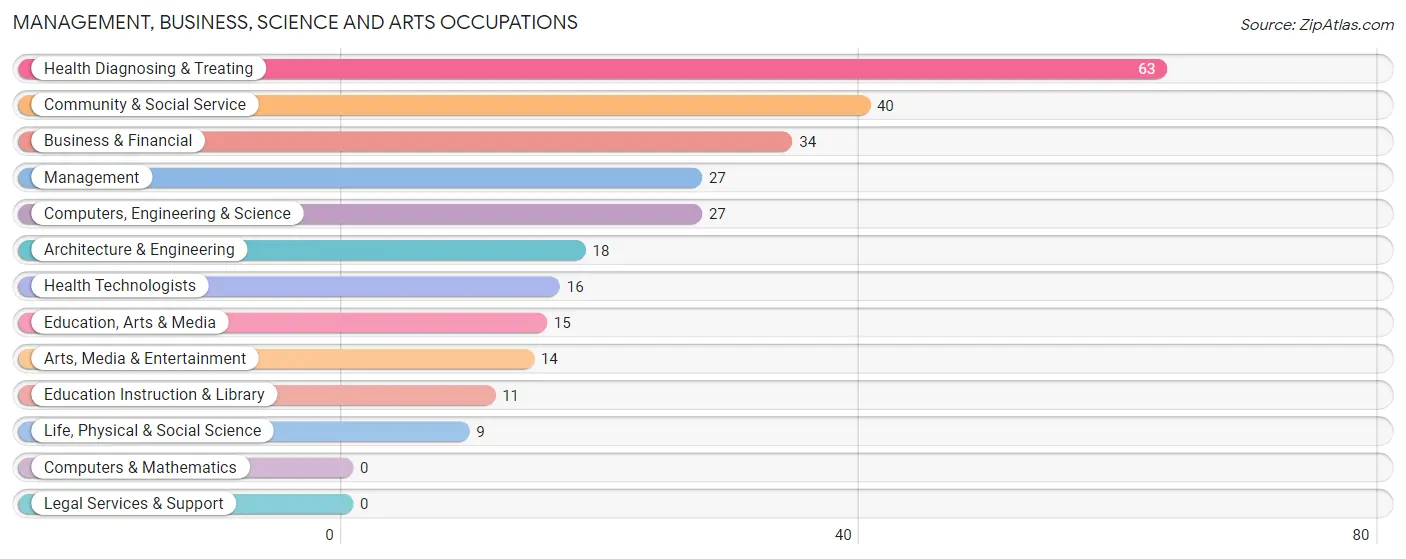
Management, Business, Science and Arts Occupations
The most common Management, Business, Science and Arts occupations in Paw Paw are Health Diagnosing & Treating (63 | 5.0%), Community & Social Service (40 | 3.2%), Business & Financial (34 | 2.7%), Management (27 | 2.1%), and Computers, Engineering & Science (27 | 2.1%).
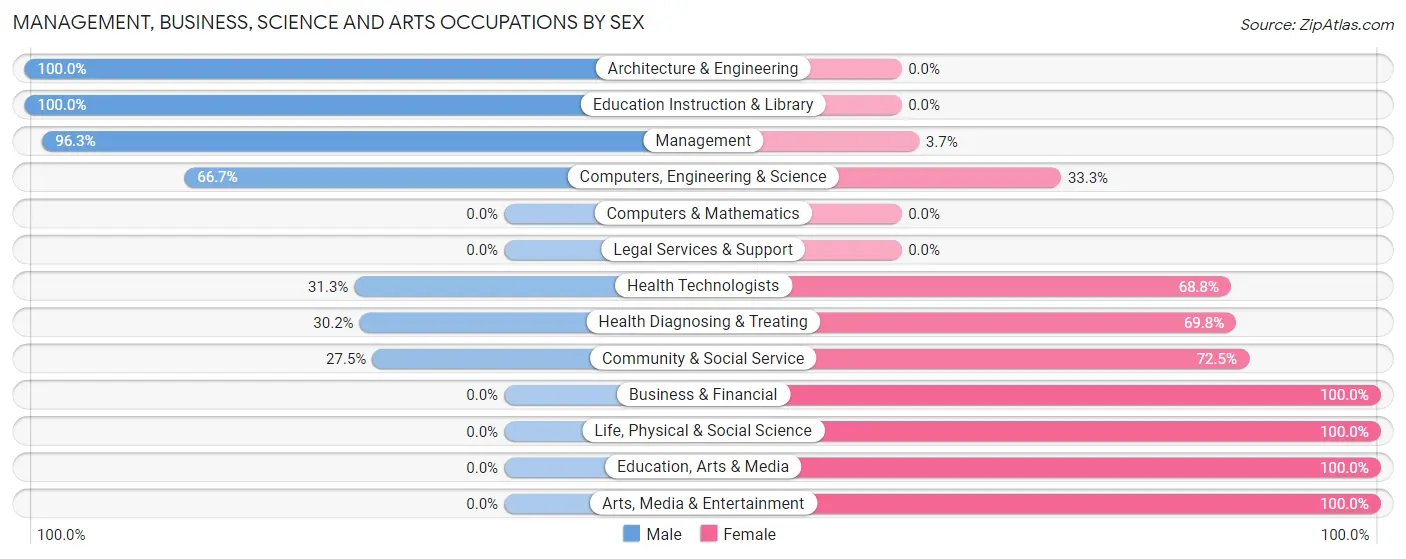
Management, Business, Science and Arts Occupations by Sex
Within the Management, Business, Science and Arts occupations in Paw Paw, the most male-oriented occupations are Architecture & Engineering (100.0%), Education Instruction & Library (100.0%), and Management (96.3%), while the most female-oriented occupations are Business & Financial (100.0%), Life, Physical & Social Science (100.0%), and Education, Arts & Media (100.0%).
| Occupation | Male | Female |
| Management | 26 (96.3%) | 1 (3.7%) |
| Business & Financial | 0 (0.0%) | 34 (100.0%) |
| Computers, Engineering & Science | 18 (66.7%) | 9 (33.3%) |
| Computers & Mathematics | 0 (0.0%) | 0 (0.0%) |
| Architecture & Engineering | 18 (100.0%) | 0 (0.0%) |
| Life, Physical & Social Science | 0 (0.0%) | 9 (100.0%) |
| Community & Social Service | 11 (27.5%) | 29 (72.5%) |
| Education, Arts & Media | 0 (0.0%) | 15 (100.0%) |
| Legal Services & Support | 0 (0.0%) | 0 (0.0%) |
| Education Instruction & Library | 11 (100.0%) | 0 (0.0%) |
| Arts, Media & Entertainment | 0 (0.0%) | 14 (100.0%) |
| Health Diagnosing & Treating | 19 (30.2%) | 44 (69.8%) |
| Health Technologists | 5 (31.2%) | 11 (68.8%) |
| Total (Category) | 74 (38.7%) | 117 (61.3%) |
| Total (Overall) | 654 (51.5%) | 616 (48.5%) |
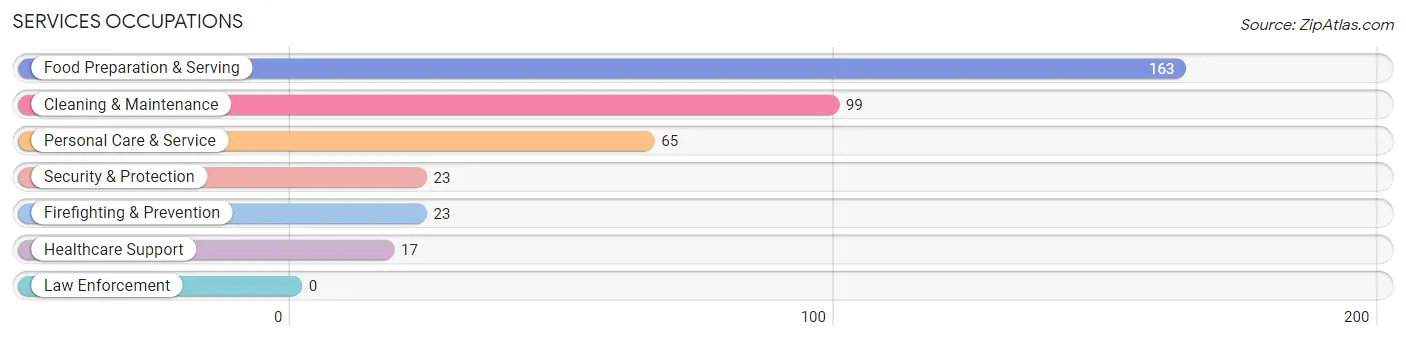
Services Occupations
The most common Services occupations in Paw Paw are Food Preparation & Serving (163 | 12.8%), Cleaning & Maintenance (99 | 7.8%), Personal Care & Service (65 | 5.1%), Security & Protection (23 | 1.8%), and Firefighting & Prevention (23 | 1.8%).
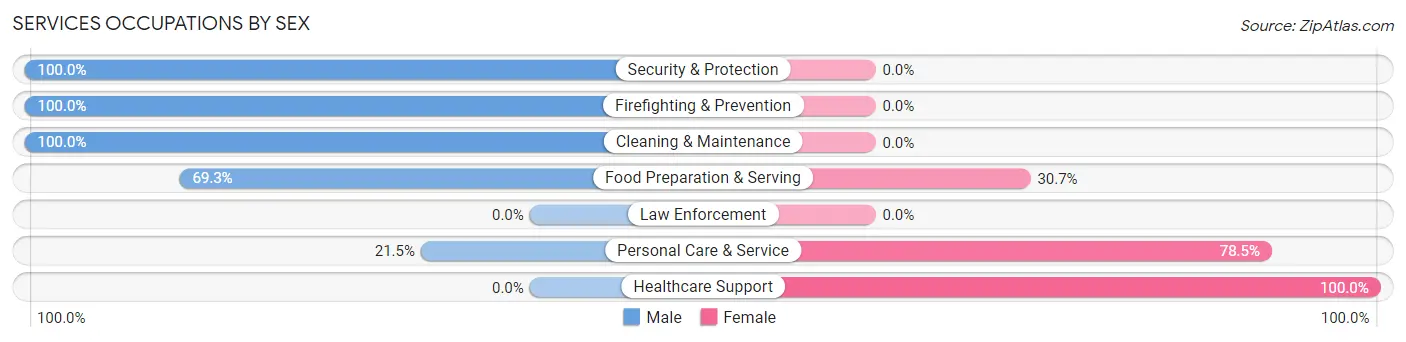
Services Occupations by Sex
Within the Services occupations in Paw Paw, the most male-oriented occupations are Security & Protection (100.0%), Firefighting & Prevention (100.0%), and Cleaning & Maintenance (100.0%), while the most female-oriented occupations are Healthcare Support (100.0%), Personal Care & Service (78.5%), and Food Preparation & Serving (30.7%).
| Occupation | Male | Female |
| Healthcare Support | 0 (0.0%) | 17 (100.0%) |
| Security & Protection | 23 (100.0%) | 0 (0.0%) |
| Firefighting & Prevention | 23 (100.0%) | 0 (0.0%) |
| Law Enforcement | 0 (0.0%) | 0 (0.0%) |
| Food Preparation & Serving | 113 (69.3%) | 50 (30.7%) |
| Cleaning & Maintenance | 99 (100.0%) | 0 (0.0%) |
| Personal Care & Service | 14 (21.5%) | 51 (78.5%) |
| Total (Category) | 249 (67.8%) | 118 (32.2%) |
| Total (Overall) | 654 (51.5%) | 616 (48.5%) |
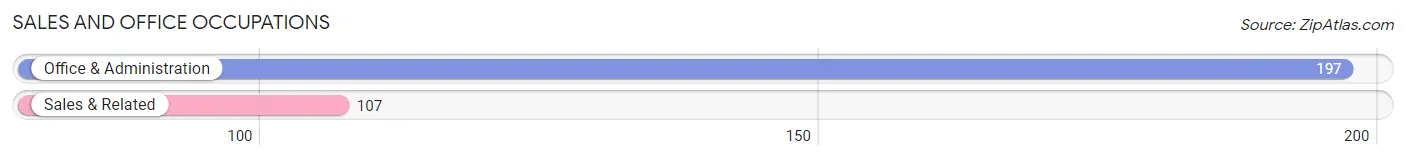
Sales and Office Occupations
The most common Sales and Office occupations in Paw Paw are Office & Administration (197 | 15.5%), and Sales & Related (107 | 8.4%).
Sales and Office Occupations by Sex
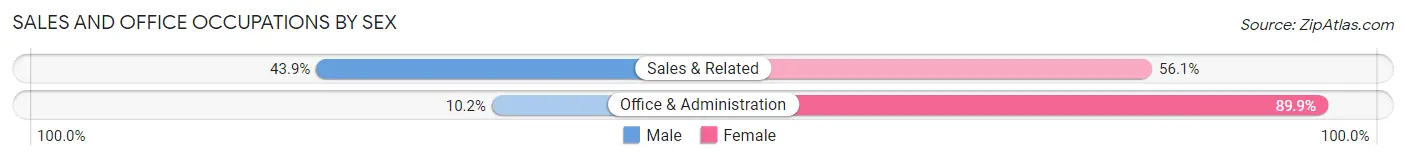
| Occupation | Male | Female |
| Sales & Related | 47 (43.9%) | 60 (56.1%) |
| Office & Administration | 20 (10.2%) | 177 (89.8%) |
| Total (Category) | 67 (22.0%) | 237 (78.0%) |
| Total (Overall) | 654 (51.5%) | 616 (48.5%) |
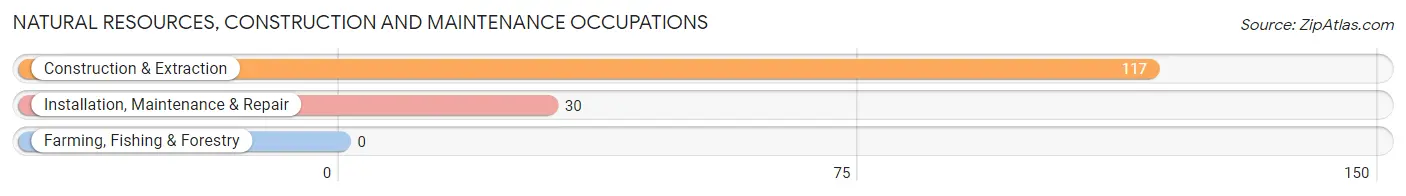
Natural Resources, Construction and Maintenance Occupations
The most common Natural Resources, Construction and Maintenance occupations in Paw Paw are Construction & Extraction (117 | 9.2%), and Installation, Maintenance & Repair (30 | 2.4%).
Natural Resources, Construction and Maintenance Occupations by Sex
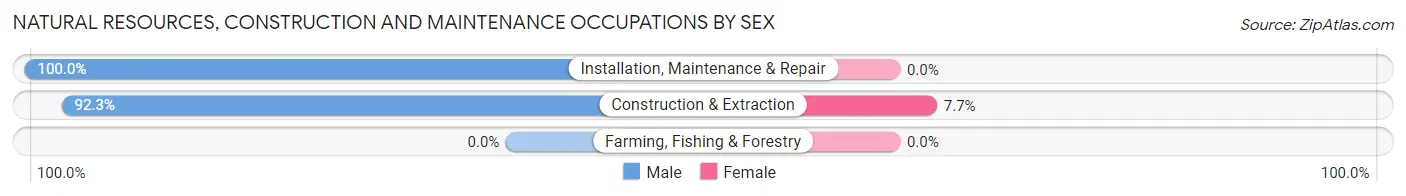
| Occupation | Male | Female |
| Farming, Fishing & Forestry | 0 (0.0%) | 0 (0.0%) |
| Construction & Extraction | 108 (92.3%) | 9 (7.7%) |
| Installation, Maintenance & Repair | 30 (100.0%) | 0 (0.0%) |
| Total (Category) | 138 (93.9%) | 9 (6.1%) |
| Total (Overall) | 654 (51.5%) | 616 (48.5%) |
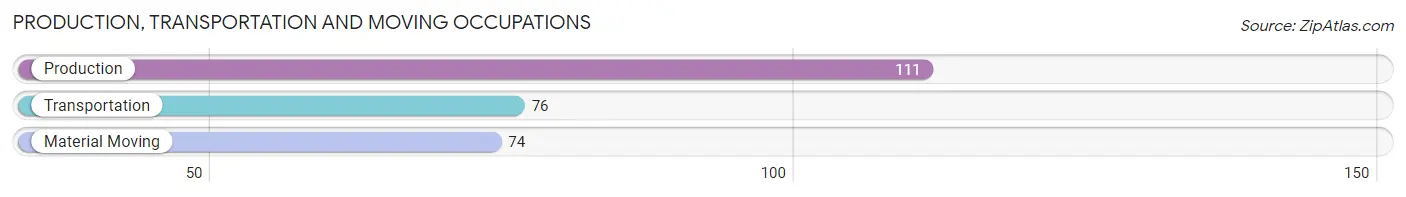
Production, Transportation and Moving Occupations
The most common Production, Transportation and Moving occupations in Paw Paw are Production (111 | 8.7%), Transportation (76 | 6.0%), and Material Moving (74 | 5.8%).
Production, Transportation and Moving Occupations by Sex
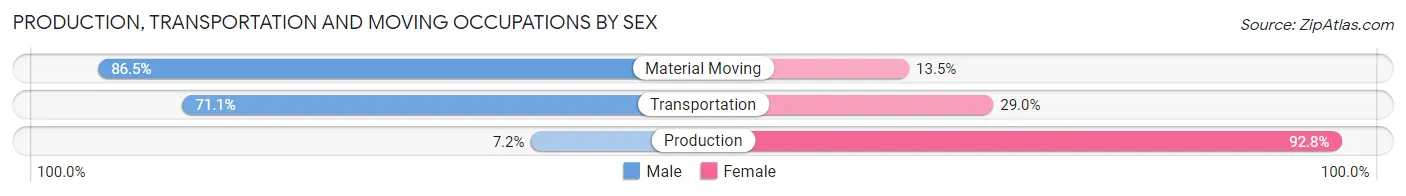
| Occupation | Male | Female |
| Production | 8 (7.2%) | 103 (92.8%) |
| Transportation | 54 (71.1%) | 22 (28.9%) |
| Material Moving | 64 (86.5%) | 10 (13.5%) |
| Total (Category) | 126 (48.3%) | 135 (51.7%) |
| Total (Overall) | 654 (51.5%) | 616 (48.5%) |
Employment Industries by Sex in Paw Paw
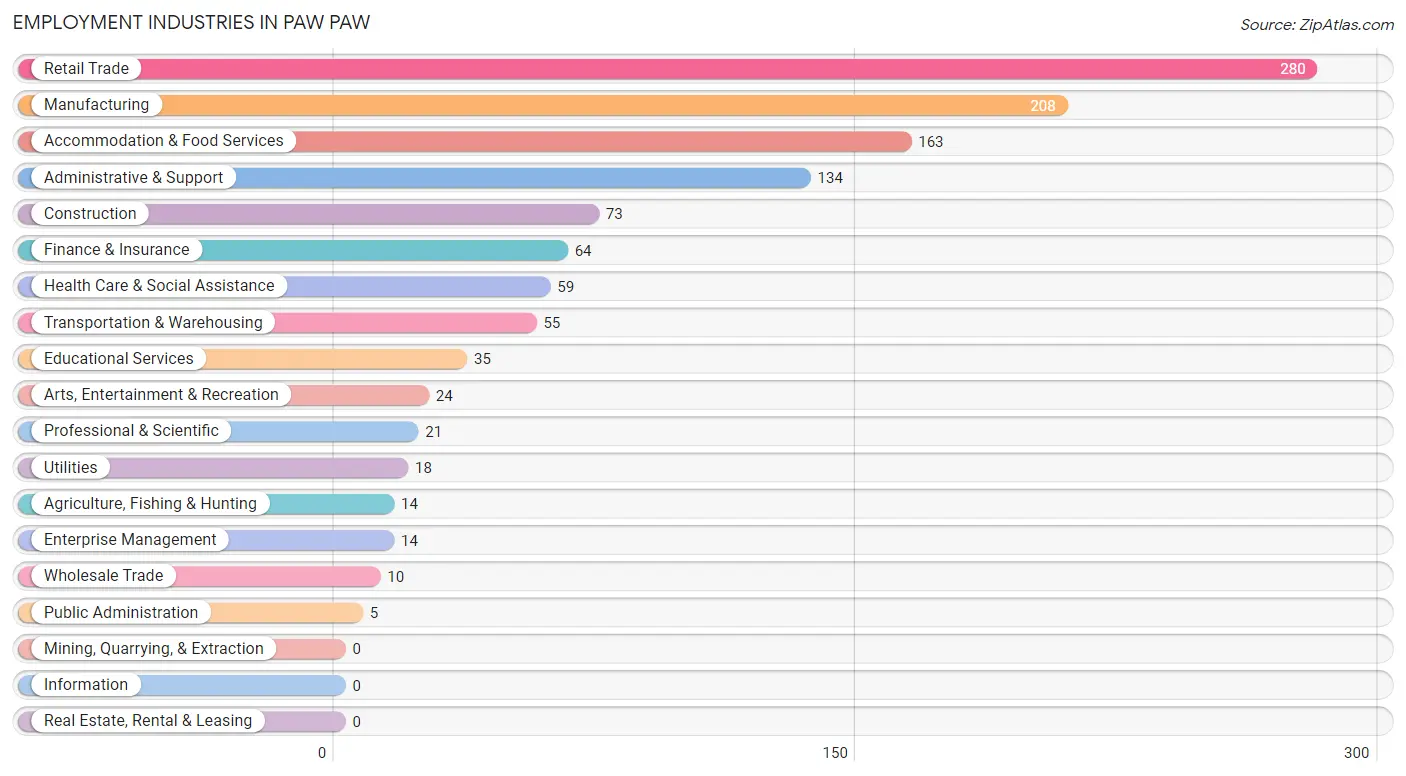
Employment Industries in Paw Paw
The major employment industries in Paw Paw include Retail Trade (280 | 22.1%), Manufacturing (208 | 16.4%), Accommodation & Food Services (163 | 12.8%), Administrative & Support (134 | 10.5%), and Construction (73 | 5.8%).
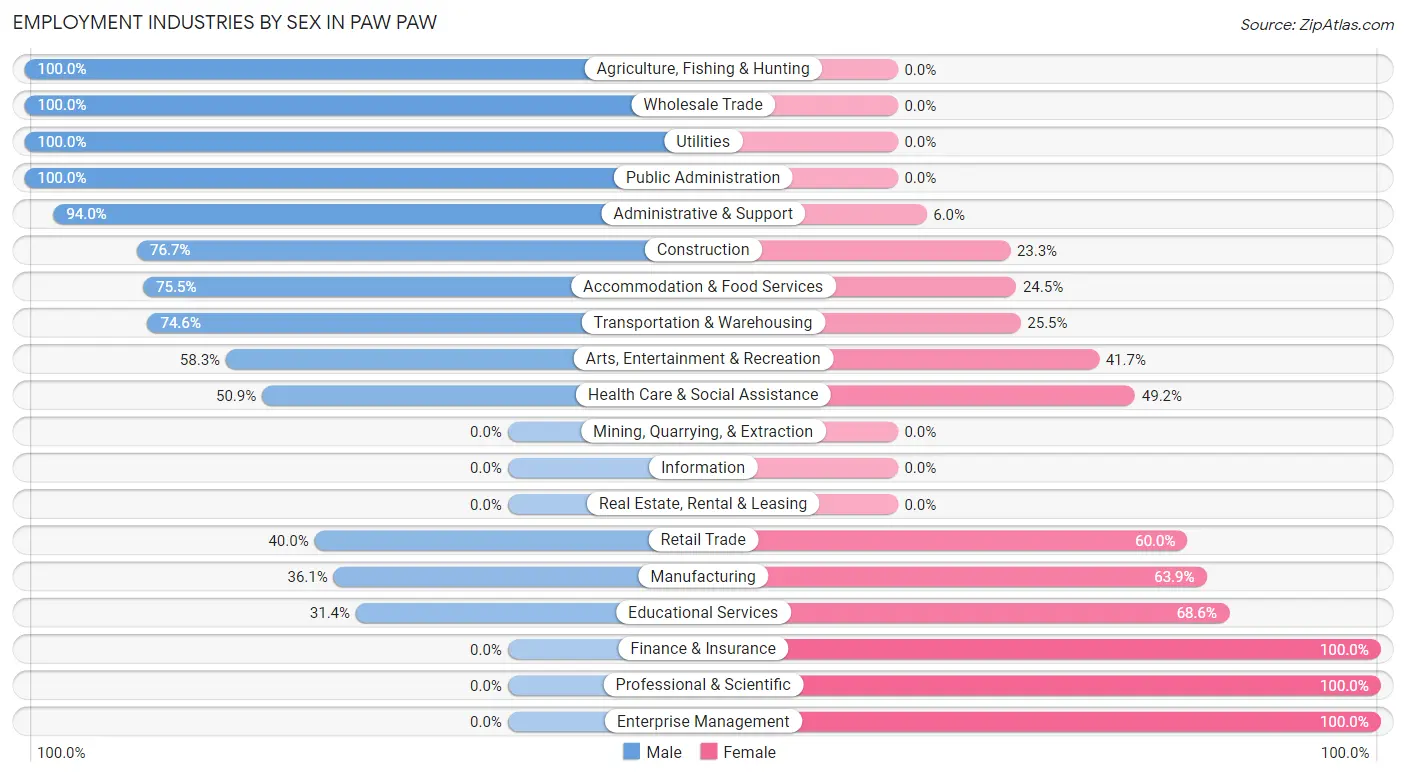
Employment Industries by Sex in Paw Paw
The Paw Paw industries that see more men than women are Agriculture, Fishing & Hunting (100.0%), Wholesale Trade (100.0%), and Utilities (100.0%), whereas the industries that tend to have a higher number of women are Finance & Insurance (100.0%), Professional & Scientific (100.0%), and Enterprise Management (100.0%).
| Industry | Male | Female |
| Agriculture, Fishing & Hunting | 14 (100.0%) | 0 (0.0%) |
| Mining, Quarrying, & Extraction | 0 (0.0%) | 0 (0.0%) |
| Construction | 56 (76.7%) | 17 (23.3%) |
| Manufacturing | 75 (36.1%) | 133 (63.9%) |
| Wholesale Trade | 10 (100.0%) | 0 (0.0%) |
| Retail Trade | 112 (40.0%) | 168 (60.0%) |
| Transportation & Warehousing | 41 (74.6%) | 14 (25.5%) |
| Utilities | 18 (100.0%) | 0 (0.0%) |
| Information | 0 (0.0%) | 0 (0.0%) |
| Finance & Insurance | 0 (0.0%) | 64 (100.0%) |
| Real Estate, Rental & Leasing | 0 (0.0%) | 0 (0.0%) |
| Professional & Scientific | 0 (0.0%) | 21 (100.0%) |
| Enterprise Management | 0 (0.0%) | 14 (100.0%) |
| Administrative & Support | 126 (94.0%) | 8 (6.0%) |
| Educational Services | 11 (31.4%) | 24 (68.6%) |
| Health Care & Social Assistance | 30 (50.8%) | 29 (49.1%) |
| Arts, Entertainment & Recreation | 14 (58.3%) | 10 (41.7%) |
| Accommodation & Food Services | 123 (75.5%) | 40 (24.5%) |
| Public Administration | 5 (100.0%) | 0 (0.0%) |
| Total | 654 (51.5%) | 616 (48.5%) |
Education in Paw Paw
School Enrollment in Paw Paw
The most common levels of schooling among the 731 students in Paw Paw are elementary school (223 | 30.5%), middle school (146 | 20.0%), and college / undergraduate (132 | 18.1%).
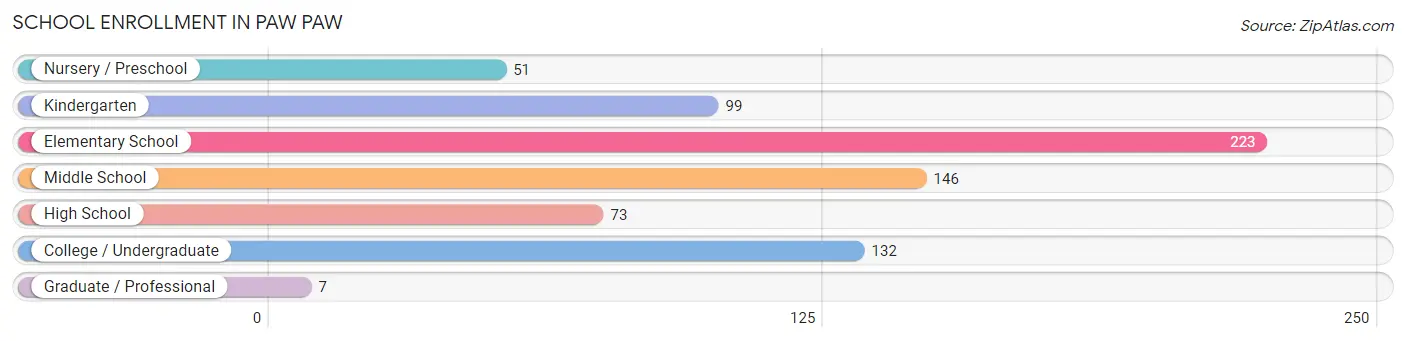
| School Level | # Students | % Students |
| Nursery / Preschool | 51 | 7.0% |
| Kindergarten | 99 | 13.5% |
| Elementary School | 223 | 30.5% |
| Middle School | 146 | 20.0% |
| High School | 73 | 10.0% |
| College / Undergraduate | 132 | 18.1% |
| Graduate / Professional | 7 | 1.0% |
| Total | 731 | 100.0% |
School Enrollment by Age by Funding Source in Paw Paw
Out of a total of 731 students who are enrolled in schools in Paw Paw, 116 (15.9%) attend a private institution, while the remaining 615 (84.1%) are enrolled in public schools. The age group of 5 to 9 year old has the highest likelihood of being enrolled in private schools, with 116 (33.8% in the age bracket) enrolled. Conversely, the age group of 10 to 14 year olds has the lowest likelihood of being enrolled in a private school, with 176 (100.0% in the age bracket) attending a public institution.
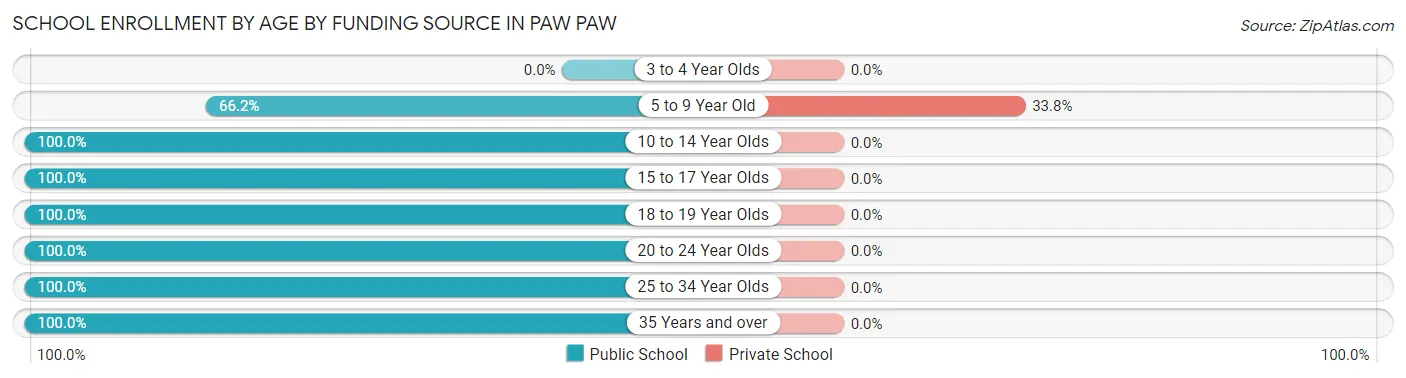
| Age Bracket | Public School | Private School |
| 3 to 4 Year Olds | 0 (0.0%) | 0 (0.0%) |
| 5 to 9 Year Old | 227 (66.2%) | 116 (33.8%) |
| 10 to 14 Year Olds | 176 (100.0%) | 0 (0.0%) |
| 15 to 17 Year Olds | 50 (100.0%) | 0 (0.0%) |
| 18 to 19 Year Olds | 72 (100.0%) | 0 (0.0%) |
| 20 to 24 Year Olds | 40 (100.0%) | 0 (0.0%) |
| 25 to 34 Year Olds | 26 (100.0%) | 0 (0.0%) |
| 35 Years and over | 24 (100.0%) | 0 (0.0%) |
| Total | 615 (84.1%) | 116 (15.9%) |
Educational Attainment by Field of Study in Paw Paw
Business (73 | 28.2%), liberal arts & history (42 | 16.2%), bio, nature & agricultural (29 | 11.2%), social sciences (23 | 8.9%), and education (21 | 8.1%) are the most common fields of study among 259 individuals in Paw Paw who have obtained a bachelor's degree or higher.
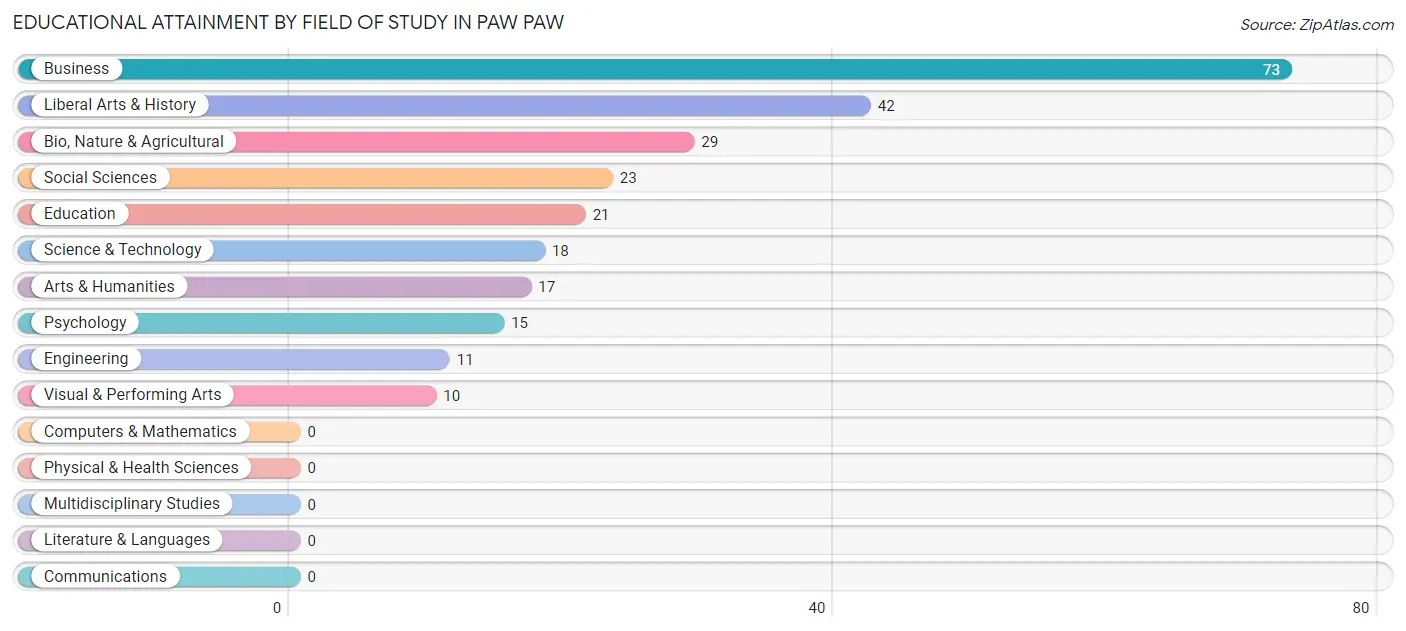
| Field of Study | # Graduates | % Graduates |
| Computers & Mathematics | 0 | 0.0% |
| Bio, Nature & Agricultural | 29 | 11.2% |
| Physical & Health Sciences | 0 | 0.0% |
| Psychology | 15 | 5.8% |
| Social Sciences | 23 | 8.9% |
| Engineering | 11 | 4.3% |
| Multidisciplinary Studies | 0 | 0.0% |
| Science & Technology | 18 | 7.0% |
| Business | 73 | 28.2% |
| Education | 21 | 8.1% |
| Literature & Languages | 0 | 0.0% |
| Liberal Arts & History | 42 | 16.2% |
| Visual & Performing Arts | 10 | 3.9% |
| Communications | 0 | 0.0% |
| Arts & Humanities | 17 | 6.6% |
| Total | 259 | 100.0% |
Transportation & Commute in Paw Paw
Vehicle Availability by Sex in Paw Paw
The most prevalent vehicle ownership categories in Paw Paw are males with 2 vehicles (391, accounting for 57.8%) and females with 2 vehicles (209, making up 63.6%).
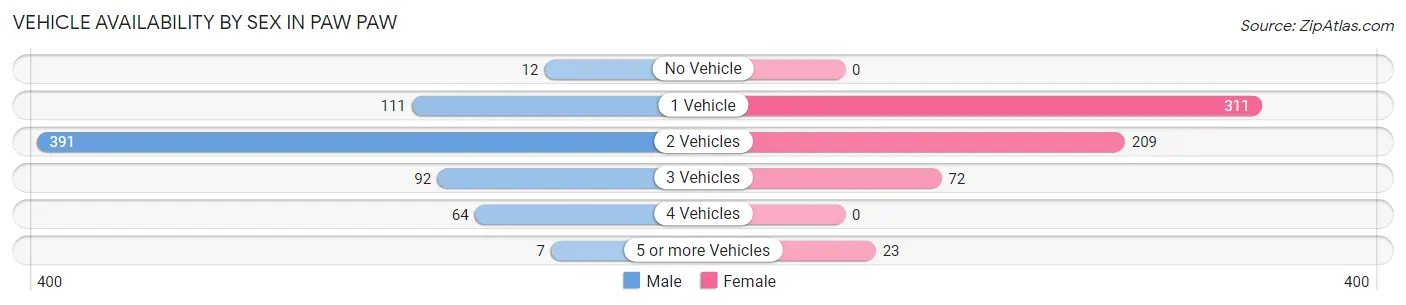
| Vehicles Available | Male | Female |
| No Vehicle | 12 (1.8%) | 0 (0.0%) |
| 1 Vehicle | 111 (16.4%) | 311 (50.6%) |
| 2 Vehicles | 391 (57.8%) | 209 (34.0%) |
| 3 Vehicles | 92 (13.6%) | 72 (11.7%) |
| 4 Vehicles | 64 (9.5%) | 0 (0.0%) |
| 5 or more Vehicles | 7 (1.0%) | 23 (3.7%) |
| Total | 677 (100.0%) | 615 (100.0%) |
Commute Time in Paw Paw
The most frequently occuring commute durations in Paw Paw are 10 to 14 minutes (212 commuters, 17.5%), 25 to 29 minutes (202 commuters, 16.6%), and 30 to 34 minutes (184 commuters, 15.2%).
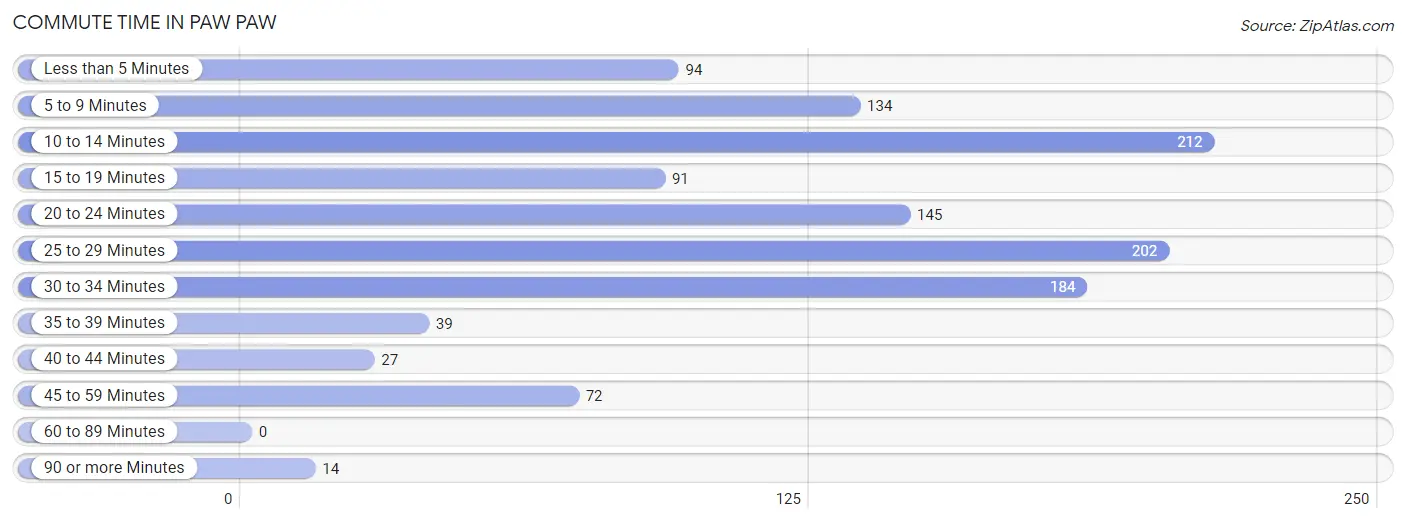
| Commute Time | # Commuters | % Commuters |
| Less than 5 Minutes | 94 | 7.7% |
| 5 to 9 Minutes | 134 | 11.0% |
| 10 to 14 Minutes | 212 | 17.5% |
| 15 to 19 Minutes | 91 | 7.5% |
| 20 to 24 Minutes | 145 | 11.9% |
| 25 to 29 Minutes | 202 | 16.6% |
| 30 to 34 Minutes | 184 | 15.2% |
| 35 to 39 Minutes | 39 | 3.2% |
| 40 to 44 Minutes | 27 | 2.2% |
| 45 to 59 Minutes | 72 | 5.9% |
| 60 to 89 Minutes | 0 | 0.0% |
| 90 or more Minutes | 14 | 1.1% |
Commute Time by Sex in Paw Paw
The most common commute times in Paw Paw are 30 to 34 minutes (129 commuters, 19.1%) for males and 25 to 29 minutes (110 commuters, 20.5%) for females.
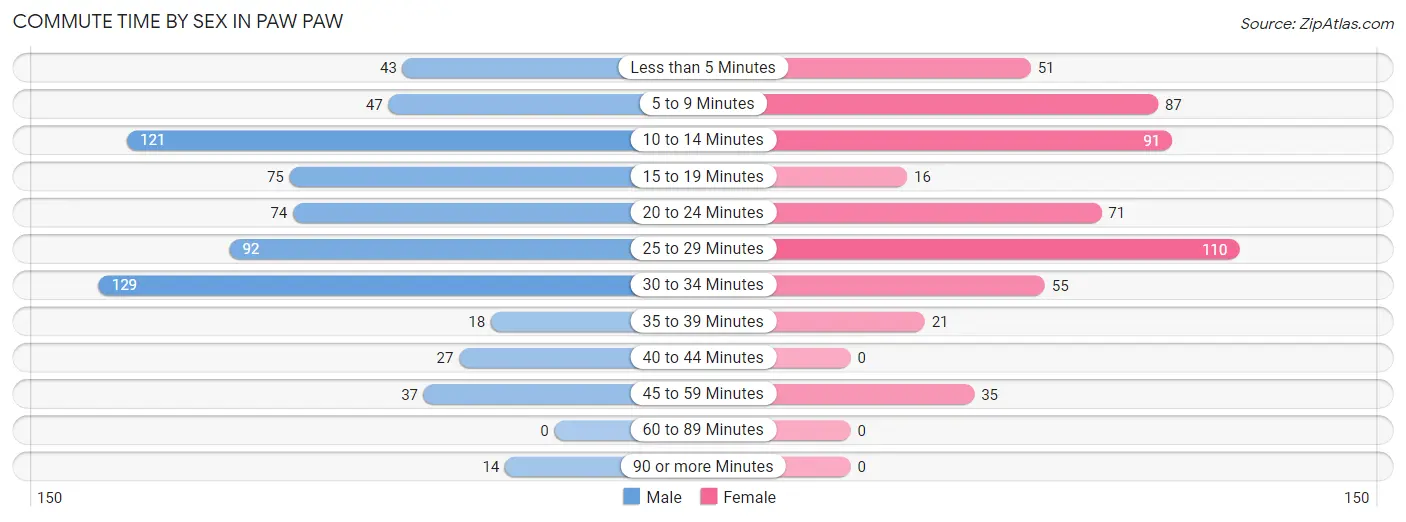
| Commute Time | Male | Female |
| Less than 5 Minutes | 43 (6.4%) | 51 (9.5%) |
| 5 to 9 Minutes | 47 (6.9%) | 87 (16.2%) |
| 10 to 14 Minutes | 121 (17.9%) | 91 (17.0%) |
| 15 to 19 Minutes | 75 (11.1%) | 16 (3.0%) |
| 20 to 24 Minutes | 74 (10.9%) | 71 (13.2%) |
| 25 to 29 Minutes | 92 (13.6%) | 110 (20.5%) |
| 30 to 34 Minutes | 129 (19.1%) | 55 (10.2%) |
| 35 to 39 Minutes | 18 (2.7%) | 21 (3.9%) |
| 40 to 44 Minutes | 27 (4.0%) | 0 (0.0%) |
| 45 to 59 Minutes | 37 (5.5%) | 35 (6.5%) |
| 60 to 89 Minutes | 0 (0.0%) | 0 (0.0%) |
| 90 or more Minutes | 14 (2.1%) | 0 (0.0%) |
Time of Departure to Work by Sex in Paw Paw
The most frequent times of departure to work in Paw Paw are 12:00 PM to 3:59 PM (121, 17.9%) for males and 6:00 AM to 6:29 AM (149, 27.8%) for females.
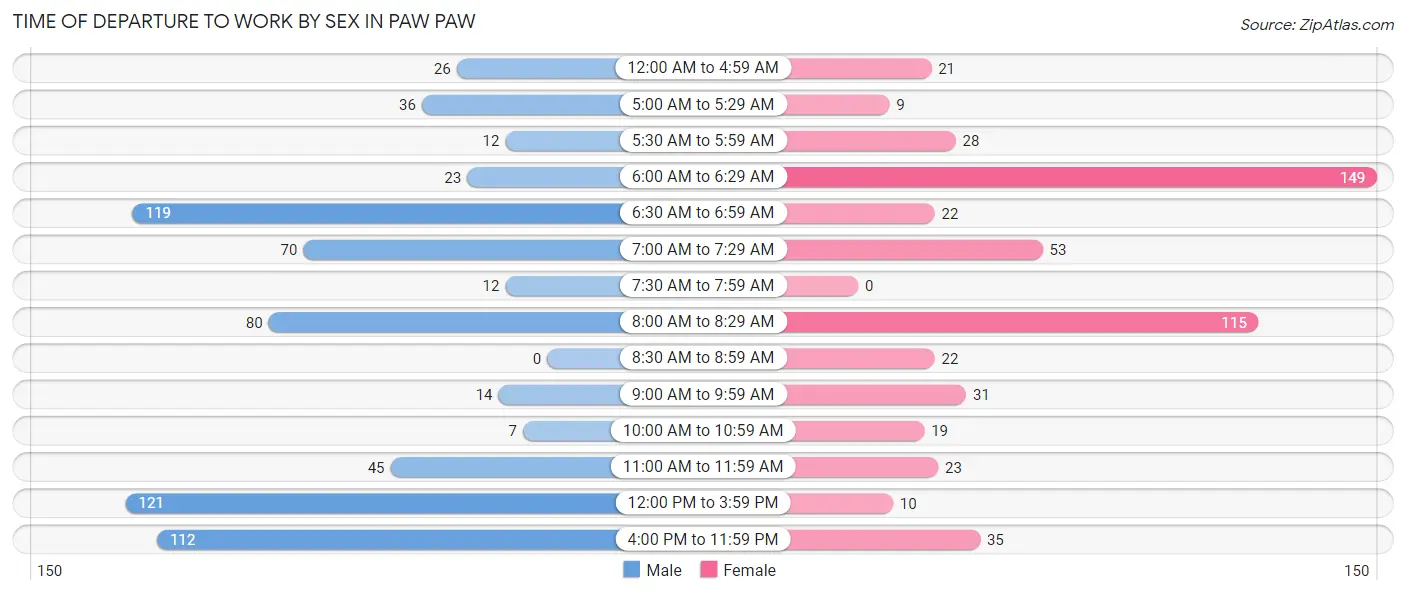
| Time of Departure | Male | Female |
| 12:00 AM to 4:59 AM | 26 (3.8%) | 21 (3.9%) |
| 5:00 AM to 5:29 AM | 36 (5.3%) | 9 (1.7%) |
| 5:30 AM to 5:59 AM | 12 (1.8%) | 28 (5.2%) |
| 6:00 AM to 6:29 AM | 23 (3.4%) | 149 (27.8%) |
| 6:30 AM to 6:59 AM | 119 (17.6%) | 22 (4.1%) |
| 7:00 AM to 7:29 AM | 70 (10.3%) | 53 (9.9%) |
| 7:30 AM to 7:59 AM | 12 (1.8%) | 0 (0.0%) |
| 8:00 AM to 8:29 AM | 80 (11.8%) | 115 (21.4%) |
| 8:30 AM to 8:59 AM | 0 (0.0%) | 22 (4.1%) |
| 9:00 AM to 9:59 AM | 14 (2.1%) | 31 (5.8%) |
| 10:00 AM to 10:59 AM | 7 (1.0%) | 19 (3.5%) |
| 11:00 AM to 11:59 AM | 45 (6.7%) | 23 (4.3%) |
| 12:00 PM to 3:59 PM | 121 (17.9%) | 10 (1.9%) |
| 4:00 PM to 11:59 PM | 112 (16.5%) | 35 (6.5%) |
| Total | 677 (100.0%) | 537 (100.0%) |
Housing Occupancy in Paw Paw
Occupancy by Ownership in Paw Paw
Of the total 1,369 dwellings in Paw Paw, owner-occupied units account for 717 (52.4%), while renter-occupied units make up 652 (47.6%).
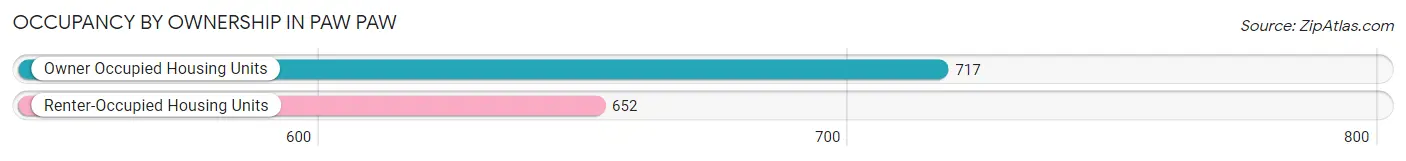
| Occupancy | # Housing Units | % Housing Units |
| Owner Occupied Housing Units | 717 | 52.4% |
| Renter-Occupied Housing Units | 652 | 47.6% |
| Total Occupied Housing Units | 1,369 | 100.0% |
Occupancy by Household Size in Paw Paw

| Household Size | # Housing Units | % Housing Units |
| 1-Person Household | 531 | 38.8% |
| 2-Person Household | 360 | 26.3% |
| 3-Person Household | 164 | 12.0% |
| 4+ Person Household | 314 | 22.9% |
| Total Housing Units | 1,369 | 100.0% |
Occupancy by Ownership by Household Size in Paw Paw
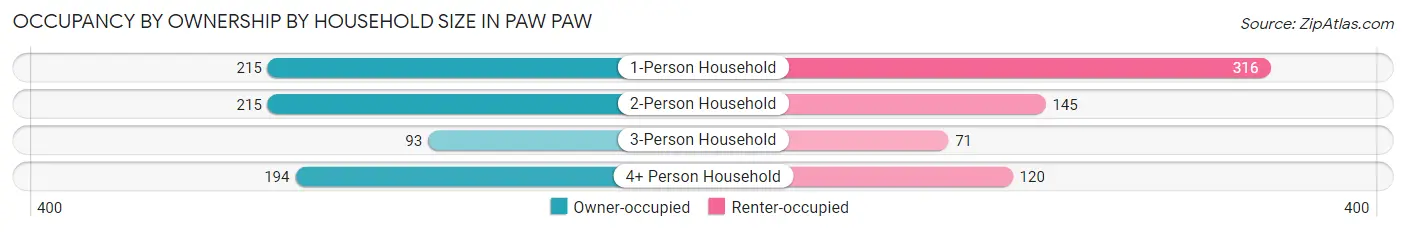
| Household Size | Owner-occupied | Renter-occupied |
| 1-Person Household | 215 (40.5%) | 316 (59.5%) |
| 2-Person Household | 215 (59.7%) | 145 (40.3%) |
| 3-Person Household | 93 (56.7%) | 71 (43.3%) |
| 4+ Person Household | 194 (61.8%) | 120 (38.2%) |
| Total Housing Units | 717 (52.4%) | 652 (47.6%) |
Occupancy by Educational Attainment in Paw Paw
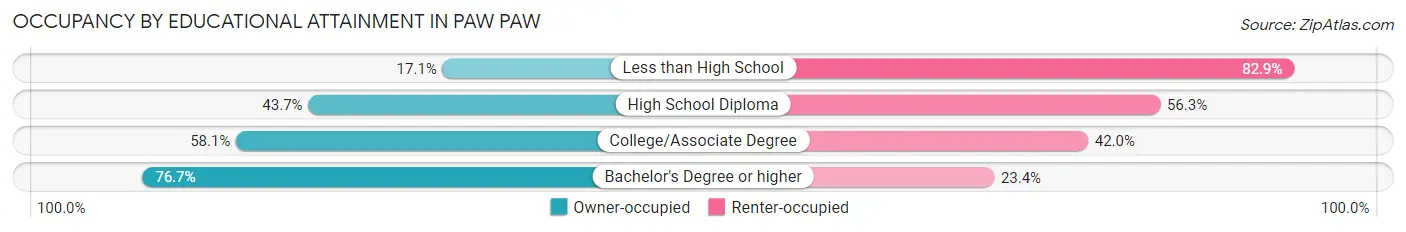
| Household Size | Owner-occupied | Renter-occupied |
| Less than High School | 13 (17.1%) | 63 (82.9%) |
| High School Diploma | 237 (43.7%) | 305 (56.3%) |
| College/Associate Degree | 339 (58.1%) | 245 (41.9%) |
| Bachelor's Degree or higher | 128 (76.6%) | 39 (23.4%) |
Occupancy by Age of Householder in Paw Paw
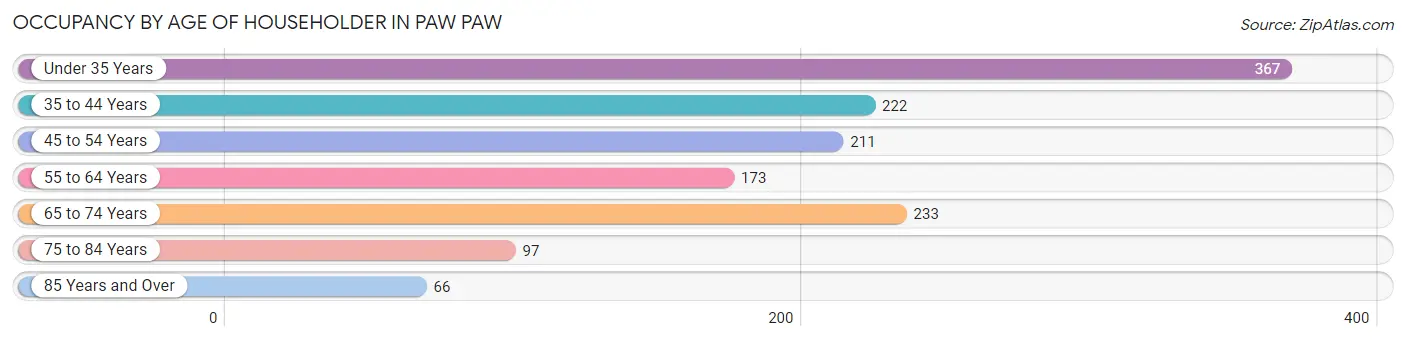
| Age Bracket | # Households | % Households |
| Under 35 Years | 367 | 26.8% |
| 35 to 44 Years | 222 | 16.2% |
| 45 to 54 Years | 211 | 15.4% |
| 55 to 64 Years | 173 | 12.6% |
| 65 to 74 Years | 233 | 17.0% |
| 75 to 84 Years | 97 | 7.1% |
| 85 Years and Over | 66 | 4.8% |
| Total | 1,369 | 100.0% |
Housing Finances in Paw Paw
Median Income by Occupancy in Paw Paw
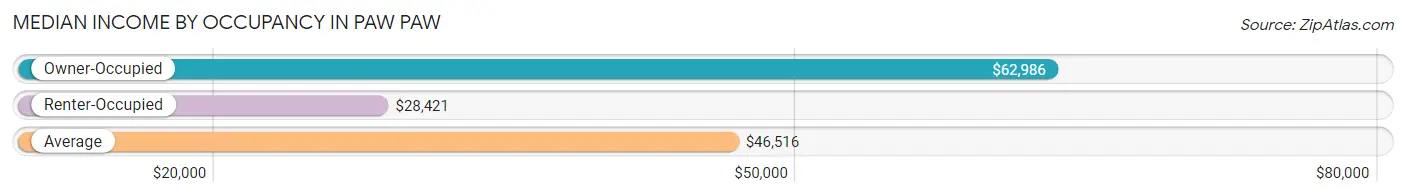
| Occupancy Type | # Households | Median Income |
| Owner-Occupied | 717 (52.4%) | $62,986 |
| Renter-Occupied | 652 (47.6%) | $28,421 |
| Average | 1,369 (100.0%) | $46,516 |
Occupancy by Householder Income Bracket in Paw Paw
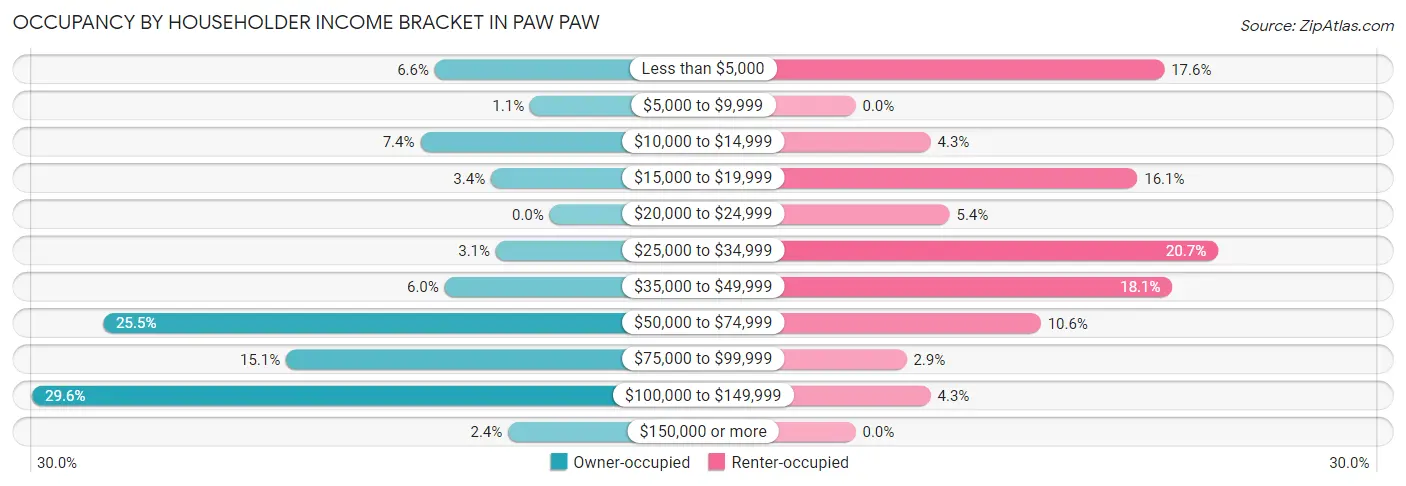
| Income Bracket | Owner-occupied | Renter-occupied |
| Less than $5,000 | 47 (6.6%) | 115 (17.6%) |
| $5,000 to $9,999 | 8 (1.1%) | 0 (0.0%) |
| $10,000 to $14,999 | 53 (7.4%) | 28 (4.3%) |
| $15,000 to $19,999 | 24 (3.4%) | 105 (16.1%) |
| $20,000 to $24,999 | 0 (0.0%) | 35 (5.4%) |
| $25,000 to $34,999 | 22 (3.1%) | 135 (20.7%) |
| $35,000 to $49,999 | 43 (6.0%) | 118 (18.1%) |
| $50,000 to $74,999 | 183 (25.5%) | 69 (10.6%) |
| $75,000 to $99,999 | 108 (15.1%) | 19 (2.9%) |
| $100,000 to $149,999 | 212 (29.6%) | 28 (4.3%) |
| $150,000 or more | 17 (2.4%) | 0 (0.0%) |
| Total | 717 (100.0%) | 652 (100.0%) |
Monthly Housing Cost Tiers in Paw Paw
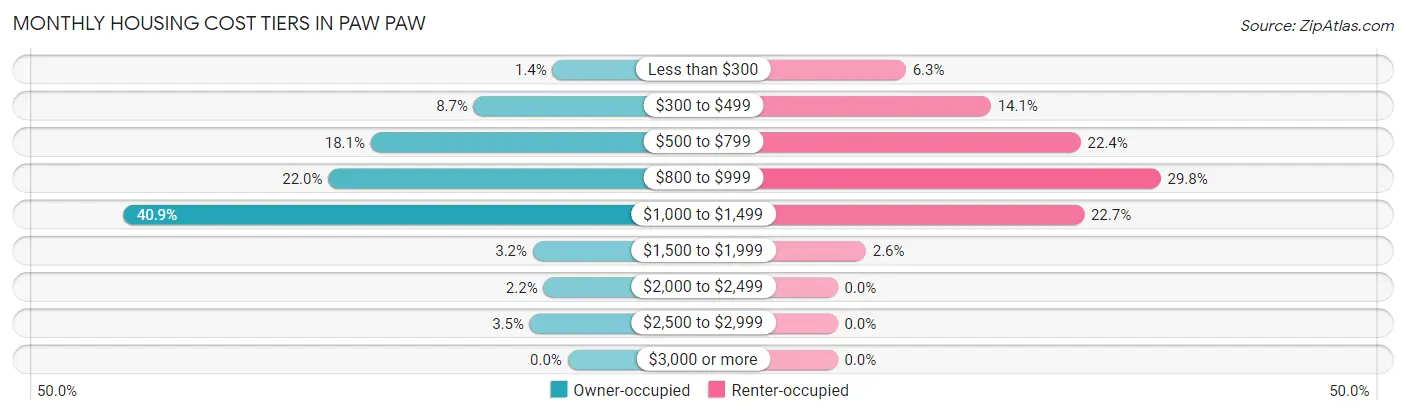
| Monthly Cost | Owner-occupied | Renter-occupied |
| Less than $300 | 10 (1.4%) | 41 (6.3%) |
| $300 to $499 | 62 (8.6%) | 92 (14.1%) |
| $500 to $799 | 130 (18.1%) | 146 (22.4%) |
| $800 to $999 | 158 (22.0%) | 194 (29.7%) |
| $1,000 to $1,499 | 293 (40.9%) | 148 (22.7%) |
| $1,500 to $1,999 | 23 (3.2%) | 17 (2.6%) |
| $2,000 to $2,499 | 16 (2.2%) | 0 (0.0%) |
| $2,500 to $2,999 | 25 (3.5%) | 0 (0.0%) |
| $3,000 or more | 0 (0.0%) | 0 (0.0%) |
| Total | 717 (100.0%) | 652 (100.0%) |
Physical Housing Characteristics in Paw Paw
Housing Structures in Paw Paw
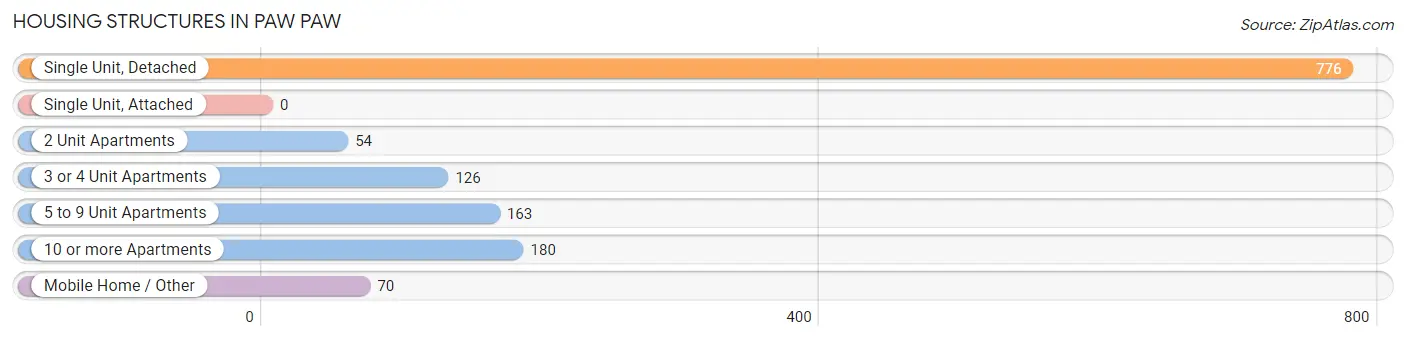
| Structure Type | # Housing Units | % Housing Units |
| Single Unit, Detached | 776 | 56.7% |
| Single Unit, Attached | 0 | 0.0% |
| 2 Unit Apartments | 54 | 3.9% |
| 3 or 4 Unit Apartments | 126 | 9.2% |
| 5 to 9 Unit Apartments | 163 | 11.9% |
| 10 or more Apartments | 180 | 13.2% |
| Mobile Home / Other | 70 | 5.1% |
| Total | 1,369 | 100.0% |
Housing Structures by Occupancy in Paw Paw
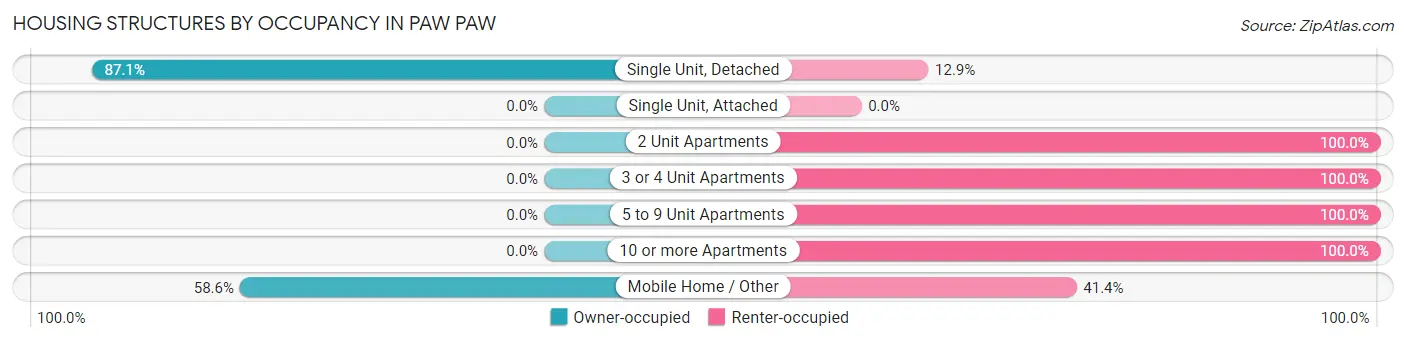
| Structure Type | Owner-occupied | Renter-occupied |
| Single Unit, Detached | 676 (87.1%) | 100 (12.9%) |
| Single Unit, Attached | 0 (0.0%) | 0 (0.0%) |
| 2 Unit Apartments | 0 (0.0%) | 54 (100.0%) |
| 3 or 4 Unit Apartments | 0 (0.0%) | 126 (100.0%) |
| 5 to 9 Unit Apartments | 0 (0.0%) | 163 (100.0%) |
| 10 or more Apartments | 0 (0.0%) | 180 (100.0%) |
| Mobile Home / Other | 41 (58.6%) | 29 (41.4%) |
| Total | 717 (52.4%) | 652 (47.6%) |
Housing Structures by Number of Rooms in Paw Paw
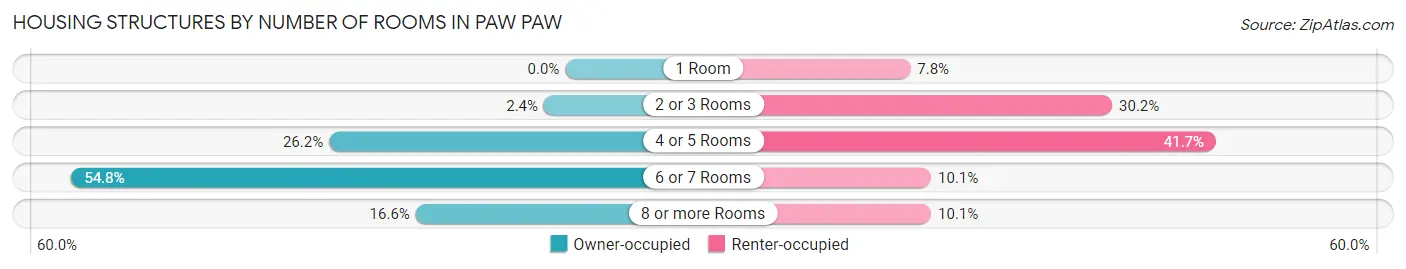
| Number of Rooms | Owner-occupied | Renter-occupied |
| 1 Room | 0 (0.0%) | 51 (7.8%) |
| 2 or 3 Rooms | 17 (2.4%) | 197 (30.2%) |
| 4 or 5 Rooms | 188 (26.2%) | 272 (41.7%) |
| 6 or 7 Rooms | 393 (54.8%) | 66 (10.1%) |
| 8 or more Rooms | 119 (16.6%) | 66 (10.1%) |
| Total | 717 (100.0%) | 652 (100.0%) |
Housing Structure by Heating Type in Paw Paw
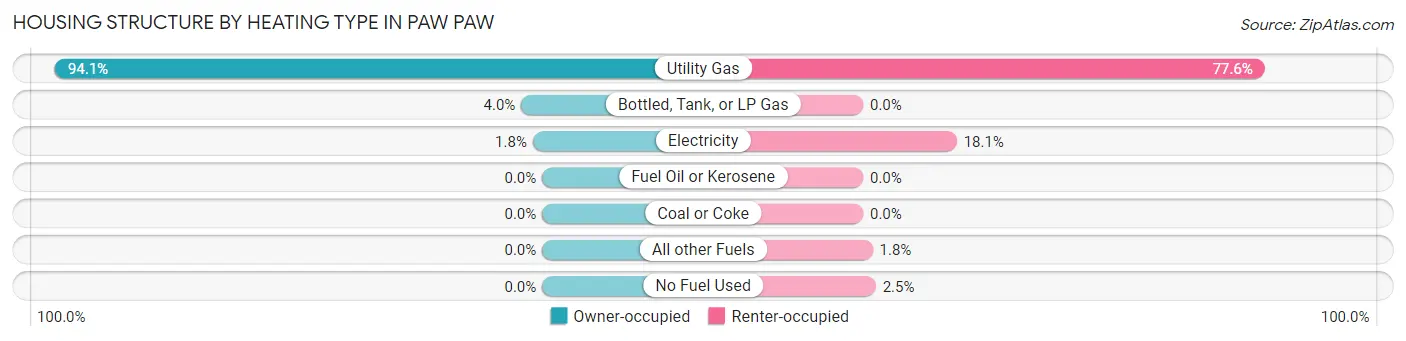
| Heating Type | Owner-occupied | Renter-occupied |
| Utility Gas | 675 (94.1%) | 506 (77.6%) |
| Bottled, Tank, or LP Gas | 29 (4.0%) | 0 (0.0%) |
| Electricity | 13 (1.8%) | 118 (18.1%) |
| Fuel Oil or Kerosene | 0 (0.0%) | 0 (0.0%) |
| Coal or Coke | 0 (0.0%) | 0 (0.0%) |
| All other Fuels | 0 (0.0%) | 12 (1.8%) |
| No Fuel Used | 0 (0.0%) | 16 (2.5%) |
| Total | 717 (100.0%) | 652 (100.0%) |
Household Vehicle Usage in Paw Paw
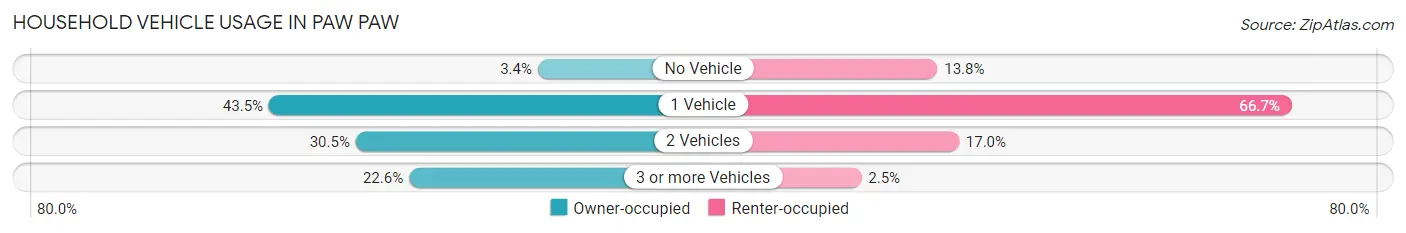
| Vehicles per Household | Owner-occupied | Renter-occupied |
| No Vehicle | 24 (3.4%) | 90 (13.8%) |
| 1 Vehicle | 312 (43.5%) | 435 (66.7%) |
| 2 Vehicles | 219 (30.5%) | 111 (17.0%) |
| 3 or more Vehicles | 162 (22.6%) | 16 (2.5%) |
| Total | 717 (100.0%) | 652 (100.0%) |
Real Estate & Mortgages in Paw Paw
Real Estate and Mortgage Overview in Paw Paw
| Characteristic | Without Mortgage | With Mortgage |
| Housing Units | 146 | 571 |
| Median Property Value | $111,800 | $124,900 |
| Median Household Income | $45,556 | $17 |
| Monthly Housing Costs | $505 | $0 |
| Real Estate Taxes | $1,786 | $15 |
Property Value by Mortgage Status in Paw Paw
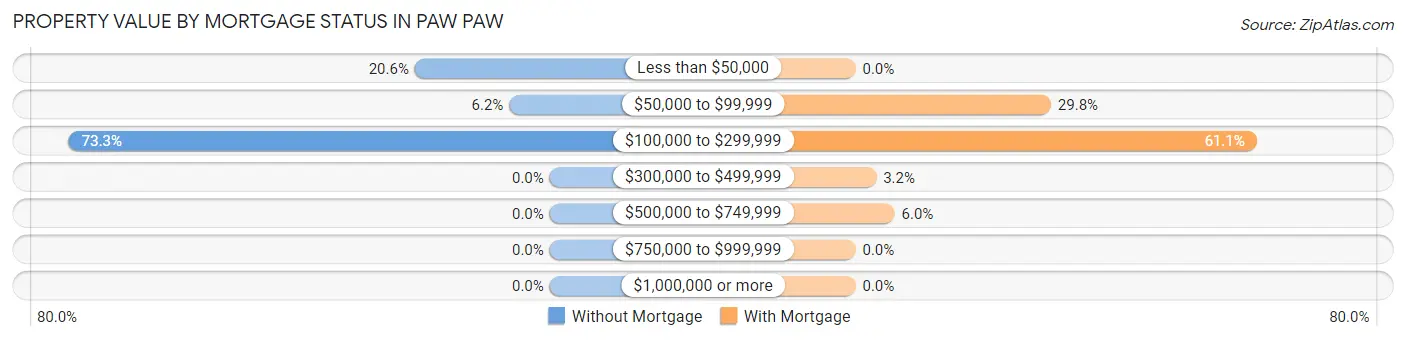
| Property Value | Without Mortgage | With Mortgage |
| Less than $50,000 | 30 (20.5%) | 0 (0.0%) |
| $50,000 to $99,999 | 9 (6.2%) | 170 (29.8%) |
| $100,000 to $299,999 | 107 (73.3%) | 349 (61.1%) |
| $300,000 to $499,999 | 0 (0.0%) | 18 (3.2%) |
| $500,000 to $749,999 | 0 (0.0%) | 34 (5.9%) |
| $750,000 to $999,999 | 0 (0.0%) | 0 (0.0%) |
| $1,000,000 or more | 0 (0.0%) | 0 (0.0%) |
| Total | 146 (100.0%) | 571 (100.0%) |
Household Income by Mortgage Status in Paw Paw
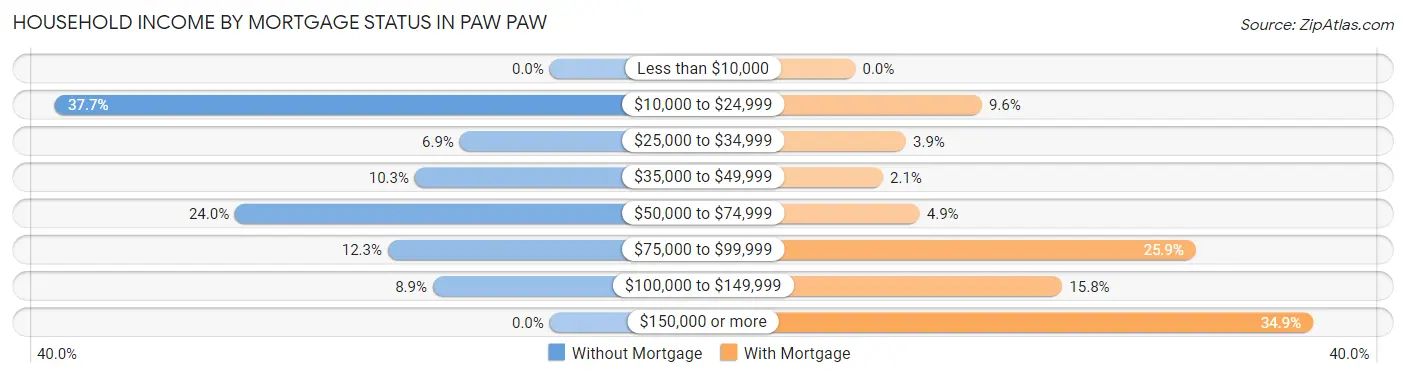
| Household Income | Without Mortgage | With Mortgage |
| Less than $10,000 | 0 (0.0%) | 0 (0.0%) |
| $10,000 to $24,999 | 55 (37.7%) | 55 (9.6%) |
| $25,000 to $34,999 | 10 (6.9%) | 22 (3.8%) |
| $35,000 to $49,999 | 15 (10.3%) | 12 (2.1%) |
| $50,000 to $74,999 | 35 (24.0%) | 28 (4.9%) |
| $75,000 to $99,999 | 18 (12.3%) | 148 (25.9%) |
| $100,000 to $149,999 | 13 (8.9%) | 90 (15.8%) |
| $150,000 or more | 0 (0.0%) | 199 (34.8%) |
| Total | 146 (100.0%) | 571 (100.0%) |
Property Value to Household Income Ratio in Paw Paw
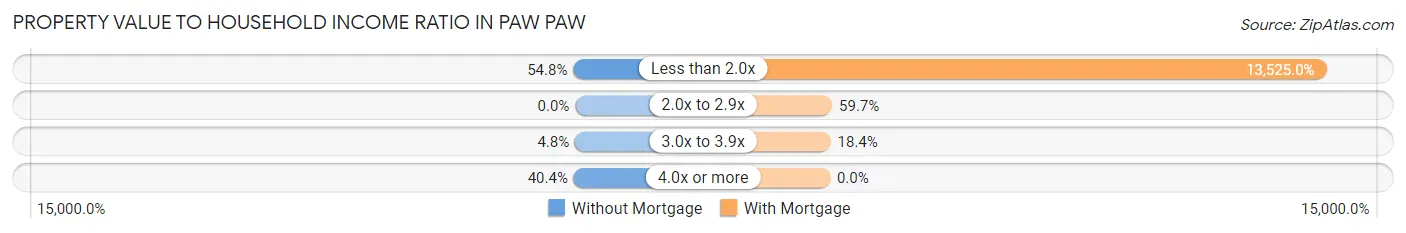
| Value-to-Income Ratio | Without Mortgage | With Mortgage |
| Less than 2.0x | 80 (54.8%) | 77,228 (13,525.0%) |
| 2.0x to 2.9x | 0 (0.0%) | 341 (59.7%) |
| 3.0x to 3.9x | 7 (4.8%) | 105 (18.4%) |
| 4.0x or more | 59 (40.4%) | 0 (0.0%) |
| Total | 146 (100.0%) | 571 (100.0%) |
Real Estate Taxes by Mortgage Status in Paw Paw
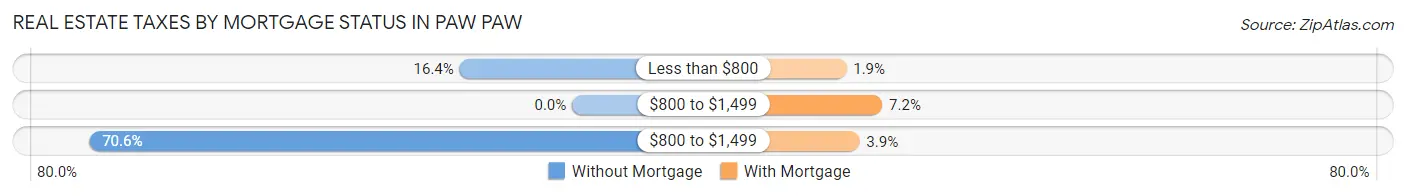
| Property Taxes | Without Mortgage | With Mortgage |
| Less than $800 | 24 (16.4%) | 11 (1.9%) |
| $800 to $1,499 | 0 (0.0%) | 41 (7.2%) |
| $800 to $1,499 | 103 (70.6%) | 22 (3.8%) |
| Total | 146 (100.0%) | 571 (100.0%) |
Health & Disability in Paw Paw
Health Insurance Coverage by Age in Paw Paw
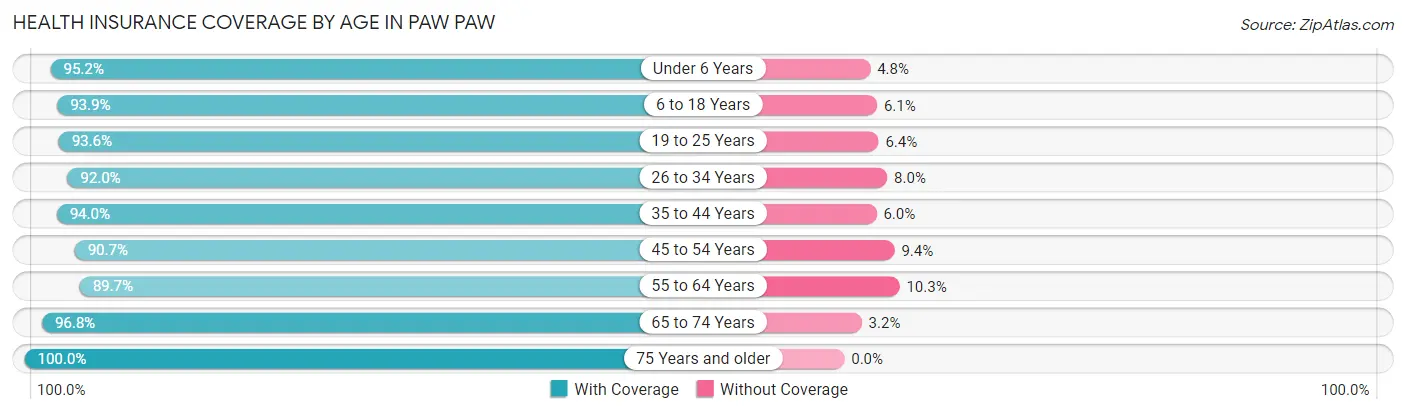
| Age Bracket | With Coverage | Without Coverage |
| Under 6 Years | 393 (95.2%) | 20 (4.8%) |
| 6 to 18 Years | 555 (93.9%) | 36 (6.1%) |
| 19 to 25 Years | 147 (93.6%) | 10 (6.4%) |
| 26 to 34 Years | 357 (92.0%) | 31 (8.0%) |
| 35 to 44 Years | 470 (94.0%) | 30 (6.0%) |
| 45 to 54 Years | 291 (90.6%) | 30 (9.3%) |
| 55 to 64 Years | 218 (89.7%) | 25 (10.3%) |
| 65 to 74 Years | 299 (96.8%) | 10 (3.2%) |
| 75 Years and older | 210 (100.0%) | 0 (0.0%) |
| Total | 2,940 (93.9%) | 192 (6.1%) |
Health Insurance Coverage by Citizenship Status in Paw Paw
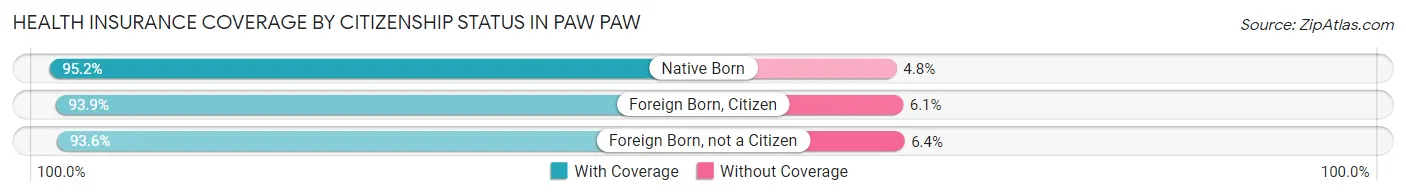
| Citizenship Status | With Coverage | Without Coverage |
| Native Born | 393 (95.2%) | 20 (4.8%) |
| Foreign Born, Citizen | 555 (93.9%) | 36 (6.1%) |
| Foreign Born, not a Citizen | 147 (93.6%) | 10 (6.4%) |
Health Insurance Coverage by Household Income in Paw Paw
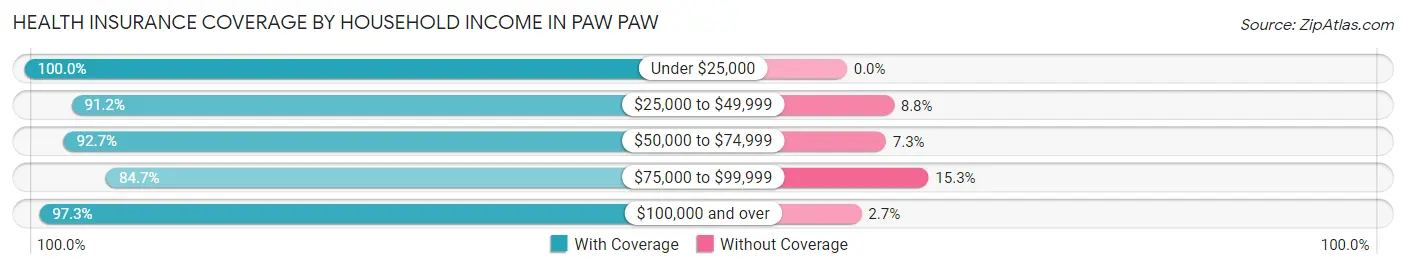
| Household Income | With Coverage | Without Coverage |
| Under $25,000 | 591 (100.0%) | 0 (0.0%) |
| $25,000 to $49,999 | 518 (91.2%) | 50 (8.8%) |
| $50,000 to $74,999 | 519 (92.7%) | 41 (7.3%) |
| $75,000 to $99,999 | 421 (84.7%) | 76 (15.3%) |
| $100,000 and over | 886 (97.3%) | 25 (2.7%) |
Public vs Private Health Insurance Coverage by Age in Paw Paw
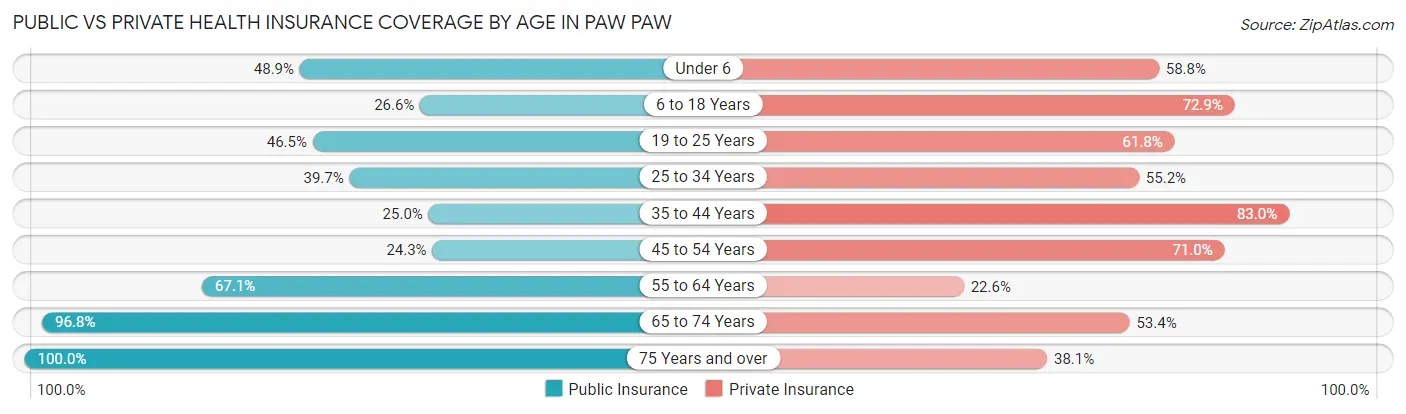
| Age Bracket | Public Insurance | Private Insurance |
| Under 6 | 202 (48.9%) | 243 (58.8%) |
| 6 to 18 Years | 157 (26.6%) | 431 (72.9%) |
| 19 to 25 Years | 73 (46.5%) | 97 (61.8%) |
| 25 to 34 Years | 154 (39.7%) | 214 (55.1%) |
| 35 to 44 Years | 125 (25.0%) | 415 (83.0%) |
| 45 to 54 Years | 78 (24.3%) | 228 (71.0%) |
| 55 to 64 Years | 163 (67.1%) | 55 (22.6%) |
| 65 to 74 Years | 299 (96.8%) | 165 (53.4%) |
| 75 Years and over | 210 (100.0%) | 80 (38.1%) |
| Total | 1,461 (46.7%) | 1,928 (61.6%) |
Disability Status by Sex by Age in Paw Paw
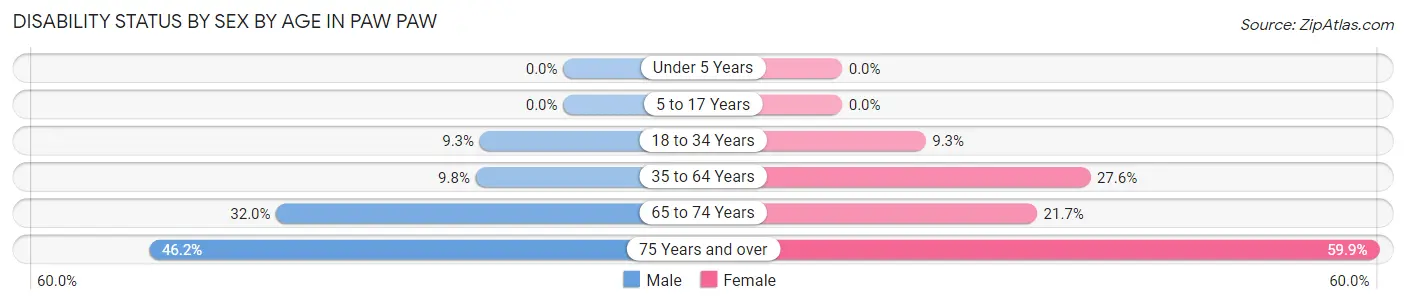
| Age Bracket | Male | Female |
| Under 5 Years | 0 (0.0%) | 0 (0.0%) |
| 5 to 17 Years | 0 (0.0%) | 0 (0.0%) |
| 18 to 34 Years | 28 (9.3%) | 33 (9.3%) |
| 35 to 64 Years | 53 (9.8%) | 144 (27.6%) |
| 65 to 74 Years | 31 (32.0%) | 46 (21.7%) |
| 75 Years and over | 36 (46.2%) | 79 (59.9%) |
Disability Class by Sex by Age in Paw Paw
Disability Class: Hearing Difficulty
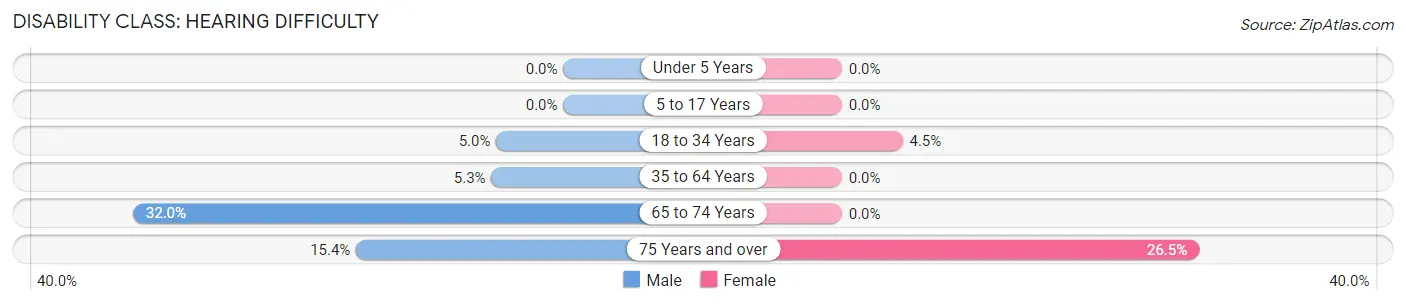
| Age Bracket | Male | Female |
| Under 5 Years | 0 (0.0%) | 0 (0.0%) |
| 5 to 17 Years | 0 (0.0%) | 0 (0.0%) |
| 18 to 34 Years | 15 (5.0%) | 16 (4.5%) |
| 35 to 64 Years | 29 (5.3%) | 0 (0.0%) |
| 65 to 74 Years | 31 (32.0%) | 0 (0.0%) |
| 75 Years and over | 12 (15.4%) | 35 (26.5%) |
Disability Class: Vision Difficulty
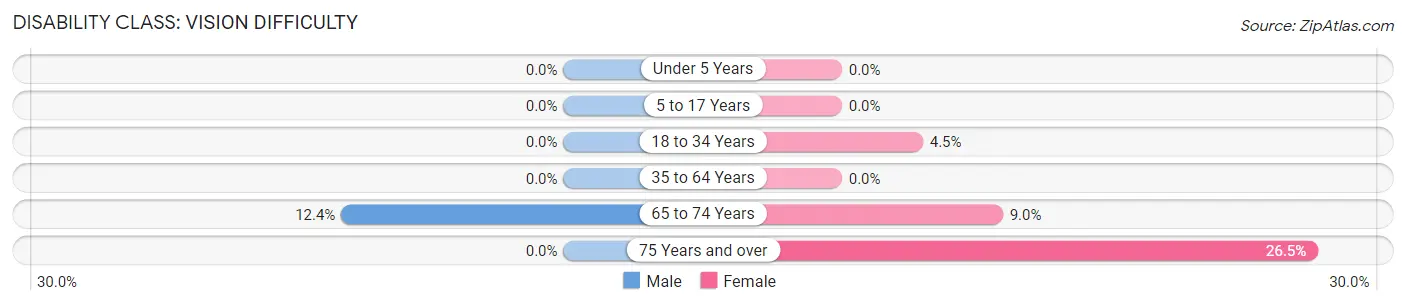
| Age Bracket | Male | Female |
| Under 5 Years | 0 (0.0%) | 0 (0.0%) |
| 5 to 17 Years | 0 (0.0%) | 0 (0.0%) |
| 18 to 34 Years | 0 (0.0%) | 16 (4.5%) |
| 35 to 64 Years | 0 (0.0%) | 0 (0.0%) |
| 65 to 74 Years | 12 (12.4%) | 19 (9.0%) |
| 75 Years and over | 0 (0.0%) | 35 (26.5%) |
Disability Class: Cognitive Difficulty
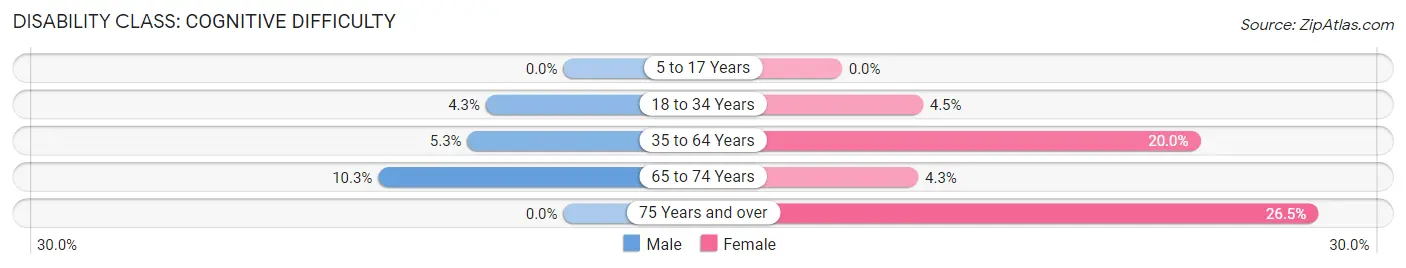
| Age Bracket | Male | Female |
| 5 to 17 Years | 0 (0.0%) | 0 (0.0%) |
| 18 to 34 Years | 13 (4.3%) | 16 (4.5%) |
| 35 to 64 Years | 29 (5.3%) | 104 (20.0%) |
| 65 to 74 Years | 10 (10.3%) | 9 (4.3%) |
| 75 Years and over | 0 (0.0%) | 35 (26.5%) |
Disability Class: Ambulatory Difficulty
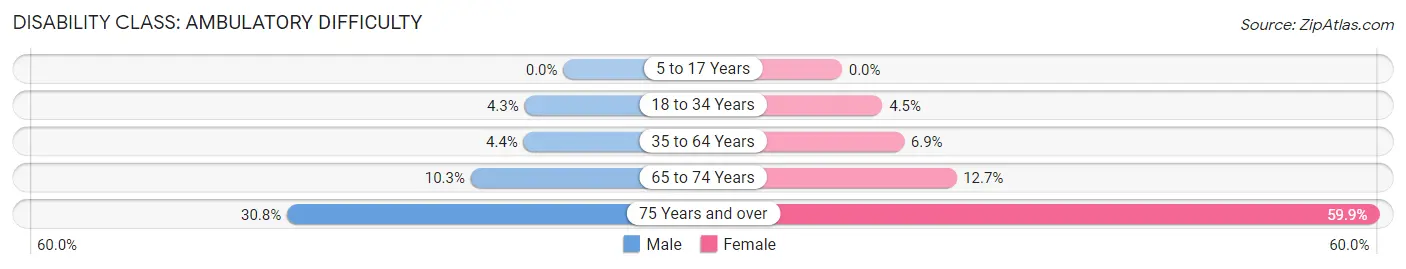
| Age Bracket | Male | Female |
| 5 to 17 Years | 0 (0.0%) | 0 (0.0%) |
| 18 to 34 Years | 13 (4.3%) | 16 (4.5%) |
| 35 to 64 Years | 24 (4.4%) | 36 (6.9%) |
| 65 to 74 Years | 10 (10.3%) | 27 (12.7%) |
| 75 Years and over | 24 (30.8%) | 79 (59.9%) |
Disability Class: Self-Care Difficulty
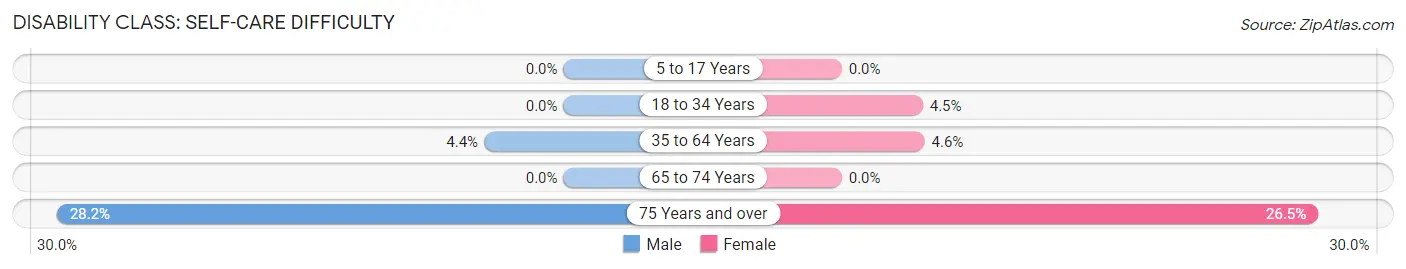
| Age Bracket | Male | Female |
| 5 to 17 Years | 0 (0.0%) | 0 (0.0%) |
| 18 to 34 Years | 0 (0.0%) | 16 (4.5%) |
| 35 to 64 Years | 24 (4.4%) | 24 (4.6%) |
| 65 to 74 Years | 0 (0.0%) | 0 (0.0%) |
| 75 Years and over | 22 (28.2%) | 35 (26.5%) |
Technology Access in Paw Paw
Computing Device Access in Paw Paw
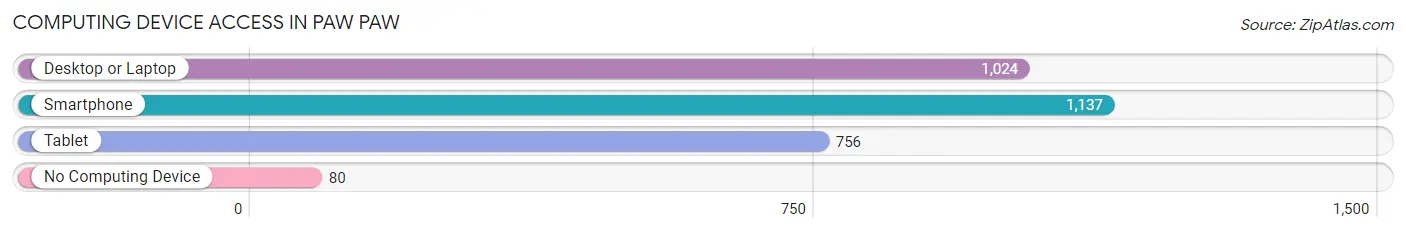
| Device Type | # Households | % Households |
| Desktop or Laptop | 1,024 | 74.8% |
| Smartphone | 1,137 | 83.1% |
| Tablet | 756 | 55.2% |
| No Computing Device | 80 | 5.8% |
| Total | 1,369 | 100.0% |
Internet Access in Paw Paw
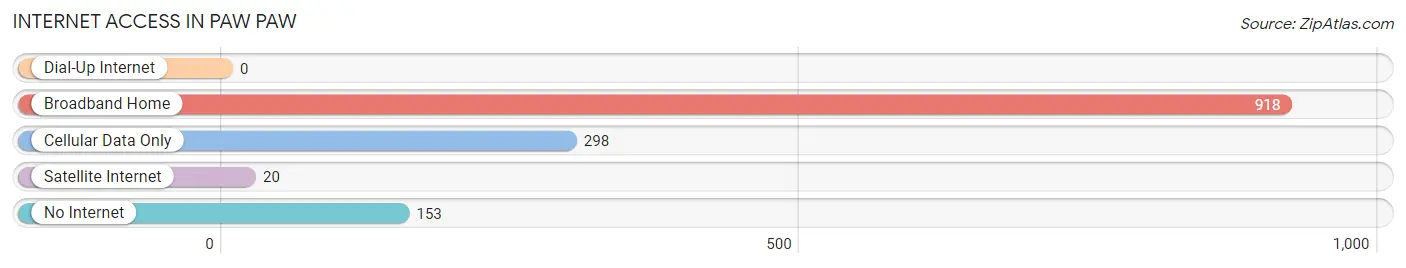
| Internet Type | # Households | % Households |
| Dial-Up Internet | 0 | 0.0% |
| Broadband Home | 918 | 67.1% |
| Cellular Data Only | 298 | 21.8% |
| Satellite Internet | 20 | 1.5% |
| No Internet | 153 | 11.2% |
| Total | 1,369 | 100.0% |
Paw Paw Summary
Paw Paw is a small village located in the southwestern corner of Michigan, in Van Buren County. It is situated on the banks of the Paw Paw River, and is surrounded by rolling hills and farmland. The village has a population of 3,521, according to the 2010 census.
History
The area that is now Paw Paw was first settled in the early 1800s by French-Canadian fur traders. The village was officially founded in 1837, and was named after the Paw Paw River, which was named by the Potawatomi Indians who lived in the area. The village was incorporated in 1867.
In the late 1800s, Paw Paw was a thriving agricultural community, with a variety of crops being grown in the area. The village was also home to several factories, including a flour mill, a sawmill, and a furniture factory.
In the early 1900s, the village began to experience a decline in population as people moved away to larger cities. However, the village was able to maintain its small-town charm, and it remains a popular destination for tourists and outdoor enthusiasts.
Geography
Paw Paw is located in the southwestern corner of Michigan, in Van Buren County. It is situated on the banks of the Paw Paw River, and is surrounded by rolling hills and farmland. The village is located approximately 25 miles south of Kalamazoo, and about 50 miles east of South Bend, Indiana.
The village has a total area of 2.2 square miles, all of which is land. The terrain is mostly flat, with some rolling hills in the surrounding area. The climate is humid continental, with hot summers and cold winters.
Economy
Paw Paw’s economy is largely based on agriculture and tourism. The village is home to several wineries, as well as a variety of small businesses. The village also has a number of antique shops, art galleries, and restaurants.
The village is also home to several manufacturing companies, including a furniture factory, a plastics factory, and a metal fabrication plant. The village is also home to a number of small businesses, including a grocery store, a hardware store, and a variety of other retail stores.
Demographics
According to the 2010 census, Paw Paw has a population of 3,521. The population is predominantly white (94.3%), with small percentages of African American (2.2%), Hispanic (1.3%), and Asian (0.7%) residents. The median household income is $41,944, and the median age is 40.
The village is served by the Paw Paw Public School District, which includes two elementary schools, one middle school, and one high school. The village is also home to a branch of the Van Buren District Library.
Conclusion
Paw Paw is a small village located in the southwestern corner of Michigan, in Van Buren County. It is situated on the banks of the Paw Paw River, and is surrounded by rolling hills and farmland. The village has a population of 3,521, according to the 2010 census. The village’s economy is largely based on agriculture and tourism, and it is home to several wineries, as well as a variety of small businesses. The village is served by the Paw Paw Public School District, and is home to a branch of the Van Buren District Library.
Common Questions
What is Per Capita Income in Paw Paw?
Per Capita income in Paw Paw is $24,053.
What is the Median Family Income in Paw Paw?
Median Family Income in Paw Paw is $59,683.
What is the Median Household income in Paw Paw?
Median Household Income in Paw Paw is $46,516.
What is Income or Wage Gap in Paw Paw?
Income or Wage Gap in Paw Paw is 29.4%.
Women in Paw Paw earn 70.6 cents for every dollar earned by a man.
What is Inequality or Gini Index in Paw Paw?
Inequality or Gini Index in Paw Paw is 0.45.
What is the Total Population of Paw Paw?
Total Population of Paw Paw is 3,318.
What is the Total Male Population of Paw Paw?
Total Male Population of Paw Paw is 1,726.
What is the Total Female Population of Paw Paw?
Total Female Population of Paw Paw is 1,592.
What is the Ratio of Males per 100 Females in Paw Paw?
There are 108.42 Males per 100 Females in Paw Paw.
What is the Ratio of Females per 100 Males in Paw Paw?
There are 92.24 Females per 100 Males in Paw Paw.
What is the Median Population Age in Paw Paw?
Median Population Age in Paw Paw is 35.4 Years.
What is the Average Family Size in Paw Paw
Average Family Size in Paw Paw is 3.1 People.
What is the Average Household Size in Paw Paw
Average Household Size in Paw Paw is 2.3 People.
How Large is the Labor Force in Paw Paw?
There are 1,384 People in the Labor Forcein in Paw Paw.
What is the Percentage of People in the Labor Force in Paw Paw?
56.6% of People are in the Labor Force in Paw Paw.
What is the Unemployment Rate in Paw Paw?
Unemployment Rate in Paw Paw is 6.6%.