Byron, MI Map & Demographics
Byron Map
Byron Overview
$30,734
PER CAPITA INCOME
$71,875
AVG FAMILY INCOME
$70,417
AVG HOUSEHOLD INCOME
48.0%
WAGE / INCOME GAP [ % ]
52.0¢/ $1
WAGE / INCOME GAP [ $ ]
0.34
INEQUALITY / GINI INDEX
604
TOTAL POPULATION
289
MALE POPULATION
315
FEMALE POPULATION
91.75
MALES / 100 FEMALES
109.00
FEMALES / 100 MALES
38.9
MEDIAN AGE
2.9
AVG FAMILY SIZE
2.7
AVG HOUSEHOLD SIZE
316
LABOR FORCE [ PEOPLE ]
68.1%
PERCENT IN LABOR FORCE
4.7%
UNEMPLOYMENT RATE
Byron Zip Codes
Byron Area Codes
Income in Byron
Income Overview in Byron
Per Capita Income in Byron is $30,734, while median incomes of families and households are $71,875 and $70,417 respectively.
| Characteristic | Number | Measure |
| Per Capita Income | 604 | $30,734 |
| Median Family Income | 177 | $71,875 |
| Mean Family Income | 177 | $85,119 |
| Median Household Income | 224 | $70,417 |
| Mean Household Income | 224 | $83,131 |
| Income Deficit | 177 | $0 |
| Wage / Income Gap (%) | 604 | 48.01% |
| Wage / Income Gap ($) | 604 | 51.99¢ per $1 |
| Gini / Inequality Index | 604 | 0.34 |
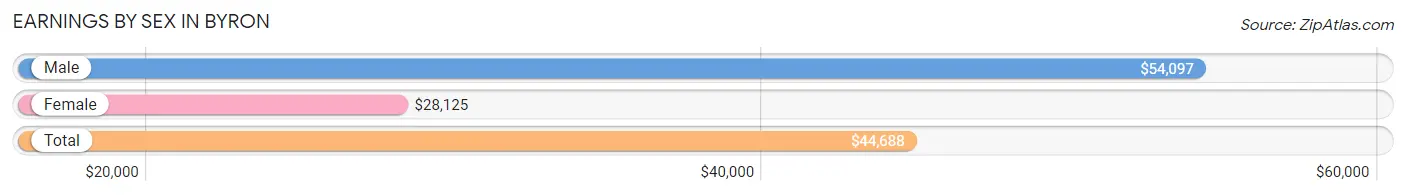
Earnings by Sex in Byron
Average Earnings in Byron are $44,688, $54,097 for men and $28,125 for women, a difference of 48.0%.
| Sex | Number | Average Earnings |
| Male | 157 (48.9%) | $54,097 |
| Female | 164 (51.1%) | $28,125 |
| Total | 321 (100.0%) | $44,688 |
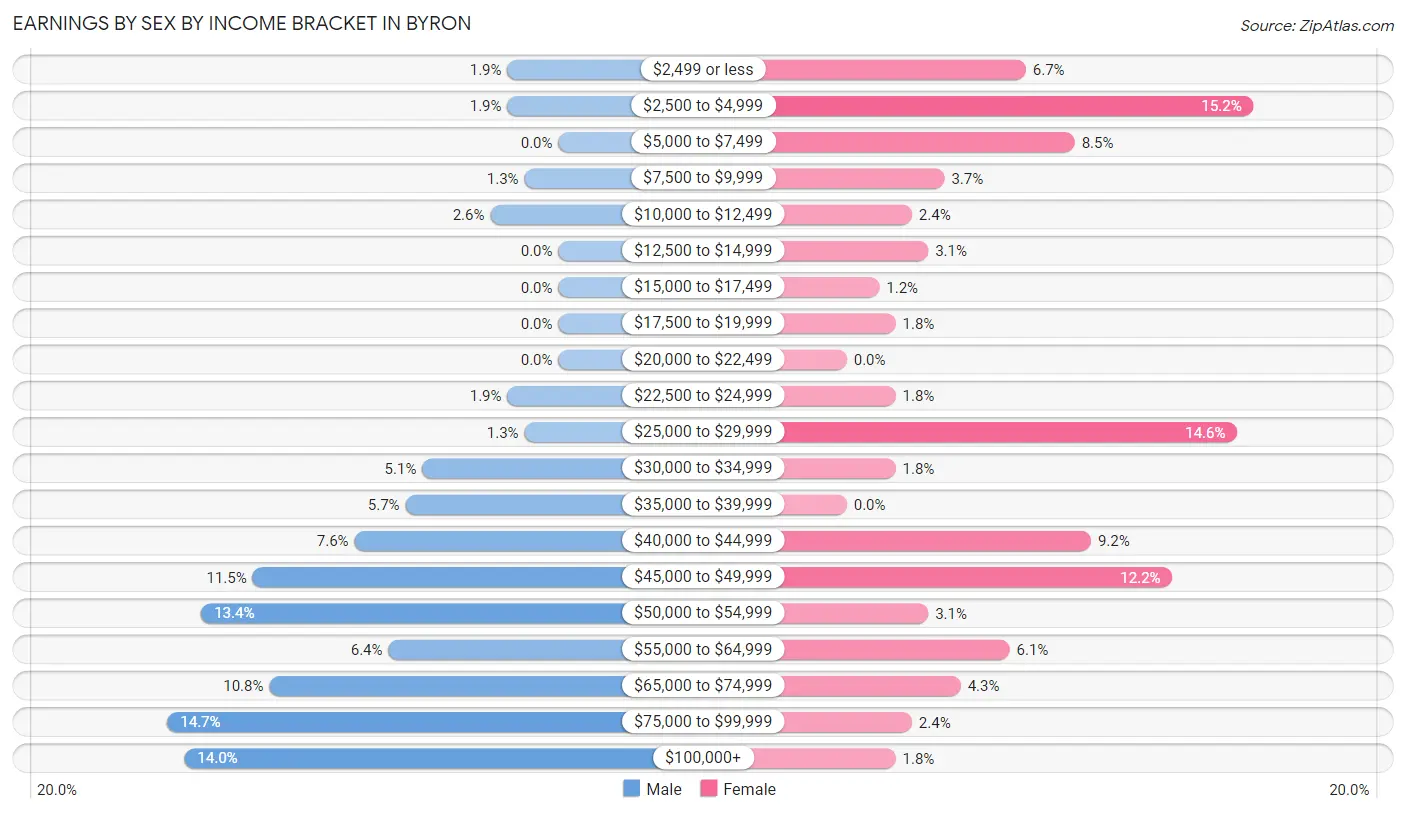
Earnings by Sex by Income Bracket in Byron
The most common earnings brackets in Byron are $75,000 to $99,999 for men (23 | 14.6%) and $2,500 to $4,999 for women (25 | 15.2%).
| Income | Male | Female |
| $2,499 or less | 3 (1.9%) | 11 (6.7%) |
| $2,500 to $4,999 | 3 (1.9%) | 25 (15.2%) |
| $5,000 to $7,499 | 0 (0.0%) | 14 (8.5%) |
| $7,500 to $9,999 | 2 (1.3%) | 6 (3.7%) |
| $10,000 to $12,499 | 4 (2.5%) | 4 (2.4%) |
| $12,500 to $14,999 | 0 (0.0%) | 5 (3.0%) |
| $15,000 to $17,499 | 0 (0.0%) | 2 (1.2%) |
| $17,500 to $19,999 | 0 (0.0%) | 3 (1.8%) |
| $20,000 to $22,499 | 0 (0.0%) | 0 (0.0%) |
| $22,500 to $24,999 | 3 (1.9%) | 3 (1.8%) |
| $25,000 to $29,999 | 2 (1.3%) | 24 (14.6%) |
| $30,000 to $34,999 | 8 (5.1%) | 3 (1.8%) |
| $35,000 to $39,999 | 9 (5.7%) | 0 (0.0%) |
| $40,000 to $44,999 | 12 (7.6%) | 15 (9.1%) |
| $45,000 to $49,999 | 18 (11.5%) | 20 (12.2%) |
| $50,000 to $54,999 | 21 (13.4%) | 5 (3.0%) |
| $55,000 to $64,999 | 10 (6.4%) | 10 (6.1%) |
| $65,000 to $74,999 | 17 (10.8%) | 7 (4.3%) |
| $75,000 to $99,999 | 23 (14.6%) | 4 (2.4%) |
| $100,000+ | 22 (14.0%) | 3 (1.8%) |
| Total | 157 (100.0%) | 164 (100.0%) |
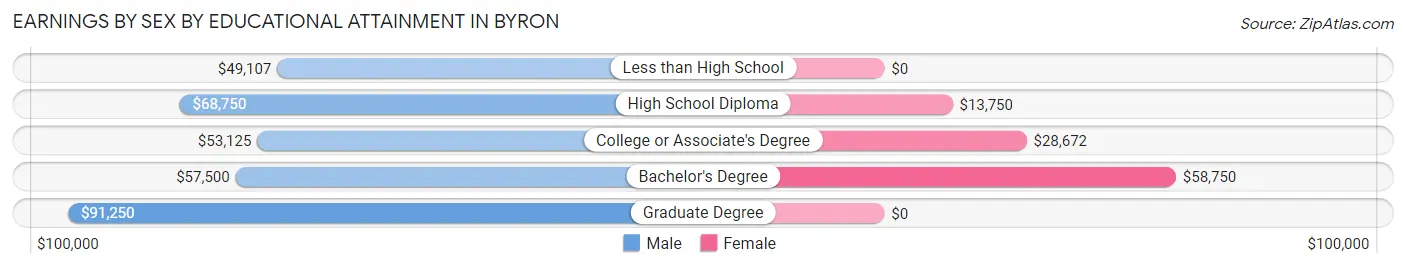
Earnings by Sex by Educational Attainment in Byron
Average earnings in Byron are $54,931 for men and $29,500 for women, a difference of 46.3%. Men with an educational attainment of graduate degree enjoy the highest average annual earnings of $91,250, while those with less than high school education earn the least with $49,107. Women with an educational attainment of bachelor's degree earn the most with the average annual earnings of $58,750, while those with high school diploma education have the smallest earnings of $13,750.
| Educational Attainment | Male Income | Female Income |
| Less than High School | $49,107 | $0 |
| High School Diploma | $68,750 | $13,750 |
| College or Associate's Degree | $53,125 | $28,672 |
| Bachelor's Degree | $57,500 | $58,750 |
| Graduate Degree | $91,250 | $0 |
| Total | $54,931 | $29,500 |
Family Income in Byron
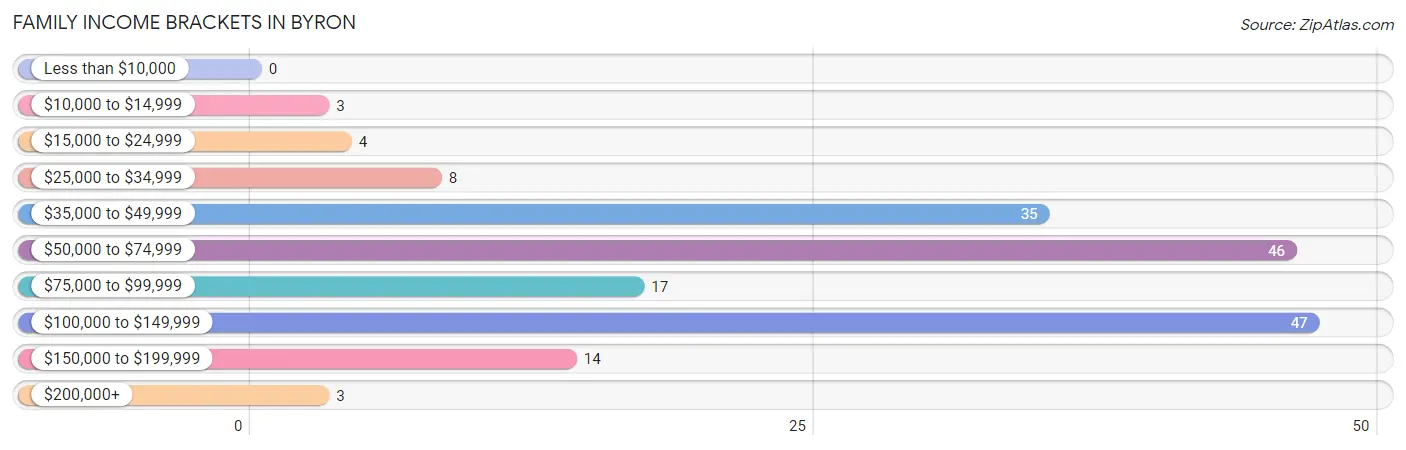
Family Income Brackets in Byron
According to the Byron family income data, there are 47 families falling into the $100,000 to $149,999 income range, which is the most common income bracket and makes up 26.6% of all families.
| Income Bracket | # Families | % Families |
| Less than $10,000 | 0 | 0.0% |
| $10,000 to $14,999 | 3 | 1.7% |
| $15,000 to $24,999 | 4 | 2.3% |
| $25,000 to $34,999 | 8 | 4.5% |
| $35,000 to $49,999 | 35 | 19.8% |
| $50,000 to $74,999 | 46 | 26.0% |
| $75,000 to $99,999 | 17 | 9.6% |
| $100,000 to $149,999 | 47 | 26.6% |
| $150,000 to $199,999 | 14 | 7.9% |
| $200,000+ | 3 | 1.7% |
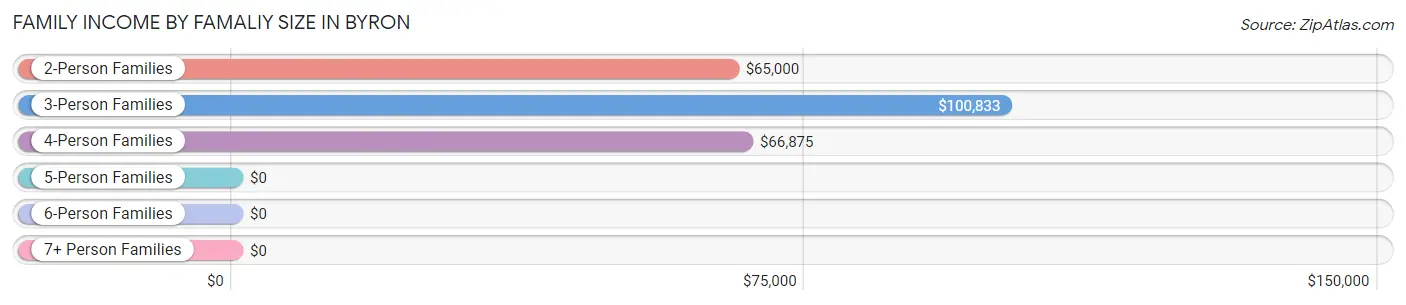
Family Income by Famaliy Size in Byron
3-person families (50 | 28.2%) account for the highest median family income in Byron with $100,833 per family, while 3-person families (50 | 28.2%) have the highest median income of $33,611 per family member.
| Income Bracket | # Families | Median Income |
| 2-Person Families | 86 (48.6%) | $65,000 |
| 3-Person Families | 50 (28.2%) | $100,833 |
| 4-Person Families | 28 (15.8%) | $66,875 |
| 5-Person Families | 4 (2.3%) | $0 |
| 6-Person Families | 9 (5.1%) | $0 |
| 7+ Person Families | 0 (0.0%) | $0 |
| Total | 177 (100.0%) | $71,875 |
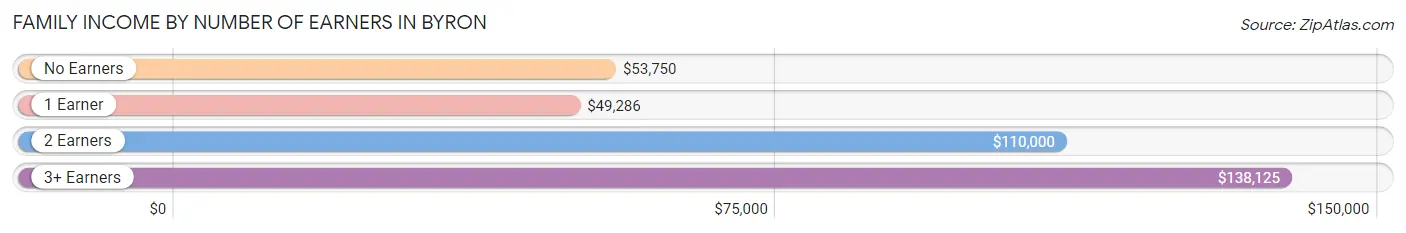
Family Income by Number of Earners in Byron
The median family income in Byron is $71,875, with families comprising 3+ earners (17) having the highest median family income of $138,125, while families with 1 earner (74) have the lowest median family income of $49,286, accounting for 9.6% and 41.8% of families, respectively.
| Number of Earners | # Families | Median Income |
| No Earners | 22 (12.4%) | $53,750 |
| 1 Earner | 74 (41.8%) | $49,286 |
| 2 Earners | 64 (36.2%) | $110,000 |
| 3+ Earners | 17 (9.6%) | $138,125 |
| Total | 177 (100.0%) | $71,875 |
Household Income in Byron
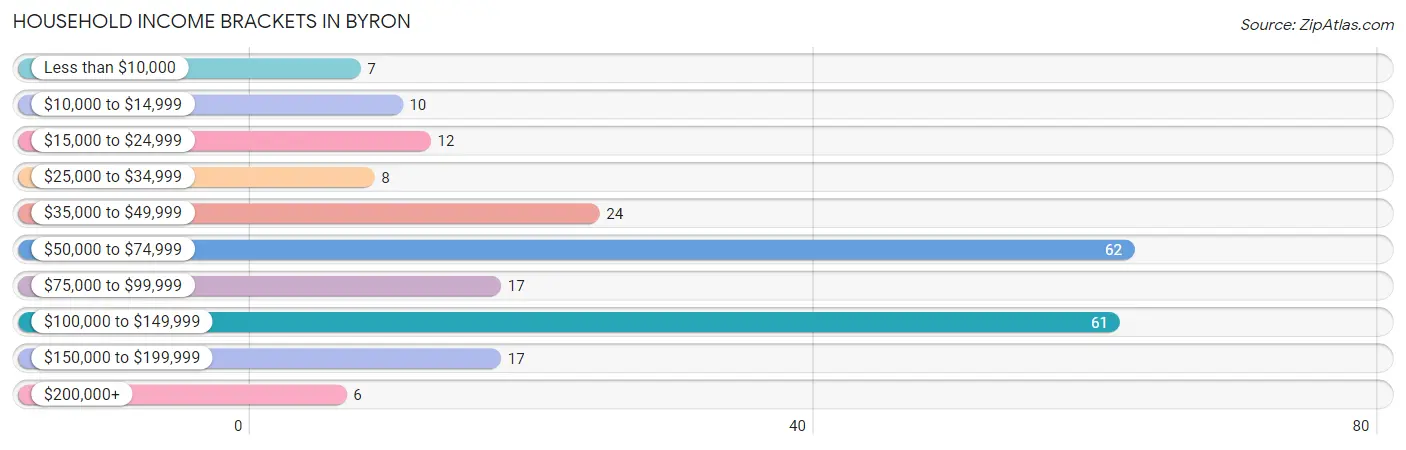
Household Income Brackets in Byron
With 62 households falling in the category, the $50,000 to $74,999 income range is the most frequent in Byron, accounting for 27.7% of all households. In contrast, only 6 households (2.7%) fall into the $200,000+ income bracket, making it the least populous group.
| Income Bracket | # Households | % Households |
| Less than $10,000 | 7 | 3.1% |
| $10,000 to $14,999 | 10 | 4.5% |
| $15,000 to $24,999 | 12 | 5.4% |
| $25,000 to $34,999 | 8 | 3.6% |
| $35,000 to $49,999 | 24 | 10.7% |
| $50,000 to $74,999 | 62 | 27.7% |
| $75,000 to $99,999 | 17 | 7.6% |
| $100,000 to $149,999 | 61 | 27.2% |
| $150,000 to $199,999 | 17 | 7.6% |
| $200,000+ | 6 | 2.7% |
Household Income by Householder Age in Byron
The median household income in Byron is $70,417, with the highest median household income of $107,614 found in the 25 to 44 years age bracket for the primary householder. A total of 71 households (31.7%) fall into this category. Meanwhile, the 15 to 24 years age bracket for the primary householder has the lowest median household income of $0, with 3 households (1.3%) in this group.
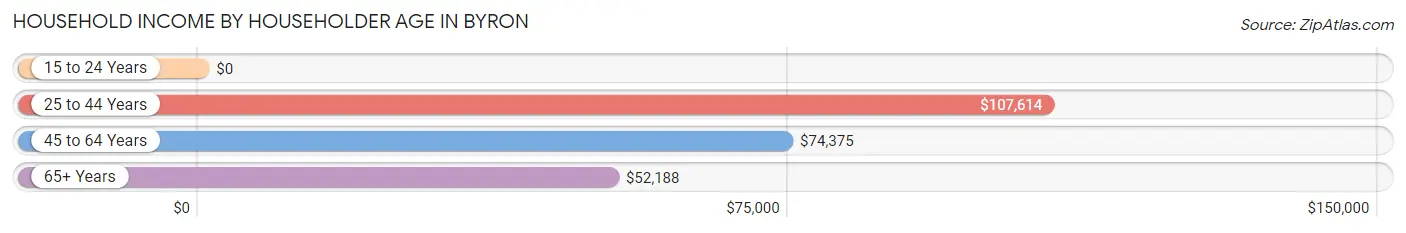
| Income Bracket | # Households | Median Income |
| 15 to 24 Years | 3 (1.3%) | $0 |
| 25 to 44 Years | 71 (31.7%) | $107,614 |
| 45 to 64 Years | 74 (33.0%) | $74,375 |
| 65+ Years | 76 (33.9%) | $52,188 |
| Total | 224 (100.0%) | $70,417 |
Poverty in Byron
Income Below Poverty by Sex and Age in Byron
With 6.4% poverty level for males and 2.6% for females among the residents of Byron, 75 year old and over males and 75 year old and over females are the most vulnerable to poverty, with 3 males (37.5%) and 5 females (23.8%) in their respective age groups living below the poverty level.
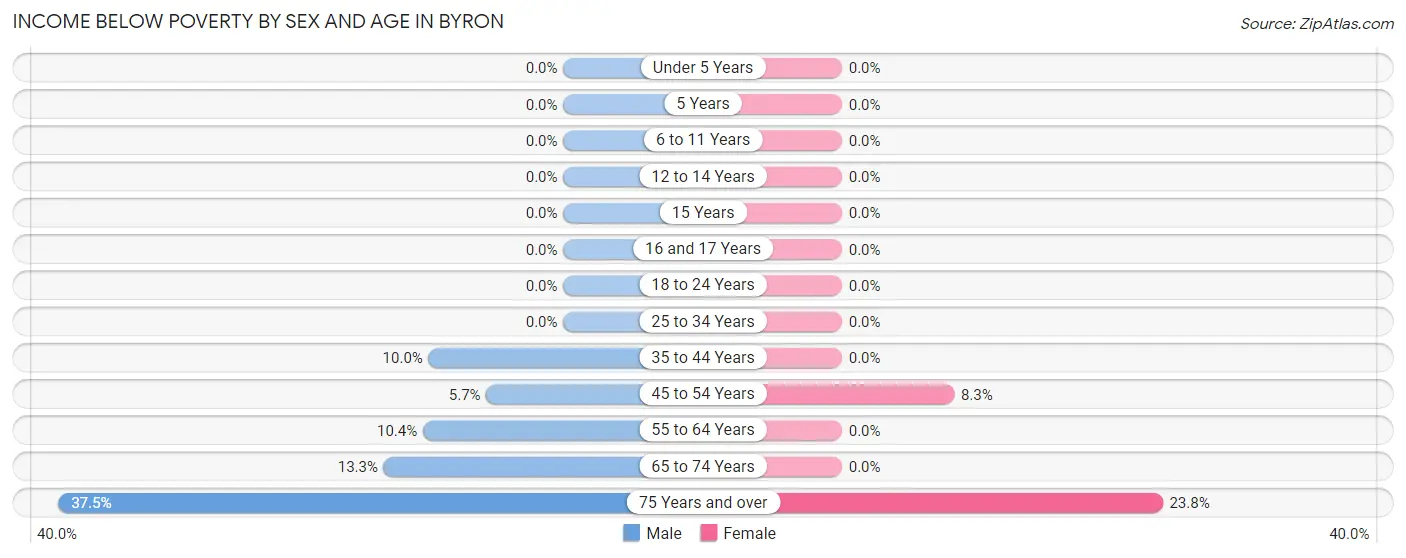
| Age Bracket | Male | Female |
| Under 5 Years | 0 (0.0%) | 0 (0.0%) |
| 5 Years | 0 (0.0%) | 0 (0.0%) |
| 6 to 11 Years | 0 (0.0%) | 0 (0.0%) |
| 12 to 14 Years | 0 (0.0%) | 0 (0.0%) |
| 15 Years | 0 (0.0%) | 0 (0.0%) |
| 16 and 17 Years | 0 (0.0%) | 0 (0.0%) |
| 18 to 24 Years | 0 (0.0%) | 0 (0.0%) |
| 25 to 34 Years | 0 (0.0%) | 0 (0.0%) |
| 35 to 44 Years | 4 (10.0%) | 0 (0.0%) |
| 45 to 54 Years | 2 (5.7%) | 3 (8.3%) |
| 55 to 64 Years | 5 (10.4%) | 0 (0.0%) |
| 65 to 74 Years | 4 (13.3%) | 0 (0.0%) |
| 75 Years and over | 3 (37.5%) | 5 (23.8%) |
| Total | 18 (6.4%) | 8 (2.6%) |
Income Above Poverty by Sex and Age in Byron
According to the poverty statistics in Byron, males aged under 5 years and females aged under 5 years are the age groups that are most secure financially, with 100.0% of males and 100.0% of females in these age groups living above the poverty line.
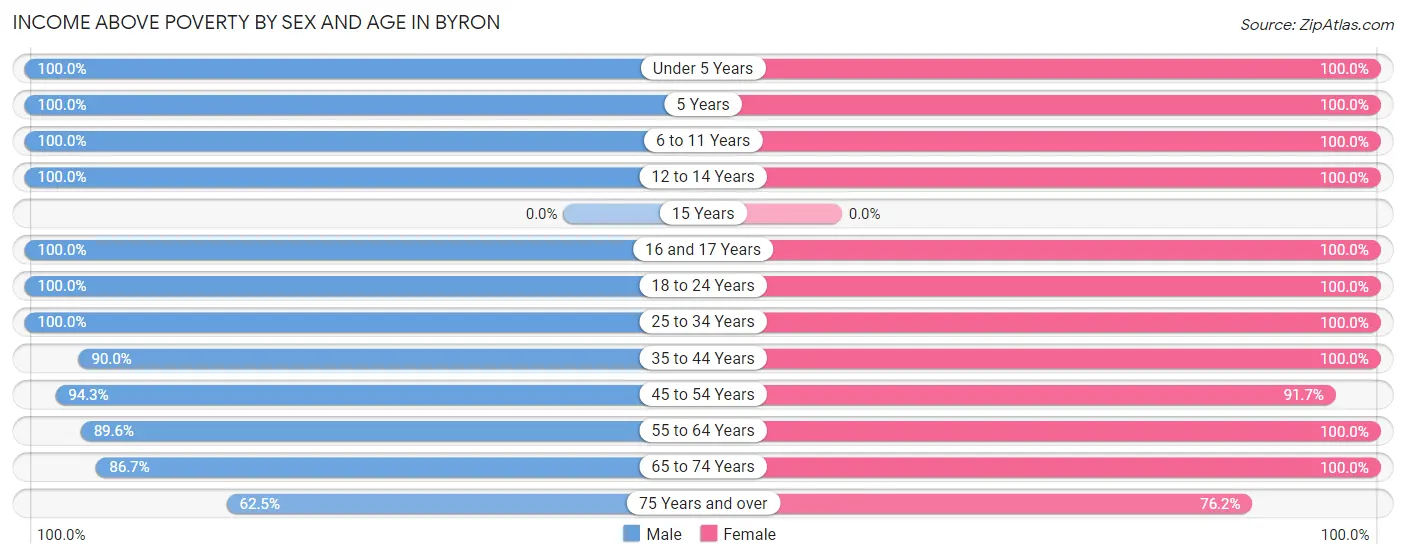
| Age Bracket | Male | Female |
| Under 5 Years | 15 (100.0%) | 16 (100.0%) |
| 5 Years | 5 (100.0%) | 4 (100.0%) |
| 6 to 11 Years | 21 (100.0%) | 29 (100.0%) |
| 12 to 14 Years | 16 (100.0%) | 22 (100.0%) |
| 15 Years | 0 (0.0%) | 0 (0.0%) |
| 16 and 17 Years | 3 (100.0%) | 4 (100.0%) |
| 18 to 24 Years | 21 (100.0%) | 18 (100.0%) |
| 25 to 34 Years | 39 (100.0%) | 53 (100.0%) |
| 35 to 44 Years | 36 (90.0%) | 24 (100.0%) |
| 45 to 54 Years | 33 (94.3%) | 33 (91.7%) |
| 55 to 64 Years | 43 (89.6%) | 42 (100.0%) |
| 65 to 74 Years | 26 (86.7%) | 42 (100.0%) |
| 75 Years and over | 5 (62.5%) | 16 (76.2%) |
| Total | 263 (93.6%) | 303 (97.4%) |
Income Below Poverty Among Married-Couple Families in Byron
The poverty statistics for married-couple families in Byron show that 2.3% or 3 of the total 129 families live below the poverty line. Families with no children have the highest poverty rate of 4.0%, comprising of 3 families. On the other hand, families with 1 or 2 children have the lowest poverty rate of 0.0%, which includes 0 families.
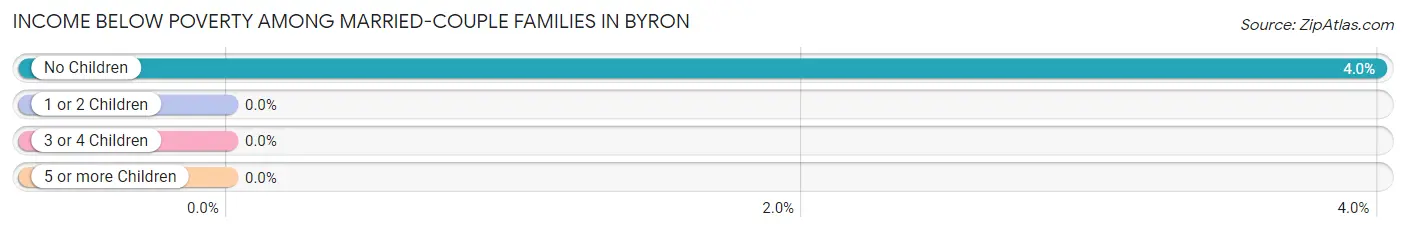
| Children | Above Poverty | Below Poverty |
| No Children | 72 (96.0%) | 3 (4.0%) |
| 1 or 2 Children | 45 (100.0%) | 0 (0.0%) |
| 3 or 4 Children | 9 (100.0%) | 0 (0.0%) |
| 5 or more Children | 0 (0.0%) | 0 (0.0%) |
| Total | 126 (97.7%) | 3 (2.3%) |
Income Below Poverty Among Single-Parent Households in Byron
| Children | Single Father | Single Mother |
| No Children | 0 (0.0%) | 0 (0.0%) |
| 1 or 2 Children | 0 (0.0%) | 0 (0.0%) |
| 3 or 4 Children | 0 (0.0%) | 0 (0.0%) |
| 5 or more Children | 0 (0.0%) | 0 (0.0%) |
| Total | 0 (0.0%) | 0 (0.0%) |
Income Below Poverty Among Married-Couple vs Single-Parent Households in Byron
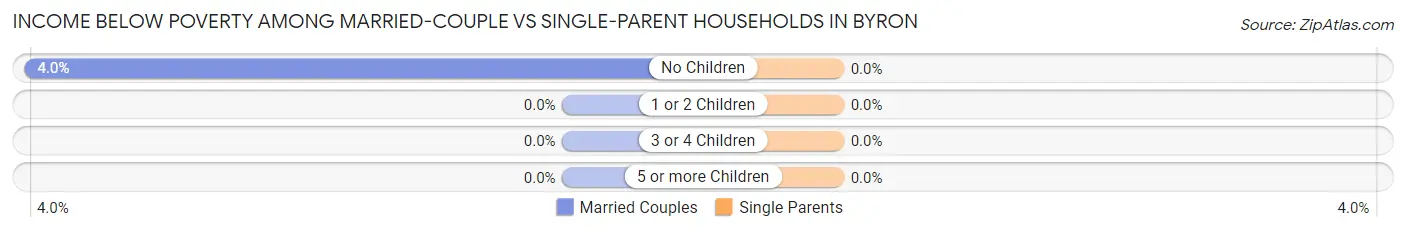
| Children | Married-Couple Families | Single-Parent Households |
| No Children | 3 (4.0%) | 0 (0.0%) |
| 1 or 2 Children | 0 (0.0%) | 0 (0.0%) |
| 3 or 4 Children | 0 (0.0%) | 0 (0.0%) |
| 5 or more Children | 0 (0.0%) | 0 (0.0%) |
| Total | 3 (2.3%) | 0 (0.0%) |
Race in Byron
The most populous races in Byron are White / Caucasian (572 | 94.7%), Two or more Races (29 | 4.8%), and Hispanic or Latino (10 | 1.7%).
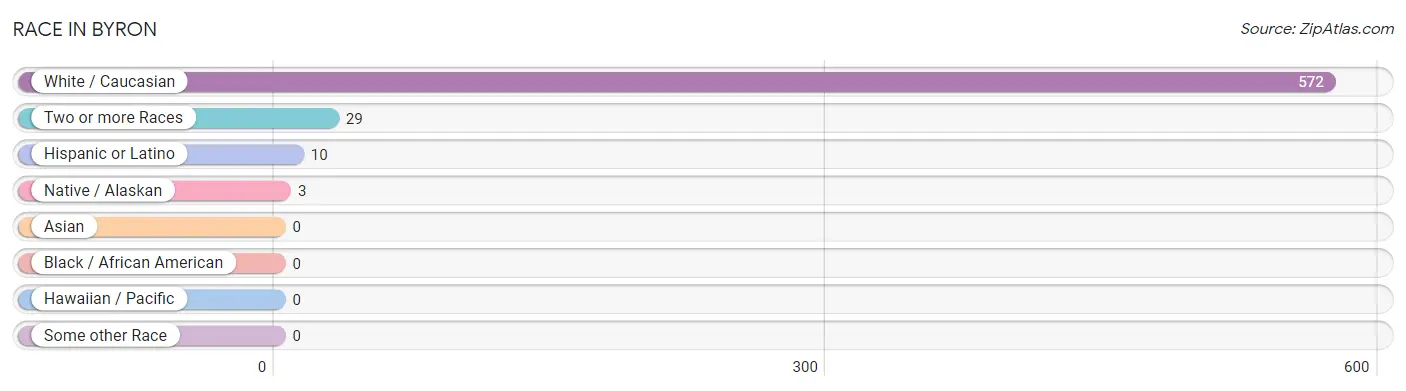
| Race | # Population | % Population |
| Asian | 0 | 0.0% |
| Black / African American | 0 | 0.0% |
| Hawaiian / Pacific | 0 | 0.0% |
| Hispanic or Latino | 10 | 1.7% |
| Native / Alaskan | 3 | 0.5% |
| White / Caucasian | 572 | 94.7% |
| Two or more Races | 29 | 4.8% |
| Some other Race | 0 | 0.0% |
| Total | 604 | 100.0% |
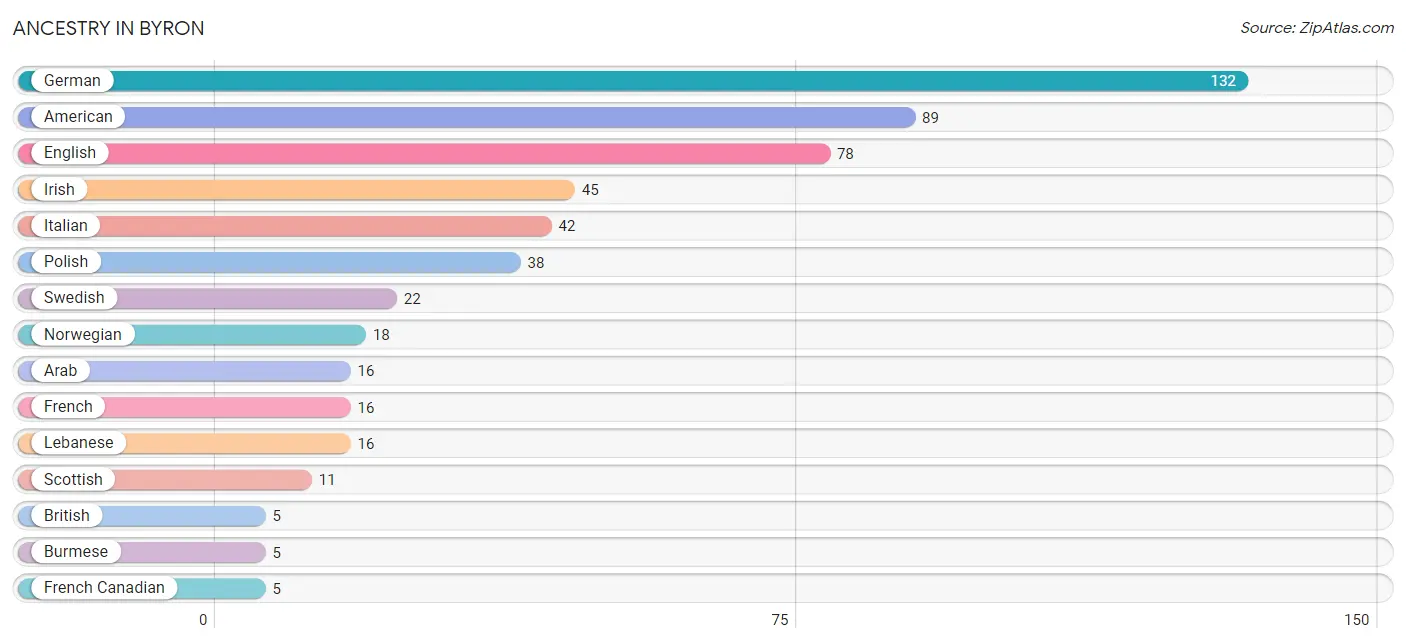
Ancestry in Byron
The most populous ancestries reported in Byron are German (132 | 21.8%), American (89 | 14.7%), English (78 | 12.9%), Irish (45 | 7.4%), and Italian (42 | 7.0%), together accounting for 63.9% of all Byron residents.
| Ancestry | # Population | % Population |
| American | 89 | 14.7% |
| Arab | 16 | 2.6% |
| Belgian | 3 | 0.5% |
| British | 5 | 0.8% |
| Burmese | 5 | 0.8% |
| Chippewa | 1 | 0.2% |
| Czech | 3 | 0.5% |
| Dutch | 4 | 0.7% |
| English | 78 | 12.9% |
| European | 2 | 0.3% |
| French | 16 | 2.6% |
| French Canadian | 5 | 0.8% |
| German | 132 | 21.8% |
| Greek | 4 | 0.7% |
| Irish | 45 | 7.4% |
| Iroquois | 3 | 0.5% |
| Italian | 42 | 7.0% |
| Lebanese | 16 | 2.6% |
| Mexican | 5 | 0.8% |
| Norwegian | 18 | 3.0% |
| Peruvian | 5 | 0.8% |
| Polish | 38 | 6.3% |
| Scandinavian | 2 | 0.3% |
| Scottish | 11 | 1.8% |
| South American | 5 | 0.8% |
| Swedish | 22 | 3.6% |
| Ukrainian | 4 | 0.7% |
| Welsh | 4 | 0.7% | View All 28 Rows |
Immigrants in Byron
The most numerous immigrant groups reported in Byron came from Latin America (5 | 0.8%), Peru (5 | 0.8%), and South America (5 | 0.8%), together accounting for 2.5% of all Byron residents.
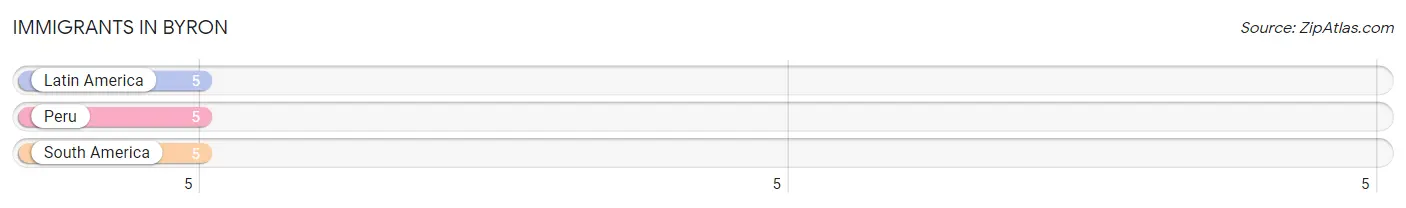
| Immigration Origin | # Population | % Population |
| Latin America | 5 | 0.8% |
| Peru | 5 | 0.8% |
| South America | 5 | 0.8% | View All 3 Rows |
Sex and Age in Byron
Sex and Age in Byron
The most populous age groups in Byron are 60 to 64 Years (30 | 10.4%) for men and 10 to 14 Years (33 | 10.5%) for women.
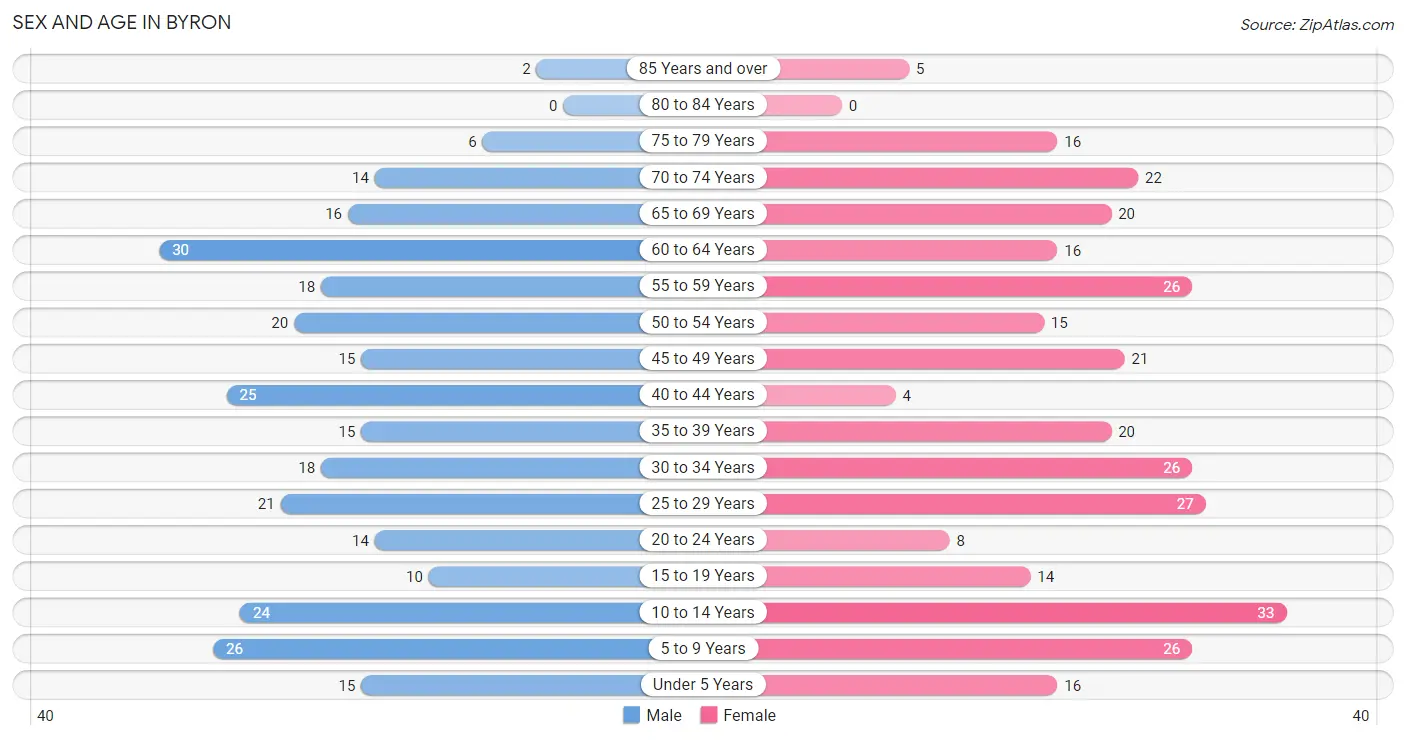
| Age Bracket | Male | Female |
| Under 5 Years | 15 (5.2%) | 16 (5.1%) |
| 5 to 9 Years | 26 (9.0%) | 26 (8.3%) |
| 10 to 14 Years | 24 (8.3%) | 33 (10.5%) |
| 15 to 19 Years | 10 (3.5%) | 14 (4.4%) |
| 20 to 24 Years | 14 (4.8%) | 8 (2.5%) |
| 25 to 29 Years | 21 (7.3%) | 27 (8.6%) |
| 30 to 34 Years | 18 (6.2%) | 26 (8.3%) |
| 35 to 39 Years | 15 (5.2%) | 20 (6.4%) |
| 40 to 44 Years | 25 (8.6%) | 4 (1.3%) |
| 45 to 49 Years | 15 (5.2%) | 21 (6.7%) |
| 50 to 54 Years | 20 (6.9%) | 15 (4.8%) |
| 55 to 59 Years | 18 (6.2%) | 26 (8.3%) |
| 60 to 64 Years | 30 (10.4%) | 16 (5.1%) |
| 65 to 69 Years | 16 (5.5%) | 20 (6.4%) |
| 70 to 74 Years | 14 (4.8%) | 22 (7.0%) |
| 75 to 79 Years | 6 (2.1%) | 16 (5.1%) |
| 80 to 84 Years | 0 (0.0%) | 0 (0.0%) |
| 85 Years and over | 2 (0.7%) | 5 (1.6%) |
| Total | 289 (100.0%) | 315 (100.0%) |
Families and Households in Byron
Median Family Size in Byron
The median family size in Byron is 2.94 persons per family, with married-couple families (129 | 72.9%) accounting for the largest median family size of 3.19 persons per family. On the other hand, single female/mother families (45 | 25.4%) represent the smallest median family size with 2.27 persons per family.
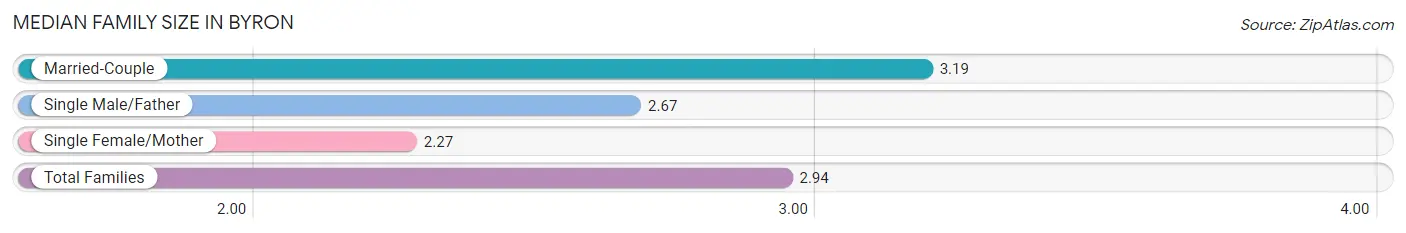
| Family Type | # Families | Family Size |
| Married-Couple | 129 (72.9%) | 3.19 |
| Single Male/Father | 3 (1.7%) | 2.67 |
| Single Female/Mother | 45 (25.4%) | 2.27 |
| Total Families | 177 (100.0%) | 2.94 |
Median Household Size in Byron
The median household size in Byron is 2.70 persons per household, with married-couple households (129 | 57.6%) accounting for the largest median household size of 3.19 persons per household. non-family households (47 | 21.0%) represent the smallest median household size with 1.26 persons per household.
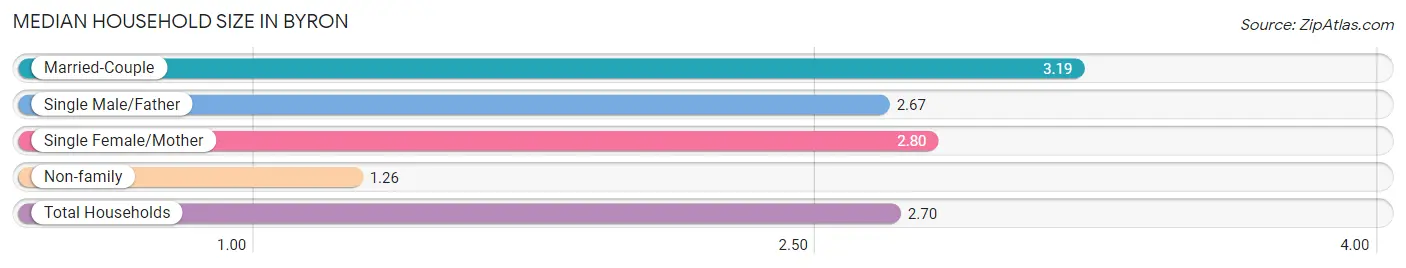
| Household Type | # Households | Household Size |
| Married-Couple | 129 (57.6%) | 3.19 |
| Single Male/Father | 3 (1.3%) | 2.67 |
| Single Female/Mother | 45 (20.1%) | 2.80 |
| Non-family | 47 (21.0%) | 1.26 |
| Total Households | 224 (100.0%) | 2.70 |
Household Size by Marriage Status in Byron
Out of a total of 224 households in Byron, 177 (79.0%) are family households, while 47 (21.0%) are nonfamily households. The most numerous type of family households are 2-person households, comprising 83, and the most common type of nonfamily households are 1-person households, comprising 33.
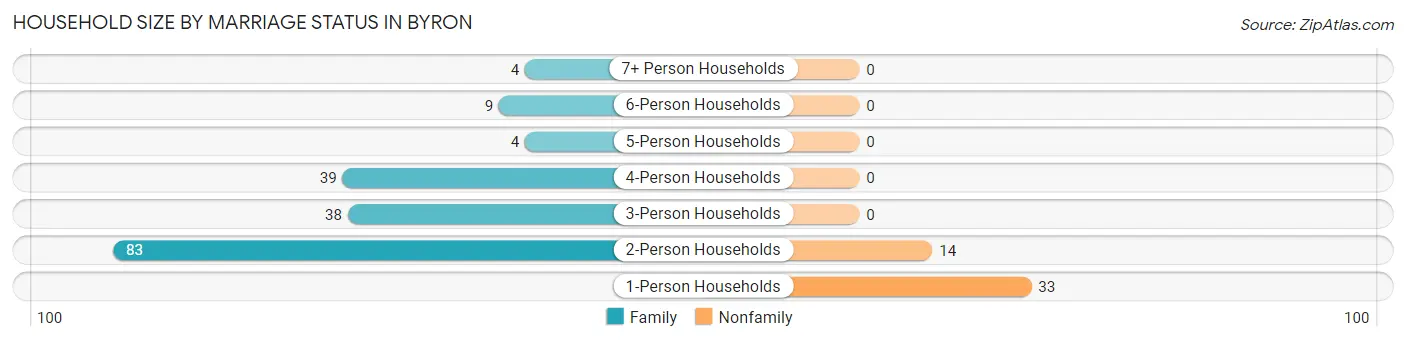
| Household Size | Family Households | Nonfamily Households |
| 1-Person Households | - | 33 (14.7%) |
| 2-Person Households | 83 (37.0%) | 14 (6.2%) |
| 3-Person Households | 38 (17.0%) | 0 (0.0%) |
| 4-Person Households | 39 (17.4%) | 0 (0.0%) |
| 5-Person Households | 4 (1.8%) | 0 (0.0%) |
| 6-Person Households | 9 (4.0%) | 0 (0.0%) |
| 7+ Person Households | 4 (1.8%) | 0 (0.0%) |
| Total | 177 (79.0%) | 47 (21.0%) |
Female Fertility in Byron
Fertility by Age in Byron
Average fertility rate in Byron is 50.0 births per 1,000 women. Women in the age bracket of 20 to 34 years have the highest fertility rate with 98.0 births per 1,000 women. Women in the age bracket of 20 to 34 years acount for 100.0% of all women with births.
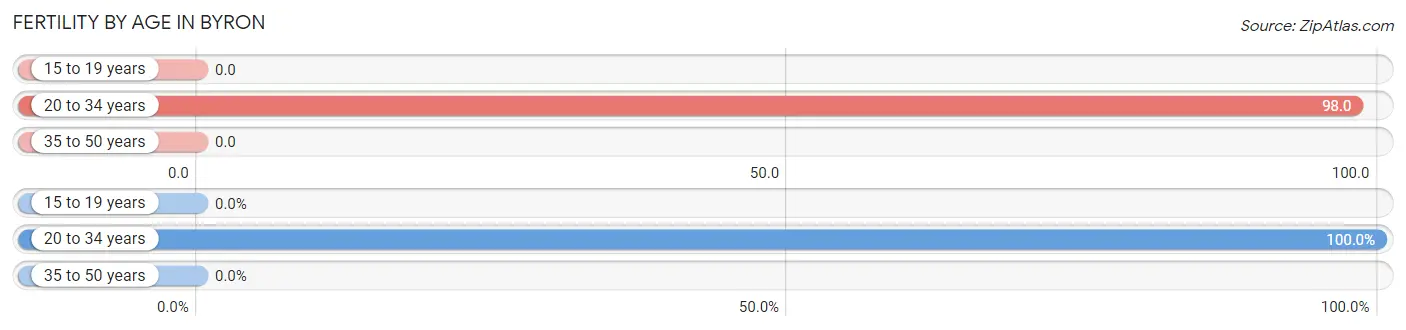
| Age Bracket | Women with Births | Births / 1,000 Women |
| 15 to 19 years | 0 (0.0%) | 0.0 |
| 20 to 34 years | 6 (100.0%) | 98.0 |
| 35 to 50 years | 0 (0.0%) | 0.0 |
| Total | 6 (100.0%) | 50.0 |
Fertility by Age by Marriage Status in Byron
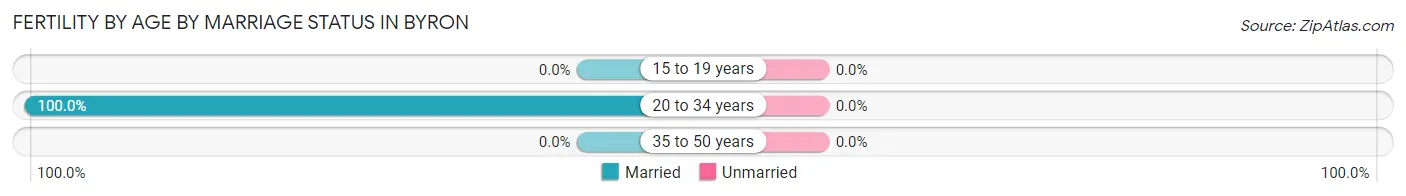
| Age Bracket | Married | Unmarried |
| 15 to 19 years | 0 (0.0%) | 0 (0.0%) |
| 20 to 34 years | 6 (100.0%) | 0 (0.0%) |
| 35 to 50 years | 0 (0.0%) | 0 (0.0%) |
| Total | 6 (100.0%) | 0 (0.0%) |
Fertility by Education in Byron
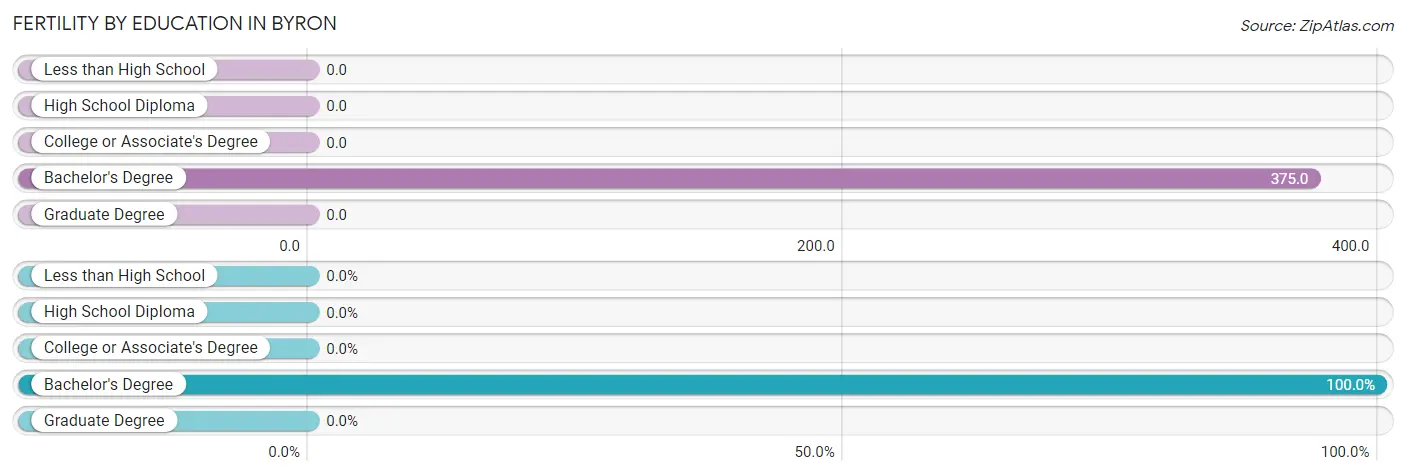
| Educational Attainment | Women with Births | Births / 1,000 Women |
| Less than High School | 0 (0.0%) | 0.0 |
| High School Diploma | 0 (0.0%) | 0.0 |
| College or Associate's Degree | 0 (0.0%) | 0.0 |
| Bachelor's Degree | 6 (100.0%) | 375.0 |
| Graduate Degree | 0 (0.0%) | 0.0 |
| Total | 6 (100.0%) | 50.0 |
Fertility by Education by Marriage Status in Byron
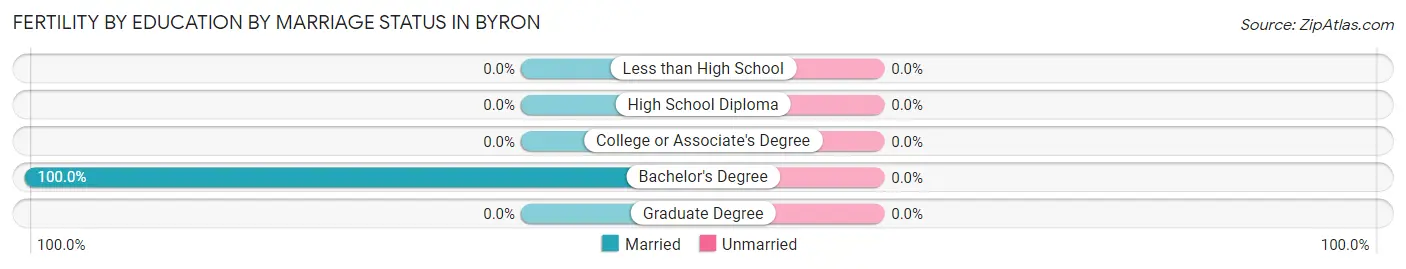
| Educational Attainment | Married | Unmarried |
| Less than High School | 0 (0.0%) | 0 (0.0%) |
| High School Diploma | 0 (0.0%) | 0 (0.0%) |
| College or Associate's Degree | 0 (0.0%) | 0 (0.0%) |
| Bachelor's Degree | 6 (100.0%) | 0 (0.0%) |
| Graduate Degree | 0 (0.0%) | 0 (0.0%) |
| Total | 6 (100.0%) | 0 (0.0%) |
Employment Characteristics in Byron
Employment by Class of Employer in Byron
Among the 297 employed individuals in Byron, private company employees (210 | 70.7%), not-for-profit organizations (33 | 11.1%), and self-employed (not incorporated) (26 | 8.7%) make up the most common classes of employment.
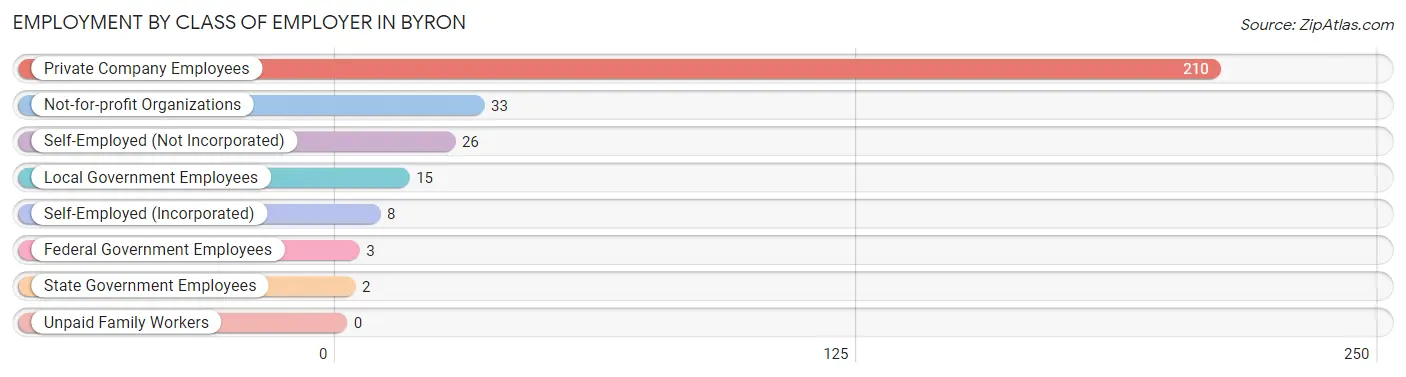
| Employer Class | # Employees | % Employees |
| Private Company Employees | 210 | 70.7% |
| Self-Employed (Incorporated) | 8 | 2.7% |
| Self-Employed (Not Incorporated) | 26 | 8.7% |
| Not-for-profit Organizations | 33 | 11.1% |
| Local Government Employees | 15 | 5.1% |
| State Government Employees | 2 | 0.7% |
| Federal Government Employees | 3 | 1.0% |
| Unpaid Family Workers | 0 | 0.0% |
| Total | 297 | 100.0% |
Employment Status by Age in Byron
According to the labor force statistics for Byron, out of the total population over 16 years of age (464), 68.1% or 316 individuals are in the labor force, with 4.7% or 15 of them unemployed. The age group with the highest labor force participation rate is 25 to 29 years, with 100.0% or 48 individuals in the labor force. Within the labor force, the 20 to 24 years age range has the highest percentage of unemployed individuals, with 33.3% or 4 of them being unemployed.
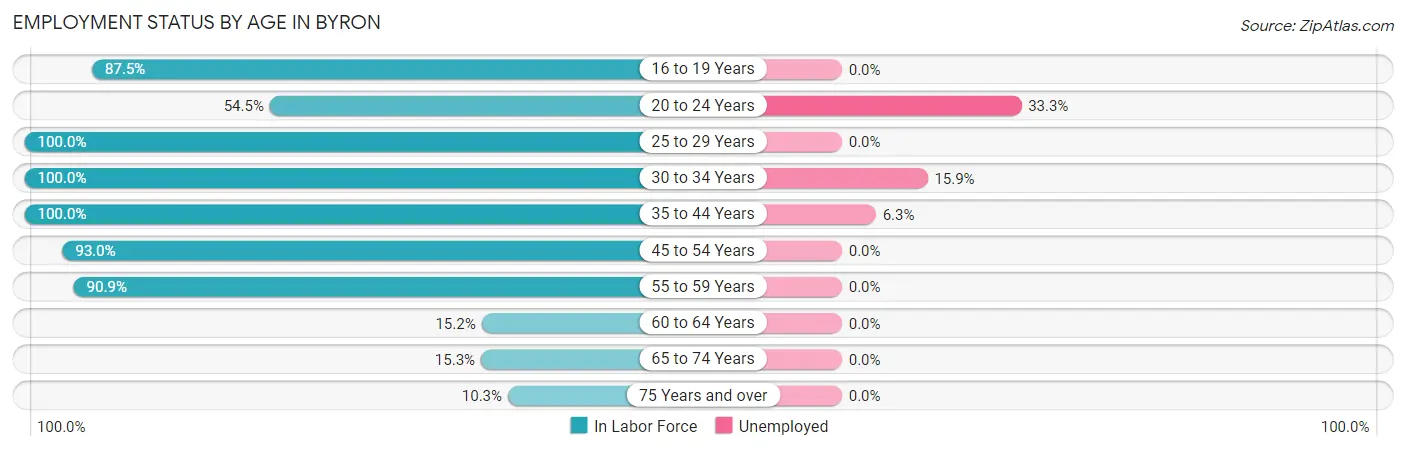
| Age Bracket | In Labor Force | Unemployed |
| 16 to 19 Years | 21 (87.5%) | 0 (0.0%) |
| 20 to 24 Years | 12 (54.5%) | 4 (33.3%) |
| 25 to 29 Years | 48 (100.0%) | 0 (0.0%) |
| 30 to 34 Years | 44 (100.0%) | 7 (15.9%) |
| 35 to 44 Years | 64 (100.0%) | 4 (6.3%) |
| 45 to 54 Years | 66 (93.0%) | 0 (0.0%) |
| 55 to 59 Years | 40 (90.9%) | 0 (0.0%) |
| 60 to 64 Years | 7 (15.2%) | 0 (0.0%) |
| 65 to 74 Years | 11 (15.3%) | 0 (0.0%) |
| 75 Years and over | 3 (10.3%) | 0 (0.0%) |
| Total | 316 (68.1%) | 15 (4.7%) |
Employment Status by Educational Attainment in Byron
According to labor force statistics for Byron, 84.9% of individuals (269) out of the total population between 25 and 64 years of age (317) are in the labor force, with 4.1% or 11 of them being unemployed. The group with the highest labor force participation rate are those with the educational attainment of bachelor's degree or higher, with 93.2% or 68 individuals in the labor force. Within the labor force, individuals with high school diploma education have the highest percentage of unemployment, with 18.6% or 11 of them being unemployed.
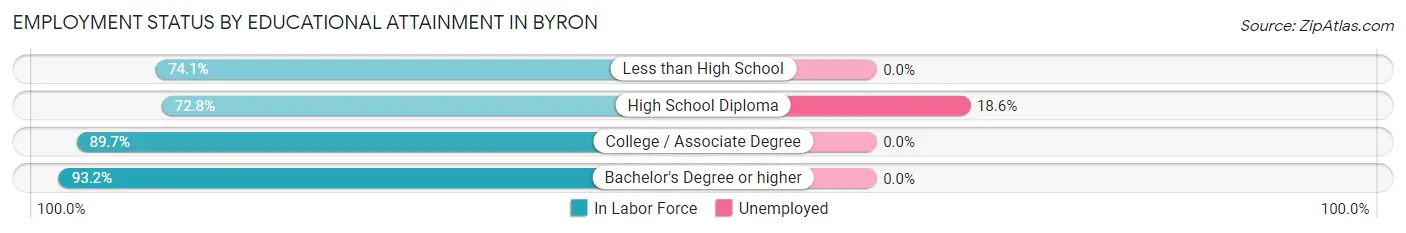
| Educational Attainment | In Labor Force | Unemployed |
| Less than High School | 20 (74.1%) | 0 (0.0%) |
| High School Diploma | 59 (72.8%) | 15 (18.6%) |
| College / Associate Degree | 122 (89.7%) | 0 (0.0%) |
| Bachelor's Degree or higher | 68 (93.2%) | 0 (0.0%) |
| Total | 269 (84.9%) | 13 (4.1%) |
Employment Occupations by Sex in Byron
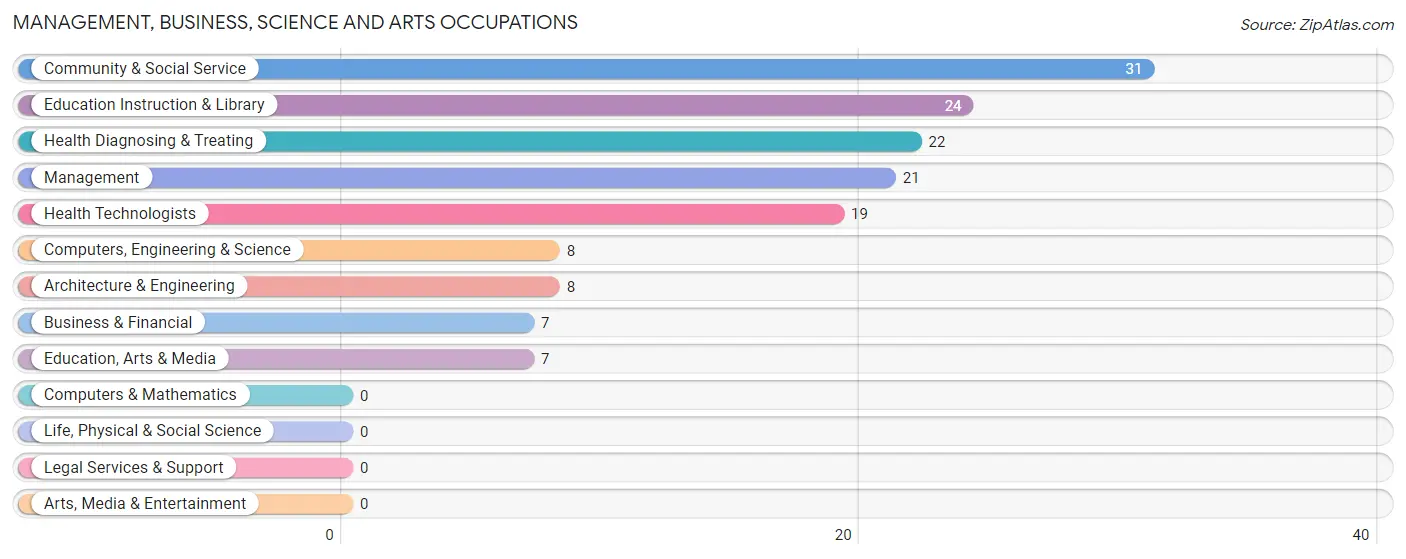
Management, Business, Science and Arts Occupations
The most common Management, Business, Science and Arts occupations in Byron are Community & Social Service (31 | 10.3%), Education Instruction & Library (24 | 8.0%), Health Diagnosing & Treating (22 | 7.3%), Management (21 | 7.0%), and Health Technologists (19 | 6.3%).
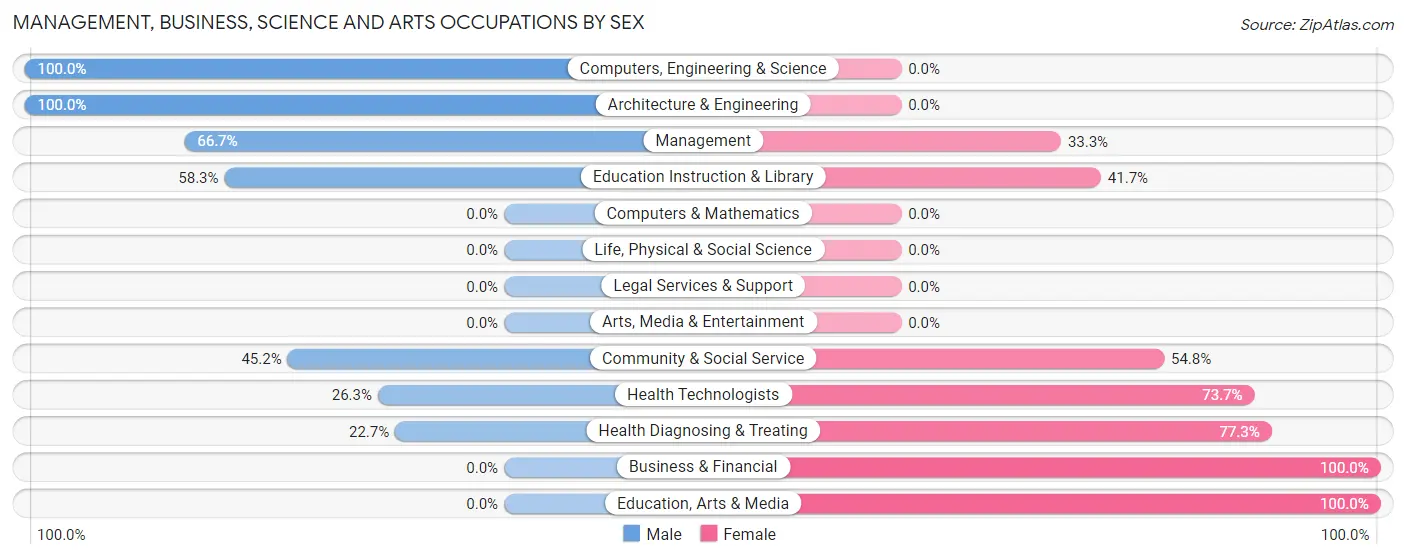
Management, Business, Science and Arts Occupations by Sex
Within the Management, Business, Science and Arts occupations in Byron, the most male-oriented occupations are Computers, Engineering & Science (100.0%), Architecture & Engineering (100.0%), and Management (66.7%), while the most female-oriented occupations are Business & Financial (100.0%), Education, Arts & Media (100.0%), and Health Diagnosing & Treating (77.3%).
| Occupation | Male | Female |
| Management | 14 (66.7%) | 7 (33.3%) |
| Business & Financial | 0 (0.0%) | 7 (100.0%) |
| Computers, Engineering & Science | 8 (100.0%) | 0 (0.0%) |
| Computers & Mathematics | 0 (0.0%) | 0 (0.0%) |
| Architecture & Engineering | 8 (100.0%) | 0 (0.0%) |
| Life, Physical & Social Science | 0 (0.0%) | 0 (0.0%) |
| Community & Social Service | 14 (45.2%) | 17 (54.8%) |
| Education, Arts & Media | 0 (0.0%) | 7 (100.0%) |
| Legal Services & Support | 0 (0.0%) | 0 (0.0%) |
| Education Instruction & Library | 14 (58.3%) | 10 (41.7%) |
| Arts, Media & Entertainment | 0 (0.0%) | 0 (0.0%) |
| Health Diagnosing & Treating | 5 (22.7%) | 17 (77.3%) |
| Health Technologists | 5 (26.3%) | 14 (73.7%) |
| Total (Category) | 41 (46.1%) | 48 (53.9%) |
| Total (Overall) | 148 (49.2%) | 153 (50.8%) |
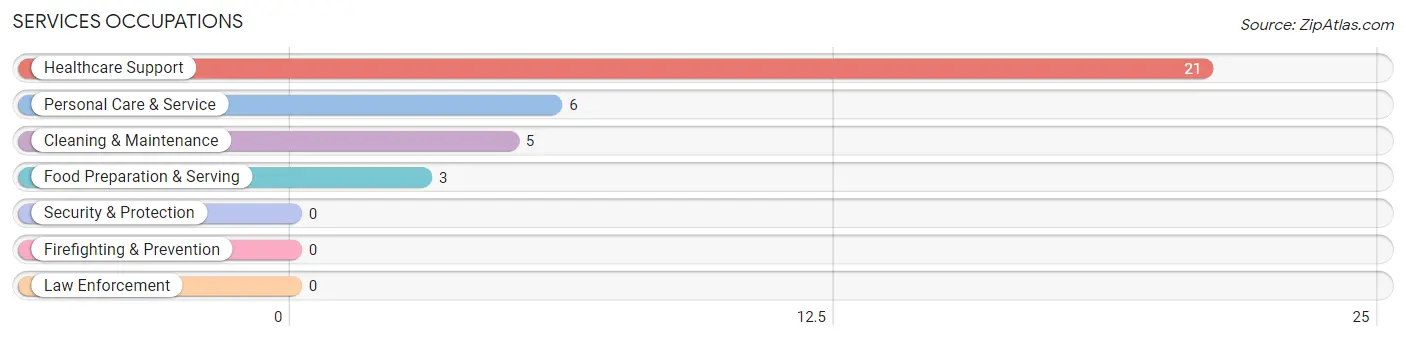
Services Occupations
The most common Services occupations in Byron are Healthcare Support (21 | 7.0%), Personal Care & Service (6 | 2.0%), Cleaning & Maintenance (5 | 1.7%), and Food Preparation & Serving (3 | 1.0%).
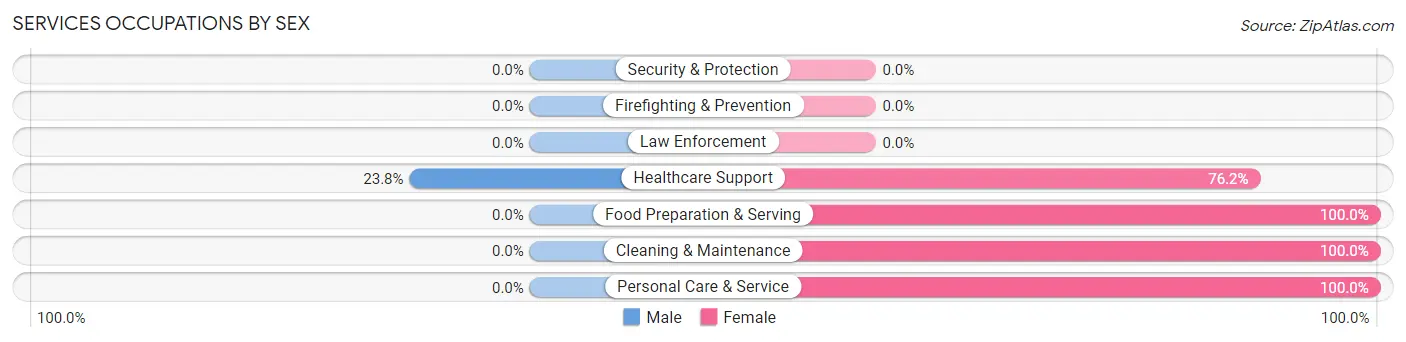
Services Occupations by Sex
| Occupation | Male | Female |
| Healthcare Support | 5 (23.8%) | 16 (76.2%) |
| Security & Protection | 0 (0.0%) | 0 (0.0%) |
| Firefighting & Prevention | 0 (0.0%) | 0 (0.0%) |
| Law Enforcement | 0 (0.0%) | 0 (0.0%) |
| Food Preparation & Serving | 0 (0.0%) | 3 (100.0%) |
| Cleaning & Maintenance | 0 (0.0%) | 5 (100.0%) |
| Personal Care & Service | 0 (0.0%) | 6 (100.0%) |
| Total (Category) | 5 (14.3%) | 30 (85.7%) |
| Total (Overall) | 148 (49.2%) | 153 (50.8%) |
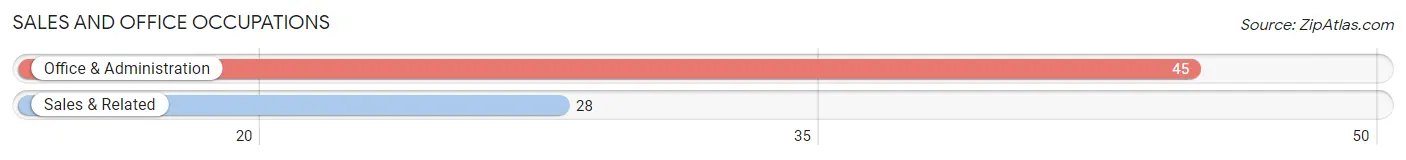
Sales and Office Occupations
The most common Sales and Office occupations in Byron are Office & Administration (45 | 14.9%), and Sales & Related (28 | 9.3%).
Sales and Office Occupations by Sex
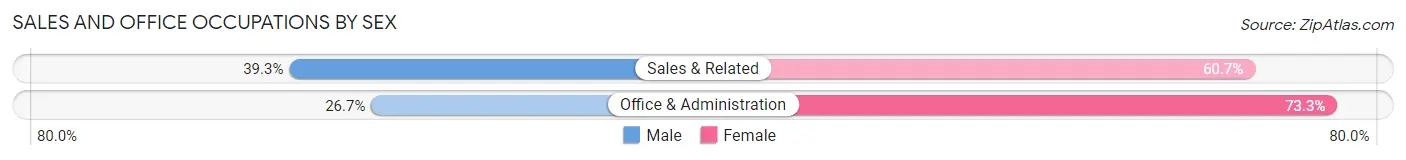
| Occupation | Male | Female |
| Sales & Related | 11 (39.3%) | 17 (60.7%) |
| Office & Administration | 12 (26.7%) | 33 (73.3%) |
| Total (Category) | 23 (31.5%) | 50 (68.5%) |
| Total (Overall) | 148 (49.2%) | 153 (50.8%) |
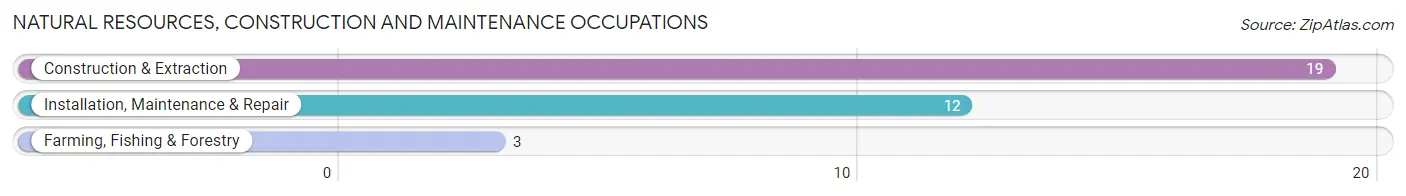
Natural Resources, Construction and Maintenance Occupations
The most common Natural Resources, Construction and Maintenance occupations in Byron are Construction & Extraction (19 | 6.3%), Installation, Maintenance & Repair (12 | 4.0%), and Farming, Fishing & Forestry (3 | 1.0%).
Natural Resources, Construction and Maintenance Occupations by Sex
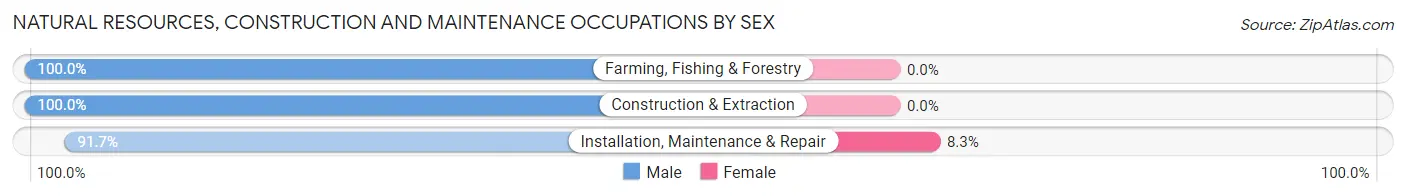
| Occupation | Male | Female |
| Farming, Fishing & Forestry | 3 (100.0%) | 0 (0.0%) |
| Construction & Extraction | 19 (100.0%) | 0 (0.0%) |
| Installation, Maintenance & Repair | 11 (91.7%) | 1 (8.3%) |
| Total (Category) | 33 (97.1%) | 1 (2.9%) |
| Total (Overall) | 148 (49.2%) | 153 (50.8%) |
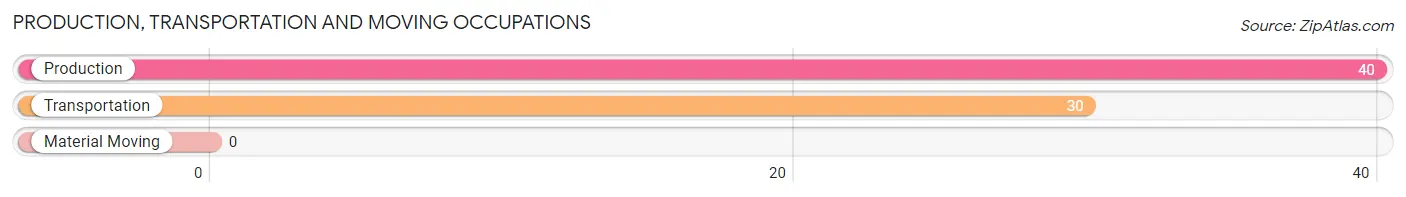
Production, Transportation and Moving Occupations
The most common Production, Transportation and Moving occupations in Byron are Production (40 | 13.3%), and Transportation (30 | 10.0%).
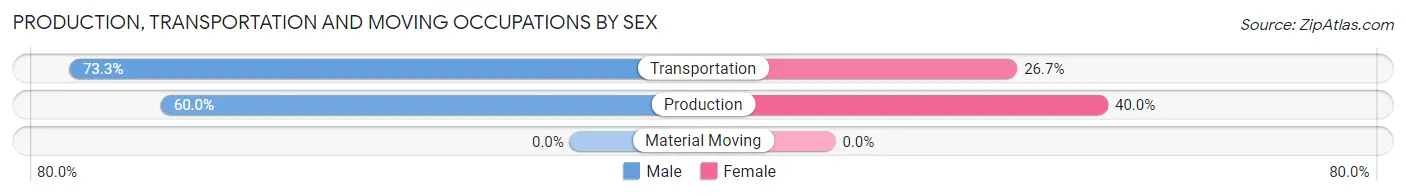
Production, Transportation and Moving Occupations by Sex
| Occupation | Male | Female |
| Production | 24 (60.0%) | 16 (40.0%) |
| Transportation | 22 (73.3%) | 8 (26.7%) |
| Material Moving | 0 (0.0%) | 0 (0.0%) |
| Total (Category) | 46 (65.7%) | 24 (34.3%) |
| Total (Overall) | 148 (49.2%) | 153 (50.8%) |
Employment Industries by Sex in Byron
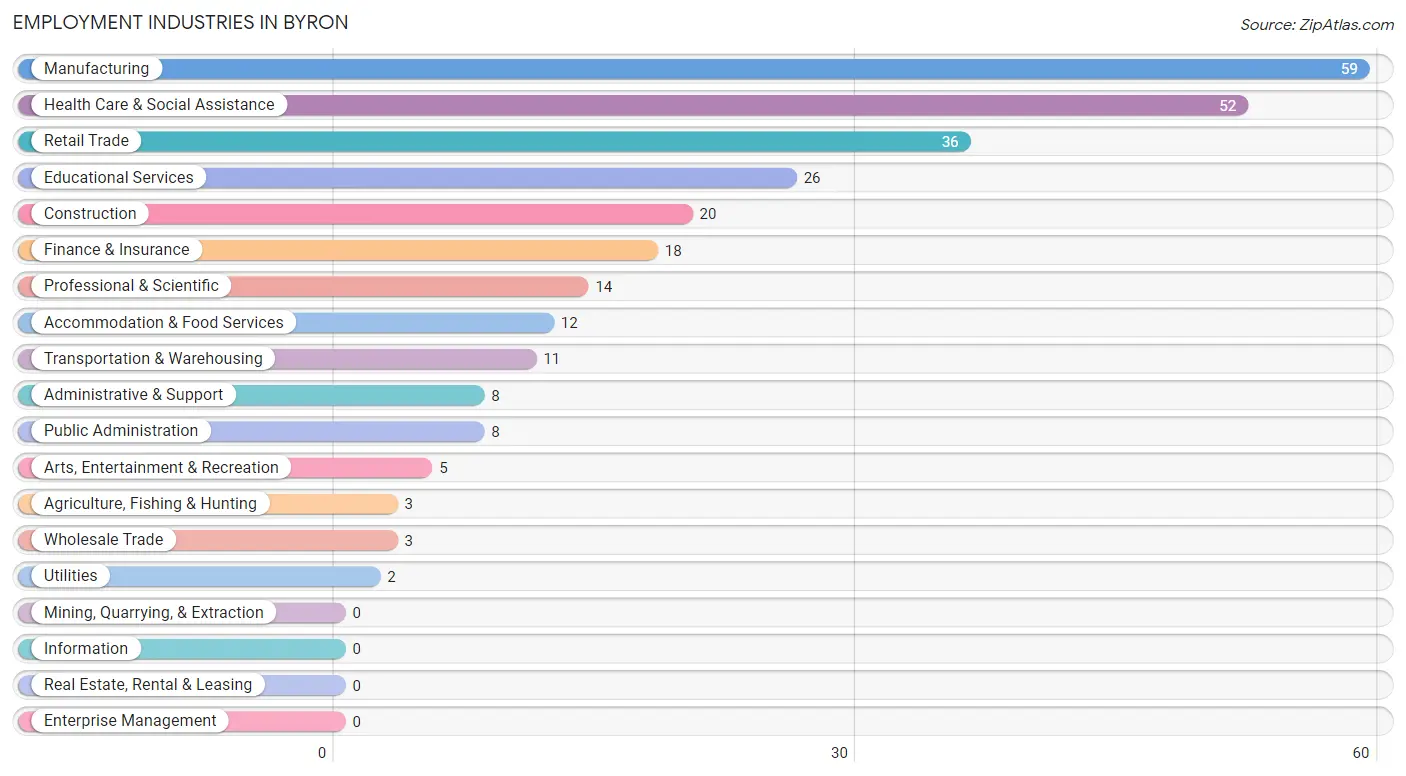
Employment Industries in Byron
The major employment industries in Byron include Manufacturing (59 | 19.6%), Health Care & Social Assistance (52 | 17.3%), Retail Trade (36 | 12.0%), Educational Services (26 | 8.6%), and Construction (20 | 6.6%).
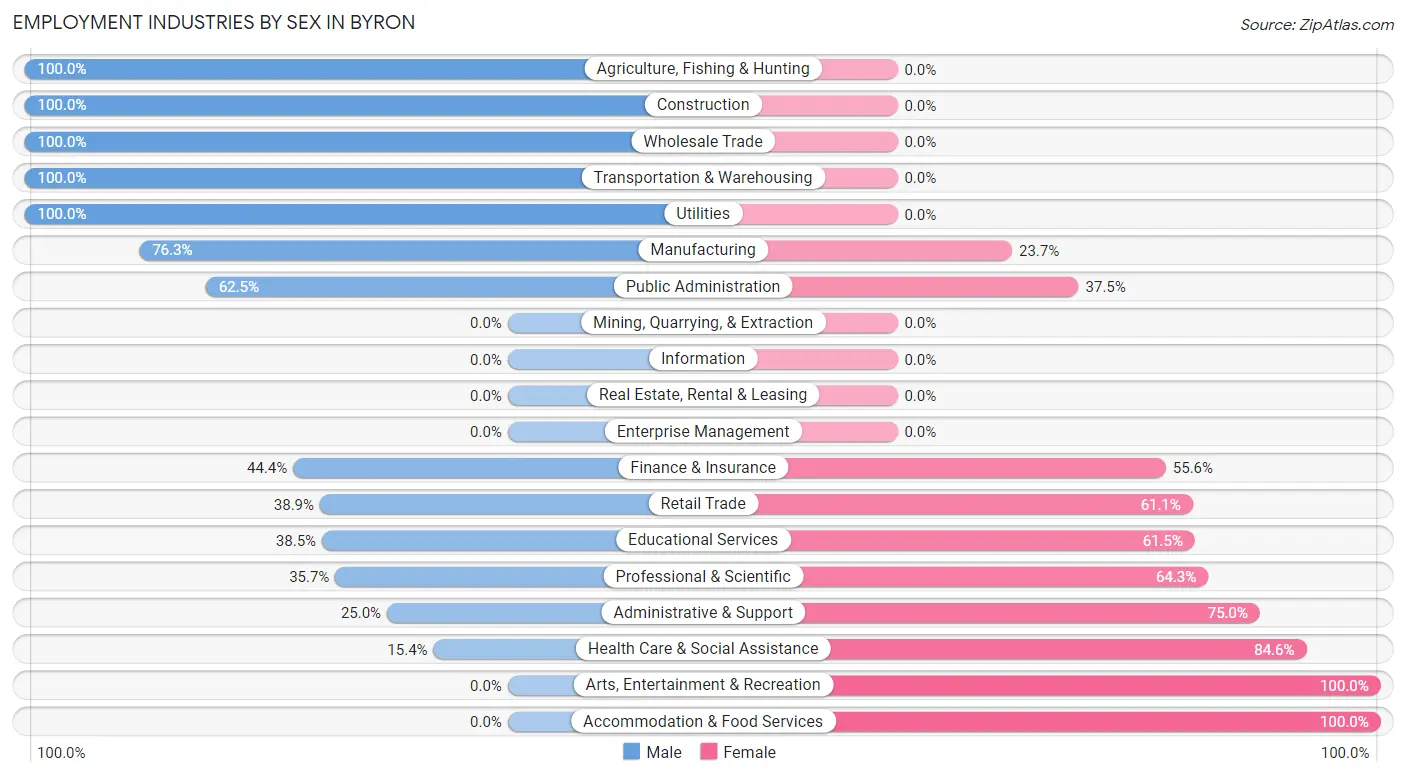
Employment Industries by Sex in Byron
The Byron industries that see more men than women are Agriculture, Fishing & Hunting (100.0%), Construction (100.0%), and Wholesale Trade (100.0%), whereas the industries that tend to have a higher number of women are Arts, Entertainment & Recreation (100.0%), Accommodation & Food Services (100.0%), and Health Care & Social Assistance (84.6%).
| Industry | Male | Female |
| Agriculture, Fishing & Hunting | 3 (100.0%) | 0 (0.0%) |
| Mining, Quarrying, & Extraction | 0 (0.0%) | 0 (0.0%) |
| Construction | 20 (100.0%) | 0 (0.0%) |
| Manufacturing | 45 (76.3%) | 14 (23.7%) |
| Wholesale Trade | 3 (100.0%) | 0 (0.0%) |
| Retail Trade | 14 (38.9%) | 22 (61.1%) |
| Transportation & Warehousing | 11 (100.0%) | 0 (0.0%) |
| Utilities | 2 (100.0%) | 0 (0.0%) |
| Information | 0 (0.0%) | 0 (0.0%) |
| Finance & Insurance | 8 (44.4%) | 10 (55.6%) |
| Real Estate, Rental & Leasing | 0 (0.0%) | 0 (0.0%) |
| Professional & Scientific | 5 (35.7%) | 9 (64.3%) |
| Enterprise Management | 0 (0.0%) | 0 (0.0%) |
| Administrative & Support | 2 (25.0%) | 6 (75.0%) |
| Educational Services | 10 (38.5%) | 16 (61.5%) |
| Health Care & Social Assistance | 8 (15.4%) | 44 (84.6%) |
| Arts, Entertainment & Recreation | 0 (0.0%) | 5 (100.0%) |
| Accommodation & Food Services | 0 (0.0%) | 12 (100.0%) |
| Public Administration | 5 (62.5%) | 3 (37.5%) |
| Total | 148 (49.2%) | 153 (50.8%) |
Education in Byron
School Enrollment in Byron
The most common levels of schooling among the 163 students in Byron are middle school (42 | 25.8%), college / undergraduate (42 | 25.8%), and elementary school (37 | 22.7%).
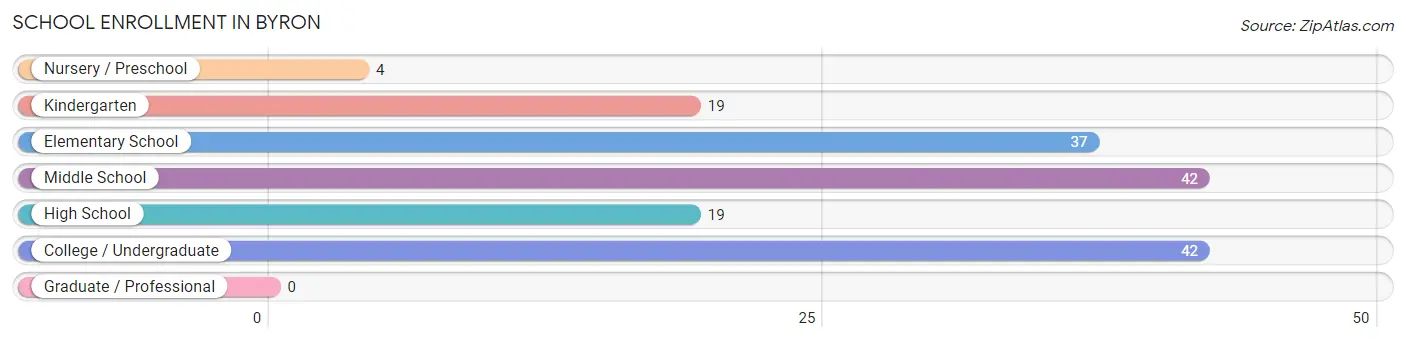
| School Level | # Students | % Students |
| Nursery / Preschool | 4 | 2.5% |
| Kindergarten | 19 | 11.7% |
| Elementary School | 37 | 22.7% |
| Middle School | 42 | 25.8% |
| High School | 19 | 11.7% |
| College / Undergraduate | 42 | 25.8% |
| Graduate / Professional | 0 | 0.0% |
| Total | 163 | 100.0% |
School Enrollment by Age by Funding Source in Byron
Out of a total of 163 students who are enrolled in schools in Byron, 30 (18.4%) attend a private institution, while the remaining 133 (81.6%) are enrolled in public schools. The age group of 18 to 19 year olds has the highest likelihood of being enrolled in private schools, with 5 (50.0% in the age bracket) enrolled. Conversely, the age group of 35 years and over has the lowest likelihood of being enrolled in a private school, with 8 (100.0% in the age bracket) attending a public institution.
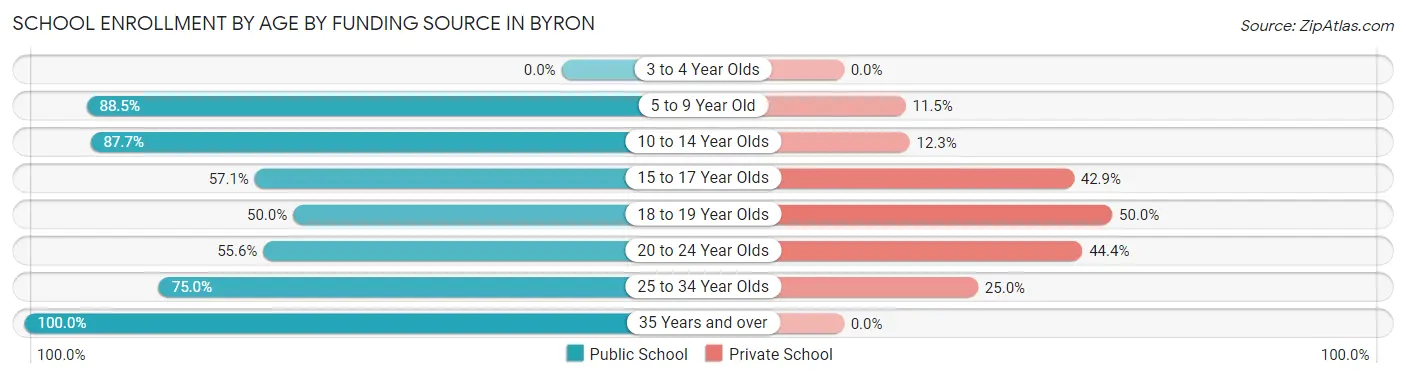
| Age Bracket | Public School | Private School |
| 3 to 4 Year Olds | 0 (0.0%) | 0 (0.0%) |
| 5 to 9 Year Old | 46 (88.5%) | 6 (11.5%) |
| 10 to 14 Year Olds | 50 (87.7%) | 7 (12.3%) |
| 15 to 17 Year Olds | 4 (57.1%) | 3 (42.9%) |
| 18 to 19 Year Olds | 5 (50.0%) | 5 (50.0%) |
| 20 to 24 Year Olds | 5 (55.6%) | 4 (44.4%) |
| 25 to 34 Year Olds | 15 (75.0%) | 5 (25.0%) |
| 35 Years and over | 8 (100.0%) | 0 (0.0%) |
| Total | 133 (81.6%) | 30 (18.4%) |
Educational Attainment by Field of Study in Byron
Science & technology (17 | 19.3%), arts & humanities (17 | 19.3%), business (13 | 14.8%), liberal arts & history (9 | 10.2%), and social sciences (7 | 8.0%) are the most common fields of study among 88 individuals in Byron who have obtained a bachelor's degree or higher.
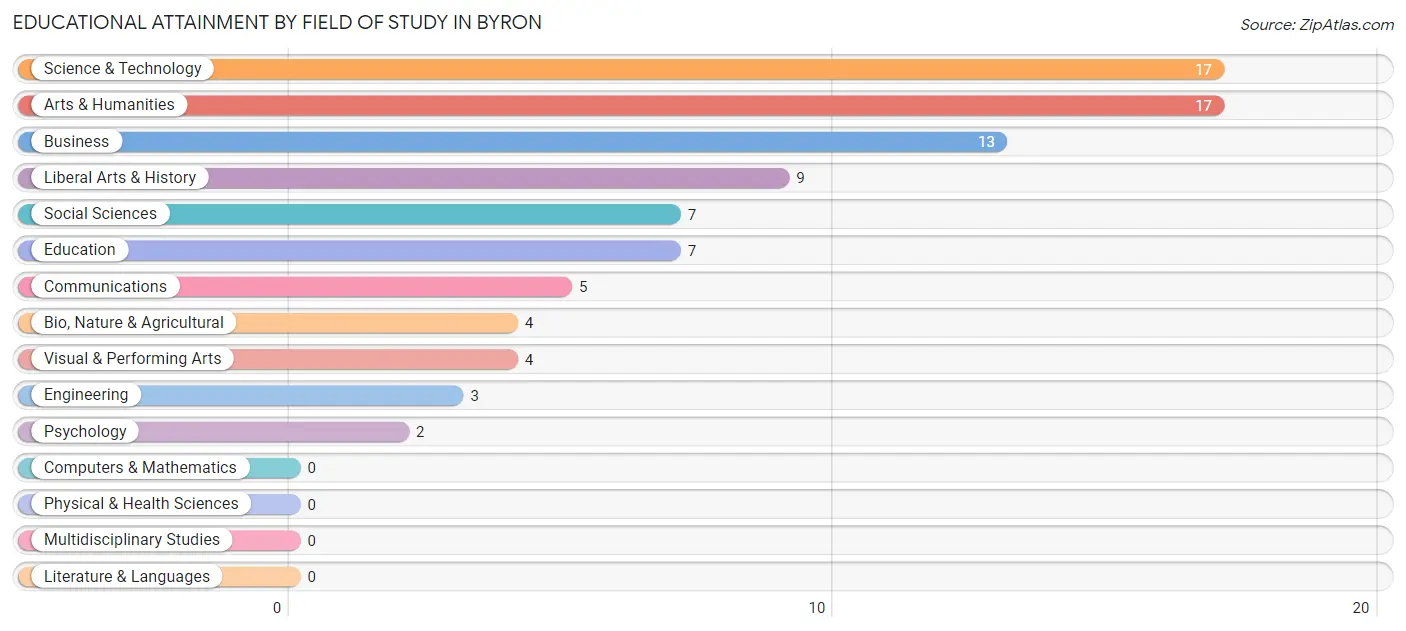
| Field of Study | # Graduates | % Graduates |
| Computers & Mathematics | 0 | 0.0% |
| Bio, Nature & Agricultural | 4 | 4.5% |
| Physical & Health Sciences | 0 | 0.0% |
| Psychology | 2 | 2.3% |
| Social Sciences | 7 | 8.0% |
| Engineering | 3 | 3.4% |
| Multidisciplinary Studies | 0 | 0.0% |
| Science & Technology | 17 | 19.3% |
| Business | 13 | 14.8% |
| Education | 7 | 8.0% |
| Literature & Languages | 0 | 0.0% |
| Liberal Arts & History | 9 | 10.2% |
| Visual & Performing Arts | 4 | 4.5% |
| Communications | 5 | 5.7% |
| Arts & Humanities | 17 | 19.3% |
| Total | 88 | 100.0% |
Transportation & Commute in Byron
Vehicle Availability by Sex in Byron
The most prevalent vehicle ownership categories in Byron are males with 2 vehicles (60, accounting for 40.5%) and females with 2 vehicles (60, making up 40.3%).
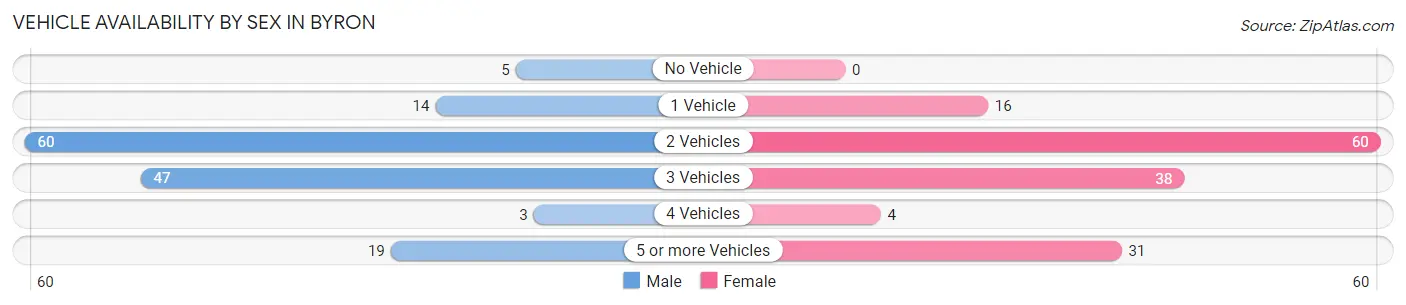
| Vehicles Available | Male | Female |
| No Vehicle | 5 (3.4%) | 0 (0.0%) |
| 1 Vehicle | 14 (9.5%) | 16 (10.7%) |
| 2 Vehicles | 60 (40.5%) | 60 (40.3%) |
| 3 Vehicles | 47 (31.8%) | 38 (25.5%) |
| 4 Vehicles | 3 (2.0%) | 4 (2.7%) |
| 5 or more Vehicles | 19 (12.8%) | 31 (20.8%) |
| Total | 148 (100.0%) | 149 (100.0%) |
Commute Time in Byron
The most frequently occuring commute durations in Byron are 30 to 34 minutes (52 commuters, 19.4%), 25 to 29 minutes (41 commuters, 15.3%), and 45 to 59 minutes (36 commuters, 13.4%).
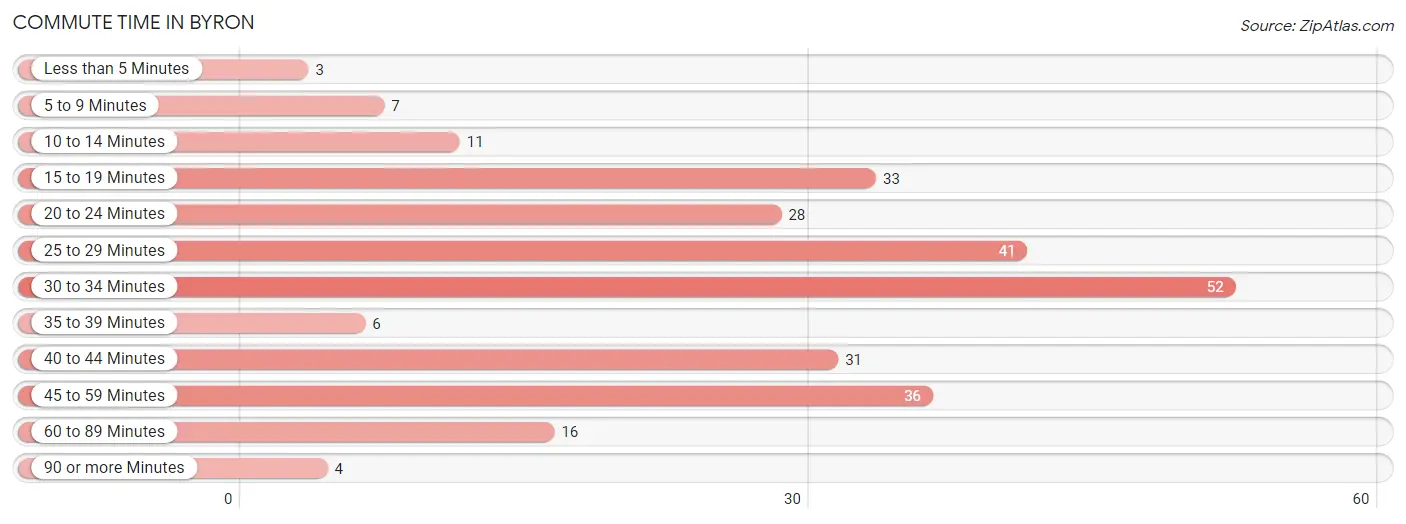
| Commute Time | # Commuters | % Commuters |
| Less than 5 Minutes | 3 | 1.1% |
| 5 to 9 Minutes | 7 | 2.6% |
| 10 to 14 Minutes | 11 | 4.1% |
| 15 to 19 Minutes | 33 | 12.3% |
| 20 to 24 Minutes | 28 | 10.4% |
| 25 to 29 Minutes | 41 | 15.3% |
| 30 to 34 Minutes | 52 | 19.4% |
| 35 to 39 Minutes | 6 | 2.2% |
| 40 to 44 Minutes | 31 | 11.6% |
| 45 to 59 Minutes | 36 | 13.4% |
| 60 to 89 Minutes | 16 | 6.0% |
| 90 or more Minutes | 4 | 1.5% |
Commute Time by Sex in Byron
The most common commute times in Byron are 40 to 44 minutes (31 commuters, 22.8%) for males and 25 to 29 minutes (34 commuters, 25.8%) for females.
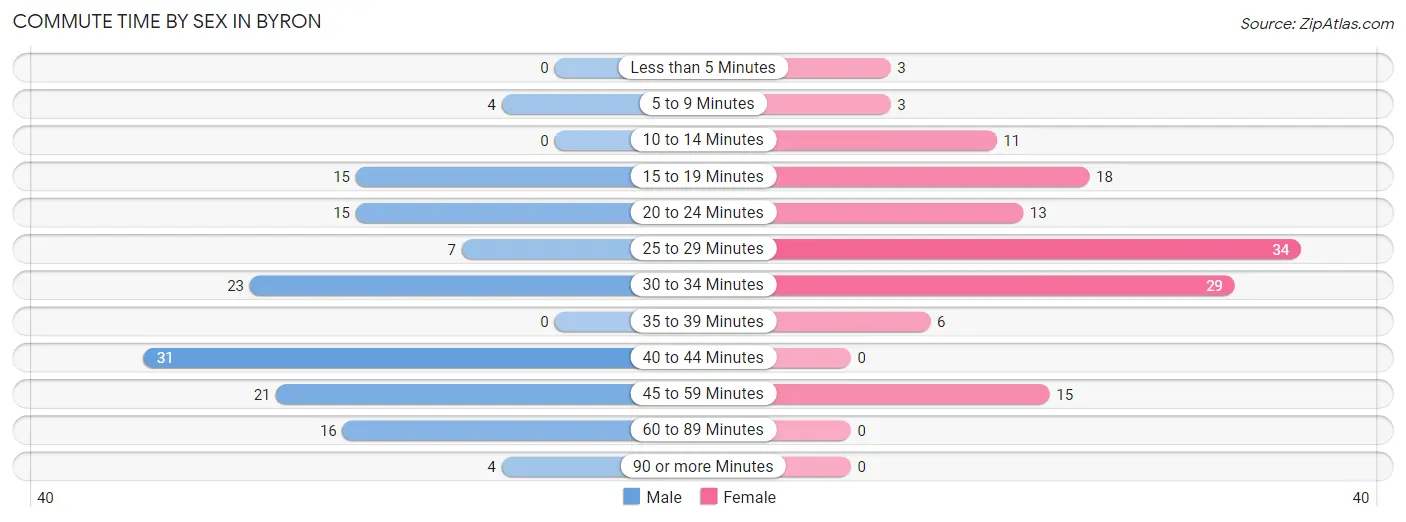
| Commute Time | Male | Female |
| Less than 5 Minutes | 0 (0.0%) | 3 (2.3%) |
| 5 to 9 Minutes | 4 (2.9%) | 3 (2.3%) |
| 10 to 14 Minutes | 0 (0.0%) | 11 (8.3%) |
| 15 to 19 Minutes | 15 (11.0%) | 18 (13.6%) |
| 20 to 24 Minutes | 15 (11.0%) | 13 (9.9%) |
| 25 to 29 Minutes | 7 (5.1%) | 34 (25.8%) |
| 30 to 34 Minutes | 23 (16.9%) | 29 (22.0%) |
| 35 to 39 Minutes | 0 (0.0%) | 6 (4.5%) |
| 40 to 44 Minutes | 31 (22.8%) | 0 (0.0%) |
| 45 to 59 Minutes | 21 (15.4%) | 15 (11.4%) |
| 60 to 89 Minutes | 16 (11.8%) | 0 (0.0%) |
| 90 or more Minutes | 4 (2.9%) | 0 (0.0%) |
Time of Departure to Work by Sex in Byron
The most frequent times of departure to work in Byron are 6:00 AM to 6:29 AM (37, 27.2%) for males and 7:30 AM to 7:59 AM (24, 18.2%) for females.
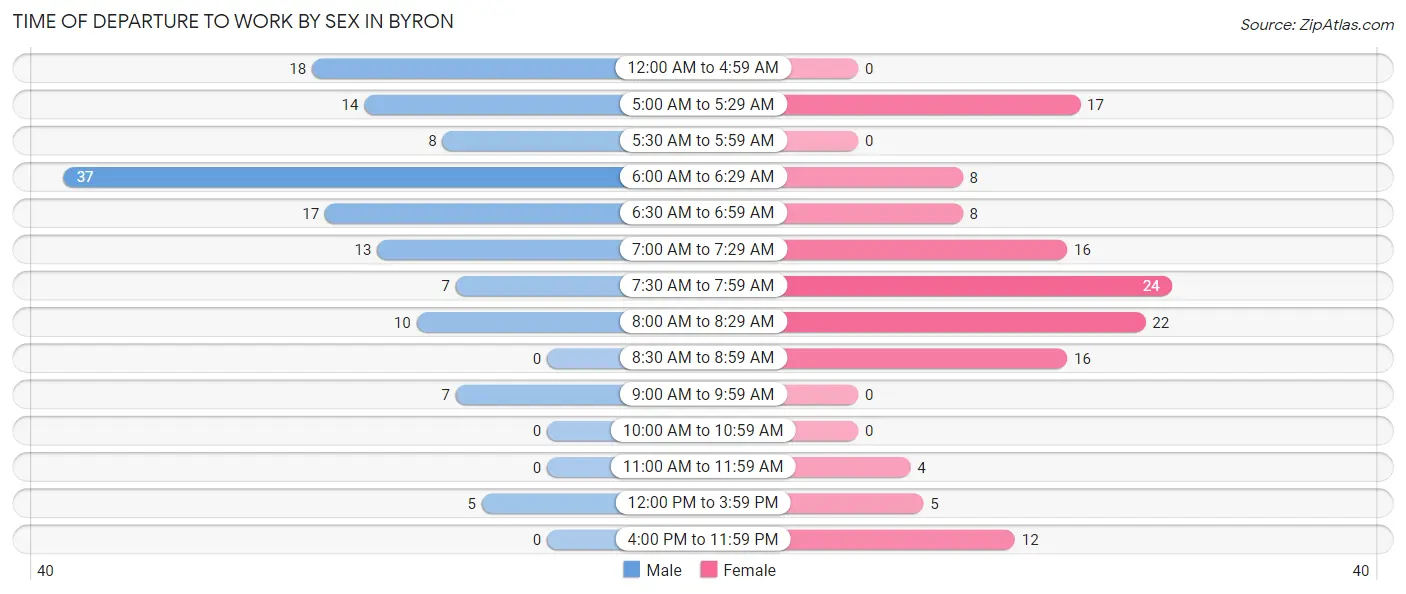
| Time of Departure | Male | Female |
| 12:00 AM to 4:59 AM | 18 (13.2%) | 0 (0.0%) |
| 5:00 AM to 5:29 AM | 14 (10.3%) | 17 (12.9%) |
| 5:30 AM to 5:59 AM | 8 (5.9%) | 0 (0.0%) |
| 6:00 AM to 6:29 AM | 37 (27.2%) | 8 (6.1%) |
| 6:30 AM to 6:59 AM | 17 (12.5%) | 8 (6.1%) |
| 7:00 AM to 7:29 AM | 13 (9.6%) | 16 (12.1%) |
| 7:30 AM to 7:59 AM | 7 (5.1%) | 24 (18.2%) |
| 8:00 AM to 8:29 AM | 10 (7.3%) | 22 (16.7%) |
| 8:30 AM to 8:59 AM | 0 (0.0%) | 16 (12.1%) |
| 9:00 AM to 9:59 AM | 7 (5.1%) | 0 (0.0%) |
| 10:00 AM to 10:59 AM | 0 (0.0%) | 0 (0.0%) |
| 11:00 AM to 11:59 AM | 0 (0.0%) | 4 (3.0%) |
| 12:00 PM to 3:59 PM | 5 (3.7%) | 5 (3.8%) |
| 4:00 PM to 11:59 PM | 0 (0.0%) | 12 (9.1%) |
| Total | 136 (100.0%) | 132 (100.0%) |
Housing Occupancy in Byron
Occupancy by Ownership in Byron
Of the total 224 dwellings in Byron, owner-occupied units account for 190 (84.8%), while renter-occupied units make up 34 (15.2%).
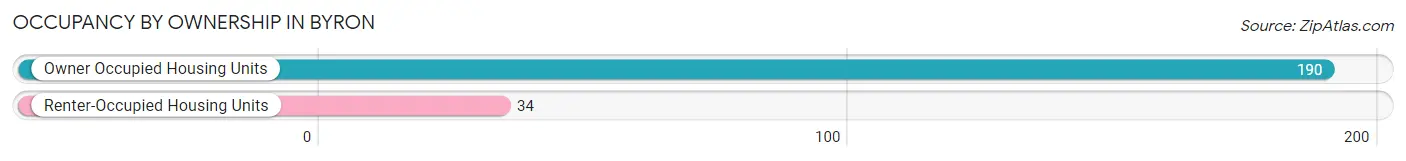
| Occupancy | # Housing Units | % Housing Units |
| Owner Occupied Housing Units | 190 | 84.8% |
| Renter-Occupied Housing Units | 34 | 15.2% |
| Total Occupied Housing Units | 224 | 100.0% |
Occupancy by Household Size in Byron
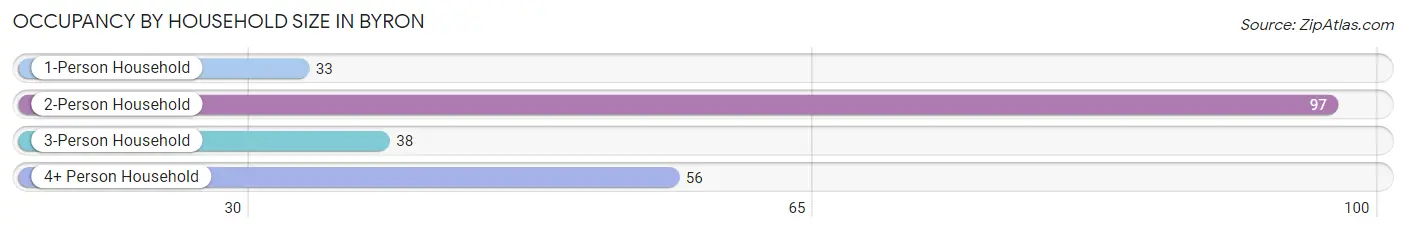
| Household Size | # Housing Units | % Housing Units |
| 1-Person Household | 33 | 14.7% |
| 2-Person Household | 97 | 43.3% |
| 3-Person Household | 38 | 17.0% |
| 4+ Person Household | 56 | 25.0% |
| Total Housing Units | 224 | 100.0% |
Occupancy by Ownership by Household Size in Byron
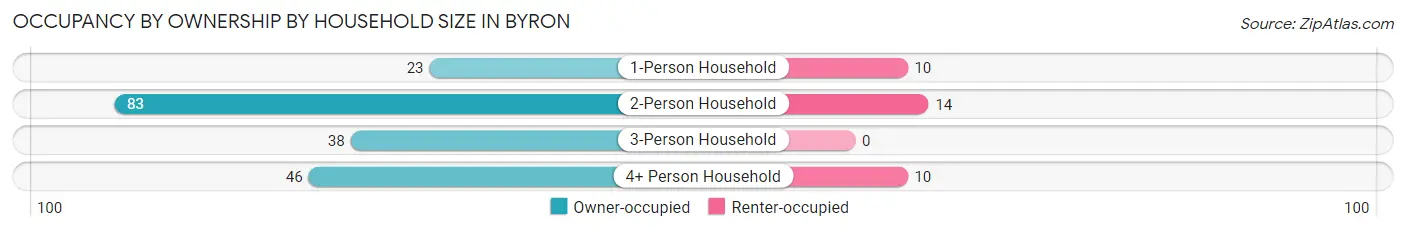
| Household Size | Owner-occupied | Renter-occupied |
| 1-Person Household | 23 (69.7%) | 10 (30.3%) |
| 2-Person Household | 83 (85.6%) | 14 (14.4%) |
| 3-Person Household | 38 (100.0%) | 0 (0.0%) |
| 4+ Person Household | 46 (82.1%) | 10 (17.9%) |
| Total Housing Units | 190 (84.8%) | 34 (15.2%) |
Occupancy by Educational Attainment in Byron
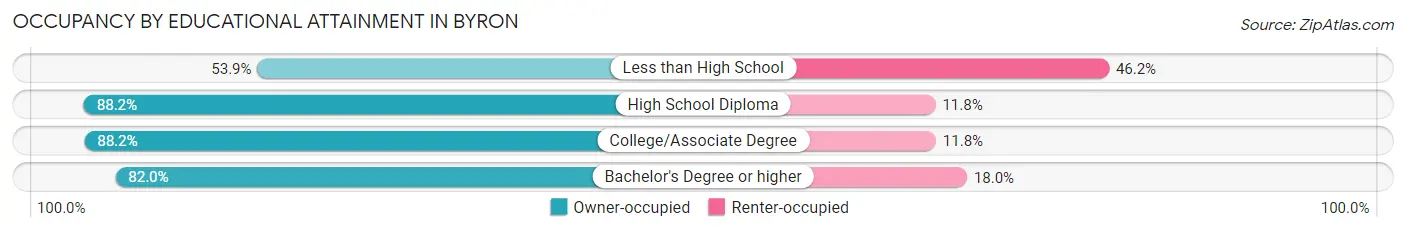
| Household Size | Owner-occupied | Renter-occupied |
| Less than High School | 7 (53.8%) | 6 (46.2%) |
| High School Diploma | 75 (88.2%) | 10 (11.8%) |
| College/Associate Degree | 67 (88.2%) | 9 (11.8%) |
| Bachelor's Degree or higher | 41 (82.0%) | 9 (18.0%) |
Occupancy by Age of Householder in Byron
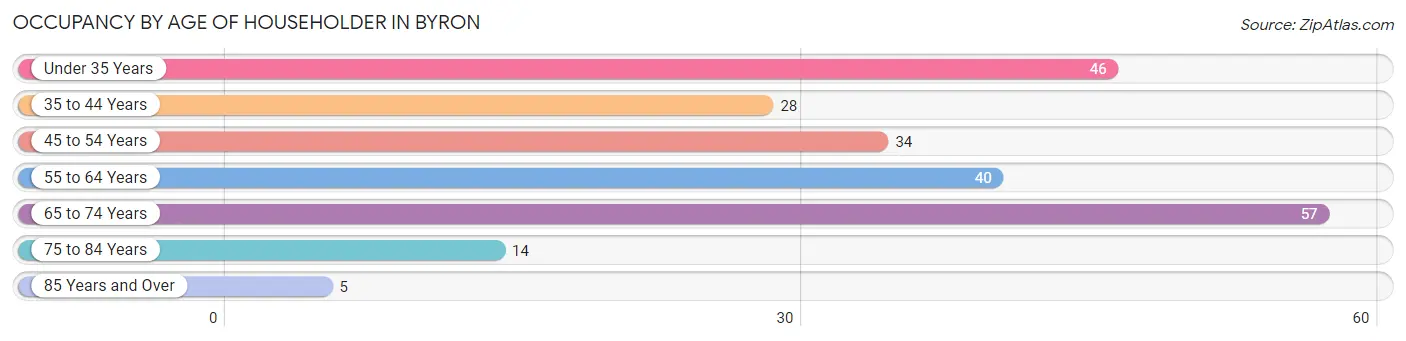
| Age Bracket | # Households | % Households |
| Under 35 Years | 46 | 20.5% |
| 35 to 44 Years | 28 | 12.5% |
| 45 to 54 Years | 34 | 15.2% |
| 55 to 64 Years | 40 | 17.9% |
| 65 to 74 Years | 57 | 25.5% |
| 75 to 84 Years | 14 | 6.2% |
| 85 Years and Over | 5 | 2.2% |
| Total | 224 | 100.0% |
Housing Finances in Byron
Median Income by Occupancy in Byron
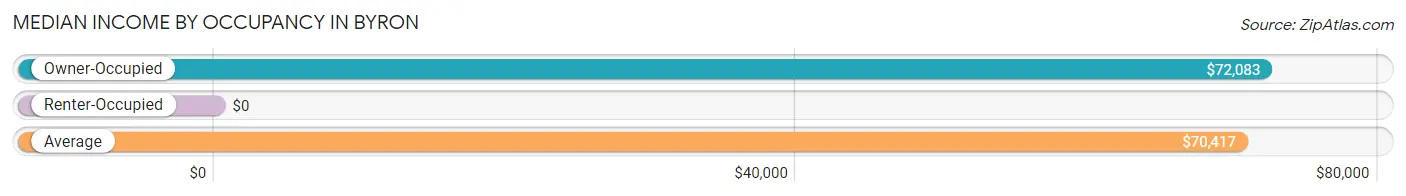
| Occupancy Type | # Households | Median Income |
| Owner-Occupied | 190 (84.8%) | $72,083 |
| Renter-Occupied | 34 (15.2%) | $0 |
| Average | 224 (100.0%) | $70,417 |
Occupancy by Householder Income Bracket in Byron
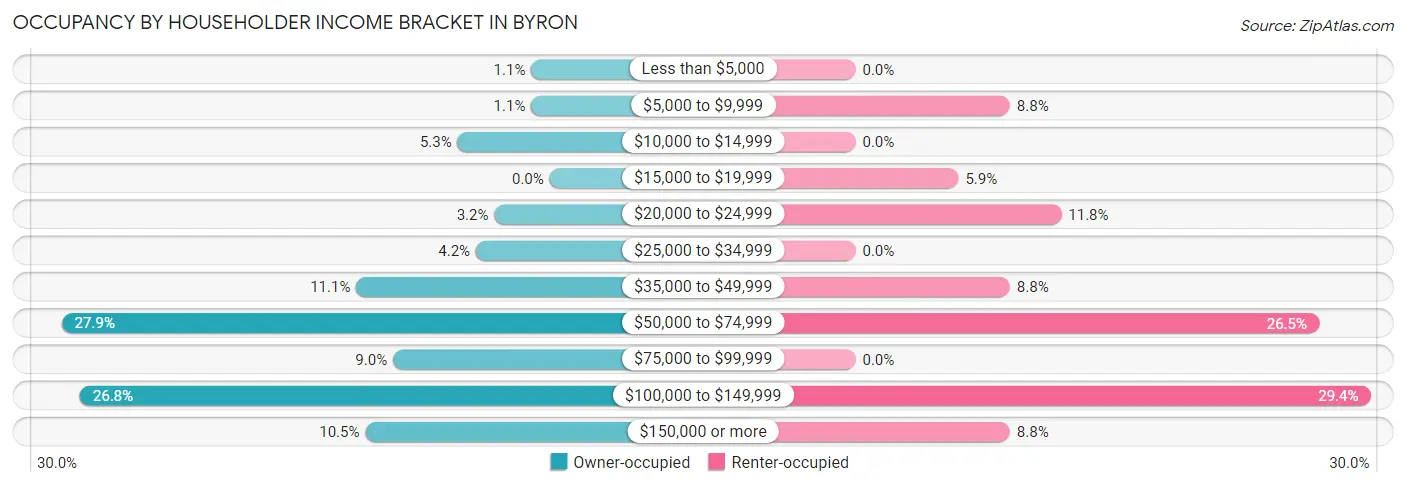
| Income Bracket | Owner-occupied | Renter-occupied |
| Less than $5,000 | 2 (1.1%) | 0 (0.0%) |
| $5,000 to $9,999 | 2 (1.1%) | 3 (8.8%) |
| $10,000 to $14,999 | 10 (5.3%) | 0 (0.0%) |
| $15,000 to $19,999 | 0 (0.0%) | 2 (5.9%) |
| $20,000 to $24,999 | 6 (3.2%) | 4 (11.8%) |
| $25,000 to $34,999 | 8 (4.2%) | 0 (0.0%) |
| $35,000 to $49,999 | 21 (11.1%) | 3 (8.8%) |
| $50,000 to $74,999 | 53 (27.9%) | 9 (26.5%) |
| $75,000 to $99,999 | 17 (8.9%) | 0 (0.0%) |
| $100,000 to $149,999 | 51 (26.8%) | 10 (29.4%) |
| $150,000 or more | 20 (10.5%) | 3 (8.8%) |
| Total | 190 (100.0%) | 34 (100.0%) |
Monthly Housing Cost Tiers in Byron
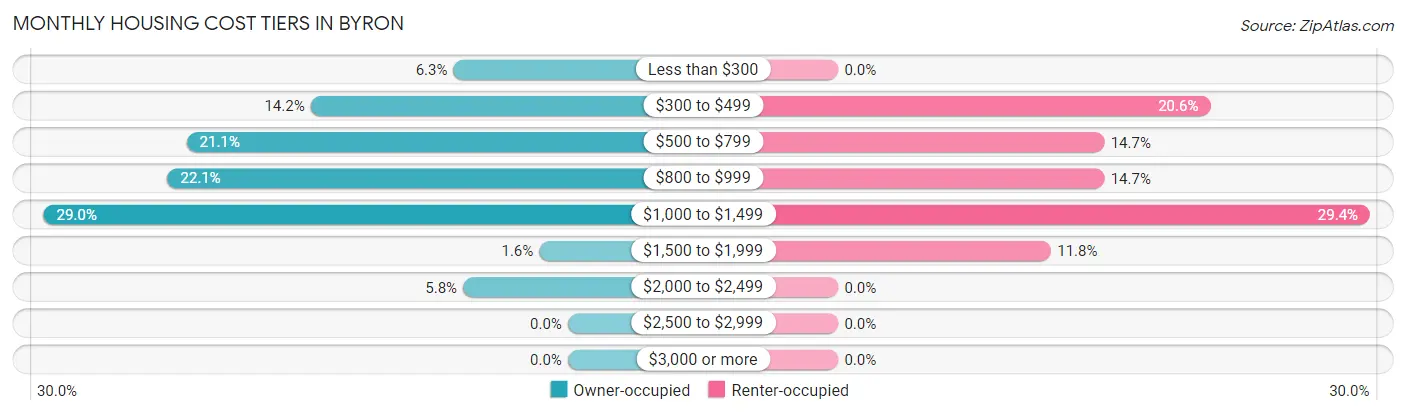
| Monthly Cost | Owner-occupied | Renter-occupied |
| Less than $300 | 12 (6.3%) | 0 (0.0%) |
| $300 to $499 | 27 (14.2%) | 7 (20.6%) |
| $500 to $799 | 40 (21.0%) | 5 (14.7%) |
| $800 to $999 | 42 (22.1%) | 5 (14.7%) |
| $1,000 to $1,499 | 55 (28.9%) | 10 (29.4%) |
| $1,500 to $1,999 | 3 (1.6%) | 4 (11.8%) |
| $2,000 to $2,499 | 11 (5.8%) | 0 (0.0%) |
| $2,500 to $2,999 | 0 (0.0%) | 0 (0.0%) |
| $3,000 or more | 0 (0.0%) | 0 (0.0%) |
| Total | 190 (100.0%) | 34 (100.0%) |
Physical Housing Characteristics in Byron
Housing Structures in Byron
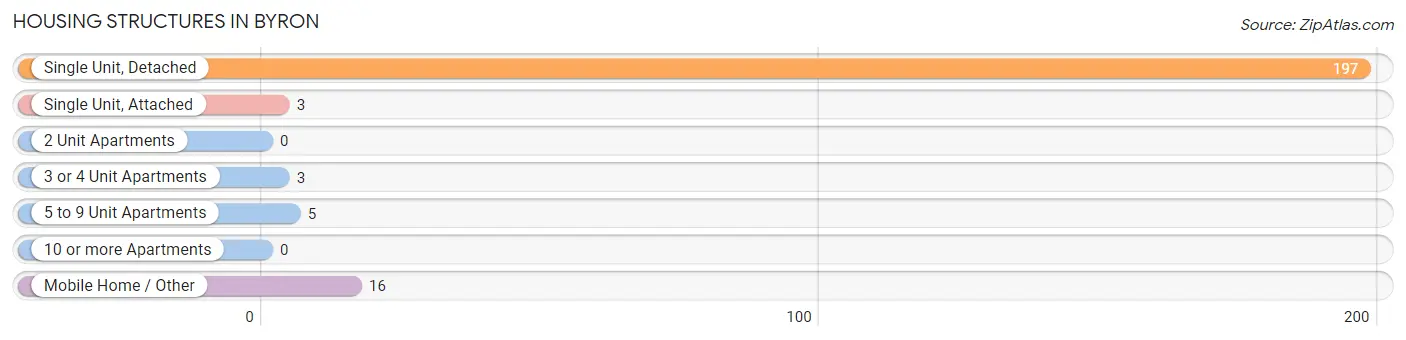
| Structure Type | # Housing Units | % Housing Units |
| Single Unit, Detached | 197 | 87.9% |
| Single Unit, Attached | 3 | 1.3% |
| 2 Unit Apartments | 0 | 0.0% |
| 3 or 4 Unit Apartments | 3 | 1.3% |
| 5 to 9 Unit Apartments | 5 | 2.2% |
| 10 or more Apartments | 0 | 0.0% |
| Mobile Home / Other | 16 | 7.1% |
| Total | 224 | 100.0% |
Housing Structures by Occupancy in Byron
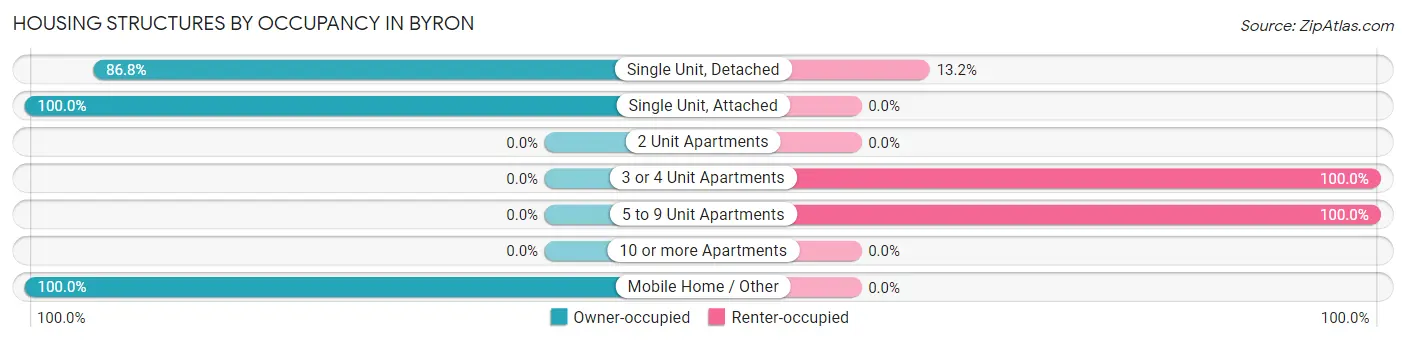
| Structure Type | Owner-occupied | Renter-occupied |
| Single Unit, Detached | 171 (86.8%) | 26 (13.2%) |
| Single Unit, Attached | 3 (100.0%) | 0 (0.0%) |
| 2 Unit Apartments | 0 (0.0%) | 0 (0.0%) |
| 3 or 4 Unit Apartments | 0 (0.0%) | 3 (100.0%) |
| 5 to 9 Unit Apartments | 0 (0.0%) | 5 (100.0%) |
| 10 or more Apartments | 0 (0.0%) | 0 (0.0%) |
| Mobile Home / Other | 16 (100.0%) | 0 (0.0%) |
| Total | 190 (84.8%) | 34 (15.2%) |
Housing Structures by Number of Rooms in Byron
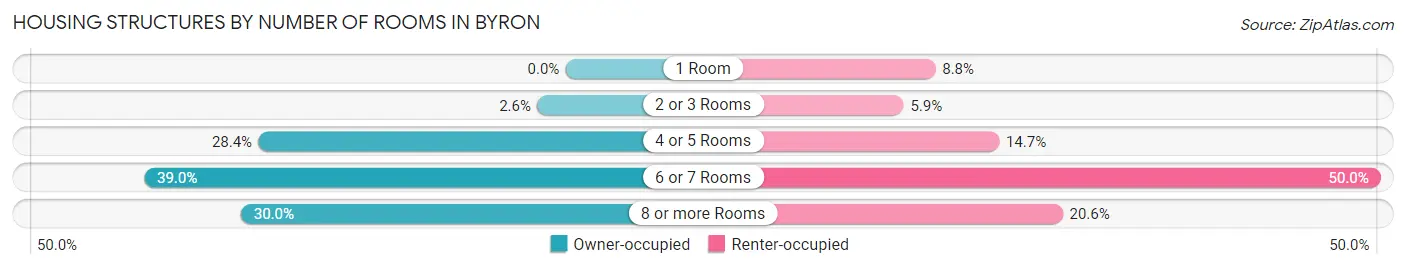
| Number of Rooms | Owner-occupied | Renter-occupied |
| 1 Room | 0 (0.0%) | 3 (8.8%) |
| 2 or 3 Rooms | 5 (2.6%) | 2 (5.9%) |
| 4 or 5 Rooms | 54 (28.4%) | 5 (14.7%) |
| 6 or 7 Rooms | 74 (39.0%) | 17 (50.0%) |
| 8 or more Rooms | 57 (30.0%) | 7 (20.6%) |
| Total | 190 (100.0%) | 34 (100.0%) |
Housing Structure by Heating Type in Byron
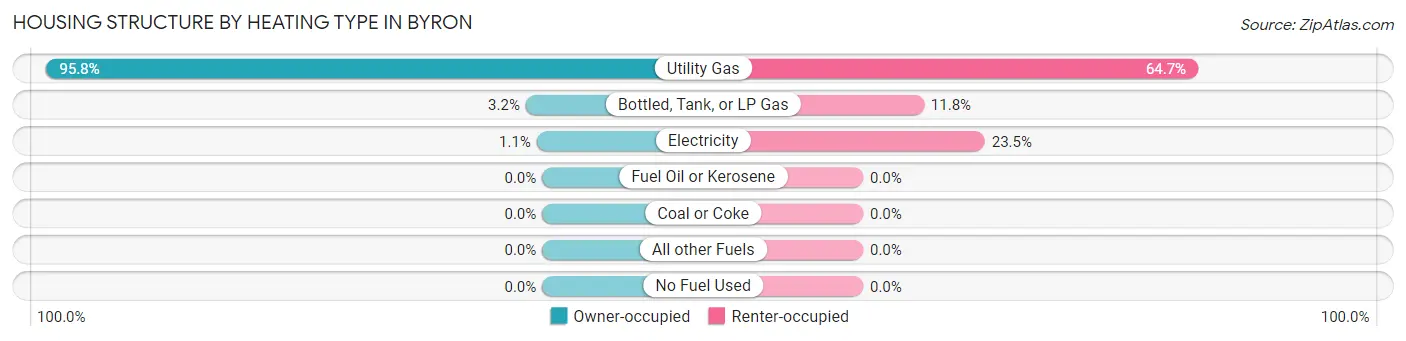
| Heating Type | Owner-occupied | Renter-occupied |
| Utility Gas | 182 (95.8%) | 22 (64.7%) |
| Bottled, Tank, or LP Gas | 6 (3.2%) | 4 (11.8%) |
| Electricity | 2 (1.1%) | 8 (23.5%) |
| Fuel Oil or Kerosene | 0 (0.0%) | 0 (0.0%) |
| Coal or Coke | 0 (0.0%) | 0 (0.0%) |
| All other Fuels | 0 (0.0%) | 0 (0.0%) |
| No Fuel Used | 0 (0.0%) | 0 (0.0%) |
| Total | 190 (100.0%) | 34 (100.0%) |
Household Vehicle Usage in Byron
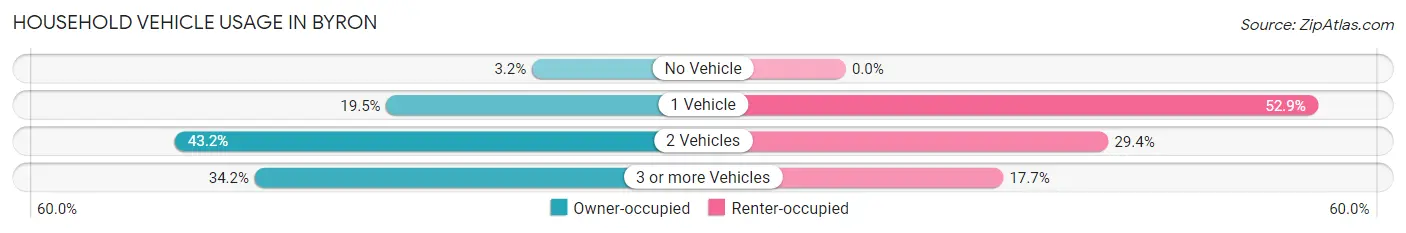
| Vehicles per Household | Owner-occupied | Renter-occupied |
| No Vehicle | 6 (3.2%) | 0 (0.0%) |
| 1 Vehicle | 37 (19.5%) | 18 (52.9%) |
| 2 Vehicles | 82 (43.2%) | 10 (29.4%) |
| 3 or more Vehicles | 65 (34.2%) | 6 (17.6%) |
| Total | 190 (100.0%) | 34 (100.0%) |
Real Estate & Mortgages in Byron
Real Estate and Mortgage Overview in Byron
| Characteristic | Without Mortgage | With Mortgage |
| Housing Units | 65 | 125 |
| Median Property Value | $159,800 | $159,400 |
| Median Household Income | $66,875 | $20 |
| Monthly Housing Costs | $454 | $0 |
| Real Estate Taxes | $1,537 | $0 |
Property Value by Mortgage Status in Byron
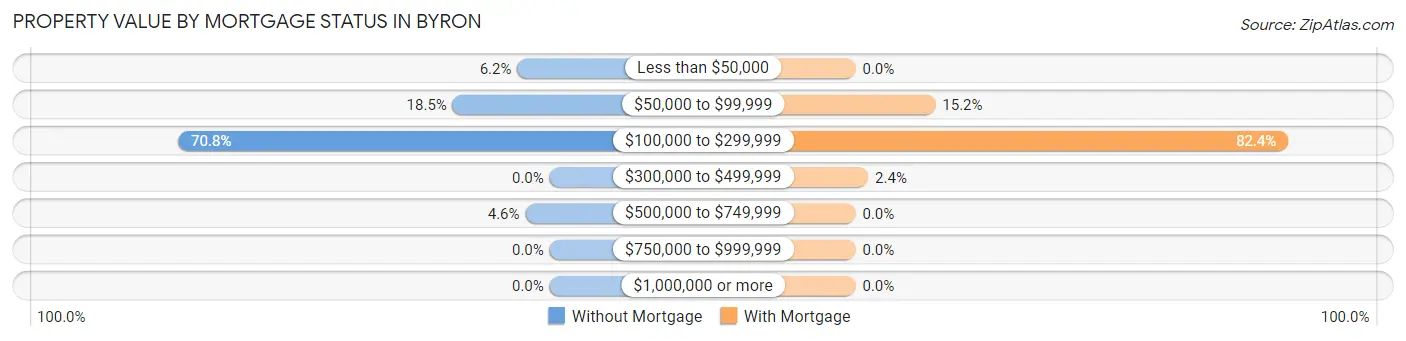
| Property Value | Without Mortgage | With Mortgage |
| Less than $50,000 | 4 (6.1%) | 0 (0.0%) |
| $50,000 to $99,999 | 12 (18.5%) | 19 (15.2%) |
| $100,000 to $299,999 | 46 (70.8%) | 103 (82.4%) |
| $300,000 to $499,999 | 0 (0.0%) | 3 (2.4%) |
| $500,000 to $749,999 | 3 (4.6%) | 0 (0.0%) |
| $750,000 to $999,999 | 0 (0.0%) | 0 (0.0%) |
| $1,000,000 or more | 0 (0.0%) | 0 (0.0%) |
| Total | 65 (100.0%) | 125 (100.0%) |
Household Income by Mortgage Status in Byron
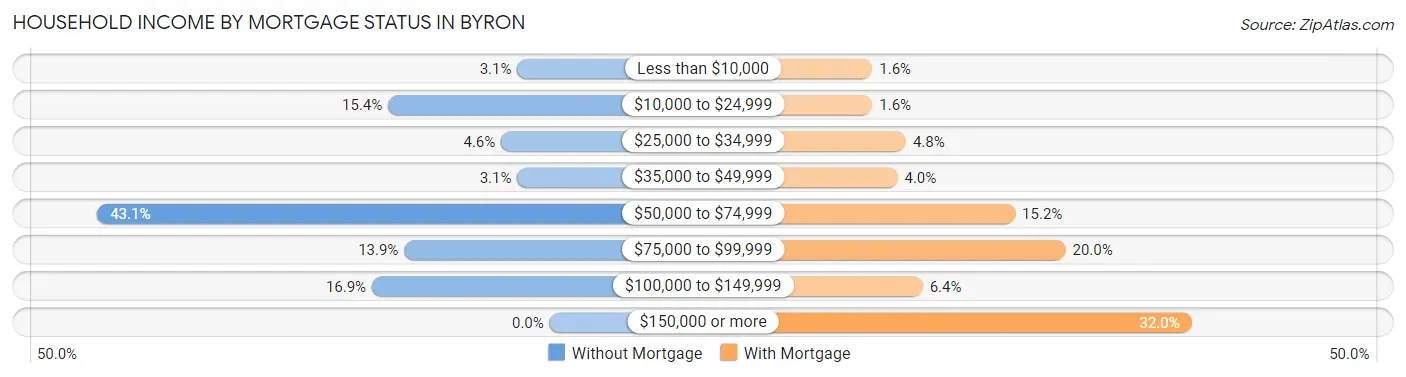
| Household Income | Without Mortgage | With Mortgage |
| Less than $10,000 | 2 (3.1%) | 2 (1.6%) |
| $10,000 to $24,999 | 10 (15.4%) | 2 (1.6%) |
| $25,000 to $34,999 | 3 (4.6%) | 6 (4.8%) |
| $35,000 to $49,999 | 2 (3.1%) | 5 (4.0%) |
| $50,000 to $74,999 | 28 (43.1%) | 19 (15.2%) |
| $75,000 to $99,999 | 9 (13.9%) | 25 (20.0%) |
| $100,000 to $149,999 | 11 (16.9%) | 8 (6.4%) |
| $150,000 or more | 0 (0.0%) | 40 (32.0%) |
| Total | 65 (100.0%) | 125 (100.0%) |
Property Value to Household Income Ratio in Byron
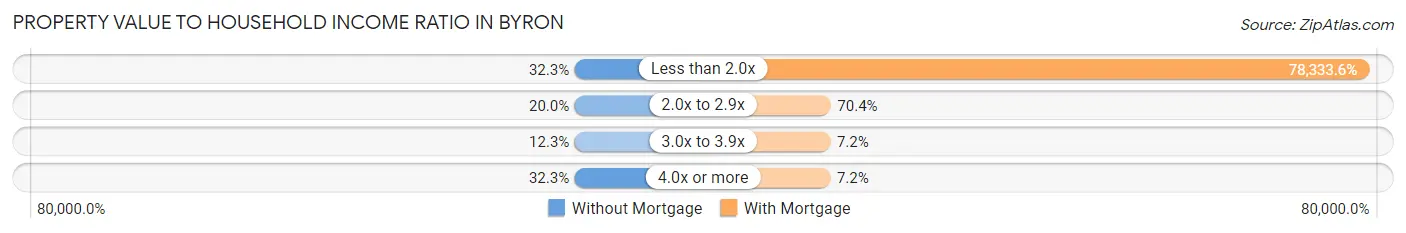
| Value-to-Income Ratio | Without Mortgage | With Mortgage |
| Less than 2.0x | 21 (32.3%) | 97,917 (78,333.6%) |
| 2.0x to 2.9x | 13 (20.0%) | 88 (70.4%) |
| 3.0x to 3.9x | 8 (12.3%) | 9 (7.2%) |
| 4.0x or more | 21 (32.3%) | 9 (7.2%) |
| Total | 65 (100.0%) | 125 (100.0%) |
Real Estate Taxes by Mortgage Status in Byron
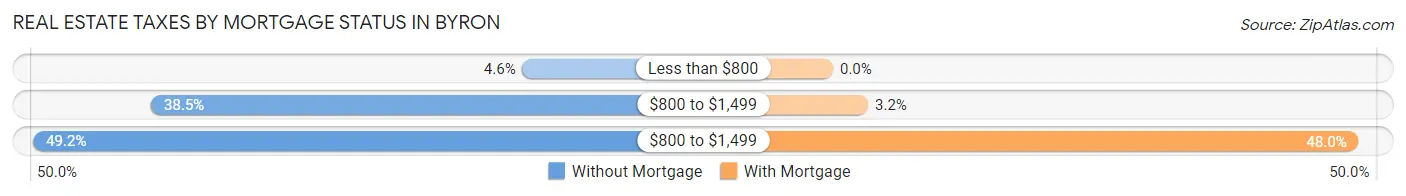
| Property Taxes | Without Mortgage | With Mortgage |
| Less than $800 | 3 (4.6%) | 0 (0.0%) |
| $800 to $1,499 | 25 (38.5%) | 4 (3.2%) |
| $800 to $1,499 | 32 (49.2%) | 60 (48.0%) |
| Total | 65 (100.0%) | 125 (100.0%) |
Health & Disability in Byron
Health Insurance Coverage by Age in Byron
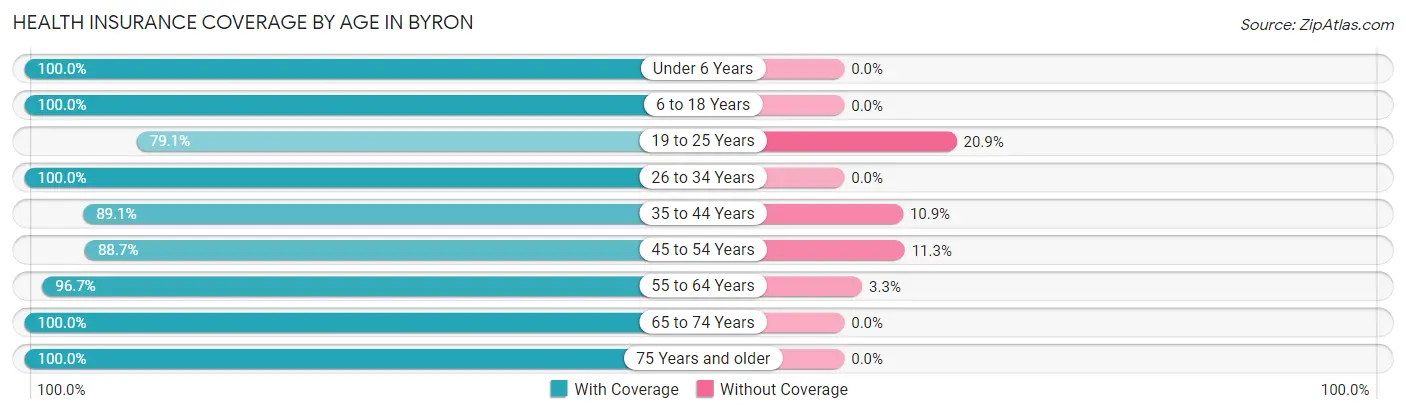
| Age Bracket | With Coverage | Without Coverage |
| Under 6 Years | 40 (100.0%) | 0 (0.0%) |
| 6 to 18 Years | 112 (100.0%) | 0 (0.0%) |
| 19 to 25 Years | 34 (79.1%) | 9 (20.9%) |
| 26 to 34 Years | 83 (100.0%) | 0 (0.0%) |
| 35 to 44 Years | 57 (89.1%) | 7 (10.9%) |
| 45 to 54 Years | 63 (88.7%) | 8 (11.3%) |
| 55 to 64 Years | 87 (96.7%) | 3 (3.3%) |
| 65 to 74 Years | 72 (100.0%) | 0 (0.0%) |
| 75 Years and older | 29 (100.0%) | 0 (0.0%) |
| Total | 577 (95.5%) | 27 (4.5%) |
Health Insurance Coverage by Citizenship Status in Byron
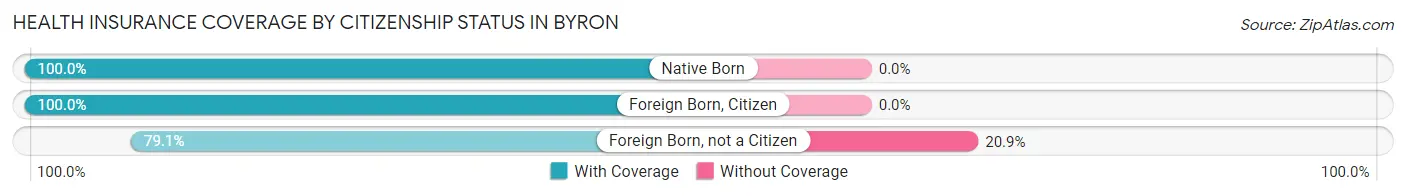
| Citizenship Status | With Coverage | Without Coverage |
| Native Born | 40 (100.0%) | 0 (0.0%) |
| Foreign Born, Citizen | 112 (100.0%) | 0 (0.0%) |
| Foreign Born, not a Citizen | 34 (79.1%) | 9 (20.9%) |
Health Insurance Coverage by Household Income in Byron
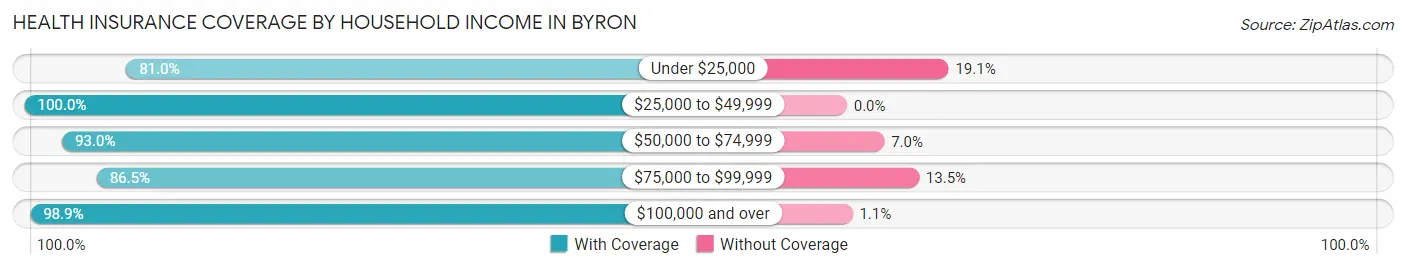
| Household Income | With Coverage | Without Coverage |
| Under $25,000 | 34 (80.9%) | 8 (19.1%) |
| $25,000 to $49,999 | 86 (100.0%) | 0 (0.0%) |
| $50,000 to $74,999 | 146 (93.0%) | 11 (7.0%) |
| $75,000 to $99,999 | 32 (86.5%) | 5 (13.5%) |
| $100,000 and over | 279 (98.9%) | 3 (1.1%) |
Public vs Private Health Insurance Coverage by Age in Byron
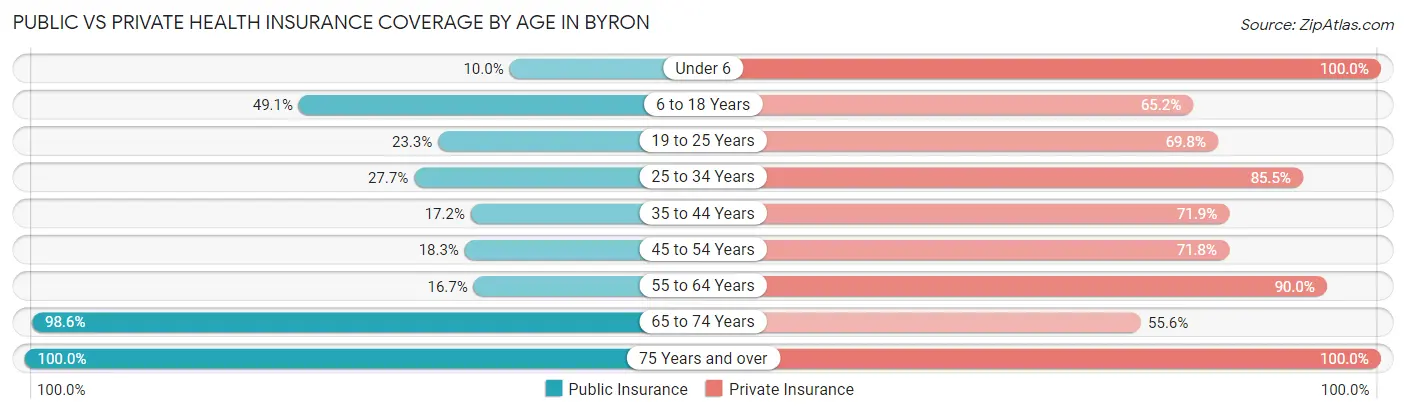
| Age Bracket | Public Insurance | Private Insurance |
| Under 6 | 4 (10.0%) | 40 (100.0%) |
| 6 to 18 Years | 55 (49.1%) | 73 (65.2%) |
| 19 to 25 Years | 10 (23.3%) | 30 (69.8%) |
| 25 to 34 Years | 23 (27.7%) | 71 (85.5%) |
| 35 to 44 Years | 11 (17.2%) | 46 (71.9%) |
| 45 to 54 Years | 13 (18.3%) | 51 (71.8%) |
| 55 to 64 Years | 15 (16.7%) | 81 (90.0%) |
| 65 to 74 Years | 71 (98.6%) | 40 (55.6%) |
| 75 Years and over | 29 (100.0%) | 29 (100.0%) |
| Total | 231 (38.3%) | 461 (76.3%) |
Disability Status by Sex by Age in Byron
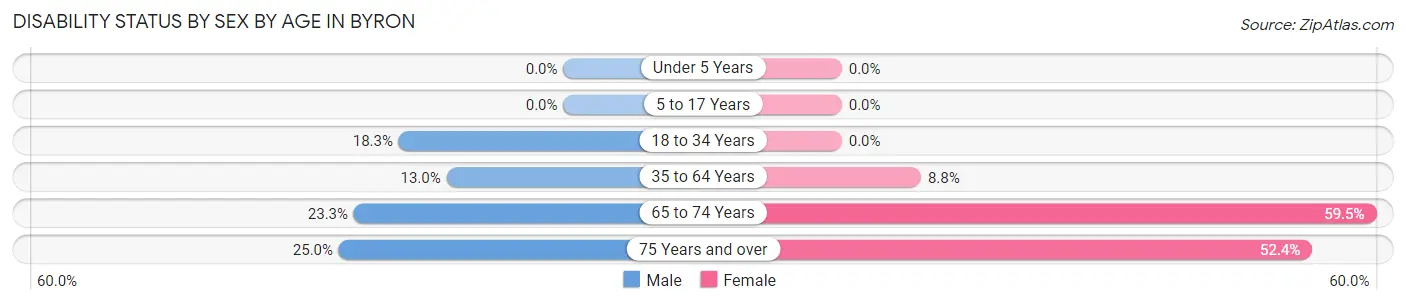
| Age Bracket | Male | Female |
| Under 5 Years | 0 (0.0%) | 0 (0.0%) |
| 5 to 17 Years | 0 (0.0%) | 0 (0.0%) |
| 18 to 34 Years | 11 (18.3%) | 0 (0.0%) |
| 35 to 64 Years | 16 (13.0%) | 9 (8.8%) |
| 65 to 74 Years | 7 (23.3%) | 25 (59.5%) |
| 75 Years and over | 2 (25.0%) | 11 (52.4%) |
Disability Class by Sex by Age in Byron
Disability Class: Hearing Difficulty
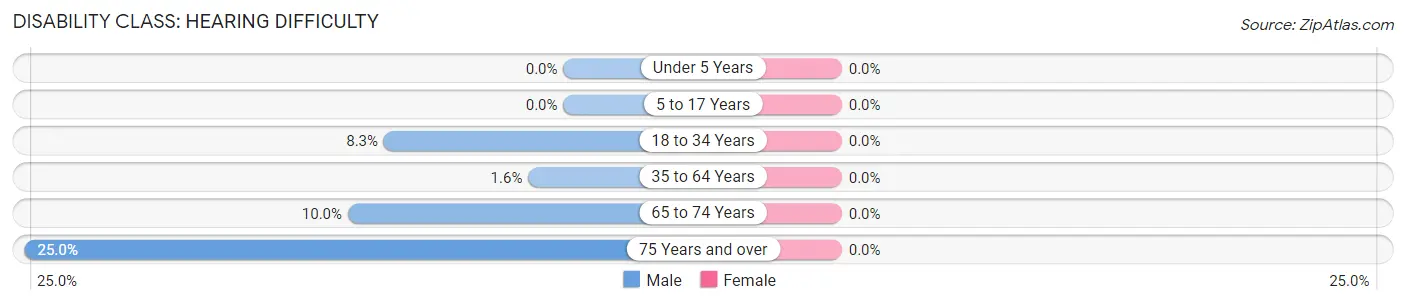
| Age Bracket | Male | Female |
| Under 5 Years | 0 (0.0%) | 0 (0.0%) |
| 5 to 17 Years | 0 (0.0%) | 0 (0.0%) |
| 18 to 34 Years | 5 (8.3%) | 0 (0.0%) |
| 35 to 64 Years | 2 (1.6%) | 0 (0.0%) |
| 65 to 74 Years | 3 (10.0%) | 0 (0.0%) |
| 75 Years and over | 2 (25.0%) | 0 (0.0%) |
Disability Class: Vision Difficulty
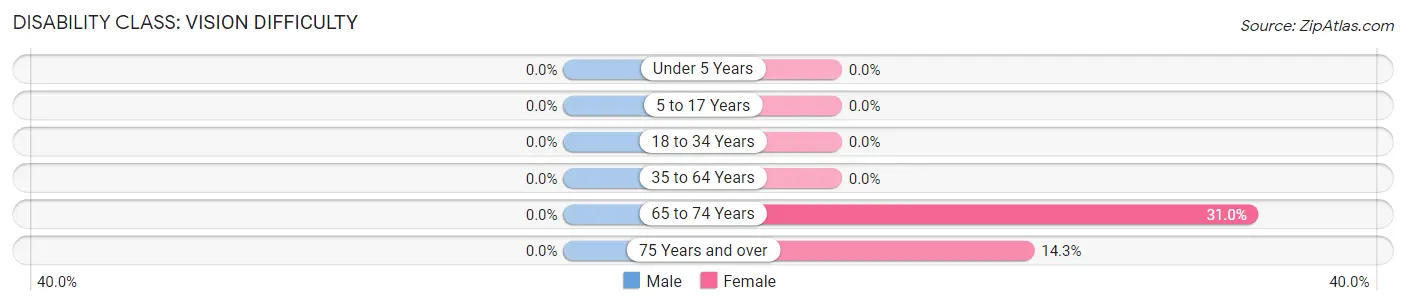
| Age Bracket | Male | Female |
| Under 5 Years | 0 (0.0%) | 0 (0.0%) |
| 5 to 17 Years | 0 (0.0%) | 0 (0.0%) |
| 18 to 34 Years | 0 (0.0%) | 0 (0.0%) |
| 35 to 64 Years | 0 (0.0%) | 0 (0.0%) |
| 65 to 74 Years | 0 (0.0%) | 13 (30.9%) |
| 75 Years and over | 0 (0.0%) | 3 (14.3%) |
Disability Class: Cognitive Difficulty
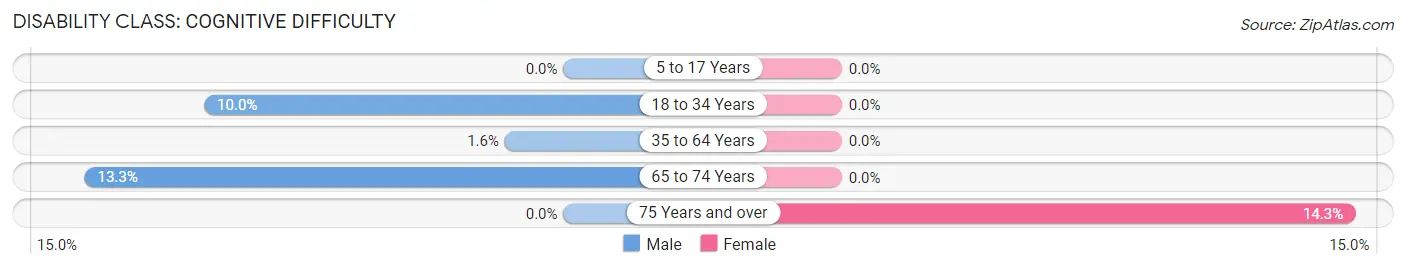
| Age Bracket | Male | Female |
| 5 to 17 Years | 0 (0.0%) | 0 (0.0%) |
| 18 to 34 Years | 6 (10.0%) | 0 (0.0%) |
| 35 to 64 Years | 2 (1.6%) | 0 (0.0%) |
| 65 to 74 Years | 4 (13.3%) | 0 (0.0%) |
| 75 Years and over | 0 (0.0%) | 3 (14.3%) |
Disability Class: Ambulatory Difficulty
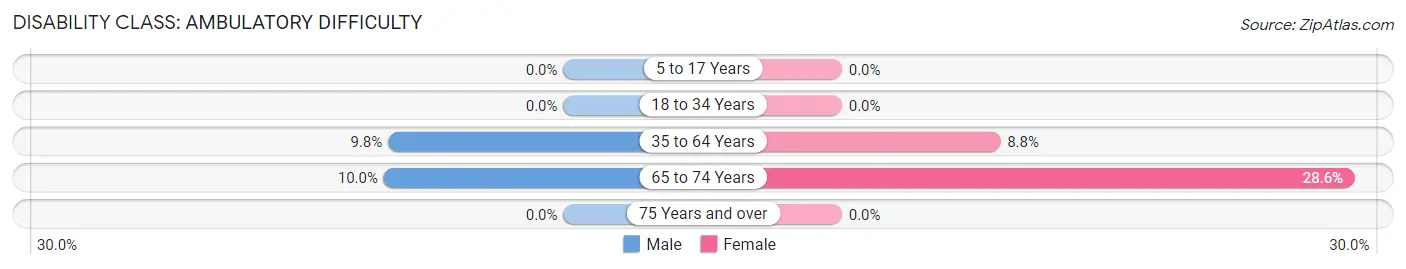
| Age Bracket | Male | Female |
| 5 to 17 Years | 0 (0.0%) | 0 (0.0%) |
| 18 to 34 Years | 0 (0.0%) | 0 (0.0%) |
| 35 to 64 Years | 12 (9.8%) | 9 (8.8%) |
| 65 to 74 Years | 3 (10.0%) | 12 (28.6%) |
| 75 Years and over | 0 (0.0%) | 0 (0.0%) |
Disability Class: Self-Care Difficulty
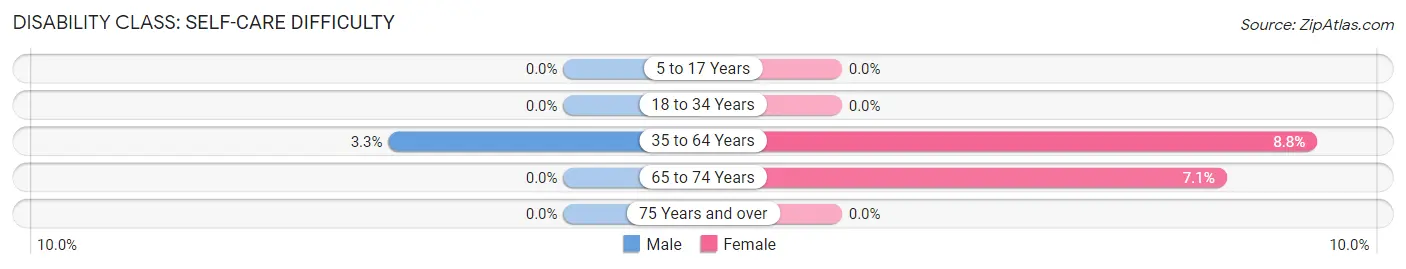
| Age Bracket | Male | Female |
| 5 to 17 Years | 0 (0.0%) | 0 (0.0%) |
| 18 to 34 Years | 0 (0.0%) | 0 (0.0%) |
| 35 to 64 Years | 4 (3.3%) | 9 (8.8%) |
| 65 to 74 Years | 0 (0.0%) | 3 (7.1%) |
| 75 Years and over | 0 (0.0%) | 0 (0.0%) |
Technology Access in Byron
Computing Device Access in Byron
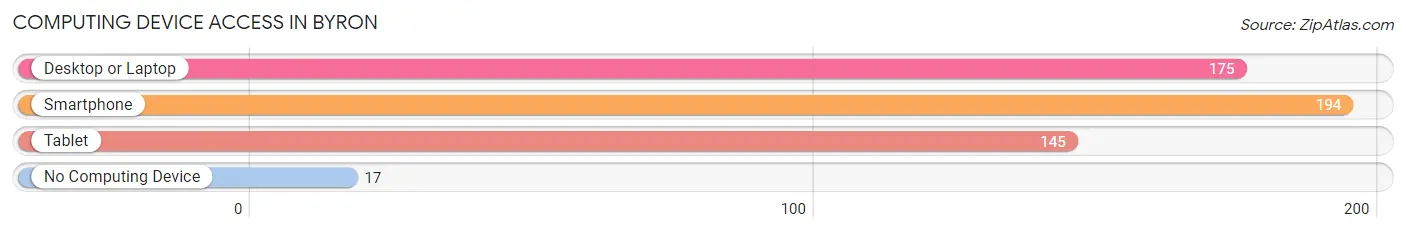
| Device Type | # Households | % Households |
| Desktop or Laptop | 175 | 78.1% |
| Smartphone | 194 | 86.6% |
| Tablet | 145 | 64.7% |
| No Computing Device | 17 | 7.6% |
| Total | 224 | 100.0% |
Internet Access in Byron
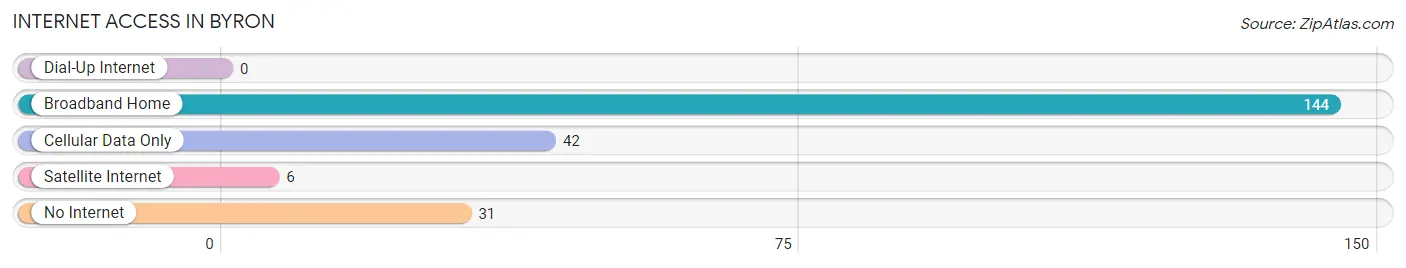
| Internet Type | # Households | % Households |
| Dial-Up Internet | 0 | 0.0% |
| Broadband Home | 144 | 64.3% |
| Cellular Data Only | 42 | 18.8% |
| Satellite Internet | 6 | 2.7% |
| No Internet | 31 | 13.8% |
| Total | 224 | 100.0% |
Byron Summary
Byron, Michigan is a small village located in Shiawassee County, Michigan. It is situated on the Shiawassee River, about 10 miles south of Owosso. The village has a population of about 1,000 people and covers an area of 0.7 square miles.
History
Byron was first settled in 1836 by a group of settlers from New York. The village was named after Lord Byron, a famous English poet. The first post office was established in 1837 and the village was incorporated in 1867.
Byron was a thriving agricultural community in the late 19th century. The village was home to several mills, including a grist mill, a saw mill, and a woolen mill. The village also had a blacksmith shop, a general store, and a hotel.
Byron was also home to a number of churches, including the First Congregational Church, the Methodist Episcopal Church, and the Presbyterian Church. The village also had a school, which was built in 1876.
Geography
Byron is located in Shiawassee County, Michigan. It is situated on the Shiawassee River, about 10 miles south of Owosso. The village has a total area of 0.7 square miles, all of which is land.
The village is located in a rural area, with rolling hills and farmland. The terrain is mostly flat, with some areas of higher elevation. The village is surrounded by woods and wetlands.
Economy
Byron’s economy is largely based on agriculture. The village is home to several farms, which produce a variety of crops, including corn, soybeans, wheat, and hay. The village also has a number of small businesses, including a grocery store, a hardware store, and a gas station.
Demographics
Byron has a population of about 1,000 people. The village is predominantly white, with about 95% of the population being Caucasian. The median household income is $45,000, and the median home value is $90,000.
The village has a low crime rate and a low unemployment rate. The village is served by the Byron-Owosso Public Schools, which includes two elementary schools, one middle school, and one high school.
Conclusion
Byron, Michigan is a small village located in Shiawassee County, Michigan. It is situated on the Shiawassee River, about 10 miles south of Owosso. The village has a population of about 1,000 people and covers an area of 0.7 square miles. The village was first settled in 1836 and was named after Lord Byron, a famous English poet. The village’s economy is largely based on agriculture, and the village is predominantly white. The median household income is $45,000, and the median home value is $90,000. The village has a low crime rate and a low unemployment rate.
Common Questions
What is Per Capita Income in Byron?
Per Capita income in Byron is $30,734.
What is the Median Family Income in Byron?
Median Family Income in Byron is $71,875.
What is the Median Household income in Byron?
Median Household Income in Byron is $70,417.
What is Income or Wage Gap in Byron?
Income or Wage Gap in Byron is 48.0%.
Women in Byron earn 52.0 cents for every dollar earned by a man.
What is Inequality or Gini Index in Byron?
Inequality or Gini Index in Byron is 0.34.
What is the Total Population of Byron?
Total Population of Byron is 604.
What is the Total Male Population of Byron?
Total Male Population of Byron is 289.
What is the Total Female Population of Byron?
Total Female Population of Byron is 315.
What is the Ratio of Males per 100 Females in Byron?
There are 91.75 Males per 100 Females in Byron.
What is the Ratio of Females per 100 Males in Byron?
There are 109.00 Females per 100 Males in Byron.
What is the Median Population Age in Byron?
Median Population Age in Byron is 38.9 Years.
What is the Average Family Size in Byron
Average Family Size in Byron is 2.9 People.
What is the Average Household Size in Byron
Average Household Size in Byron is 2.7 People.
How Large is the Labor Force in Byron?
There are 316 People in the Labor Forcein in Byron.
What is the Percentage of People in the Labor Force in Byron?
68.1% of People are in the Labor Force in Byron.
What is the Unemployment Rate in Byron?
Unemployment Rate in Byron is 4.7%.