Scottville, MI Map & Demographics
Scottville Map
Scottville Overview
$33,282
PER CAPITA INCOME
$62,917
AVG FAMILY INCOME
$47,643
AVG HOUSEHOLD INCOME
37.2%
WAGE / INCOME GAP [ % ]
62.8¢/ $1
WAGE / INCOME GAP [ $ ]
0.54
INEQUALITY / GINI INDEX
1,512
TOTAL POPULATION
711
MALE POPULATION
801
FEMALE POPULATION
88.76
MALES / 100 FEMALES
112.66
FEMALES / 100 MALES
33.9
MEDIAN AGE
3.2
AVG FAMILY SIZE
2.6
AVG HOUSEHOLD SIZE
716
LABOR FORCE [ PEOPLE ]
61.9%
PERCENT IN LABOR FORCE
3.6%
UNEMPLOYMENT RATE
Scottville Zip Codes
Scottville Area Codes
Income in Scottville
Income Overview in Scottville
Per Capita Income in Scottville is $33,282, while median incomes of families and households are $62,917 and $47,643 respectively.
| Characteristic | Number | Measure |
| Per Capita Income | 1,512 | $33,282 |
| Median Family Income | 345 | $62,917 |
| Mean Family Income | 345 | $91,077 |
| Median Household Income | 570 | $47,643 |
| Mean Household Income | 570 | $73,514 |
| Income Deficit | 345 | $0 |
| Wage / Income Gap (%) | 1,512 | 37.17% |
| Wage / Income Gap ($) | 1,512 | 62.83¢ per $1 |
| Gini / Inequality Index | 1,512 | 0.54 |
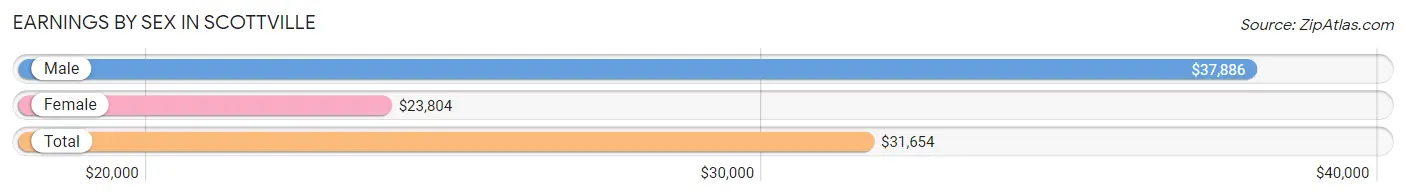
Earnings by Sex in Scottville
Average Earnings in Scottville are $31,654, $37,886 for men and $23,804 for women, a difference of 37.2%.
| Sex | Number | Average Earnings |
| Male | 433 (57.5%) | $37,886 |
| Female | 320 (42.5%) | $23,804 |
| Total | 753 (100.0%) | $31,654 |
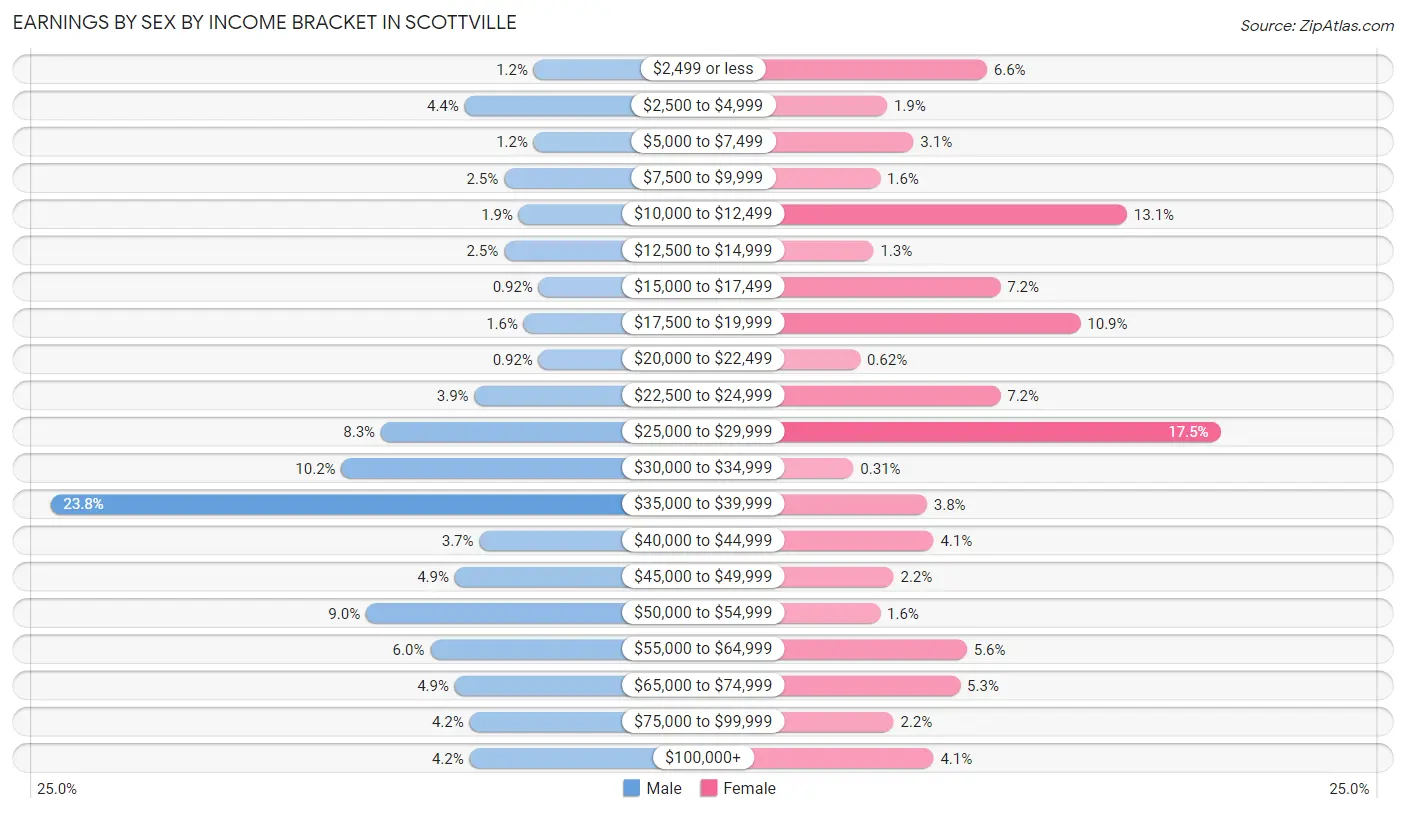
Earnings by Sex by Income Bracket in Scottville
The most common earnings brackets in Scottville are $35,000 to $39,999 for men (103 | 23.8%) and $25,000 to $29,999 for women (56 | 17.5%).
| Income | Male | Female |
| $2,499 or less | 5 (1.1%) | 21 (6.6%) |
| $2,500 to $4,999 | 19 (4.4%) | 6 (1.9%) |
| $5,000 to $7,499 | 5 (1.1%) | 10 (3.1%) |
| $7,500 to $9,999 | 11 (2.5%) | 5 (1.6%) |
| $10,000 to $12,499 | 8 (1.8%) | 42 (13.1%) |
| $12,500 to $14,999 | 11 (2.5%) | 4 (1.3%) |
| $15,000 to $17,499 | 4 (0.9%) | 23 (7.2%) |
| $17,500 to $19,999 | 7 (1.6%) | 35 (10.9%) |
| $20,000 to $22,499 | 4 (0.9%) | 2 (0.6%) |
| $22,500 to $24,999 | 17 (3.9%) | 23 (7.2%) |
| $25,000 to $29,999 | 36 (8.3%) | 56 (17.5%) |
| $30,000 to $34,999 | 44 (10.2%) | 1 (0.3%) |
| $35,000 to $39,999 | 103 (23.8%) | 12 (3.7%) |
| $40,000 to $44,999 | 16 (3.7%) | 13 (4.1%) |
| $45,000 to $49,999 | 21 (4.9%) | 7 (2.2%) |
| $50,000 to $54,999 | 39 (9.0%) | 5 (1.6%) |
| $55,000 to $64,999 | 26 (6.0%) | 18 (5.6%) |
| $65,000 to $74,999 | 21 (4.9%) | 17 (5.3%) |
| $75,000 to $99,999 | 18 (4.2%) | 7 (2.2%) |
| $100,000+ | 18 (4.2%) | 13 (4.1%) |
| Total | 433 (100.0%) | 320 (100.0%) |
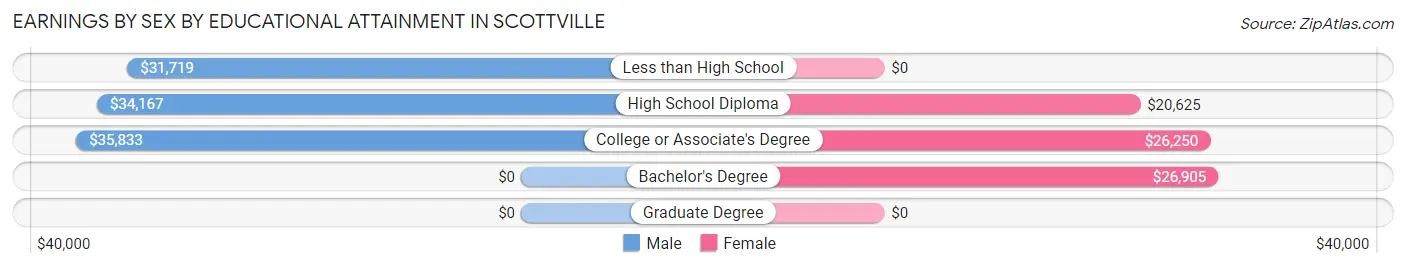
Earnings by Sex by Educational Attainment in Scottville
Average earnings in Scottville are $36,000 for men and $25,433 for women, a difference of 29.3%. Men with an educational attainment of college or associate's degree enjoy the highest average annual earnings of $35,833, while those with less than high school education earn the least with $31,719. Women with an educational attainment of bachelor's degree earn the most with the average annual earnings of $26,905, while those with high school diploma education have the smallest earnings of $20,625.
| Educational Attainment | Male Income | Female Income |
| Less than High School | $31,719 | $0 |
| High School Diploma | $34,167 | $20,625 |
| College or Associate's Degree | $35,833 | $26,250 |
| Bachelor's Degree | - | - |
| Graduate Degree | - | - |
| Total | $36,000 | $25,433 |
Family Income in Scottville
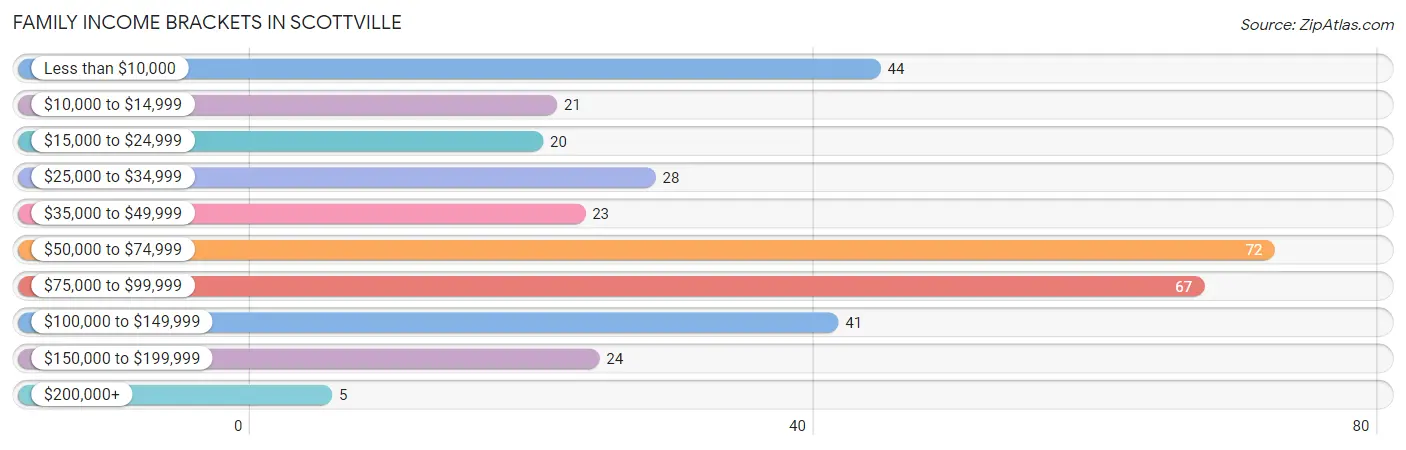
Family Income Brackets in Scottville
According to the Scottville family income data, there are 72 families falling into the $50,000 to $74,999 income range, which is the most common income bracket and makes up 20.9% of all families. Conversely, the $200,000+ income bracket is the least frequent group with only 5 families (1.5%) belonging to this category.
| Income Bracket | # Families | % Families |
| Less than $10,000 | 44 | 12.8% |
| $10,000 to $14,999 | 21 | 6.1% |
| $15,000 to $24,999 | 20 | 5.8% |
| $25,000 to $34,999 | 28 | 8.1% |
| $35,000 to $49,999 | 23 | 6.7% |
| $50,000 to $74,999 | 72 | 20.9% |
| $75,000 to $99,999 | 67 | 19.4% |
| $100,000 to $149,999 | 41 | 11.9% |
| $150,000 to $199,999 | 24 | 7.0% |
| $200,000+ | 5 | 1.4% |
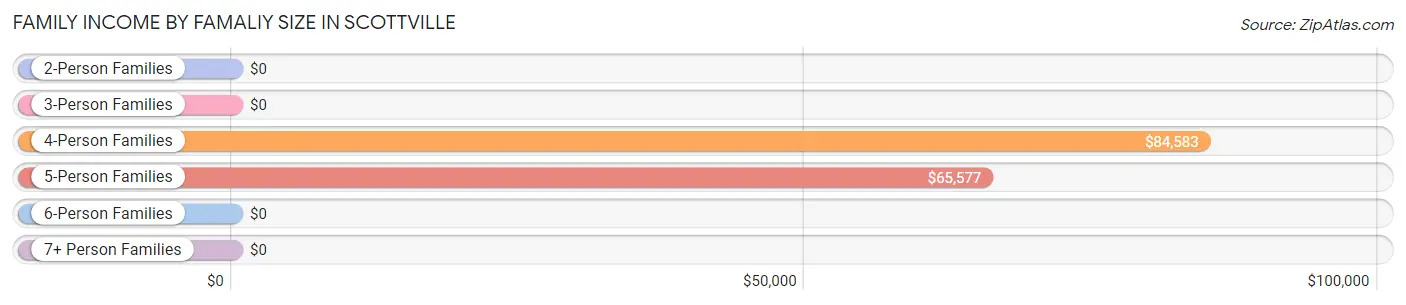
Family Income by Famaliy Size in Scottville
4-person families (49 | 14.2%) account for the highest median family income in Scottville with $84,583 per family, while 4-person families (49 | 14.2%) have the highest median income of $21,146 per family member.
| Income Bracket | # Families | Median Income |
| 2-Person Families | 157 (45.5%) | $0 |
| 3-Person Families | 86 (24.9%) | $0 |
| 4-Person Families | 49 (14.2%) | $84,583 |
| 5-Person Families | 44 (12.8%) | $65,577 |
| 6-Person Families | 3 (0.9%) | $0 |
| 7+ Person Families | 6 (1.7%) | $0 |
| Total | 345 (100.0%) | $62,917 |
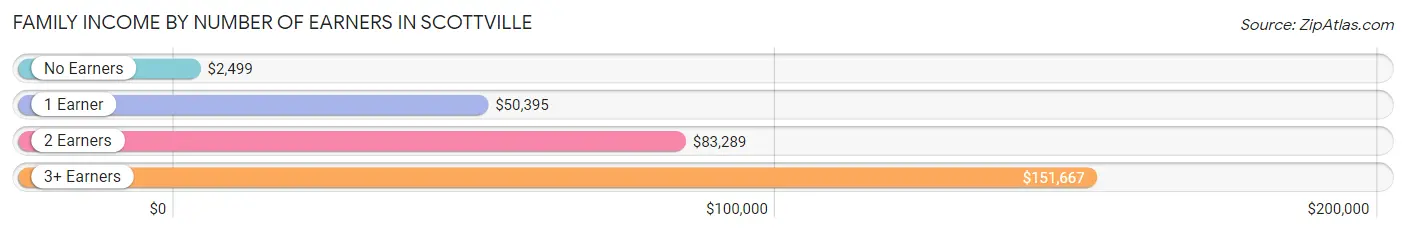
Family Income by Number of Earners in Scottville
The median family income in Scottville is $62,917, with families comprising 3+ earners (26) having the highest median family income of $151,667, while families with no earners (87) have the lowest median family income of $2,499, accounting for 7.5% and 25.2% of families, respectively.
| Number of Earners | # Families | Median Income |
| No Earners | 87 (25.2%) | $2,499 |
| 1 Earner | 104 (30.1%) | $50,395 |
| 2 Earners | 128 (37.1%) | $83,289 |
| 3+ Earners | 26 (7.5%) | $151,667 |
| Total | 345 (100.0%) | $62,917 |
Household Income in Scottville
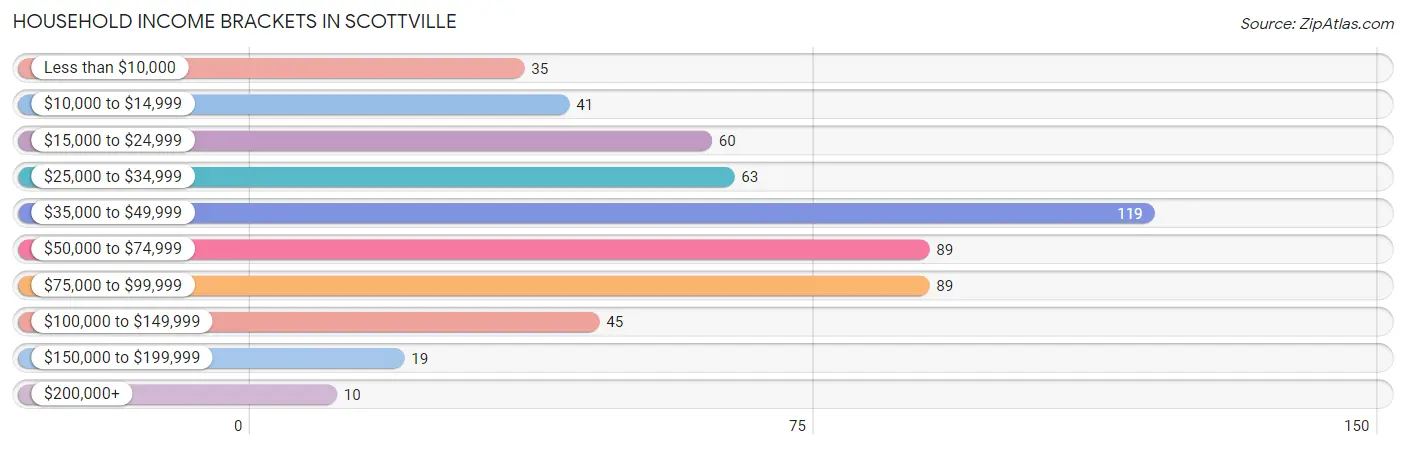
Household Income Brackets in Scottville
With 119 households falling in the category, the $35,000 to $49,999 income range is the most frequent in Scottville, accounting for 20.9% of all households. In contrast, only 10 households (1.8%) fall into the $200,000+ income bracket, making it the least populous group.
| Income Bracket | # Households | % Households |
| Less than $10,000 | 35 | 6.1% |
| $10,000 to $14,999 | 41 | 7.2% |
| $15,000 to $24,999 | 60 | 10.5% |
| $25,000 to $34,999 | 63 | 11.1% |
| $35,000 to $49,999 | 119 | 20.9% |
| $50,000 to $74,999 | 89 | 15.6% |
| $75,000 to $99,999 | 89 | 15.6% |
| $100,000 to $149,999 | 45 | 7.9% |
| $150,000 to $199,999 | 19 | 3.3% |
| $200,000+ | 10 | 1.8% |
Household Income by Householder Age in Scottville
The median household income in Scottville is $47,643, with the highest median household income of $71,750 found in the 45 to 64 years age bracket for the primary householder. A total of 209 households (36.7%) fall into this category. Meanwhile, the 65+ years age bracket for the primary householder has the lowest median household income of $32,188, with 116 households (20.3%) in this group.
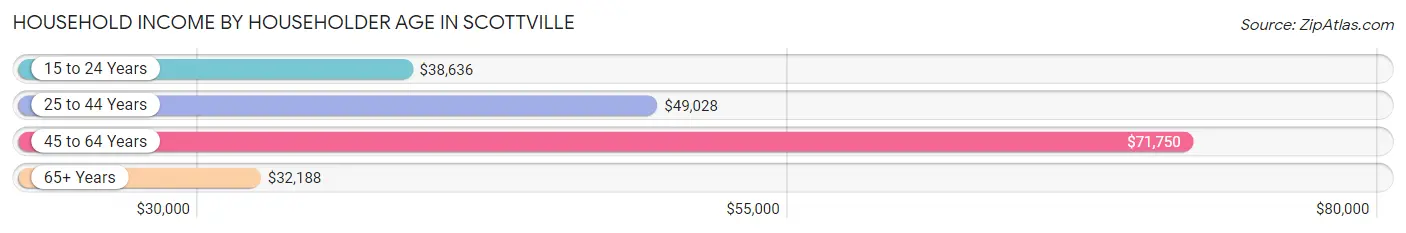
| Income Bracket | # Households | Median Income |
| 15 to 24 Years | 64 (11.2%) | $38,636 |
| 25 to 44 Years | 181 (31.8%) | $49,028 |
| 45 to 64 Years | 209 (36.7%) | $71,750 |
| 65+ Years | 116 (20.3%) | $32,188 |
| Total | 570 (100.0%) | $47,643 |
Poverty in Scottville
Income Below Poverty by Sex and Age in Scottville
With 15.1% poverty level for males and 29.8% for females among the residents of Scottville, 15 year old males and 16 and 17 year old females are the most vulnerable to poverty, with 8 males (53.3%) and 7 females (100.0%) in their respective age groups living below the poverty level.
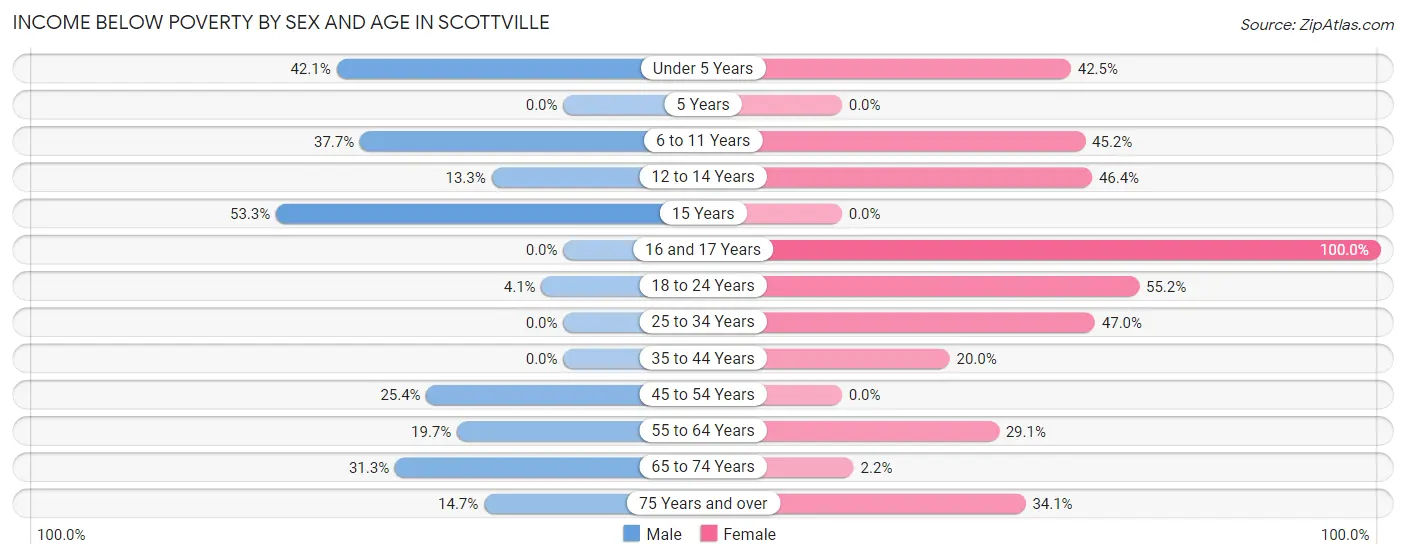
| Age Bracket | Male | Female |
| Under 5 Years | 8 (42.1%) | 34 (42.5%) |
| 5 Years | 0 (0.0%) | 0 (0.0%) |
| 6 to 11 Years | 20 (37.7%) | 14 (45.2%) |
| 12 to 14 Years | 6 (13.3%) | 39 (46.4%) |
| 15 Years | 8 (53.3%) | 0 (0.0%) |
| 16 and 17 Years | 0 (0.0%) | 7 (100.0%) |
| 18 to 24 Years | 5 (4.1%) | 48 (55.2%) |
| 25 to 34 Years | 0 (0.0%) | 31 (47.0%) |
| 35 to 44 Years | 0 (0.0%) | 19 (20.0%) |
| 45 to 54 Years | 31 (25.4%) | 0 (0.0%) |
| 55 to 64 Years | 14 (19.7%) | 30 (29.1%) |
| 65 to 74 Years | 10 (31.2%) | 2 (2.2%) |
| 75 Years and over | 5 (14.7%) | 15 (34.1%) |
| Total | 107 (15.1%) | 239 (29.8%) |
Income Above Poverty by Sex and Age in Scottville
According to the poverty statistics in Scottville, males aged 16 and 17 years and females aged 5 years are the age groups that are most secure financially, with 100.0% of males and 100.0% of females in these age groups living above the poverty line.
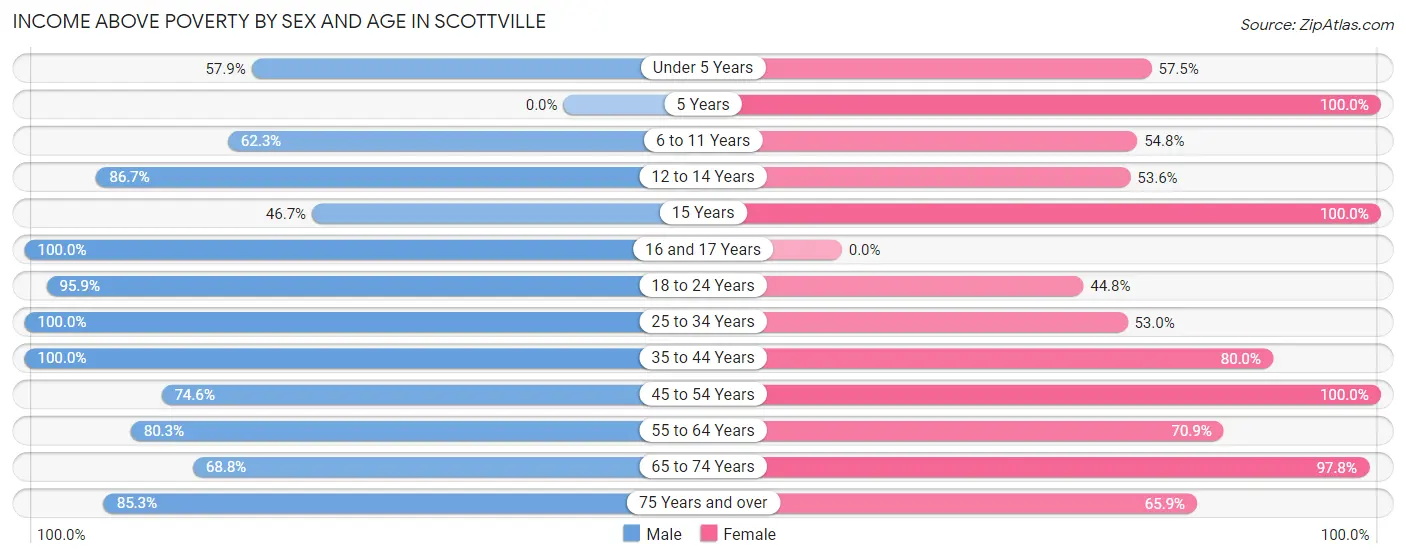
| Age Bracket | Male | Female |
| Under 5 Years | 11 (57.9%) | 46 (57.5%) |
| 5 Years | 0 (0.0%) | 15 (100.0%) |
| 6 to 11 Years | 33 (62.3%) | 17 (54.8%) |
| 12 to 14 Years | 39 (86.7%) | 45 (53.6%) |
| 15 Years | 7 (46.7%) | 10 (100.0%) |
| 16 and 17 Years | 8 (100.0%) | 0 (0.0%) |
| 18 to 24 Years | 118 (95.9%) | 39 (44.8%) |
| 25 to 34 Years | 129 (100.0%) | 35 (53.0%) |
| 35 to 44 Years | 57 (100.0%) | 76 (80.0%) |
| 45 to 54 Years | 91 (74.6%) | 88 (100.0%) |
| 55 to 64 Years | 57 (80.3%) | 73 (70.9%) |
| 65 to 74 Years | 22 (68.8%) | 89 (97.8%) |
| 75 Years and over | 29 (85.3%) | 29 (65.9%) |
| Total | 601 (84.9%) | 562 (70.2%) |
Income Below Poverty Among Married-Couple Families in Scottville
The poverty statistics for married-couple families in Scottville show that 3.4% or 6 of the total 177 families live below the poverty line. Families with 5 or more children have the highest poverty rate of 100.0%, comprising of 6 families. On the other hand, families with no children have the lowest poverty rate of 0.0%, which includes 0 families.
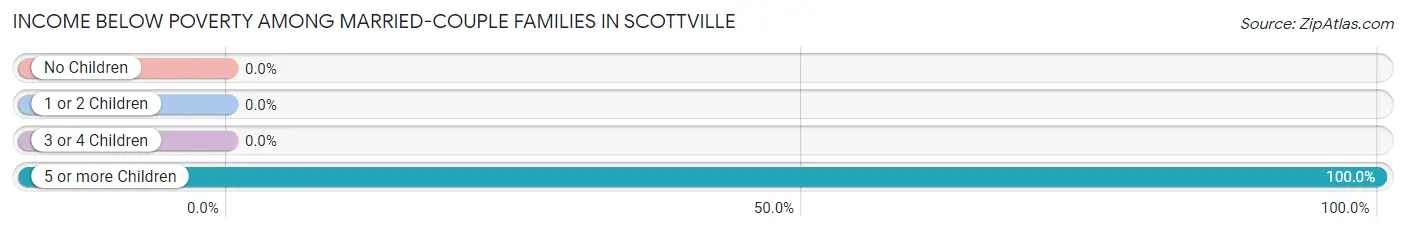
| Children | Above Poverty | Below Poverty |
| No Children | 120 (100.0%) | 0 (0.0%) |
| 1 or 2 Children | 27 (100.0%) | 0 (0.0%) |
| 3 or 4 Children | 24 (100.0%) | 0 (0.0%) |
| 5 or more Children | 0 (0.0%) | 6 (100.0%) |
| Total | 171 (96.6%) | 6 (3.4%) |
Income Below Poverty Among Single-Parent Households in Scottville
According to the poverty data in Scottville, 12.1% or 4 single-father households and 51.8% or 70 single-mother households are living below the poverty line. Among single-father households, those with no children have the highest poverty rate, with 4 households (30.8%) experiencing poverty. Likewise, among single-mother households, those with 1 or 2 children have the highest poverty rate, with 70 households (80.5%) falling below the poverty line.
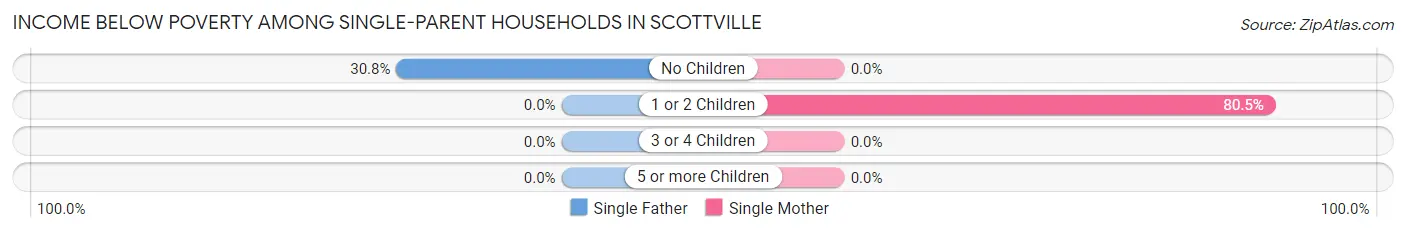
| Children | Single Father | Single Mother |
| No Children | 4 (30.8%) | 0 (0.0%) |
| 1 or 2 Children | 0 (0.0%) | 70 (80.5%) |
| 3 or 4 Children | 0 (0.0%) | 0 (0.0%) |
| 5 or more Children | 0 (0.0%) | 0 (0.0%) |
| Total | 4 (12.1%) | 70 (51.8%) |
Income Below Poverty Among Married-Couple vs Single-Parent Households in Scottville
The poverty data for Scottville shows that 6 of the married-couple family households (3.4%) and 74 of the single-parent households (44.1%) are living below the poverty level. Within the married-couple family households, those with 5 or more children have the highest poverty rate, with 6 households (100.0%) falling below the poverty line. Among the single-parent households, those with 1 or 2 children have the highest poverty rate, with 70 household (65.4%) living below poverty.
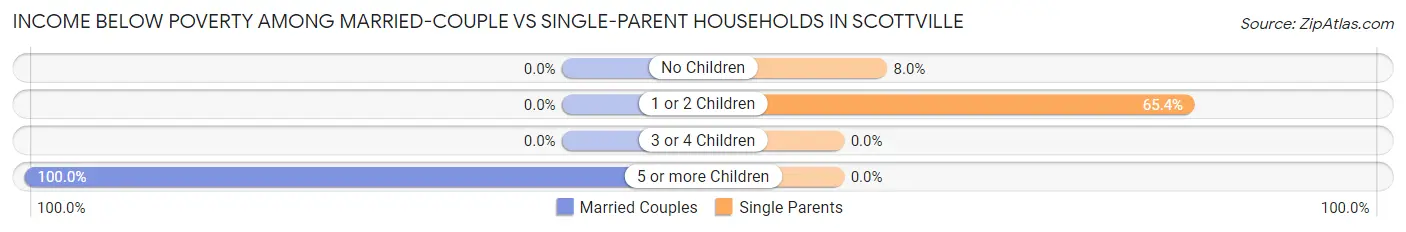
| Children | Married-Couple Families | Single-Parent Households |
| No Children | 0 (0.0%) | 4 (8.0%) |
| 1 or 2 Children | 0 (0.0%) | 70 (65.4%) |
| 3 or 4 Children | 0 (0.0%) | 0 (0.0%) |
| 5 or more Children | 6 (100.0%) | 0 (0.0%) |
| Total | 6 (3.4%) | 74 (44.1%) |
Race in Scottville
The most populous races in Scottville are White / Caucasian (1,414 | 93.5%), Hispanic or Latino (155 | 10.2%), and Two or more Races (72 | 4.8%).
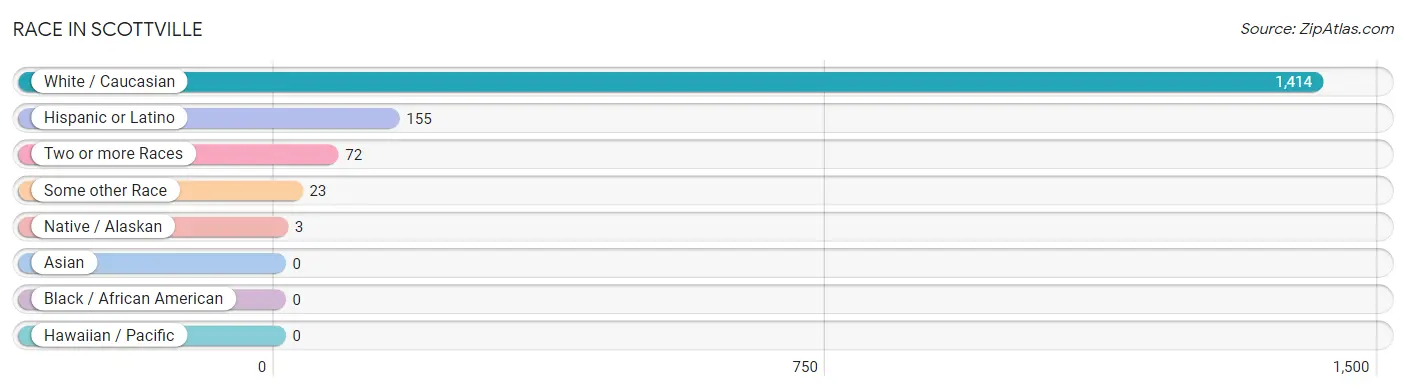
| Race | # Population | % Population |
| Asian | 0 | 0.0% |
| Black / African American | 0 | 0.0% |
| Hawaiian / Pacific | 0 | 0.0% |
| Hispanic or Latino | 155 | 10.2% |
| Native / Alaskan | 3 | 0.2% |
| White / Caucasian | 1,414 | 93.5% |
| Two or more Races | 72 | 4.8% |
| Some other Race | 23 | 1.5% |
| Total | 1,512 | 100.0% |
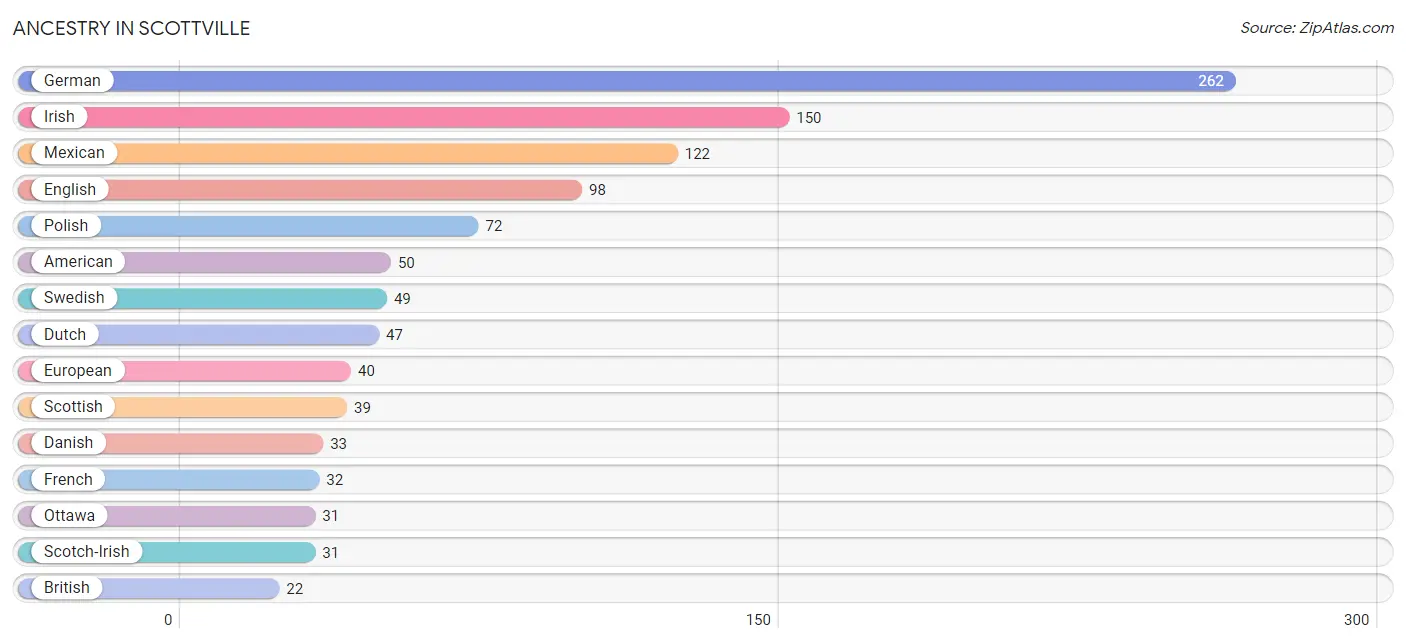
Ancestry in Scottville
The most populous ancestries reported in Scottville are German (262 | 17.3%), Irish (150 | 9.9%), Mexican (122 | 8.1%), English (98 | 6.5%), and Polish (72 | 4.8%), together accounting for 46.6% of all Scottville residents.
| Ancestry | # Population | % Population |
| American | 50 | 3.3% |
| Austrian | 3 | 0.2% |
| Belgian | 7 | 0.5% |
| British | 22 | 1.5% |
| Danish | 33 | 2.2% |
| Dutch | 47 | 3.1% |
| English | 98 | 6.5% |
| European | 40 | 2.6% |
| Finnish | 22 | 1.5% |
| French | 32 | 2.1% |
| French Canadian | 18 | 1.2% |
| German | 262 | 17.3% |
| Hungarian | 6 | 0.4% |
| Irish | 150 | 9.9% |
| Italian | 19 | 1.3% |
| Lithuanian | 22 | 1.5% |
| Maltese | 2 | 0.1% |
| Mexican | 122 | 8.1% |
| Nigerian | 4 | 0.3% |
| Norwegian | 13 | 0.9% |
| Ottawa | 31 | 2.1% |
| Polish | 72 | 4.8% |
| Potawatomi | 8 | 0.5% |
| Puerto Rican | 5 | 0.3% |
| Scandinavian | 17 | 1.1% |
| Scotch-Irish | 31 | 2.1% |
| Scottish | 39 | 2.6% |
| Spanish | 10 | 0.7% |
| Subsaharan African | 4 | 0.3% |
| Swedish | 49 | 3.2% |
| Swiss | 12 | 0.8% |
| Tohono O'Odham | 3 | 0.2% |
| Welsh | 19 | 1.3% | View All 33 Rows |
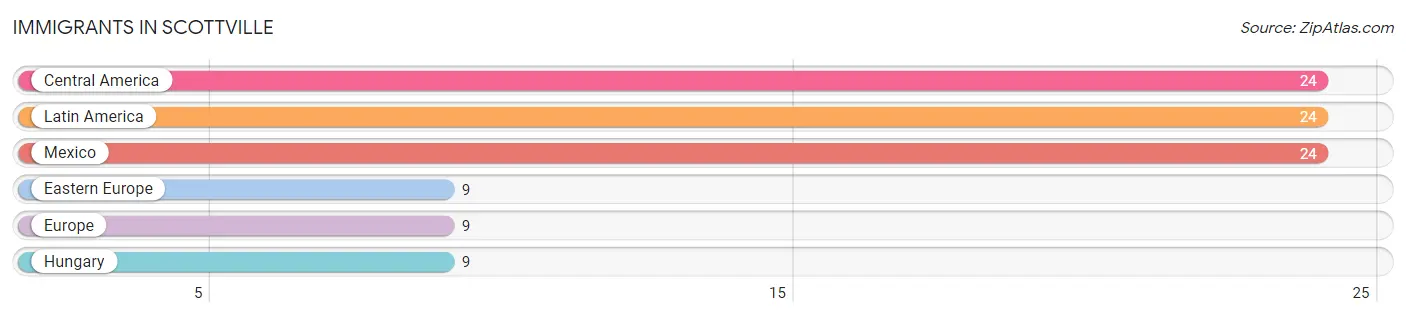
Immigrants in Scottville
The most numerous immigrant groups reported in Scottville came from Central America (24 | 1.6%), Latin America (24 | 1.6%), Mexico (24 | 1.6%), Eastern Europe (9 | 0.6%), and Europe (9 | 0.6%), together accounting for 6.0% of all Scottville residents.
| Immigration Origin | # Population | % Population |
| Central America | 24 | 1.6% |
| Eastern Europe | 9 | 0.6% |
| Europe | 9 | 0.6% |
| Hungary | 9 | 0.6% |
| Latin America | 24 | 1.6% |
| Mexico | 24 | 1.6% | View All 6 Rows |
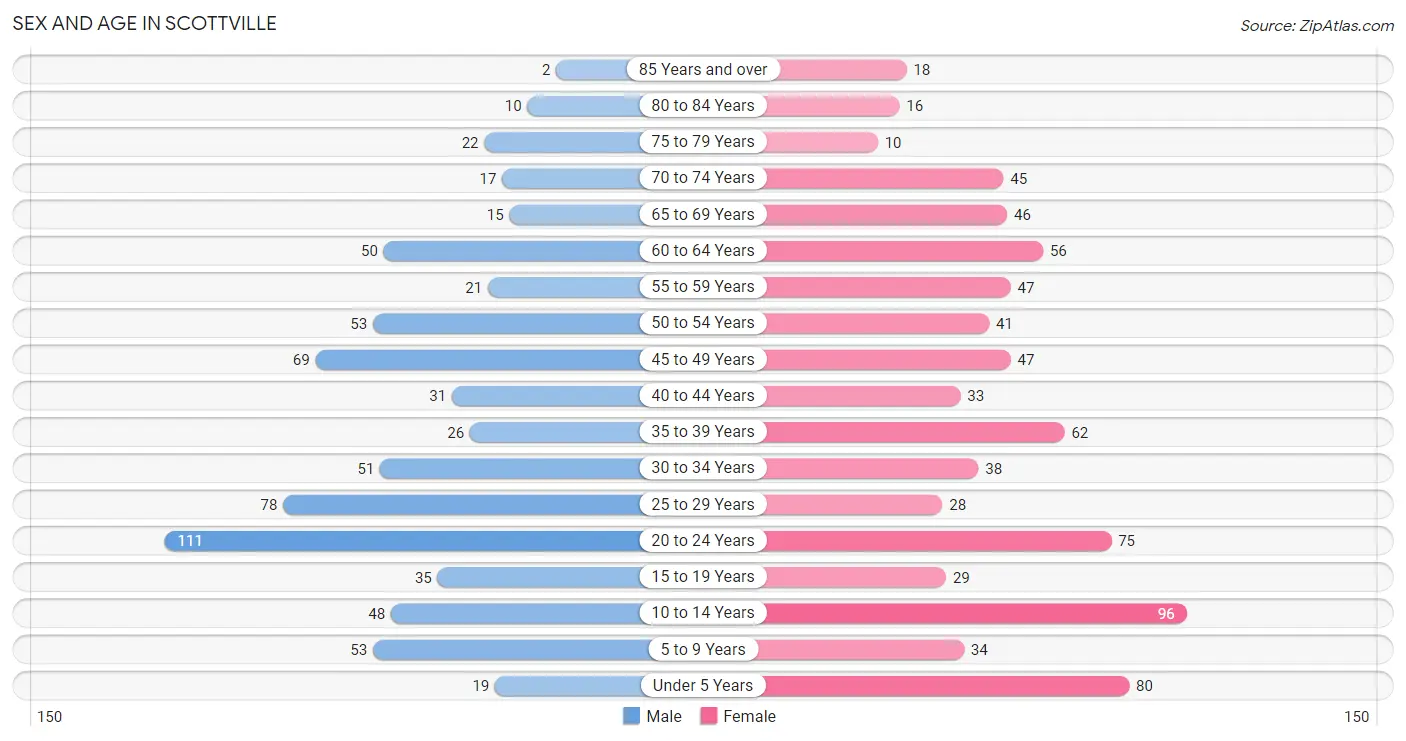
Sex and Age in Scottville
Sex and Age in Scottville
The most populous age groups in Scottville are 20 to 24 Years (111 | 15.6%) for men and 10 to 14 Years (96 | 12.0%) for women.
| Age Bracket | Male | Female |
| Under 5 Years | 19 (2.7%) | 80 (10.0%) |
| 5 to 9 Years | 53 (7.4%) | 34 (4.2%) |
| 10 to 14 Years | 48 (6.8%) | 96 (12.0%) |
| 15 to 19 Years | 35 (4.9%) | 29 (3.6%) |
| 20 to 24 Years | 111 (15.6%) | 75 (9.4%) |
| 25 to 29 Years | 78 (11.0%) | 28 (3.5%) |
| 30 to 34 Years | 51 (7.2%) | 38 (4.7%) |
| 35 to 39 Years | 26 (3.7%) | 62 (7.7%) |
| 40 to 44 Years | 31 (4.4%) | 33 (4.1%) |
| 45 to 49 Years | 69 (9.7%) | 47 (5.9%) |
| 50 to 54 Years | 53 (7.4%) | 41 (5.1%) |
| 55 to 59 Years | 21 (2.9%) | 47 (5.9%) |
| 60 to 64 Years | 50 (7.0%) | 56 (7.0%) |
| 65 to 69 Years | 15 (2.1%) | 46 (5.7%) |
| 70 to 74 Years | 17 (2.4%) | 45 (5.6%) |
| 75 to 79 Years | 22 (3.1%) | 10 (1.3%) |
| 80 to 84 Years | 10 (1.4%) | 16 (2.0%) |
| 85 Years and over | 2 (0.3%) | 18 (2.2%) |
| Total | 711 (100.0%) | 801 (100.0%) |
Families and Households in Scottville
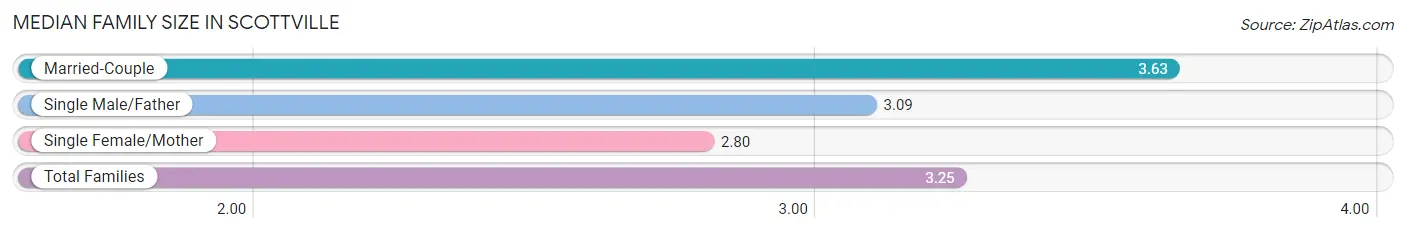
Median Family Size in Scottville
The median family size in Scottville is 3.25 persons per family, with married-couple families (177 | 51.3%) accounting for the largest median family size of 3.63 persons per family. On the other hand, single female/mother families (135 | 39.1%) represent the smallest median family size with 2.80 persons per family.
| Family Type | # Families | Family Size |
| Married-Couple | 177 (51.3%) | 3.63 |
| Single Male/Father | 33 (9.6%) | 3.09 |
| Single Female/Mother | 135 (39.1%) | 2.80 |
| Total Families | 345 (100.0%) | 3.25 |
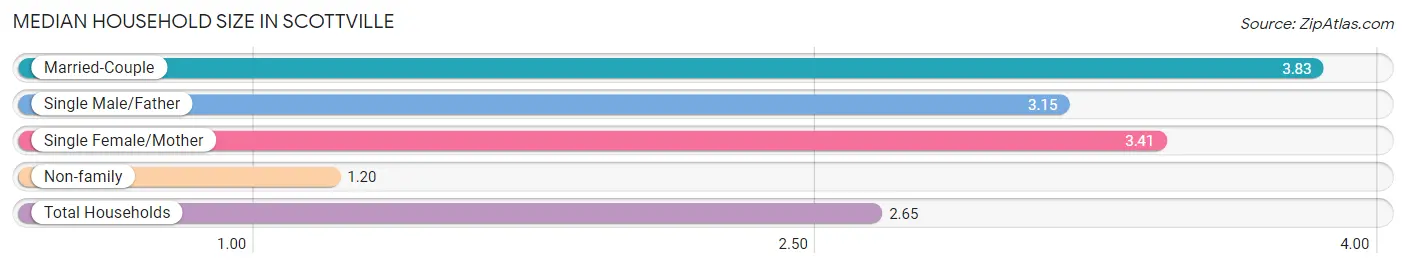
Median Household Size in Scottville
The median household size in Scottville is 2.65 persons per household, with married-couple households (177 | 31.0%) accounting for the largest median household size of 3.83 persons per household. non-family households (225 | 39.5%) represent the smallest median household size with 1.20 persons per household.
| Household Type | # Households | Household Size |
| Married-Couple | 177 (31.0%) | 3.83 |
| Single Male/Father | 33 (5.8%) | 3.15 |
| Single Female/Mother | 135 (23.7%) | 3.41 |
| Non-family | 225 (39.5%) | 1.20 |
| Total Households | 570 (100.0%) | 2.65 |
Household Size by Marriage Status in Scottville
Out of a total of 570 households in Scottville, 345 (60.5%) are family households, while 225 (39.5%) are nonfamily households. The most numerous type of family households are 3-person households, comprising 118, and the most common type of nonfamily households are 1-person households, comprising 186.
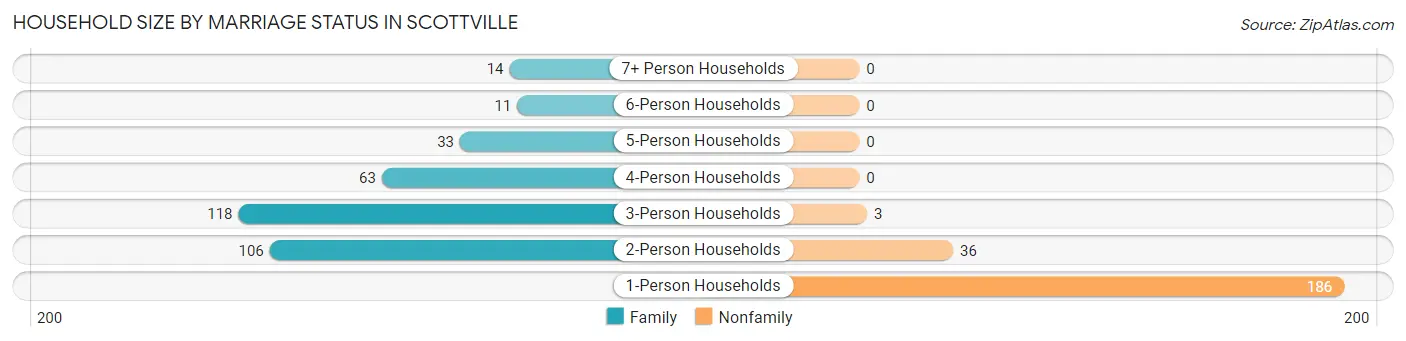
| Household Size | Family Households | Nonfamily Households |
| 1-Person Households | - | 186 (32.6%) |
| 2-Person Households | 106 (18.6%) | 36 (6.3%) |
| 3-Person Households | 118 (20.7%) | 3 (0.5%) |
| 4-Person Households | 63 (11.1%) | 0 (0.0%) |
| 5-Person Households | 33 (5.8%) | 0 (0.0%) |
| 6-Person Households | 11 (1.9%) | 0 (0.0%) |
| 7+ Person Households | 14 (2.5%) | 0 (0.0%) |
| Total | 345 (60.5%) | 225 (39.5%) |
Female Fertility in Scottville
Fertility by Age in Scottville
Average fertility rate in Scottville is 28.0 births per 1,000 women. Women in the age bracket of 35 to 50 years have the highest fertility rate with 39.0 births per 1,000 women. Women in the age bracket of 35 to 50 years acount for 66.7% of all women with births.
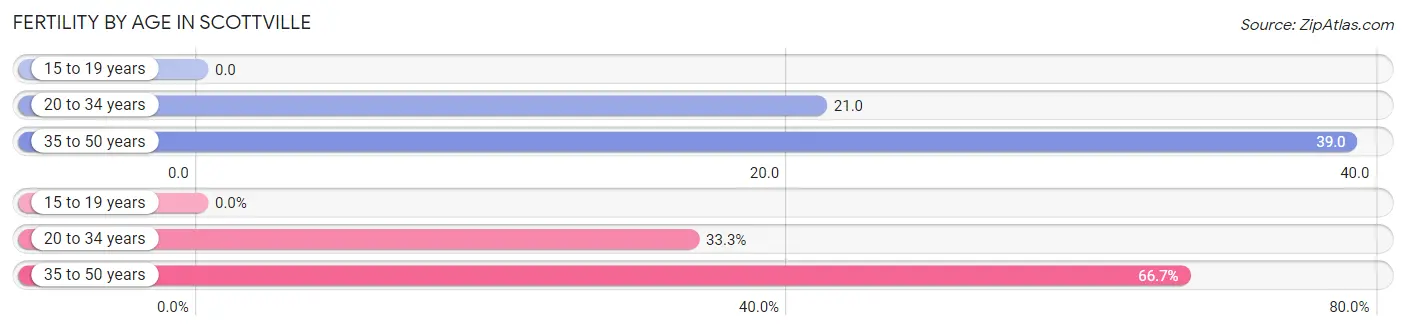
| Age Bracket | Women with Births | Births / 1,000 Women |
| 15 to 19 years | 0 (0.0%) | 0.0 |
| 20 to 34 years | 3 (33.3%) | 21.0 |
| 35 to 50 years | 6 (66.7%) | 39.0 |
| Total | 9 (100.0%) | 28.0 |
Fertility by Age by Marriage Status in Scottville
66.7% of women with births (9) in Scottville are married. The highest percentage of unmarried women with births falls into 20 to 34 years age bracket with 100.0% of them unmarried at the time of birth, while the lowest percentage of unmarried women with births belong to 35 to 50 years age bracket with 0.0% of them unmarried.
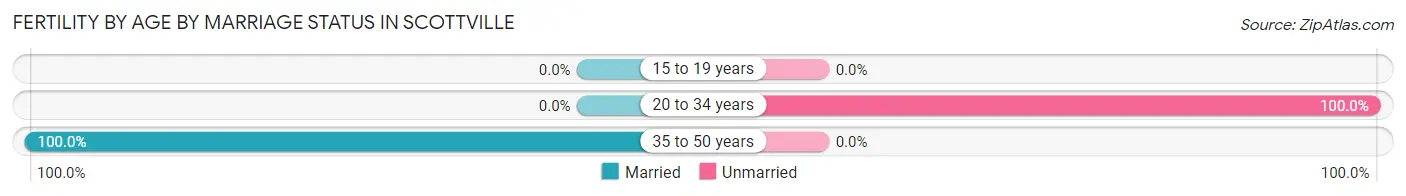
| Age Bracket | Married | Unmarried |
| 15 to 19 years | 0 (0.0%) | 0 (0.0%) |
| 20 to 34 years | 0 (0.0%) | 3 (100.0%) |
| 35 to 50 years | 6 (100.0%) | 0 (0.0%) |
| Total | 6 (66.7%) | 3 (33.3%) |
Fertility by Education in Scottville
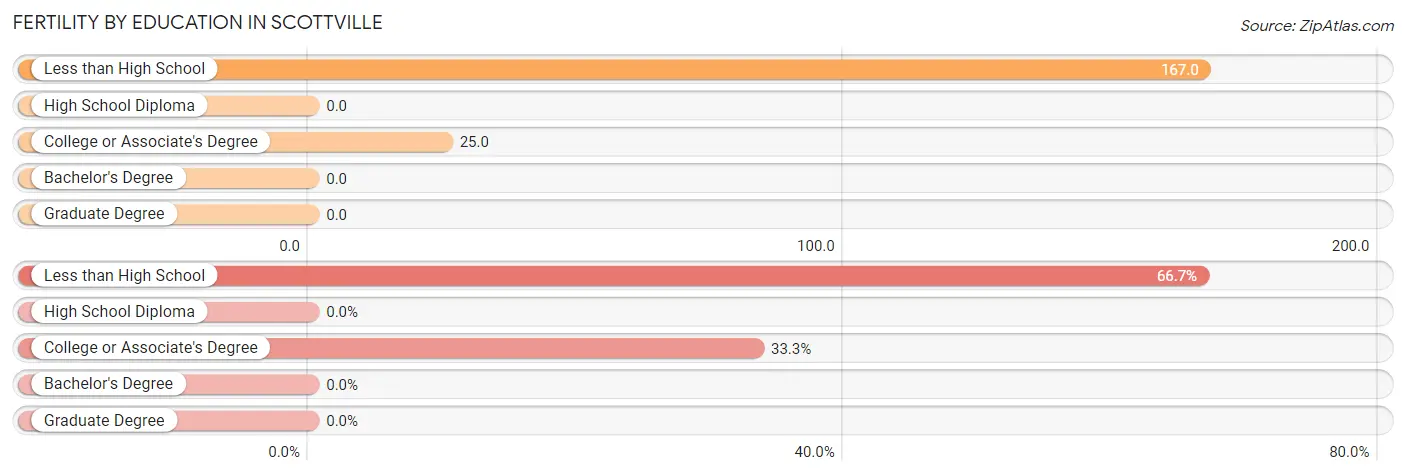
| Educational Attainment | Women with Births | Births / 1,000 Women |
| Less than High School | 6 (66.7%) | 167.0 |
| High School Diploma | 0 (0.0%) | 0.0 |
| College or Associate's Degree | 3 (33.3%) | 25.0 |
| Bachelor's Degree | 0 (0.0%) | 0.0 |
| Graduate Degree | 0 (0.0%) | 0.0 |
| Total | 9 (100.0%) | 28.0 |
Fertility by Education by Marriage Status in Scottville
33.3% of women with births in Scottville are unmarried. Women with the educational attainment of less than high school are most likely to be married with 100.0% of them married at childbirth, while women with the educational attainment of college or associate's degree are least likely to be married with 100.0% of them unmarried at childbirth.
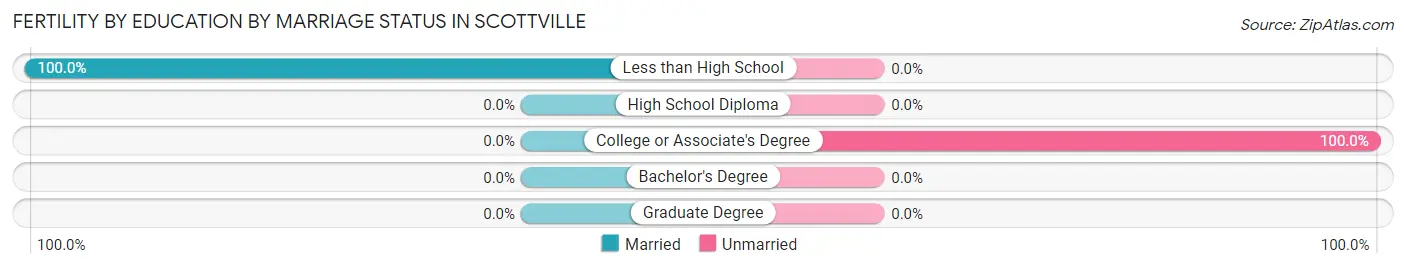
| Educational Attainment | Married | Unmarried |
| Less than High School | 6 (100.0%) | 0 (0.0%) |
| High School Diploma | 0 (0.0%) | 0 (0.0%) |
| College or Associate's Degree | 0 (0.0%) | 3 (100.0%) |
| Bachelor's Degree | 0 (0.0%) | 0 (0.0%) |
| Graduate Degree | 0 (0.0%) | 0 (0.0%) |
| Total | 6 (66.7%) | 3 (33.3%) |
Employment Characteristics in Scottville
Employment by Class of Employer in Scottville
Among the 684 employed individuals in Scottville, private company employees (500 | 73.1%), self-employed (not incorporated) (48 | 7.0%), and self-employed (incorporated) (35 | 5.1%) make up the most common classes of employment.
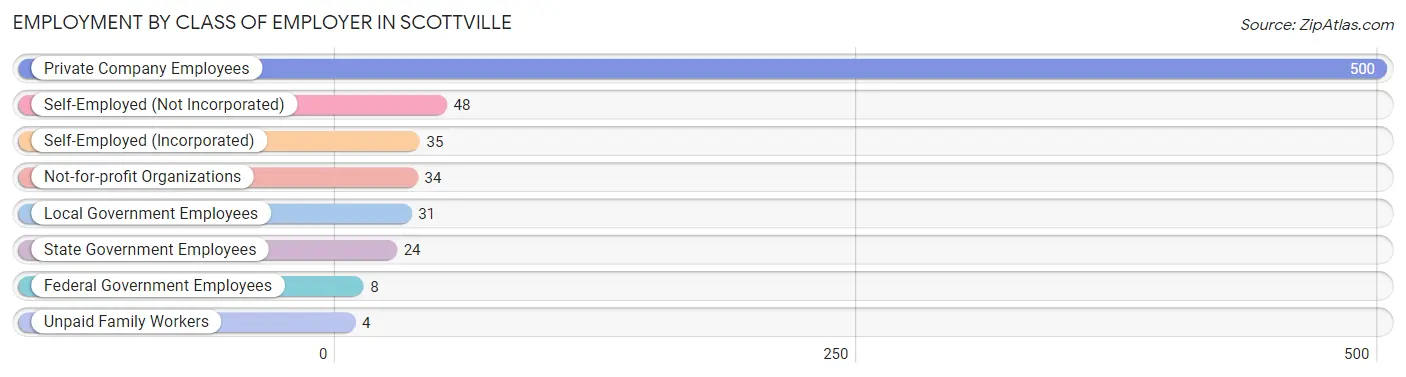
| Employer Class | # Employees | % Employees |
| Private Company Employees | 500 | 73.1% |
| Self-Employed (Incorporated) | 35 | 5.1% |
| Self-Employed (Not Incorporated) | 48 | 7.0% |
| Not-for-profit Organizations | 34 | 5.0% |
| Local Government Employees | 31 | 4.5% |
| State Government Employees | 24 | 3.5% |
| Federal Government Employees | 8 | 1.2% |
| Unpaid Family Workers | 4 | 0.6% |
| Total | 684 | 100.0% |
Employment Status by Age in Scottville
According to the labor force statistics for Scottville, out of the total population over 16 years of age (1,157), 61.9% or 716 individuals are in the labor force, with 3.6% or 26 of them unemployed. The age group with the highest labor force participation rate is 25 to 29 years, with 92.5% or 98 individuals in the labor force. Within the labor force, the 30 to 34 years age range has the highest percentage of unemployed individuals, with 30.2% or 16 of them being unemployed.
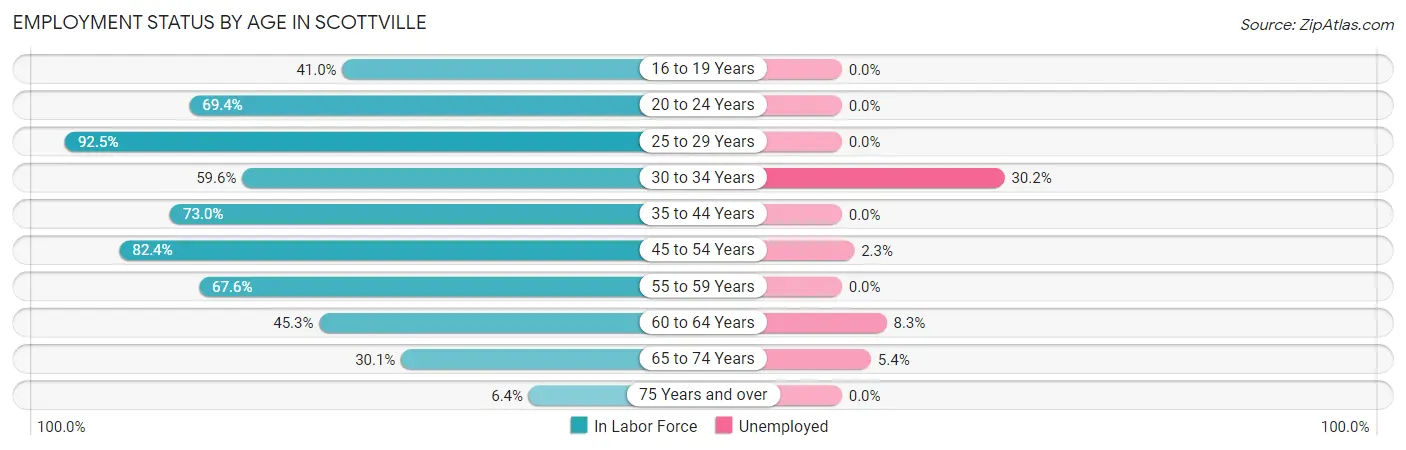
| Age Bracket | In Labor Force | Unemployed |
| 16 to 19 Years | 16 (41.0%) | 0 (0.0%) |
| 20 to 24 Years | 129 (69.4%) | 0 (0.0%) |
| 25 to 29 Years | 98 (92.5%) | 0 (0.0%) |
| 30 to 34 Years | 53 (59.6%) | 16 (30.2%) |
| 35 to 44 Years | 111 (73.0%) | 0 (0.0%) |
| 45 to 54 Years | 173 (82.4%) | 4 (2.3%) |
| 55 to 59 Years | 46 (67.6%) | 0 (0.0%) |
| 60 to 64 Years | 48 (45.3%) | 4 (8.3%) |
| 65 to 74 Years | 37 (30.1%) | 2 (5.4%) |
| 75 Years and over | 5 (6.4%) | 0 (0.0%) |
| Total | 716 (61.9%) | 26 (3.6%) |
Employment Status by Educational Attainment in Scottville
According to labor force statistics for Scottville, 72.4% of individuals (529) out of the total population between 25 and 64 years of age (731) are in the labor force, with 4.5% or 24 of them being unemployed. The group with the highest labor force participation rate are those with the educational attainment of bachelor's degree or higher, with 95.6% or 108 individuals in the labor force. Within the labor force, individuals with less than high school education have the highest percentage of unemployment, with 8.7% or 4 of them being unemployed.
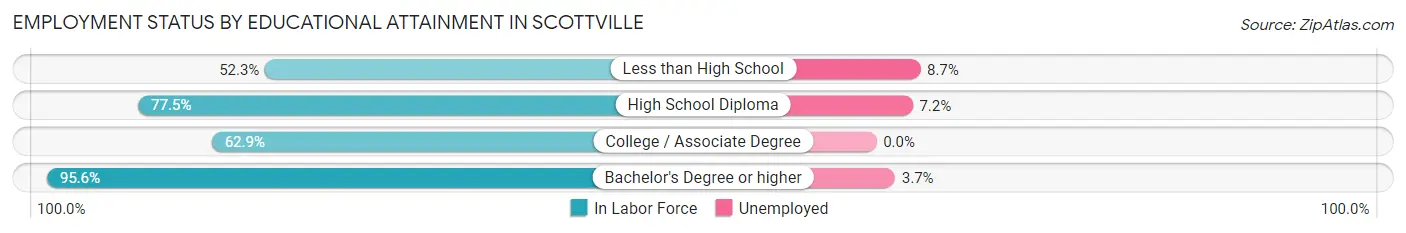
| Educational Attainment | In Labor Force | Unemployed |
| Less than High School | 46 (52.3%) | 8 (8.7%) |
| High School Diploma | 221 (77.5%) | 21 (7.2%) |
| College / Associate Degree | 154 (62.9%) | 0 (0.0%) |
| Bachelor's Degree or higher | 108 (95.6%) | 4 (3.7%) |
| Total | 529 (72.4%) | 33 (4.5%) |
Employment Occupations by Sex in Scottville
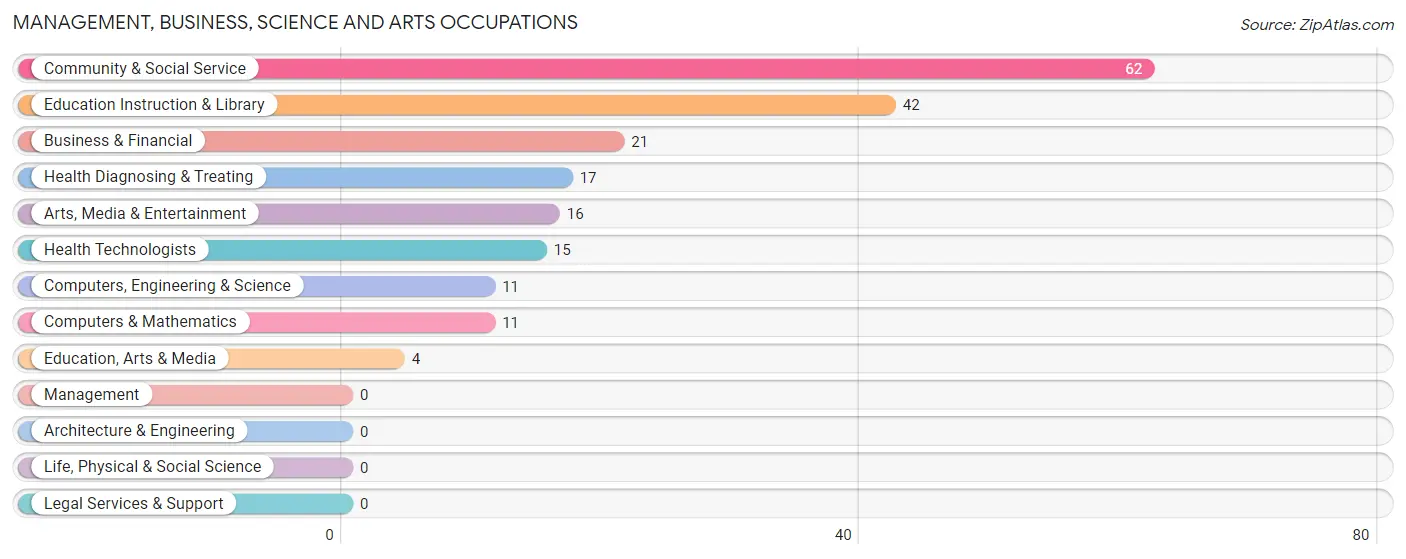
Management, Business, Science and Arts Occupations
The most common Management, Business, Science and Arts occupations in Scottville are Community & Social Service (62 | 9.0%), Education Instruction & Library (42 | 6.1%), Business & Financial (21 | 3.0%), Health Diagnosing & Treating (17 | 2.5%), and Arts, Media & Entertainment (16 | 2.3%).
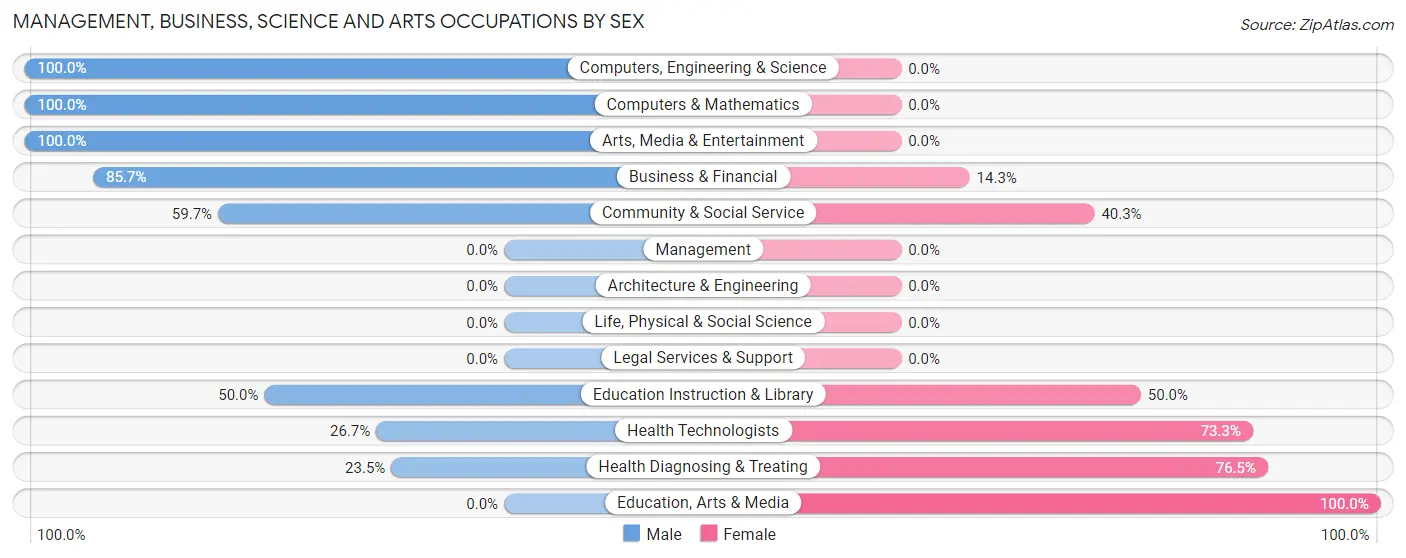
Management, Business, Science and Arts Occupations by Sex
Within the Management, Business, Science and Arts occupations in Scottville, the most male-oriented occupations are Computers, Engineering & Science (100.0%), Computers & Mathematics (100.0%), and Arts, Media & Entertainment (100.0%), while the most female-oriented occupations are Education, Arts & Media (100.0%), Health Diagnosing & Treating (76.5%), and Health Technologists (73.3%).
| Occupation | Male | Female |
| Management | 0 (0.0%) | 0 (0.0%) |
| Business & Financial | 18 (85.7%) | 3 (14.3%) |
| Computers, Engineering & Science | 11 (100.0%) | 0 (0.0%) |
| Computers & Mathematics | 11 (100.0%) | 0 (0.0%) |
| Architecture & Engineering | 0 (0.0%) | 0 (0.0%) |
| Life, Physical & Social Science | 0 (0.0%) | 0 (0.0%) |
| Community & Social Service | 37 (59.7%) | 25 (40.3%) |
| Education, Arts & Media | 0 (0.0%) | 4 (100.0%) |
| Legal Services & Support | 0 (0.0%) | 0 (0.0%) |
| Education Instruction & Library | 21 (50.0%) | 21 (50.0%) |
| Arts, Media & Entertainment | 16 (100.0%) | 0 (0.0%) |
| Health Diagnosing & Treating | 4 (23.5%) | 13 (76.5%) |
| Health Technologists | 4 (26.7%) | 11 (73.3%) |
| Total (Category) | 70 (63.1%) | 41 (36.9%) |
| Total (Overall) | 402 (58.3%) | 288 (41.7%) |
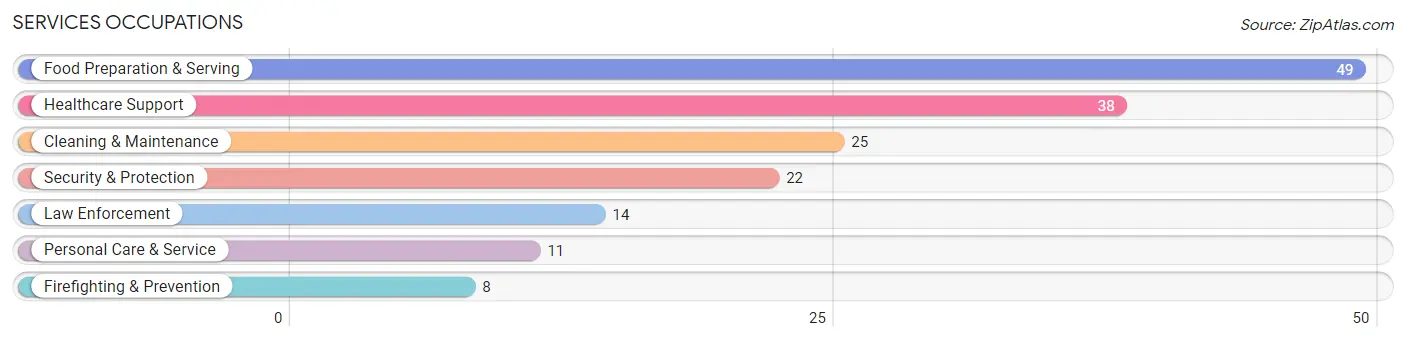
Services Occupations
The most common Services occupations in Scottville are Food Preparation & Serving (49 | 7.1%), Healthcare Support (38 | 5.5%), Cleaning & Maintenance (25 | 3.6%), Security & Protection (22 | 3.2%), and Law Enforcement (14 | 2.0%).
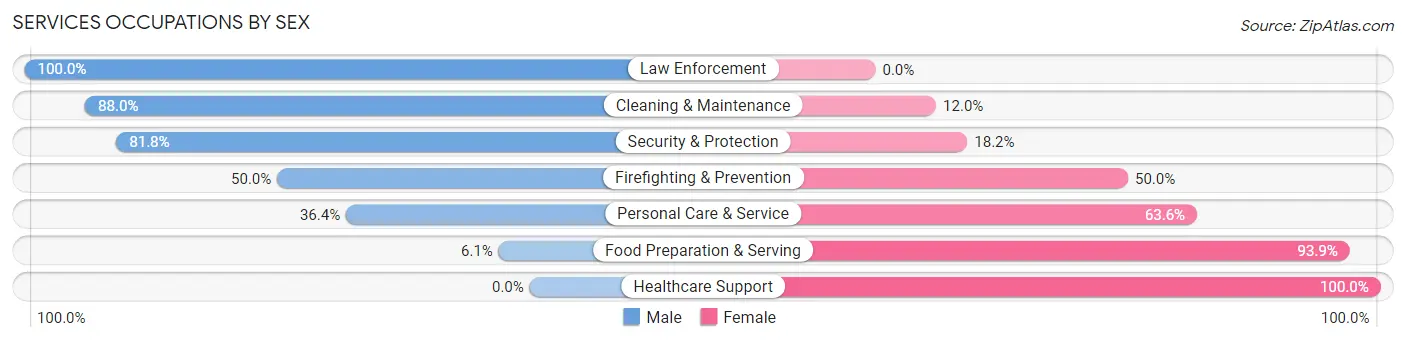
Services Occupations by Sex
Within the Services occupations in Scottville, the most male-oriented occupations are Law Enforcement (100.0%), Cleaning & Maintenance (88.0%), and Security & Protection (81.8%), while the most female-oriented occupations are Healthcare Support (100.0%), Food Preparation & Serving (93.9%), and Personal Care & Service (63.6%).
| Occupation | Male | Female |
| Healthcare Support | 0 (0.0%) | 38 (100.0%) |
| Security & Protection | 18 (81.8%) | 4 (18.2%) |
| Firefighting & Prevention | 4 (50.0%) | 4 (50.0%) |
| Law Enforcement | 14 (100.0%) | 0 (0.0%) |
| Food Preparation & Serving | 3 (6.1%) | 46 (93.9%) |
| Cleaning & Maintenance | 22 (88.0%) | 3 (12.0%) |
| Personal Care & Service | 4 (36.4%) | 7 (63.6%) |
| Total (Category) | 47 (32.4%) | 98 (67.6%) |
| Total (Overall) | 402 (58.3%) | 288 (41.7%) |
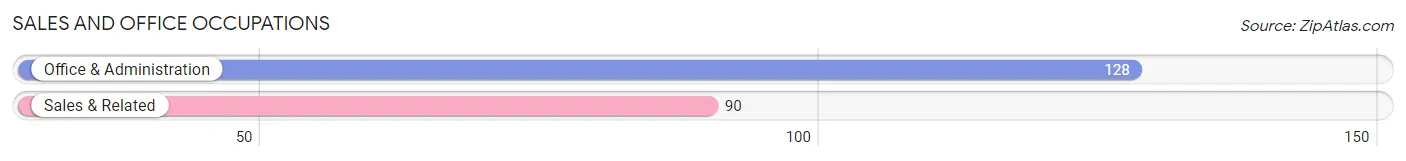
Sales and Office Occupations
The most common Sales and Office occupations in Scottville are Office & Administration (128 | 18.5%), and Sales & Related (90 | 13.0%).
Sales and Office Occupations by Sex
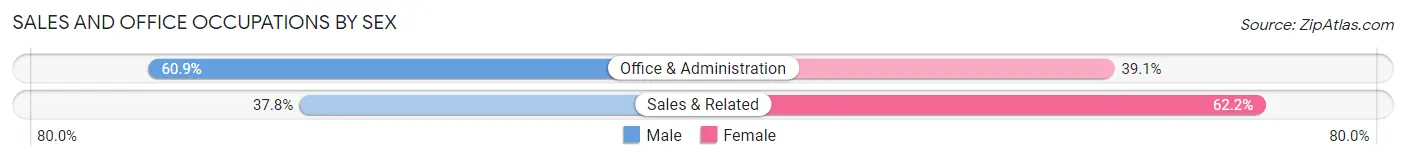
| Occupation | Male | Female |
| Sales & Related | 34 (37.8%) | 56 (62.2%) |
| Office & Administration | 78 (60.9%) | 50 (39.1%) |
| Total (Category) | 112 (51.4%) | 106 (48.6%) |
| Total (Overall) | 402 (58.3%) | 288 (41.7%) |
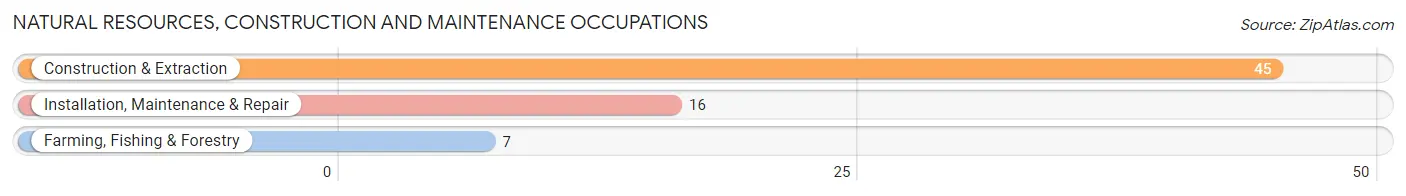
Natural Resources, Construction and Maintenance Occupations
The most common Natural Resources, Construction and Maintenance occupations in Scottville are Construction & Extraction (45 | 6.5%), Installation, Maintenance & Repair (16 | 2.3%), and Farming, Fishing & Forestry (7 | 1.0%).
Natural Resources, Construction and Maintenance Occupations by Sex
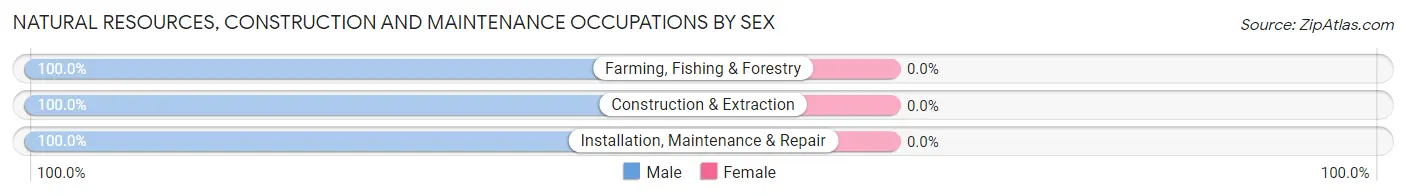
| Occupation | Male | Female |
| Farming, Fishing & Forestry | 7 (100.0%) | 0 (0.0%) |
| Construction & Extraction | 45 (100.0%) | 0 (0.0%) |
| Installation, Maintenance & Repair | 16 (100.0%) | 0 (0.0%) |
| Total (Category) | 68 (100.0%) | 0 (0.0%) |
| Total (Overall) | 402 (58.3%) | 288 (41.7%) |
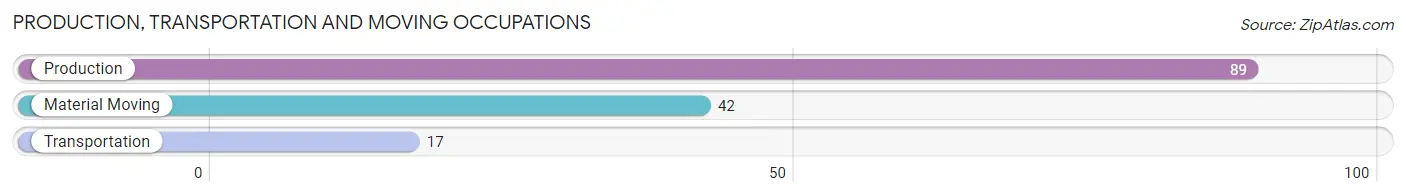
Production, Transportation and Moving Occupations
The most common Production, Transportation and Moving occupations in Scottville are Production (89 | 12.9%), Material Moving (42 | 6.1%), and Transportation (17 | 2.5%).
Production, Transportation and Moving Occupations by Sex
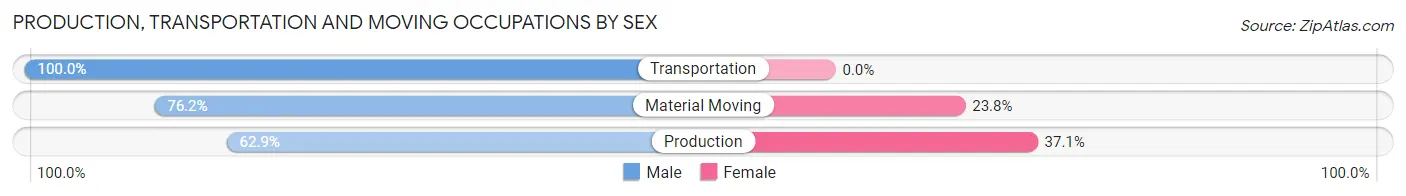
| Occupation | Male | Female |
| Production | 56 (62.9%) | 33 (37.1%) |
| Transportation | 17 (100.0%) | 0 (0.0%) |
| Material Moving | 32 (76.2%) | 10 (23.8%) |
| Total (Category) | 105 (71.0%) | 43 (29.0%) |
| Total (Overall) | 402 (58.3%) | 288 (41.7%) |
Employment Industries by Sex in Scottville
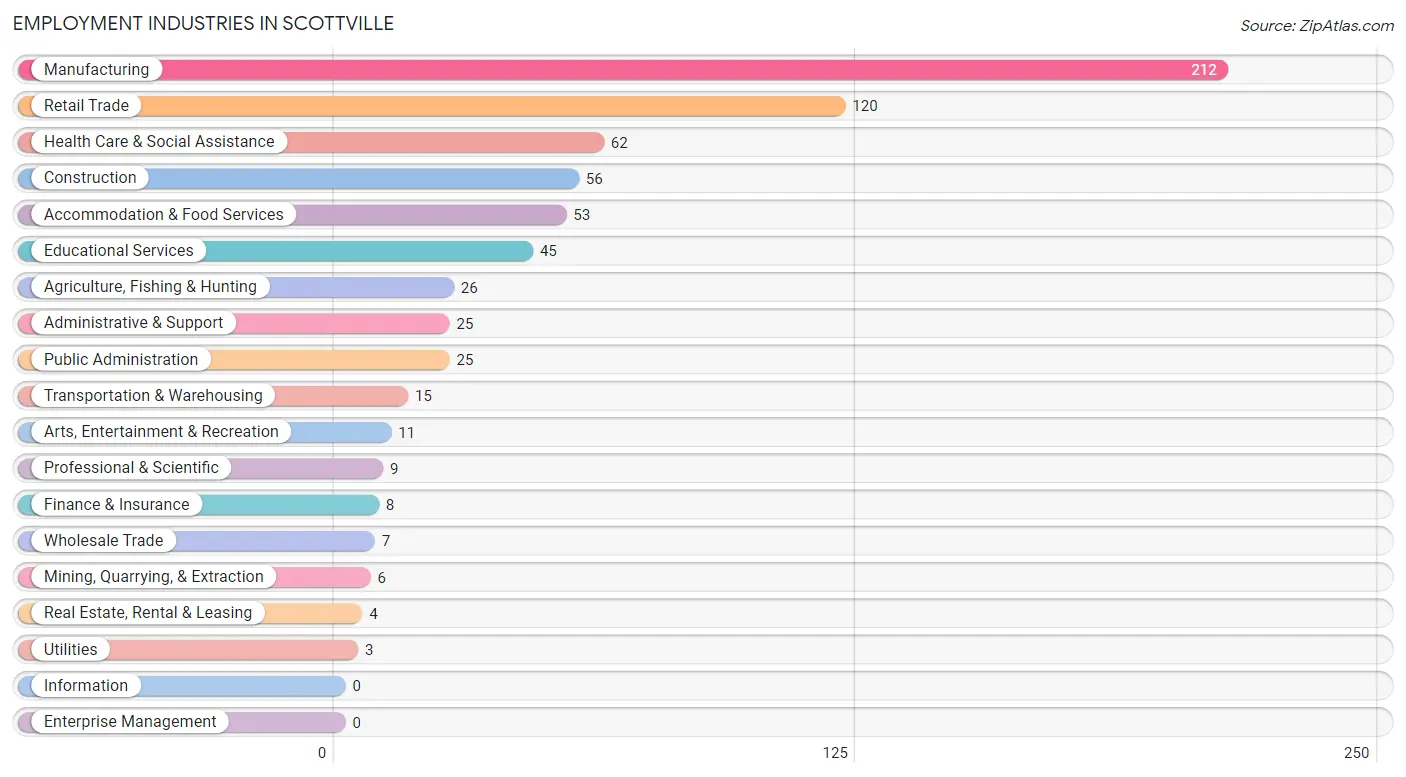
Employment Industries in Scottville
The major employment industries in Scottville include Manufacturing (212 | 30.7%), Retail Trade (120 | 17.4%), Health Care & Social Assistance (62 | 9.0%), Construction (56 | 8.1%), and Accommodation & Food Services (53 | 7.7%).
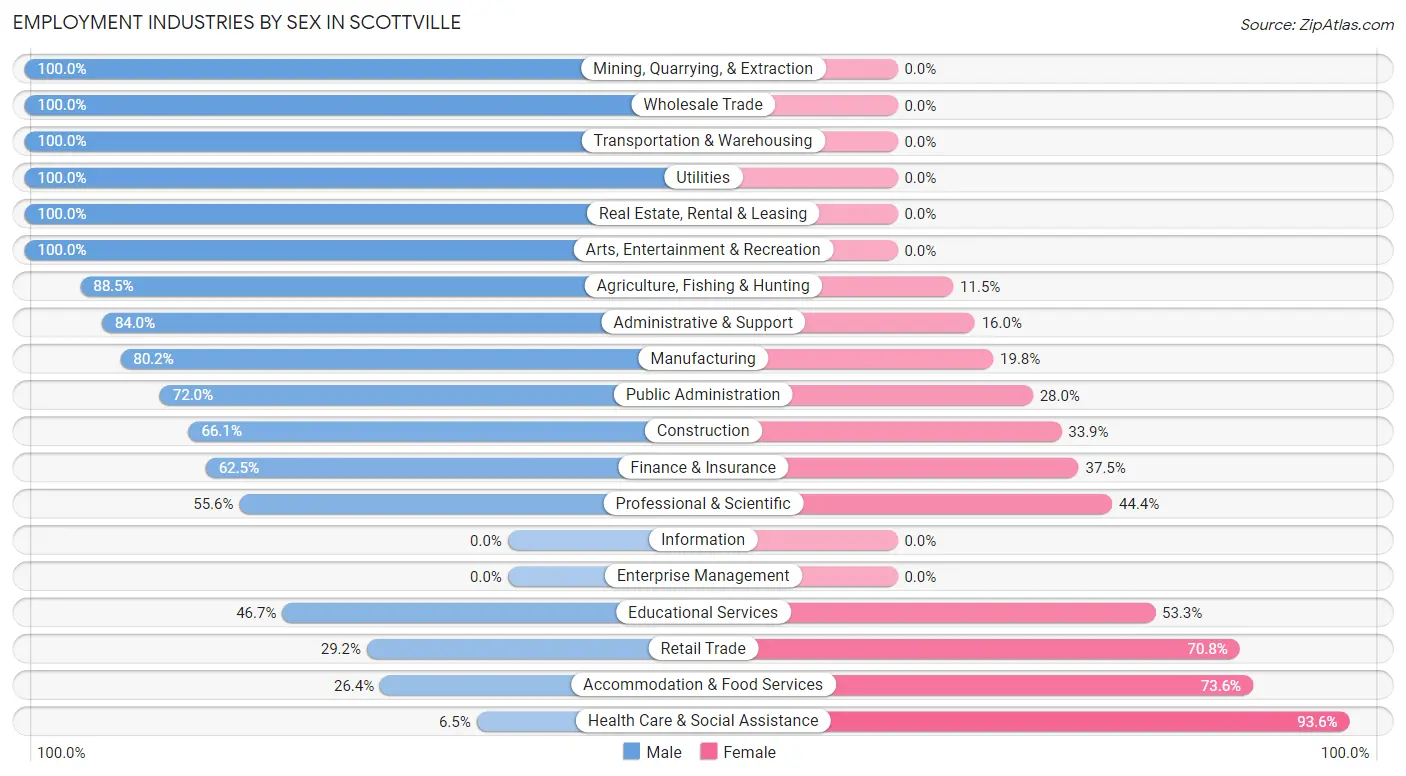
Employment Industries by Sex in Scottville
The Scottville industries that see more men than women are Mining, Quarrying, & Extraction (100.0%), Wholesale Trade (100.0%), and Transportation & Warehousing (100.0%), whereas the industries that tend to have a higher number of women are Health Care & Social Assistance (93.5%), Accommodation & Food Services (73.6%), and Retail Trade (70.8%).
| Industry | Male | Female |
| Agriculture, Fishing & Hunting | 23 (88.5%) | 3 (11.5%) |
| Mining, Quarrying, & Extraction | 6 (100.0%) | 0 (0.0%) |
| Construction | 37 (66.1%) | 19 (33.9%) |
| Manufacturing | 170 (80.2%) | 42 (19.8%) |
| Wholesale Trade | 7 (100.0%) | 0 (0.0%) |
| Retail Trade | 35 (29.2%) | 85 (70.8%) |
| Transportation & Warehousing | 15 (100.0%) | 0 (0.0%) |
| Utilities | 3 (100.0%) | 0 (0.0%) |
| Information | 0 (0.0%) | 0 (0.0%) |
| Finance & Insurance | 5 (62.5%) | 3 (37.5%) |
| Real Estate, Rental & Leasing | 4 (100.0%) | 0 (0.0%) |
| Professional & Scientific | 5 (55.6%) | 4 (44.4%) |
| Enterprise Management | 0 (0.0%) | 0 (0.0%) |
| Administrative & Support | 21 (84.0%) | 4 (16.0%) |
| Educational Services | 21 (46.7%) | 24 (53.3%) |
| Health Care & Social Assistance | 4 (6.5%) | 58 (93.5%) |
| Arts, Entertainment & Recreation | 11 (100.0%) | 0 (0.0%) |
| Accommodation & Food Services | 14 (26.4%) | 39 (73.6%) |
| Public Administration | 18 (72.0%) | 7 (28.0%) |
| Total | 402 (58.3%) | 288 (41.7%) |
Education in Scottville
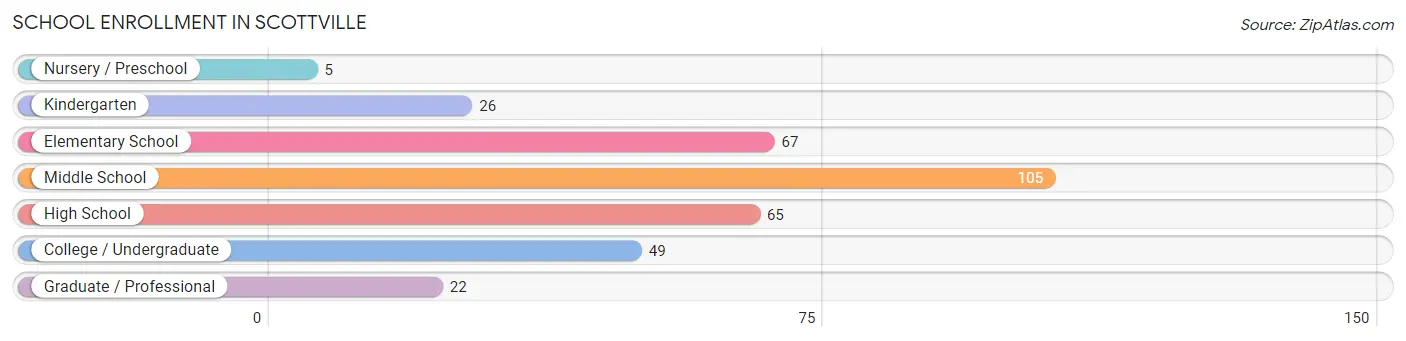
School Enrollment in Scottville
The most common levels of schooling among the 339 students in Scottville are middle school (105 | 31.0%), elementary school (67 | 19.8%), and high school (65 | 19.2%).
| School Level | # Students | % Students |
| Nursery / Preschool | 5 | 1.5% |
| Kindergarten | 26 | 7.7% |
| Elementary School | 67 | 19.8% |
| Middle School | 105 | 31.0% |
| High School | 65 | 19.2% |
| College / Undergraduate | 49 | 14.4% |
| Graduate / Professional | 22 | 6.5% |
| Total | 339 | 100.0% |
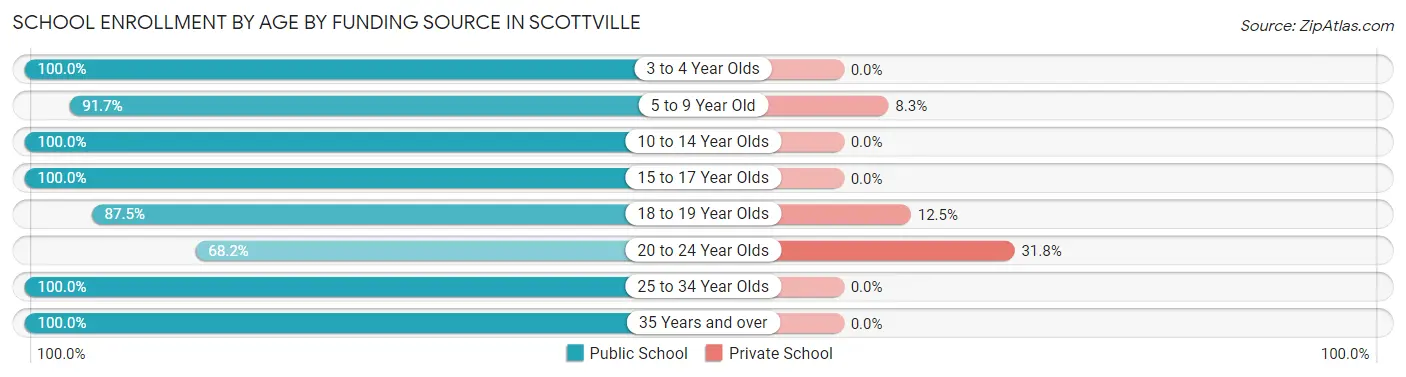
School Enrollment by Age by Funding Source in Scottville
Out of a total of 339 students who are enrolled in schools in Scottville, 16 (4.7%) attend a private institution, while the remaining 323 (95.3%) are enrolled in public schools. The age group of 20 to 24 year olds has the highest likelihood of being enrolled in private schools, with 7 (31.8% in the age bracket) enrolled. Conversely, the age group of 3 to 4 year olds has the lowest likelihood of being enrolled in a private school, with 9 (100.0% in the age bracket) attending a public institution.
| Age Bracket | Public School | Private School |
| 3 to 4 Year Olds | 9 (100.0%) | 0 (0.0%) |
| 5 to 9 Year Old | 77 (91.7%) | 7 (8.3%) |
| 10 to 14 Year Olds | 130 (100.0%) | 0 (0.0%) |
| 15 to 17 Year Olds | 37 (100.0%) | 0 (0.0%) |
| 18 to 19 Year Olds | 14 (87.5%) | 2 (12.5%) |
| 20 to 24 Year Olds | 15 (68.2%) | 7 (31.8%) |
| 25 to 34 Year Olds | 28 (100.0%) | 0 (0.0%) |
| 35 Years and over | 13 (100.0%) | 0 (0.0%) |
| Total | 323 (95.3%) | 16 (4.7%) |
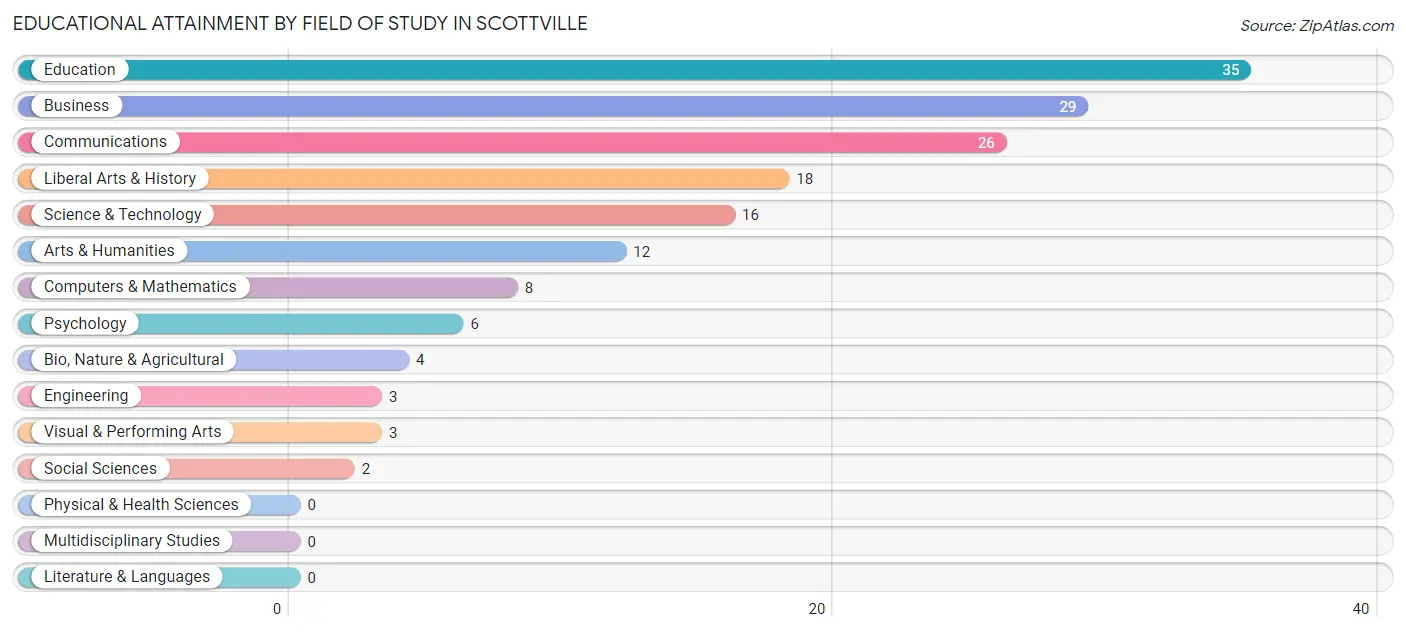
Educational Attainment by Field of Study in Scottville
Education (35 | 21.6%), business (29 | 17.9%), communications (26 | 16.1%), liberal arts & history (18 | 11.1%), and science & technology (16 | 9.9%) are the most common fields of study among 162 individuals in Scottville who have obtained a bachelor's degree or higher.
| Field of Study | # Graduates | % Graduates |
| Computers & Mathematics | 8 | 4.9% |
| Bio, Nature & Agricultural | 4 | 2.5% |
| Physical & Health Sciences | 0 | 0.0% |
| Psychology | 6 | 3.7% |
| Social Sciences | 2 | 1.2% |
| Engineering | 3 | 1.8% |
| Multidisciplinary Studies | 0 | 0.0% |
| Science & Technology | 16 | 9.9% |
| Business | 29 | 17.9% |
| Education | 35 | 21.6% |
| Literature & Languages | 0 | 0.0% |
| Liberal Arts & History | 18 | 11.1% |
| Visual & Performing Arts | 3 | 1.8% |
| Communications | 26 | 16.1% |
| Arts & Humanities | 12 | 7.4% |
| Total | 162 | 100.0% |
Transportation & Commute in Scottville
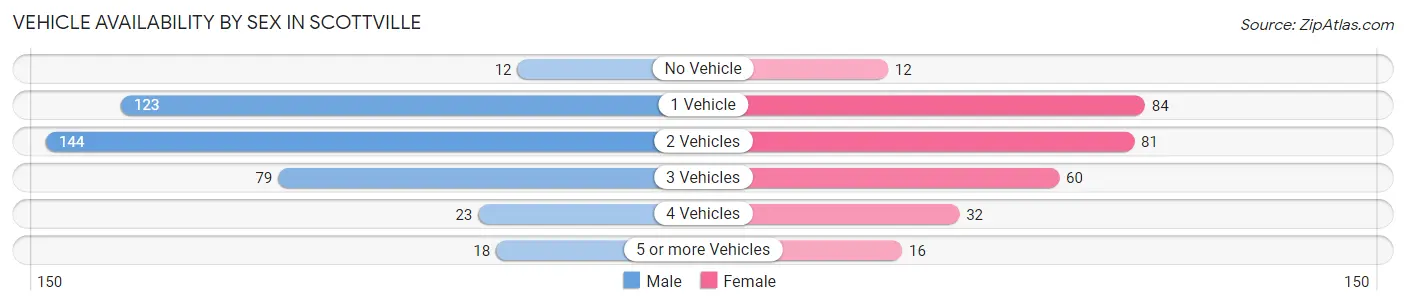
Vehicle Availability by Sex in Scottville
The most prevalent vehicle ownership categories in Scottville are males with 2 vehicles (144, accounting for 36.1%) and females with 2 vehicles (81, making up 50.5%).
| Vehicles Available | Male | Female |
| No Vehicle | 12 (3.0%) | 12 (4.2%) |
| 1 Vehicle | 123 (30.8%) | 84 (29.5%) |
| 2 Vehicles | 144 (36.1%) | 81 (28.4%) |
| 3 Vehicles | 79 (19.8%) | 60 (21.0%) |
| 4 Vehicles | 23 (5.8%) | 32 (11.2%) |
| 5 or more Vehicles | 18 (4.5%) | 16 (5.6%) |
| Total | 399 (100.0%) | 285 (100.0%) |
Commute Time in Scottville
The most frequently occuring commute durations in Scottville are 20 to 24 minutes (161 commuters, 25.0%), 15 to 19 minutes (127 commuters, 19.8%), and 10 to 14 minutes (106 commuters, 16.5%).
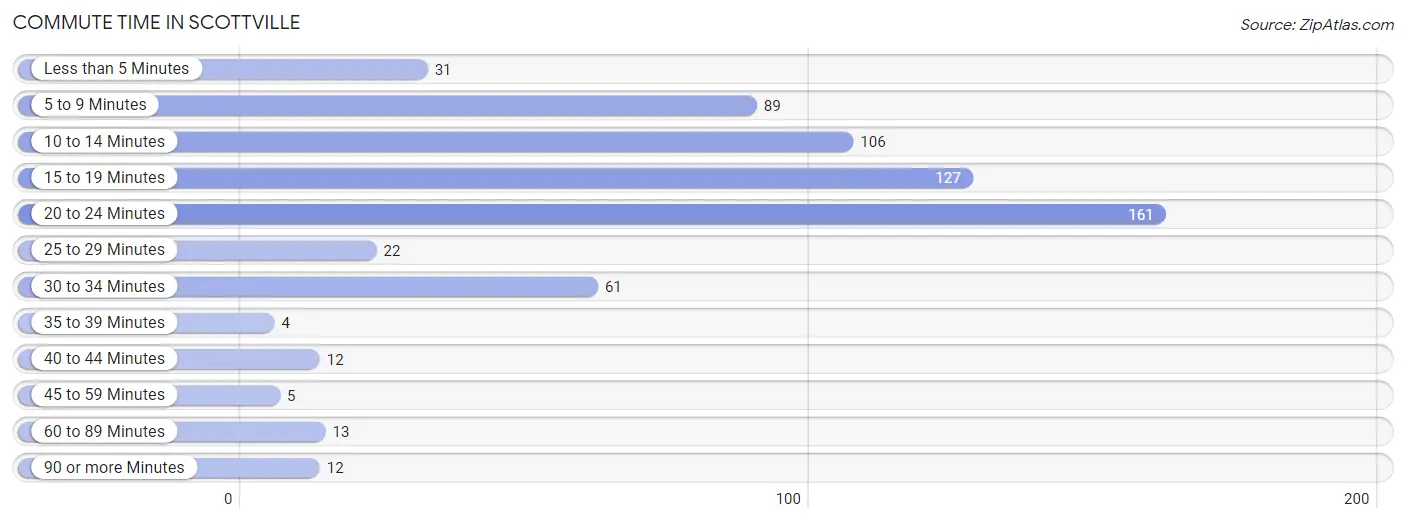
| Commute Time | # Commuters | % Commuters |
| Less than 5 Minutes | 31 | 4.8% |
| 5 to 9 Minutes | 89 | 13.8% |
| 10 to 14 Minutes | 106 | 16.5% |
| 15 to 19 Minutes | 127 | 19.8% |
| 20 to 24 Minutes | 161 | 25.0% |
| 25 to 29 Minutes | 22 | 3.4% |
| 30 to 34 Minutes | 61 | 9.5% |
| 35 to 39 Minutes | 4 | 0.6% |
| 40 to 44 Minutes | 12 | 1.9% |
| 45 to 59 Minutes | 5 | 0.8% |
| 60 to 89 Minutes | 13 | 2.0% |
| 90 or more Minutes | 12 | 1.9% |
Commute Time by Sex in Scottville
The most common commute times in Scottville are 20 to 24 minutes (107 commuters, 27.6%) for males and 10 to 14 minutes (65 commuters, 25.5%) for females.
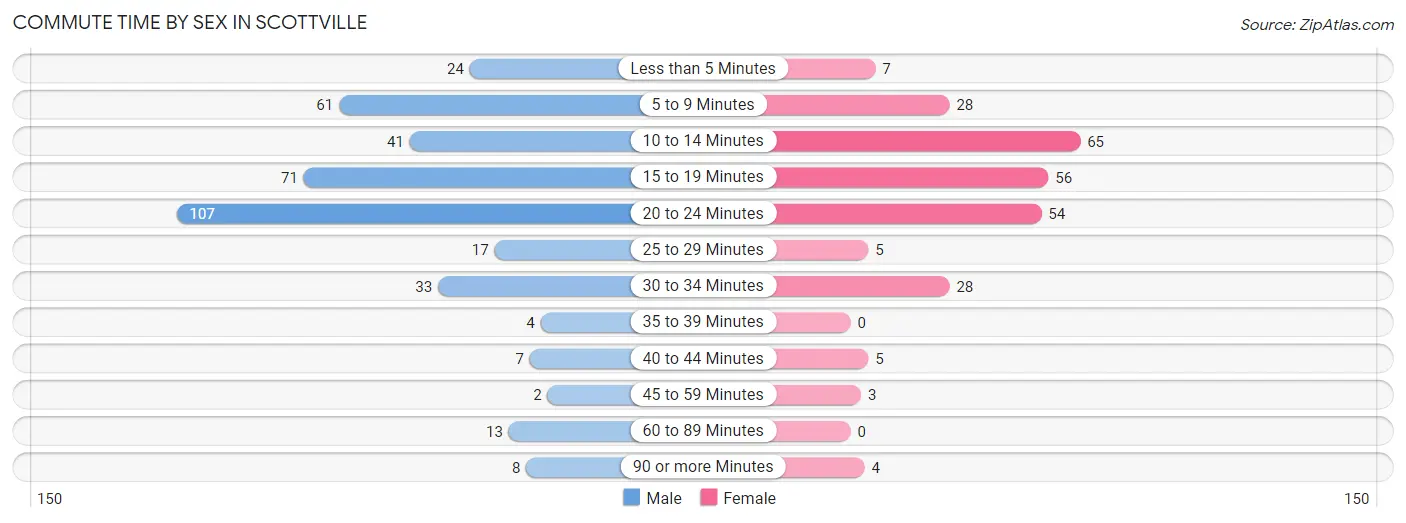
| Commute Time | Male | Female |
| Less than 5 Minutes | 24 (6.2%) | 7 (2.8%) |
| 5 to 9 Minutes | 61 (15.7%) | 28 (11.0%) |
| 10 to 14 Minutes | 41 (10.6%) | 65 (25.5%) |
| 15 to 19 Minutes | 71 (18.3%) | 56 (22.0%) |
| 20 to 24 Minutes | 107 (27.6%) | 54 (21.2%) |
| 25 to 29 Minutes | 17 (4.4%) | 5 (2.0%) |
| 30 to 34 Minutes | 33 (8.5%) | 28 (11.0%) |
| 35 to 39 Minutes | 4 (1.0%) | 0 (0.0%) |
| 40 to 44 Minutes | 7 (1.8%) | 5 (2.0%) |
| 45 to 59 Minutes | 2 (0.5%) | 3 (1.2%) |
| 60 to 89 Minutes | 13 (3.4%) | 0 (0.0%) |
| 90 or more Minutes | 8 (2.1%) | 4 (1.6%) |
Time of Departure to Work by Sex in Scottville
The most frequent times of departure to work in Scottville are 6:30 AM to 6:59 AM (94, 24.2%) for males and 7:30 AM to 7:59 AM (50, 19.6%) for females.
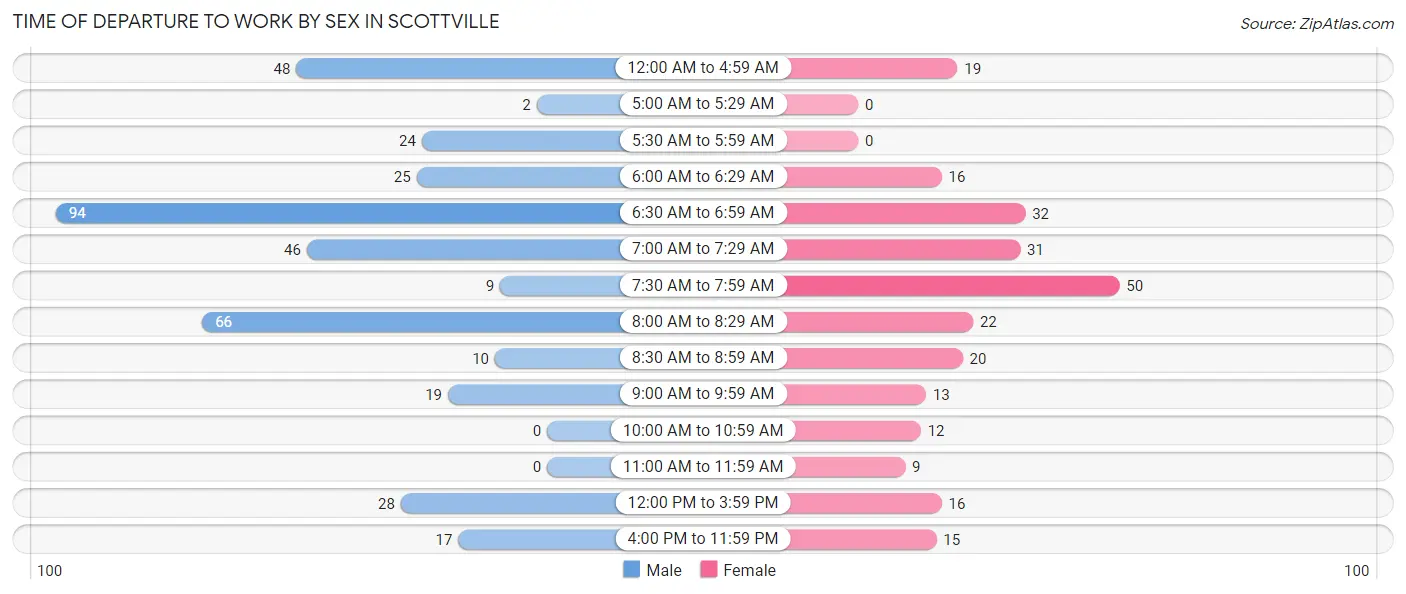
| Time of Departure | Male | Female |
| 12:00 AM to 4:59 AM | 48 (12.4%) | 19 (7.4%) |
| 5:00 AM to 5:29 AM | 2 (0.5%) | 0 (0.0%) |
| 5:30 AM to 5:59 AM | 24 (6.2%) | 0 (0.0%) |
| 6:00 AM to 6:29 AM | 25 (6.4%) | 16 (6.3%) |
| 6:30 AM to 6:59 AM | 94 (24.2%) | 32 (12.6%) |
| 7:00 AM to 7:29 AM | 46 (11.9%) | 31 (12.2%) |
| 7:30 AM to 7:59 AM | 9 (2.3%) | 50 (19.6%) |
| 8:00 AM to 8:29 AM | 66 (17.0%) | 22 (8.6%) |
| 8:30 AM to 8:59 AM | 10 (2.6%) | 20 (7.8%) |
| 9:00 AM to 9:59 AM | 19 (4.9%) | 13 (5.1%) |
| 10:00 AM to 10:59 AM | 0 (0.0%) | 12 (4.7%) |
| 11:00 AM to 11:59 AM | 0 (0.0%) | 9 (3.5%) |
| 12:00 PM to 3:59 PM | 28 (7.2%) | 16 (6.3%) |
| 4:00 PM to 11:59 PM | 17 (4.4%) | 15 (5.9%) |
| Total | 388 (100.0%) | 255 (100.0%) |
Housing Occupancy in Scottville
Occupancy by Ownership in Scottville
Of the total 570 dwellings in Scottville, owner-occupied units account for 321 (56.3%), while renter-occupied units make up 249 (43.7%).
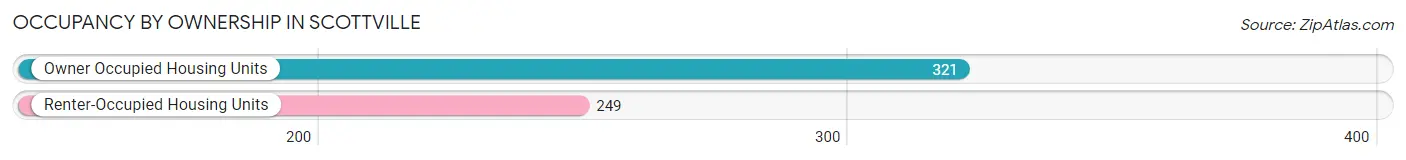
| Occupancy | # Housing Units | % Housing Units |
| Owner Occupied Housing Units | 321 | 56.3% |
| Renter-Occupied Housing Units | 249 | 43.7% |
| Total Occupied Housing Units | 570 | 100.0% |
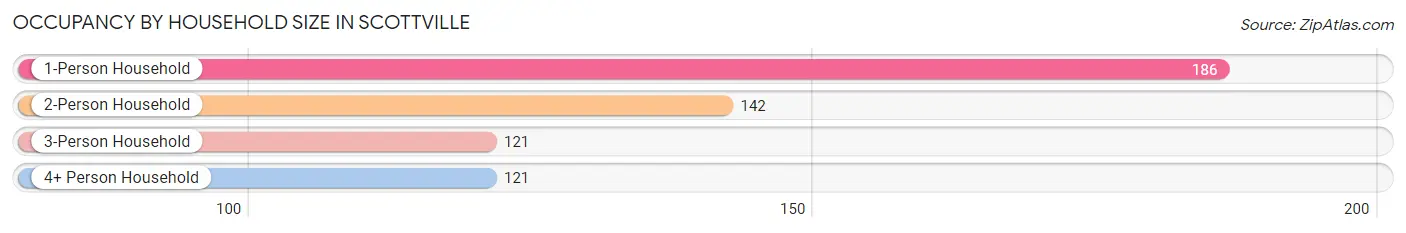
Occupancy by Household Size in Scottville
| Household Size | # Housing Units | % Housing Units |
| 1-Person Household | 186 | 32.6% |
| 2-Person Household | 142 | 24.9% |
| 3-Person Household | 121 | 21.2% |
| 4+ Person Household | 121 | 21.2% |
| Total Housing Units | 570 | 100.0% |
Occupancy by Ownership by Household Size in Scottville
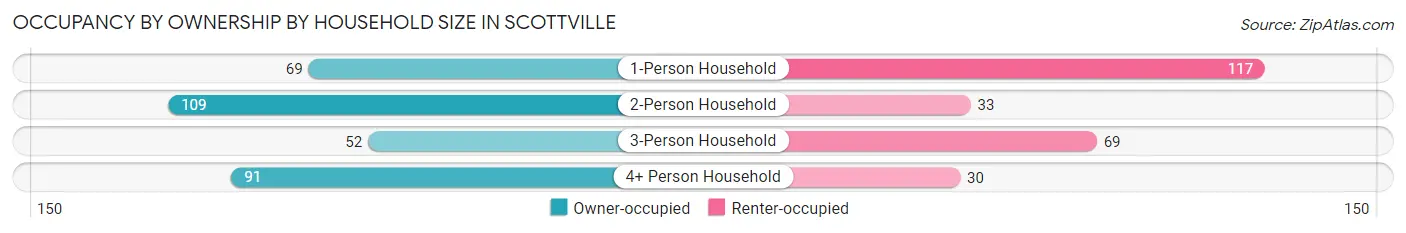
| Household Size | Owner-occupied | Renter-occupied |
| 1-Person Household | 69 (37.1%) | 117 (62.9%) |
| 2-Person Household | 109 (76.8%) | 33 (23.2%) |
| 3-Person Household | 52 (43.0%) | 69 (57.0%) |
| 4+ Person Household | 91 (75.2%) | 30 (24.8%) |
| Total Housing Units | 321 (56.3%) | 249 (43.7%) |
Occupancy by Educational Attainment in Scottville
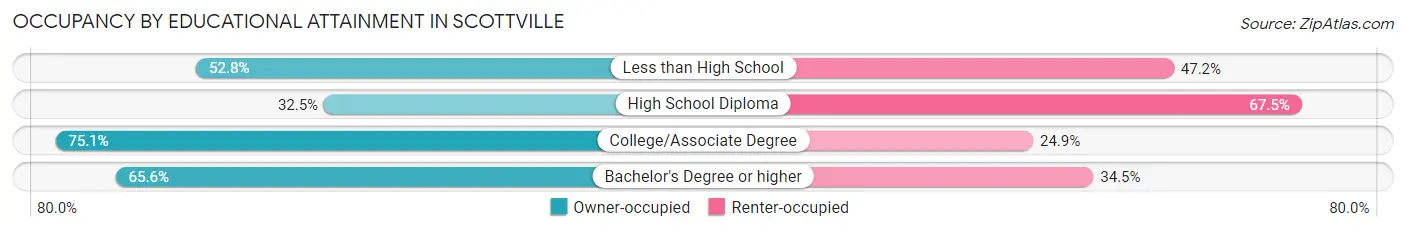
| Household Size | Owner-occupied | Renter-occupied |
| Less than High School | 19 (52.8%) | 17 (47.2%) |
| High School Diploma | 67 (32.5%) | 139 (67.5%) |
| College/Associate Degree | 157 (75.1%) | 52 (24.9%) |
| Bachelor's Degree or higher | 78 (65.5%) | 41 (34.4%) |
Occupancy by Age of Householder in Scottville
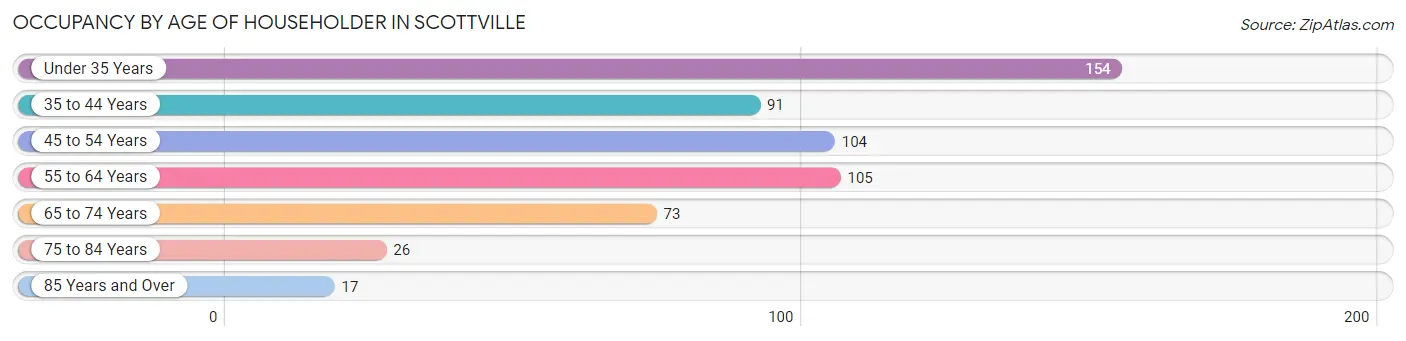
| Age Bracket | # Households | % Households |
| Under 35 Years | 154 | 27.0% |
| 35 to 44 Years | 91 | 16.0% |
| 45 to 54 Years | 104 | 18.2% |
| 55 to 64 Years | 105 | 18.4% |
| 65 to 74 Years | 73 | 12.8% |
| 75 to 84 Years | 26 | 4.6% |
| 85 Years and Over | 17 | 3.0% |
| Total | 570 | 100.0% |
Housing Finances in Scottville
Median Income by Occupancy in Scottville
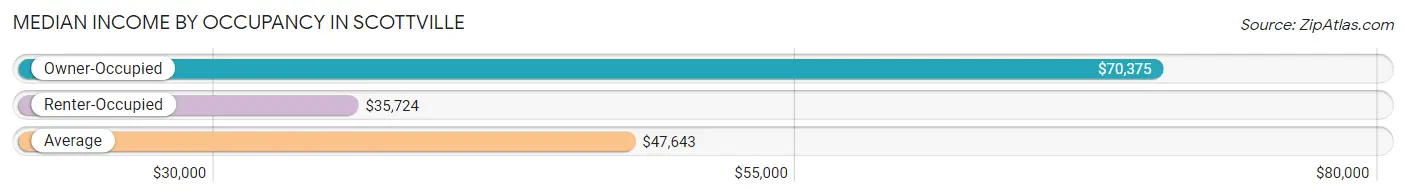
| Occupancy Type | # Households | Median Income |
| Owner-Occupied | 321 (56.3%) | $70,375 |
| Renter-Occupied | 249 (43.7%) | $35,724 |
| Average | 570 (100.0%) | $47,643 |
Occupancy by Householder Income Bracket in Scottville
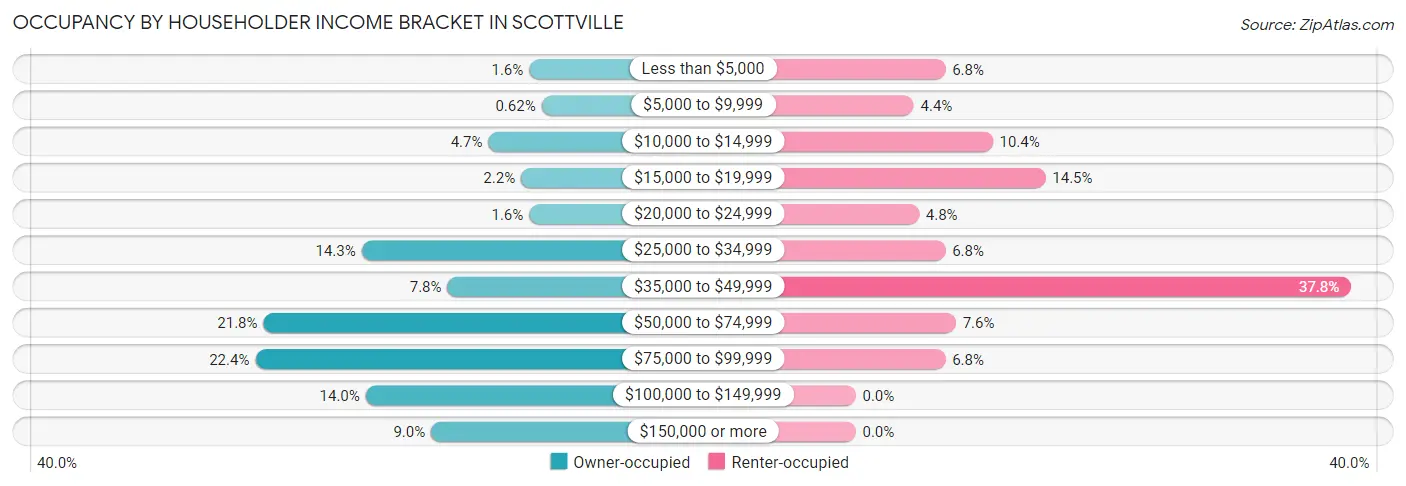
| Income Bracket | Owner-occupied | Renter-occupied |
| Less than $5,000 | 5 (1.6%) | 17 (6.8%) |
| $5,000 to $9,999 | 2 (0.6%) | 11 (4.4%) |
| $10,000 to $14,999 | 15 (4.7%) | 26 (10.4%) |
| $15,000 to $19,999 | 7 (2.2%) | 36 (14.5%) |
| $20,000 to $24,999 | 5 (1.6%) | 12 (4.8%) |
| $25,000 to $34,999 | 46 (14.3%) | 17 (6.8%) |
| $35,000 to $49,999 | 25 (7.8%) | 94 (37.8%) |
| $50,000 to $74,999 | 70 (21.8%) | 19 (7.6%) |
| $75,000 to $99,999 | 72 (22.4%) | 17 (6.8%) |
| $100,000 to $149,999 | 45 (14.0%) | 0 (0.0%) |
| $150,000 or more | 29 (9.0%) | 0 (0.0%) |
| Total | 321 (100.0%) | 249 (100.0%) |
Monthly Housing Cost Tiers in Scottville
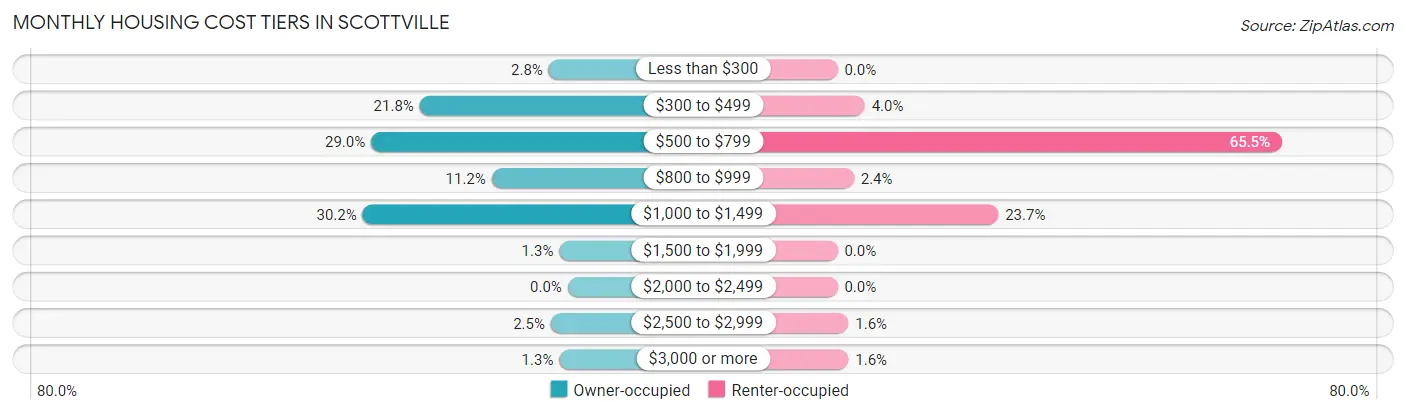
| Monthly Cost | Owner-occupied | Renter-occupied |
| Less than $300 | 9 (2.8%) | 0 (0.0%) |
| $300 to $499 | 70 (21.8%) | 10 (4.0%) |
| $500 to $799 | 93 (29.0%) | 163 (65.5%) |
| $800 to $999 | 36 (11.2%) | 6 (2.4%) |
| $1,000 to $1,499 | 97 (30.2%) | 59 (23.7%) |
| $1,500 to $1,999 | 4 (1.3%) | 0 (0.0%) |
| $2,000 to $2,499 | 0 (0.0%) | 0 (0.0%) |
| $2,500 to $2,999 | 8 (2.5%) | 4 (1.6%) |
| $3,000 or more | 4 (1.3%) | 4 (1.6%) |
| Total | 321 (100.0%) | 249 (100.0%) |
Physical Housing Characteristics in Scottville
Housing Structures in Scottville
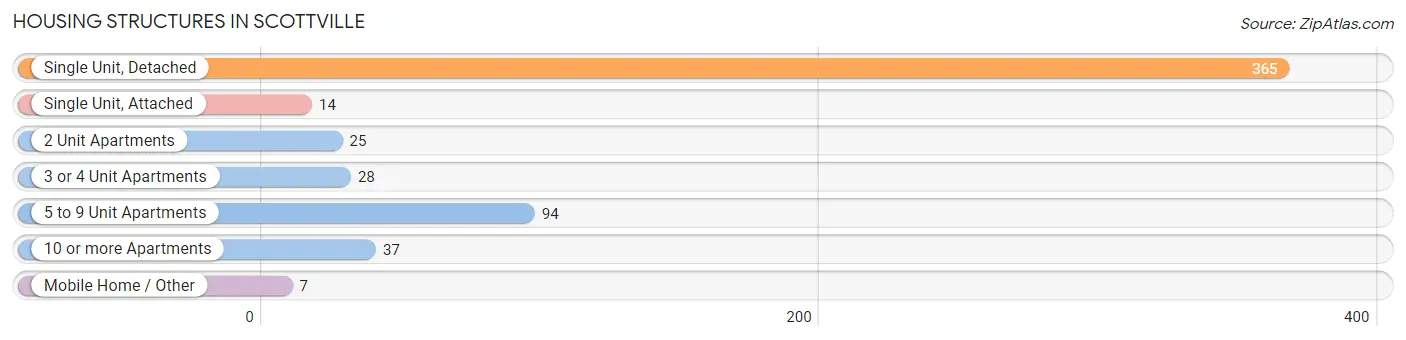
| Structure Type | # Housing Units | % Housing Units |
| Single Unit, Detached | 365 | 64.0% |
| Single Unit, Attached | 14 | 2.5% |
| 2 Unit Apartments | 25 | 4.4% |
| 3 or 4 Unit Apartments | 28 | 4.9% |
| 5 to 9 Unit Apartments | 94 | 16.5% |
| 10 or more Apartments | 37 | 6.5% |
| Mobile Home / Other | 7 | 1.2% |
| Total | 570 | 100.0% |
Housing Structures by Occupancy in Scottville
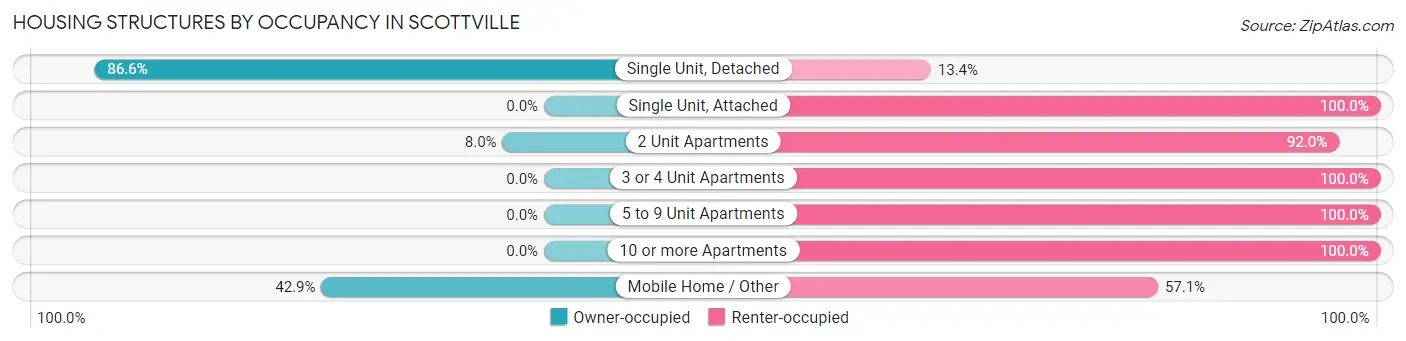
| Structure Type | Owner-occupied | Renter-occupied |
| Single Unit, Detached | 316 (86.6%) | 49 (13.4%) |
| Single Unit, Attached | 0 (0.0%) | 14 (100.0%) |
| 2 Unit Apartments | 2 (8.0%) | 23 (92.0%) |
| 3 or 4 Unit Apartments | 0 (0.0%) | 28 (100.0%) |
| 5 to 9 Unit Apartments | 0 (0.0%) | 94 (100.0%) |
| 10 or more Apartments | 0 (0.0%) | 37 (100.0%) |
| Mobile Home / Other | 3 (42.9%) | 4 (57.1%) |
| Total | 321 (56.3%) | 249 (43.7%) |
Housing Structures by Number of Rooms in Scottville
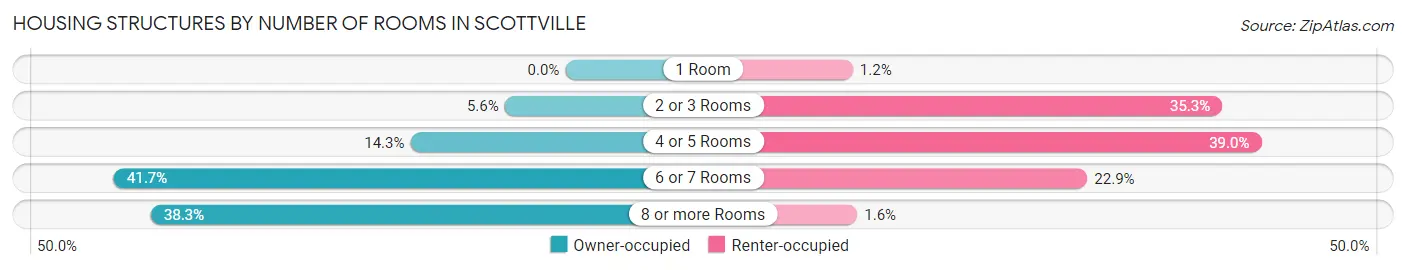
| Number of Rooms | Owner-occupied | Renter-occupied |
| 1 Room | 0 (0.0%) | 3 (1.2%) |
| 2 or 3 Rooms | 18 (5.6%) | 88 (35.3%) |
| 4 or 5 Rooms | 46 (14.3%) | 97 (39.0%) |
| 6 or 7 Rooms | 134 (41.7%) | 57 (22.9%) |
| 8 or more Rooms | 123 (38.3%) | 4 (1.6%) |
| Total | 321 (100.0%) | 249 (100.0%) |
Housing Structure by Heating Type in Scottville
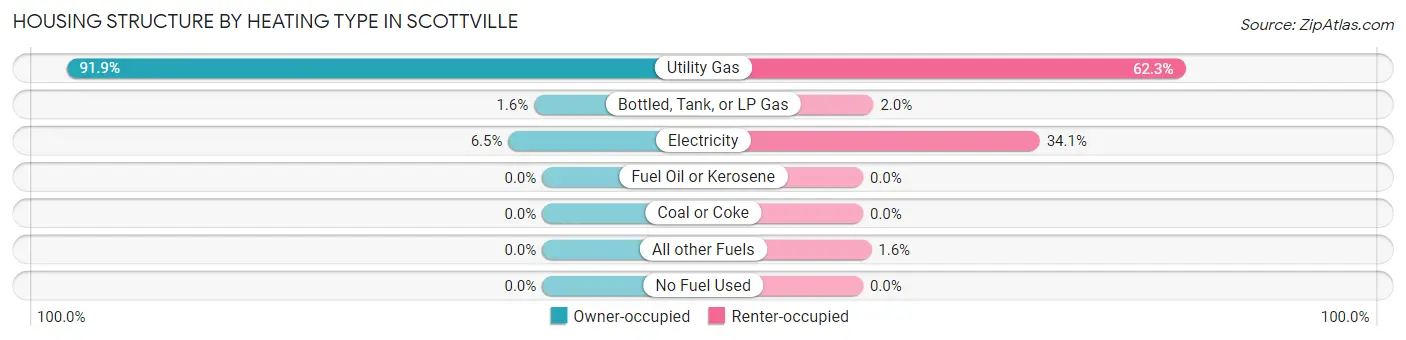
| Heating Type | Owner-occupied | Renter-occupied |
| Utility Gas | 295 (91.9%) | 155 (62.3%) |
| Bottled, Tank, or LP Gas | 5 (1.6%) | 5 (2.0%) |
| Electricity | 21 (6.5%) | 85 (34.1%) |
| Fuel Oil or Kerosene | 0 (0.0%) | 0 (0.0%) |
| Coal or Coke | 0 (0.0%) | 0 (0.0%) |
| All other Fuels | 0 (0.0%) | 4 (1.6%) |
| No Fuel Used | 0 (0.0%) | 0 (0.0%) |
| Total | 321 (100.0%) | 249 (100.0%) |
Household Vehicle Usage in Scottville
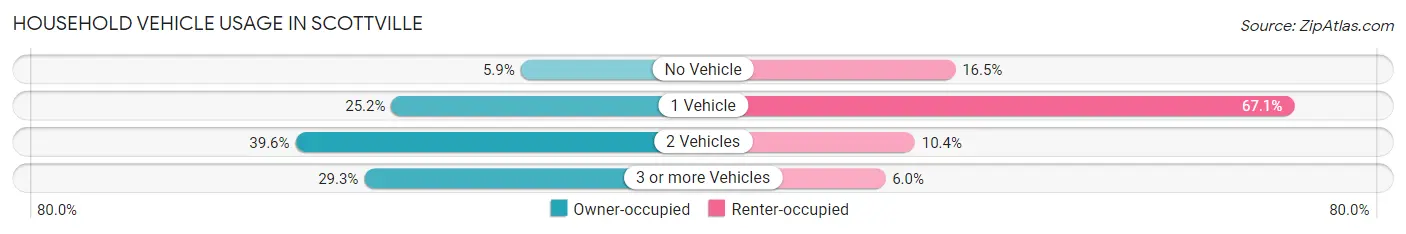
| Vehicles per Household | Owner-occupied | Renter-occupied |
| No Vehicle | 19 (5.9%) | 41 (16.5%) |
| 1 Vehicle | 81 (25.2%) | 167 (67.1%) |
| 2 Vehicles | 127 (39.6%) | 26 (10.4%) |
| 3 or more Vehicles | 94 (29.3%) | 15 (6.0%) |
| Total | 321 (100.0%) | 249 (100.0%) |
Real Estate & Mortgages in Scottville
Real Estate and Mortgage Overview in Scottville
| Characteristic | Without Mortgage | With Mortgage |
| Housing Units | 142 | 179 |
| Median Property Value | $107,300 | $117,600 |
| Median Household Income | $51,053 | $22 |
| Monthly Housing Costs | $483 | $4 |
| Real Estate Taxes | $2,043 | $14 |
Property Value by Mortgage Status in Scottville
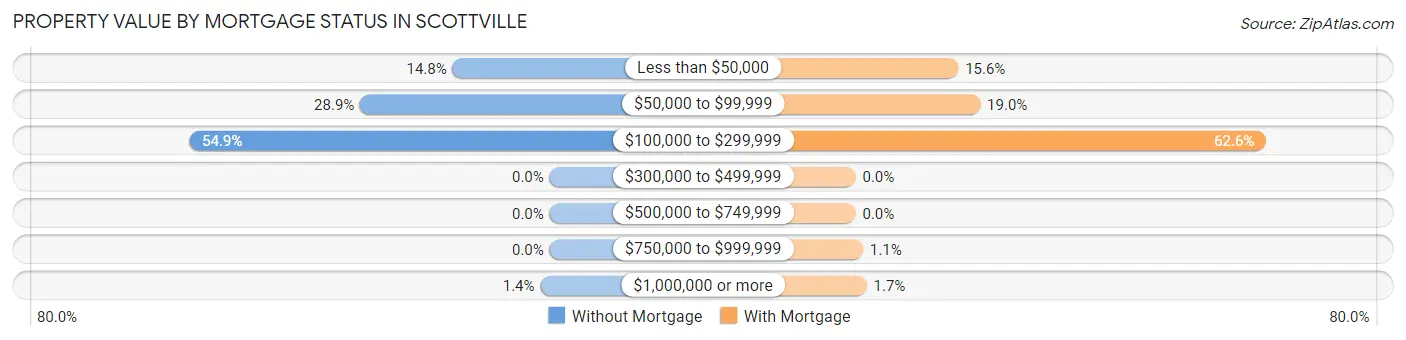
| Property Value | Without Mortgage | With Mortgage |
| Less than $50,000 | 21 (14.8%) | 28 (15.6%) |
| $50,000 to $99,999 | 41 (28.9%) | 34 (19.0%) |
| $100,000 to $299,999 | 78 (54.9%) | 112 (62.6%) |
| $300,000 to $499,999 | 0 (0.0%) | 0 (0.0%) |
| $500,000 to $749,999 | 0 (0.0%) | 0 (0.0%) |
| $750,000 to $999,999 | 0 (0.0%) | 2 (1.1%) |
| $1,000,000 or more | 2 (1.4%) | 3 (1.7%) |
| Total | 142 (100.0%) | 179 (100.0%) |
Household Income by Mortgage Status in Scottville
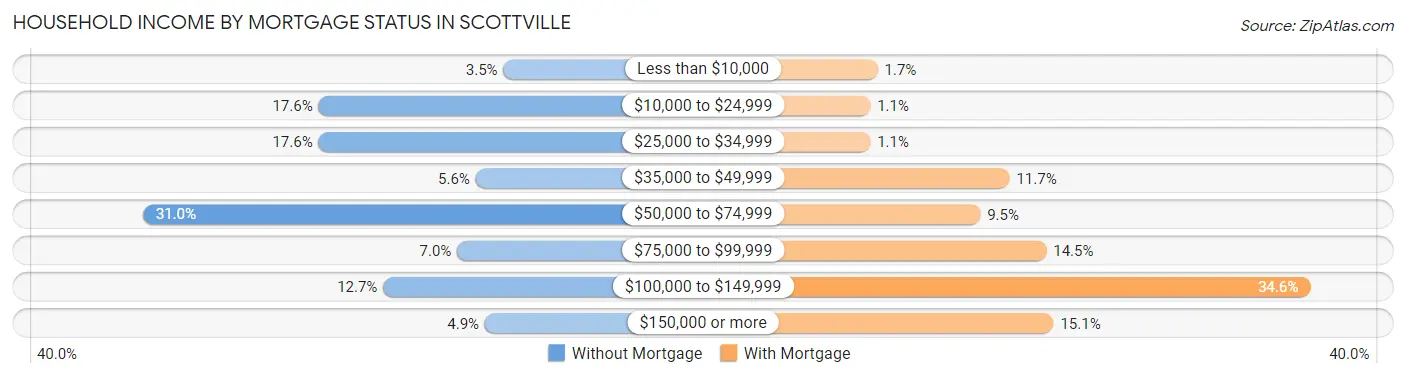
| Household Income | Without Mortgage | With Mortgage |
| Less than $10,000 | 5 (3.5%) | 3 (1.7%) |
| $10,000 to $24,999 | 25 (17.6%) | 2 (1.1%) |
| $25,000 to $34,999 | 25 (17.6%) | 2 (1.1%) |
| $35,000 to $49,999 | 8 (5.6%) | 21 (11.7%) |
| $50,000 to $74,999 | 44 (31.0%) | 17 (9.5%) |
| $75,000 to $99,999 | 10 (7.0%) | 26 (14.5%) |
| $100,000 to $149,999 | 18 (12.7%) | 62 (34.6%) |
| $150,000 or more | 7 (4.9%) | 27 (15.1%) |
| Total | 142 (100.0%) | 179 (100.0%) |
Property Value to Household Income Ratio in Scottville
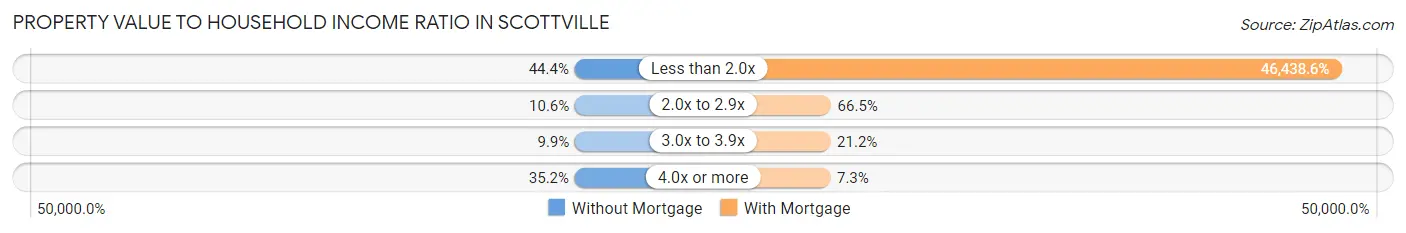
| Value-to-Income Ratio | Without Mortgage | With Mortgage |
| Less than 2.0x | 63 (44.4%) | 83,125 (46,438.5%) |
| 2.0x to 2.9x | 15 (10.6%) | 119 (66.5%) |
| 3.0x to 3.9x | 14 (9.9%) | 38 (21.2%) |
| 4.0x or more | 50 (35.2%) | 13 (7.3%) |
| Total | 142 (100.0%) | 179 (100.0%) |
Real Estate Taxes by Mortgage Status in Scottville
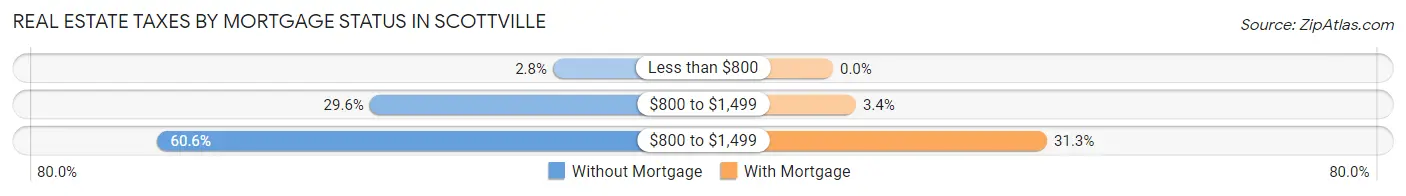
| Property Taxes | Without Mortgage | With Mortgage |
| Less than $800 | 4 (2.8%) | 0 (0.0%) |
| $800 to $1,499 | 42 (29.6%) | 6 (3.4%) |
| $800 to $1,499 | 86 (60.6%) | 56 (31.3%) |
| Total | 142 (100.0%) | 179 (100.0%) |
Health & Disability in Scottville
Health Insurance Coverage by Age in Scottville
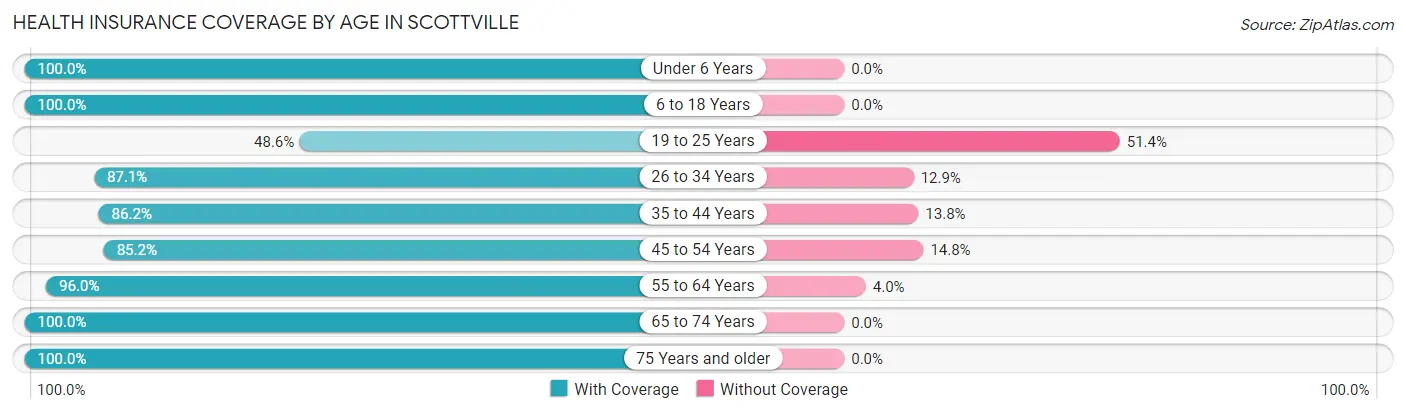
| Age Bracket | With Coverage | Without Coverage |
| Under 6 Years | 114 (100.0%) | 0 (0.0%) |
| 6 to 18 Years | 273 (100.0%) | 0 (0.0%) |
| 19 to 25 Years | 106 (48.6%) | 112 (51.4%) |
| 26 to 34 Years | 148 (87.1%) | 22 (12.9%) |
| 35 to 44 Years | 131 (86.2%) | 21 (13.8%) |
| 45 to 54 Years | 179 (85.2%) | 31 (14.8%) |
| 55 to 64 Years | 167 (96.0%) | 7 (4.0%) |
| 65 to 74 Years | 123 (100.0%) | 0 (0.0%) |
| 75 Years and older | 78 (100.0%) | 0 (0.0%) |
| Total | 1,319 (87.2%) | 193 (12.8%) |
Health Insurance Coverage by Citizenship Status in Scottville
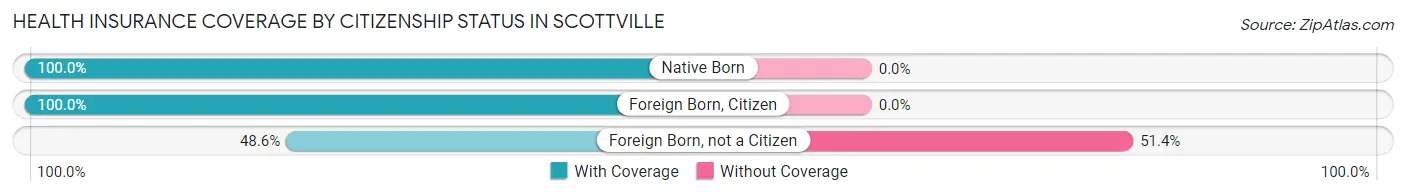
| Citizenship Status | With Coverage | Without Coverage |
| Native Born | 114 (100.0%) | 0 (0.0%) |
| Foreign Born, Citizen | 273 (100.0%) | 0 (0.0%) |
| Foreign Born, not a Citizen | 106 (48.6%) | 112 (51.4%) |
Health Insurance Coverage by Household Income in Scottville
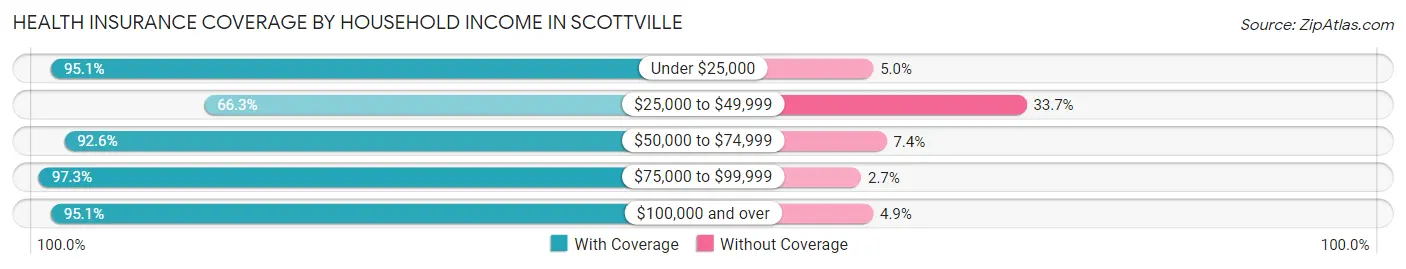
| Household Income | With Coverage | Without Coverage |
| Under $25,000 | 211 (95.1%) | 11 (5.0%) |
| $25,000 to $49,999 | 270 (66.3%) | 137 (33.7%) |
| $50,000 to $74,999 | 274 (92.6%) | 22 (7.4%) |
| $75,000 to $99,999 | 255 (97.3%) | 7 (2.7%) |
| $100,000 and over | 309 (95.1%) | 16 (4.9%) |
Public vs Private Health Insurance Coverage by Age in Scottville
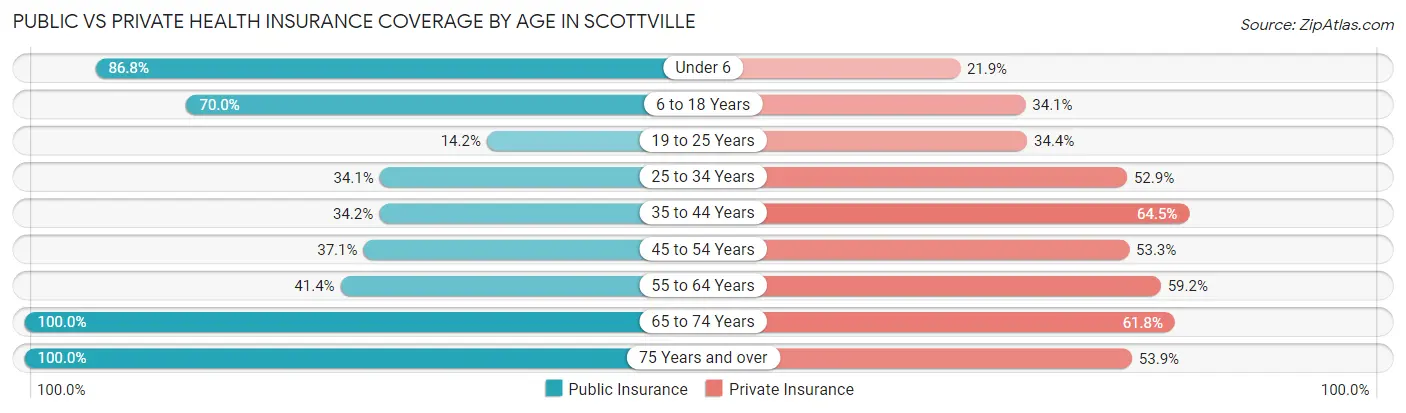
| Age Bracket | Public Insurance | Private Insurance |
| Under 6 | 99 (86.8%) | 25 (21.9%) |
| 6 to 18 Years | 191 (70.0%) | 93 (34.1%) |
| 19 to 25 Years | 31 (14.2%) | 75 (34.4%) |
| 25 to 34 Years | 58 (34.1%) | 90 (52.9%) |
| 35 to 44 Years | 52 (34.2%) | 98 (64.5%) |
| 45 to 54 Years | 78 (37.1%) | 112 (53.3%) |
| 55 to 64 Years | 72 (41.4%) | 103 (59.2%) |
| 65 to 74 Years | 123 (100.0%) | 76 (61.8%) |
| 75 Years and over | 78 (100.0%) | 42 (53.8%) |
| Total | 782 (51.7%) | 714 (47.2%) |
Disability Status by Sex by Age in Scottville
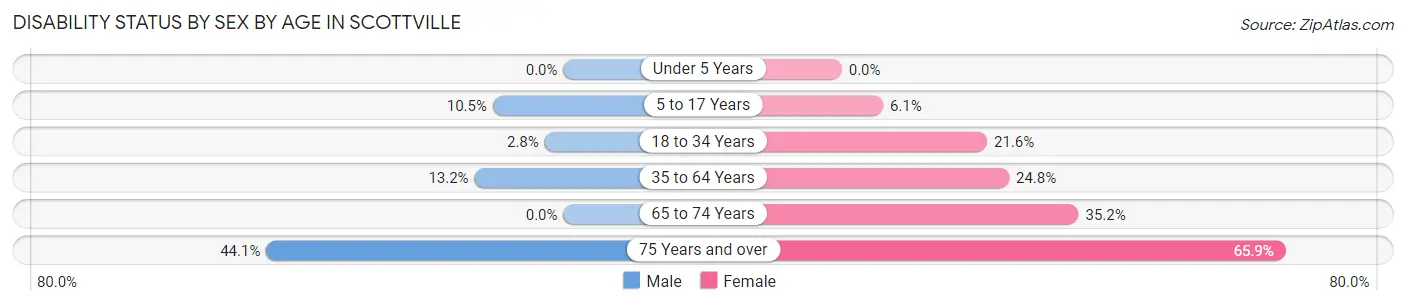
| Age Bracket | Male | Female |
| Under 5 Years | 0 (0.0%) | 0 (0.0%) |
| 5 to 17 Years | 13 (10.5%) | 9 (6.1%) |
| 18 to 34 Years | 7 (2.8%) | 33 (21.6%) |
| 35 to 64 Years | 33 (13.2%) | 71 (24.8%) |
| 65 to 74 Years | 0 (0.0%) | 32 (35.2%) |
| 75 Years and over | 15 (44.1%) | 29 (65.9%) |
Disability Class by Sex by Age in Scottville
Disability Class: Hearing Difficulty
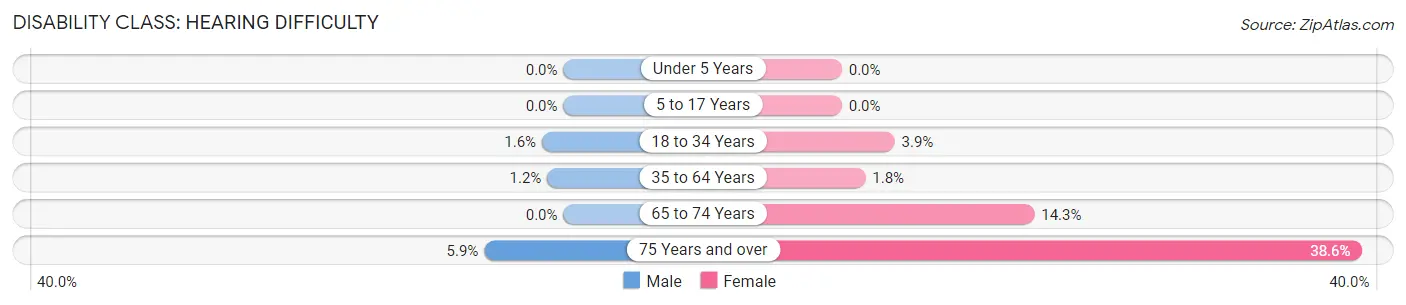
| Age Bracket | Male | Female |
| Under 5 Years | 0 (0.0%) | 0 (0.0%) |
| 5 to 17 Years | 0 (0.0%) | 0 (0.0%) |
| 18 to 34 Years | 4 (1.6%) | 6 (3.9%) |
| 35 to 64 Years | 3 (1.2%) | 5 (1.8%) |
| 65 to 74 Years | 0 (0.0%) | 13 (14.3%) |
| 75 Years and over | 2 (5.9%) | 17 (38.6%) |
Disability Class: Vision Difficulty
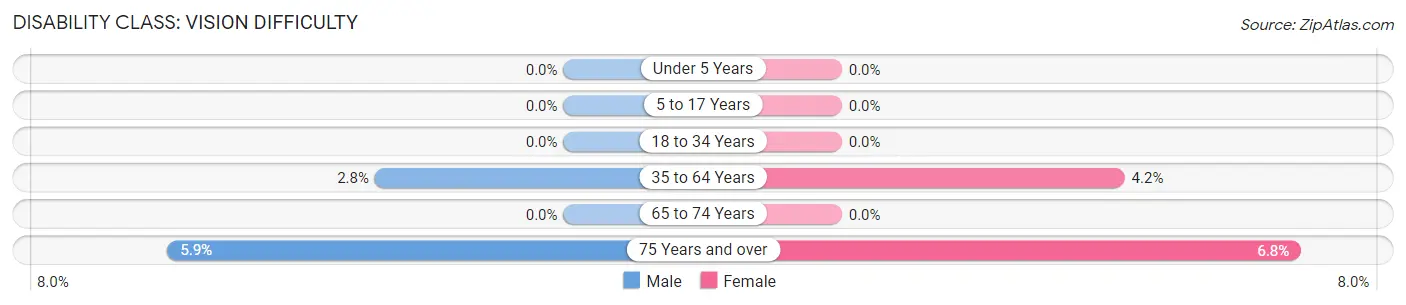
| Age Bracket | Male | Female |
| Under 5 Years | 0 (0.0%) | 0 (0.0%) |
| 5 to 17 Years | 0 (0.0%) | 0 (0.0%) |
| 18 to 34 Years | 0 (0.0%) | 0 (0.0%) |
| 35 to 64 Years | 7 (2.8%) | 12 (4.2%) |
| 65 to 74 Years | 0 (0.0%) | 0 (0.0%) |
| 75 Years and over | 2 (5.9%) | 3 (6.8%) |
Disability Class: Cognitive Difficulty
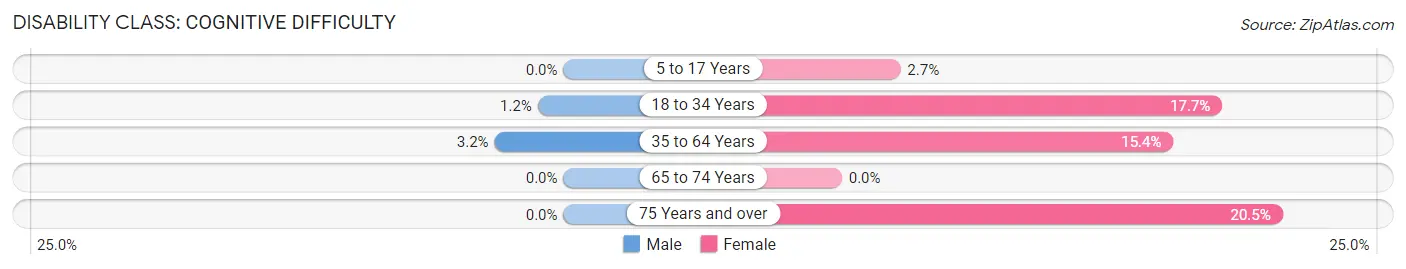
| Age Bracket | Male | Female |
| 5 to 17 Years | 0 (0.0%) | 4 (2.7%) |
| 18 to 34 Years | 3 (1.2%) | 27 (17.6%) |
| 35 to 64 Years | 8 (3.2%) | 44 (15.4%) |
| 65 to 74 Years | 0 (0.0%) | 0 (0.0%) |
| 75 Years and over | 0 (0.0%) | 9 (20.4%) |
Disability Class: Ambulatory Difficulty
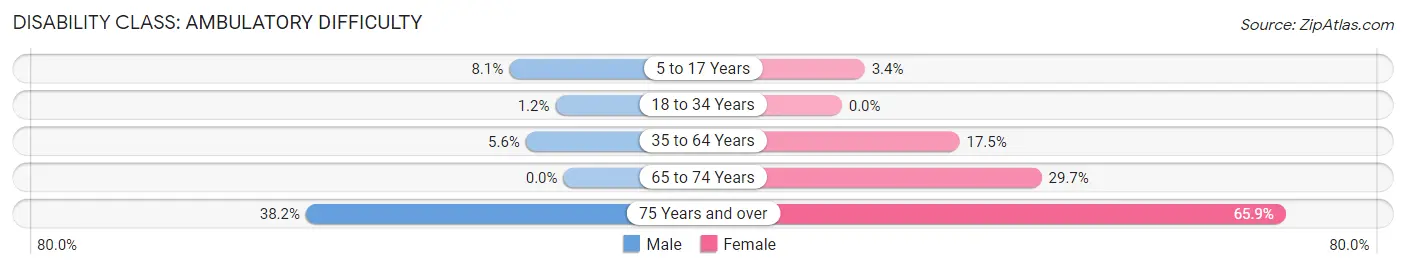
| Age Bracket | Male | Female |
| 5 to 17 Years | 10 (8.1%) | 5 (3.4%) |
| 18 to 34 Years | 3 (1.2%) | 0 (0.0%) |
| 35 to 64 Years | 14 (5.6%) | 50 (17.5%) |
| 65 to 74 Years | 0 (0.0%) | 27 (29.7%) |
| 75 Years and over | 13 (38.2%) | 29 (65.9%) |
Disability Class: Self-Care Difficulty
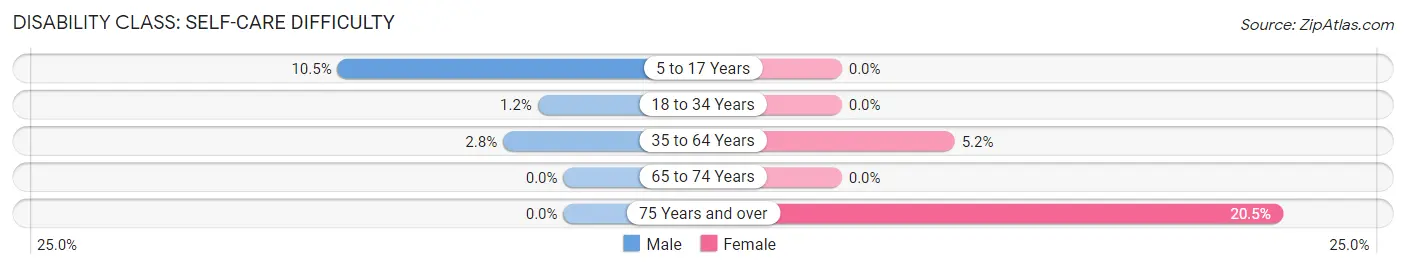
| Age Bracket | Male | Female |
| 5 to 17 Years | 13 (10.5%) | 0 (0.0%) |
| 18 to 34 Years | 3 (1.2%) | 0 (0.0%) |
| 35 to 64 Years | 7 (2.8%) | 15 (5.2%) |
| 65 to 74 Years | 0 (0.0%) | 0 (0.0%) |
| 75 Years and over | 0 (0.0%) | 9 (20.4%) |
Technology Access in Scottville
Computing Device Access in Scottville
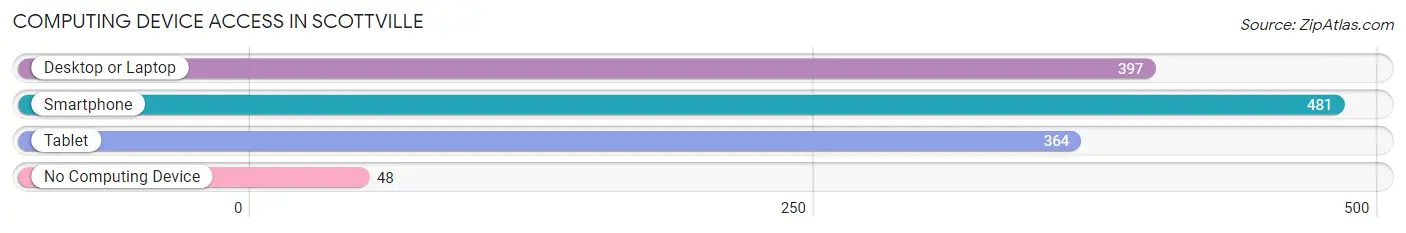
| Device Type | # Households | % Households |
| Desktop or Laptop | 397 | 69.7% |
| Smartphone | 481 | 84.4% |
| Tablet | 364 | 63.9% |
| No Computing Device | 48 | 8.4% |
| Total | 570 | 100.0% |
Internet Access in Scottville
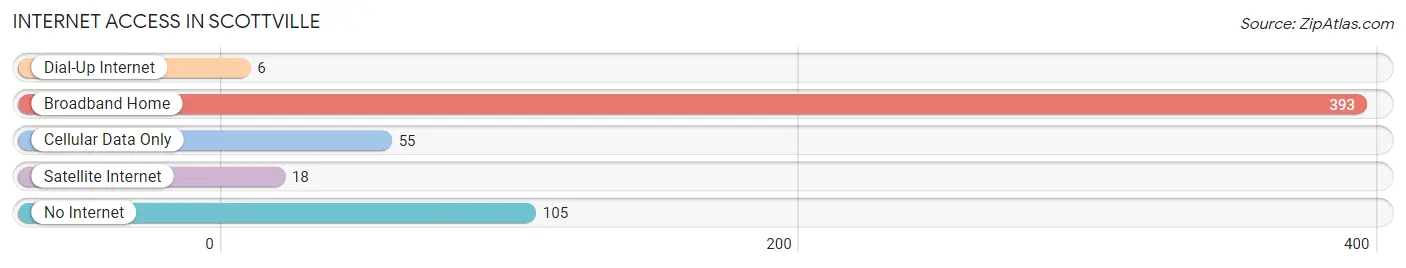
| Internet Type | # Households | % Households |
| Dial-Up Internet | 6 | 1.1% |
| Broadband Home | 393 | 69.0% |
| Cellular Data Only | 55 | 9.7% |
| Satellite Internet | 18 | 3.2% |
| No Internet | 105 | 18.4% |
| Total | 570 | 100.0% |
Scottville Summary
History
Scottville is a small city located in Mason County, Michigan. It is situated on the banks of the Pere Marquette River, and is part of the Ludington metropolitan area. The city was founded in 1871 by William Scott, a lumberman from Ohio. Scott purchased a large tract of land in the area and began to develop it into a town. He named the town after himself, and it quickly grew into a thriving community.
The city of Scottville was incorporated in 1891, and it quickly became a hub for the lumber industry. The city was home to several sawmills, and the lumber industry provided employment for many of the city’s residents. The city also had a thriving agricultural sector, and it was home to several farms and orchards.
In the early 20th century, Scottville began to experience a decline in its lumber industry. This was due to the depletion of the local timber resources, as well as the introduction of new technologies that made it easier to process lumber elsewhere. As a result, the city’s economy shifted to focus more on agriculture and tourism.
Geography
Scottville is located in Mason County, Michigan. It is situated on the banks of the Pere Marquette River, and is part of the Ludington metropolitan area. The city is located approximately 25 miles north of Ludington, and is about 30 miles south of Manistee.
The city has a total area of 2.2 square miles, all of which is land. The terrain is mostly flat, with some rolling hills in the area. The city is located in a temperate climate zone, and experiences four distinct seasons.
Economy
The economy of Scottville is largely based on agriculture and tourism. The city is home to several farms and orchards, and the local agricultural sector provides employment for many of the city’s residents. The city is also home to several tourist attractions, including the Scottville Clown Band Shell, the Scottville Museum, and the Scottville Historical Society.
The city is also home to several small businesses, including restaurants, retail stores, and service providers. The city is served by several major highways, including US-10 and M-37, which provide access to larger cities in the region.
Demographics
As of the 2010 census, the population of Scottville was 1,845. The racial makeup of the city was 95.3% White, 0.7% African American, 0.3% Native American, 0.7% Asian, 0.1% Pacific Islander, 0.7% from other races, and 2.1% from two or more races. Hispanic or Latino of any race were 2.2% of the population.
The median household income in Scottville was $37,917, and the median family income was $45,938. The per capita income for the city was $19,945. About 11.2% of families and 14.2% of the population were below the poverty line, including 19.3% of those under age 18 and 8.2% of those age 65 or over.
Common Questions
What is Per Capita Income in Scottville?
Per Capita income in Scottville is $33,282.
What is the Median Family Income in Scottville?
Median Family Income in Scottville is $62,917.
What is the Median Household income in Scottville?
Median Household Income in Scottville is $47,643.
What is Income or Wage Gap in Scottville?
Income or Wage Gap in Scottville is 37.2%.
Women in Scottville earn 62.8 cents for every dollar earned by a man.
What is Inequality or Gini Index in Scottville?
Inequality or Gini Index in Scottville is 0.54.
What is the Total Population of Scottville?
Total Population of Scottville is 1,512.
What is the Total Male Population of Scottville?
Total Male Population of Scottville is 711.
What is the Total Female Population of Scottville?
Total Female Population of Scottville is 801.
What is the Ratio of Males per 100 Females in Scottville?
There are 88.76 Males per 100 Females in Scottville.
What is the Ratio of Females per 100 Males in Scottville?
There are 112.66 Females per 100 Males in Scottville.
What is the Median Population Age in Scottville?
Median Population Age in Scottville is 33.9 Years.
What is the Average Family Size in Scottville
Average Family Size in Scottville is 3.2 People.
What is the Average Household Size in Scottville
Average Household Size in Scottville is 2.6 People.
How Large is the Labor Force in Scottville?
There are 716 People in the Labor Forcein in Scottville.
What is the Percentage of People in the Labor Force in Scottville?
61.9% of People are in the Labor Force in Scottville.
What is the Unemployment Rate in Scottville?
Unemployment Rate in Scottville is 3.6%.