Zip Codes with the Highest Percentage of Population with a Degree in Liberal Arts and History in Dearborn, MI
RELATED REPORTS & OPTIONS
Liberal Arts and History
Dearborn
Compare Zip Codes
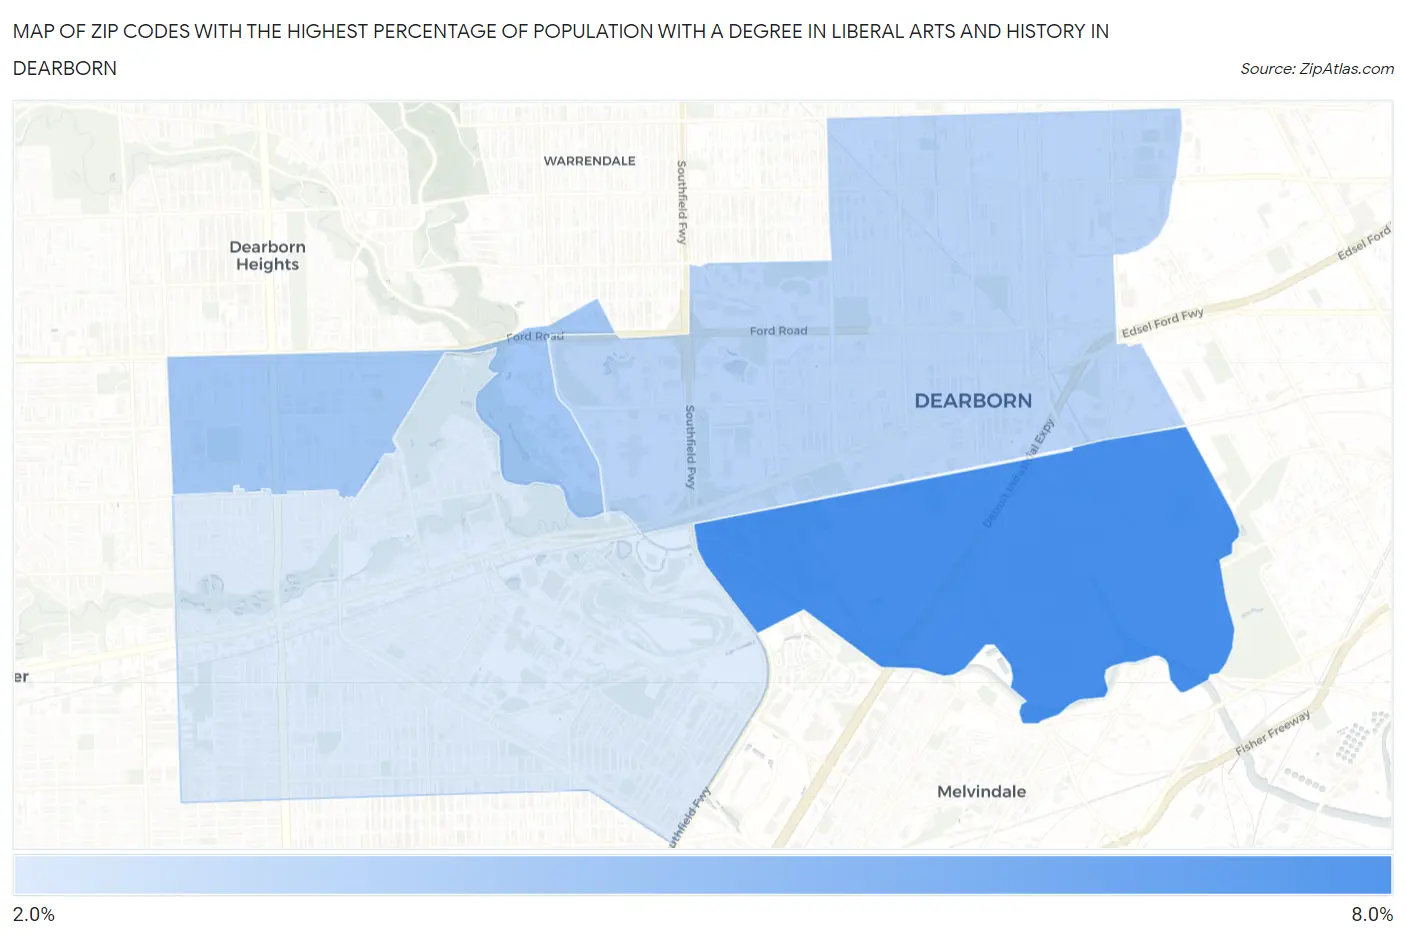
Map of Zip Codes with the Highest Percentage of Population with a Degree in Liberal Arts and History in Dearborn
2.7%
6.0%
Zip Codes with the Highest Percentage of Population with a Degree in Liberal Arts and History in Dearborn, MI
| Zip Code | % Graduates | vs State | vs National | |
| 1. | 48120 | 6.0% | 4.0%(+2.05)#193 | 4.9%(+1.16)#8,440 |
| 2. | 48128 | 3.9% | 4.0%(-0.040)#421 | 4.9%(-0.930)#15,009 |
| 3. | 48126 | 3.5% | 4.0%(-0.510)#508 | 4.9%(-1.40)#16,695 |
| 4. | 48124 | 2.7% | 4.0%(-1.31)#629 | 4.9%(-2.20)#19,419 |
1
Common Questions
What are the Top 3 Zip Codes with the Highest Percentage of Population with a Degree in Liberal Arts and History in Dearborn, MI?
Top 3 Zip Codes with the Highest Percentage of Population with a Degree in Liberal Arts and History in Dearborn, MI are:
What zip code has the Highest Percentage of Population with a Degree in Liberal Arts and History in Dearborn, MI?
48120 has the Highest Percentage of Population with a Degree in Liberal Arts and History in Dearborn, MI with 6.0%.
What is the Percentage of Population with a Degree in Liberal Arts and History in Dearborn, MI?
Percentage of Population with a Degree in Liberal Arts and History in Dearborn is 3.4%.
What is the Percentage of Population with a Degree in Liberal Arts and History in Michigan?
Percentage of Population with a Degree in Liberal Arts and History in Michigan is 4.0%.
What is the Percentage of Population with a Degree in Liberal Arts and History in the United States?
Percentage of Population with a Degree in Liberal Arts and History in the United States is 4.9%.