Zip Codes with the Highest Percentage of Population with a Degree in Liberal Arts and History in Southfield, MI
RELATED REPORTS & OPTIONS
Liberal Arts and History
Southfield
Compare Zip Codes
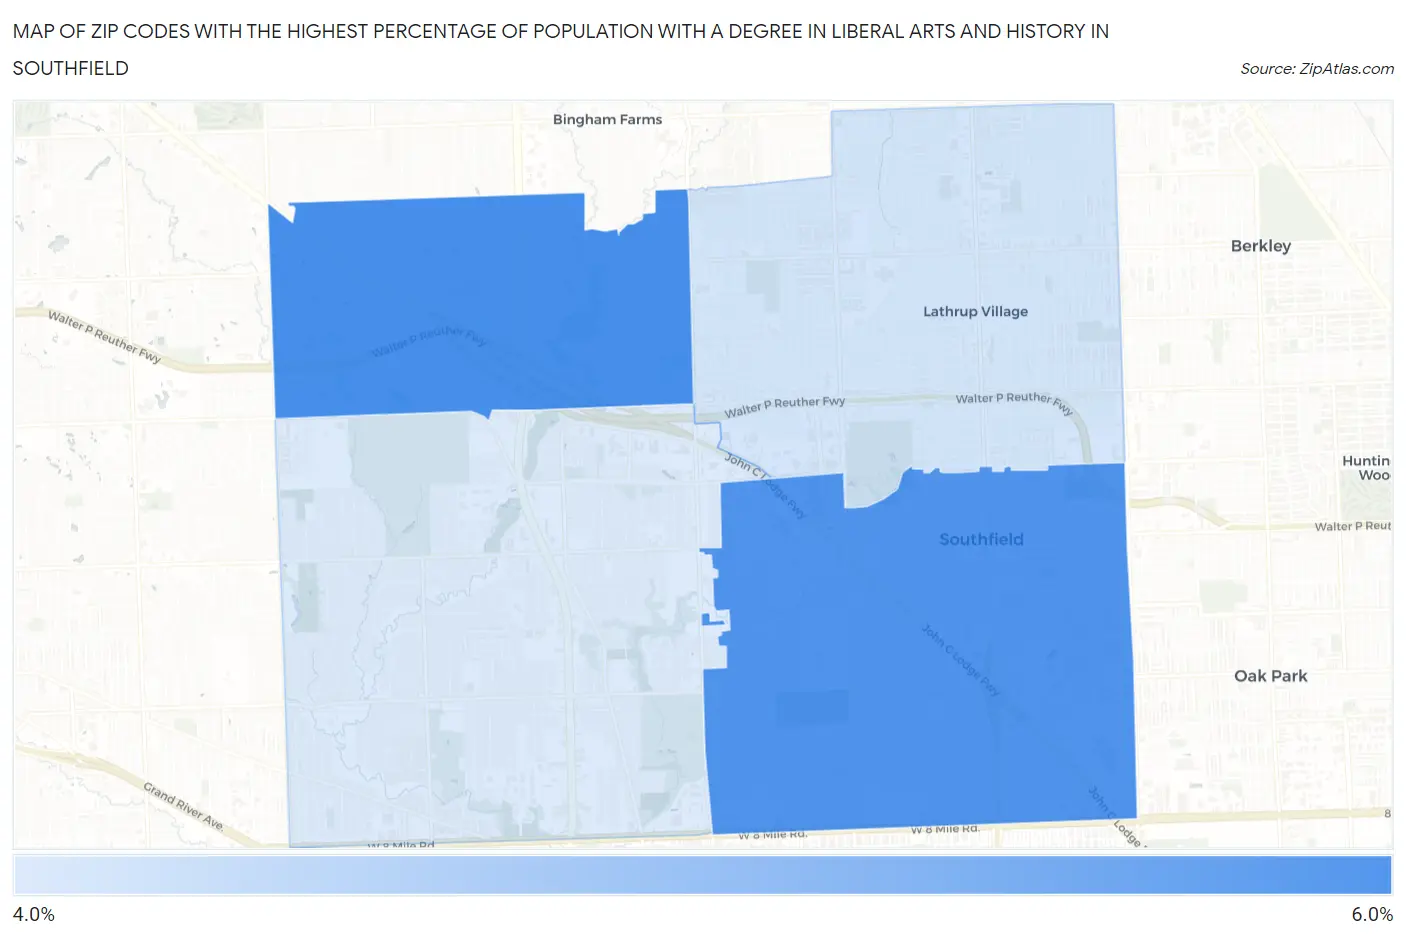
Map of Zip Codes with the Highest Percentage of Population with a Degree in Liberal Arts and History in Southfield
4.1%
5.2%
Zip Codes with the Highest Percentage of Population with a Degree in Liberal Arts and History in Southfield, MI
| Zip Code | % Graduates | vs State | vs National | |
| 1. | 48034 | 5.2% | 4.0%(+1.23)#259 | 4.9%(+0.339)#10,695 |
| 2. | 48075 | 5.2% | 4.0%(+1.18)#263 | 4.9%(+0.286)#10,850 |
| 3. | 48076 | 4.2% | 4.0%(+0.218)#382 | 4.9%(-0.672)#14,013 |
| 4. | 48033 | 4.1% | 4.0%(+0.148)#391 | 4.9%(-0.742)#14,282 |
1
Common Questions
What are the Top 3 Zip Codes with the Highest Percentage of Population with a Degree in Liberal Arts and History in Southfield, MI?
Top 3 Zip Codes with the Highest Percentage of Population with a Degree in Liberal Arts and History in Southfield, MI are:
What zip code has the Highest Percentage of Population with a Degree in Liberal Arts and History in Southfield, MI?
48034 has the Highest Percentage of Population with a Degree in Liberal Arts and History in Southfield, MI with 5.2%.
What is the Percentage of Population with a Degree in Liberal Arts and History in Southfield, MI?
Percentage of Population with a Degree in Liberal Arts and History in Southfield is 4.4%.
What is the Percentage of Population with a Degree in Liberal Arts and History in Michigan?
Percentage of Population with a Degree in Liberal Arts and History in Michigan is 4.0%.
What is the Percentage of Population with a Degree in Liberal Arts and History in the United States?
Percentage of Population with a Degree in Liberal Arts and History in the United States is 4.9%.