Zip Codes with the Highest Percentage of Population with a Degree in Liberal Arts and History in Redford, MI
RELATED REPORTS & OPTIONS
Liberal Arts and History
Redford
Compare Zip Codes
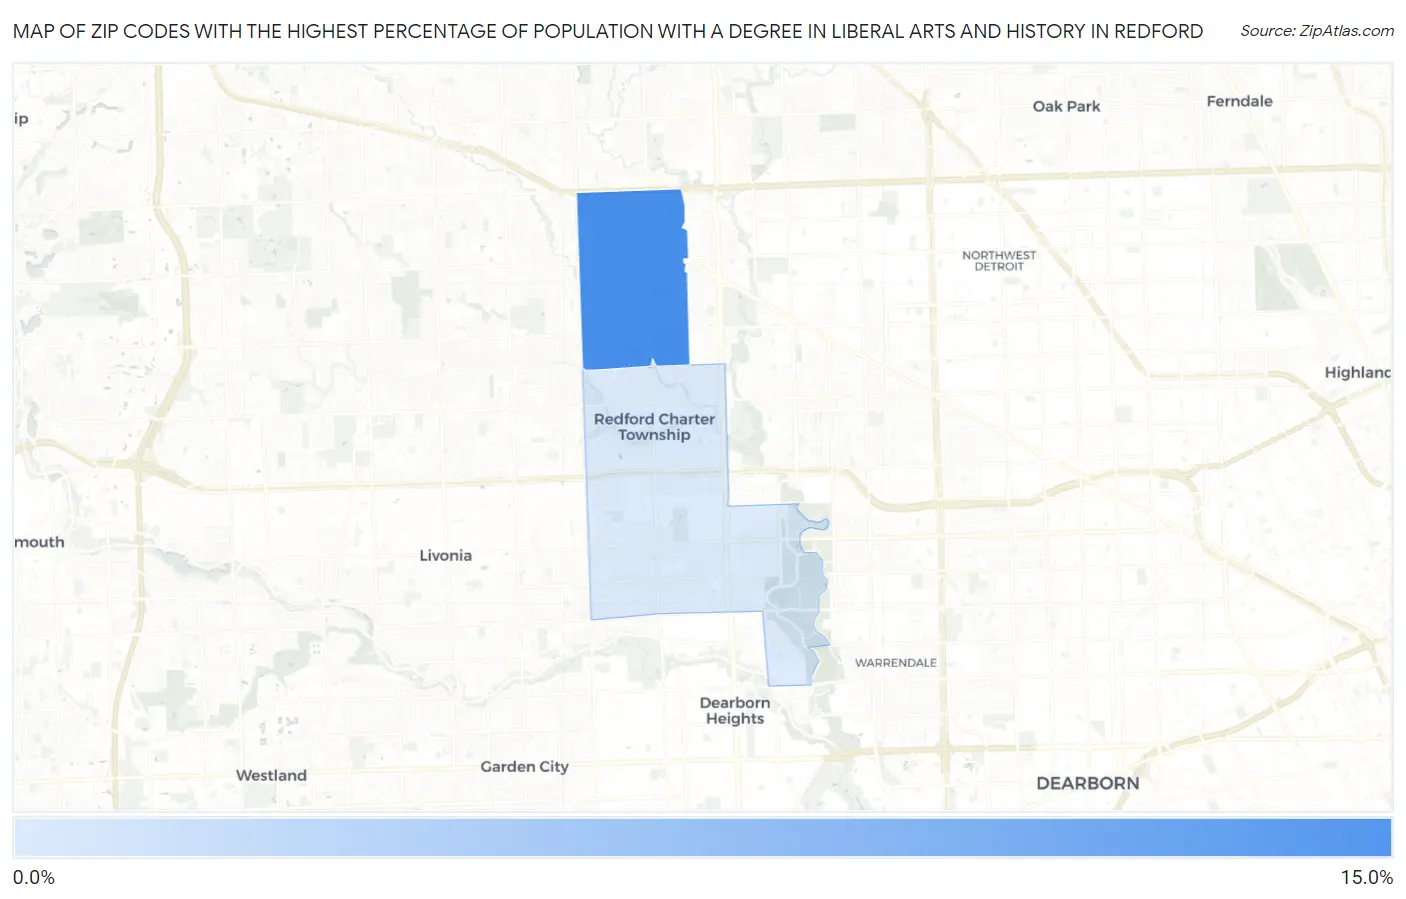
Map of Zip Codes with the Highest Percentage of Population with a Degree in Liberal Arts and History in Redford
2.9%
11.0%
Zip Codes with the Highest Percentage of Population with a Degree in Liberal Arts and History in Redford, MI
| Zip Code | % Graduates | vs State | vs National | |
| 1. | 48240 | 11.0% | 4.0%(+7.05)#44 | 4.9%(+6.16)#2,544 |
| 2. | 48239 | 2.9% | 4.0%(-1.11)#606 | 4.9%(-1.99)#18,757 |
1
Common Questions
What are the Top Zip Codes with the Highest Percentage of Population with a Degree in Liberal Arts and History in Redford, MI?
Top Zip Codes with the Highest Percentage of Population with a Degree in Liberal Arts and History in Redford, MI are:
What zip code has the Highest Percentage of Population with a Degree in Liberal Arts and History in Redford, MI?
48240 has the Highest Percentage of Population with a Degree in Liberal Arts and History in Redford, MI with 11.0%.
What is the Percentage of Population with a Degree in Liberal Arts and History in Michigan?
Percentage of Population with a Degree in Liberal Arts and History in Michigan is 4.0%.
What is the Percentage of Population with a Degree in Liberal Arts and History in the United States?
Percentage of Population with a Degree in Liberal Arts and History in the United States is 4.9%.