Zip Codes with the Highest Percentage of Population with a Degree in Bio, Nature & Agricultural in Illinois
RELATED REPORTS & OPTIONS
Bio, Nature & Agricultural
Illinois
Compare Zip Codes
Map of Zip Codes with the Highest Percentage of Population with a Degree in Bio, Nature & Agricultural in Illinois
20.0%
100.0%
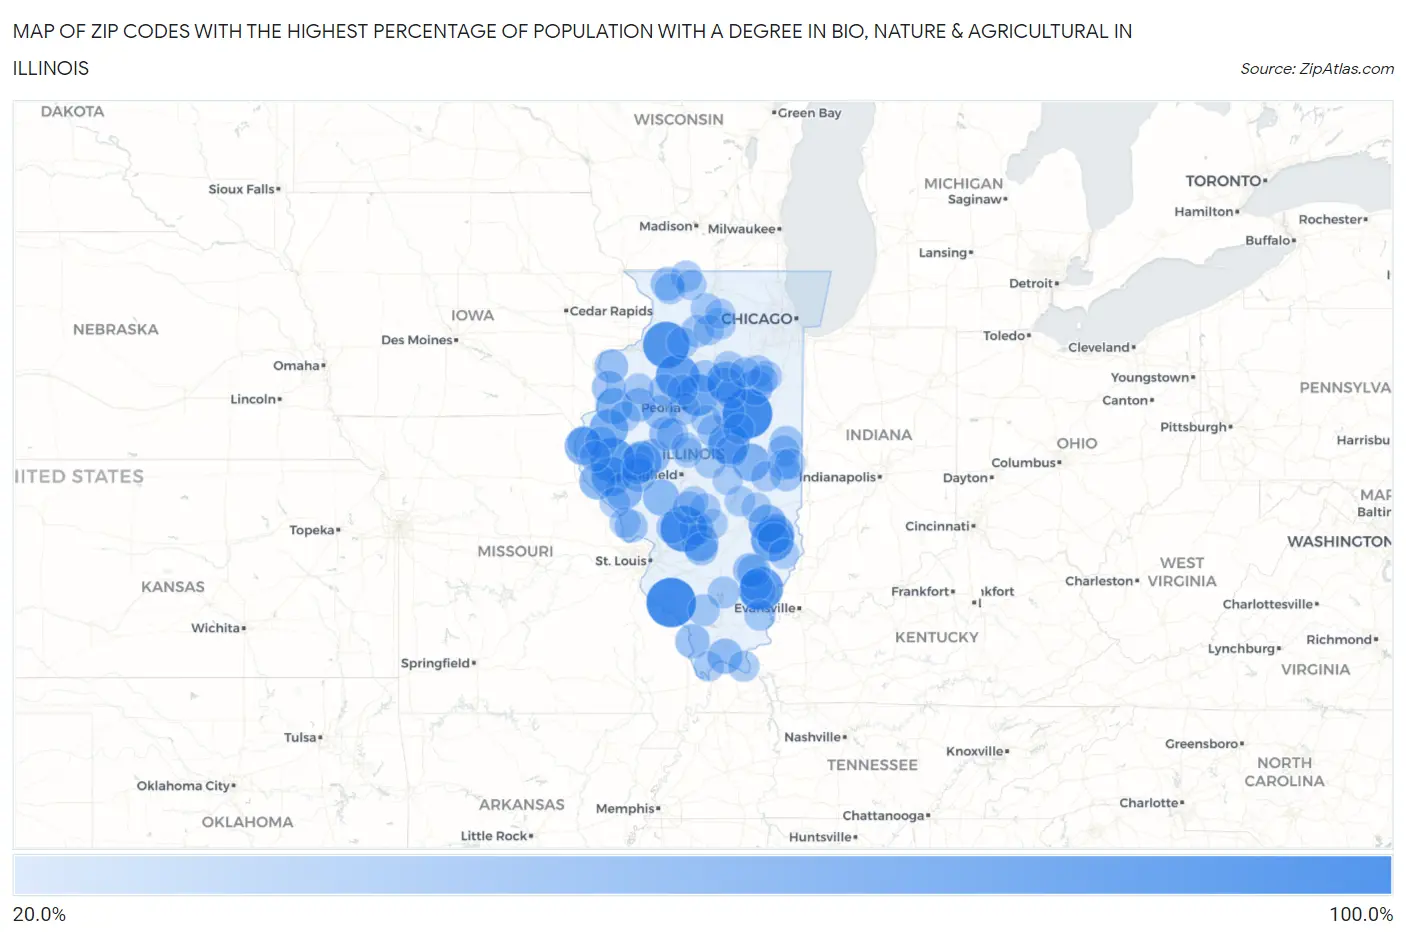
Zip Codes with the Highest Percentage of Population with a Degree in Bio, Nature & Agricultural in Illinois
| Zip Code | % Graduates | vs State | vs National | |
| 1. | 62297 | 100.0% | 5.7% (+94.3)#1 | 6.4% (+93.6)#20 |
| 2. | 61731 | 100.0% | 5.7% (+94.3)#2 | 6.4% (+93.6)#48 |
| 3. | 61258 | 87.5% | 5.7% (+81.8)#3 | 6.4% (+81.1)#101 |
| 4. | 62091 | 86.7% | 5.7% (+80.9)#4 | 6.4% (+80.3)#102 |
| 5. | 62375 | 80.2% | 5.7% (+74.5)#5 | 6.4% (+73.9)#115 |
| 6. | 62820 | 76.0% | 5.7% (+70.3)#6 | 6.4% (+69.6)#130 |
| 7. | 61426 | 75.0% | 5.7% (+69.3)#7 | 6.4% (+68.6)#135 |
| 8. | 62475 | 73.1% | 5.7% (+67.3)#8 | 6.4% (+66.7)#139 |
| 9. | 61545 | 69.3% | 5.7% (+63.5)#9 | 6.4% (+62.9)#157 |
| 10. | 61735 | 67.1% | 5.7% (+61.4)#10 | 6.4% (+60.8)#169 |
| 11. | 62622 | 62.5% | 5.7% (+56.8)#11 | 6.4% (+56.1)#208 |
| 12. | 62314 | 59.7% | 5.7% (+54.0)#12 | 6.4% (+53.3)#229 |
| 13. | 61311 | 59.3% | 5.7% (+53.5)#13 | 6.4% (+52.9)#235 |
| 14. | 62374 | 57.1% | 5.7% (+51.4)#14 | 6.4% (+50.8)#248 |
| 15. | 62480 | 56.5% | 5.7% (+50.7)#15 | 6.4% (+50.1)#255 |
| 16. | 62432 | 54.0% | 5.7% (+48.3)#16 | 6.4% (+47.7)#287 |
| 17. | 62348 | 53.8% | 5.7% (+48.1)#17 | 6.4% (+47.5)#291 |
| 18. | 61851 | 52.9% | 5.7% (+47.1)#18 | 6.4% (+46.5)#299 |
| 19. | 62862 | 50.9% | 5.7% (+45.1)#19 | 6.4% (+44.5)#322 |
| 20. | 62284 | 50.0% | 5.7% (+44.3)#20 | 6.4% (+43.6)#328 |
| 21. | 62352 | 50.0% | 5.7% (+44.3)#21 | 6.4% (+43.6)#339 |
| 22. | 61460 | 47.8% | 5.7% (+42.1)#22 | 6.4% (+41.5)#401 |
| 23. | 62345 | 47.5% | 5.7% (+41.8)#23 | 6.4% (+41.1)#405 |
| 24. | 62667 | 47.2% | 5.7% (+41.5)#24 | 6.4% (+40.9)#409 |
| 25. | 60934 | 44.4% | 5.7% (+38.7)#25 | 6.4% (+38.1)#467 |
| 26. | 61333 | 43.8% | 5.7% (+38.0)#26 | 6.4% (+37.4)#485 |
| 27. | 62908 | 42.9% | 5.7% (+37.1)#27 | 6.4% (+36.5)#498 |
| 28. | 62627 | 41.0% | 5.7% (+35.3)#28 | 6.4% (+34.7)#540 |
| 29. | 62998 | 40.0% | 5.7% (+34.3)#29 | 6.4% (+33.6)#571 |
| 30. | 62628 | 39.6% | 5.7% (+33.8)#30 | 6.4% (+33.2)#587 |
| 31. | 62017 | 39.3% | 5.7% (+33.6)#31 | 6.4% (+33.0)#595 |
| 32. | 62823 | 37.7% | 5.7% (+32.0)#32 | 6.4% (+31.4)#653 |
| 33. | 61260 | 37.5% | 5.7% (+31.8)#33 | 6.4% (+31.1)#659 |
| 34. | 61567 | 37.5% | 5.7% (+31.8)#34 | 6.4% (+31.1)#660 |
| 35. | 61553 | 37.5% | 5.7% (+31.8)#35 | 6.4% (+31.1)#664 |
| 36. | 61469 | 37.4% | 5.7% (+31.6)#36 | 6.4% (+31.0)#672 |
| 37. | 61474 | 37.1% | 5.7% (+31.4)#37 | 6.4% (+30.8)#680 |
| 38. | 61044 | 36.6% | 5.7% (+30.9)#38 | 6.4% (+30.3)#710 |
| 39. | 62842 | 36.3% | 5.7% (+30.5)#39 | 6.4% (+29.9)#723 |
| 40. | 62253 | 35.1% | 5.7% (+29.4)#40 | 6.4% (+28.8)#763 |
| 41. | 61831 | 34.6% | 5.7% (+28.9)#41 | 6.4% (+28.3)#791 |
| 42. | 62031 | 33.3% | 5.7% (+27.6)#42 | 6.4% (+27.0)#845 |
| 43. | 62373 | 33.3% | 5.7% (+27.6)#43 | 6.4% (+27.0)#862 |
| 44. | 61602 | 32.7% | 5.7% (+26.9)#44 | 6.4% (+26.3)#916 |
| 45. | 61772 | 32.4% | 5.7% (+26.6)#45 | 6.4% (+26.0)#929 |
| 46. | 61882 | 32.3% | 5.7% (+26.5)#46 | 6.4% (+25.9)#936 |
| 47. | 61940 | 32.1% | 5.7% (+26.4)#47 | 6.4% (+25.8)#943 |
| 48. | 61310 | 32.1% | 5.7% (+26.4)#48 | 6.4% (+25.8)#946 |
| 49. | 62809 | 32.0% | 5.7% (+26.3)#49 | 6.4% (+25.6)#953 |
| 50. | 62085 | 31.8% | 5.7% (+26.1)#50 | 6.4% (+25.5)#969 |
| 51. | 62316 | 31.6% | 5.7% (+25.9)#51 | 6.4% (+25.3)#984 |
| 52. | 62459 | 31.6% | 5.7% (+25.8)#52 | 6.4% (+25.2)#992 |
| 53. | 62538 | 31.5% | 5.7% (+25.8)#53 | 6.4% (+25.2)#997 |
| 54. | 61451 | 31.2% | 5.7% (+25.5)#54 | 6.4% (+24.9)#1,012 |
| 55. | 61336 | 31.2% | 5.7% (+25.4)#55 | 6.4% (+24.8)#1,014 |
| 56. | 61753 | 31.0% | 5.7% (+25.3)#56 | 6.4% (+24.7)#1,019 |
| 57. | 60424 | 30.9% | 5.7% (+25.2)#57 | 6.4% (+24.6)#1,022 |
| 58. | 61857 | 30.6% | 5.7% (+24.8)#58 | 6.4% (+24.2)#1,050 |
| 59. | 62816 | 30.3% | 5.7% (+24.5)#59 | 6.4% (+23.9)#1,061 |
| 60. | 62927 | 30.0% | 5.7% (+24.3)#60 | 6.4% (+23.6)#1,089 |
| 61. | 60530 | 29.1% | 5.7% (+23.4)#61 | 6.4% (+22.8)#1,155 |
| 62. | 61532 | 29.0% | 5.7% (+23.3)#62 | 6.4% (+22.7)#1,160 |
| 63. | 61376 | 28.5% | 5.7% (+22.8)#63 | 6.4% (+22.2)#1,202 |
| 64. | 61018 | 28.4% | 5.7% (+22.7)#64 | 6.4% (+22.1)#1,207 |
| 65. | 61015 | 28.3% | 5.7% (+22.6)#65 | 6.4% (+22.0)#1,213 |
| 66. | 62871 | 28.1% | 5.7% (+22.4)#66 | 6.4% (+21.8)#1,231 |
| 67. | 62611 | 28.0% | 5.7% (+22.3)#67 | 6.4% (+21.7)#1,244 |
| 68. | 62910 | 27.9% | 5.7% (+22.2)#68 | 6.4% (+21.6)#1,258 |
| 69. | 62543 | 27.8% | 5.7% (+22.1)#69 | 6.4% (+21.5)#1,267 |
| 70. | 60969 | 27.8% | 5.7% (+22.0)#70 | 6.4% (+21.4)#1,275 |
| 71. | 61722 | 27.7% | 5.7% (+21.9)#71 | 6.4% (+21.3)#1,284 |
| 72. | 61876 | 27.6% | 5.7% (+21.8)#72 | 6.4% (+21.2)#1,289 |
| 73. | 61850 | 27.5% | 5.7% (+21.8)#73 | 6.4% (+21.1)#1,297 |
| 74. | 62325 | 27.1% | 5.7% (+21.3)#74 | 6.4% (+20.7)#1,341 |
| 75. | 62076 | 26.7% | 5.7% (+20.9)#75 | 6.4% (+20.3)#1,384 |
| 76. | 61062 | 26.6% | 5.7% (+20.8)#76 | 6.4% (+20.2)#1,392 |
| 77. | 62355 | 26.2% | 5.7% (+20.4)#77 | 6.4% (+19.8)#1,434 |
| 78. | 61402 | 26.0% | 5.7% (+20.3)#78 | 6.4% (+19.6)#1,451 |
| 79. | 62047 | 26.0% | 5.7% (+20.2)#79 | 6.4% (+19.6)#1,454 |
| 80. | 62618 | 26.0% | 5.7% (+20.2)#80 | 6.4% (+19.6)#1,458 |
| 81. | 61526 | 25.6% | 5.7% (+19.9)#81 | 6.4% (+19.3)#1,499 |
| 82. | 60917 | 25.5% | 5.7% (+19.8)#82 | 6.4% (+19.2)#1,513 |
| 83. | 61743 | 25.5% | 5.7% (+19.8)#83 | 6.4% (+19.2)#1,515 |
| 84. | 61919 | 25.4% | 5.7% (+19.6)#84 | 6.4% (+19.0)#1,536 |
| 85. | 62996 | 25.4% | 5.7% (+19.6)#85 | 6.4% (+19.0)#1,537 |
| 86. | 61957 | 25.0% | 5.7% (+19.3)#86 | 6.4% (+18.6)#1,564 |
| 87. | 61325 | 25.0% | 5.7% (+19.3)#87 | 6.4% (+18.6)#1,569 |
| 88. | 61067 | 25.0% | 5.7% (+19.3)#88 | 6.4% (+18.6)#1,578 |
| 89. | 61378 | 25.0% | 5.7% (+19.3)#89 | 6.4% (+18.6)#1,582 |
| 90. | 60437 | 25.0% | 5.7% (+19.3)#90 | 6.4% (+18.6)#1,609 |
| 91. | 62666 | 24.6% | 5.7% (+18.9)#91 | 6.4% (+18.3)#1,647 |
| 92. | 62466 | 24.6% | 5.7% (+18.9)#92 | 6.4% (+18.3)#1,649 |
| 93. | 61925 | 24.4% | 5.7% (+18.7)#93 | 6.4% (+18.1)#1,665 |
| 94. | 60113 | 24.4% | 5.7% (+18.6)#94 | 6.4% (+18.0)#1,676 |
| 95. | 62080 | 24.3% | 5.7% (+18.5)#95 | 6.4% (+17.9)#1,686 |
| 96. | 62469 | 24.2% | 5.7% (+18.5)#96 | 6.4% (+17.9)#1,692 |
| 97. | 62671 | 24.2% | 5.7% (+18.4)#97 | 6.4% (+17.8)#1,700 |
| 98. | 62546 | 24.0% | 5.7% (+18.2)#98 | 6.4% (+17.6)#1,725 |
| 99. | 61438 | 23.9% | 5.7% (+18.2)#99 | 6.4% (+17.6)#1,728 |
| 100. | 61732 | 23.8% | 5.7% (+18.1)#100 | 6.4% (+17.5)#1,746 |
Common Questions
What are the Top 10 Zip Codes with the Highest Percentage of Population with a Degree in Bio, Nature & Agricultural in Illinois?
Top 10 Zip Codes with the Highest Percentage of Population with a Degree in Bio, Nature & Agricultural in Illinois are:
What zip code has the Highest Percentage of Population with a Degree in Bio, Nature & Agricultural in Illinois?
62297 has the Highest Percentage of Population with a Degree in Bio, Nature & Agricultural in Illinois with 100.0%.
What is the Percentage of Population with a Degree in Bio, Nature & Agricultural in the State of Illinois?
Percentage of Population with a Degree in Bio, Nature & Agricultural in Illinois is 5.7%.
What is the Percentage of Population with a Degree in Bio, Nature & Agricultural in the United States?
Percentage of Population with a Degree in Bio, Nature & Agricultural in the United States is 6.4%.