Delmita, TX Map & Demographics
Delmita Map
Delmita Overview
$26,843
PER CAPITA INCOME
0.40
INEQUALITY / GINI INDEX
164
TOTAL POPULATION
77
MALE POPULATION
87
FEMALE POPULATION
88.51
MALES / 100 FEMALES
112.99
FEMALES / 100 MALES
32.4
MEDIAN AGE
3.4
AVG FAMILY SIZE
3.0
AVG HOUSEHOLD SIZE
76
LABOR FORCE [ PEOPLE ]
66.1%
PERCENT IN LABOR FORCE
Delmita Zip Codes
Delmita Area Codes
Income in Delmita
Income Overview in Delmita
| Characteristic | Number | Measure |
| Per Capita Income | 164 | $26,843 |
| Median Family Income | 46 | $0 |
| Mean Family Income | 46 | $80,159 |
| Median Household Income | 55 | $0 |
| Mean Household Income | 55 | $73,665 |
| Income Deficit | 46 | $0 |
| Wage / Income Gap (%) | 164 | 0.00% |
| Wage / Income Gap ($) | 164 | 100.00¢ per $1 |
| Gini / Inequality Index | 164 | 0.40 |
Earnings by Sex in Delmita
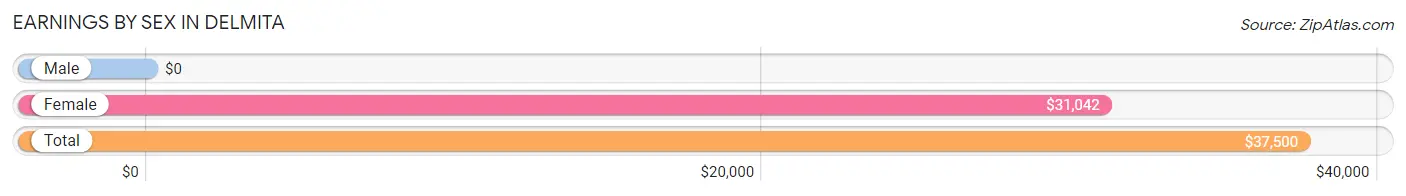
| Sex | Number | Average Earnings |
| Male | 45 (59.2%) | $0 |
| Female | 31 (40.8%) | $31,042 |
| Total | 76 (100.0%) | $37,500 |
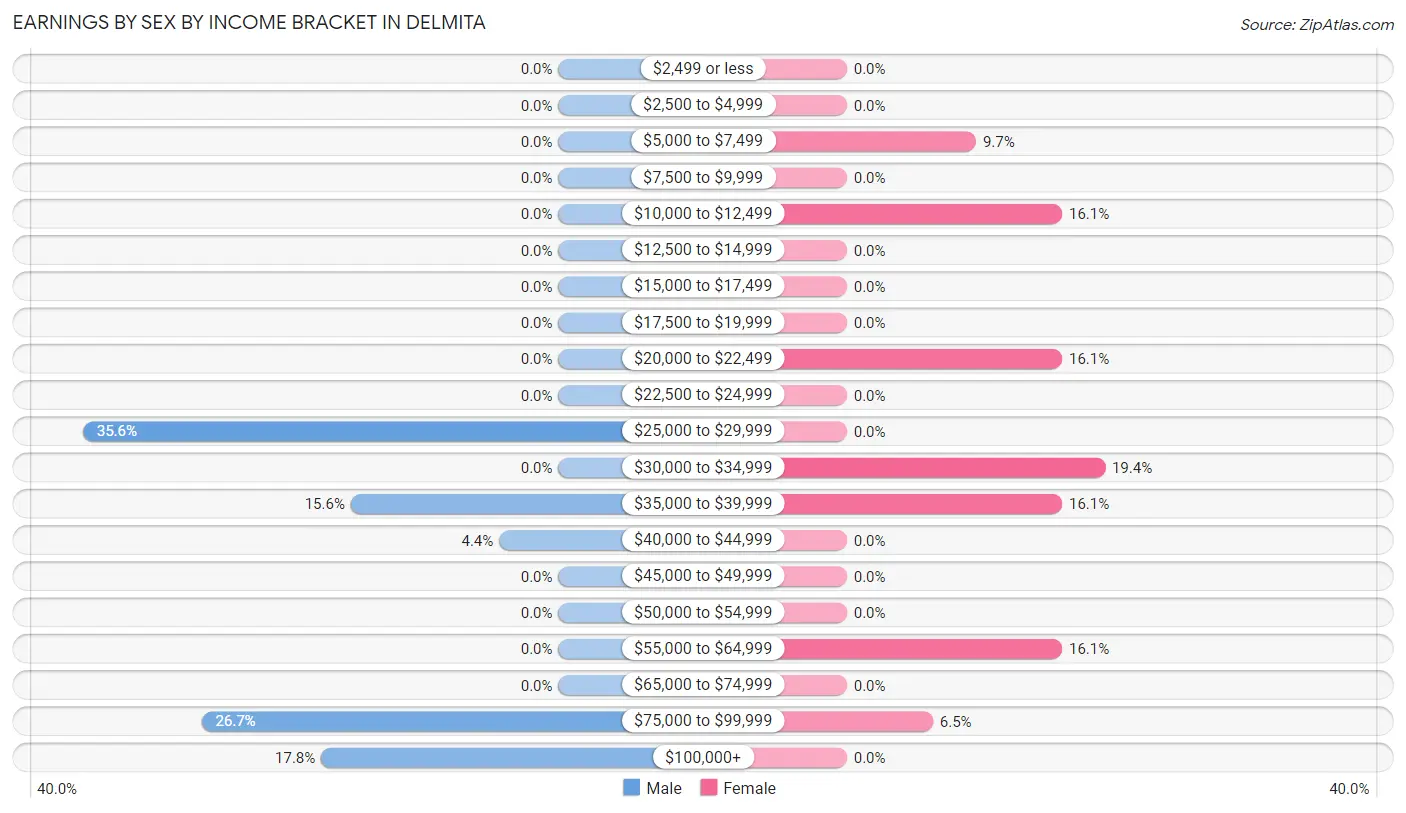
Earnings by Sex by Income Bracket in Delmita
The most common earnings brackets in Delmita are $25,000 to $29,999 for men (16 | 35.6%) and $30,000 to $34,999 for women (6 | 19.4%).
| Income | Male | Female |
| $2,499 or less | 0 (0.0%) | 0 (0.0%) |
| $2,500 to $4,999 | 0 (0.0%) | 0 (0.0%) |
| $5,000 to $7,499 | 0 (0.0%) | 3 (9.7%) |
| $7,500 to $9,999 | 0 (0.0%) | 0 (0.0%) |
| $10,000 to $12,499 | 0 (0.0%) | 5 (16.1%) |
| $12,500 to $14,999 | 0 (0.0%) | 0 (0.0%) |
| $15,000 to $17,499 | 0 (0.0%) | 0 (0.0%) |
| $17,500 to $19,999 | 0 (0.0%) | 0 (0.0%) |
| $20,000 to $22,499 | 0 (0.0%) | 5 (16.1%) |
| $22,500 to $24,999 | 0 (0.0%) | 0 (0.0%) |
| $25,000 to $29,999 | 16 (35.6%) | 0 (0.0%) |
| $30,000 to $34,999 | 0 (0.0%) | 6 (19.4%) |
| $35,000 to $39,999 | 7 (15.6%) | 5 (16.1%) |
| $40,000 to $44,999 | 2 (4.4%) | 0 (0.0%) |
| $45,000 to $49,999 | 0 (0.0%) | 0 (0.0%) |
| $50,000 to $54,999 | 0 (0.0%) | 0 (0.0%) |
| $55,000 to $64,999 | 0 (0.0%) | 5 (16.1%) |
| $65,000 to $74,999 | 0 (0.0%) | 0 (0.0%) |
| $75,000 to $99,999 | 12 (26.7%) | 2 (6.5%) |
| $100,000+ | 8 (17.8%) | 0 (0.0%) |
| Total | 45 (100.0%) | 31 (100.0%) |
Earnings by Sex by Educational Attainment in Delmita
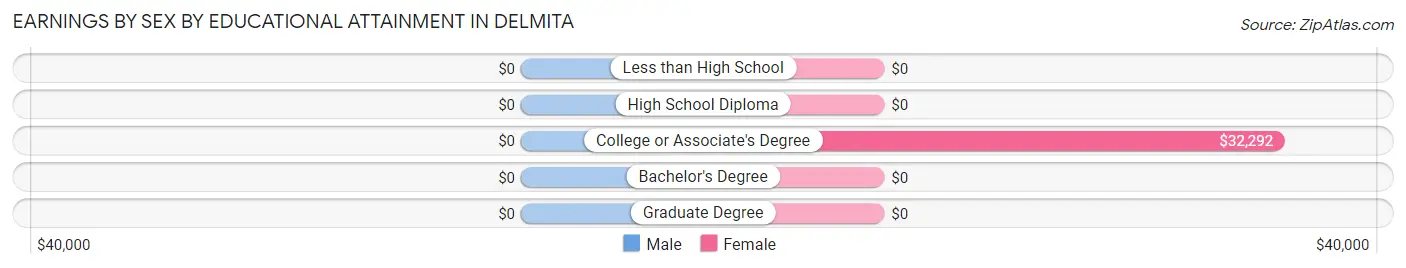
| Educational Attainment | Male Income | Female Income |
| Less than High School | - | - |
| High School Diploma | - | - |
| College or Associate's Degree | - | - |
| Bachelor's Degree | - | - |
| Graduate Degree | - | - |
| Total | - | - |
Family Income in Delmita
Family Income Brackets in Delmita
According to the Delmita family income data, there are 16 families falling into the $25,000 to $34,999 income range, which is the most common income bracket and makes up 34.8% of all families.
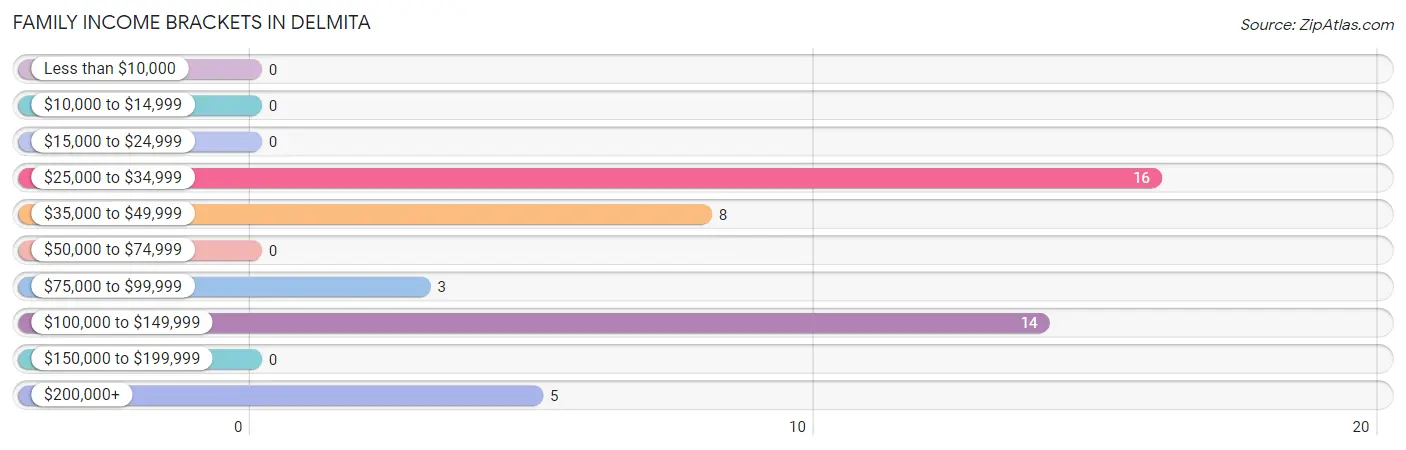
| Income Bracket | # Families | % Families |
| Less than $10,000 | 0 | 0.0% |
| $10,000 to $14,999 | 0 | 0.0% |
| $15,000 to $24,999 | 0 | 0.0% |
| $25,000 to $34,999 | 16 | 34.8% |
| $35,000 to $49,999 | 8 | 17.4% |
| $50,000 to $74,999 | 0 | 0.0% |
| $75,000 to $99,999 | 3 | 6.5% |
| $100,000 to $149,999 | 14 | 30.4% |
| $150,000 to $199,999 | 0 | 0.0% |
| $200,000+ | 5 | 10.9% |
Family Income by Famaliy Size in Delmita
3-person families (20 | 43.5%) account for the highest median family income in Delmita with $108,958 per family, while 3-person families (20 | 43.5%) have the highest median income of $36,319 per family member.
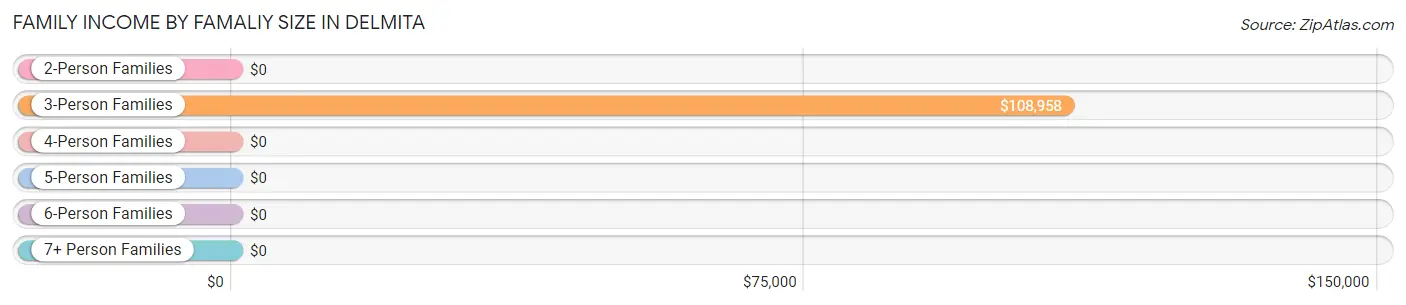
| Income Bracket | # Families | Median Income |
| 2-Person Families | 2 (4.3%) | $0 |
| 3-Person Families | 20 (43.5%) | $108,958 |
| 4-Person Families | 20 (43.5%) | $0 |
| 5-Person Families | 4 (8.7%) | $0 |
| 6-Person Families | 0 (0.0%) | $0 |
| 7+ Person Families | 0 (0.0%) | $0 |
| Total | 46 (100.0%) | $0 |
Family Income by Number of Earners in Delmita
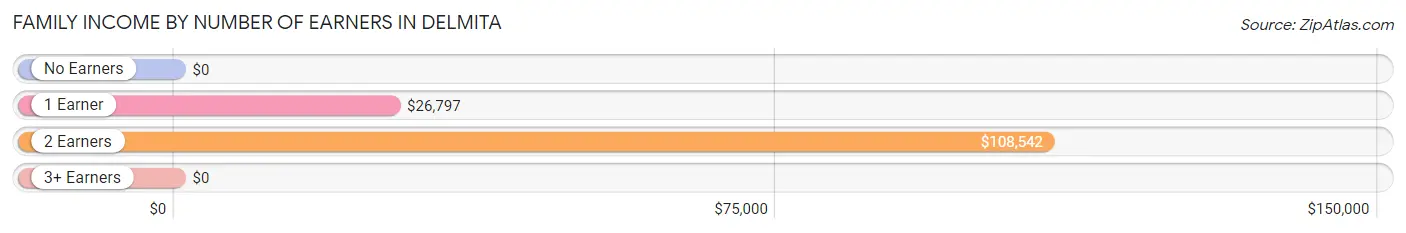
| Number of Earners | # Families | Median Income |
| No Earners | 0 (0.0%) | $0 |
| 1 Earner | 23 (50.0%) | $26,797 |
| 2 Earners | 18 (39.1%) | $108,542 |
| 3+ Earners | 5 (10.9%) | $0 |
| Total | 46 (100.0%) | $0 |
Household Income in Delmita
Household Income Brackets in Delmita
With 16 households falling in the category, the $25,000 to $34,999 income range is the most frequent in Delmita, accounting for 29.1% of all households.
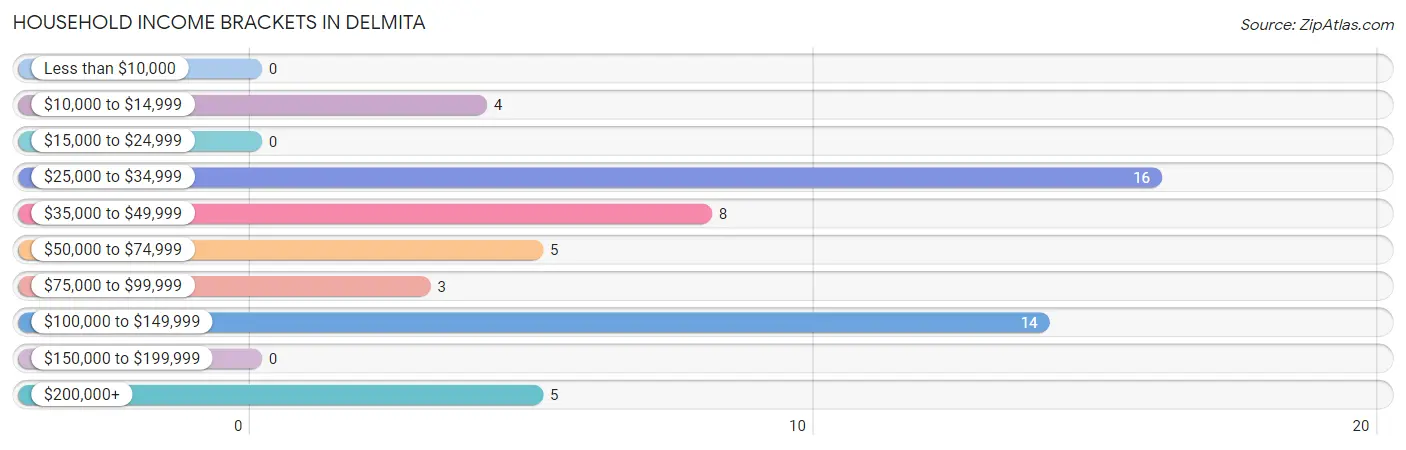
| Income Bracket | # Households | % Households |
| Less than $10,000 | 0 | 0.0% |
| $10,000 to $14,999 | 4 | 7.3% |
| $15,000 to $24,999 | 0 | 0.0% |
| $25,000 to $34,999 | 16 | 29.1% |
| $35,000 to $49,999 | 8 | 14.5% |
| $50,000 to $74,999 | 5 | 9.1% |
| $75,000 to $99,999 | 3 | 5.5% |
| $100,000 to $149,999 | 14 | 25.5% |
| $150,000 to $199,999 | 0 | 0.0% |
| $200,000+ | 5 | 9.1% |
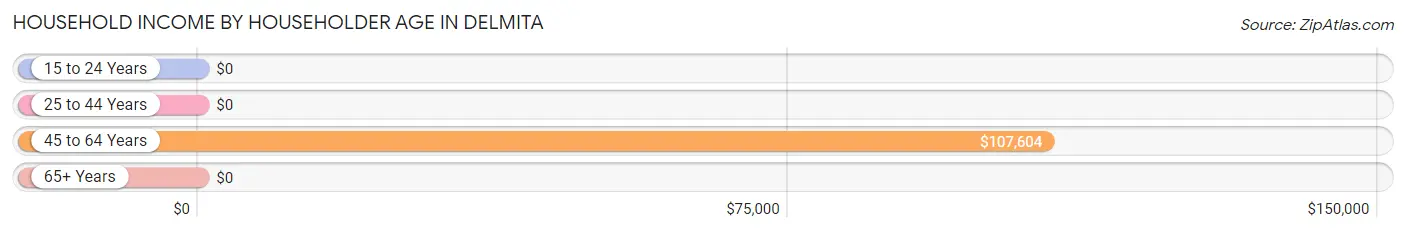
Household Income by Householder Age in Delmita
The median household income in Delmita is $0, with the highest median household income of $107,604 found in the 45 to 64 years age bracket for the primary householder. A total of 27 households (49.1%) fall into this category.
| Income Bracket | # Households | Median Income |
| 15 to 24 Years | 0 (0.0%) | $0 |
| 25 to 44 Years | 25 (45.5%) | $0 |
| 45 to 64 Years | 27 (49.1%) | $107,604 |
| 65+ Years | 3 (5.4%) | $0 |
| Total | 55 (100.0%) | $0 |
Poverty in Delmita
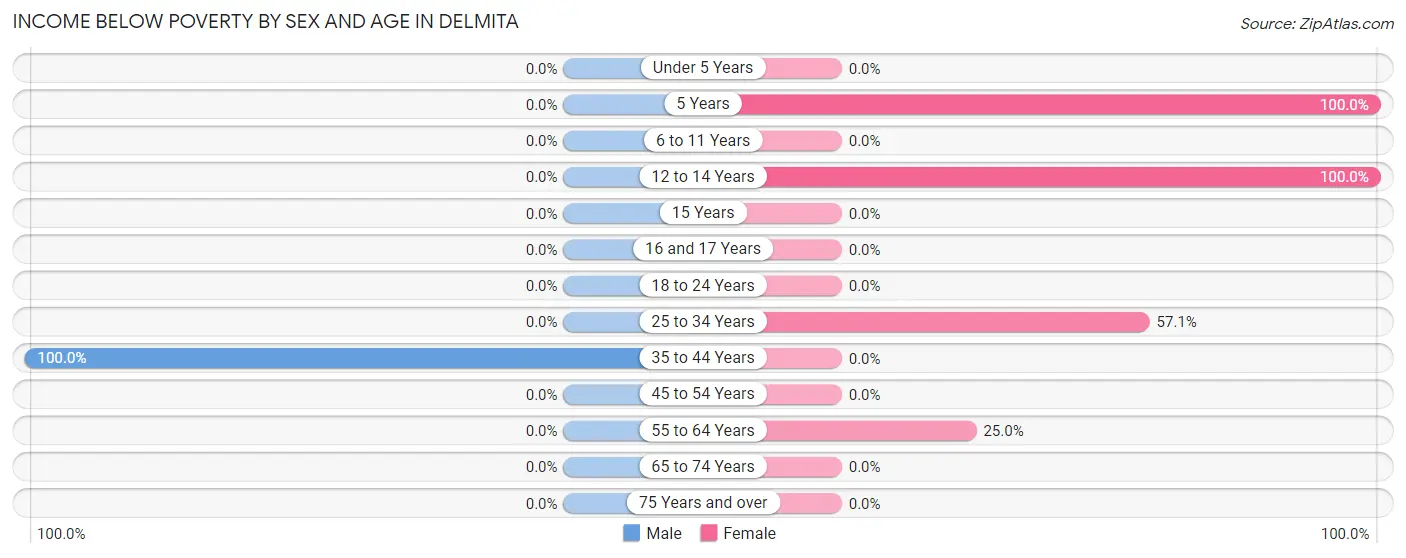
Income Below Poverty by Sex and Age in Delmita
With 20.8% poverty level for males and 51.7% for females among the residents of Delmita, 35 to 44 year old males and 5 year old females are the most vulnerable to poverty, with 16 males (100.0%) and 14 females (100.0%) in their respective age groups living below the poverty level.
| Age Bracket | Male | Female |
| Under 5 Years | 0 (0.0%) | 0 (0.0%) |
| 5 Years | 0 (0.0%) | 14 (100.0%) |
| 6 to 11 Years | 0 (0.0%) | 0 (0.0%) |
| 12 to 14 Years | 0 (0.0%) | 15 (100.0%) |
| 15 Years | 0 (0.0%) | 0 (0.0%) |
| 16 and 17 Years | 0 (0.0%) | 0 (0.0%) |
| 18 to 24 Years | 0 (0.0%) | 0 (0.0%) |
| 25 to 34 Years | 0 (0.0%) | 12 (57.1%) |
| 35 to 44 Years | 16 (100.0%) | 0 (0.0%) |
| 45 to 54 Years | 0 (0.0%) | 0 (0.0%) |
| 55 to 64 Years | 0 (0.0%) | 4 (25.0%) |
| 65 to 74 Years | 0 (0.0%) | 0 (0.0%) |
| 75 Years and over | 0 (0.0%) | 0 (0.0%) |
| Total | 16 (20.8%) | 45 (51.7%) |
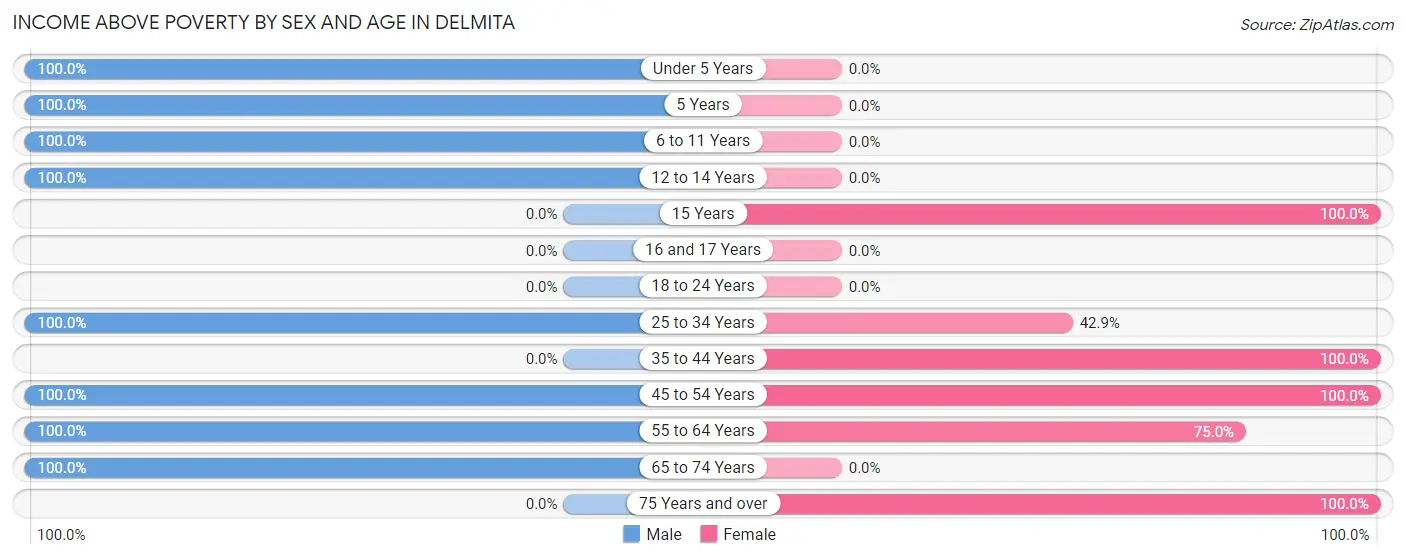
Income Above Poverty by Sex and Age in Delmita
According to the poverty statistics in Delmita, males aged under 5 years and females aged 15 years are the age groups that are most secure financially, with 100.0% of males and 100.0% of females in these age groups living above the poverty line.
| Age Bracket | Male | Female |
| Under 5 Years | 5 (100.0%) | 0 (0.0%) |
| 5 Years | 4 (100.0%) | 0 (0.0%) |
| 6 to 11 Years | 4 (100.0%) | 0 (0.0%) |
| 12 to 14 Years | 4 (100.0%) | 0 (0.0%) |
| 15 Years | 0 (0.0%) | 3 (100.0%) |
| 16 and 17 Years | 0 (0.0%) | 0 (0.0%) |
| 18 to 24 Years | 0 (0.0%) | 0 (0.0%) |
| 25 to 34 Years | 23 (100.0%) | 9 (42.9%) |
| 35 to 44 Years | 0 (0.0%) | 8 (100.0%) |
| 45 to 54 Years | 16 (100.0%) | 6 (100.0%) |
| 55 to 64 Years | 2 (100.0%) | 12 (75.0%) |
| 65 to 74 Years | 3 (100.0%) | 0 (0.0%) |
| 75 Years and over | 0 (0.0%) | 4 (100.0%) |
| Total | 61 (79.2%) | 42 (48.3%) |
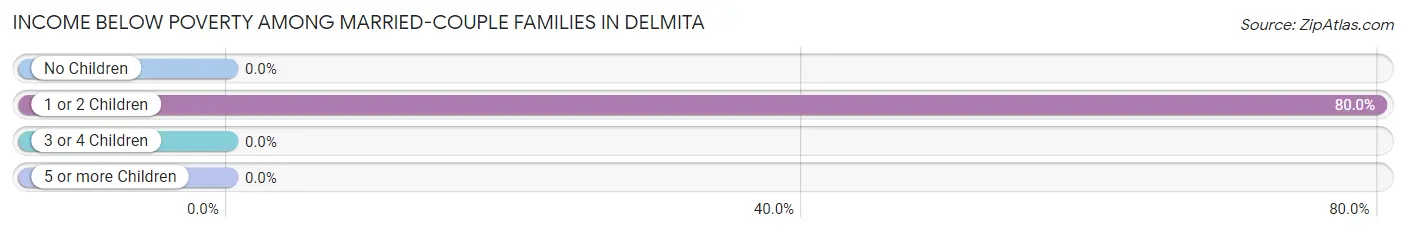
Income Below Poverty Among Married-Couple Families in Delmita
The poverty statistics for married-couple families in Delmita show that 39.0% or 16 of the total 41 families live below the poverty line. Families with 1 or 2 children have the highest poverty rate of 80.0%, comprising of 16 families. On the other hand, families with no children have the lowest poverty rate of 0.0%, which includes 0 families.
| Children | Above Poverty | Below Poverty |
| No Children | 17 (100.0%) | 0 (0.0%) |
| 1 or 2 Children | 4 (20.0%) | 16 (80.0%) |
| 3 or 4 Children | 4 (100.0%) | 0 (0.0%) |
| 5 or more Children | 0 (0.0%) | 0 (0.0%) |
| Total | 25 (61.0%) | 16 (39.0%) |
Income Below Poverty Among Single-Parent Households in Delmita
| Children | Single Father | Single Mother |
| No Children | 0 (0.0%) | 0 (0.0%) |
| 1 or 2 Children | 0 (0.0%) | 0 (0.0%) |
| 3 or 4 Children | 0 (0.0%) | 0 (0.0%) |
| 5 or more Children | 0 (0.0%) | 0 (0.0%) |
| Total | 0 (0.0%) | 0 (0.0%) |
Income Below Poverty Among Married-Couple vs Single-Parent Households in Delmita
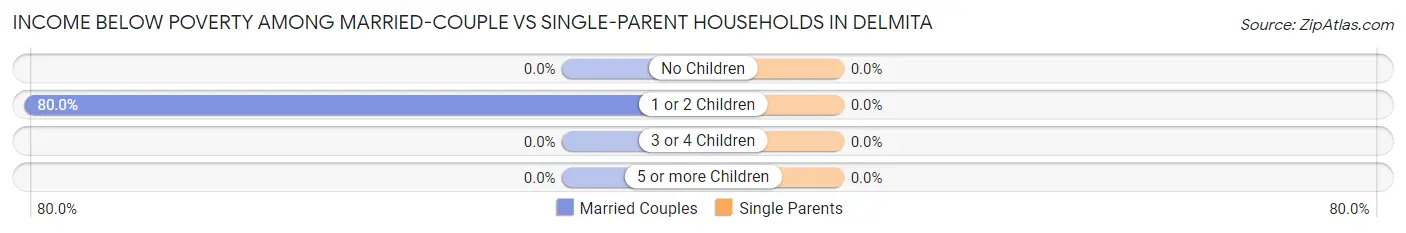
| Children | Married-Couple Families | Single-Parent Households |
| No Children | 0 (0.0%) | 0 (0.0%) |
| 1 or 2 Children | 16 (80.0%) | 0 (0.0%) |
| 3 or 4 Children | 0 (0.0%) | 0 (0.0%) |
| 5 or more Children | 0 (0.0%) | 0 (0.0%) |
| Total | 16 (39.0%) | 0 (0.0%) |
Race in Delmita
The most populous races in Delmita are Hispanic or Latino (164 | 100.0%), White / Caucasian (114 | 69.5%), and Two or more Races (32 | 19.5%).
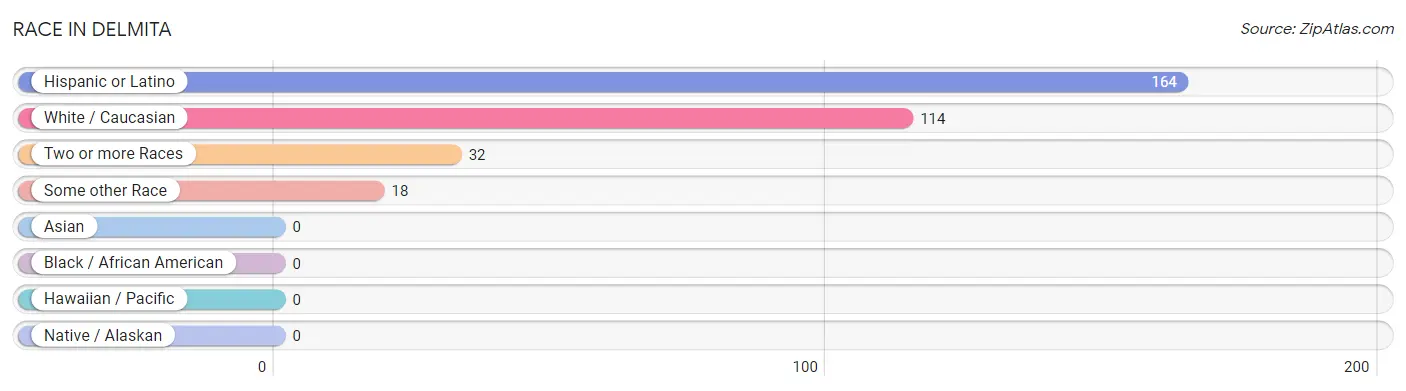
| Race | # Population | % Population |
| Asian | 0 | 0.0% |
| Black / African American | 0 | 0.0% |
| Hawaiian / Pacific | 0 | 0.0% |
| Hispanic or Latino | 164 | 100.0% |
| Native / Alaskan | 0 | 0.0% |
| White / Caucasian | 114 | 69.5% |
| Two or more Races | 32 | 19.5% |
| Some other Race | 18 | 11.0% |
| Total | 164 | 100.0% |
Ancestry in Delmita
The most populous ancestries reported in Delmita are Mexican (113 | 68.9%), Central American (41 | 25.0%), and Salvadoran (41 | 25.0%), together accounting for 118.9% of all Delmita residents.
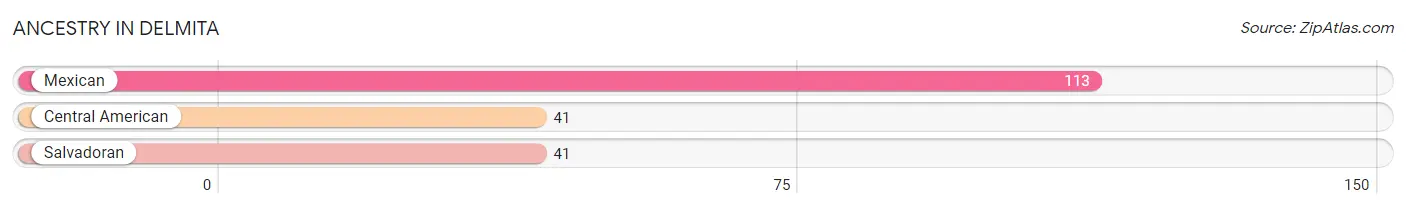
| Ancestry | # Population | % Population |
| Central American | 41 | 25.0% |
| Mexican | 113 | 68.9% |
| Salvadoran | 41 | 25.0% | View All 3 Rows |
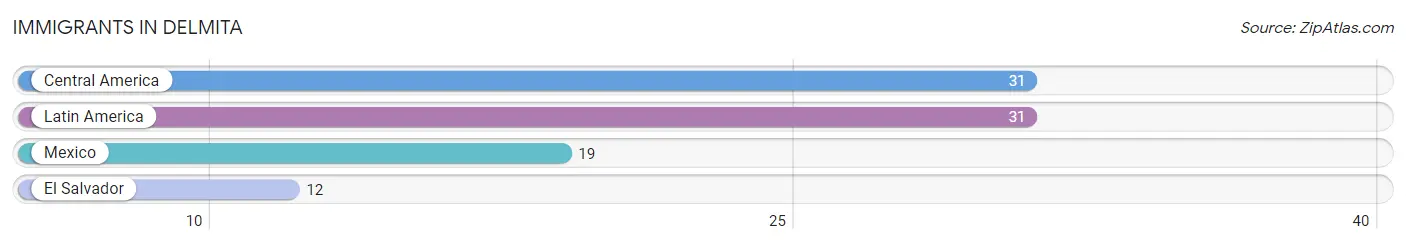
Immigrants in Delmita
The most numerous immigrant groups reported in Delmita came from Central America (31 | 18.9%), Latin America (31 | 18.9%), Mexico (19 | 11.6%), and El Salvador (12 | 7.3%), together accounting for 56.7% of all Delmita residents.
| Immigration Origin | # Population | % Population |
| Central America | 31 | 18.9% |
| El Salvador | 12 | 7.3% |
| Latin America | 31 | 18.9% |
| Mexico | 19 | 11.6% | View All 4 Rows |
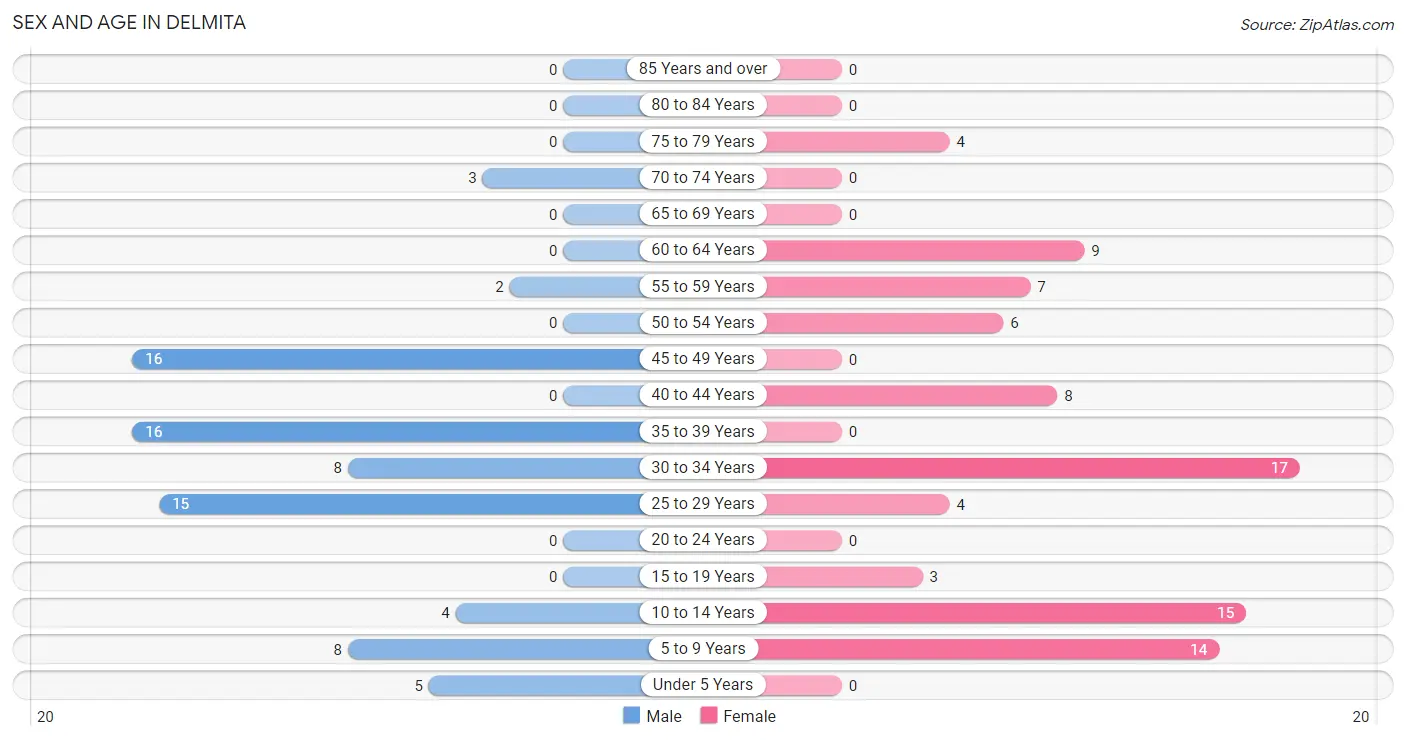
Sex and Age in Delmita
Sex and Age in Delmita
The most populous age groups in Delmita are 35 to 39 Years (16 | 20.8%) for men and 30 to 34 Years (17 | 19.5%) for women.
| Age Bracket | Male | Female |
| Under 5 Years | 5 (6.5%) | 0 (0.0%) |
| 5 to 9 Years | 8 (10.4%) | 14 (16.1%) |
| 10 to 14 Years | 4 (5.2%) | 15 (17.2%) |
| 15 to 19 Years | 0 (0.0%) | 3 (3.5%) |
| 20 to 24 Years | 0 (0.0%) | 0 (0.0%) |
| 25 to 29 Years | 15 (19.5%) | 4 (4.6%) |
| 30 to 34 Years | 8 (10.4%) | 17 (19.5%) |
| 35 to 39 Years | 16 (20.8%) | 0 (0.0%) |
| 40 to 44 Years | 0 (0.0%) | 8 (9.2%) |
| 45 to 49 Years | 16 (20.8%) | 0 (0.0%) |
| 50 to 54 Years | 0 (0.0%) | 6 (6.9%) |
| 55 to 59 Years | 2 (2.6%) | 7 (8.1%) |
| 60 to 64 Years | 0 (0.0%) | 9 (10.3%) |
| 65 to 69 Years | 0 (0.0%) | 0 (0.0%) |
| 70 to 74 Years | 3 (3.9%) | 0 (0.0%) |
| 75 to 79 Years | 0 (0.0%) | 4 (4.6%) |
| 80 to 84 Years | 0 (0.0%) | 0 (0.0%) |
| 85 Years and over | 0 (0.0%) | 0 (0.0%) |
| Total | 77 (100.0%) | 87 (100.0%) |
Families and Households in Delmita
Median Family Size in Delmita
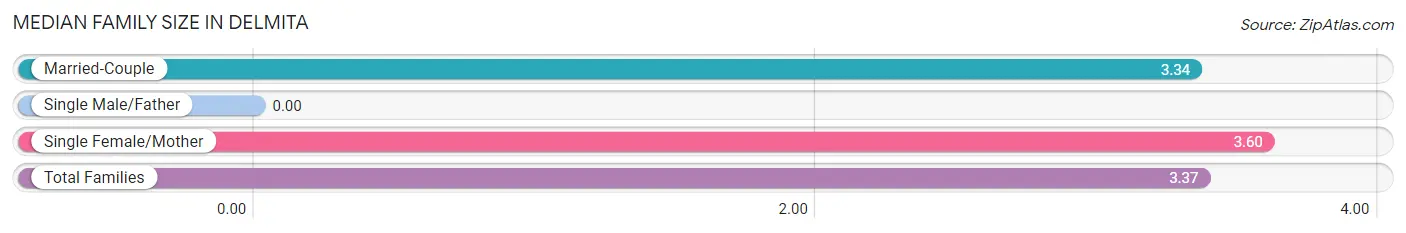
| Family Type | # Families | Family Size |
| Married-Couple | 41 (89.1%) | 3.34 |
| Single Male/Father | 0 (0.0%) | - |
| Single Female/Mother | 5 (10.9%) | 3.60 |
| Total Families | 46 (100.0%) | 3.37 |
Median Household Size in Delmita
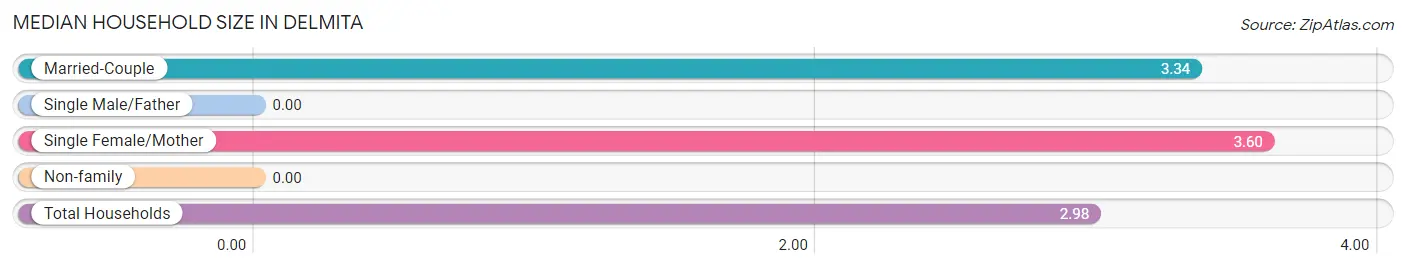
| Household Type | # Households | Household Size |
| Married-Couple | 41 (74.6%) | 3.34 |
| Single Male/Father | 0 (0.0%) | - |
| Single Female/Mother | 5 (9.1%) | 3.60 |
| Non-family | 9 (16.4%) | - |
| Total Households | 55 (100.0%) | 2.98 |
Household Size by Marriage Status in Delmita
Out of a total of 55 households in Delmita, 46 (83.6%) are family households, while 9 (16.4%) are nonfamily households. The most numerous type of family households are 3-person households, comprising 20, and the most common type of nonfamily households are 1-person households, comprising 9.
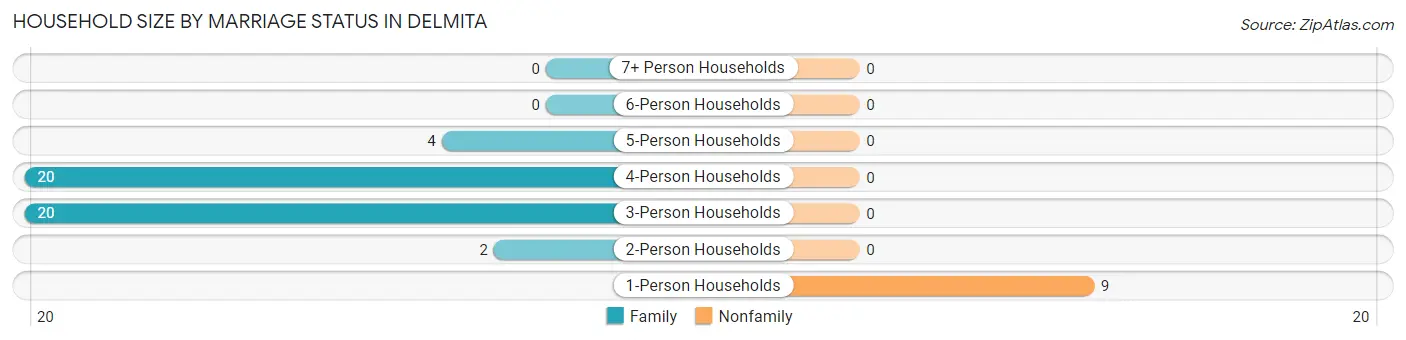
| Household Size | Family Households | Nonfamily Households |
| 1-Person Households | - | 9 (16.4%) |
| 2-Person Households | 2 (3.6%) | 0 (0.0%) |
| 3-Person Households | 20 (36.4%) | 0 (0.0%) |
| 4-Person Households | 20 (36.4%) | 0 (0.0%) |
| 5-Person Households | 4 (7.3%) | 0 (0.0%) |
| 6-Person Households | 0 (0.0%) | 0 (0.0%) |
| 7+ Person Households | 0 (0.0%) | 0 (0.0%) |
| Total | 46 (83.6%) | 9 (16.4%) |
Female Fertility in Delmita
Fertility by Age in Delmita
| Age Bracket | Women with Births | Births / 1,000 Women |
| 15 to 19 years | 0 (0.0%) | 0.0 |
| 20 to 34 years | 0 (0.0%) | 0.0 |
| 35 to 50 years | 0 (0.0%) | 0.0 |
| Total | 0 (0.0%) | 0.0 |
Fertility by Age by Marriage Status in Delmita
| Age Bracket | Married | Unmarried |
| 15 to 19 years | 0 (0.0%) | 0 (0.0%) |
| 20 to 34 years | 0 (0.0%) | 0 (0.0%) |
| 35 to 50 years | 0 (0.0%) | 0 (0.0%) |
| Total | 0 (0.0%) | 0 (0.0%) |
Fertility by Education in Delmita
| Educational Attainment | Women with Births | Births / 1,000 Women |
| Less than High School | 0 (0.0%) | 0.0 |
| High School Diploma | 0 (0.0%) | 0.0 |
| College or Associate's Degree | 0 (0.0%) | 0.0 |
| Bachelor's Degree | 0 (0.0%) | 0.0 |
| Graduate Degree | 0 (0.0%) | 0.0 |
| Total | 0 (0.0%) | 0.0 |
Fertility by Education by Marriage Status in Delmita
| Educational Attainment | Married | Unmarried |
| Less than High School | 0 (0.0%) | 0 (0.0%) |
| High School Diploma | 0 (0.0%) | 0 (0.0%) |
| College or Associate's Degree | 0 (0.0%) | 0 (0.0%) |
| Bachelor's Degree | 0 (0.0%) | 0 (0.0%) |
| Graduate Degree | 0 (0.0%) | 0 (0.0%) |
| Total | 0 (0.0%) | 0 (0.0%) |
Employment Characteristics in Delmita
Employment by Class of Employer in Delmita
Among the 76 employed individuals in Delmita, private company employees (58 | 76.3%), local government employees (10 | 13.2%), and not-for-profit organizations (8 | 10.5%) make up the most common classes of employment.
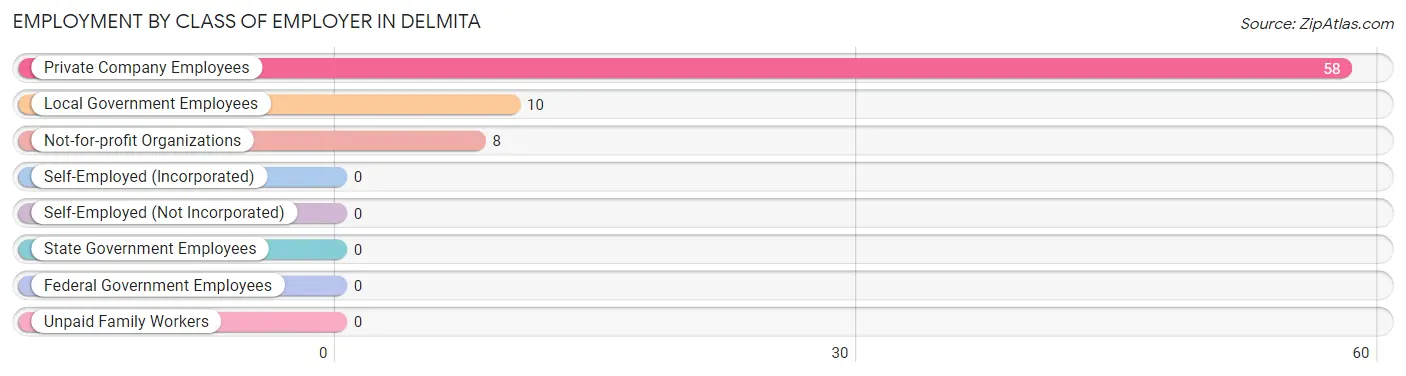
| Employer Class | # Employees | % Employees |
| Private Company Employees | 58 | 76.3% |
| Self-Employed (Incorporated) | 0 | 0.0% |
| Self-Employed (Not Incorporated) | 0 | 0.0% |
| Not-for-profit Organizations | 8 | 10.5% |
| Local Government Employees | 10 | 13.2% |
| State Government Employees | 0 | 0.0% |
| Federal Government Employees | 0 | 0.0% |
| Unpaid Family Workers | 0 | 0.0% |
| Total | 76 | 100.0% |
Employment Status by Age in Delmita
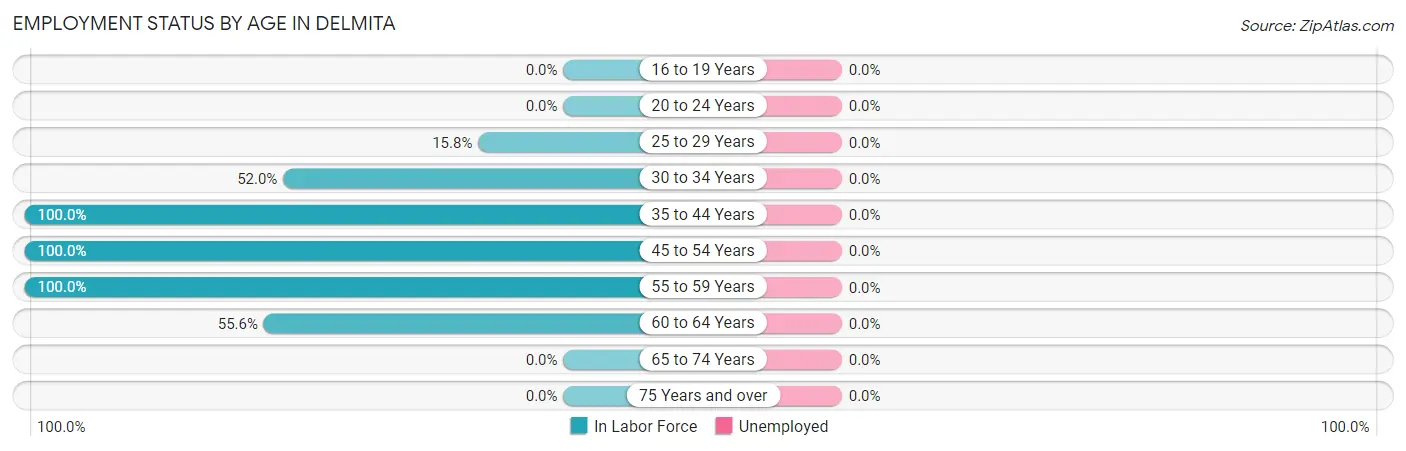
| Age Bracket | In Labor Force | Unemployed |
| 16 to 19 Years | 0 (0.0%) | 0 (0.0%) |
| 20 to 24 Years | 0 (0.0%) | 0 (0.0%) |
| 25 to 29 Years | 3 (15.8%) | 0 (0.0%) |
| 30 to 34 Years | 13 (52.0%) | 0 (0.0%) |
| 35 to 44 Years | 24 (100.0%) | 0 (0.0%) |
| 45 to 54 Years | 22 (100.0%) | 0 (0.0%) |
| 55 to 59 Years | 9 (100.0%) | 0 (0.0%) |
| 60 to 64 Years | 5 (55.6%) | 0 (0.0%) |
| 65 to 74 Years | 0 (0.0%) | 0 (0.0%) |
| 75 Years and over | 0 (0.0%) | 0 (0.0%) |
| Total | 76 (66.1%) | 0 (0.0%) |
Employment Status by Educational Attainment in Delmita
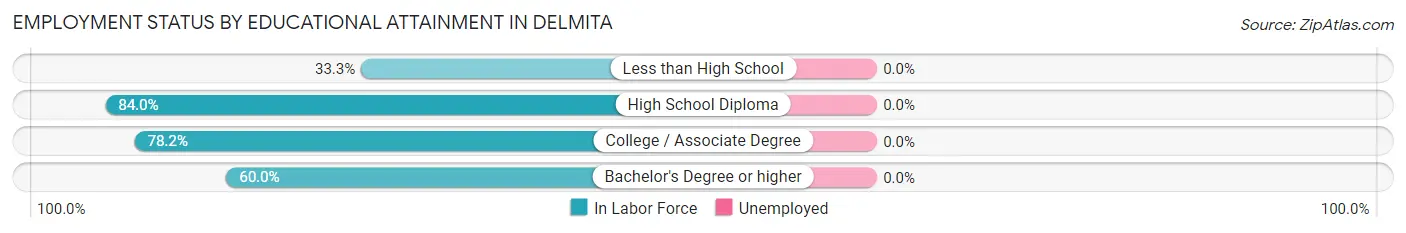
| Educational Attainment | In Labor Force | Unemployed |
| Less than High School | 6 (33.3%) | 0 (0.0%) |
| High School Diploma | 21 (84.0%) | 0 (0.0%) |
| College / Associate Degree | 43 (78.2%) | 0 (0.0%) |
| Bachelor's Degree or higher | 6 (60.0%) | 0 (0.0%) |
| Total | 76 (70.4%) | 0 (0.0%) |
Employment Occupations by Sex in Delmita
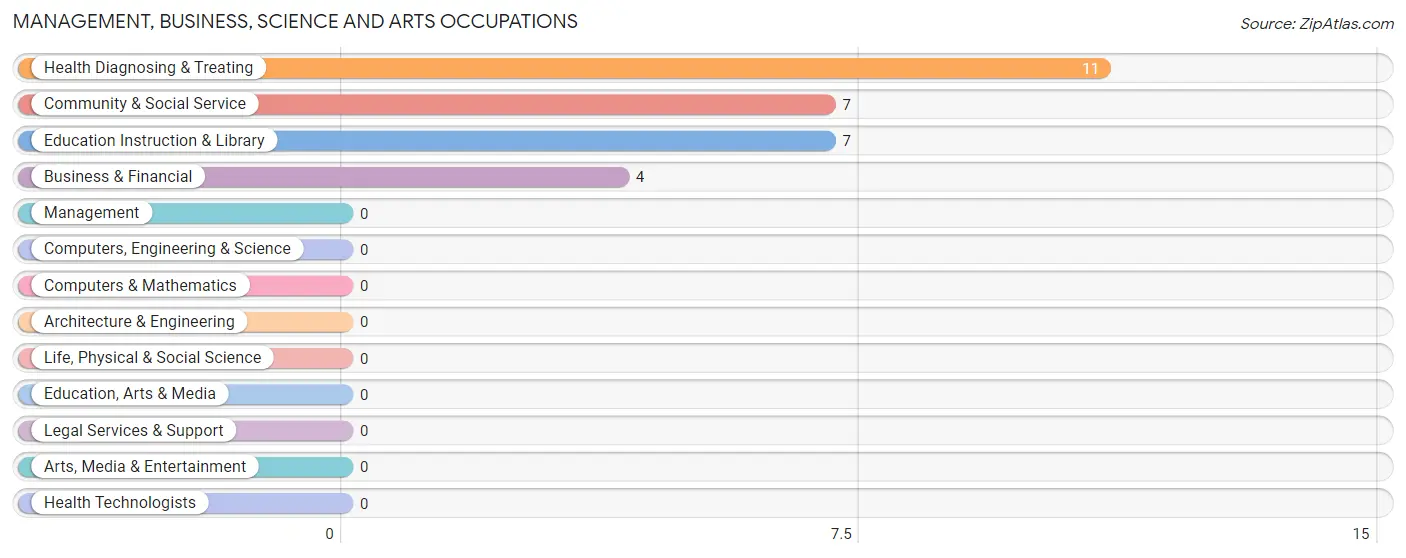
Management, Business, Science and Arts Occupations
The most common Management, Business, Science and Arts occupations in Delmita are Health Diagnosing & Treating (11 | 14.5%), Community & Social Service (7 | 9.2%), Education Instruction & Library (7 | 9.2%), and Business & Financial (4 | 5.3%).
Management, Business, Science and Arts Occupations by Sex
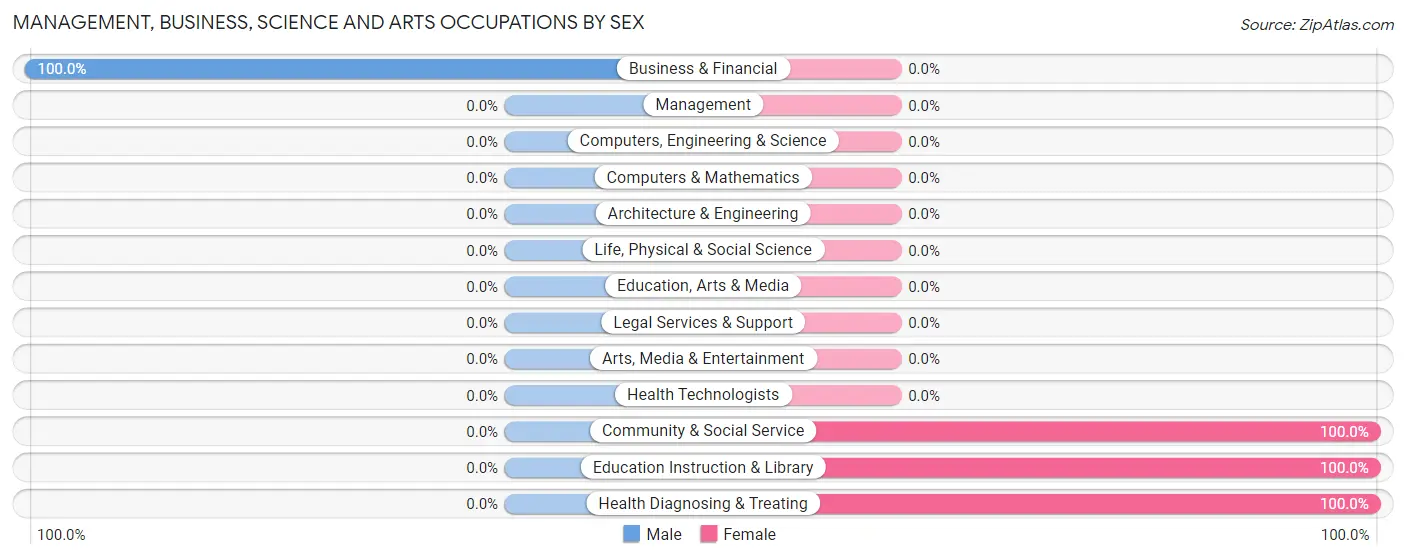
| Occupation | Male | Female |
| Management | 0 (0.0%) | 0 (0.0%) |
| Business & Financial | 4 (100.0%) | 0 (0.0%) |
| Computers, Engineering & Science | 0 (0.0%) | 0 (0.0%) |
| Computers & Mathematics | 0 (0.0%) | 0 (0.0%) |
| Architecture & Engineering | 0 (0.0%) | 0 (0.0%) |
| Life, Physical & Social Science | 0 (0.0%) | 0 (0.0%) |
| Community & Social Service | 0 (0.0%) | 7 (100.0%) |
| Education, Arts & Media | 0 (0.0%) | 0 (0.0%) |
| Legal Services & Support | 0 (0.0%) | 0 (0.0%) |
| Education Instruction & Library | 0 (0.0%) | 7 (100.0%) |
| Arts, Media & Entertainment | 0 (0.0%) | 0 (0.0%) |
| Health Diagnosing & Treating | 0 (0.0%) | 11 (100.0%) |
| Health Technologists | 0 (0.0%) | 0 (0.0%) |
| Total (Category) | 4 (18.2%) | 18 (81.8%) |
| Total (Overall) | 45 (59.2%) | 31 (40.8%) |
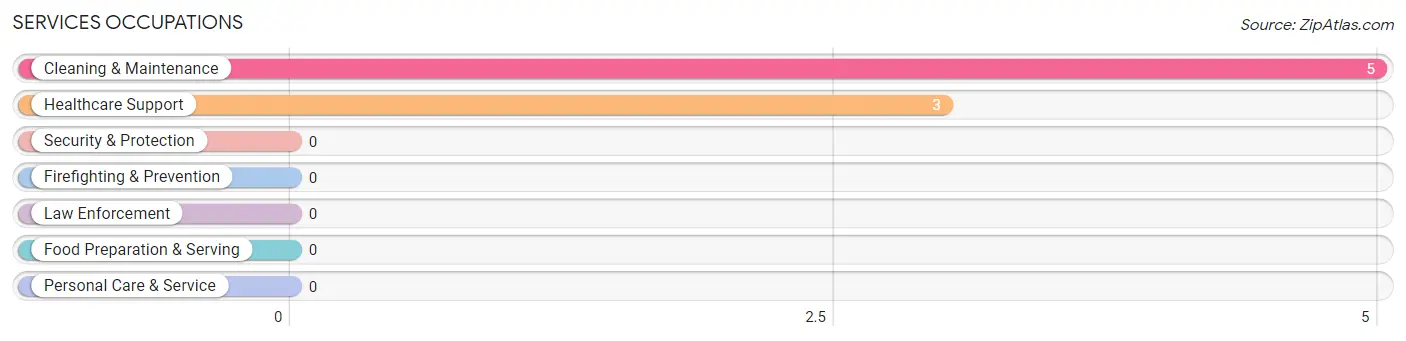
Services Occupations
The most common Services occupations in Delmita are Cleaning & Maintenance (5 | 6.6%), and Healthcare Support (3 | 4.0%).
Services Occupations by Sex
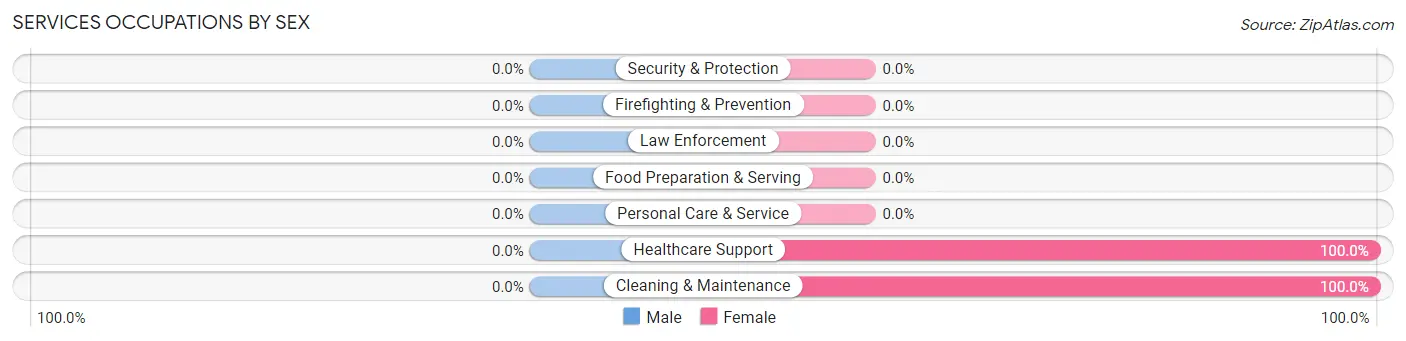
| Occupation | Male | Female |
| Healthcare Support | 0 (0.0%) | 3 (100.0%) |
| Security & Protection | 0 (0.0%) | 0 (0.0%) |
| Firefighting & Prevention | 0 (0.0%) | 0 (0.0%) |
| Law Enforcement | 0 (0.0%) | 0 (0.0%) |
| Food Preparation & Serving | 0 (0.0%) | 0 (0.0%) |
| Cleaning & Maintenance | 0 (0.0%) | 5 (100.0%) |
| Personal Care & Service | 0 (0.0%) | 0 (0.0%) |
| Total (Category) | 0 (0.0%) | 8 (100.0%) |
| Total (Overall) | 45 (59.2%) | 31 (40.8%) |
Sales and Office Occupations
The most common Sales and Office occupations in Delmita are , and Office & Administration (5 | 6.6%).
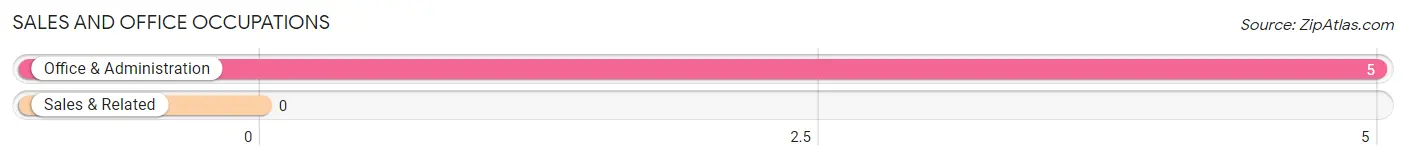
Sales and Office Occupations by Sex

| Occupation | Male | Female |
| Sales & Related | 0 (0.0%) | 0 (0.0%) |
| Office & Administration | 0 (0.0%) | 5 (100.0%) |
| Total (Category) | 0 (0.0%) | 5 (100.0%) |
| Total (Overall) | 45 (59.2%) | 31 (40.8%) |
Natural Resources, Construction and Maintenance Occupations
The most common Natural Resources, Construction and Maintenance occupations in Delmita are Construction & Extraction (3 | 4.0%), and Installation, Maintenance & Repair (2 | 2.6%).
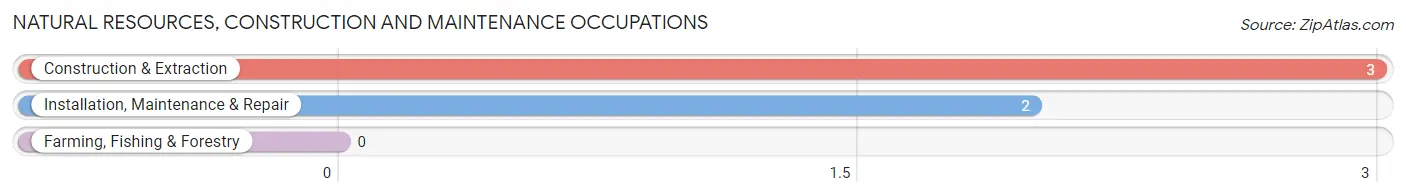
Natural Resources, Construction and Maintenance Occupations by Sex
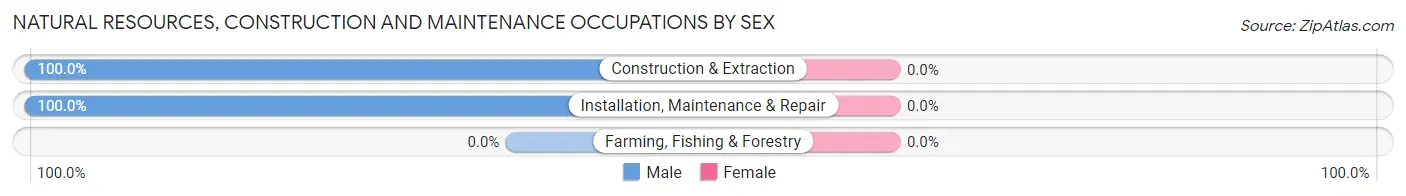
| Occupation | Male | Female |
| Farming, Fishing & Forestry | 0 (0.0%) | 0 (0.0%) |
| Construction & Extraction | 3 (100.0%) | 0 (0.0%) |
| Installation, Maintenance & Repair | 2 (100.0%) | 0 (0.0%) |
| Total (Category) | 5 (100.0%) | 0 (0.0%) |
| Total (Overall) | 45 (59.2%) | 31 (40.8%) |
Production, Transportation and Moving Occupations
The most common Production, Transportation and Moving occupations in Delmita are Production (20 | 26.3%), and Transportation (16 | 21.0%).
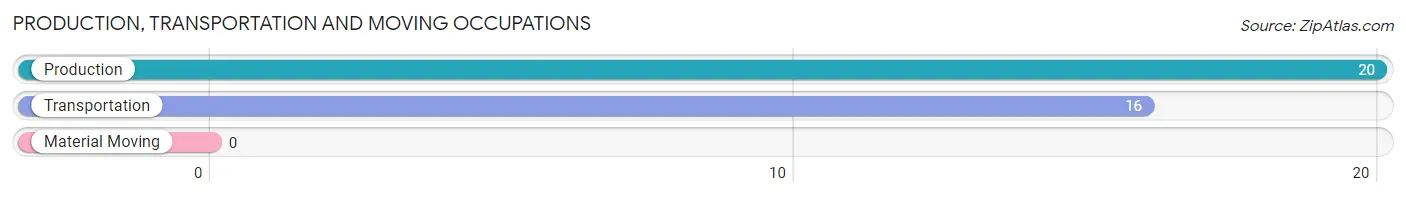
Production, Transportation and Moving Occupations by Sex
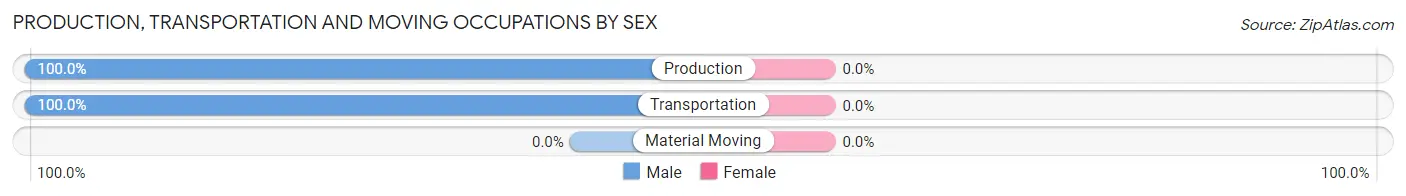
| Occupation | Male | Female |
| Production | 20 (100.0%) | 0 (0.0%) |
| Transportation | 16 (100.0%) | 0 (0.0%) |
| Material Moving | 0 (0.0%) | 0 (0.0%) |
| Total (Category) | 36 (100.0%) | 0 (0.0%) |
| Total (Overall) | 45 (59.2%) | 31 (40.8%) |
Employment Industries by Sex in Delmita
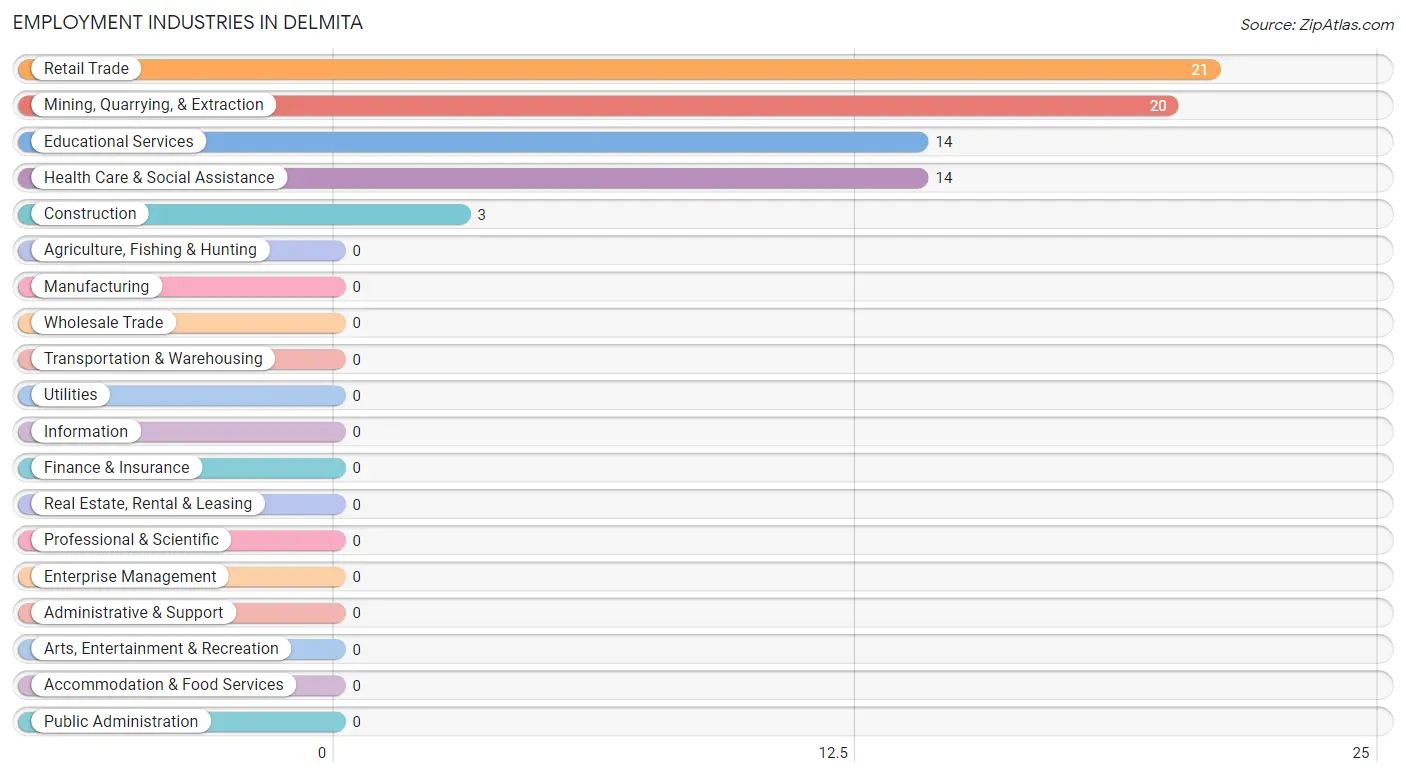
Employment Industries in Delmita
The major employment industries in Delmita include Retail Trade (21 | 27.6%), Mining, Quarrying, & Extraction (20 | 26.3%), Educational Services (14 | 18.4%), Health Care & Social Assistance (14 | 18.4%), and Construction (3 | 4.0%).
Employment Industries by Sex in Delmita
The Delmita industries that see more men than women are Mining, Quarrying, & Extraction (100.0%), Construction (100.0%), and Retail Trade (76.2%), whereas the industries that tend to have a higher number of women are Health Care & Social Assistance (100.0%), Educational Services (85.7%), and Retail Trade (23.8%).
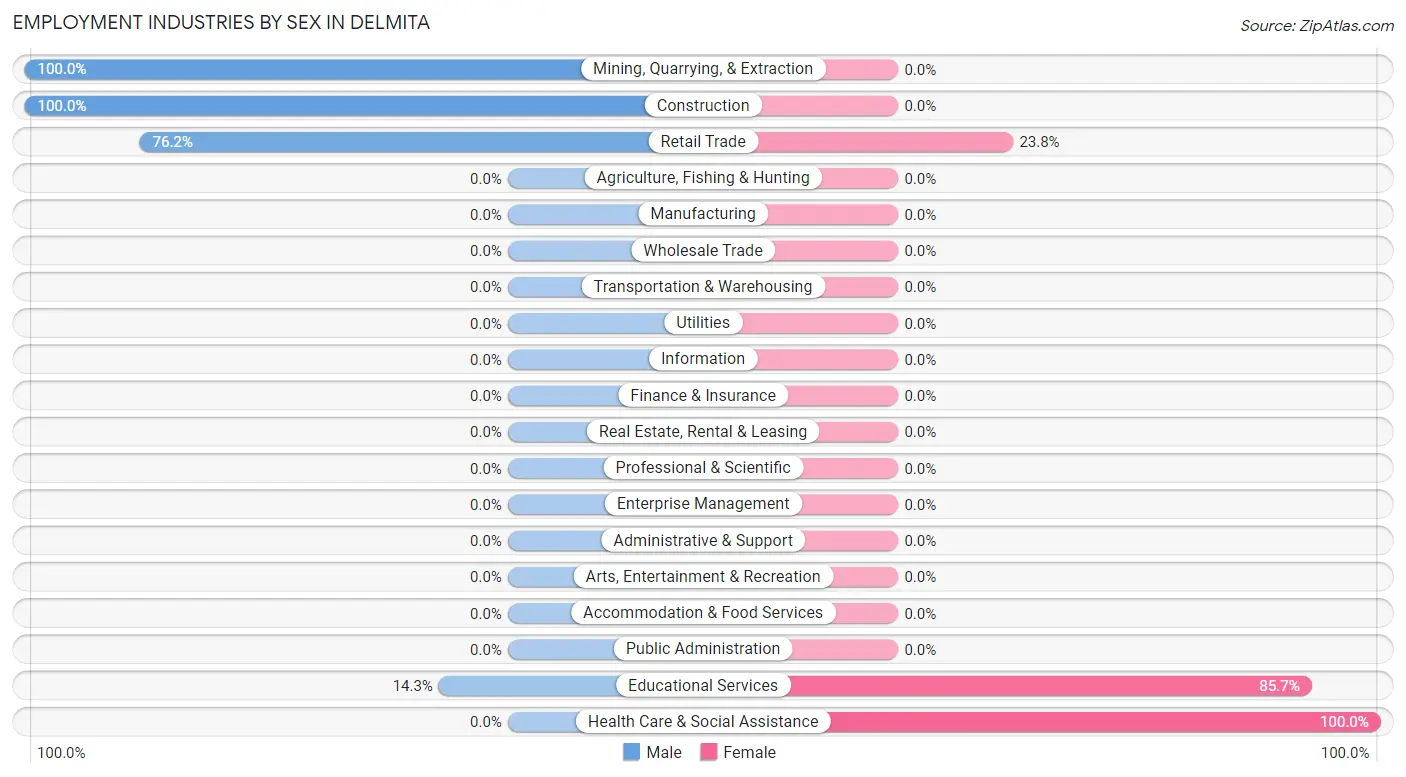
| Industry | Male | Female |
| Agriculture, Fishing & Hunting | 0 (0.0%) | 0 (0.0%) |
| Mining, Quarrying, & Extraction | 20 (100.0%) | 0 (0.0%) |
| Construction | 3 (100.0%) | 0 (0.0%) |
| Manufacturing | 0 (0.0%) | 0 (0.0%) |
| Wholesale Trade | 0 (0.0%) | 0 (0.0%) |
| Retail Trade | 16 (76.2%) | 5 (23.8%) |
| Transportation & Warehousing | 0 (0.0%) | 0 (0.0%) |
| Utilities | 0 (0.0%) | 0 (0.0%) |
| Information | 0 (0.0%) | 0 (0.0%) |
| Finance & Insurance | 0 (0.0%) | 0 (0.0%) |
| Real Estate, Rental & Leasing | 0 (0.0%) | 0 (0.0%) |
| Professional & Scientific | 0 (0.0%) | 0 (0.0%) |
| Enterprise Management | 0 (0.0%) | 0 (0.0%) |
| Administrative & Support | 0 (0.0%) | 0 (0.0%) |
| Educational Services | 2 (14.3%) | 12 (85.7%) |
| Health Care & Social Assistance | 0 (0.0%) | 14 (100.0%) |
| Arts, Entertainment & Recreation | 0 (0.0%) | 0 (0.0%) |
| Accommodation & Food Services | 0 (0.0%) | 0 (0.0%) |
| Public Administration | 0 (0.0%) | 0 (0.0%) |
| Total | 45 (59.2%) | 31 (40.8%) |
Education in Delmita
School Enrollment in Delmita
The most common levels of schooling among the 53 students in Delmita are middle school (19 | 35.8%), nursery / preschool (14 | 26.4%), and college / undergraduate (9 | 17.0%).
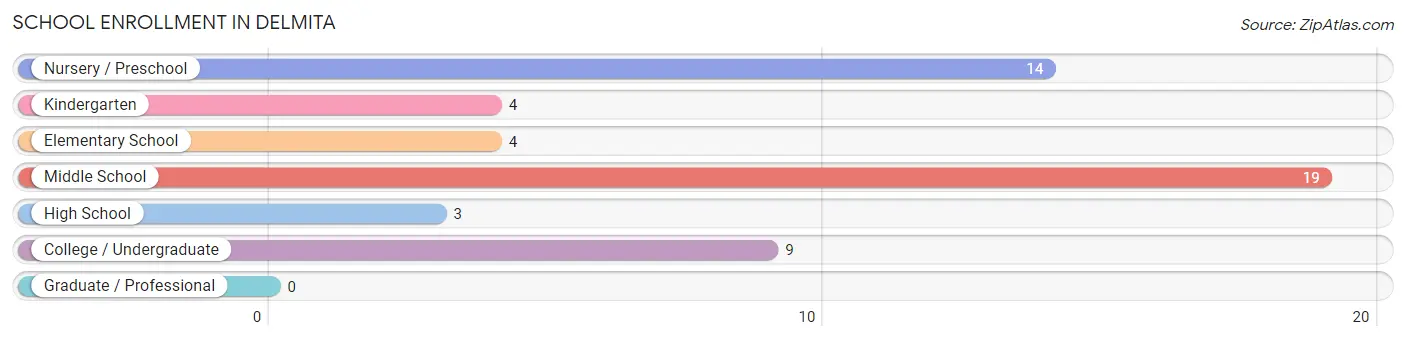
| School Level | # Students | % Students |
| Nursery / Preschool | 14 | 26.4% |
| Kindergarten | 4 | 7.5% |
| Elementary School | 4 | 7.5% |
| Middle School | 19 | 35.8% |
| High School | 3 | 5.7% |
| College / Undergraduate | 9 | 17.0% |
| Graduate / Professional | 0 | 0.0% |
| Total | 53 | 100.0% |
School Enrollment by Age by Funding Source in Delmita
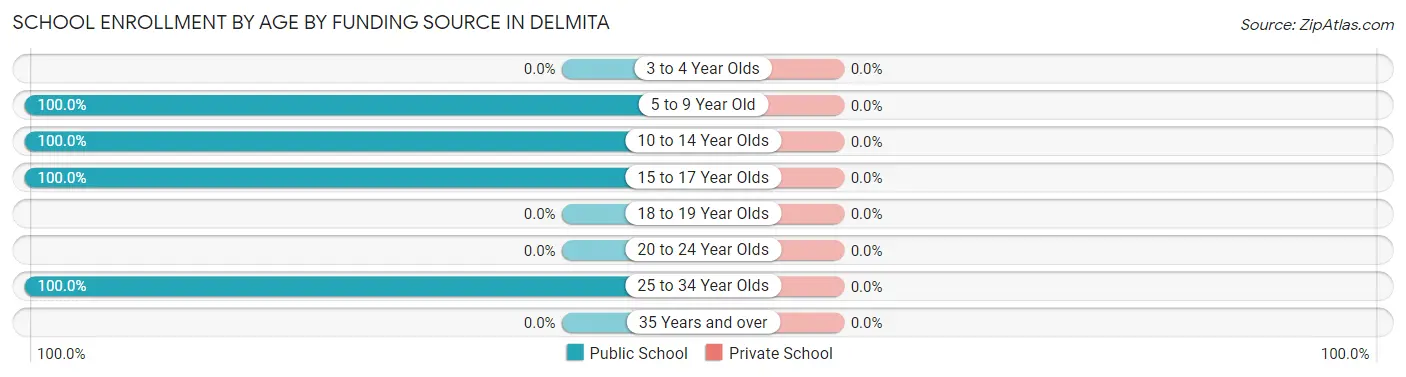
| Age Bracket | Public School | Private School |
| 3 to 4 Year Olds | 0 (0.0%) | 0 (0.0%) |
| 5 to 9 Year Old | 22 (100.0%) | 0 (0.0%) |
| 10 to 14 Year Olds | 19 (100.0%) | 0 (0.0%) |
| 15 to 17 Year Olds | 3 (100.0%) | 0 (0.0%) |
| 18 to 19 Year Olds | 0 (0.0%) | 0 (0.0%) |
| 20 to 24 Year Olds | 0 (0.0%) | 0 (0.0%) |
| 25 to 34 Year Olds | 9 (100.0%) | 0 (0.0%) |
| 35 Years and over | 0 (0.0%) | 0 (0.0%) |
| Total | 53 (100.0%) | 0 (0.0%) |
Educational Attainment by Field of Study in Delmita
Business (8 | 80.0%), and education (2 | 20.0%) are the most common fields of study among 10 individuals in Delmita who have obtained a bachelor's degree or higher.
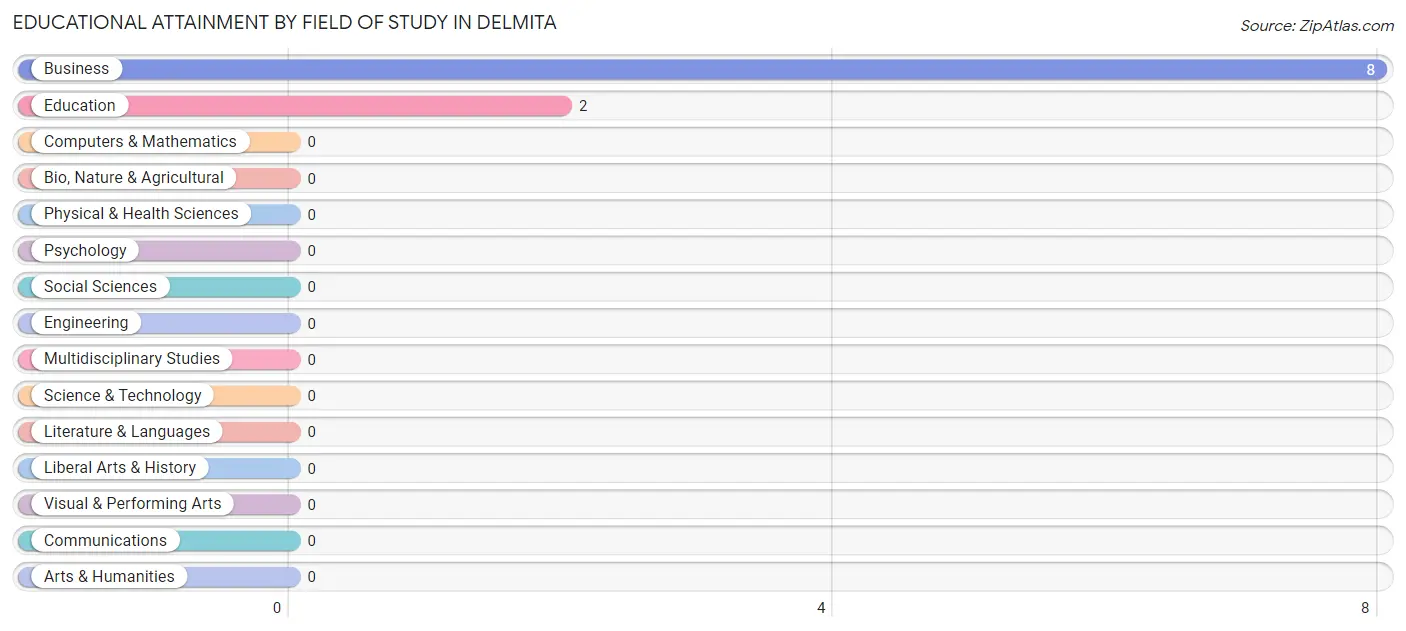
| Field of Study | # Graduates | % Graduates |
| Computers & Mathematics | 0 | 0.0% |
| Bio, Nature & Agricultural | 0 | 0.0% |
| Physical & Health Sciences | 0 | 0.0% |
| Psychology | 0 | 0.0% |
| Social Sciences | 0 | 0.0% |
| Engineering | 0 | 0.0% |
| Multidisciplinary Studies | 0 | 0.0% |
| Science & Technology | 0 | 0.0% |
| Business | 8 | 80.0% |
| Education | 2 | 20.0% |
| Literature & Languages | 0 | 0.0% |
| Liberal Arts & History | 0 | 0.0% |
| Visual & Performing Arts | 0 | 0.0% |
| Communications | 0 | 0.0% |
| Arts & Humanities | 0 | 0.0% |
| Total | 10 | 100.0% |
Transportation & Commute in Delmita
Vehicle Availability by Sex in Delmita
The most prevalent vehicle ownership categories in Delmita are males with 2 vehicles (18, accounting for 40.0%) and females with 2 vehicles (2, making up 58.1%).
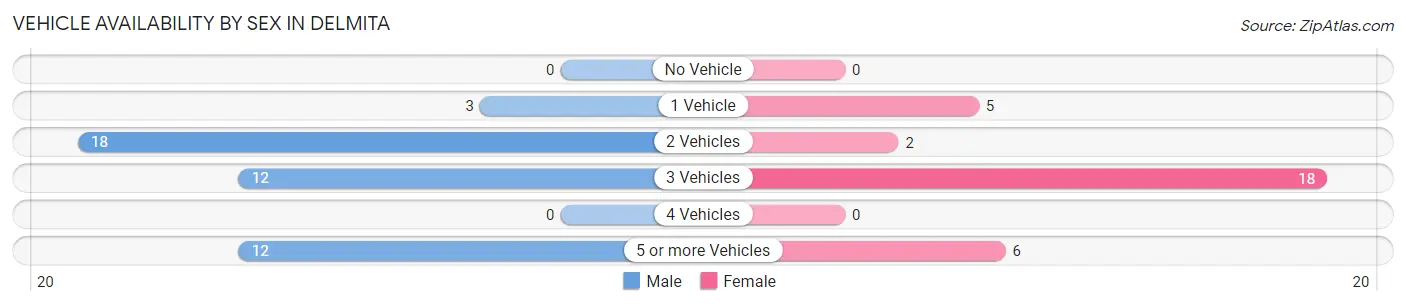
| Vehicles Available | Male | Female |
| No Vehicle | 0 (0.0%) | 0 (0.0%) |
| 1 Vehicle | 3 (6.7%) | 5 (16.1%) |
| 2 Vehicles | 18 (40.0%) | 2 (6.5%) |
| 3 Vehicles | 12 (26.7%) | 18 (58.1%) |
| 4 Vehicles | 0 (0.0%) | 0 (0.0%) |
| 5 or more Vehicles | 12 (26.7%) | 6 (19.4%) |
| Total | 45 (100.0%) | 31 (100.0%) |
Commute Time in Delmita
The most frequently occuring commute durations in Delmita are 10 to 14 minutes (25 commuters, 32.9%), 30 to 34 minutes (15 commuters, 19.7%), and 5 to 9 minutes (13 commuters, 17.1%).
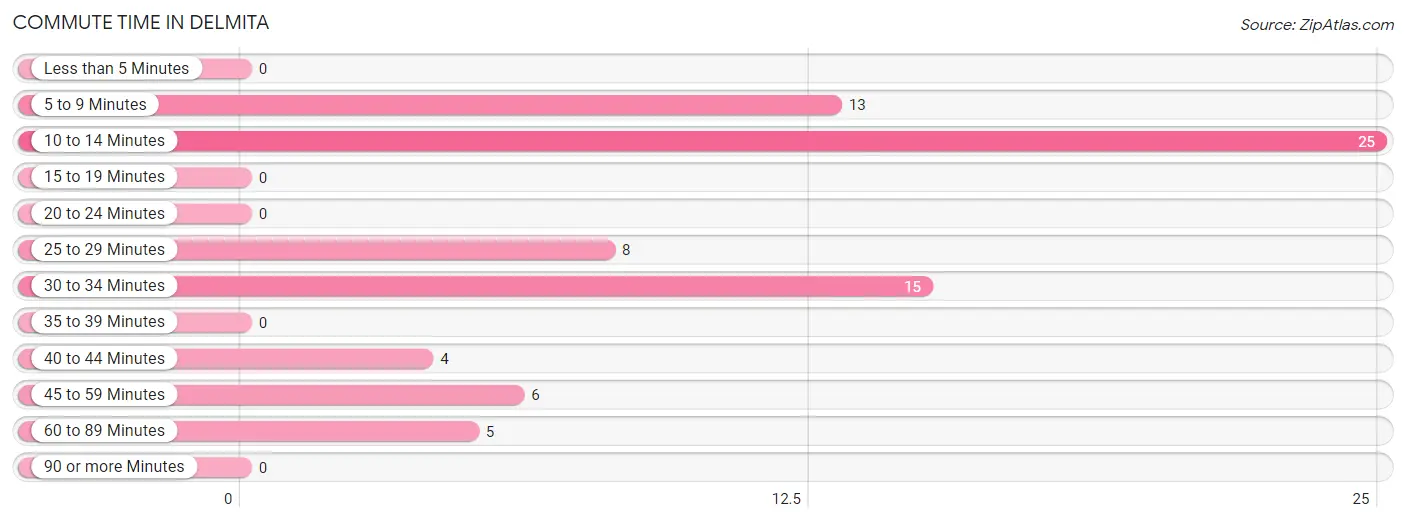
| Commute Time | # Commuters | % Commuters |
| Less than 5 Minutes | 0 | 0.0% |
| 5 to 9 Minutes | 13 | 17.1% |
| 10 to 14 Minutes | 25 | 32.9% |
| 15 to 19 Minutes | 0 | 0.0% |
| 20 to 24 Minutes | 0 | 0.0% |
| 25 to 29 Minutes | 8 | 10.5% |
| 30 to 34 Minutes | 15 | 19.7% |
| 35 to 39 Minutes | 0 | 0.0% |
| 40 to 44 Minutes | 4 | 5.3% |
| 45 to 59 Minutes | 6 | 7.9% |
| 60 to 89 Minutes | 5 | 6.6% |
| 90 or more Minutes | 0 | 0.0% |
Commute Time by Sex in Delmita
The most common commute times in Delmita are 10 to 14 minutes (18 commuters, 40.0%) for males and 5 to 9 minutes (13 commuters, 41.9%) for females.
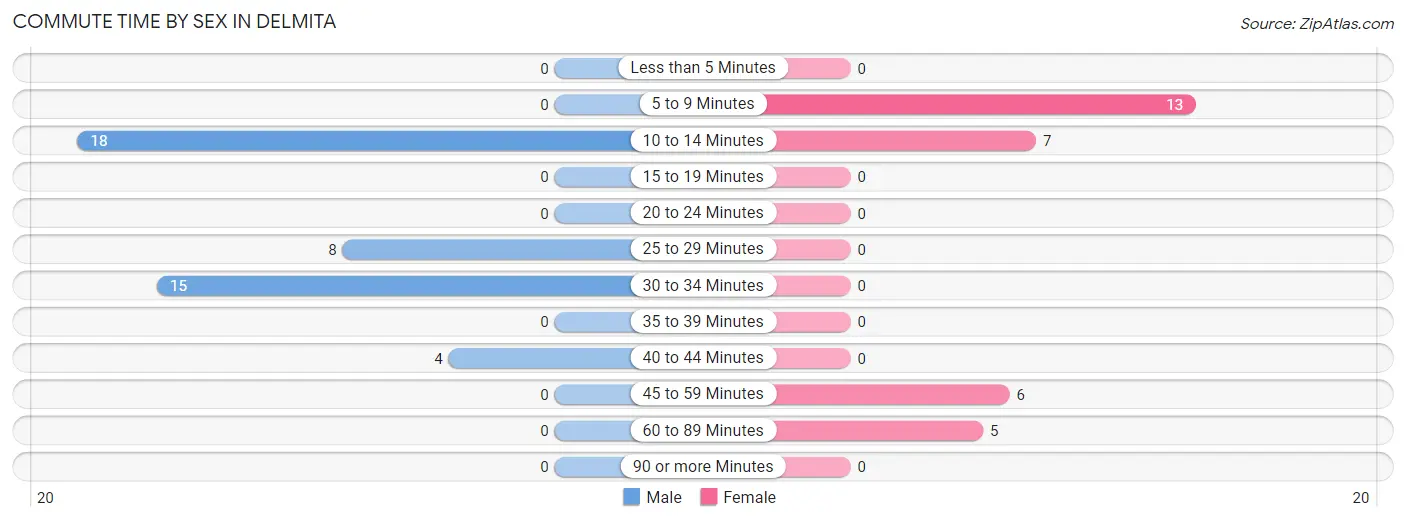
| Commute Time | Male | Female |
| Less than 5 Minutes | 0 (0.0%) | 0 (0.0%) |
| 5 to 9 Minutes | 0 (0.0%) | 13 (41.9%) |
| 10 to 14 Minutes | 18 (40.0%) | 7 (22.6%) |
| 15 to 19 Minutes | 0 (0.0%) | 0 (0.0%) |
| 20 to 24 Minutes | 0 (0.0%) | 0 (0.0%) |
| 25 to 29 Minutes | 8 (17.8%) | 0 (0.0%) |
| 30 to 34 Minutes | 15 (33.3%) | 0 (0.0%) |
| 35 to 39 Minutes | 0 (0.0%) | 0 (0.0%) |
| 40 to 44 Minutes | 4 (8.9%) | 0 (0.0%) |
| 45 to 59 Minutes | 0 (0.0%) | 6 (19.4%) |
| 60 to 89 Minutes | 0 (0.0%) | 5 (16.1%) |
| 90 or more Minutes | 0 (0.0%) | 0 (0.0%) |
Time of Departure to Work by Sex in Delmita
The most frequent times of departure to work in Delmita are 7:00 AM to 7:29 AM (27, 60.0%) for males and 7:00 AM to 7:29 AM (18, 58.1%) for females.
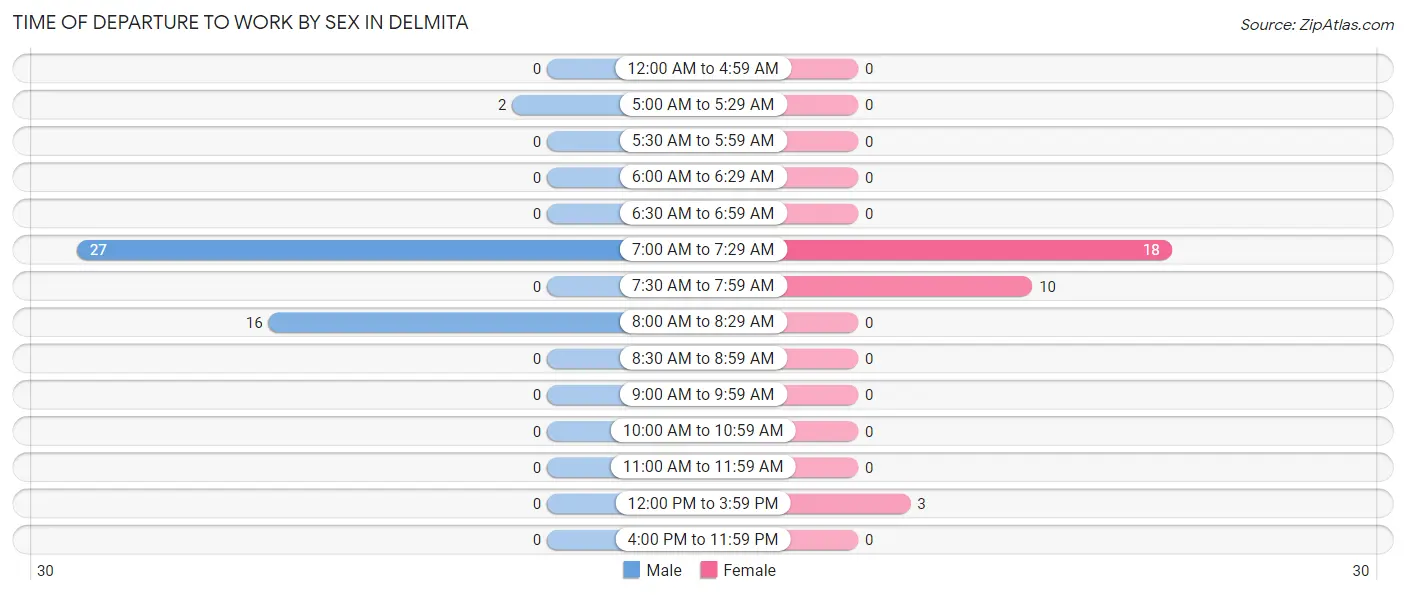
| Time of Departure | Male | Female |
| 12:00 AM to 4:59 AM | 0 (0.0%) | 0 (0.0%) |
| 5:00 AM to 5:29 AM | 2 (4.4%) | 0 (0.0%) |
| 5:30 AM to 5:59 AM | 0 (0.0%) | 0 (0.0%) |
| 6:00 AM to 6:29 AM | 0 (0.0%) | 0 (0.0%) |
| 6:30 AM to 6:59 AM | 0 (0.0%) | 0 (0.0%) |
| 7:00 AM to 7:29 AM | 27 (60.0%) | 18 (58.1%) |
| 7:30 AM to 7:59 AM | 0 (0.0%) | 10 (32.3%) |
| 8:00 AM to 8:29 AM | 16 (35.6%) | 0 (0.0%) |
| 8:30 AM to 8:59 AM | 0 (0.0%) | 0 (0.0%) |
| 9:00 AM to 9:59 AM | 0 (0.0%) | 0 (0.0%) |
| 10:00 AM to 10:59 AM | 0 (0.0%) | 0 (0.0%) |
| 11:00 AM to 11:59 AM | 0 (0.0%) | 0 (0.0%) |
| 12:00 PM to 3:59 PM | 0 (0.0%) | 3 (9.7%) |
| 4:00 PM to 11:59 PM | 0 (0.0%) | 0 (0.0%) |
| Total | 45 (100.0%) | 31 (100.0%) |
Housing Occupancy in Delmita
Occupancy by Ownership in Delmita
Of the total 55 dwellings in Delmita, owner-occupied units account for 31 (56.4%), while renter-occupied units make up 24 (43.6%).
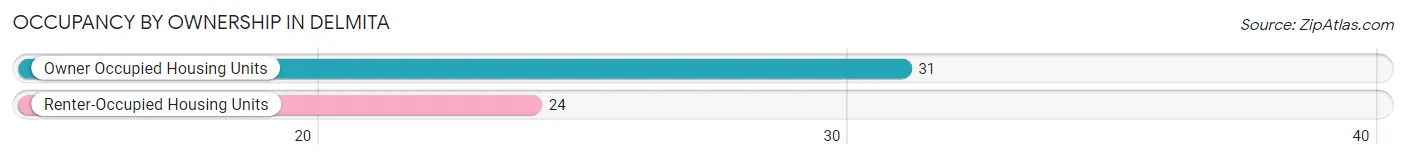
| Occupancy | # Housing Units | % Housing Units |
| Owner Occupied Housing Units | 31 | 56.4% |
| Renter-Occupied Housing Units | 24 | 43.6% |
| Total Occupied Housing Units | 55 | 100.0% |
Occupancy by Household Size in Delmita
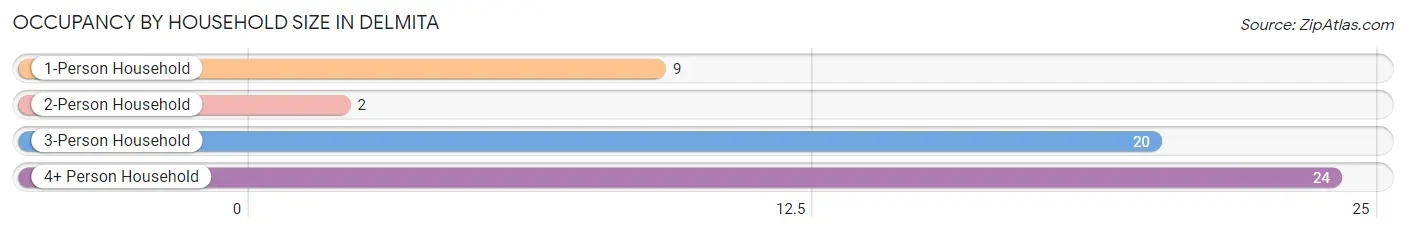
| Household Size | # Housing Units | % Housing Units |
| 1-Person Household | 9 | 16.4% |
| 2-Person Household | 2 | 3.6% |
| 3-Person Household | 20 | 36.4% |
| 4+ Person Household | 24 | 43.6% |
| Total Housing Units | 55 | 100.0% |
Occupancy by Ownership by Household Size in Delmita
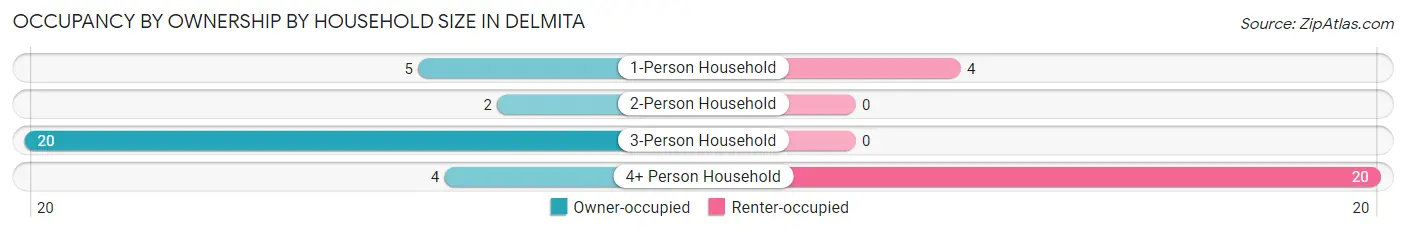
| Household Size | Owner-occupied | Renter-occupied |
| 1-Person Household | 5 (55.6%) | 4 (44.4%) |
| 2-Person Household | 2 (100.0%) | 0 (0.0%) |
| 3-Person Household | 20 (100.0%) | 0 (0.0%) |
| 4+ Person Household | 4 (16.7%) | 20 (83.3%) |
| Total Housing Units | 31 (56.4%) | 24 (43.6%) |
Occupancy by Educational Attainment in Delmita
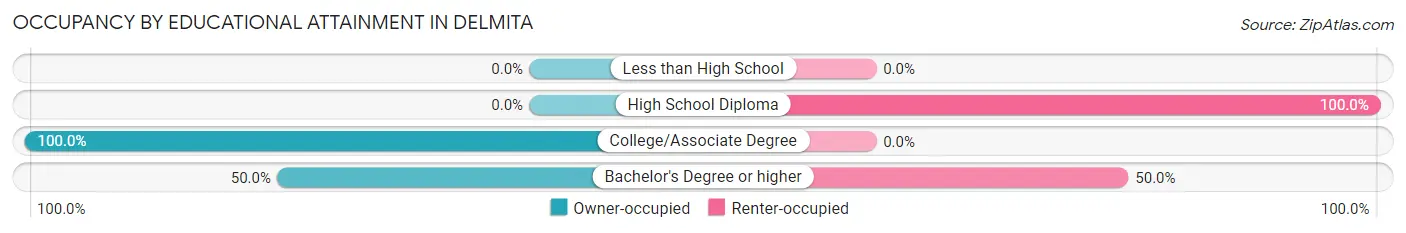
| Household Size | Owner-occupied | Renter-occupied |
| Less than High School | 0 (0.0%) | 0 (0.0%) |
| High School Diploma | 0 (0.0%) | 20 (100.0%) |
| College/Associate Degree | 27 (100.0%) | 0 (0.0%) |
| Bachelor's Degree or higher | 4 (50.0%) | 4 (50.0%) |
Occupancy by Age of Householder in Delmita
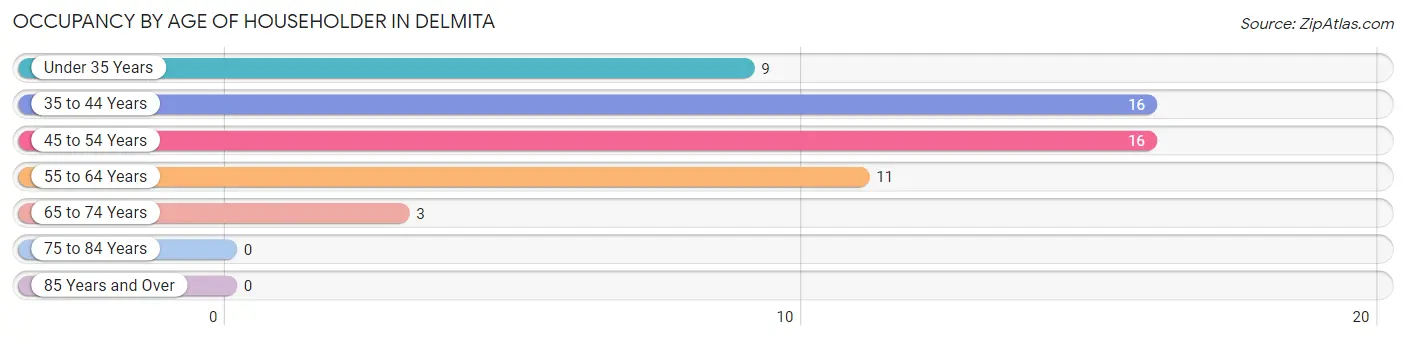
| Age Bracket | # Households | % Households |
| Under 35 Years | 9 | 16.4% |
| 35 to 44 Years | 16 | 29.1% |
| 45 to 54 Years | 16 | 29.1% |
| 55 to 64 Years | 11 | 20.0% |
| 65 to 74 Years | 3 | 5.4% |
| 75 to 84 Years | 0 | 0.0% |
| 85 Years and Over | 0 | 0.0% |
| Total | 55 | 100.0% |
Housing Finances in Delmita
Median Income by Occupancy in Delmita
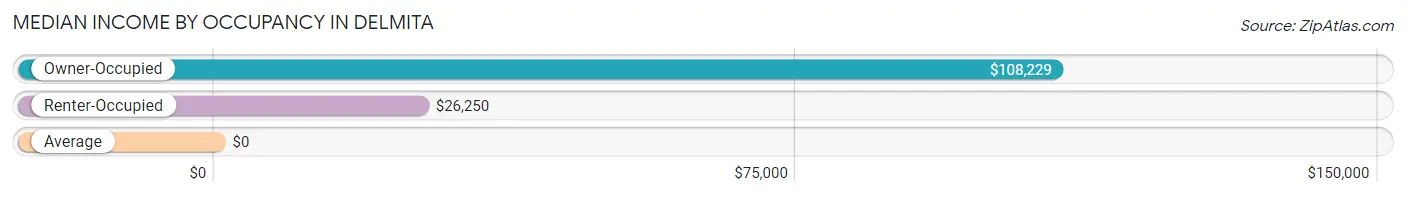
| Occupancy Type | # Households | Median Income |
| Owner-Occupied | 31 (56.4%) | $108,229 |
| Renter-Occupied | 24 (43.6%) | $26,250 |
| Average | 55 (100.0%) | $0 |
Occupancy by Householder Income Bracket in Delmita
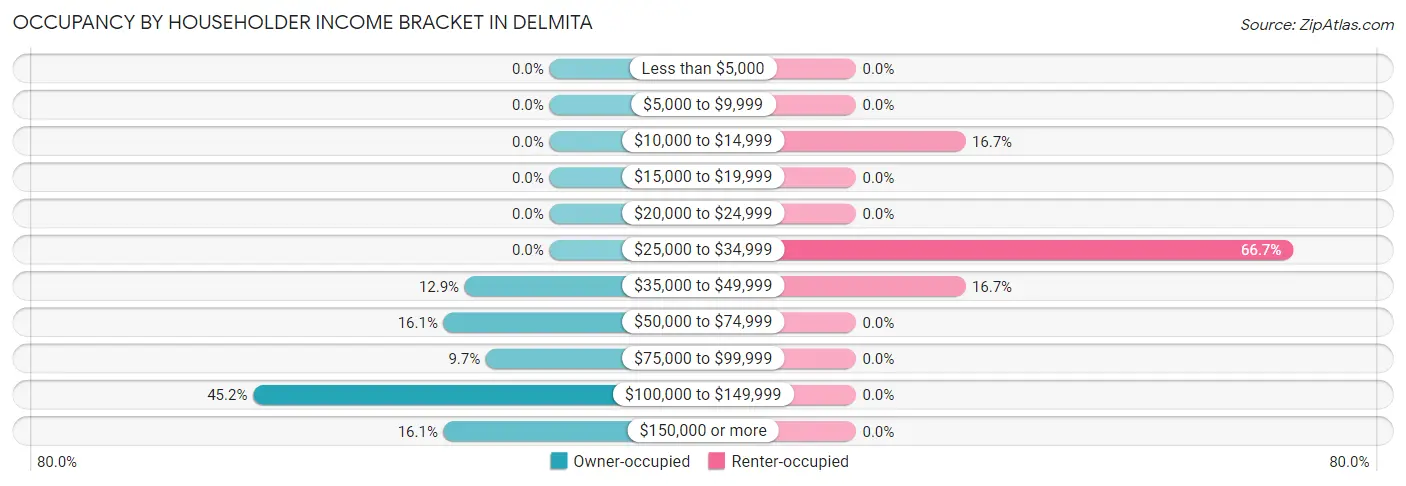
| Income Bracket | Owner-occupied | Renter-occupied |
| Less than $5,000 | 0 (0.0%) | 0 (0.0%) |
| $5,000 to $9,999 | 0 (0.0%) | 0 (0.0%) |
| $10,000 to $14,999 | 0 (0.0%) | 4 (16.7%) |
| $15,000 to $19,999 | 0 (0.0%) | 0 (0.0%) |
| $20,000 to $24,999 | 0 (0.0%) | 0 (0.0%) |
| $25,000 to $34,999 | 0 (0.0%) | 16 (66.7%) |
| $35,000 to $49,999 | 4 (12.9%) | 4 (16.7%) |
| $50,000 to $74,999 | 5 (16.1%) | 0 (0.0%) |
| $75,000 to $99,999 | 3 (9.7%) | 0 (0.0%) |
| $100,000 to $149,999 | 14 (45.2%) | 0 (0.0%) |
| $150,000 or more | 5 (16.1%) | 0 (0.0%) |
| Total | 31 (100.0%) | 24 (100.0%) |
Monthly Housing Cost Tiers in Delmita
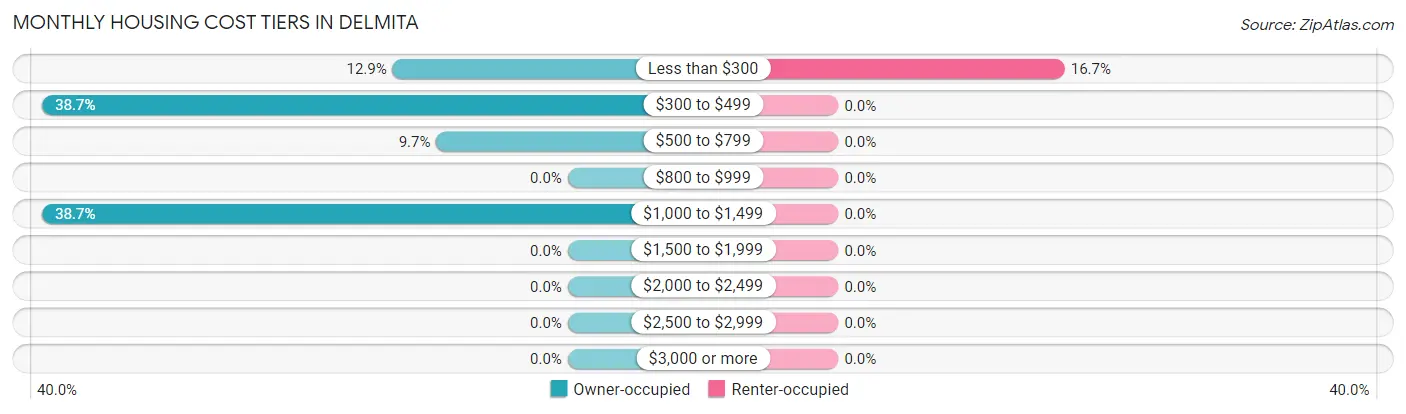
| Monthly Cost | Owner-occupied | Renter-occupied |
| Less than $300 | 4 (12.9%) | 4 (16.7%) |
| $300 to $499 | 12 (38.7%) | 0 (0.0%) |
| $500 to $799 | 3 (9.7%) | 0 (0.0%) |
| $800 to $999 | 0 (0.0%) | 0 (0.0%) |
| $1,000 to $1,499 | 12 (38.7%) | 0 (0.0%) |
| $1,500 to $1,999 | 0 (0.0%) | 0 (0.0%) |
| $2,000 to $2,499 | 0 (0.0%) | 0 (0.0%) |
| $2,500 to $2,999 | 0 (0.0%) | 0 (0.0%) |
| $3,000 or more | 0 (0.0%) | 0 (0.0%) |
| Total | 31 (100.0%) | 24 (100.0%) |
Physical Housing Characteristics in Delmita
Housing Structures in Delmita
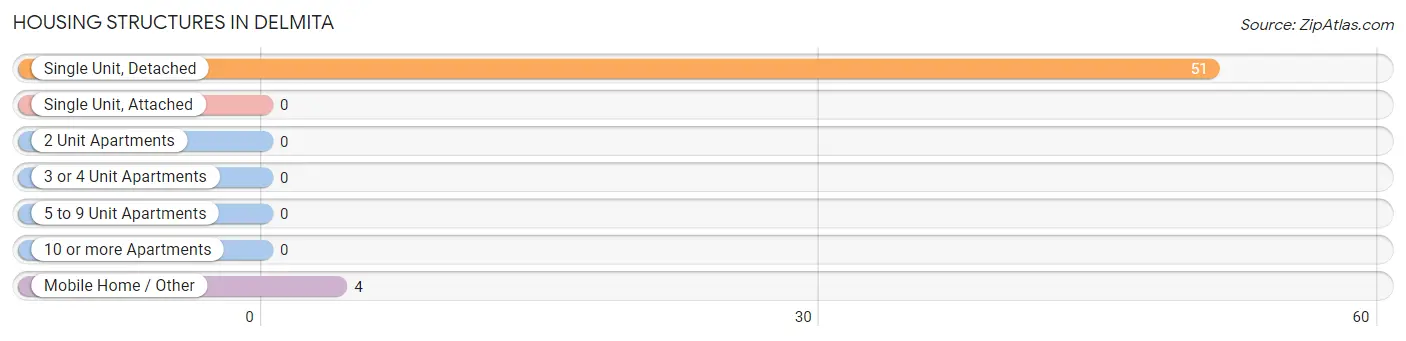
| Structure Type | # Housing Units | % Housing Units |
| Single Unit, Detached | 51 | 92.7% |
| Single Unit, Attached | 0 | 0.0% |
| 2 Unit Apartments | 0 | 0.0% |
| 3 or 4 Unit Apartments | 0 | 0.0% |
| 5 to 9 Unit Apartments | 0 | 0.0% |
| 10 or more Apartments | 0 | 0.0% |
| Mobile Home / Other | 4 | 7.3% |
| Total | 55 | 100.0% |
Housing Structures by Occupancy in Delmita
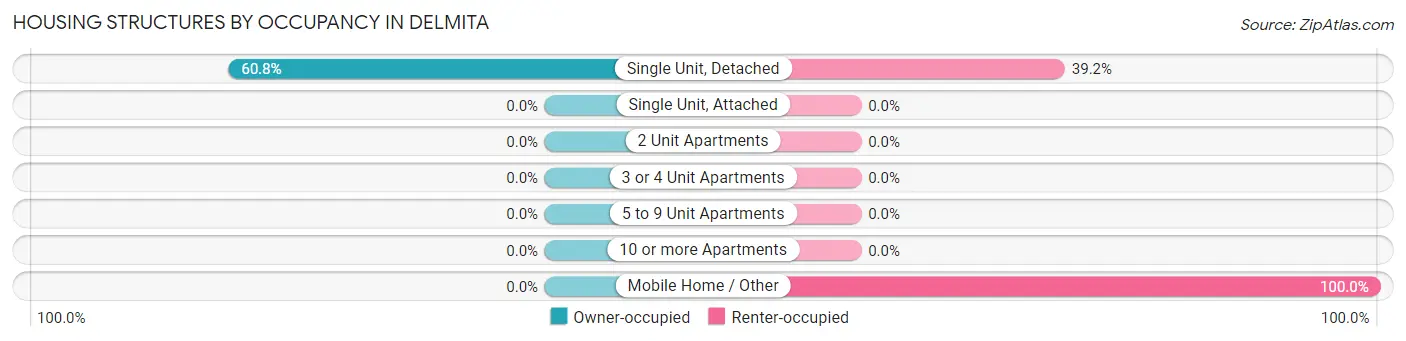
| Structure Type | Owner-occupied | Renter-occupied |
| Single Unit, Detached | 31 (60.8%) | 20 (39.2%) |
| Single Unit, Attached | 0 (0.0%) | 0 (0.0%) |
| 2 Unit Apartments | 0 (0.0%) | 0 (0.0%) |
| 3 or 4 Unit Apartments | 0 (0.0%) | 0 (0.0%) |
| 5 to 9 Unit Apartments | 0 (0.0%) | 0 (0.0%) |
| 10 or more Apartments | 0 (0.0%) | 0 (0.0%) |
| Mobile Home / Other | 0 (0.0%) | 4 (100.0%) |
| Total | 31 (56.4%) | 24 (43.6%) |
Housing Structures by Number of Rooms in Delmita
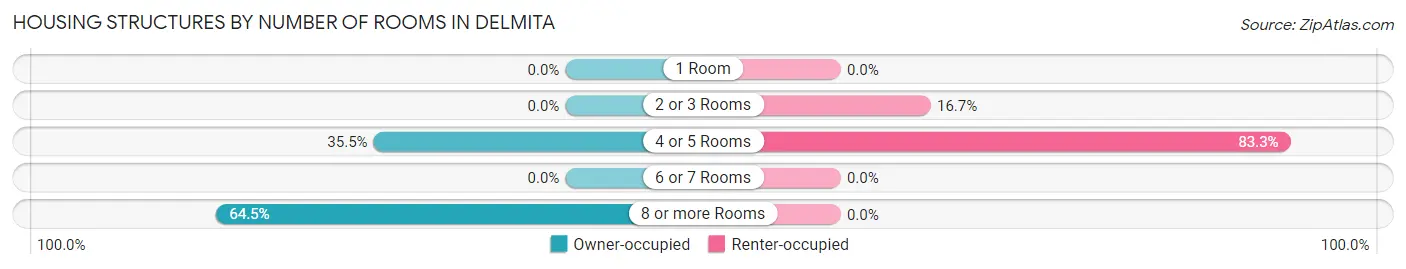
| Number of Rooms | Owner-occupied | Renter-occupied |
| 1 Room | 0 (0.0%) | 0 (0.0%) |
| 2 or 3 Rooms | 0 (0.0%) | 4 (16.7%) |
| 4 or 5 Rooms | 11 (35.5%) | 20 (83.3%) |
| 6 or 7 Rooms | 0 (0.0%) | 0 (0.0%) |
| 8 or more Rooms | 20 (64.5%) | 0 (0.0%) |
| Total | 31 (100.0%) | 24 (100.0%) |
Housing Structure by Heating Type in Delmita
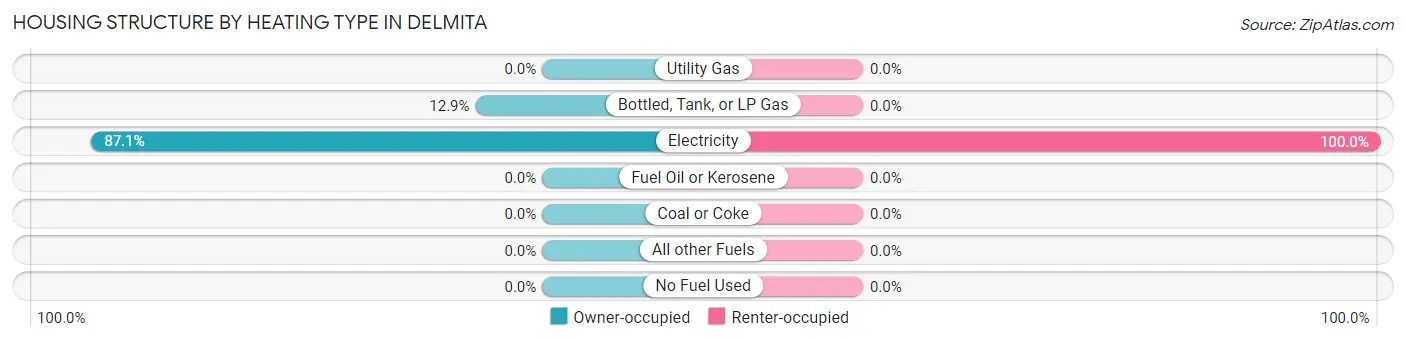
| Heating Type | Owner-occupied | Renter-occupied |
| Utility Gas | 0 (0.0%) | 0 (0.0%) |
| Bottled, Tank, or LP Gas | 4 (12.9%) | 0 (0.0%) |
| Electricity | 27 (87.1%) | 24 (100.0%) |
| Fuel Oil or Kerosene | 0 (0.0%) | 0 (0.0%) |
| Coal or Coke | 0 (0.0%) | 0 (0.0%) |
| All other Fuels | 0 (0.0%) | 0 (0.0%) |
| No Fuel Used | 0 (0.0%) | 0 (0.0%) |
| Total | 31 (100.0%) | 24 (100.0%) |
Household Vehicle Usage in Delmita
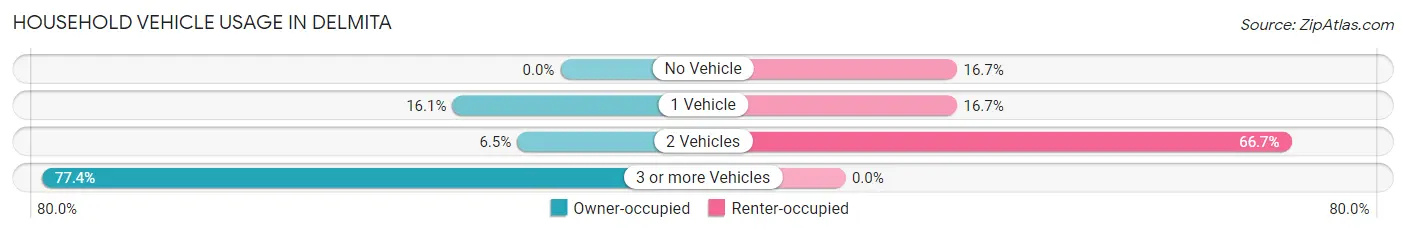
| Vehicles per Household | Owner-occupied | Renter-occupied |
| No Vehicle | 0 (0.0%) | 4 (16.7%) |
| 1 Vehicle | 5 (16.1%) | 4 (16.7%) |
| 2 Vehicles | 2 (6.5%) | 16 (66.7%) |
| 3 or more Vehicles | 24 (77.4%) | 0 (0.0%) |
| Total | 31 (100.0%) | 24 (100.0%) |
Real Estate & Mortgages in Delmita
Real Estate and Mortgage Overview in Delmita
| Characteristic | Without Mortgage | With Mortgage |
| Housing Units | 19 | 12 |
| Median Property Value | $80,600 | $0 |
| Median Household Income | $92,917 | $0 |
| Monthly Housing Costs | $339 | $0 |
| Real Estate Taxes | $1,393 | $0 |
Property Value by Mortgage Status in Delmita
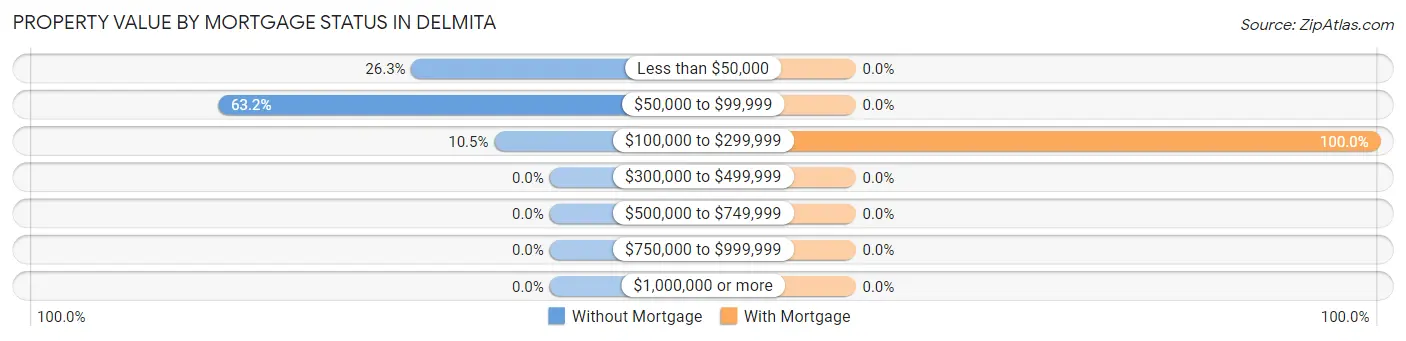
| Property Value | Without Mortgage | With Mortgage |
| Less than $50,000 | 5 (26.3%) | 0 (0.0%) |
| $50,000 to $99,999 | 12 (63.2%) | 0 (0.0%) |
| $100,000 to $299,999 | 2 (10.5%) | 12 (100.0%) |
| $300,000 to $499,999 | 0 (0.0%) | 0 (0.0%) |
| $500,000 to $749,999 | 0 (0.0%) | 0 (0.0%) |
| $750,000 to $999,999 | 0 (0.0%) | 0 (0.0%) |
| $1,000,000 or more | 0 (0.0%) | 0 (0.0%) |
| Total | 19 (100.0%) | 12 (100.0%) |
Household Income by Mortgage Status in Delmita
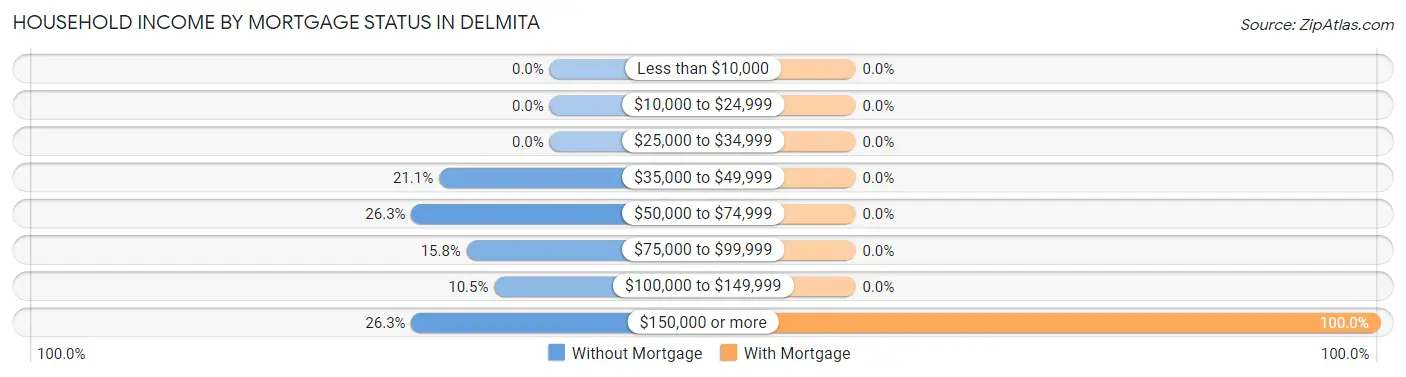
| Household Income | Without Mortgage | With Mortgage |
| Less than $10,000 | 0 (0.0%) | 0 (0.0%) |
| $10,000 to $24,999 | 0 (0.0%) | 0 (0.0%) |
| $25,000 to $34,999 | 0 (0.0%) | 0 (0.0%) |
| $35,000 to $49,999 | 4 (21.0%) | 0 (0.0%) |
| $50,000 to $74,999 | 5 (26.3%) | 0 (0.0%) |
| $75,000 to $99,999 | 3 (15.8%) | 0 (0.0%) |
| $100,000 to $149,999 | 2 (10.5%) | 0 (0.0%) |
| $150,000 or more | 5 (26.3%) | 12 (100.0%) |
| Total | 19 (100.0%) | 12 (100.0%) |
Property Value to Household Income Ratio in Delmita
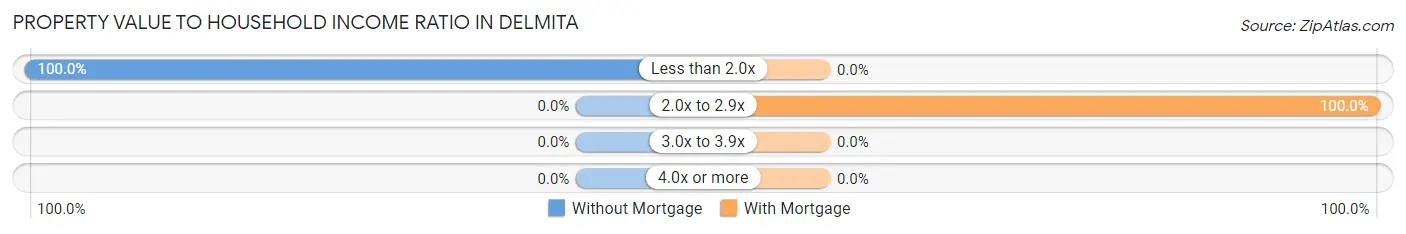
| Value-to-Income Ratio | Without Mortgage | With Mortgage |
| Less than 2.0x | 19 (100.0%) | 0 (0.0%) |
| 2.0x to 2.9x | 0 (0.0%) | 12 (100.0%) |
| 3.0x to 3.9x | 0 (0.0%) | 0 (0.0%) |
| 4.0x or more | 0 (0.0%) | 0 (0.0%) |
| Total | 19 (100.0%) | 12 (100.0%) |
Real Estate Taxes by Mortgage Status in Delmita
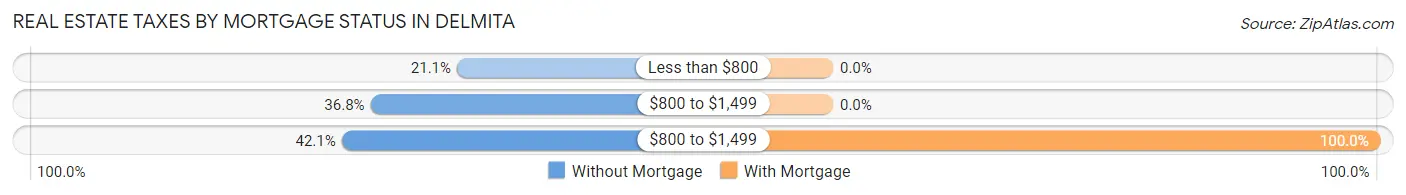
| Property Taxes | Without Mortgage | With Mortgage |
| Less than $800 | 4 (21.0%) | 0 (0.0%) |
| $800 to $1,499 | 7 (36.8%) | 0 (0.0%) |
| $800 to $1,499 | 8 (42.1%) | 12 (100.0%) |
| Total | 19 (100.0%) | 12 (100.0%) |
Health & Disability in Delmita
Health Insurance Coverage by Age in Delmita
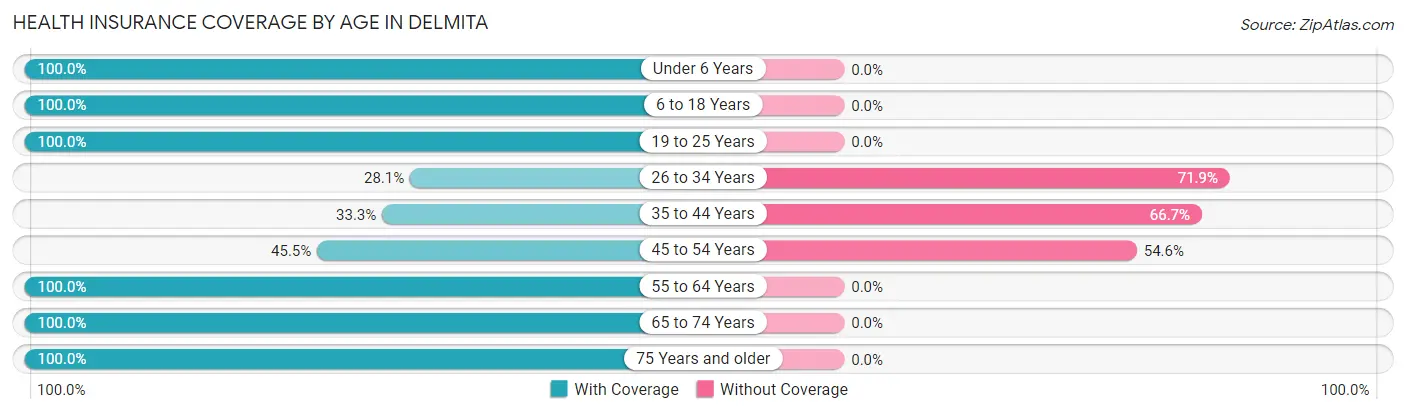
| Age Bracket | With Coverage | Without Coverage |
| Under 6 Years | 23 (100.0%) | 0 (0.0%) |
| 6 to 18 Years | 26 (100.0%) | 0 (0.0%) |
| 19 to 25 Years | 12 (100.0%) | 0 (0.0%) |
| 26 to 34 Years | 9 (28.1%) | 23 (71.9%) |
| 35 to 44 Years | 8 (33.3%) | 16 (66.7%) |
| 45 to 54 Years | 10 (45.5%) | 12 (54.5%) |
| 55 to 64 Years | 18 (100.0%) | 0 (0.0%) |
| 65 to 74 Years | 3 (100.0%) | 0 (0.0%) |
| 75 Years and older | 4 (100.0%) | 0 (0.0%) |
| Total | 113 (68.9%) | 51 (31.1%) |
Health Insurance Coverage by Citizenship Status in Delmita
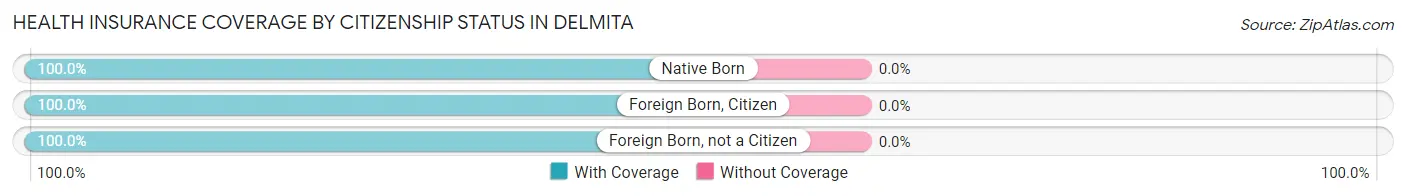
| Citizenship Status | With Coverage | Without Coverage |
| Native Born | 23 (100.0%) | 0 (0.0%) |
| Foreign Born, Citizen | 26 (100.0%) | 0 (0.0%) |
| Foreign Born, not a Citizen | 12 (100.0%) | 0 (0.0%) |
Health Insurance Coverage by Household Income in Delmita
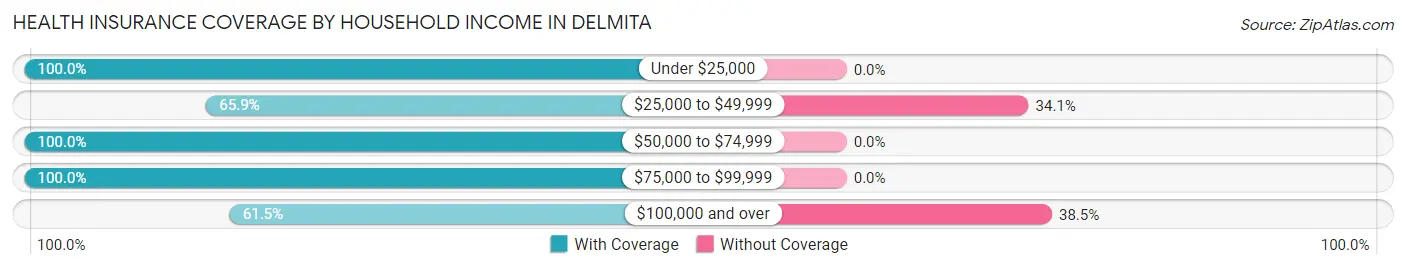
| Household Income | With Coverage | Without Coverage |
| Under $25,000 | 4 (100.0%) | 0 (0.0%) |
| $25,000 to $49,999 | 60 (65.9%) | 31 (34.1%) |
| $50,000 to $74,999 | 5 (100.0%) | 0 (0.0%) |
| $75,000 to $99,999 | 12 (100.0%) | 0 (0.0%) |
| $100,000 and over | 32 (61.5%) | 20 (38.5%) |
Public vs Private Health Insurance Coverage by Age in Delmita
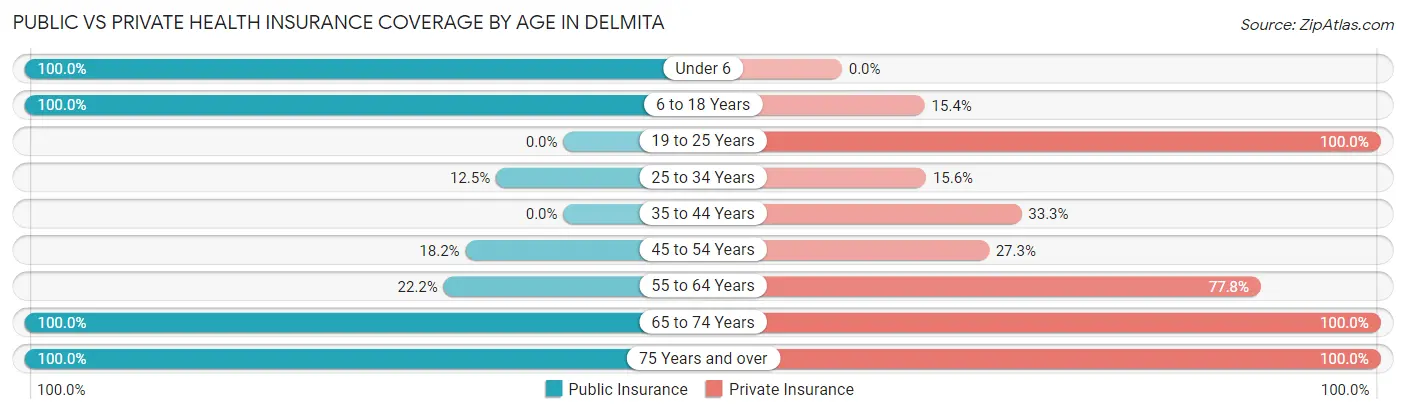
| Age Bracket | Public Insurance | Private Insurance |
| Under 6 | 23 (100.0%) | 0 (0.0%) |
| 6 to 18 Years | 26 (100.0%) | 4 (15.4%) |
| 19 to 25 Years | 0 (0.0%) | 12 (100.0%) |
| 25 to 34 Years | 4 (12.5%) | 5 (15.6%) |
| 35 to 44 Years | 0 (0.0%) | 8 (33.3%) |
| 45 to 54 Years | 4 (18.2%) | 6 (27.3%) |
| 55 to 64 Years | 4 (22.2%) | 14 (77.8%) |
| 65 to 74 Years | 3 (100.0%) | 3 (100.0%) |
| 75 Years and over | 4 (100.0%) | 4 (100.0%) |
| Total | 68 (41.5%) | 56 (34.2%) |
Disability Status by Sex by Age in Delmita
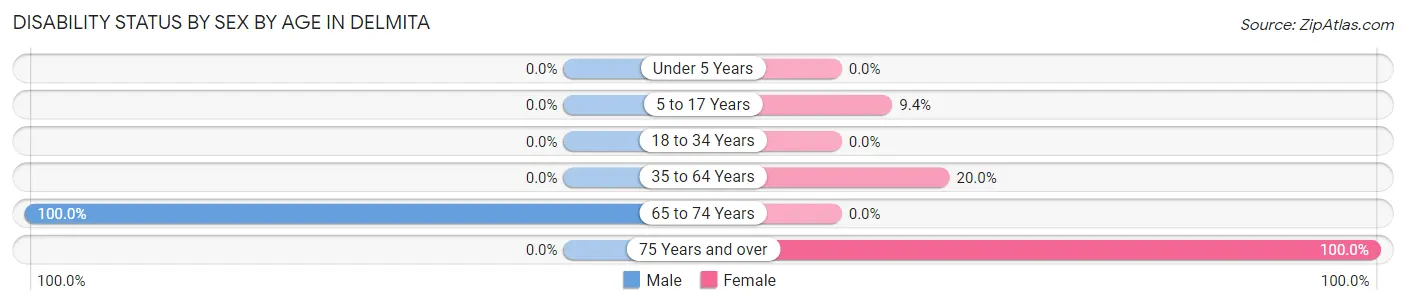
| Age Bracket | Male | Female |
| Under 5 Years | 0 (0.0%) | 0 (0.0%) |
| 5 to 17 Years | 0 (0.0%) | 3 (9.4%) |
| 18 to 34 Years | 0 (0.0%) | 0 (0.0%) |
| 35 to 64 Years | 0 (0.0%) | 6 (20.0%) |
| 65 to 74 Years | 3 (100.0%) | 0 (0.0%) |
| 75 Years and over | 0 (0.0%) | 4 (100.0%) |
Disability Class by Sex by Age in Delmita
Disability Class: Hearing Difficulty
| Age Bracket | Male | Female |
| Under 5 Years | 0 (0.0%) | 0 (0.0%) |
| 5 to 17 Years | 0 (0.0%) | 0 (0.0%) |
| 18 to 34 Years | 0 (0.0%) | 0 (0.0%) |
| 35 to 64 Years | 0 (0.0%) | 0 (0.0%) |
| 65 to 74 Years | 0 (0.0%) | 0 (0.0%) |
| 75 Years and over | 0 (0.0%) | 0 (0.0%) |
Disability Class: Vision Difficulty
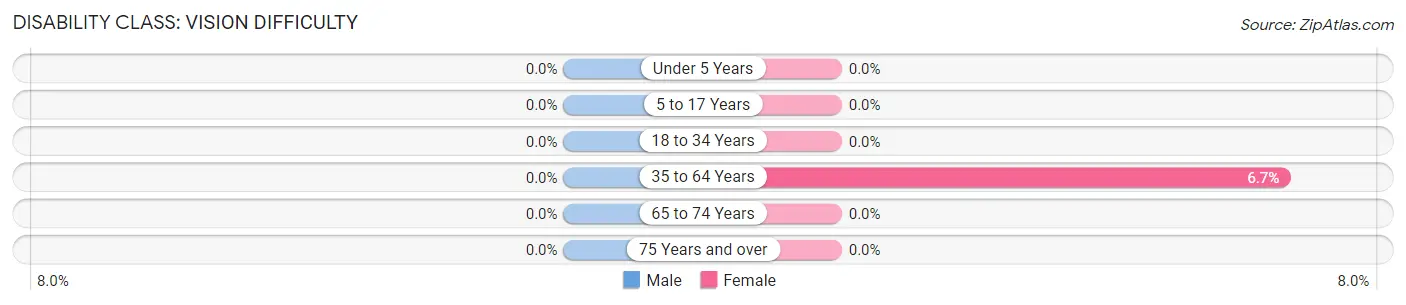
| Age Bracket | Male | Female |
| Under 5 Years | 0 (0.0%) | 0 (0.0%) |
| 5 to 17 Years | 0 (0.0%) | 0 (0.0%) |
| 18 to 34 Years | 0 (0.0%) | 0 (0.0%) |
| 35 to 64 Years | 0 (0.0%) | 2 (6.7%) |
| 65 to 74 Years | 0 (0.0%) | 0 (0.0%) |
| 75 Years and over | 0 (0.0%) | 0 (0.0%) |
Disability Class: Cognitive Difficulty
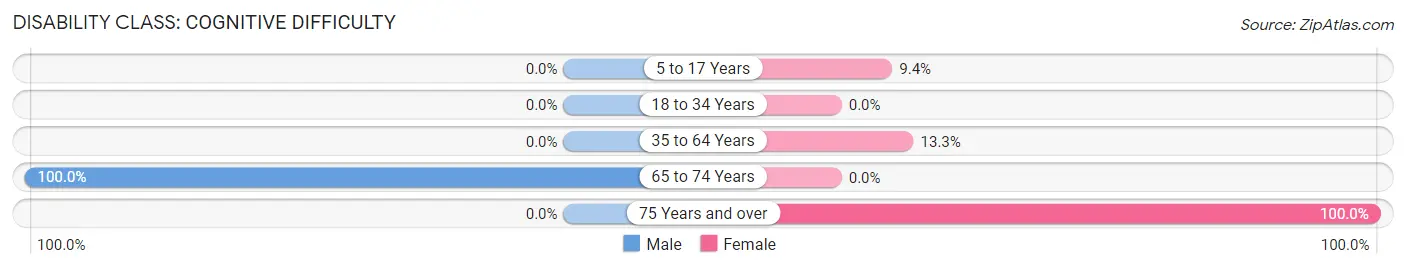
| Age Bracket | Male | Female |
| 5 to 17 Years | 0 (0.0%) | 3 (9.4%) |
| 18 to 34 Years | 0 (0.0%) | 0 (0.0%) |
| 35 to 64 Years | 0 (0.0%) | 4 (13.3%) |
| 65 to 74 Years | 3 (100.0%) | 0 (0.0%) |
| 75 Years and over | 0 (0.0%) | 4 (100.0%) |
Disability Class: Ambulatory Difficulty
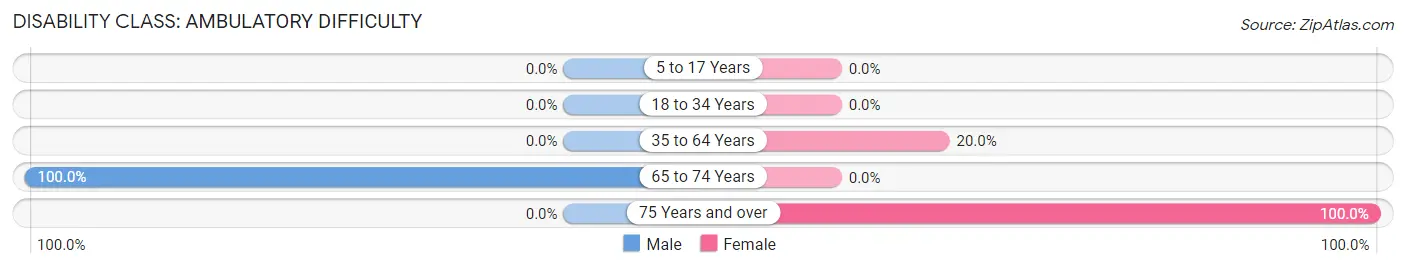
| Age Bracket | Male | Female |
| 5 to 17 Years | 0 (0.0%) | 0 (0.0%) |
| 18 to 34 Years | 0 (0.0%) | 0 (0.0%) |
| 35 to 64 Years | 0 (0.0%) | 6 (20.0%) |
| 65 to 74 Years | 3 (100.0%) | 0 (0.0%) |
| 75 Years and over | 0 (0.0%) | 4 (100.0%) |
Disability Class: Self-Care Difficulty
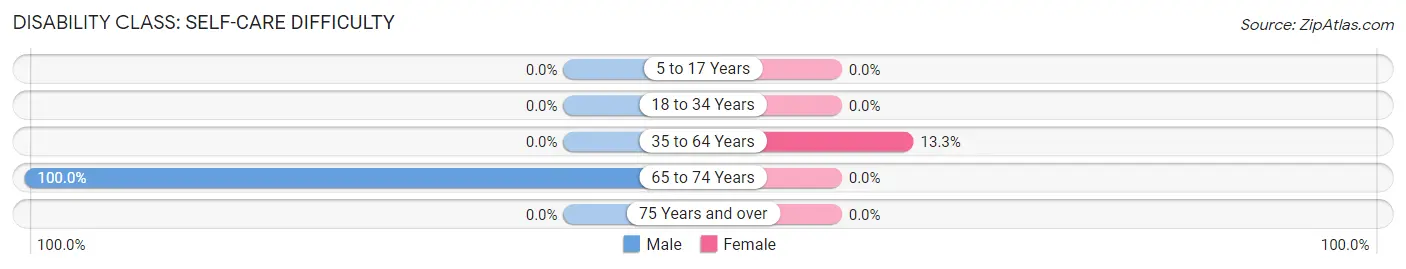
| Age Bracket | Male | Female |
| 5 to 17 Years | 0 (0.0%) | 0 (0.0%) |
| 18 to 34 Years | 0 (0.0%) | 0 (0.0%) |
| 35 to 64 Years | 0 (0.0%) | 4 (13.3%) |
| 65 to 74 Years | 3 (100.0%) | 0 (0.0%) |
| 75 Years and over | 0 (0.0%) | 0 (0.0%) |
Technology Access in Delmita
Computing Device Access in Delmita
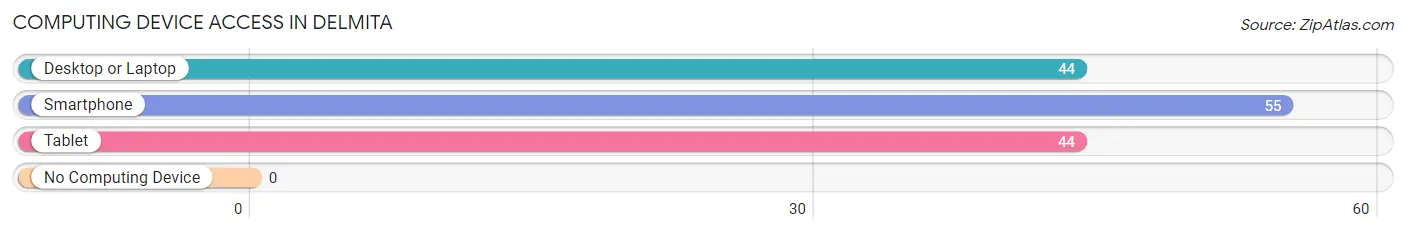
| Device Type | # Households | % Households |
| Desktop or Laptop | 44 | 80.0% |
| Smartphone | 55 | 100.0% |
| Tablet | 44 | 80.0% |
| No Computing Device | 0 | 0.0% |
| Total | 55 | 100.0% |
Internet Access in Delmita
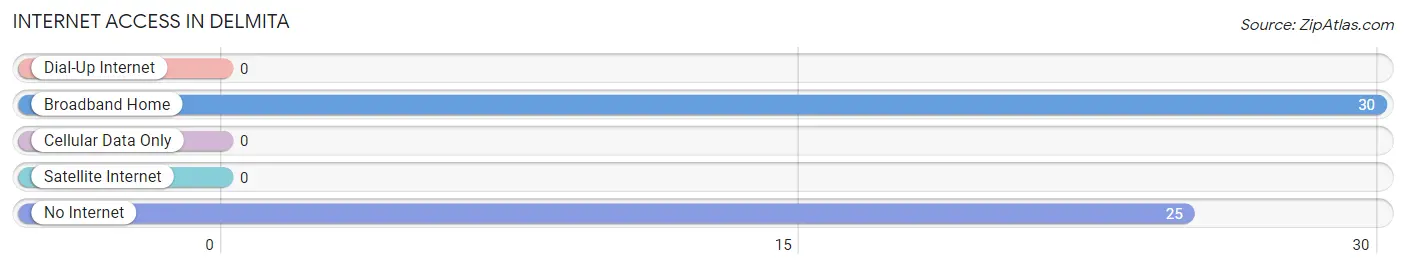
| Internet Type | # Households | % Households |
| Dial-Up Internet | 0 | 0.0% |
| Broadband Home | 30 | 54.5% |
| Cellular Data Only | 0 | 0.0% |
| Satellite Internet | 0 | 0.0% |
| No Internet | 25 | 45.5% |
| Total | 55 | 100.0% |
Delmita Summary
Delmita, Texas is a small unincorporated community located in Starr County, Texas. It is situated about 10 miles south of Rio Grande City, the county seat. The population of Delmita was estimated to be around 1,000 people in 2020.
History
Delmita was founded in the late 19th century by a group of Mexican settlers. The name Delmita is derived from the Spanish phrase “de la mitad” which means “from the middle”. The settlers chose this name because the town was located in the middle of the Rio Grande Valley.
The town was originally a farming community, with the main crops being cotton, corn, and sorghum. In the early 20th century, the town began to grow as more people moved to the area. By the 1950s, Delmita had become a thriving community with a population of over 1,000 people.
Geography
Delmita is located in Starr County, Texas, about 10 miles south of Rio Grande City. The town is situated in the Rio Grande Valley, which is a flat, low-lying area. The terrain is mostly flat with some rolling hills. The climate is semi-arid, with hot summers and mild winters.
The town is located near the Rio Grande River, which serves as the border between the United States and Mexico. The river is a major source of irrigation for the area, and it also provides recreational opportunities such as fishing and boating.
Economy
The economy of Delmita is largely based on agriculture. The main crops grown in the area are cotton, corn, and sorghum. The town also has a few small businesses, such as restaurants, grocery stores, and gas stations.
The town is also home to a few manufacturing plants, which produce a variety of products such as furniture, clothing, and electronics. The town is also home to a few oil and gas companies, which provide jobs to many of the town’s residents.
Demographics
The population of Delmita was estimated to be around 1,000 people in 2020. The town is predominantly Hispanic, with over 90% of the population being of Mexican descent. The median household income in the town is around $30,000, which is lower than the national average.
The town has a high poverty rate, with over 40% of the population living below the poverty line. The town also has a high unemployment rate, with over 20% of the population being unemployed.
Delmita is a small, rural town with a rich history and culture. The town is home to a diverse population, and it has a strong agricultural economy. The town is also home to a few small businesses, which provide jobs to many of the town’s residents. Despite its small size, Delmita is a vibrant community with a bright future.
Common Questions
What is Per Capita Income in Delmita?
Per Capita income in Delmita is $26,843.
What is Inequality or Gini Index in Delmita?
Inequality or Gini Index in Delmita is 0.40.
What is the Total Population of Delmita?
Total Population of Delmita is 164.
What is the Total Male Population of Delmita?
Total Male Population of Delmita is 77.
What is the Total Female Population of Delmita?
Total Female Population of Delmita is 87.
What is the Ratio of Males per 100 Females in Delmita?
There are 88.51 Males per 100 Females in Delmita.
What is the Ratio of Females per 100 Males in Delmita?
There are 112.99 Females per 100 Males in Delmita.
What is the Median Population Age in Delmita?
Median Population Age in Delmita is 32.4 Years.
What is the Average Family Size in Delmita
Average Family Size in Delmita is 3.4 People.
What is the Average Household Size in Delmita
Average Household Size in Delmita is 3.0 People.
How Large is the Labor Force in Delmita?
There are 76 People in the Labor Forcein in Delmita.
What is the Percentage of People in the Labor Force in Delmita?
66.1% of People are in the Labor Force in Delmita.