Wyldwood, TX Map & Demographics
Wyldwood Map
Wyldwood Overview
$22,005
PER CAPITA INCOME
$80,214
AVG FAMILY INCOME
$67,422
AVG HOUSEHOLD INCOME
39.3%
WAGE / INCOME GAP [ % ]
60.7¢/ $1
WAGE / INCOME GAP [ $ ]
$6,736
FAMILY INCOME DEFICIT
0.43
INEQUALITY / GINI INDEX
4,368
TOTAL POPULATION
2,209
MALE POPULATION
2,159
FEMALE POPULATION
102.32
MALES / 100 FEMALES
97.74
FEMALES / 100 MALES
37.3
MEDIAN AGE
4.2
AVG FAMILY SIZE
3.4
AVG HOUSEHOLD SIZE
1,328
LABOR FORCE [ PEOPLE ]
40.7%
PERCENT IN LABOR FORCE
3.1%
UNEMPLOYMENT RATE
Income in Wyldwood
Income Overview in Wyldwood
Per Capita Income in Wyldwood is $22,005, while median incomes of families and households are $80,214 and $67,422 respectively.
| Characteristic | Number | Measure |
| Per Capita Income | 4,368 | $22,005 |
| Median Family Income | 918 | $80,214 |
| Mean Family Income | 918 | $87,848 |
| Median Household Income | 1,271 | $67,422 |
| Mean Household Income | 1,271 | $74,057 |
| Income Deficit | 918 | $6,736 |
| Wage / Income Gap (%) | 4,368 | 39.30% |
| Wage / Income Gap ($) | 4,368 | 60.70¢ per $1 |
| Gini / Inequality Index | 4,368 | 0.43 |
Earnings by Sex in Wyldwood
Average Earnings in Wyldwood are $28,349, $35,769 for men and $21,712 for women, a difference of 39.3%.

| Sex | Number | Average Earnings |
| Male | 917 (51.6%) | $35,769 |
| Female | 859 (48.4%) | $21,712 |
| Total | 1,776 (100.0%) | $28,349 |
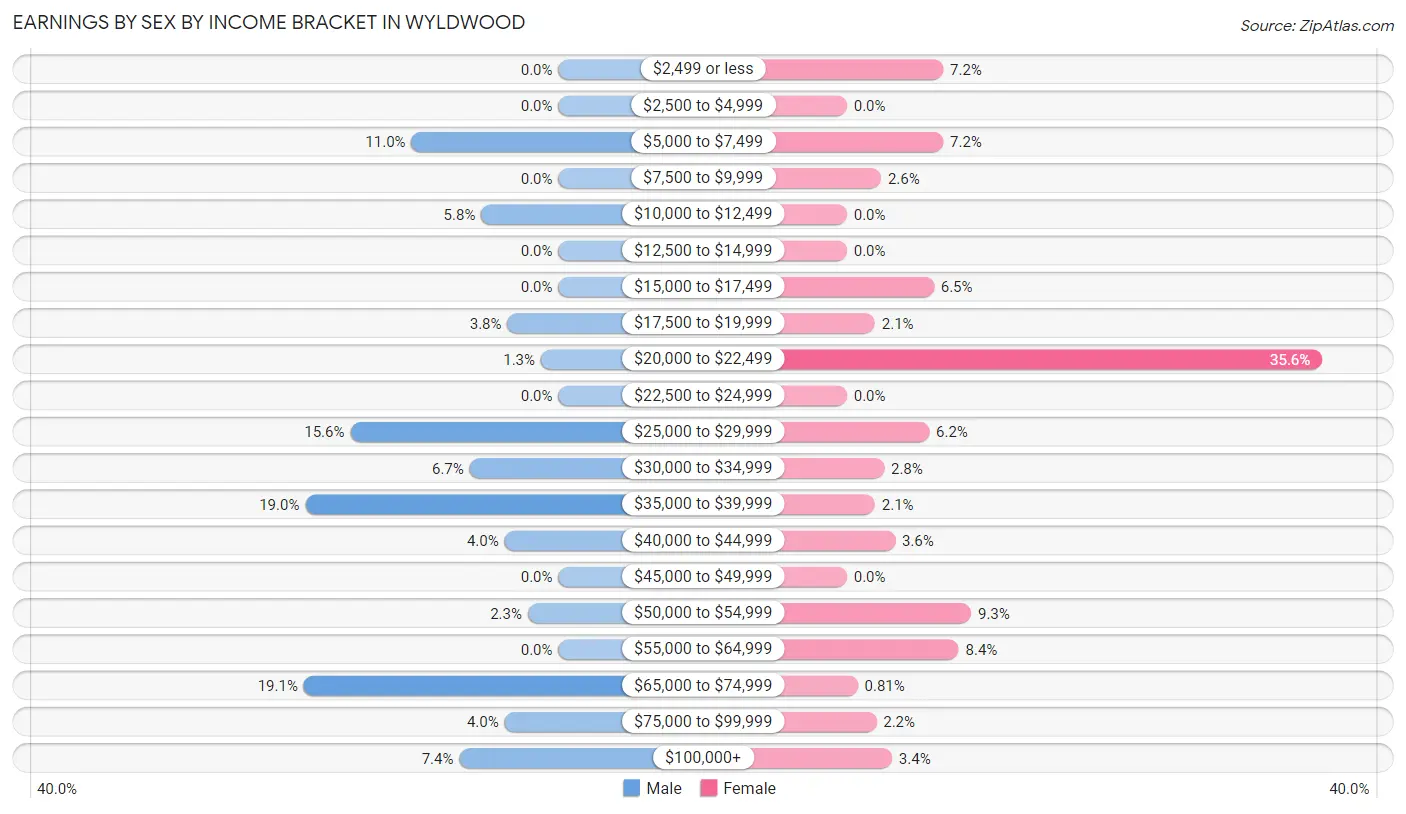
Earnings by Sex by Income Bracket in Wyldwood
The most common earnings brackets in Wyldwood are $65,000 to $74,999 for men (175 | 19.1%) and $20,000 to $22,499 for women (306 | 35.6%).
| Income | Male | Female |
| $2,499 or less | 0 (0.0%) | 62 (7.2%) |
| $2,500 to $4,999 | 0 (0.0%) | 0 (0.0%) |
| $5,000 to $7,499 | 101 (11.0%) | 62 (7.2%) |
| $7,500 to $9,999 | 0 (0.0%) | 22 (2.6%) |
| $10,000 to $12,499 | 53 (5.8%) | 0 (0.0%) |
| $12,500 to $14,999 | 0 (0.0%) | 0 (0.0%) |
| $15,000 to $17,499 | 0 (0.0%) | 56 (6.5%) |
| $17,500 to $19,999 | 35 (3.8%) | 18 (2.1%) |
| $20,000 to $22,499 | 12 (1.3%) | 306 (35.6%) |
| $22,500 to $24,999 | 0 (0.0%) | 0 (0.0%) |
| $25,000 to $29,999 | 143 (15.6%) | 53 (6.2%) |
| $30,000 to $34,999 | 61 (6.7%) | 24 (2.8%) |
| $35,000 to $39,999 | 174 (19.0%) | 18 (2.1%) |
| $40,000 to $44,999 | 37 (4.0%) | 31 (3.6%) |
| $45,000 to $49,999 | 0 (0.0%) | 0 (0.0%) |
| $50,000 to $54,999 | 21 (2.3%) | 80 (9.3%) |
| $55,000 to $64,999 | 0 (0.0%) | 72 (8.4%) |
| $65,000 to $74,999 | 175 (19.1%) | 7 (0.8%) |
| $75,000 to $99,999 | 37 (4.0%) | 19 (2.2%) |
| $100,000+ | 68 (7.4%) | 29 (3.4%) |
| Total | 917 (100.0%) | 859 (100.0%) |
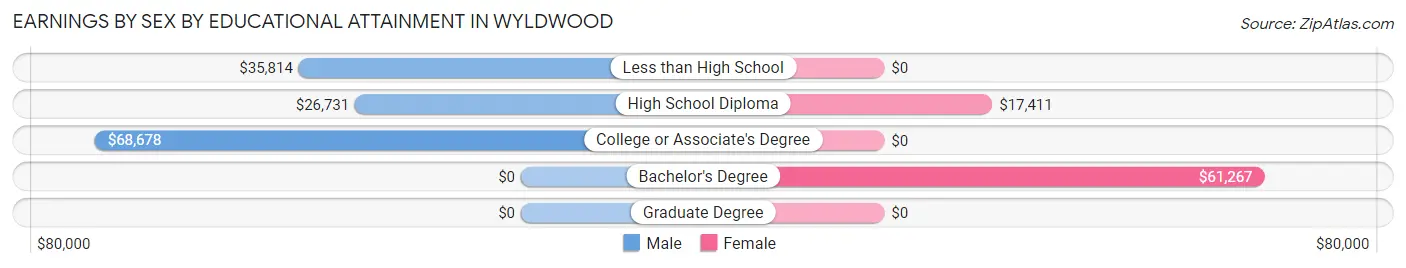
Earnings by Sex by Educational Attainment in Wyldwood
Average earnings in Wyldwood are $35,769 for men and $21,965 for women, a difference of 38.6%. Men with an educational attainment of college or associate's degree enjoy the highest average annual earnings of $68,678, while those with high school diploma education earn the least with $26,731. Women with an educational attainment of bachelor's degree earn the most with the average annual earnings of $61,267, while those with high school diploma education have the smallest earnings of $17,411.
| Educational Attainment | Male Income | Female Income |
| Less than High School | $35,814 | $0 |
| High School Diploma | $26,731 | $17,411 |
| College or Associate's Degree | $68,678 | $0 |
| Bachelor's Degree | - | - |
| Graduate Degree | - | - |
| Total | $35,769 | $21,965 |
Family Income in Wyldwood
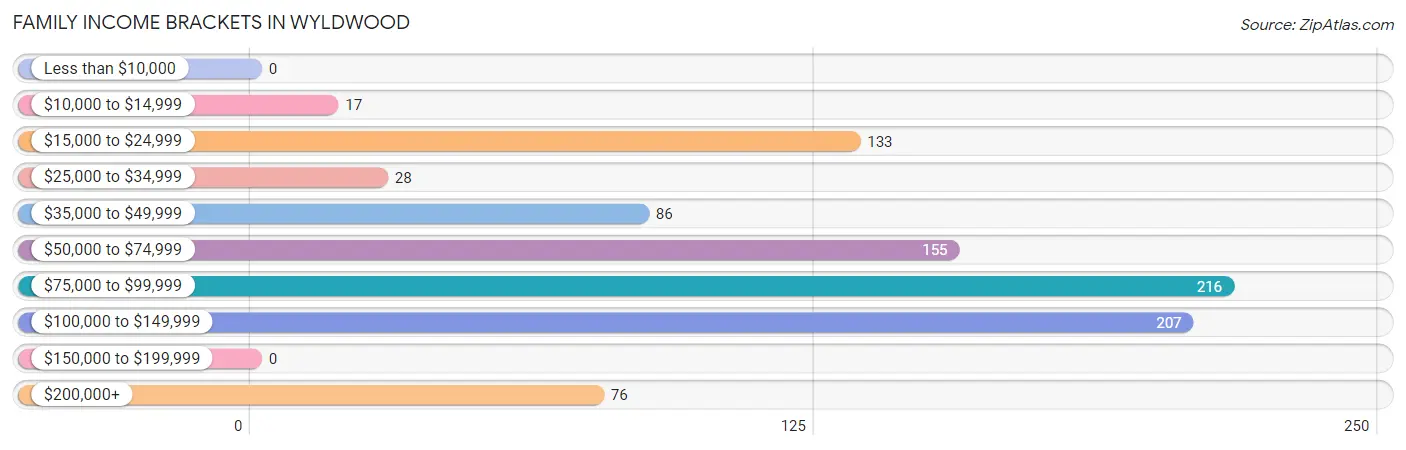
Family Income Brackets in Wyldwood
According to the Wyldwood family income data, there are 216 families falling into the $75,000 to $99,999 income range, which is the most common income bracket and makes up 23.5% of all families.
| Income Bracket | # Families | % Families |
| Less than $10,000 | 0 | 0.0% |
| $10,000 to $14,999 | 17 | 1.9% |
| $15,000 to $24,999 | 133 | 14.5% |
| $25,000 to $34,999 | 28 | 3.1% |
| $35,000 to $49,999 | 86 | 9.4% |
| $50,000 to $74,999 | 155 | 16.9% |
| $75,000 to $99,999 | 216 | 23.5% |
| $100,000 to $149,999 | 207 | 22.5% |
| $150,000 to $199,999 | 0 | 0.0% |
| $200,000+ | 76 | 8.3% |
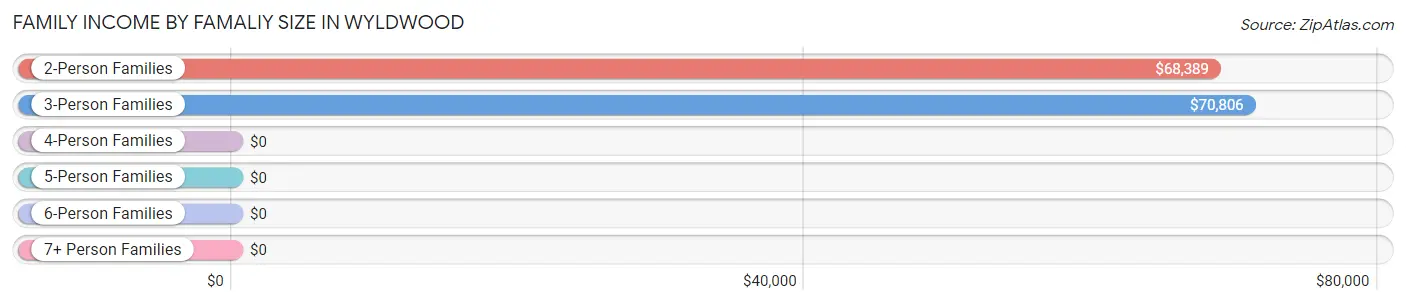
Family Income by Famaliy Size in Wyldwood
3-person families (228 | 24.8%) account for the highest median family income in Wyldwood with $70,806 per family, while 2-person families (291 | 31.7%) have the highest median income of $34,194 per family member.
| Income Bracket | # Families | Median Income |
| 2-Person Families | 291 (31.7%) | $68,389 |
| 3-Person Families | 228 (24.8%) | $70,806 |
| 4-Person Families | 247 (26.9%) | $0 |
| 5-Person Families | 0 (0.0%) | $0 |
| 6-Person Families | 152 (16.6%) | $0 |
| 7+ Person Families | 0 (0.0%) | $0 |
| Total | 918 (100.0%) | $80,214 |
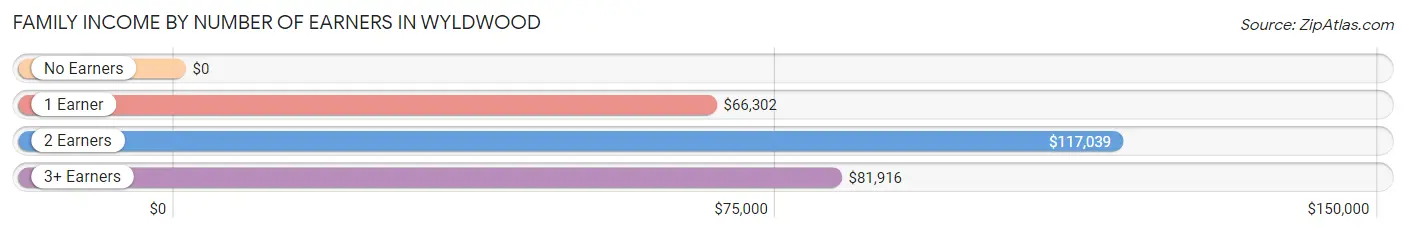
Family Income by Number of Earners in Wyldwood
| Number of Earners | # Families | Median Income |
| No Earners | 152 (16.6%) | $0 |
| 1 Earner | 328 (35.7%) | $66,302 |
| 2 Earners | 205 (22.3%) | $117,039 |
| 3+ Earners | 233 (25.4%) | $81,916 |
| Total | 918 (100.0%) | $80,214 |
Household Income in Wyldwood
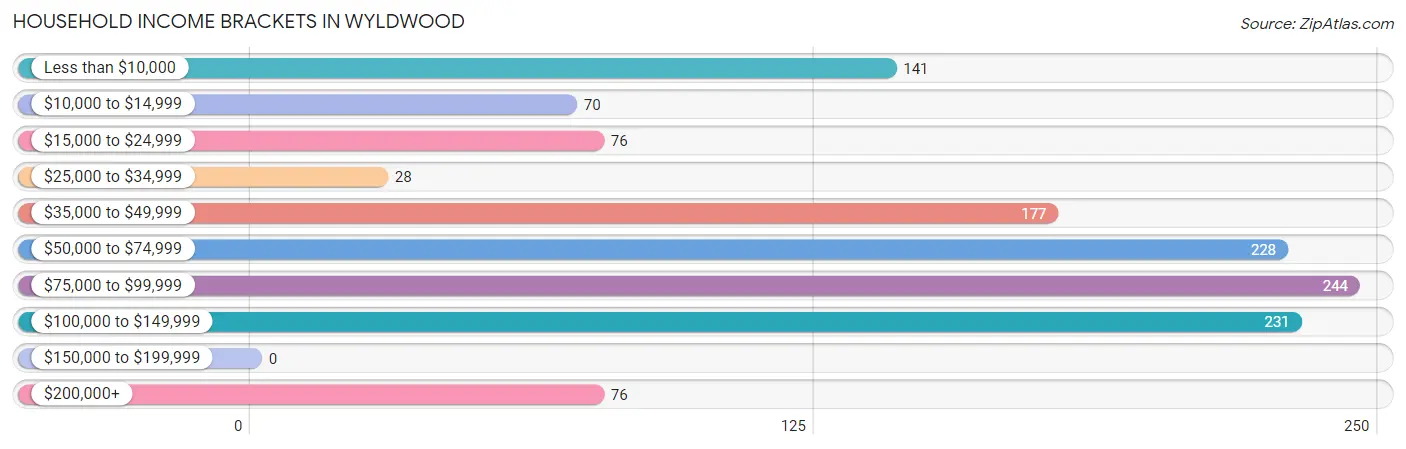
Household Income Brackets in Wyldwood
With 244 households falling in the category, the $75,000 to $99,999 income range is the most frequent in Wyldwood, accounting for 19.2% of all households.
| Income Bracket | # Households | % Households |
| Less than $10,000 | 141 | 11.1% |
| $10,000 to $14,999 | 70 | 5.5% |
| $15,000 to $24,999 | 76 | 6.0% |
| $25,000 to $34,999 | 28 | 2.2% |
| $35,000 to $49,999 | 177 | 13.9% |
| $50,000 to $74,999 | 228 | 17.9% |
| $75,000 to $99,999 | 244 | 19.2% |
| $100,000 to $149,999 | 231 | 18.2% |
| $150,000 to $199,999 | 0 | 0.0% |
| $200,000+ | 76 | 6.0% |
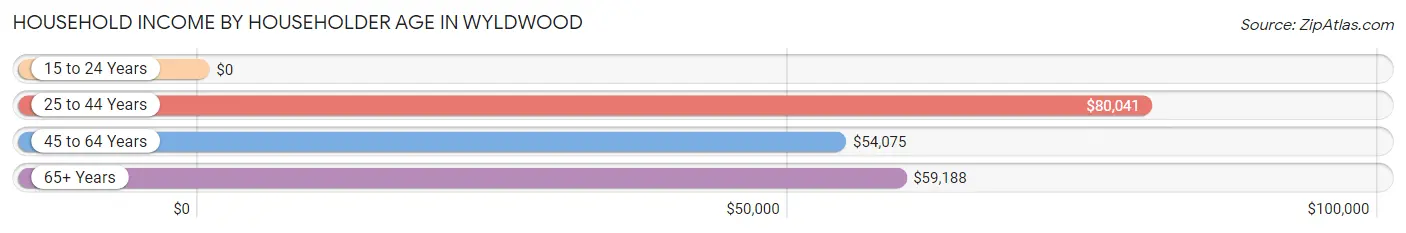
Household Income by Householder Age in Wyldwood
The median household income in Wyldwood is $67,422, with the highest median household income of $80,041 found in the 25 to 44 years age bracket for the primary householder. A total of 437 households (34.4%) fall into this category.
| Income Bracket | # Households | Median Income |
| 15 to 24 Years | 0 (0.0%) | $0 |
| 25 to 44 Years | 437 (34.4%) | $80,041 |
| 45 to 64 Years | 601 (47.3%) | $54,075 |
| 65+ Years | 233 (18.3%) | $59,188 |
| Total | 1,271 (100.0%) | $67,422 |
Poverty in Wyldwood
Income Below Poverty by Sex and Age in Wyldwood
With 25.2% poverty level for males and 15.3% for females among the residents of Wyldwood, 12 to 14 year old males and 16 and 17 year old females are the most vulnerable to poverty, with 325 males (100.0%) and 78 females (100.0%) in their respective age groups living below the poverty level.
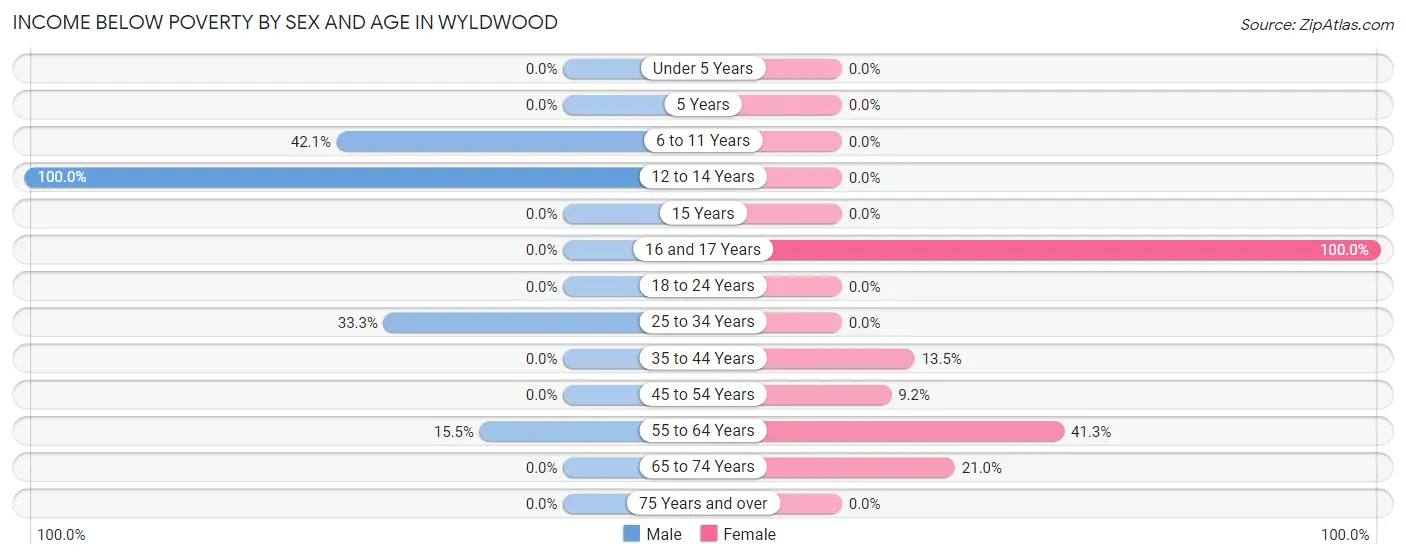
| Age Bracket | Male | Female |
| Under 5 Years | 0 (0.0%) | 0 (0.0%) |
| 5 Years | 0 (0.0%) | 0 (0.0%) |
| 6 to 11 Years | 119 (42.0%) | 0 (0.0%) |
| 12 to 14 Years | 325 (100.0%) | 0 (0.0%) |
| 15 Years | 0 (0.0%) | 0 (0.0%) |
| 16 and 17 Years | 0 (0.0%) | 78 (100.0%) |
| 18 to 24 Years | 0 (0.0%) | 0 (0.0%) |
| 25 to 34 Years | 53 (33.3%) | 0 (0.0%) |
| 35 to 44 Years | 0 (0.0%) | 56 (13.5%) |
| 45 to 54 Years | 0 (0.0%) | 22 (9.2%) |
| 55 to 64 Years | 60 (15.5%) | 158 (41.2%) |
| 65 to 74 Years | 0 (0.0%) | 17 (21.0%) |
| 75 Years and over | 0 (0.0%) | 0 (0.0%) |
| Total | 557 (25.2%) | 331 (15.3%) |
Income Above Poverty by Sex and Age in Wyldwood
According to the poverty statistics in Wyldwood, males aged under 5 years and females aged under 5 years are the age groups that are most secure financially, with 100.0% of males and 100.0% of females in these age groups living above the poverty line.
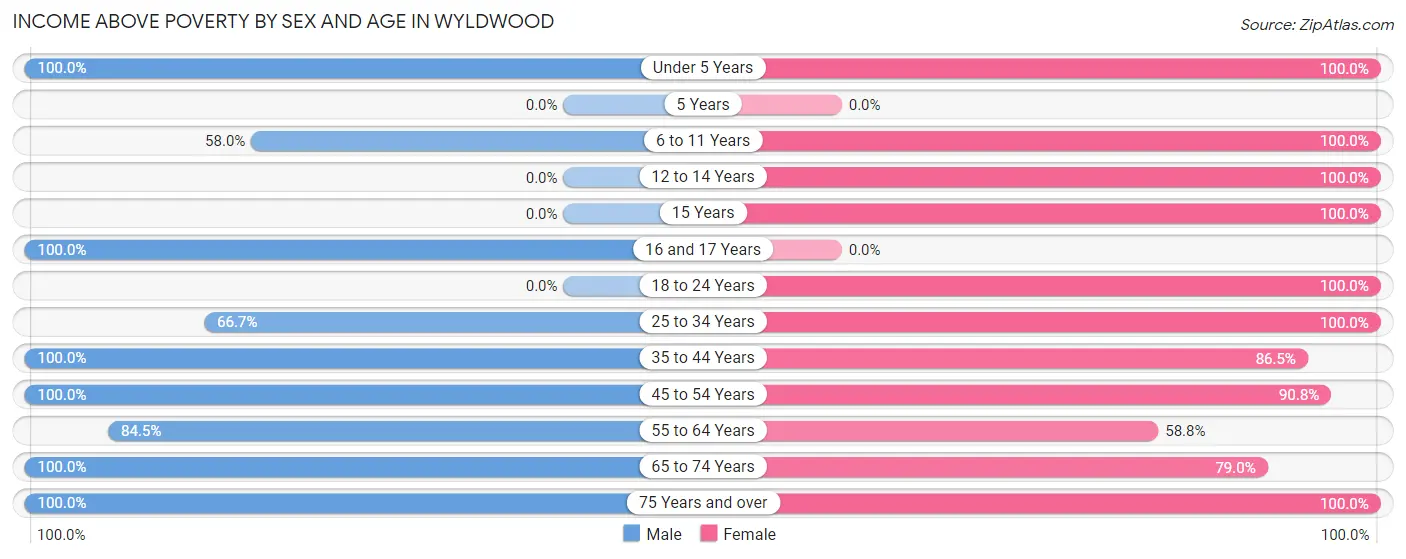
| Age Bracket | Male | Female |
| Under 5 Years | 55 (100.0%) | 32 (100.0%) |
| 5 Years | 0 (0.0%) | 0 (0.0%) |
| 6 to 11 Years | 164 (58.0%) | 69 (100.0%) |
| 12 to 14 Years | 0 (0.0%) | 299 (100.0%) |
| 15 Years | 0 (0.0%) | 43 (100.0%) |
| 16 and 17 Years | 332 (100.0%) | 0 (0.0%) |
| 18 to 24 Years | 0 (0.0%) | 305 (100.0%) |
| 25 to 34 Years | 106 (66.7%) | 109 (100.0%) |
| 35 to 44 Years | 432 (100.0%) | 358 (86.5%) |
| 45 to 54 Years | 100 (100.0%) | 218 (90.8%) |
| 55 to 64 Years | 327 (84.5%) | 225 (58.8%) |
| 65 to 74 Years | 78 (100.0%) | 64 (79.0%) |
| 75 Years and over | 58 (100.0%) | 106 (100.0%) |
| Total | 1,652 (74.8%) | 1,828 (84.7%) |
Income Below Poverty Among Married-Couple Families in Wyldwood
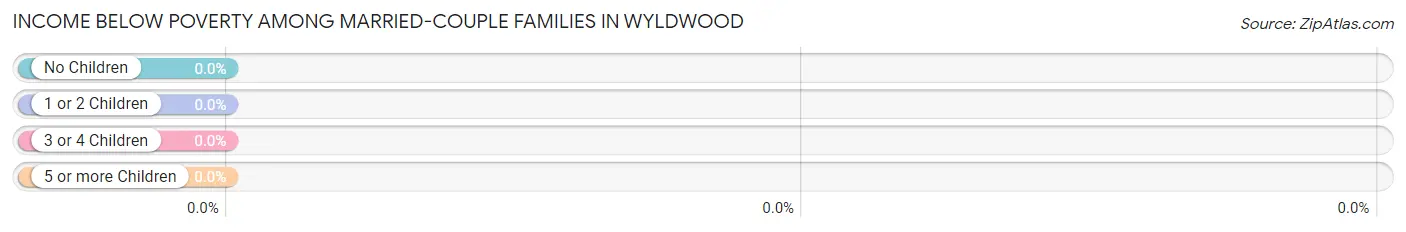
| Children | Above Poverty | Below Poverty |
| No Children | 216 (100.0%) | 0 (0.0%) |
| 1 or 2 Children | 334 (100.0%) | 0 (0.0%) |
| 3 or 4 Children | 0 (0.0%) | 0 (0.0%) |
| 5 or more Children | 0 (0.0%) | 0 (0.0%) |
| Total | 550 (100.0%) | 0 (0.0%) |
Income Below Poverty Among Single-Parent Households in Wyldwood
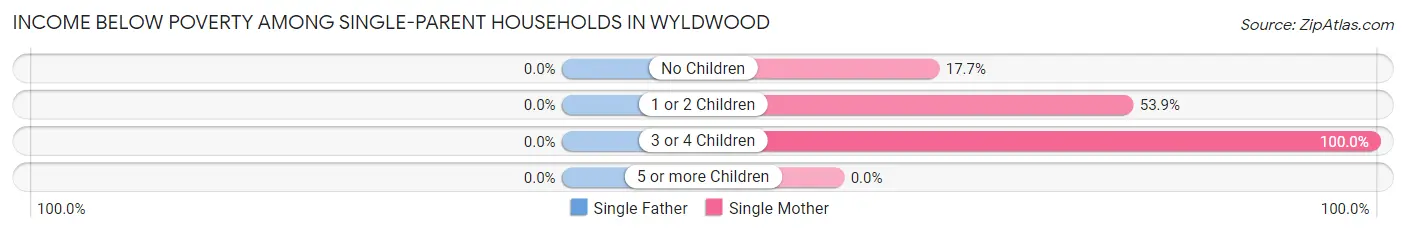
| Children | Single Father | Single Mother |
| No Children | 0 (0.0%) | 17 (17.7%) |
| 1 or 2 Children | 0 (0.0%) | 56 (53.8%) |
| 3 or 4 Children | 0 (0.0%) | 77 (100.0%) |
| 5 or more Children | 0 (0.0%) | 0 (0.0%) |
| Total | 0 (0.0%) | 150 (54.1%) |
Income Below Poverty Among Married-Couple vs Single-Parent Households in Wyldwood
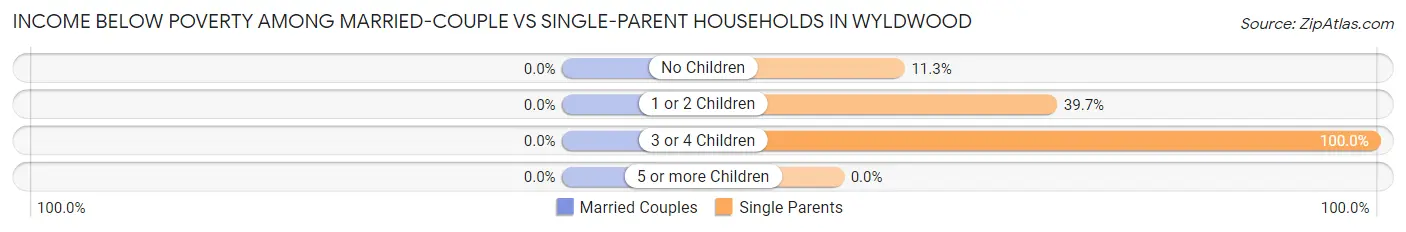
| Children | Married-Couple Families | Single-Parent Households |
| No Children | 0 (0.0%) | 17 (11.3%) |
| 1 or 2 Children | 0 (0.0%) | 56 (39.7%) |
| 3 or 4 Children | 0 (0.0%) | 77 (100.0%) |
| 5 or more Children | 0 (0.0%) | 0 (0.0%) |
| Total | 0 (0.0%) | 150 (40.8%) |
Race in Wyldwood
The most populous races in Wyldwood are White / Caucasian (2,478 | 56.7%), Hispanic or Latino (2,374 | 54.3%), and Two or more Races (1,480 | 33.9%).
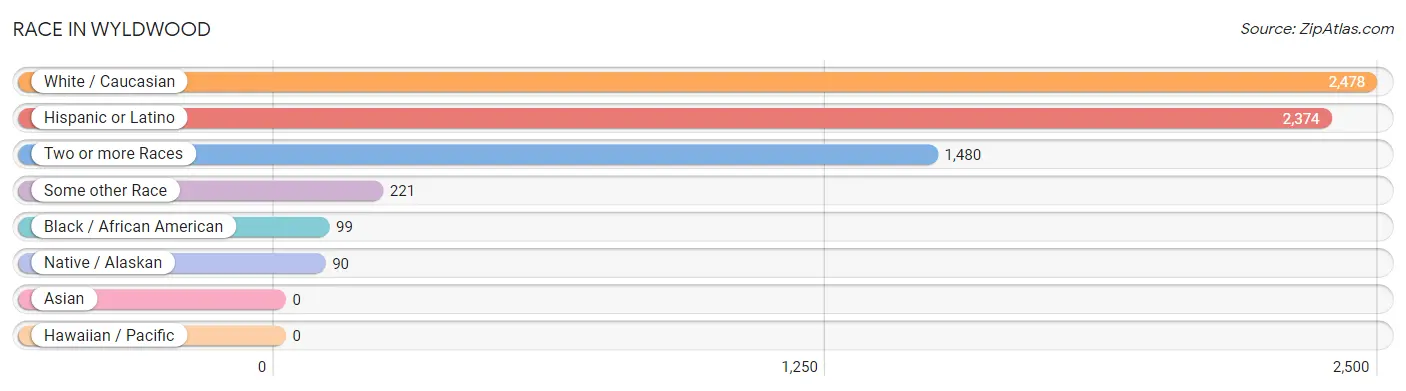
| Race | # Population | % Population |
| Asian | 0 | 0.0% |
| Black / African American | 99 | 2.3% |
| Hawaiian / Pacific | 0 | 0.0% |
| Hispanic or Latino | 2,374 | 54.3% |
| Native / Alaskan | 90 | 2.1% |
| White / Caucasian | 2,478 | 56.7% |
| Two or more Races | 1,480 | 33.9% |
| Some other Race | 221 | 5.1% |
| Total | 4,368 | 100.0% |
Ancestry in Wyldwood
The most populous ancestries reported in Wyldwood are Central American (1,418 | 32.5%), Salvadoran (1,319 | 30.2%), Mexican (956 | 21.9%), German (690 | 15.8%), and American (556 | 12.7%), together accounting for 113.1% of all Wyldwood residents.
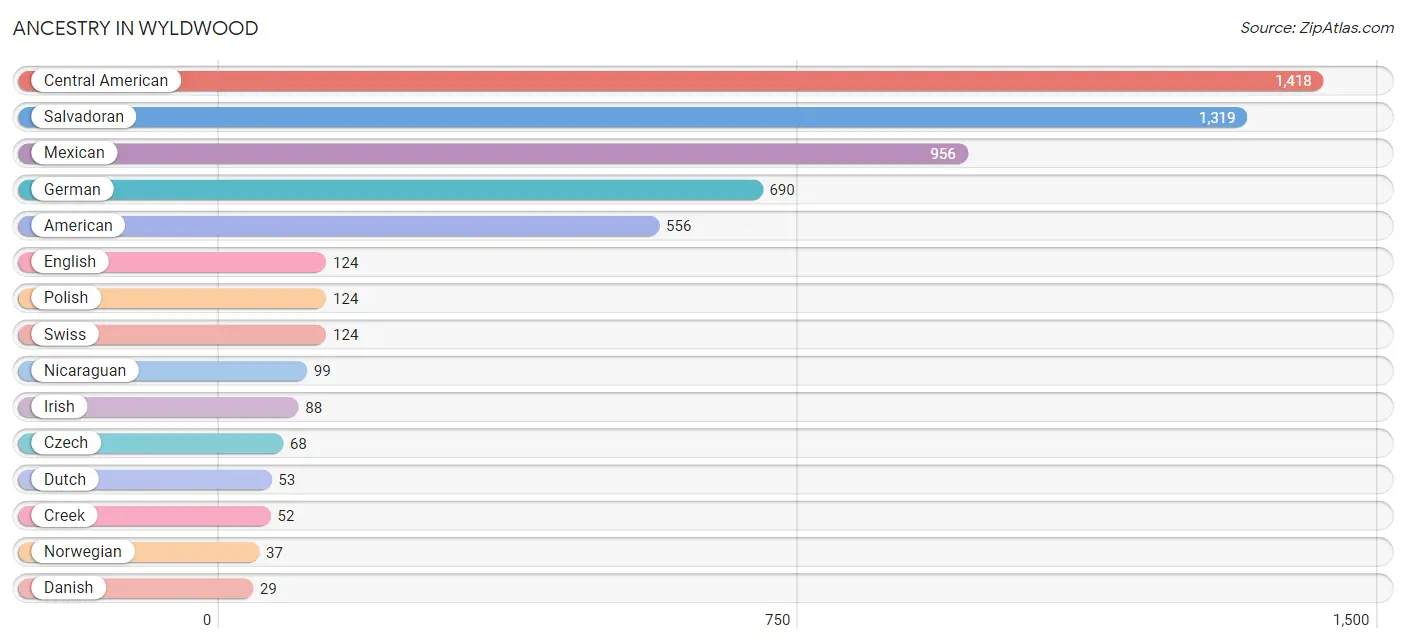
| Ancestry | # Population | % Population |
| American | 556 | 12.7% |
| Central American | 1,418 | 32.5% |
| Creek | 52 | 1.2% |
| Czech | 68 | 1.6% |
| Danish | 29 | 0.7% |
| Dutch | 53 | 1.2% |
| English | 124 | 2.8% |
| French | 20 | 0.5% |
| German | 690 | 15.8% |
| Irish | 88 | 2.0% |
| Mexican | 956 | 21.9% |
| Nicaraguan | 99 | 2.3% |
| Norwegian | 37 | 0.9% |
| Polish | 124 | 2.8% |
| Salvadoran | 1,319 | 30.2% |
| Scottish | 16 | 0.4% |
| Swiss | 124 | 2.8% |
| Welsh | 29 | 0.7% | View All 18 Rows |
Immigrants in Wyldwood
The most numerous immigrant groups reported in Wyldwood came from Latin America (1,108 | 25.4%), Central America (1,048 | 24.0%), El Salvador (816 | 18.7%), Mexico (232 | 5.3%), and Chile (60 | 1.4%), together accounting for 74.7% of all Wyldwood residents.
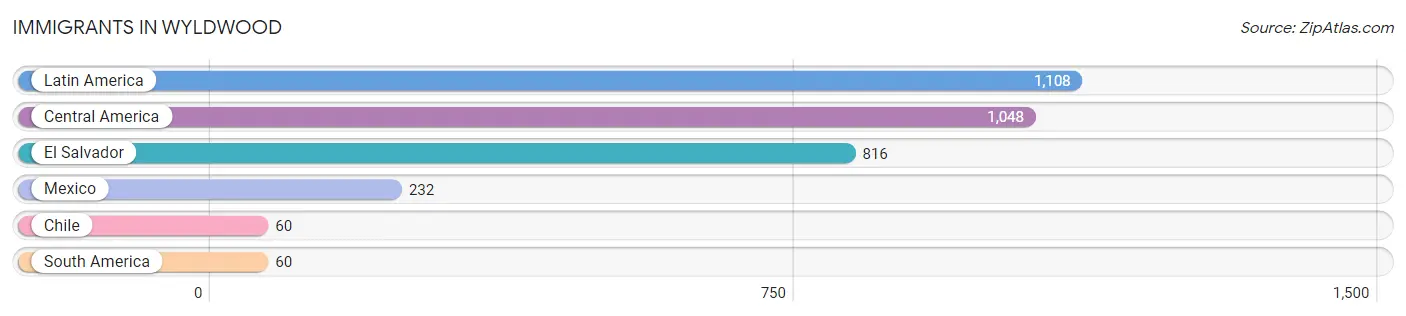
| Immigration Origin | # Population | % Population |
| Central America | 1,048 | 24.0% |
| Chile | 60 | 1.4% |
| El Salvador | 816 | 18.7% |
| Latin America | 1,108 | 25.4% |
| Mexico | 232 | 5.3% |
| South America | 60 | 1.4% | View All 6 Rows |
Sex and Age in Wyldwood
Sex and Age in Wyldwood
The most populous age groups in Wyldwood are 10 to 14 Years (405 | 18.3%) for men and 15 to 19 Years (426 | 19.7%) for women.
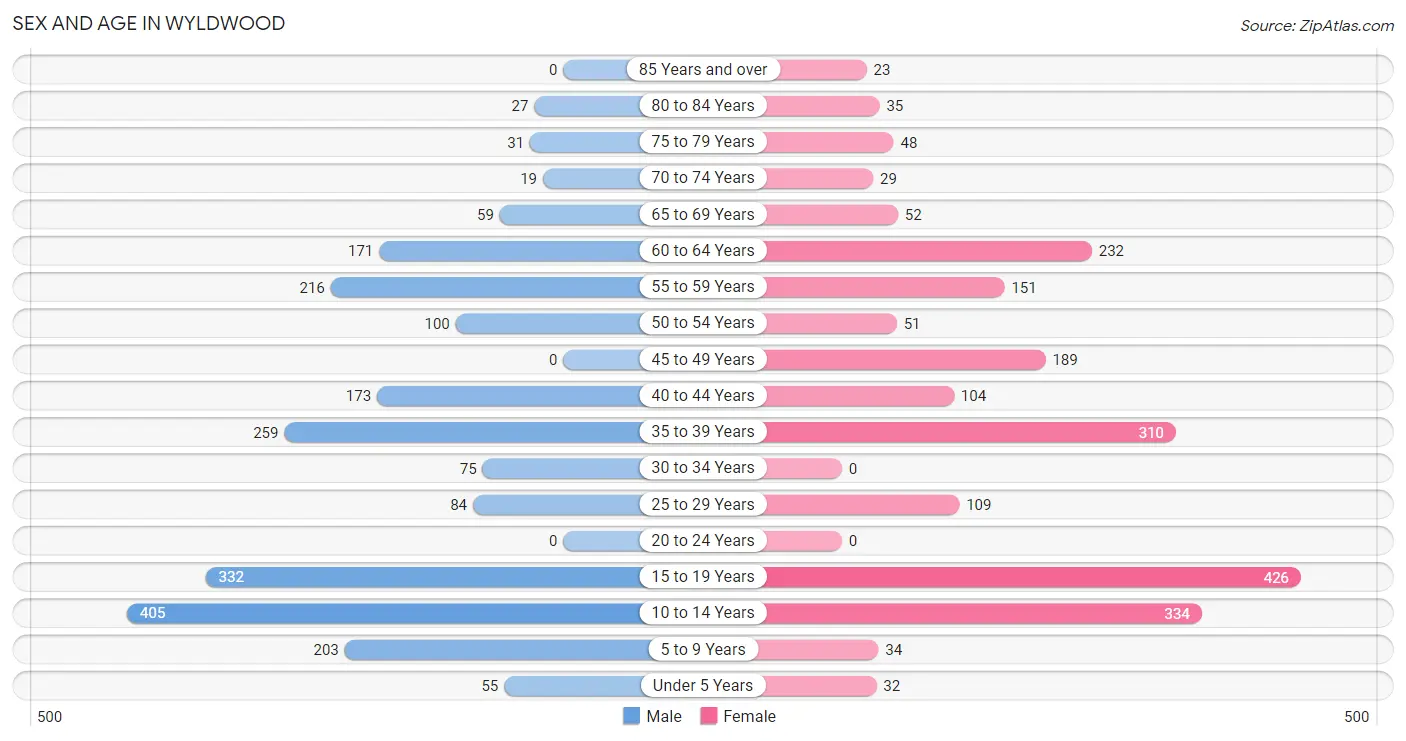
| Age Bracket | Male | Female |
| Under 5 Years | 55 (2.5%) | 32 (1.5%) |
| 5 to 9 Years | 203 (9.2%) | 34 (1.6%) |
| 10 to 14 Years | 405 (18.3%) | 334 (15.5%) |
| 15 to 19 Years | 332 (15.0%) | 426 (19.7%) |
| 20 to 24 Years | 0 (0.0%) | 0 (0.0%) |
| 25 to 29 Years | 84 (3.8%) | 109 (5.1%) |
| 30 to 34 Years | 75 (3.4%) | 0 (0.0%) |
| 35 to 39 Years | 259 (11.7%) | 310 (14.4%) |
| 40 to 44 Years | 173 (7.8%) | 104 (4.8%) |
| 45 to 49 Years | 0 (0.0%) | 189 (8.7%) |
| 50 to 54 Years | 100 (4.5%) | 51 (2.4%) |
| 55 to 59 Years | 216 (9.8%) | 151 (7.0%) |
| 60 to 64 Years | 171 (7.7%) | 232 (10.7%) |
| 65 to 69 Years | 59 (2.7%) | 52 (2.4%) |
| 70 to 74 Years | 19 (0.9%) | 29 (1.3%) |
| 75 to 79 Years | 31 (1.4%) | 48 (2.2%) |
| 80 to 84 Years | 27 (1.2%) | 35 (1.6%) |
| 85 Years and over | 0 (0.0%) | 23 (1.1%) |
| Total | 2,209 (100.0%) | 2,159 (100.0%) |
Families and Households in Wyldwood
Median Family Size in Wyldwood
The median family size in Wyldwood is 4.16 persons per family, with married-couple families (550 | 59.9%) accounting for the largest median family size of 4.67 persons per family. On the other hand, single male/father families (91 | 9.9%) represent the smallest median family size with 2.54 persons per family.
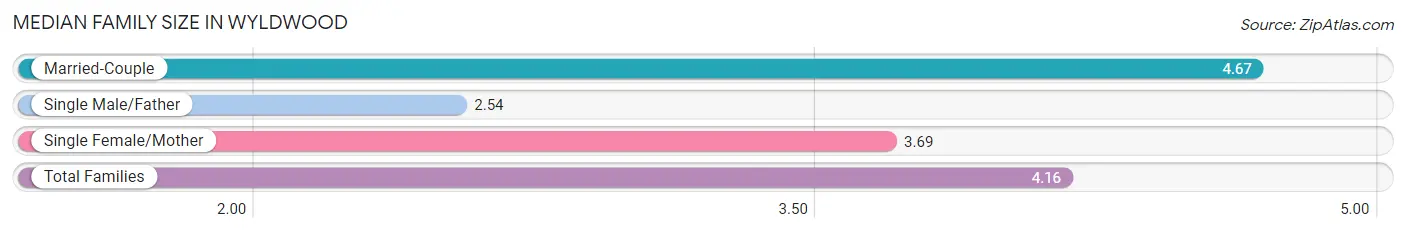
| Family Type | # Families | Family Size |
| Married-Couple | 550 (59.9%) | 4.67 |
| Single Male/Father | 91 (9.9%) | 2.54 |
| Single Female/Mother | 277 (30.2%) | 3.69 |
| Total Families | 918 (100.0%) | 4.16 |
Median Household Size in Wyldwood
The median household size in Wyldwood is 3.44 persons per household, with married-couple households (550 | 43.3%) accounting for the largest median household size of 4.67 persons per household. non-family households (353 | 27.8%) represent the smallest median household size with 1.20 persons per household.
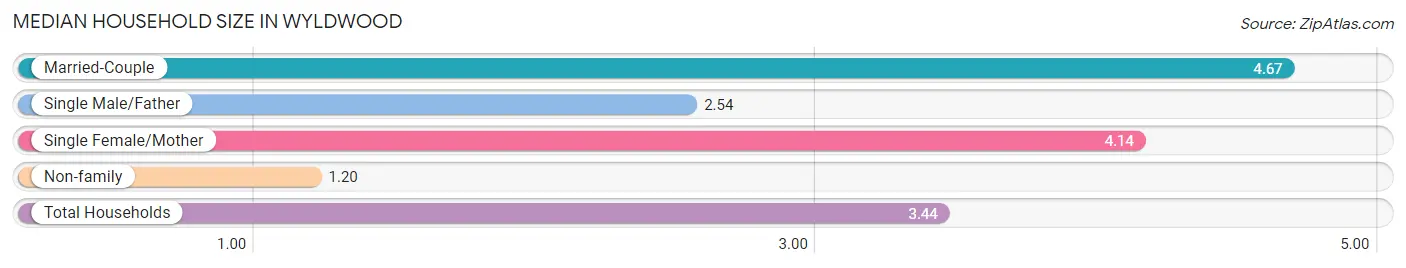
| Household Type | # Households | Household Size |
| Married-Couple | 550 (43.3%) | 4.67 |
| Single Male/Father | 91 (7.2%) | 2.54 |
| Single Female/Mother | 277 (21.8%) | 4.14 |
| Non-family | 353 (27.8%) | 1.20 |
| Total Households | 1,271 (100.0%) | 3.44 |
Household Size by Marriage Status in Wyldwood
Out of a total of 1,271 households in Wyldwood, 918 (72.2%) are family households, while 353 (27.8%) are nonfamily households. The most numerous type of family households are 2-person households, comprising 267, and the most common type of nonfamily households are 1-person households, comprising 277.
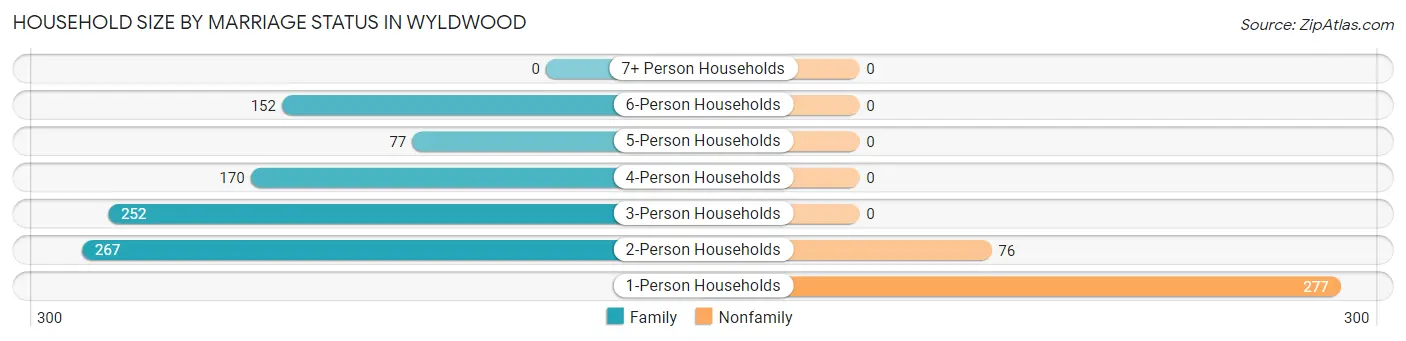
| Household Size | Family Households | Nonfamily Households |
| 1-Person Households | - | 277 (21.8%) |
| 2-Person Households | 267 (21.0%) | 76 (6.0%) |
| 3-Person Households | 252 (19.8%) | 0 (0.0%) |
| 4-Person Households | 170 (13.4%) | 0 (0.0%) |
| 5-Person Households | 77 (6.1%) | 0 (0.0%) |
| 6-Person Households | 152 (12.0%) | 0 (0.0%) |
| 7+ Person Households | 0 (0.0%) | 0 (0.0%) |
| Total | 918 (72.2%) | 353 (27.8%) |
Female Fertility in Wyldwood
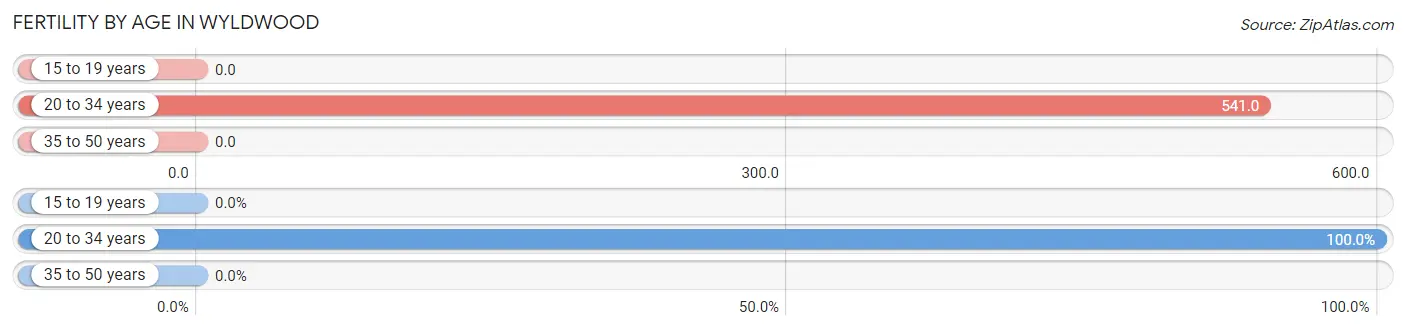
Fertility by Age in Wyldwood
Average fertility rate in Wyldwood is 51.0 births per 1,000 women. Women in the age bracket of 20 to 34 years have the highest fertility rate with 541.0 births per 1,000 women. Women in the age bracket of 20 to 34 years acount for 100.0% of all women with births.
| Age Bracket | Women with Births | Births / 1,000 Women |
| 15 to 19 years | 0 (0.0%) | 0.0 |
| 20 to 34 years | 59 (100.0%) | 541.0 |
| 35 to 50 years | 0 (0.0%) | 0.0 |
| Total | 59 (100.0%) | 51.0 |
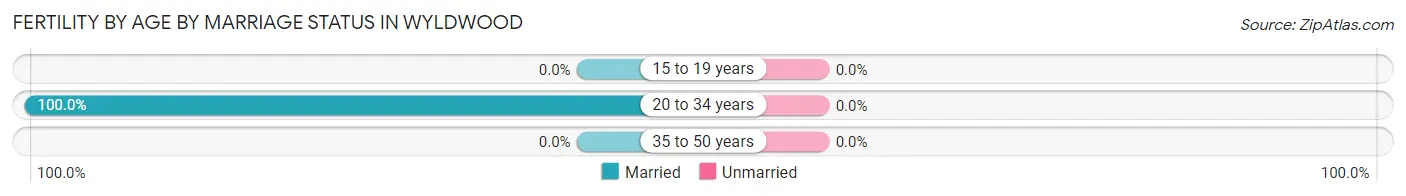
Fertility by Age by Marriage Status in Wyldwood
| Age Bracket | Married | Unmarried |
| 15 to 19 years | 0 (0.0%) | 0 (0.0%) |
| 20 to 34 years | 59 (100.0%) | 0 (0.0%) |
| 35 to 50 years | 0 (0.0%) | 0 (0.0%) |
| Total | 59 (100.0%) | 0 (0.0%) |
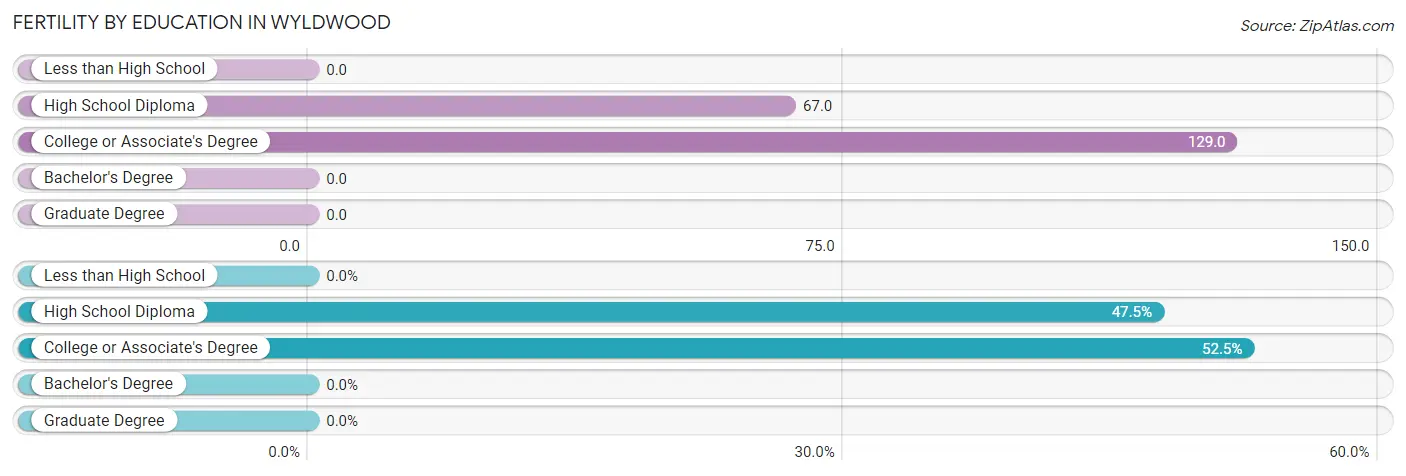
Fertility by Education in Wyldwood
| Educational Attainment | Women with Births | Births / 1,000 Women |
| Less than High School | 0 (0.0%) | 0.0 |
| High School Diploma | 28 (47.5%) | 67.0 |
| College or Associate's Degree | 31 (52.5%) | 129.0 |
| Bachelor's Degree | 0 (0.0%) | 0.0 |
| Graduate Degree | 0 (0.0%) | 0.0 |
| Total | 59 (100.0%) | 51.0 |
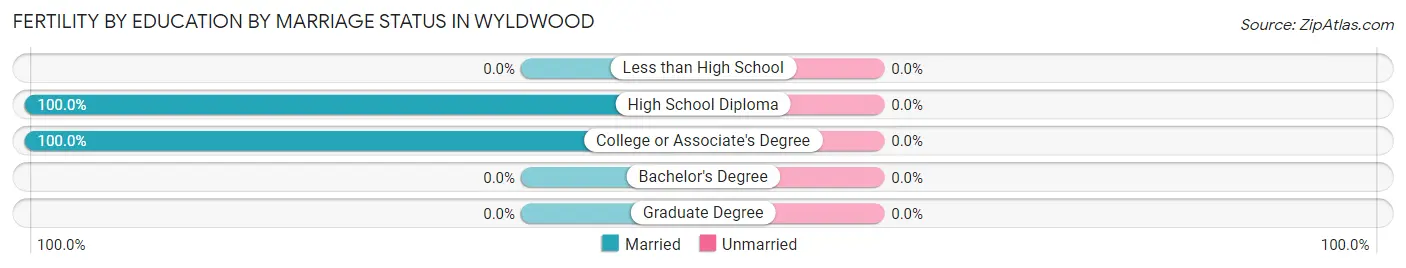
Fertility by Education by Marriage Status in Wyldwood
| Educational Attainment | Married | Unmarried |
| Less than High School | 0 (0.0%) | 0 (0.0%) |
| High School Diploma | 28 (100.0%) | 0 (0.0%) |
| College or Associate's Degree | 31 (100.0%) | 0 (0.0%) |
| Bachelor's Degree | 0 (0.0%) | 0 (0.0%) |
| Graduate Degree | 0 (0.0%) | 0 (0.0%) |
| Total | 59 (100.0%) | 0 (0.0%) |
Employment Characteristics in Wyldwood
Employment by Class of Employer in Wyldwood
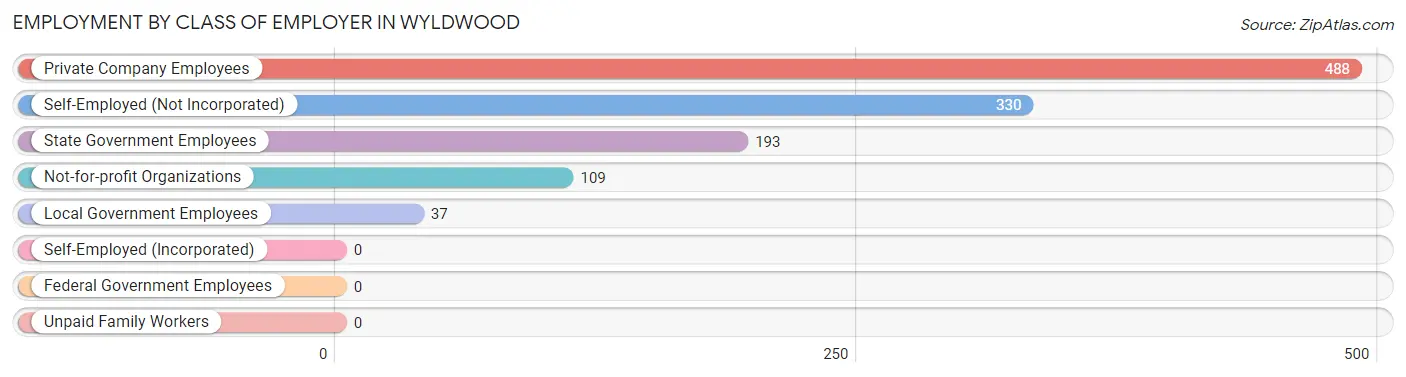
Among the 1,157 employed individuals in Wyldwood, private company employees (488 | 42.2%), self-employed (not incorporated) (330 | 28.5%), and state government employees (193 | 16.7%) make up the most common classes of employment.
| Employer Class | # Employees | % Employees |
| Private Company Employees | 488 | 42.2% |
| Self-Employed (Incorporated) | 0 | 0.0% |
| Self-Employed (Not Incorporated) | 330 | 28.5% |
| Not-for-profit Organizations | 109 | 9.4% |
| Local Government Employees | 37 | 3.2% |
| State Government Employees | 193 | 16.7% |
| Federal Government Employees | 0 | 0.0% |
| Unpaid Family Workers | 0 | 0.0% |
| Total | 1,157 | 100.0% |
Employment Status by Age in Wyldwood
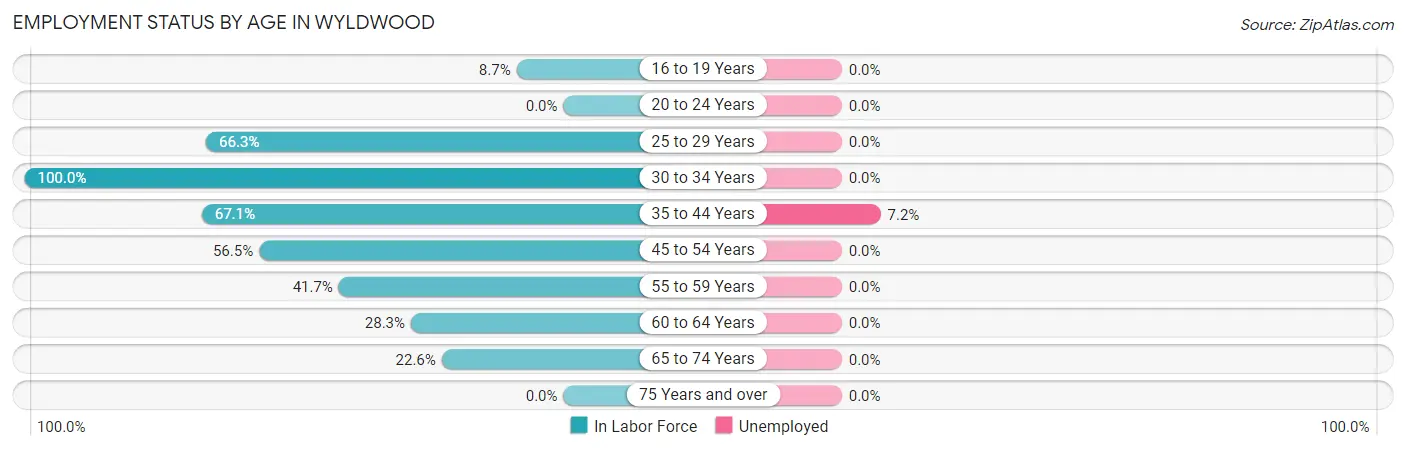
According to the labor force statistics for Wyldwood, out of the total population over 16 years of age (3,262), 40.7% or 1,328 individuals are in the labor force, with 3.1% or 41 of them unemployed. The age group with the highest labor force participation rate is 30 to 34 years, with 100.0% or 75 individuals in the labor force. Within the labor force, the 35 to 44 years age range has the highest percentage of unemployed individuals, with 7.2% or 41 of them being unemployed.
| Age Bracket | In Labor Force | Unemployed |
| 16 to 19 Years | 62 (8.7%) | 0 (0.0%) |
| 20 to 24 Years | 0 (0.0%) | 0 (0.0%) |
| 25 to 29 Years | 128 (66.3%) | 0 (0.0%) |
| 30 to 34 Years | 75 (100.0%) | 0 (0.0%) |
| 35 to 44 Years | 568 (67.1%) | 41 (7.2%) |
| 45 to 54 Years | 192 (56.5%) | 0 (0.0%) |
| 55 to 59 Years | 153 (41.7%) | 0 (0.0%) |
| 60 to 64 Years | 114 (28.3%) | 0 (0.0%) |
| 65 to 74 Years | 36 (22.6%) | 0 (0.0%) |
| 75 Years and over | 0 (0.0%) | 0 (0.0%) |
| Total | 1,328 (40.7%) | 41 (3.1%) |
Employment Status by Educational Attainment in Wyldwood
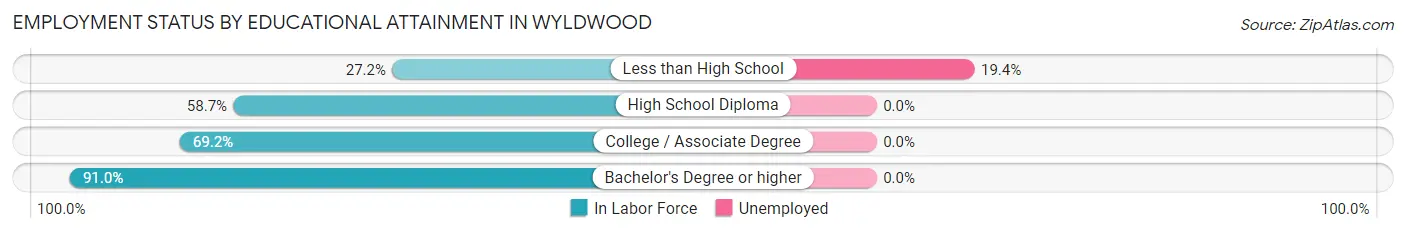
According to labor force statistics for Wyldwood, 55.3% of individuals (1,230) out of the total population between 25 and 64 years of age (2,224) are in the labor force, with 3.3% or 41 of them being unemployed. The group with the highest labor force participation rate are those with the educational attainment of bachelor's degree or higher, with 91.0% or 356 individuals in the labor force. Within the labor force, individuals with less than high school education have the highest percentage of unemployment, with 19.4% or 41 of them being unemployed.
| Educational Attainment | In Labor Force | Unemployed |
| Less than High School | 211 (27.2%) | 151 (19.4%) |
| High School Diploma | 384 (58.7%) | 0 (0.0%) |
| College / Associate Degree | 279 (69.2%) | 0 (0.0%) |
| Bachelor's Degree or higher | 356 (91.0%) | 0 (0.0%) |
| Total | 1,230 (55.3%) | 73 (3.3%) |
Employment Occupations by Sex in Wyldwood
Management, Business, Science and Arts Occupations
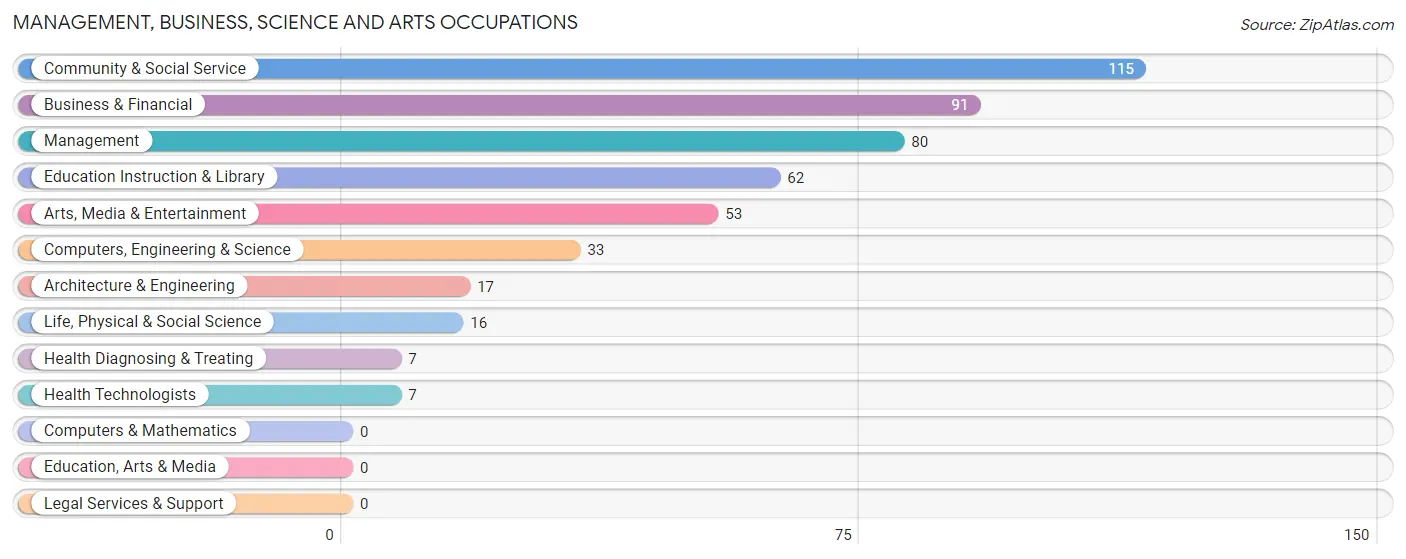
The most common Management, Business, Science and Arts occupations in Wyldwood are Community & Social Service (115 | 8.9%), Business & Financial (91 | 7.1%), Management (80 | 6.2%), Education Instruction & Library (62 | 4.8%), and Arts, Media & Entertainment (53 | 4.1%).
Management, Business, Science and Arts Occupations by Sex
Within the Management, Business, Science and Arts occupations in Wyldwood, the most male-oriented occupations are Computers, Engineering & Science (100.0%), Architecture & Engineering (100.0%), and Life, Physical & Social Science (100.0%), while the most female-oriented occupations are Business & Financial (100.0%), Education Instruction & Library (100.0%), and Health Diagnosing & Treating (100.0%).
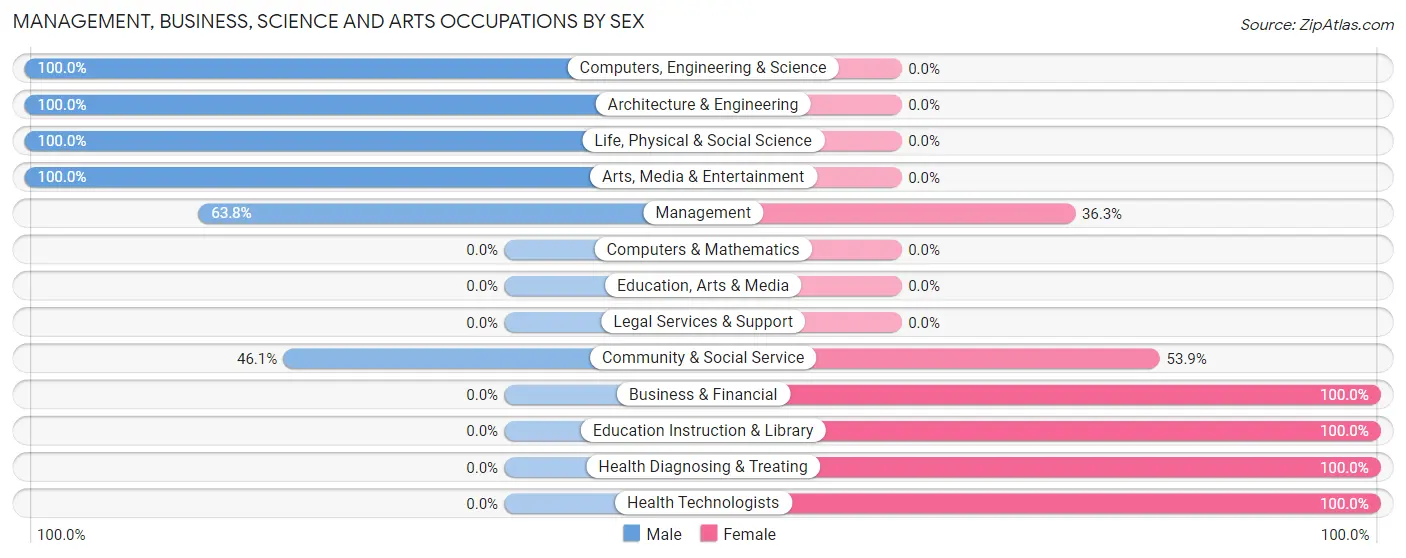
| Occupation | Male | Female |
| Management | 51 (63.7%) | 29 (36.2%) |
| Business & Financial | 0 (0.0%) | 91 (100.0%) |
| Computers, Engineering & Science | 33 (100.0%) | 0 (0.0%) |
| Computers & Mathematics | 0 (0.0%) | 0 (0.0%) |
| Architecture & Engineering | 17 (100.0%) | 0 (0.0%) |
| Life, Physical & Social Science | 16 (100.0%) | 0 (0.0%) |
| Community & Social Service | 53 (46.1%) | 62 (53.9%) |
| Education, Arts & Media | 0 (0.0%) | 0 (0.0%) |
| Legal Services & Support | 0 (0.0%) | 0 (0.0%) |
| Education Instruction & Library | 0 (0.0%) | 62 (100.0%) |
| Arts, Media & Entertainment | 53 (100.0%) | 0 (0.0%) |
| Health Diagnosing & Treating | 0 (0.0%) | 7 (100.0%) |
| Health Technologists | 0 (0.0%) | 7 (100.0%) |
| Total (Category) | 137 (42.0%) | 189 (58.0%) |
| Total (Overall) | 796 (61.9%) | 491 (38.2%) |
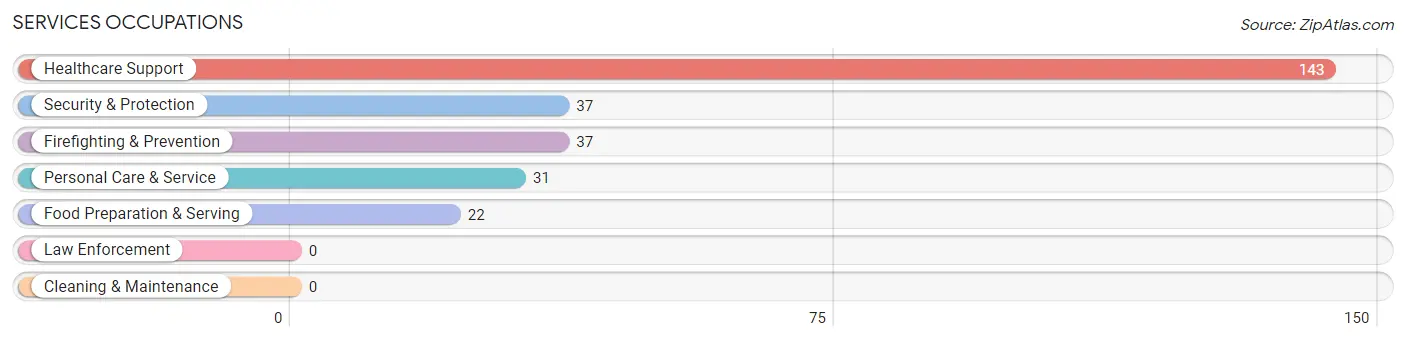
Services Occupations
The most common Services occupations in Wyldwood are Healthcare Support (143 | 11.1%), Security & Protection (37 | 2.9%), Firefighting & Prevention (37 | 2.9%), Personal Care & Service (31 | 2.4%), and Food Preparation & Serving (22 | 1.7%).
Services Occupations by Sex
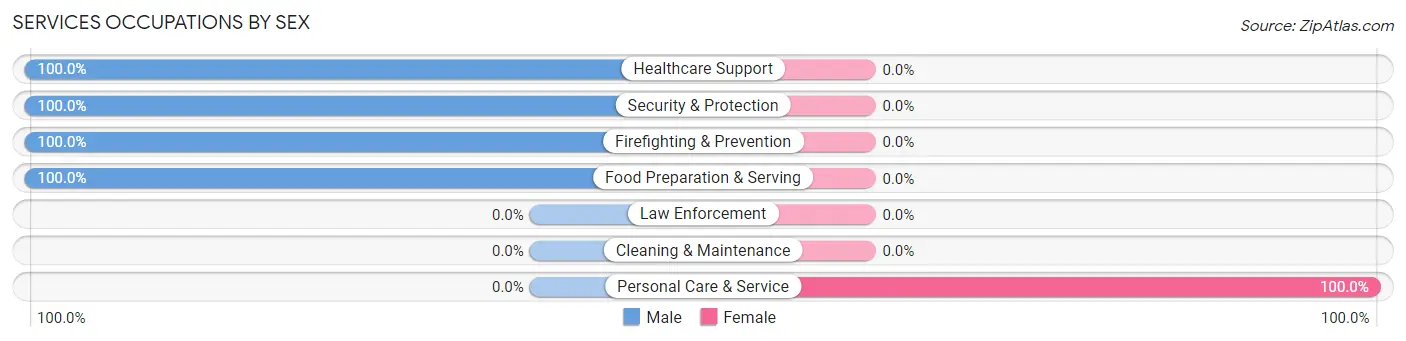
| Occupation | Male | Female |
| Healthcare Support | 143 (100.0%) | 0 (0.0%) |
| Security & Protection | 37 (100.0%) | 0 (0.0%) |
| Firefighting & Prevention | 37 (100.0%) | 0 (0.0%) |
| Law Enforcement | 0 (0.0%) | 0 (0.0%) |
| Food Preparation & Serving | 22 (100.0%) | 0 (0.0%) |
| Cleaning & Maintenance | 0 (0.0%) | 0 (0.0%) |
| Personal Care & Service | 0 (0.0%) | 31 (100.0%) |
| Total (Category) | 202 (86.7%) | 31 (13.3%) |
| Total (Overall) | 796 (61.9%) | 491 (38.2%) |
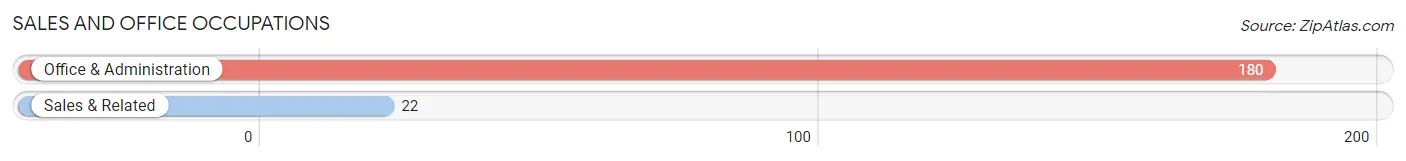
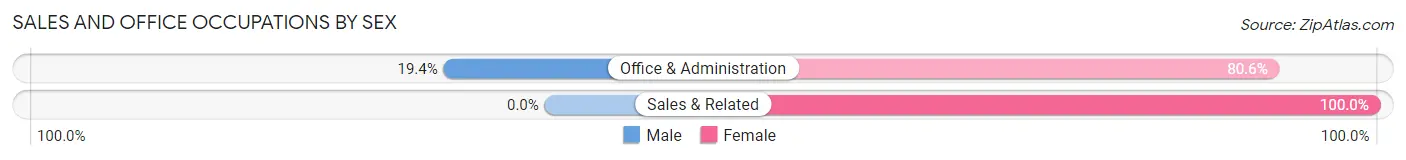
Sales and Office Occupations
The most common Sales and Office occupations in Wyldwood are Office & Administration (180 | 14.0%), and Sales & Related (22 | 1.7%).
Sales and Office Occupations by Sex
| Occupation | Male | Female |
| Sales & Related | 0 (0.0%) | 22 (100.0%) |
| Office & Administration | 35 (19.4%) | 145 (80.6%) |
| Total (Category) | 35 (17.3%) | 167 (82.7%) |
| Total (Overall) | 796 (61.9%) | 491 (38.2%) |
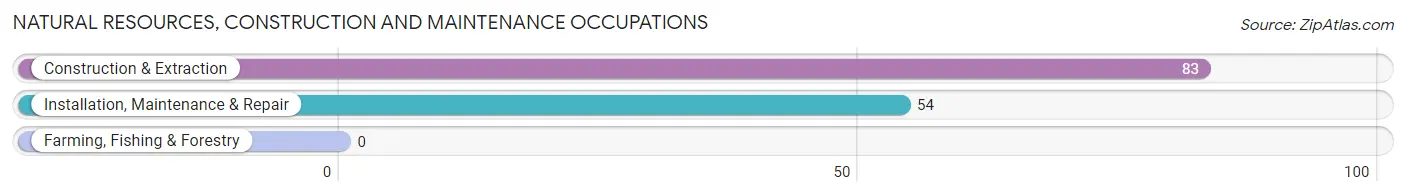
Natural Resources, Construction and Maintenance Occupations
The most common Natural Resources, Construction and Maintenance occupations in Wyldwood are Construction & Extraction (83 | 6.5%), and Installation, Maintenance & Repair (54 | 4.2%).
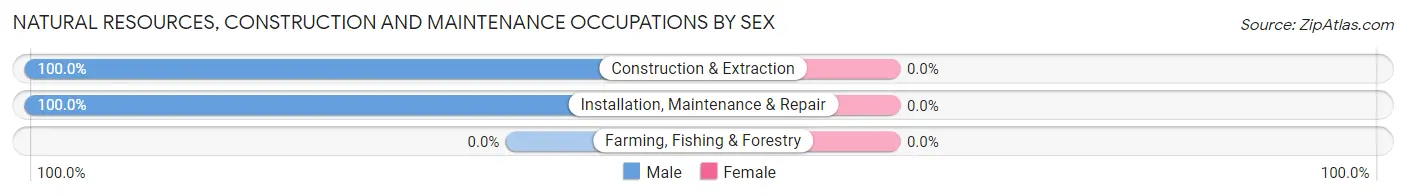
Natural Resources, Construction and Maintenance Occupations by Sex
| Occupation | Male | Female |
| Farming, Fishing & Forestry | 0 (0.0%) | 0 (0.0%) |
| Construction & Extraction | 83 (100.0%) | 0 (0.0%) |
| Installation, Maintenance & Repair | 54 (100.0%) | 0 (0.0%) |
| Total (Category) | 137 (100.0%) | 0 (0.0%) |
| Total (Overall) | 796 (61.9%) | 491 (38.2%) |
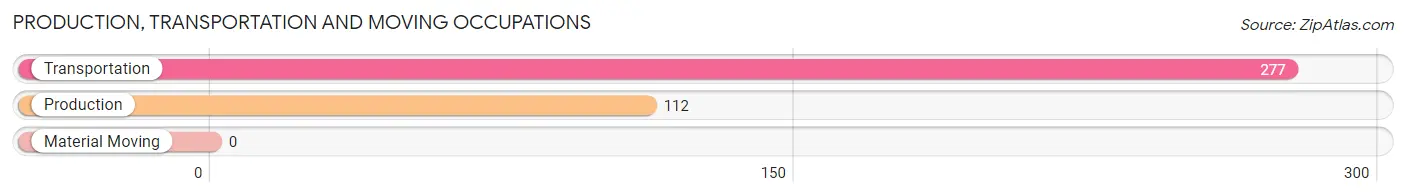
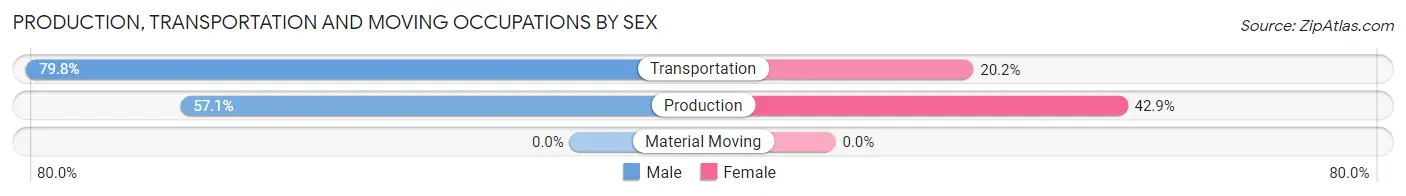
Production, Transportation and Moving Occupations
The most common Production, Transportation and Moving occupations in Wyldwood are Transportation (277 | 21.5%), and Production (112 | 8.7%).
Production, Transportation and Moving Occupations by Sex
| Occupation | Male | Female |
| Production | 64 (57.1%) | 48 (42.9%) |
| Transportation | 221 (79.8%) | 56 (20.2%) |
| Material Moving | 0 (0.0%) | 0 (0.0%) |
| Total (Category) | 285 (73.3%) | 104 (26.7%) |
| Total (Overall) | 796 (61.9%) | 491 (38.2%) |
Employment Industries by Sex in Wyldwood
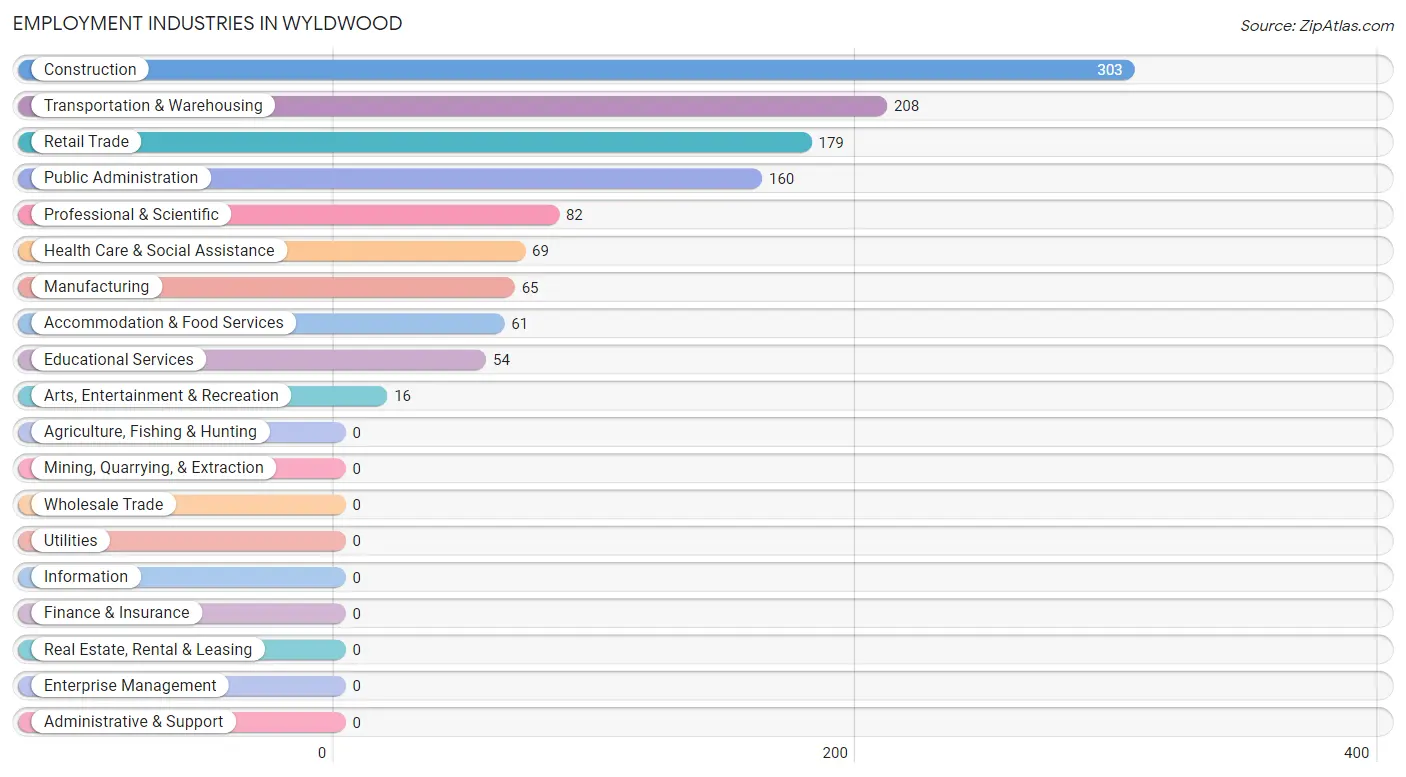
Employment Industries in Wyldwood
The major employment industries in Wyldwood include Construction (303 | 23.5%), Transportation & Warehousing (208 | 16.2%), Retail Trade (179 | 13.9%), Public Administration (160 | 12.4%), and Professional & Scientific (82 | 6.4%).
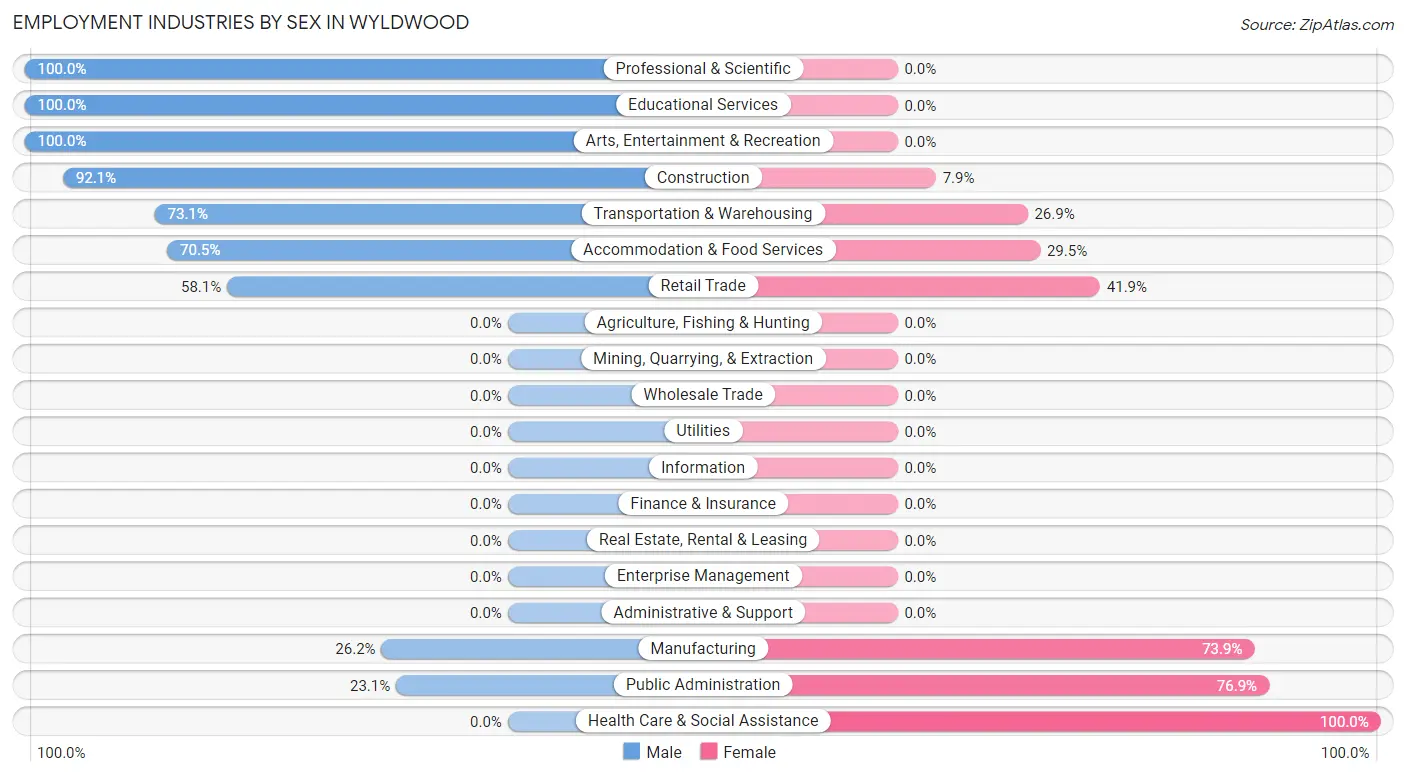
Employment Industries by Sex in Wyldwood
The Wyldwood industries that see more men than women are Professional & Scientific (100.0%), Educational Services (100.0%), and Arts, Entertainment & Recreation (100.0%), whereas the industries that tend to have a higher number of women are Health Care & Social Assistance (100.0%), Public Administration (76.9%), and Manufacturing (73.9%).
| Industry | Male | Female |
| Agriculture, Fishing & Hunting | 0 (0.0%) | 0 (0.0%) |
| Mining, Quarrying, & Extraction | 0 (0.0%) | 0 (0.0%) |
| Construction | 279 (92.1%) | 24 (7.9%) |
| Manufacturing | 17 (26.2%) | 48 (73.9%) |
| Wholesale Trade | 0 (0.0%) | 0 (0.0%) |
| Retail Trade | 104 (58.1%) | 75 (41.9%) |
| Transportation & Warehousing | 152 (73.1%) | 56 (26.9%) |
| Utilities | 0 (0.0%) | 0 (0.0%) |
| Information | 0 (0.0%) | 0 (0.0%) |
| Finance & Insurance | 0 (0.0%) | 0 (0.0%) |
| Real Estate, Rental & Leasing | 0 (0.0%) | 0 (0.0%) |
| Professional & Scientific | 82 (100.0%) | 0 (0.0%) |
| Enterprise Management | 0 (0.0%) | 0 (0.0%) |
| Administrative & Support | 0 (0.0%) | 0 (0.0%) |
| Educational Services | 54 (100.0%) | 0 (0.0%) |
| Health Care & Social Assistance | 0 (0.0%) | 69 (100.0%) |
| Arts, Entertainment & Recreation | 16 (100.0%) | 0 (0.0%) |
| Accommodation & Food Services | 43 (70.5%) | 18 (29.5%) |
| Public Administration | 37 (23.1%) | 123 (76.9%) |
| Total | 796 (61.9%) | 491 (38.2%) |
Education in Wyldwood
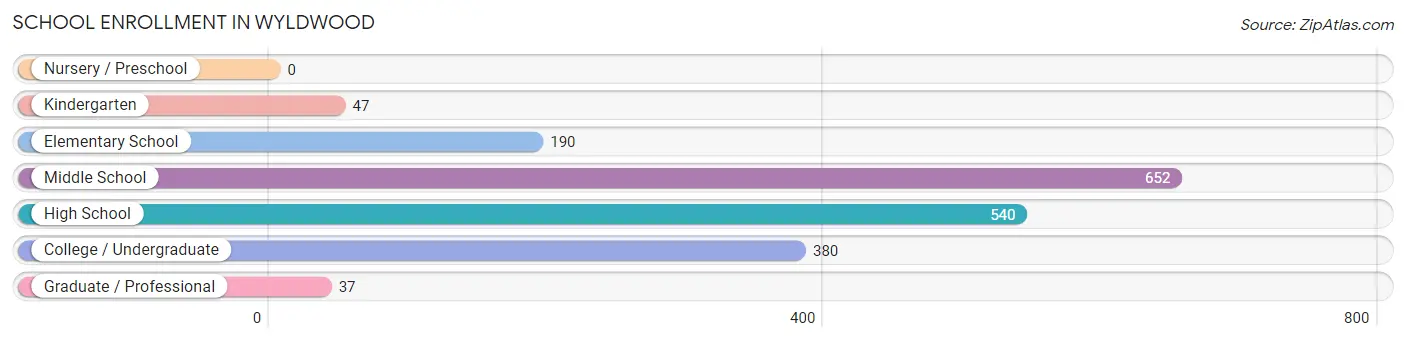
School Enrollment in Wyldwood
The most common levels of schooling among the 1,846 students in Wyldwood are middle school (652 | 35.3%), high school (540 | 29.2%), and college / undergraduate (380 | 20.6%).
| School Level | # Students | % Students |
| Nursery / Preschool | 0 | 0.0% |
| Kindergarten | 47 | 2.5% |
| Elementary School | 190 | 10.3% |
| Middle School | 652 | 35.3% |
| High School | 540 | 29.2% |
| College / Undergraduate | 380 | 20.6% |
| Graduate / Professional | 37 | 2.0% |
| Total | 1,846 | 100.0% |
School Enrollment by Age by Funding Source in Wyldwood
Out of a total of 1,846 students who are enrolled in schools in Wyldwood, 209 (11.3%) attend a private institution, while the remaining 1,637 (88.7%) are enrolled in public schools. The age group of 25 to 34 year olds has the highest likelihood of being enrolled in private schools, with 53 (65.4% in the age bracket) enrolled. Conversely, the age group of 5 to 9 year old has the lowest likelihood of being enrolled in a private school, with 237 (100.0% in the age bracket) attending a public institution.
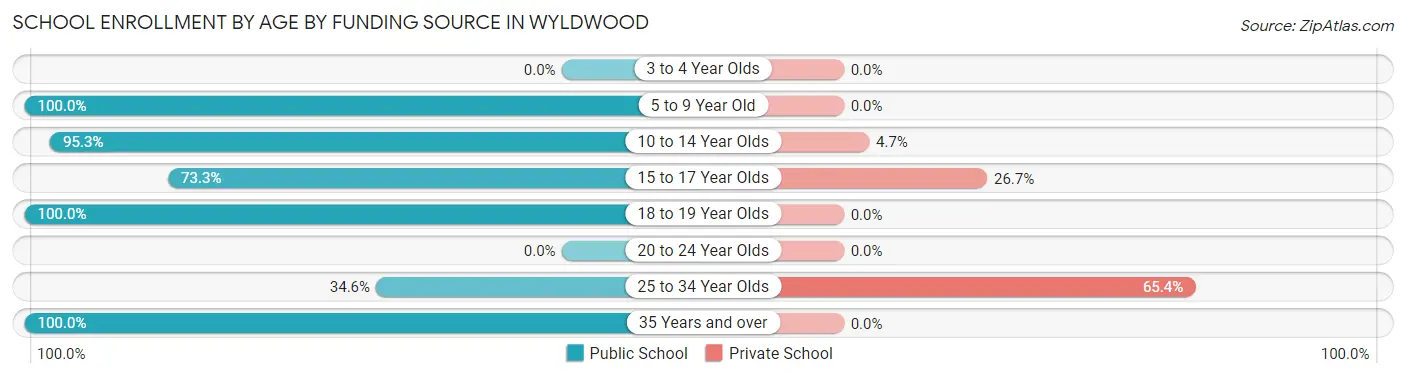
| Age Bracket | Public School | Private School |
| 3 to 4 Year Olds | 0 (0.0%) | 0 (0.0%) |
| 5 to 9 Year Old | 237 (100.0%) | 0 (0.0%) |
| 10 to 14 Year Olds | 704 (95.3%) | 35 (4.7%) |
| 15 to 17 Year Olds | 332 (73.3%) | 121 (26.7%) |
| 18 to 19 Year Olds | 243 (100.0%) | 0 (0.0%) |
| 20 to 24 Year Olds | 0 (0.0%) | 0 (0.0%) |
| 25 to 34 Year Olds | 28 (34.6%) | 53 (65.4%) |
| 35 Years and over | 93 (100.0%) | 0 (0.0%) |
| Total | 1,637 (88.7%) | 209 (11.3%) |
Educational Attainment by Field of Study in Wyldwood
Social sciences (142 | 28.9%), visual & performing arts (75 | 15.3%), computers & mathematics (74 | 15.1%), business (48 | 9.8%), and psychology (32 | 6.5%) are the most common fields of study among 491 individuals in Wyldwood who have obtained a bachelor's degree or higher.
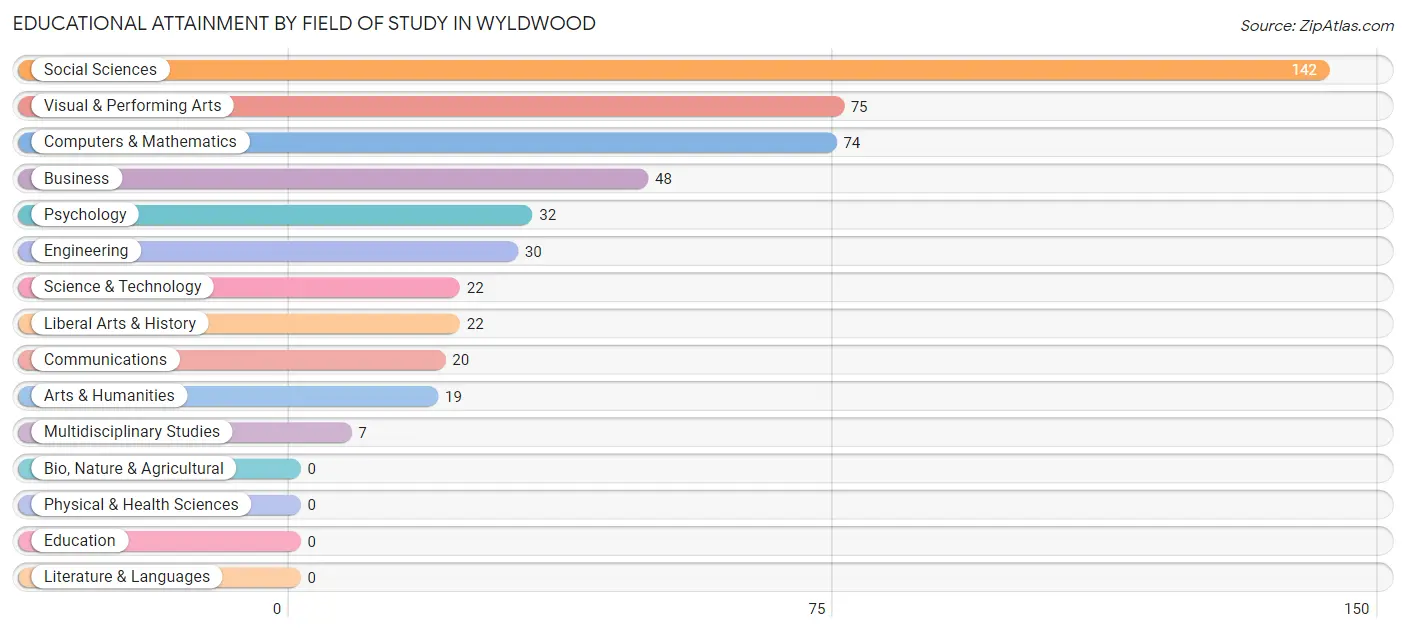
| Field of Study | # Graduates | % Graduates |
| Computers & Mathematics | 74 | 15.1% |
| Bio, Nature & Agricultural | 0 | 0.0% |
| Physical & Health Sciences | 0 | 0.0% |
| Psychology | 32 | 6.5% |
| Social Sciences | 142 | 28.9% |
| Engineering | 30 | 6.1% |
| Multidisciplinary Studies | 7 | 1.4% |
| Science & Technology | 22 | 4.5% |
| Business | 48 | 9.8% |
| Education | 0 | 0.0% |
| Literature & Languages | 0 | 0.0% |
| Liberal Arts & History | 22 | 4.5% |
| Visual & Performing Arts | 75 | 15.3% |
| Communications | 20 | 4.1% |
| Arts & Humanities | 19 | 3.9% |
| Total | 491 | 100.0% |
Transportation & Commute in Wyldwood
Vehicle Availability by Sex in Wyldwood
The most prevalent vehicle ownership categories in Wyldwood are males with 3 vehicles (446, accounting for 60.0%) and females with 3 vehicles (137, making up 108.0%).
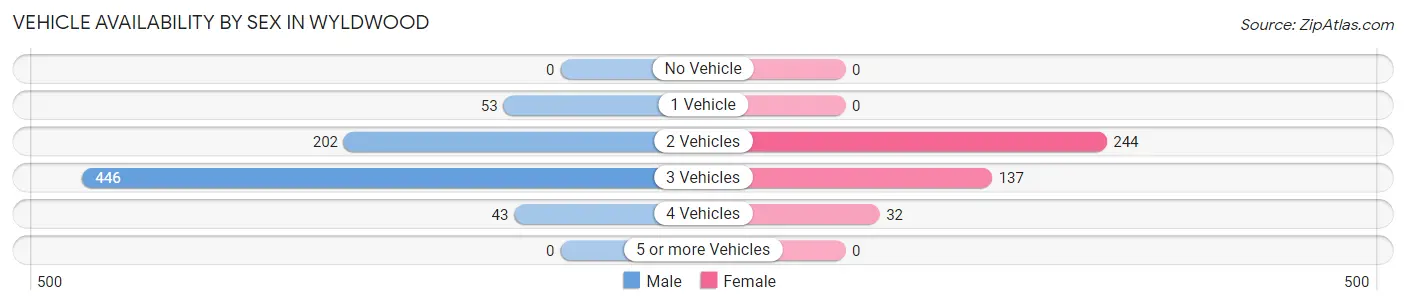
| Vehicles Available | Male | Female |
| No Vehicle | 0 (0.0%) | 0 (0.0%) |
| 1 Vehicle | 53 (7.1%) | 0 (0.0%) |
| 2 Vehicles | 202 (27.2%) | 244 (59.1%) |
| 3 Vehicles | 446 (60.0%) | 137 (33.2%) |
| 4 Vehicles | 43 (5.8%) | 32 (7.7%) |
| 5 or more Vehicles | 0 (0.0%) | 0 (0.0%) |
| Total | 744 (100.0%) | 413 (100.0%) |
Commute Time in Wyldwood
The most frequently occuring commute durations in Wyldwood are 30 to 34 minutes (356 commuters, 31.6%), 40 to 44 minutes (294 commuters, 26.1%), and 45 to 59 minutes (229 commuters, 20.3%).
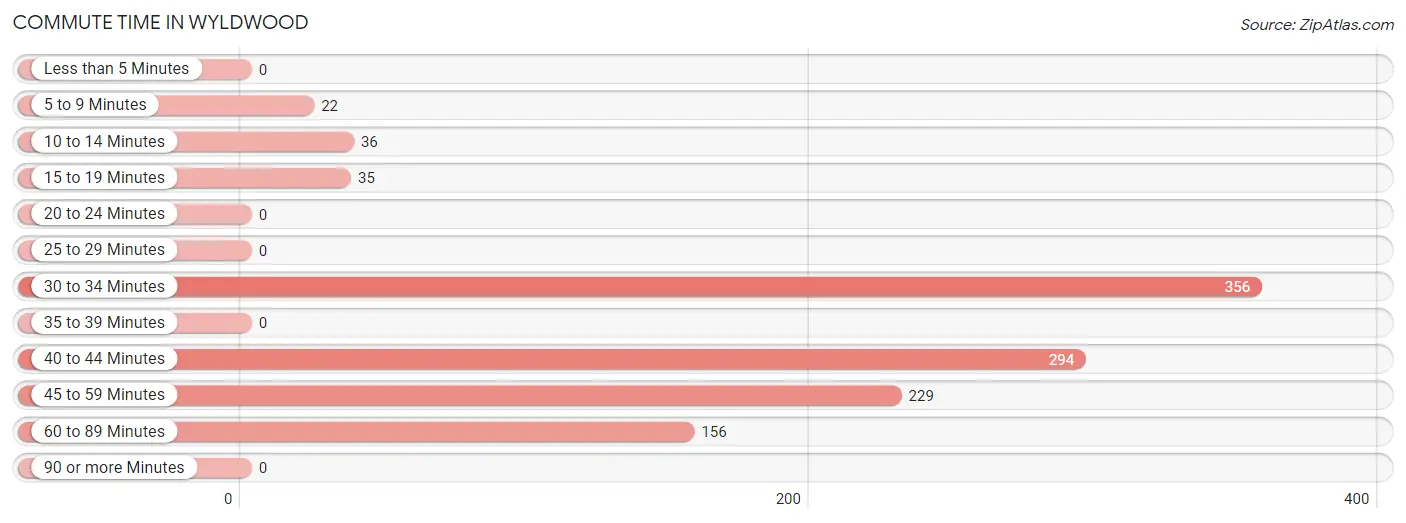
| Commute Time | # Commuters | % Commuters |
| Less than 5 Minutes | 0 | 0.0% |
| 5 to 9 Minutes | 22 | 1.9% |
| 10 to 14 Minutes | 36 | 3.2% |
| 15 to 19 Minutes | 35 | 3.1% |
| 20 to 24 Minutes | 0 | 0.0% |
| 25 to 29 Minutes | 0 | 0.0% |
| 30 to 34 Minutes | 356 | 31.6% |
| 35 to 39 Minutes | 0 | 0.0% |
| 40 to 44 Minutes | 294 | 26.1% |
| 45 to 59 Minutes | 229 | 20.3% |
| 60 to 89 Minutes | 156 | 13.8% |
| 90 or more Minutes | 0 | 0.0% |
Commute Time by Sex in Wyldwood
The most common commute times in Wyldwood are 30 to 34 minutes (356 commuters, 47.8%) for males and 40 to 44 minutes (125 commuters, 32.6%) for females.
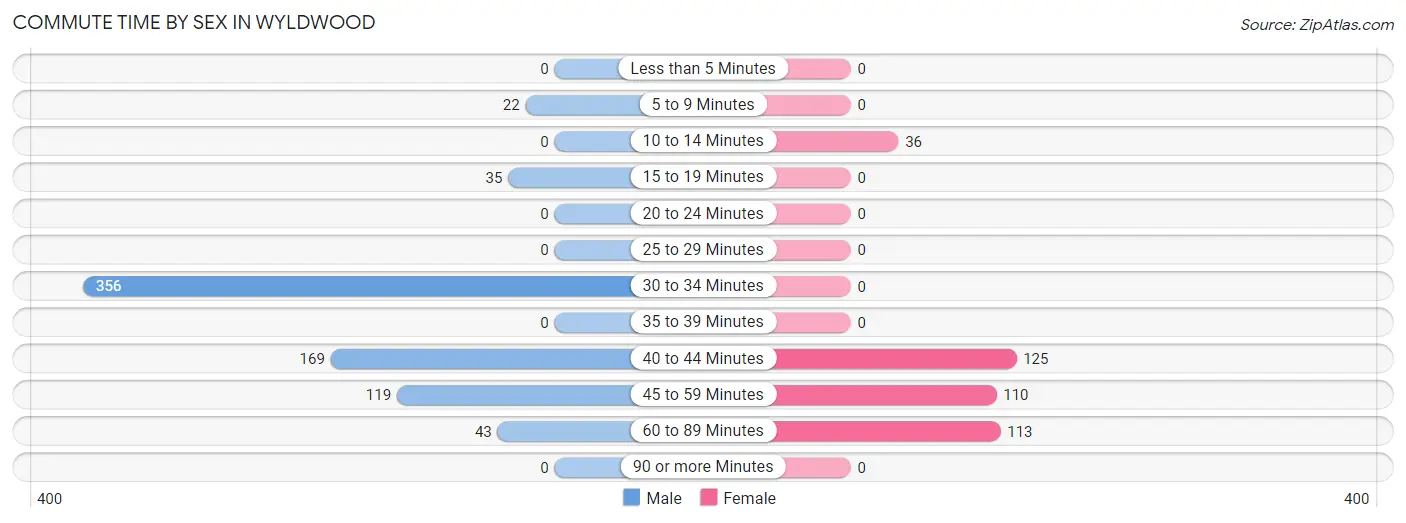
| Commute Time | Male | Female |
| Less than 5 Minutes | 0 (0.0%) | 0 (0.0%) |
| 5 to 9 Minutes | 22 (3.0%) | 0 (0.0%) |
| 10 to 14 Minutes | 0 (0.0%) | 36 (9.4%) |
| 15 to 19 Minutes | 35 (4.7%) | 0 (0.0%) |
| 20 to 24 Minutes | 0 (0.0%) | 0 (0.0%) |
| 25 to 29 Minutes | 0 (0.0%) | 0 (0.0%) |
| 30 to 34 Minutes | 356 (47.8%) | 0 (0.0%) |
| 35 to 39 Minutes | 0 (0.0%) | 0 (0.0%) |
| 40 to 44 Minutes | 169 (22.7%) | 125 (32.6%) |
| 45 to 59 Minutes | 119 (16.0%) | 110 (28.6%) |
| 60 to 89 Minutes | 43 (5.8%) | 113 (29.4%) |
| 90 or more Minutes | 0 (0.0%) | 0 (0.0%) |
Time of Departure to Work by Sex in Wyldwood
The most frequent times of departure to work in Wyldwood are 6:00 AM to 6:29 AM (356, 47.8%) for males and 6:30 AM to 6:59 AM (130, 33.9%) for females.
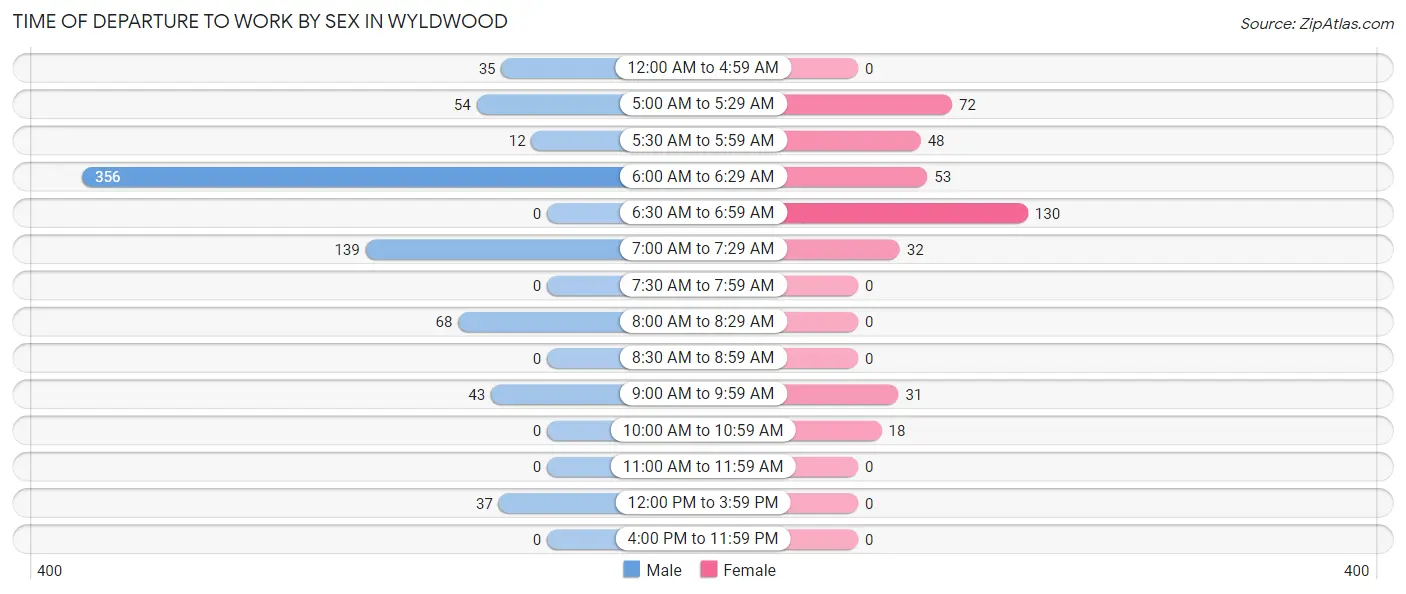
| Time of Departure | Male | Female |
| 12:00 AM to 4:59 AM | 35 (4.7%) | 0 (0.0%) |
| 5:00 AM to 5:29 AM | 54 (7.3%) | 72 (18.8%) |
| 5:30 AM to 5:59 AM | 12 (1.6%) | 48 (12.5%) |
| 6:00 AM to 6:29 AM | 356 (47.8%) | 53 (13.8%) |
| 6:30 AM to 6:59 AM | 0 (0.0%) | 130 (33.9%) |
| 7:00 AM to 7:29 AM | 139 (18.7%) | 32 (8.3%) |
| 7:30 AM to 7:59 AM | 0 (0.0%) | 0 (0.0%) |
| 8:00 AM to 8:29 AM | 68 (9.1%) | 0 (0.0%) |
| 8:30 AM to 8:59 AM | 0 (0.0%) | 0 (0.0%) |
| 9:00 AM to 9:59 AM | 43 (5.8%) | 31 (8.1%) |
| 10:00 AM to 10:59 AM | 0 (0.0%) | 18 (4.7%) |
| 11:00 AM to 11:59 AM | 0 (0.0%) | 0 (0.0%) |
| 12:00 PM to 3:59 PM | 37 (5.0%) | 0 (0.0%) |
| 4:00 PM to 11:59 PM | 0 (0.0%) | 0 (0.0%) |
| Total | 744 (100.0%) | 384 (100.0%) |
Housing Occupancy in Wyldwood
Occupancy by Ownership in Wyldwood
Of the total 1,271 dwellings in Wyldwood, owner-occupied units account for 981 (77.2%), while renter-occupied units make up 290 (22.8%).
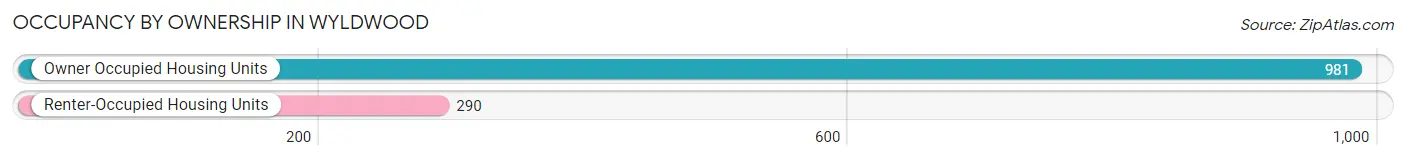
| Occupancy | # Housing Units | % Housing Units |
| Owner Occupied Housing Units | 981 | 77.2% |
| Renter-Occupied Housing Units | 290 | 22.8% |
| Total Occupied Housing Units | 1,271 | 100.0% |
Occupancy by Household Size in Wyldwood
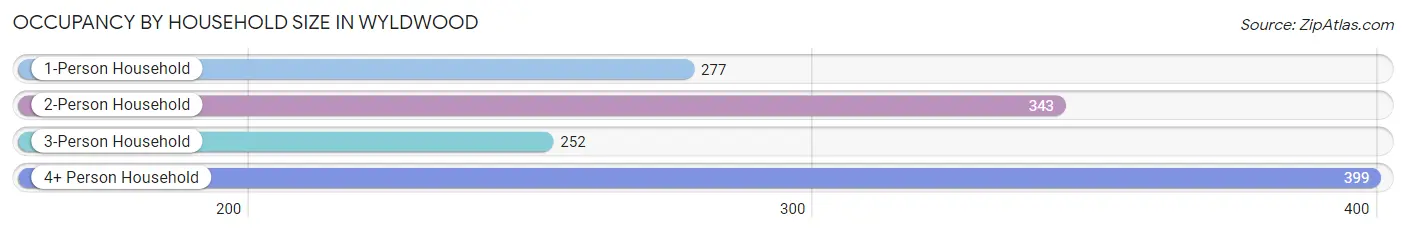
| Household Size | # Housing Units | % Housing Units |
| 1-Person Household | 277 | 21.8% |
| 2-Person Household | 343 | 27.0% |
| 3-Person Household | 252 | 19.8% |
| 4+ Person Household | 399 | 31.4% |
| Total Housing Units | 1,271 | 100.0% |
Occupancy by Ownership by Household Size in Wyldwood
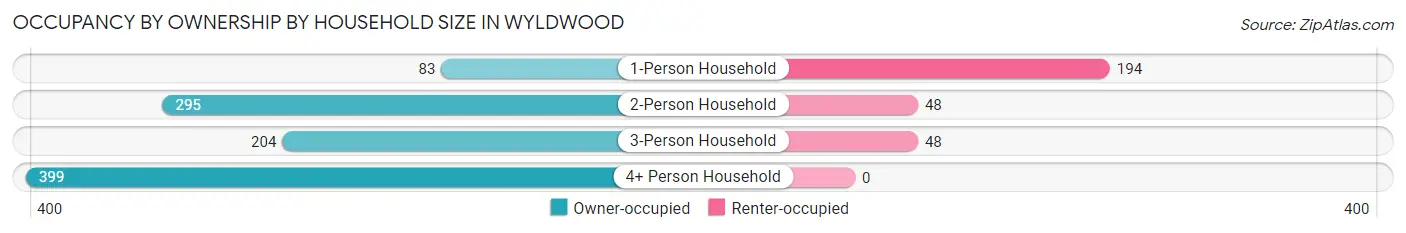
| Household Size | Owner-occupied | Renter-occupied |
| 1-Person Household | 83 (30.0%) | 194 (70.0%) |
| 2-Person Household | 295 (86.0%) | 48 (14.0%) |
| 3-Person Household | 204 (80.9%) | 48 (19.1%) |
| 4+ Person Household | 399 (100.0%) | 0 (0.0%) |
| Total Housing Units | 981 (77.2%) | 290 (22.8%) |
Occupancy by Educational Attainment in Wyldwood
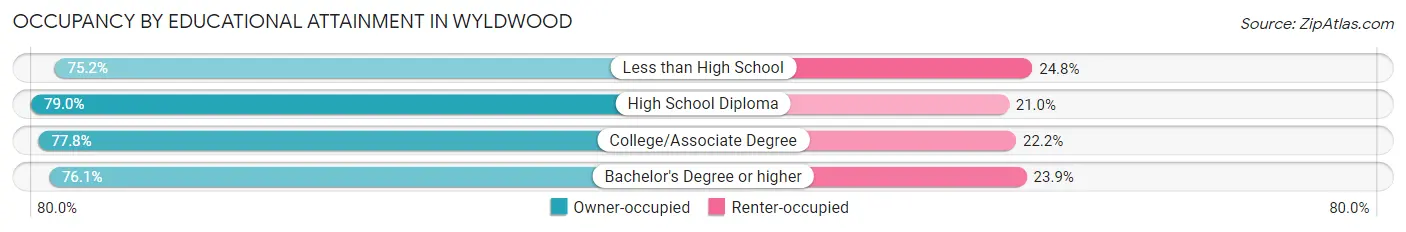
| Household Size | Owner-occupied | Renter-occupied |
| Less than High School | 246 (75.2%) | 81 (24.8%) |
| High School Diploma | 289 (79.0%) | 77 (21.0%) |
| College/Associate Degree | 277 (77.8%) | 79 (22.2%) |
| Bachelor's Degree or higher | 169 (76.1%) | 53 (23.9%) |
Occupancy by Age of Householder in Wyldwood
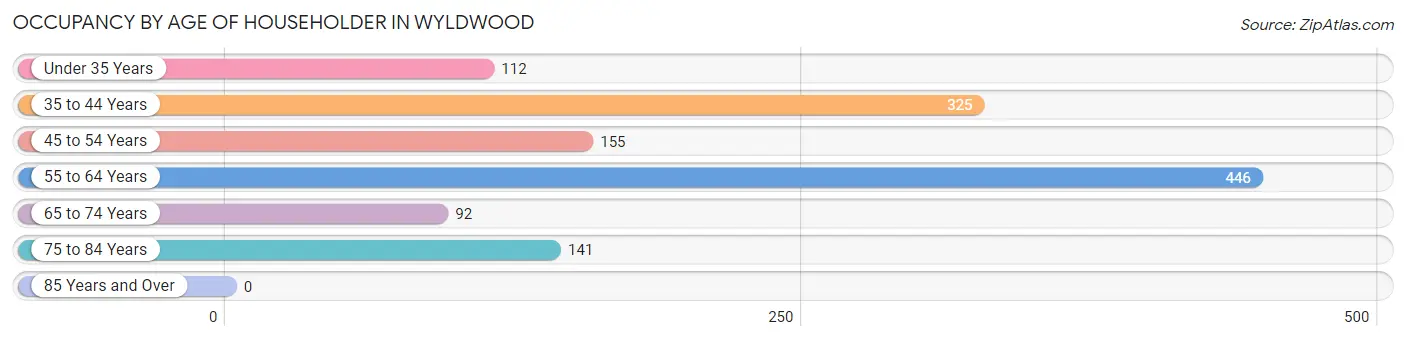
| Age Bracket | # Households | % Households |
| Under 35 Years | 112 | 8.8% |
| 35 to 44 Years | 325 | 25.6% |
| 45 to 54 Years | 155 | 12.2% |
| 55 to 64 Years | 446 | 35.1% |
| 65 to 74 Years | 92 | 7.2% |
| 75 to 84 Years | 141 | 11.1% |
| 85 Years and Over | 0 | 0.0% |
| Total | 1,271 | 100.0% |
Housing Finances in Wyldwood
Median Income by Occupancy in Wyldwood
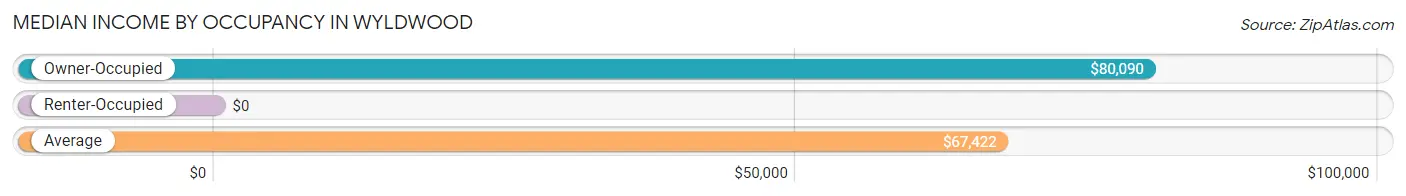
| Occupancy Type | # Households | Median Income |
| Owner-Occupied | 981 (77.2%) | $80,090 |
| Renter-Occupied | 290 (22.8%) | $0 |
| Average | 1,271 (100.0%) | $67,422 |
Occupancy by Householder Income Bracket in Wyldwood
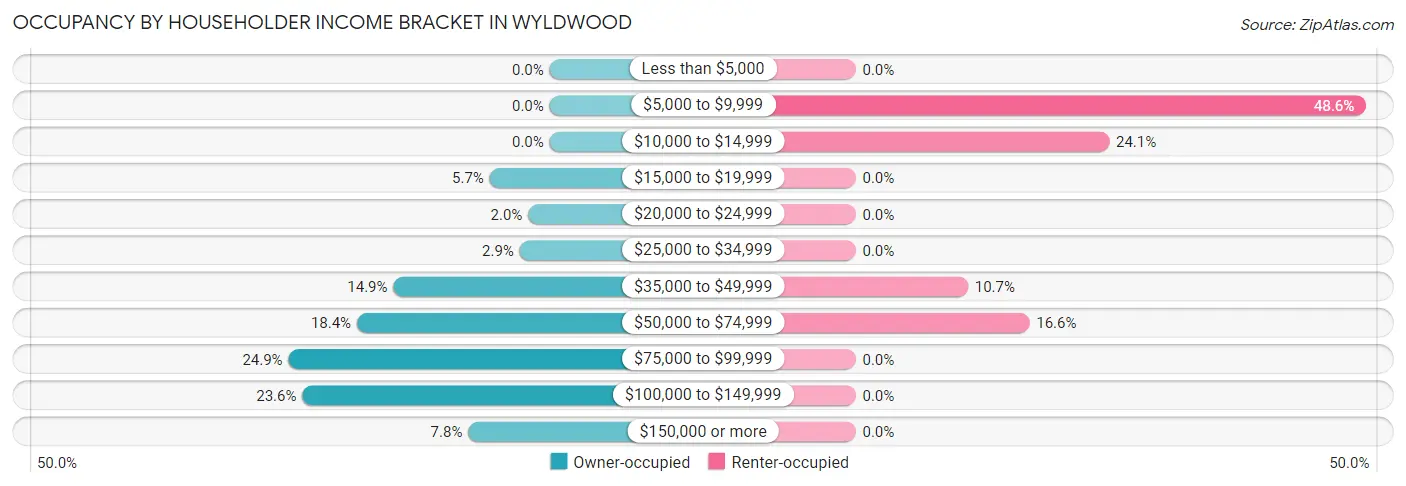
| Income Bracket | Owner-occupied | Renter-occupied |
| Less than $5,000 | 0 (0.0%) | 0 (0.0%) |
| $5,000 to $9,999 | 0 (0.0%) | 141 (48.6%) |
| $10,000 to $14,999 | 0 (0.0%) | 70 (24.1%) |
| $15,000 to $19,999 | 56 (5.7%) | 0 (0.0%) |
| $20,000 to $24,999 | 20 (2.0%) | 0 (0.0%) |
| $25,000 to $34,999 | 28 (2.9%) | 0 (0.0%) |
| $35,000 to $49,999 | 146 (14.9%) | 31 (10.7%) |
| $50,000 to $74,999 | 180 (18.3%) | 48 (16.6%) |
| $75,000 to $99,999 | 244 (24.9%) | 0 (0.0%) |
| $100,000 to $149,999 | 231 (23.5%) | 0 (0.0%) |
| $150,000 or more | 76 (7.7%) | 0 (0.0%) |
| Total | 981 (100.0%) | 290 (100.0%) |
Monthly Housing Cost Tiers in Wyldwood
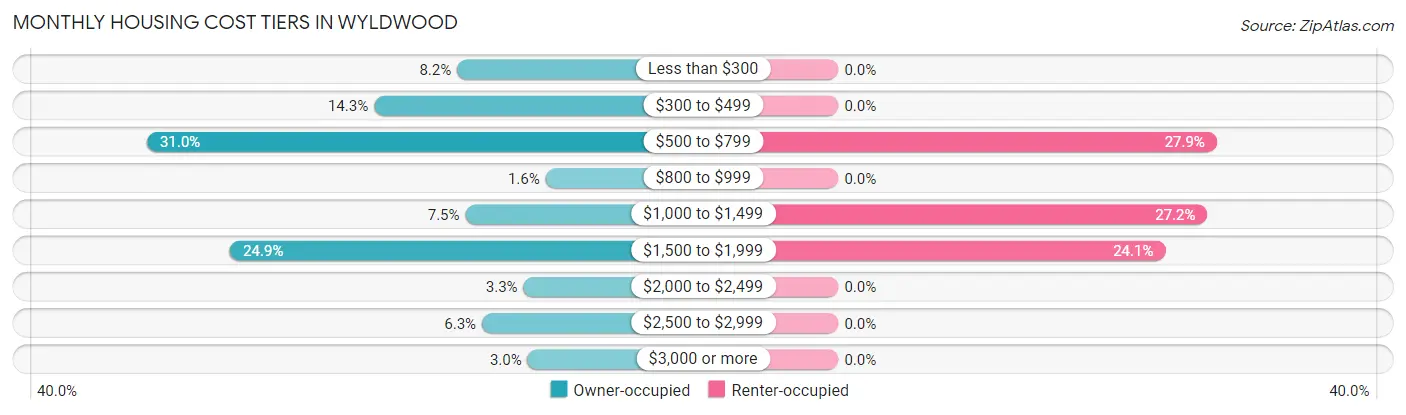
| Monthly Cost | Owner-occupied | Renter-occupied |
| Less than $300 | 80 (8.2%) | 0 (0.0%) |
| $300 to $499 | 140 (14.3%) | 0 (0.0%) |
| $500 to $799 | 304 (31.0%) | 81 (27.9%) |
| $800 to $999 | 16 (1.6%) | 0 (0.0%) |
| $1,000 to $1,499 | 74 (7.5%) | 79 (27.2%) |
| $1,500 to $1,999 | 244 (24.9%) | 70 (24.1%) |
| $2,000 to $2,499 | 32 (3.3%) | 0 (0.0%) |
| $2,500 to $2,999 | 62 (6.3%) | 0 (0.0%) |
| $3,000 or more | 29 (3.0%) | 0 (0.0%) |
| Total | 981 (100.0%) | 290 (100.0%) |
Physical Housing Characteristics in Wyldwood
Housing Structures in Wyldwood
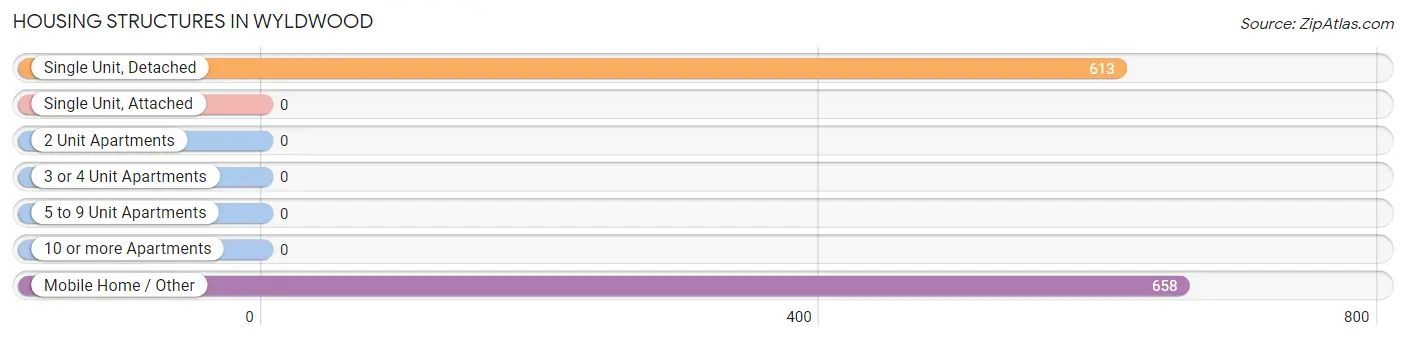
| Structure Type | # Housing Units | % Housing Units |
| Single Unit, Detached | 613 | 48.2% |
| Single Unit, Attached | 0 | 0.0% |
| 2 Unit Apartments | 0 | 0.0% |
| 3 or 4 Unit Apartments | 0 | 0.0% |
| 5 to 9 Unit Apartments | 0 | 0.0% |
| 10 or more Apartments | 0 | 0.0% |
| Mobile Home / Other | 658 | 51.8% |
| Total | 1,271 | 100.0% |
Housing Structures by Occupancy in Wyldwood
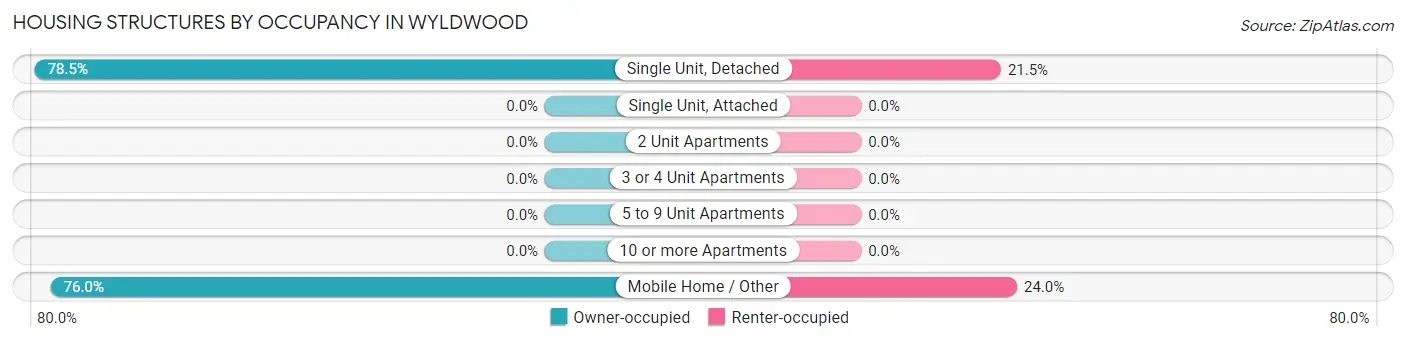
| Structure Type | Owner-occupied | Renter-occupied |
| Single Unit, Detached | 481 (78.5%) | 132 (21.5%) |
| Single Unit, Attached | 0 (0.0%) | 0 (0.0%) |
| 2 Unit Apartments | 0 (0.0%) | 0 (0.0%) |
| 3 or 4 Unit Apartments | 0 (0.0%) | 0 (0.0%) |
| 5 to 9 Unit Apartments | 0 (0.0%) | 0 (0.0%) |
| 10 or more Apartments | 0 (0.0%) | 0 (0.0%) |
| Mobile Home / Other | 500 (76.0%) | 158 (24.0%) |
| Total | 981 (77.2%) | 290 (22.8%) |
Housing Structures by Number of Rooms in Wyldwood
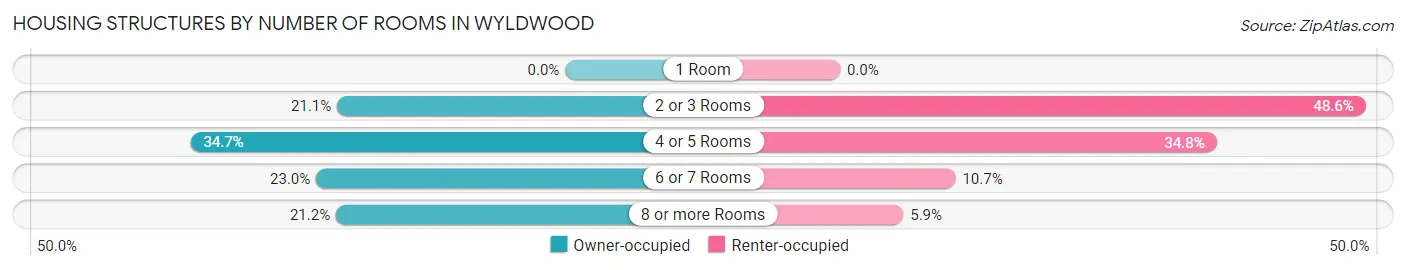
| Number of Rooms | Owner-occupied | Renter-occupied |
| 1 Room | 0 (0.0%) | 0 (0.0%) |
| 2 or 3 Rooms | 207 (21.1%) | 141 (48.6%) |
| 4 or 5 Rooms | 340 (34.7%) | 101 (34.8%) |
| 6 or 7 Rooms | 226 (23.0%) | 31 (10.7%) |
| 8 or more Rooms | 208 (21.2%) | 17 (5.9%) |
| Total | 981 (100.0%) | 290 (100.0%) |
Housing Structure by Heating Type in Wyldwood
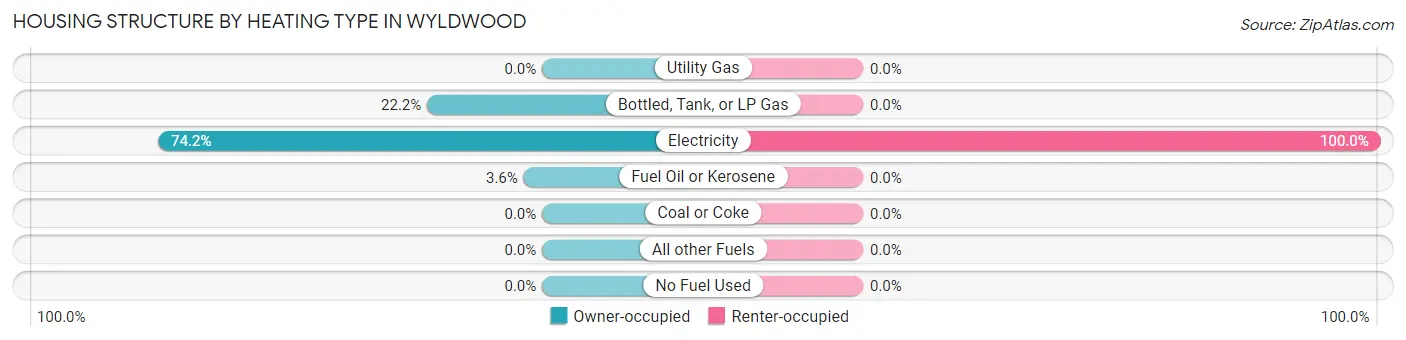
| Heating Type | Owner-occupied | Renter-occupied |
| Utility Gas | 0 (0.0%) | 0 (0.0%) |
| Bottled, Tank, or LP Gas | 218 (22.2%) | 0 (0.0%) |
| Electricity | 728 (74.2%) | 290 (100.0%) |
| Fuel Oil or Kerosene | 35 (3.6%) | 0 (0.0%) |
| Coal or Coke | 0 (0.0%) | 0 (0.0%) |
| All other Fuels | 0 (0.0%) | 0 (0.0%) |
| No Fuel Used | 0 (0.0%) | 0 (0.0%) |
| Total | 981 (100.0%) | 290 (100.0%) |
Household Vehicle Usage in Wyldwood
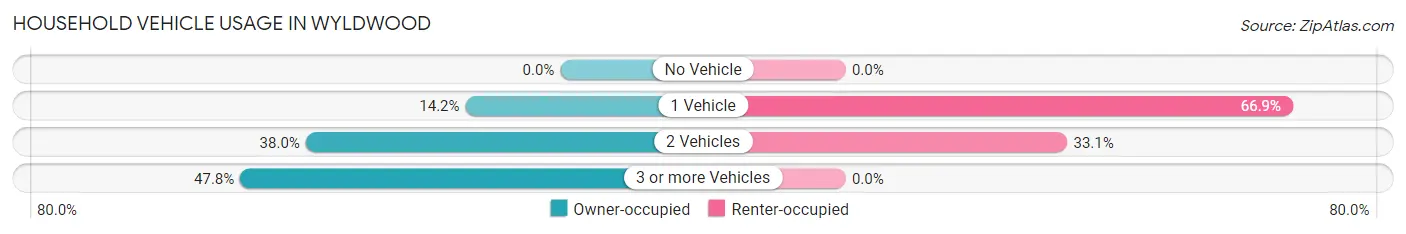
| Vehicles per Household | Owner-occupied | Renter-occupied |
| No Vehicle | 0 (0.0%) | 0 (0.0%) |
| 1 Vehicle | 139 (14.2%) | 194 (66.9%) |
| 2 Vehicles | 373 (38.0%) | 96 (33.1%) |
| 3 or more Vehicles | 469 (47.8%) | 0 (0.0%) |
| Total | 981 (100.0%) | 290 (100.0%) |
Real Estate & Mortgages in Wyldwood
Real Estate and Mortgage Overview in Wyldwood
| Characteristic | Without Mortgage | With Mortgage |
| Housing Units | 566 | 415 |
| Median Property Value | $162,400 | $132,600 |
| Median Household Income | $68,029 | $29 |
| Monthly Housing Costs | $546 | $29 |
| Real Estate Taxes | $3,244 | $9 |
Property Value by Mortgage Status in Wyldwood
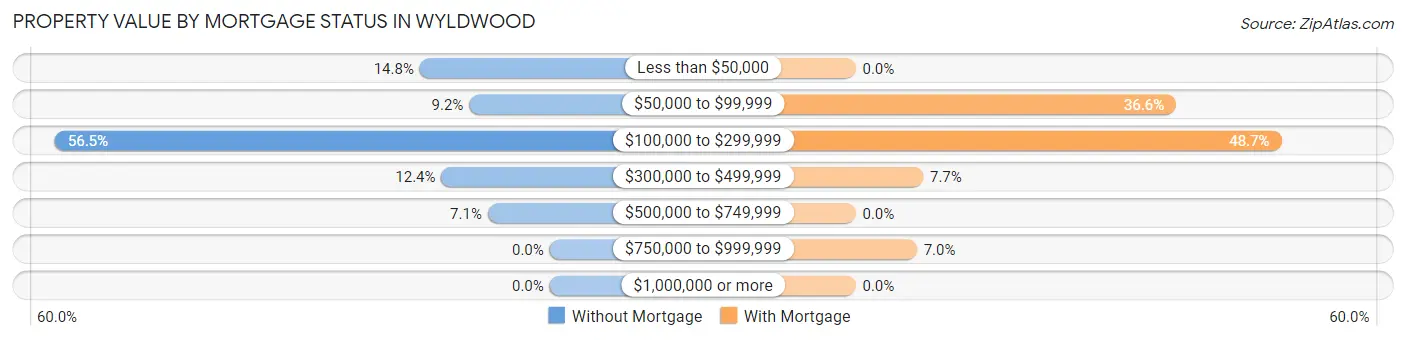
| Property Value | Without Mortgage | With Mortgage |
| Less than $50,000 | 84 (14.8%) | 0 (0.0%) |
| $50,000 to $99,999 | 52 (9.2%) | 152 (36.6%) |
| $100,000 to $299,999 | 320 (56.5%) | 202 (48.7%) |
| $300,000 to $499,999 | 70 (12.4%) | 32 (7.7%) |
| $500,000 to $749,999 | 40 (7.1%) | 0 (0.0%) |
| $750,000 to $999,999 | 0 (0.0%) | 29 (7.0%) |
| $1,000,000 or more | 0 (0.0%) | 0 (0.0%) |
| Total | 566 (100.0%) | 415 (100.0%) |
Household Income by Mortgage Status in Wyldwood
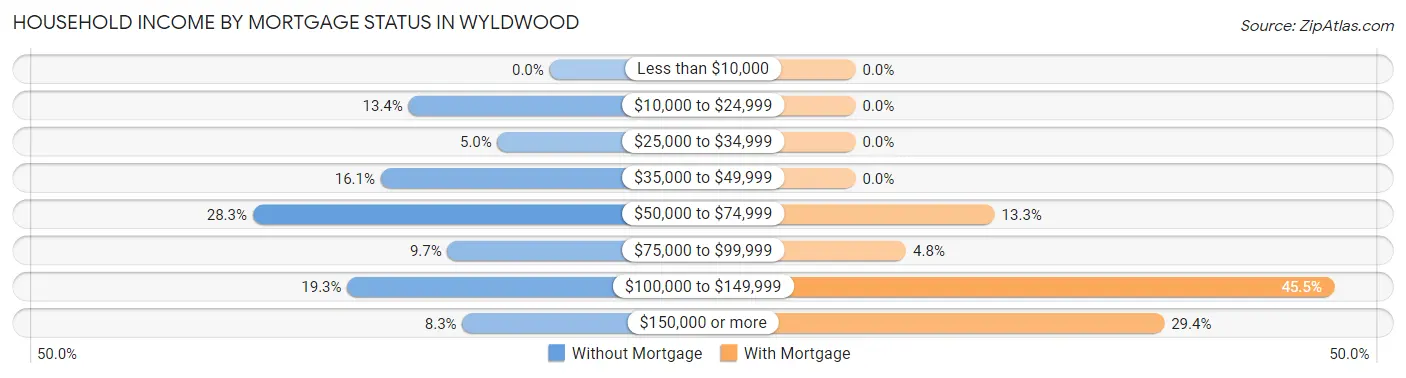
| Household Income | Without Mortgage | With Mortgage |
| Less than $10,000 | 0 (0.0%) | 0 (0.0%) |
| $10,000 to $24,999 | 76 (13.4%) | 0 (0.0%) |
| $25,000 to $34,999 | 28 (5.0%) | 0 (0.0%) |
| $35,000 to $49,999 | 91 (16.1%) | 0 (0.0%) |
| $50,000 to $74,999 | 160 (28.3%) | 55 (13.3%) |
| $75,000 to $99,999 | 55 (9.7%) | 20 (4.8%) |
| $100,000 to $149,999 | 109 (19.3%) | 189 (45.5%) |
| $150,000 or more | 47 (8.3%) | 122 (29.4%) |
| Total | 566 (100.0%) | 415 (100.0%) |
Property Value to Household Income Ratio in Wyldwood
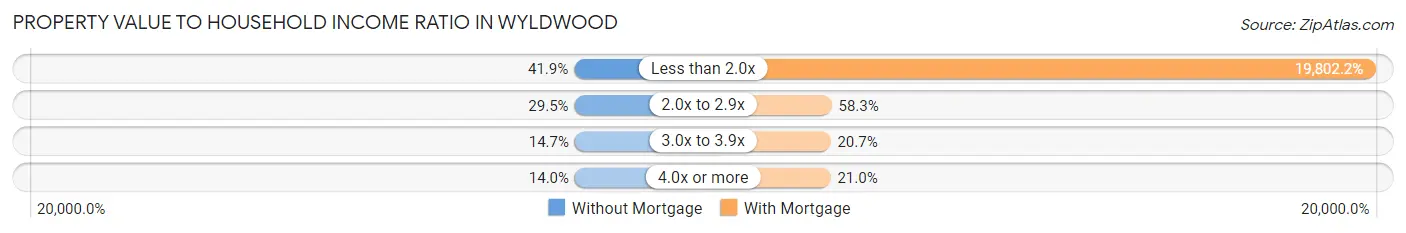
| Value-to-Income Ratio | Without Mortgage | With Mortgage |
| Less than 2.0x | 237 (41.9%) | 82,179 (19,802.2%) |
| 2.0x to 2.9x | 167 (29.5%) | 242 (58.3%) |
| 3.0x to 3.9x | 83 (14.7%) | 86 (20.7%) |
| 4.0x or more | 79 (14.0%) | 87 (21.0%) |
| Total | 566 (100.0%) | 415 (100.0%) |
Real Estate Taxes by Mortgage Status in Wyldwood
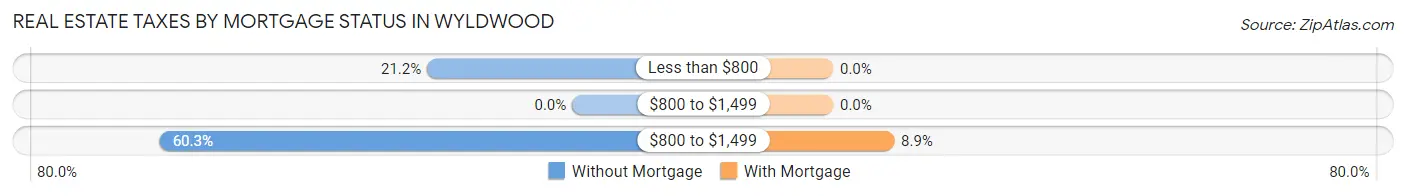
| Property Taxes | Without Mortgage | With Mortgage |
| Less than $800 | 120 (21.2%) | 0 (0.0%) |
| $800 to $1,499 | 0 (0.0%) | 0 (0.0%) |
| $800 to $1,499 | 341 (60.3%) | 37 (8.9%) |
| Total | 566 (100.0%) | 415 (100.0%) |
Health & Disability in Wyldwood
Health Insurance Coverage by Age in Wyldwood
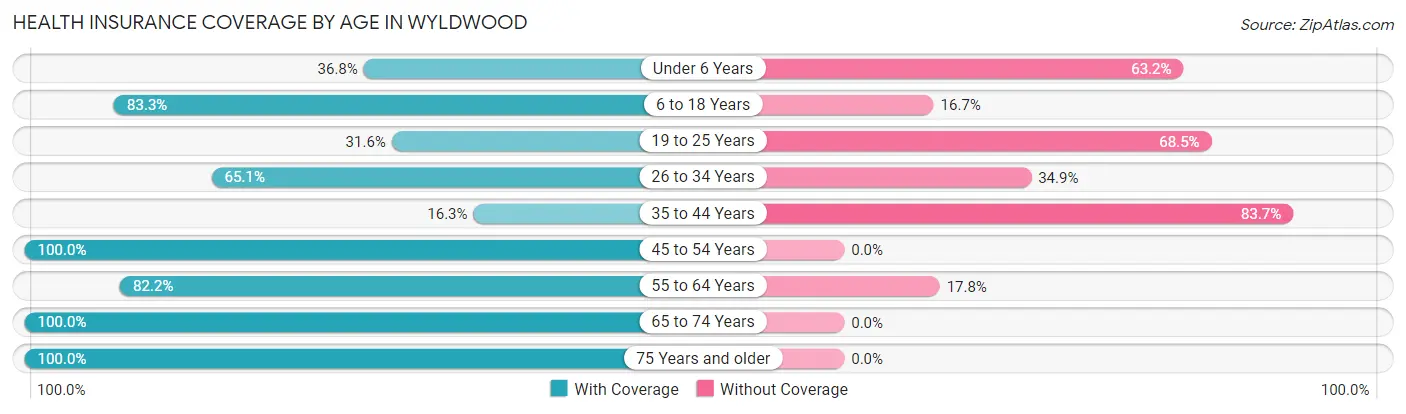
| Age Bracket | With Coverage | Without Coverage |
| Under 6 Years | 32 (36.8%) | 55 (63.2%) |
| 6 to 18 Years | 1,191 (83.3%) | 238 (16.7%) |
| 19 to 25 Years | 112 (31.6%) | 243 (68.4%) |
| 26 to 34 Years | 142 (65.1%) | 76 (34.9%) |
| 35 to 44 Years | 138 (16.3%) | 708 (83.7%) |
| 45 to 54 Years | 340 (100.0%) | 0 (0.0%) |
| 55 to 64 Years | 633 (82.2%) | 137 (17.8%) |
| 65 to 74 Years | 159 (100.0%) | 0 (0.0%) |
| 75 Years and older | 164 (100.0%) | 0 (0.0%) |
| Total | 2,911 (66.6%) | 1,457 (33.4%) |
Health Insurance Coverage by Citizenship Status in Wyldwood
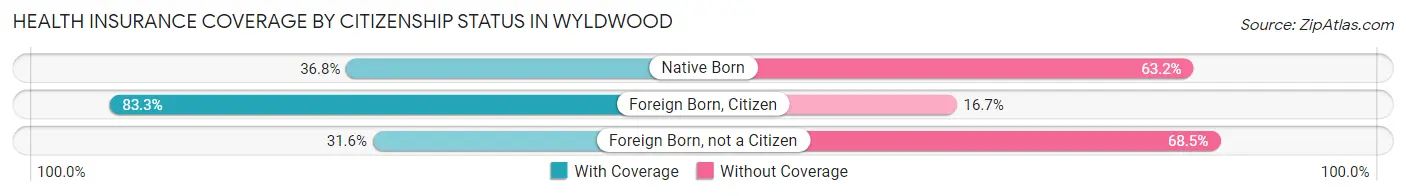
| Citizenship Status | With Coverage | Without Coverage |
| Native Born | 32 (36.8%) | 55 (63.2%) |
| Foreign Born, Citizen | 1,191 (83.3%) | 238 (16.7%) |
| Foreign Born, not a Citizen | 112 (31.6%) | 243 (68.4%) |
Health Insurance Coverage by Household Income in Wyldwood
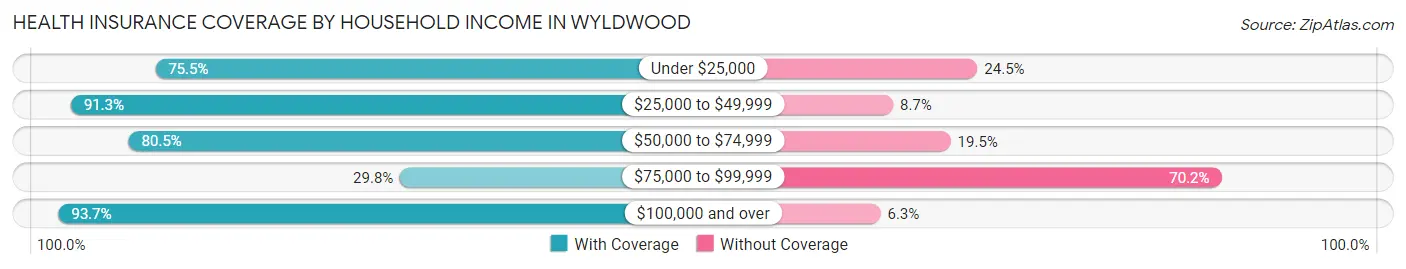
| Household Income | With Coverage | Without Coverage |
| Under $25,000 | 358 (75.5%) | 116 (24.5%) |
| $25,000 to $49,999 | 401 (91.3%) | 38 (8.7%) |
| $50,000 to $74,999 | 770 (80.5%) | 186 (19.5%) |
| $75,000 to $99,999 | 448 (29.8%) | 1,054 (70.2%) |
| $100,000 and over | 934 (93.7%) | 63 (6.3%) |
Public vs Private Health Insurance Coverage by Age in Wyldwood
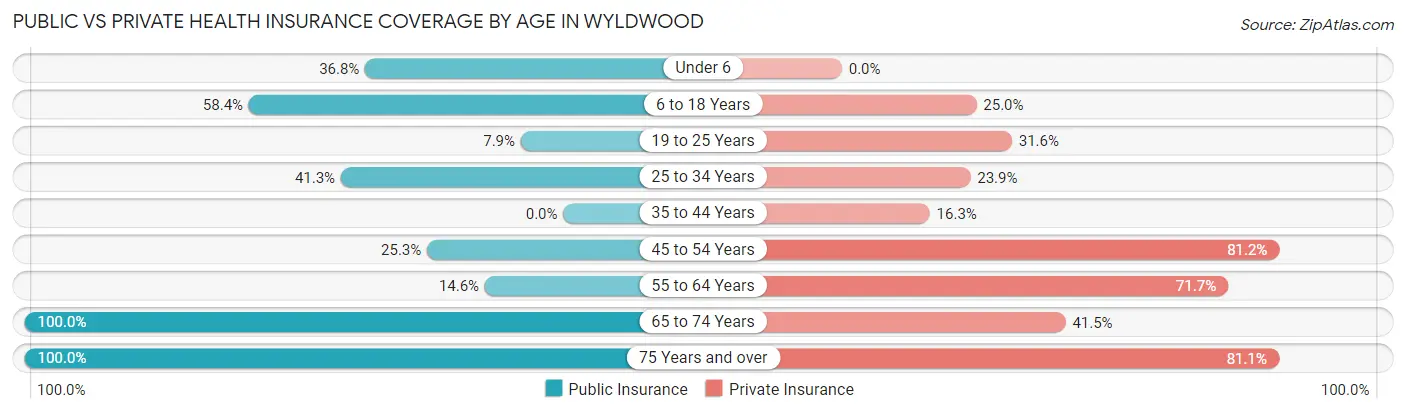
| Age Bracket | Public Insurance | Private Insurance |
| Under 6 | 32 (36.8%) | 0 (0.0%) |
| 6 to 18 Years | 834 (58.4%) | 357 (25.0%) |
| 19 to 25 Years | 28 (7.9%) | 112 (31.6%) |
| 25 to 34 Years | 90 (41.3%) | 52 (23.8%) |
| 35 to 44 Years | 0 (0.0%) | 138 (16.3%) |
| 45 to 54 Years | 86 (25.3%) | 276 (81.2%) |
| 55 to 64 Years | 112 (14.5%) | 552 (71.7%) |
| 65 to 74 Years | 159 (100.0%) | 66 (41.5%) |
| 75 Years and over | 164 (100.0%) | 133 (81.1%) |
| Total | 1,505 (34.5%) | 1,686 (38.6%) |
Disability Status by Sex by Age in Wyldwood
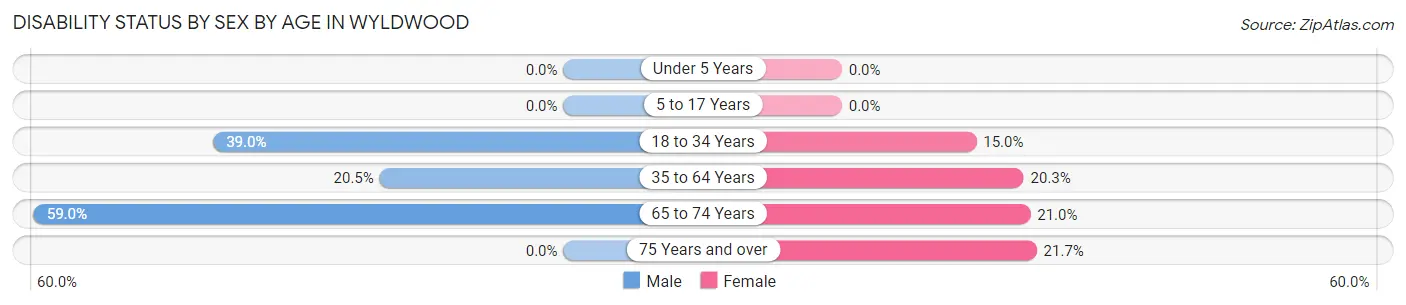
| Age Bracket | Male | Female |
| Under 5 Years | 0 (0.0%) | 0 (0.0%) |
| 5 to 17 Years | 0 (0.0%) | 0 (0.0%) |
| 18 to 34 Years | 62 (39.0%) | 62 (15.0%) |
| 35 to 64 Years | 188 (20.5%) | 210 (20.3%) |
| 65 to 74 Years | 46 (59.0%) | 17 (21.0%) |
| 75 Years and over | 0 (0.0%) | 23 (21.7%) |
Disability Class by Sex by Age in Wyldwood
Disability Class: Hearing Difficulty
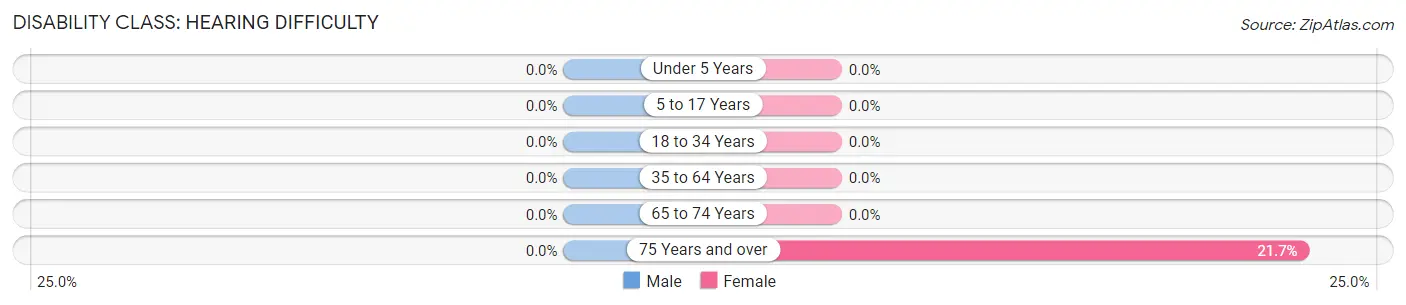
| Age Bracket | Male | Female |
| Under 5 Years | 0 (0.0%) | 0 (0.0%) |
| 5 to 17 Years | 0 (0.0%) | 0 (0.0%) |
| 18 to 34 Years | 0 (0.0%) | 0 (0.0%) |
| 35 to 64 Years | 0 (0.0%) | 0 (0.0%) |
| 65 to 74 Years | 0 (0.0%) | 0 (0.0%) |
| 75 Years and over | 0 (0.0%) | 23 (21.7%) |
Disability Class: Vision Difficulty
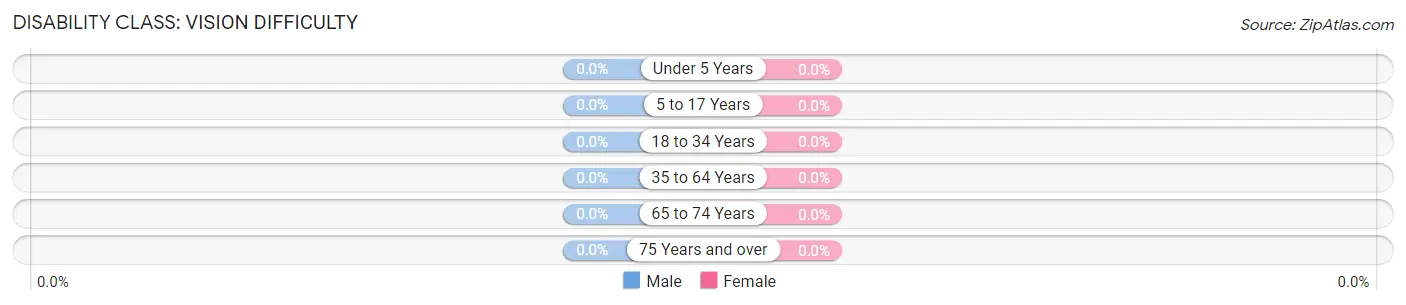
| Age Bracket | Male | Female |
| Under 5 Years | 0 (0.0%) | 0 (0.0%) |
| 5 to 17 Years | 0 (0.0%) | 0 (0.0%) |
| 18 to 34 Years | 0 (0.0%) | 0 (0.0%) |
| 35 to 64 Years | 0 (0.0%) | 0 (0.0%) |
| 65 to 74 Years | 0 (0.0%) | 0 (0.0%) |
| 75 Years and over | 0 (0.0%) | 0 (0.0%) |
Disability Class: Cognitive Difficulty
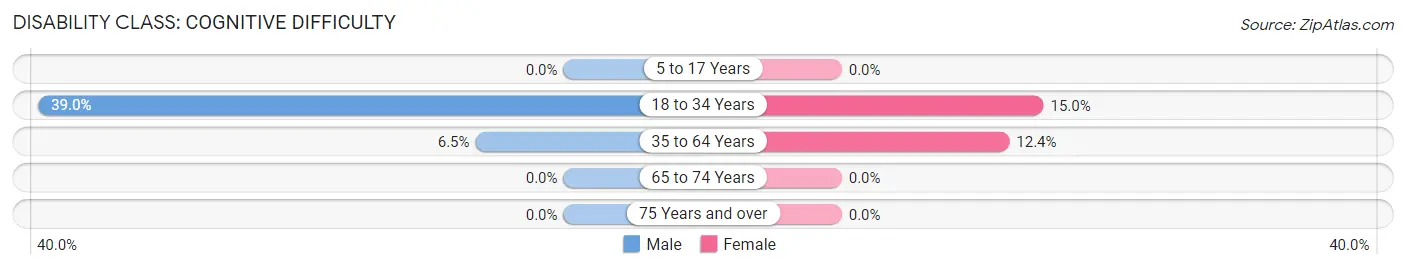
| Age Bracket | Male | Female |
| 5 to 17 Years | 0 (0.0%) | 0 (0.0%) |
| 18 to 34 Years | 62 (39.0%) | 62 (15.0%) |
| 35 to 64 Years | 60 (6.5%) | 129 (12.4%) |
| 65 to 74 Years | 0 (0.0%) | 0 (0.0%) |
| 75 Years and over | 0 (0.0%) | 0 (0.0%) |
Disability Class: Ambulatory Difficulty
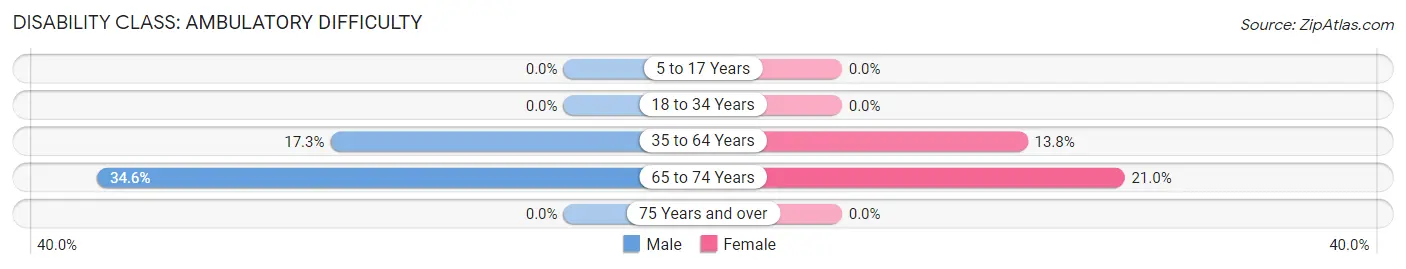
| Age Bracket | Male | Female |
| 5 to 17 Years | 0 (0.0%) | 0 (0.0%) |
| 18 to 34 Years | 0 (0.0%) | 0 (0.0%) |
| 35 to 64 Years | 159 (17.3%) | 143 (13.8%) |
| 65 to 74 Years | 27 (34.6%) | 17 (21.0%) |
| 75 Years and over | 0 (0.0%) | 0 (0.0%) |
Disability Class: Self-Care Difficulty
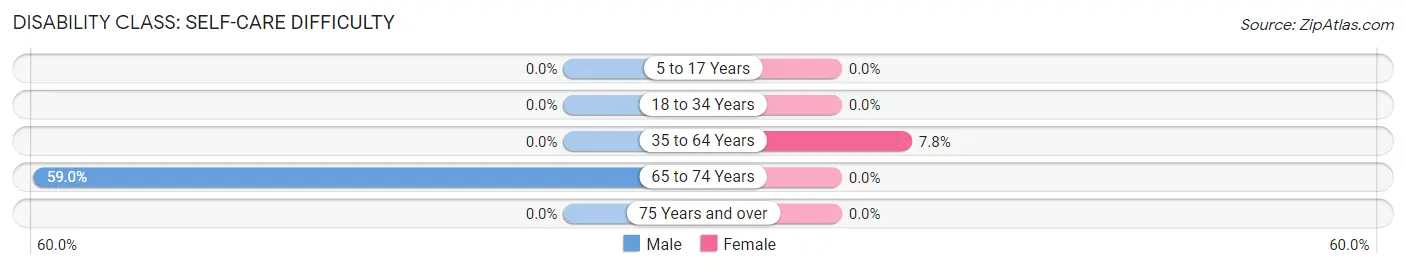
| Age Bracket | Male | Female |
| 5 to 17 Years | 0 (0.0%) | 0 (0.0%) |
| 18 to 34 Years | 0 (0.0%) | 0 (0.0%) |
| 35 to 64 Years | 0 (0.0%) | 81 (7.8%) |
| 65 to 74 Years | 46 (59.0%) | 0 (0.0%) |
| 75 Years and over | 0 (0.0%) | 0 (0.0%) |
Technology Access in Wyldwood
Computing Device Access in Wyldwood
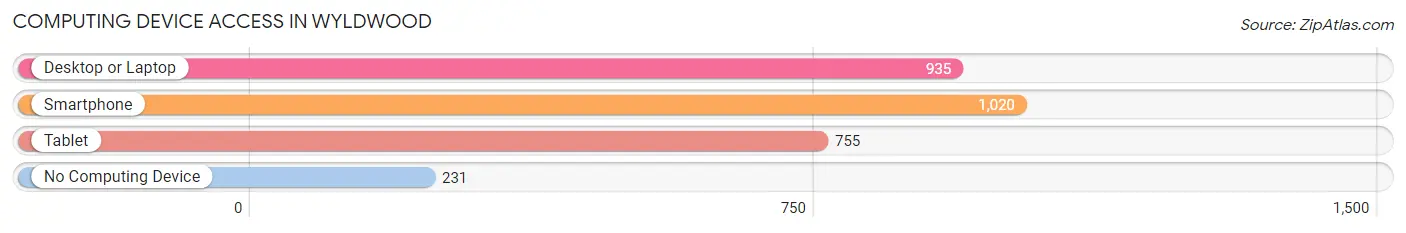
| Device Type | # Households | % Households |
| Desktop or Laptop | 935 | 73.6% |
| Smartphone | 1,020 | 80.2% |
| Tablet | 755 | 59.4% |
| No Computing Device | 231 | 18.2% |
| Total | 1,271 | 100.0% |
Internet Access in Wyldwood
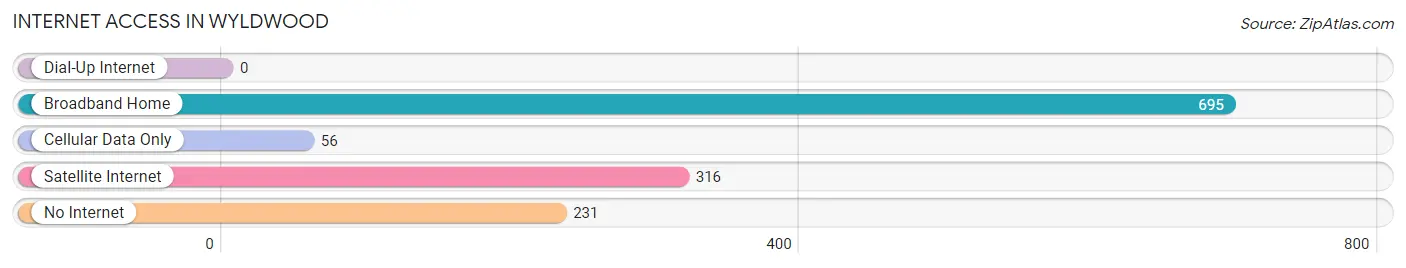
| Internet Type | # Households | % Households |
| Dial-Up Internet | 0 | 0.0% |
| Broadband Home | 695 | 54.7% |
| Cellular Data Only | 56 | 4.4% |
| Satellite Internet | 316 | 24.9% |
| No Internet | 231 | 18.2% |
| Total | 1,271 | 100.0% |
Wyldwood Summary
Wyldwood is a small unincorporated community located in Bastrop County, Texas, United States. It is situated about 25 miles southeast of Austin and is part of the Austin–Round Rock–San Marcos metropolitan area. The population of Wyldwood was estimated to be 1,845 in 2019.
History
The area that is now Wyldwood was first settled in the late 1800s by German immigrants. The town was originally known as “Wyldwood” after the wildwood trees that grew in the area. The first post office was established in 1891 and the town was officially incorporated in 1895.
The town grew slowly but steadily over the years, and by the mid-1900s, it had become a thriving community. The town was home to several businesses, including a general store, a blacksmith shop, a cotton gin, and a sawmill.
Geography
Wyldwood is located in Bastrop County, Texas, about 25 miles southeast of Austin. It is situated in the rolling hills of the Texas Hill Country, and is surrounded by lush green pastures and wooded areas. The town is located on the banks of the Colorado River, which provides a scenic backdrop for the town.
The climate in Wyldwood is generally mild, with hot summers and cool winters. The average annual temperature is around 70 degrees Fahrenheit, and the average annual precipitation is around 35 inches.
Economy
The economy of Wyldwood is largely based on agriculture and tourism. The town is home to several farms and ranches, which produce a variety of crops, including cotton, corn, and hay. The town is also home to several wineries, which attract tourists from all over the state.
In addition to agriculture and tourism, Wyldwood is home to several small businesses, including restaurants, shops, and services. The town is also home to a few manufacturing companies, which produce a variety of products, including furniture and clothing.
Demographics
As of 2019, the population of Wyldwood was estimated to be 1,845. The population is predominantly white (90.3%), with a small Hispanic population (7.2%). The median household income in Wyldwood is $50,000, and the median home value is $150,000.
The town is served by the Bastrop Independent School District, which includes two elementary schools, one middle school, and one high school. The town is also home to several churches, including the Wyldwood United Methodist Church and the Wyldwood Baptist Church.
Conclusion
Wyldwood is a small unincorporated community located in Bastrop County, Texas. It is situated about 25 miles southeast of Austin and is part of the Austin–Round Rock–San Marcos metropolitan area. The town has a rich history, and its economy is largely based on agriculture and tourism. The population of Wyldwood is predominantly white, with a small Hispanic population. The town is served by the Bastrop Independent School District, and is home to several churches.
Common Questions
What is Per Capita Income in Wyldwood?
Per Capita income in Wyldwood is $22,005.
What is the Median Family Income in Wyldwood?
Median Family Income in Wyldwood is $80,214.
What is the Median Household income in Wyldwood?
Median Household Income in Wyldwood is $67,422.
What is Income or Wage Gap in Wyldwood?
Income or Wage Gap in Wyldwood is 39.3%.
Women in Wyldwood earn 60.7 cents for every dollar earned by a man.
What is Family Income Deficit in Wyldwood?
Family Income Deficit in Wyldwood is $6,736.
Families that are below poverty line in Wyldwood earn $6,736 less on average than the poverty threshold level.
What is Inequality or Gini Index in Wyldwood?
Inequality or Gini Index in Wyldwood is 0.43.
What is the Total Population of Wyldwood?
Total Population of Wyldwood is 4,368.
What is the Total Male Population of Wyldwood?
Total Male Population of Wyldwood is 2,209.
What is the Total Female Population of Wyldwood?
Total Female Population of Wyldwood is 2,159.
What is the Ratio of Males per 100 Females in Wyldwood?
There are 102.32 Males per 100 Females in Wyldwood.
What is the Ratio of Females per 100 Males in Wyldwood?
There are 97.74 Females per 100 Males in Wyldwood.
What is the Median Population Age in Wyldwood?
Median Population Age in Wyldwood is 37.3 Years.
What is the Average Family Size in Wyldwood
Average Family Size in Wyldwood is 4.2 People.
What is the Average Household Size in Wyldwood
Average Household Size in Wyldwood is 3.4 People.
How Large is the Labor Force in Wyldwood?
There are 1,328 People in the Labor Forcein in Wyldwood.
What is the Percentage of People in the Labor Force in Wyldwood?
40.7% of People are in the Labor Force in Wyldwood.
What is the Unemployment Rate in Wyldwood?
Unemployment Rate in Wyldwood is 3.1%.