Alpha, MN Map & Demographics
Alpha Map
Alpha Overview
$80,502
PER CAPITA INCOME
$81,250
AVG FAMILY INCOME
$135,638
AVG HOUSEHOLD INCOME
30.5%
WAGE / INCOME GAP [ % ]
69.5¢/ $1
WAGE / INCOME GAP [ $ ]
0.18
INEQUALITY / GINI INDEX
114
TOTAL POPULATION
34
MALE POPULATION
80
FEMALE POPULATION
42.50
MALES / 100 FEMALES
235.29
FEMALES / 100 MALES
60.2
MEDIAN AGE
2.8
AVG FAMILY SIZE
1.4
AVG HOUSEHOLD SIZE
92
LABOR FORCE [ PEOPLE ]
85.2%
PERCENT IN LABOR FORCE
Alpha Zip Codes
Alpha Area Codes
Income in Alpha
Income Overview in Alpha
Per Capita Income in Alpha is $80,502, while median incomes of families and households are $81,250 and $135,638 respectively.
| Characteristic | Number | Measure |
| Per Capita Income | 114 | $80,502 |
| Median Family Income | 20 | $81,250 |
| Mean Family Income | 20 | $94,680 |
| Median Household Income | 79 | $135,638 |
| Mean Household Income | 79 | $112,504 |
| Income Deficit | 20 | $0 |
| Wage / Income Gap (%) | 114 | 30.47% |
| Wage / Income Gap ($) | 114 | 69.53¢ per $1 |
| Gini / Inequality Index | 114 | 0.18 |
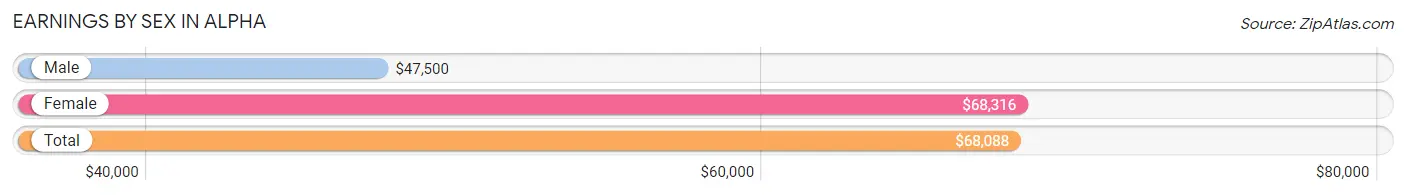
Earnings by Sex in Alpha
Average Earnings in Alpha are $68,088, $47,500 for men and $68,316 for women, a difference of 30.5%.
| Sex | Number | Average Earnings |
| Male | 26 (27.1%) | $47,500 |
| Female | 70 (72.9%) | $68,316 |
| Total | 96 (100.0%) | $68,088 |
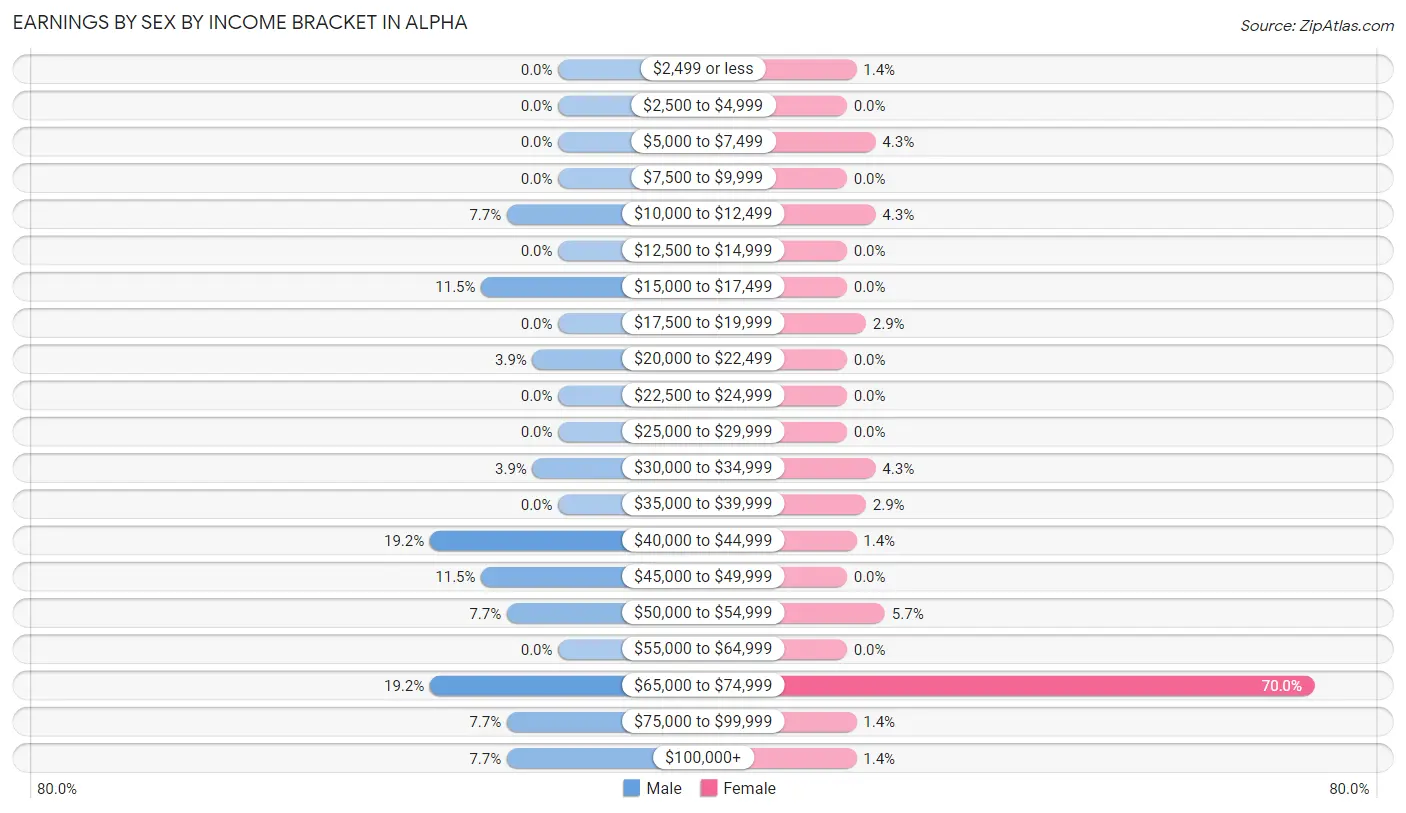
Earnings by Sex by Income Bracket in Alpha
The most common earnings brackets in Alpha are $40,000 to $44,999 for men (5 | 19.2%) and $65,000 to $74,999 for women (49 | 70.0%).
| Income | Male | Female |
| $2,499 or less | 0 (0.0%) | 1 (1.4%) |
| $2,500 to $4,999 | 0 (0.0%) | 0 (0.0%) |
| $5,000 to $7,499 | 0 (0.0%) | 3 (4.3%) |
| $7,500 to $9,999 | 0 (0.0%) | 0 (0.0%) |
| $10,000 to $12,499 | 2 (7.7%) | 3 (4.3%) |
| $12,500 to $14,999 | 0 (0.0%) | 0 (0.0%) |
| $15,000 to $17,499 | 3 (11.5%) | 0 (0.0%) |
| $17,500 to $19,999 | 0 (0.0%) | 2 (2.9%) |
| $20,000 to $22,499 | 1 (3.8%) | 0 (0.0%) |
| $22,500 to $24,999 | 0 (0.0%) | 0 (0.0%) |
| $25,000 to $29,999 | 0 (0.0%) | 0 (0.0%) |
| $30,000 to $34,999 | 1 (3.8%) | 3 (4.3%) |
| $35,000 to $39,999 | 0 (0.0%) | 2 (2.9%) |
| $40,000 to $44,999 | 5 (19.2%) | 1 (1.4%) |
| $45,000 to $49,999 | 3 (11.5%) | 0 (0.0%) |
| $50,000 to $54,999 | 2 (7.7%) | 4 (5.7%) |
| $55,000 to $64,999 | 0 (0.0%) | 0 (0.0%) |
| $65,000 to $74,999 | 5 (19.2%) | 49 (70.0%) |
| $75,000 to $99,999 | 2 (7.7%) | 1 (1.4%) |
| $100,000+ | 2 (7.7%) | 1 (1.4%) |
| Total | 26 (100.0%) | 70 (100.0%) |
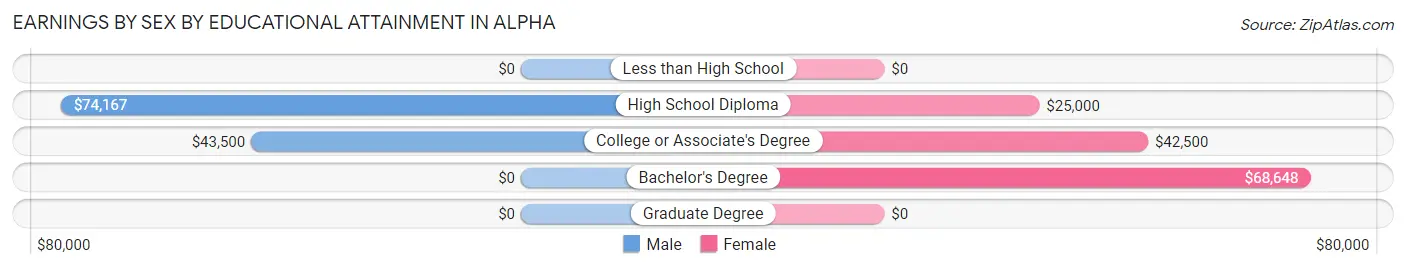
Earnings by Sex by Educational Attainment in Alpha
Average earnings in Alpha are $48,750 for men and $68,469 for women, a difference of 28.8%. Men with an educational attainment of high school diploma enjoy the highest average annual earnings of $74,167, while those with college or associate's degree education earn the least with $43,500. Women with an educational attainment of bachelor's degree earn the most with the average annual earnings of $68,648, while those with high school diploma education have the smallest earnings of $25,000.
| Educational Attainment | Male Income | Female Income |
| Less than High School | - | - |
| High School Diploma | $74,167 | $25,000 |
| College or Associate's Degree | $43,500 | $42,500 |
| Bachelor's Degree | - | - |
| Graduate Degree | - | - |
| Total | $48,750 | $68,469 |
Family Income in Alpha
Family Income Brackets in Alpha
According to the Alpha family income data, there are 9 families falling into the $50,000 to $74,999 income range, which is the most common income bracket and makes up 45.0% of all families.
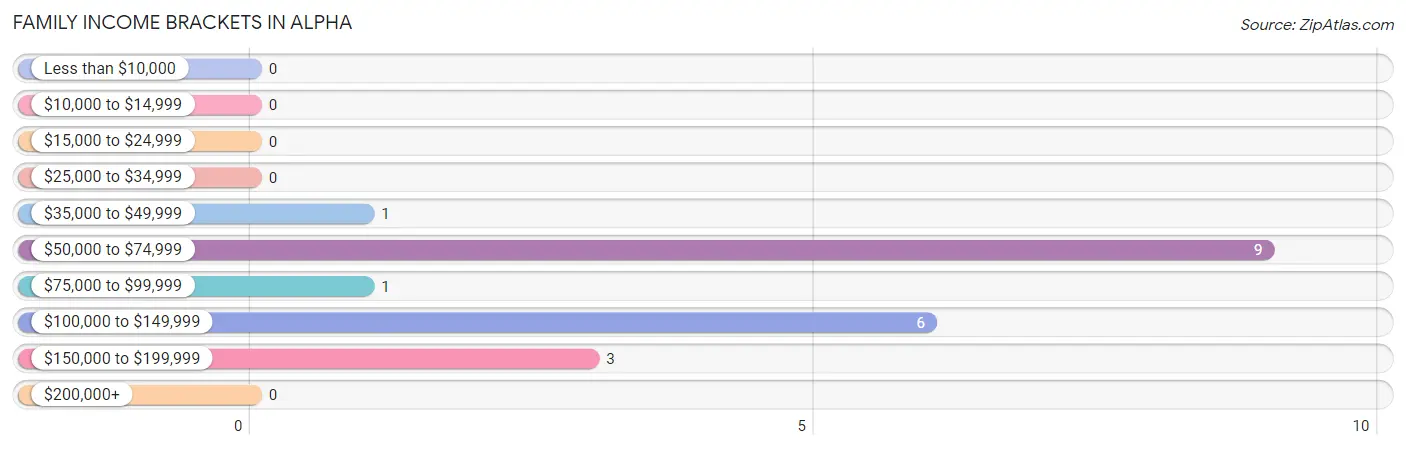
| Income Bracket | # Families | % Families |
| Less than $10,000 | 0 | 0.0% |
| $10,000 to $14,999 | 0 | 0.0% |
| $15,000 to $24,999 | 0 | 0.0% |
| $25,000 to $34,999 | 0 | 0.0% |
| $35,000 to $49,999 | 1 | 5.0% |
| $50,000 to $74,999 | 9 | 45.0% |
| $75,000 to $99,999 | 1 | 5.0% |
| $100,000 to $149,999 | 6 | 30.0% |
| $150,000 to $199,999 | 3 | 15.0% |
| $200,000+ | 0 | 0.0% |
Family Income by Famaliy Size in Alpha
3-person families (3 | 15.0%) account for the highest median family income in Alpha with $133,750 per family, while 2-person families (13 | 65.0%) have the highest median income of $46,875 per family member.
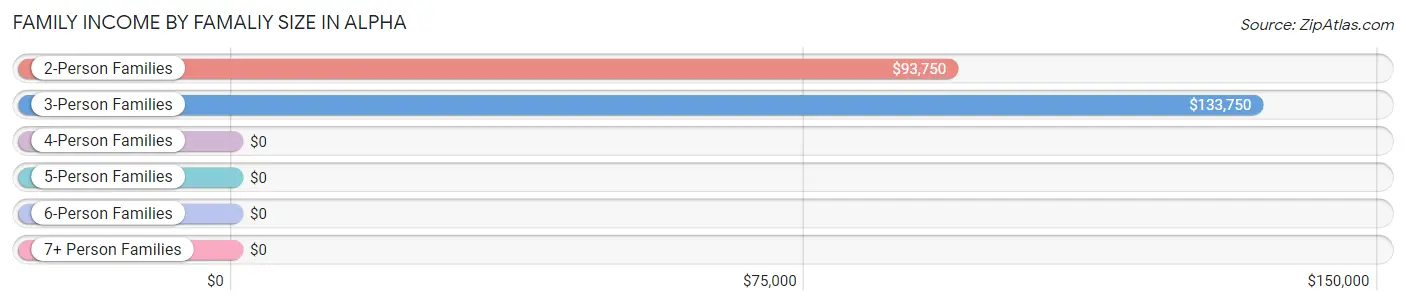
| Income Bracket | # Families | Median Income |
| 2-Person Families | 13 (65.0%) | $93,750 |
| 3-Person Families | 3 (15.0%) | $133,750 |
| 4-Person Families | 4 (20.0%) | $0 |
| 5-Person Families | 0 (0.0%) | $0 |
| 6-Person Families | 0 (0.0%) | $0 |
| 7+ Person Families | 0 (0.0%) | $0 |
| Total | 20 (100.0%) | $81,250 |
Family Income by Number of Earners in Alpha
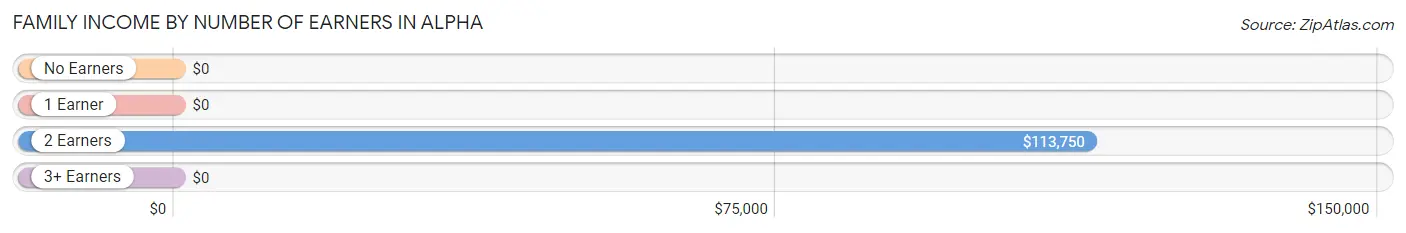
| Number of Earners | # Families | Median Income |
| No Earners | 0 (0.0%) | $0 |
| 1 Earner | 6 (30.0%) | $0 |
| 2 Earners | 10 (50.0%) | $113,750 |
| 3+ Earners | 4 (20.0%) | $0 |
| Total | 20 (100.0%) | $81,250 |
Household Income in Alpha
Household Income Brackets in Alpha
With 55 households falling in the category, the $100,000 to $149,999 income range is the most frequent in Alpha, accounting for 69.6% of all households.
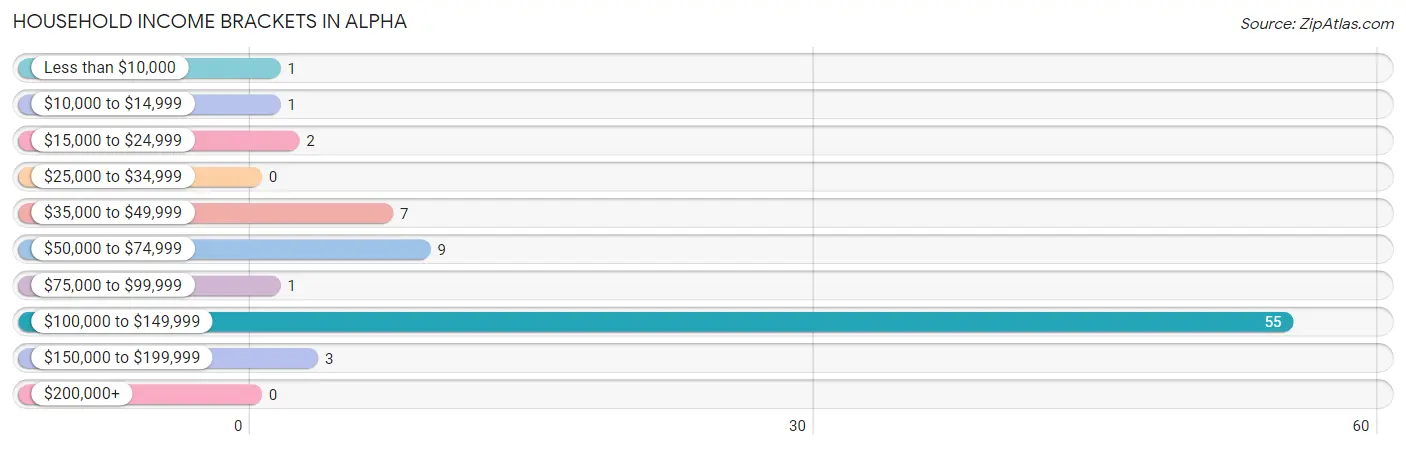
| Income Bracket | # Households | % Households |
| Less than $10,000 | 1 | 1.3% |
| $10,000 to $14,999 | 1 | 1.3% |
| $15,000 to $24,999 | 2 | 2.5% |
| $25,000 to $34,999 | 0 | 0.0% |
| $35,000 to $49,999 | 7 | 8.9% |
| $50,000 to $74,999 | 9 | 11.4% |
| $75,000 to $99,999 | 1 | 1.3% |
| $100,000 to $149,999 | 55 | 69.6% |
| $150,000 to $199,999 | 3 | 3.8% |
| $200,000+ | 0 | 0.0% |
Household Income by Householder Age in Alpha
The median household income in Alpha is $135,638, with the highest median household income of $135,944 found in the 45 to 64 years age bracket for the primary householder. A total of 65 households (82.3%) fall into this category. Meanwhile, the 15 to 24 years age bracket for the primary householder has the lowest median household income of $0, with 1 households (1.3%) in this group.
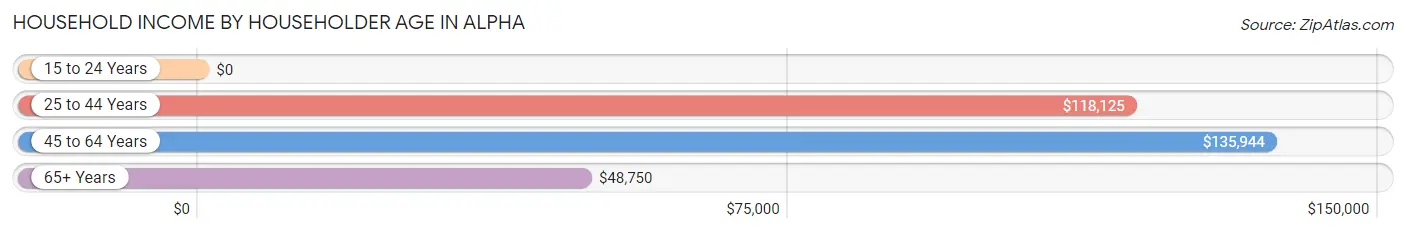
| Income Bracket | # Households | Median Income |
| 15 to 24 Years | 1 (1.3%) | $0 |
| 25 to 44 Years | 5 (6.3%) | $118,125 |
| 45 to 64 Years | 65 (82.3%) | $135,944 |
| 65+ Years | 8 (10.1%) | $48,750 |
| Total | 79 (100.0%) | $135,638 |
Poverty in Alpha
Income Below Poverty by Sex and Age in Alpha
With 2.9% poverty level for males and 1.3% for females among the residents of Alpha, 75 year old and over males and 75 year old and over females are the most vulnerable to poverty, with 1 males (50.0%) and 1 females (50.0%) in their respective age groups living below the poverty level.
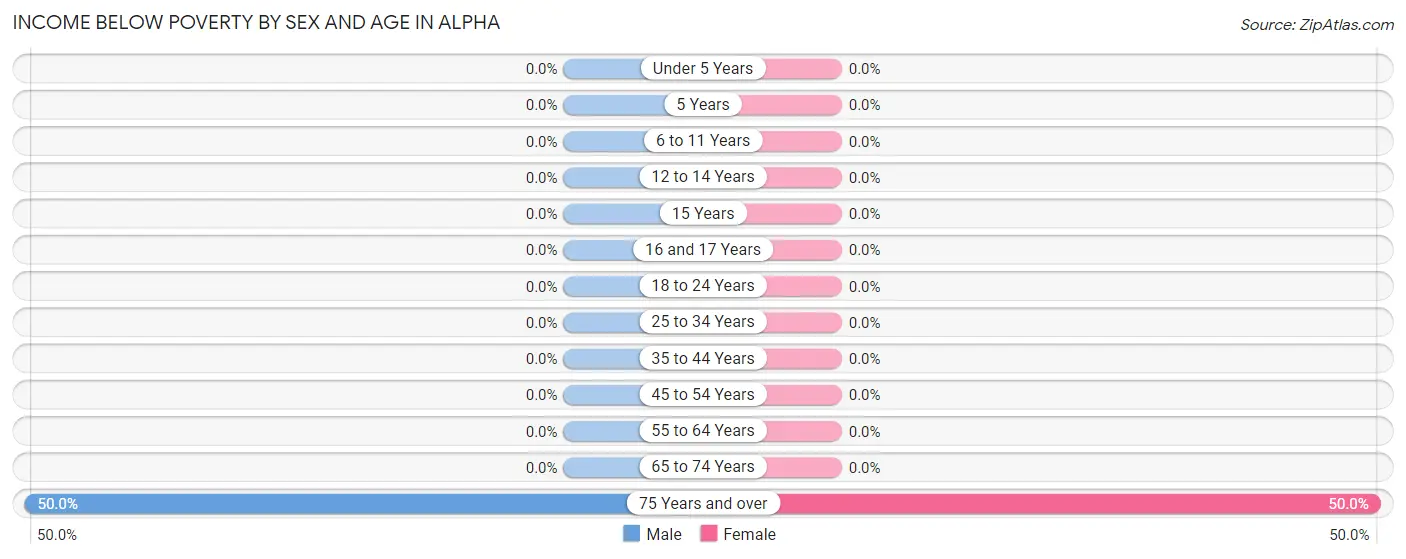
| Age Bracket | Male | Female |
| Under 5 Years | 0 (0.0%) | 0 (0.0%) |
| 5 Years | 0 (0.0%) | 0 (0.0%) |
| 6 to 11 Years | 0 (0.0%) | 0 (0.0%) |
| 12 to 14 Years | 0 (0.0%) | 0 (0.0%) |
| 15 Years | 0 (0.0%) | 0 (0.0%) |
| 16 and 17 Years | 0 (0.0%) | 0 (0.0%) |
| 18 to 24 Years | 0 (0.0%) | 0 (0.0%) |
| 25 to 34 Years | 0 (0.0%) | 0 (0.0%) |
| 35 to 44 Years | 0 (0.0%) | 0 (0.0%) |
| 45 to 54 Years | 0 (0.0%) | 0 (0.0%) |
| 55 to 64 Years | 0 (0.0%) | 0 (0.0%) |
| 65 to 74 Years | 0 (0.0%) | 0 (0.0%) |
| 75 Years and over | 1 (50.0%) | 1 (50.0%) |
| Total | 1 (2.9%) | 1 (1.3%) |
Income Above Poverty by Sex and Age in Alpha
According to the poverty statistics in Alpha, males aged 6 to 11 years and females aged 12 to 14 years are the age groups that are most secure financially, with 100.0% of males and 100.0% of females in these age groups living above the poverty line.
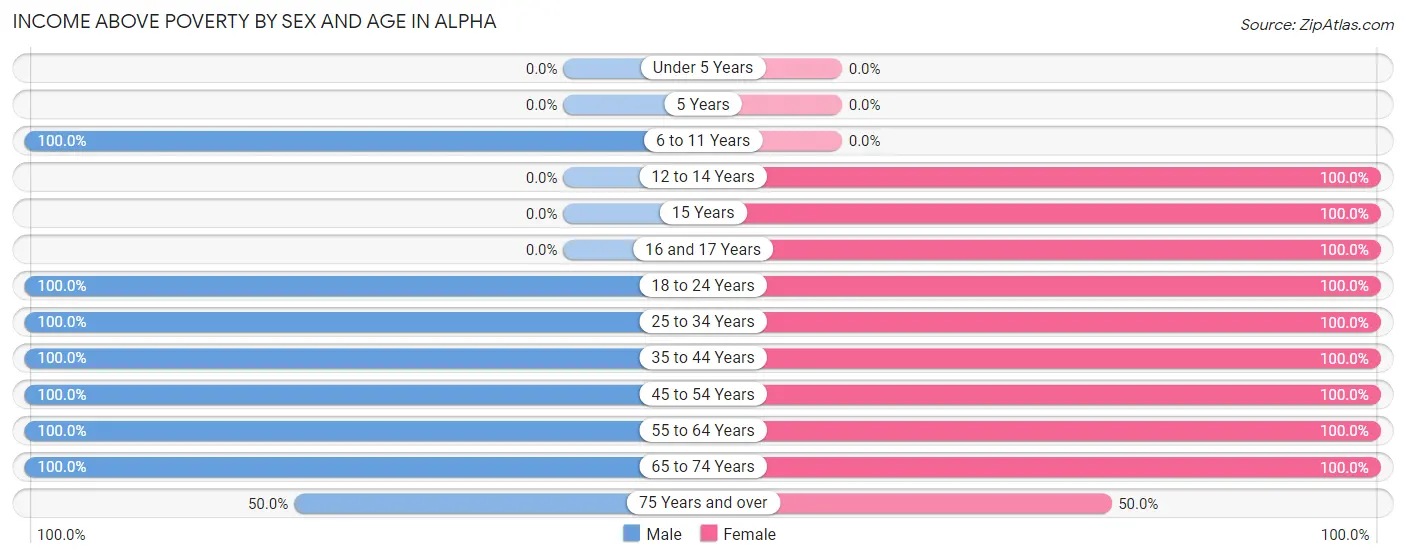
| Age Bracket | Male | Female |
| Under 5 Years | 0 (0.0%) | 0 (0.0%) |
| 5 Years | 0 (0.0%) | 0 (0.0%) |
| 6 to 11 Years | 2 (100.0%) | 0 (0.0%) |
| 12 to 14 Years | 0 (0.0%) | 2 (100.0%) |
| 15 Years | 0 (0.0%) | 2 (100.0%) |
| 16 and 17 Years | 0 (0.0%) | 1 (100.0%) |
| 18 to 24 Years | 2 (100.0%) | 6 (100.0%) |
| 25 to 34 Years | 2 (100.0%) | 2 (100.0%) |
| 35 to 44 Years | 4 (100.0%) | 6 (100.0%) |
| 45 to 54 Years | 13 (100.0%) | 1 (100.0%) |
| 55 to 64 Years | 4 (100.0%) | 54 (100.0%) |
| 65 to 74 Years | 5 (100.0%) | 4 (100.0%) |
| 75 Years and over | 1 (50.0%) | 1 (50.0%) |
| Total | 33 (97.1%) | 79 (98.8%) |
Income Below Poverty Among Married-Couple Families in Alpha
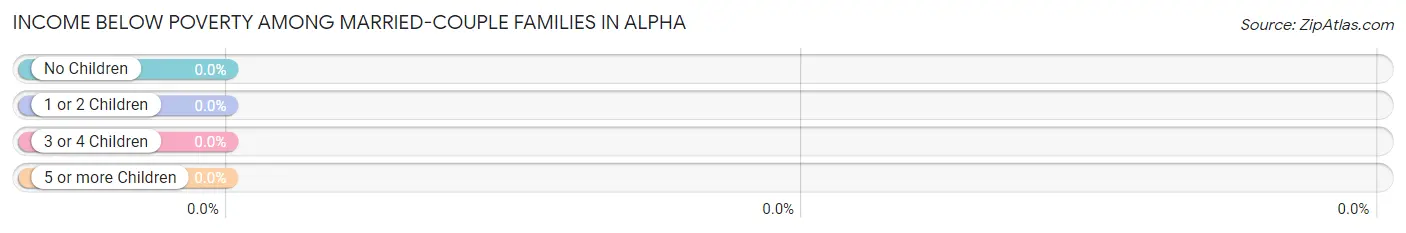
| Children | Above Poverty | Below Poverty |
| No Children | 11 (100.0%) | 0 (0.0%) |
| 1 or 2 Children | 5 (100.0%) | 0 (0.0%) |
| 3 or 4 Children | 0 (0.0%) | 0 (0.0%) |
| 5 or more Children | 0 (0.0%) | 0 (0.0%) |
| Total | 16 (100.0%) | 0 (0.0%) |
Income Below Poverty Among Single-Parent Households in Alpha
| Children | Single Father | Single Mother |
| No Children | 0 (0.0%) | 0 (0.0%) |
| 1 or 2 Children | 0 (0.0%) | 0 (0.0%) |
| 3 or 4 Children | 0 (0.0%) | 0 (0.0%) |
| 5 or more Children | 0 (0.0%) | 0 (0.0%) |
| Total | 0 (0.0%) | 0 (0.0%) |
Income Below Poverty Among Married-Couple vs Single-Parent Households in Alpha
| Children | Married-Couple Families | Single-Parent Households |
| No Children | 0 (0.0%) | 0 (0.0%) |
| 1 or 2 Children | 0 (0.0%) | 0 (0.0%) |
| 3 or 4 Children | 0 (0.0%) | 0 (0.0%) |
| 5 or more Children | 0 (0.0%) | 0 (0.0%) |
| Total | 0 (0.0%) | 0 (0.0%) |
Race in Alpha
The most populous races in Alpha are White / Caucasian (63 | 55.3%), Hispanic or Latino (49 | 43.0%), and Some other Race (49 | 43.0%).
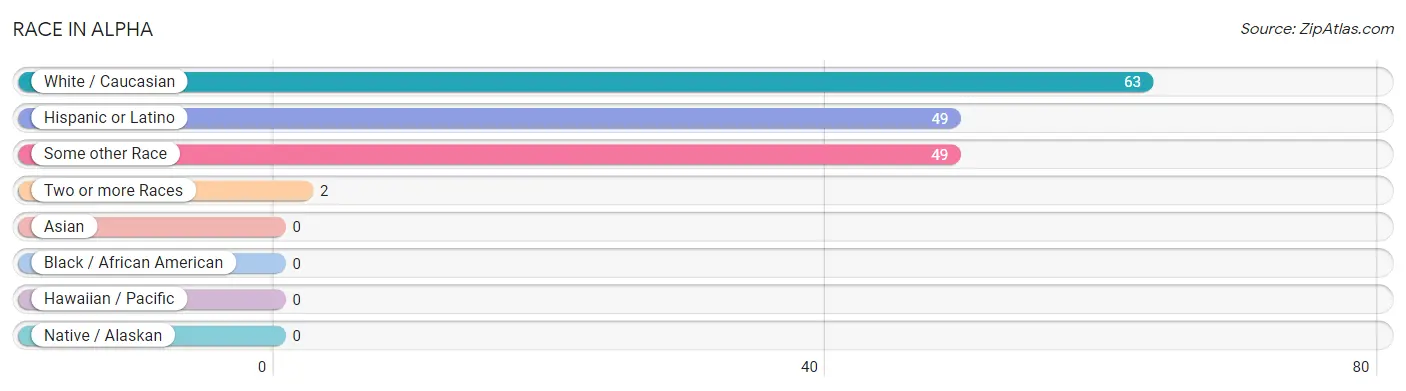
| Race | # Population | % Population |
| Asian | 0 | 0.0% |
| Black / African American | 0 | 0.0% |
| Hawaiian / Pacific | 0 | 0.0% |
| Hispanic or Latino | 49 | 43.0% |
| Native / Alaskan | 0 | 0.0% |
| White / Caucasian | 63 | 55.3% |
| Two or more Races | 2 | 1.8% |
| Some other Race | 49 | 43.0% |
| Total | 114 | 100.0% |
Ancestry in Alpha
The most populous ancestries reported in Alpha are Central American (49 | 43.0%), Salvadoran (49 | 43.0%), German (26 | 22.8%), Norwegian (12 | 10.5%), and American (7 | 6.1%), together accounting for 125.4% of all Alpha residents.
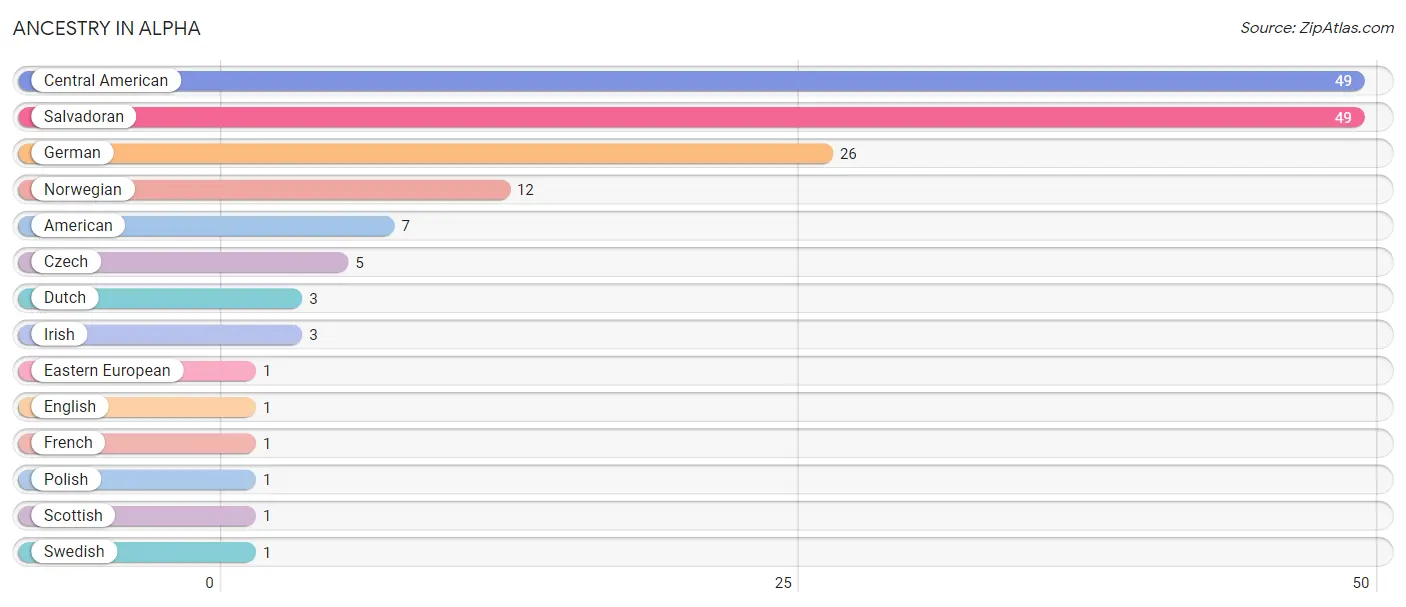
| Ancestry | # Population | % Population |
| American | 7 | 6.1% |
| Central American | 49 | 43.0% |
| Czech | 5 | 4.4% |
| Dutch | 3 | 2.6% |
| Eastern European | 1 | 0.9% |
| English | 1 | 0.9% |
| French | 1 | 0.9% |
| German | 26 | 22.8% |
| Irish | 3 | 2.6% |
| Norwegian | 12 | 10.5% |
| Polish | 1 | 0.9% |
| Salvadoran | 49 | 43.0% |
| Scottish | 1 | 0.9% |
| Swedish | 1 | 0.9% | View All 14 Rows |
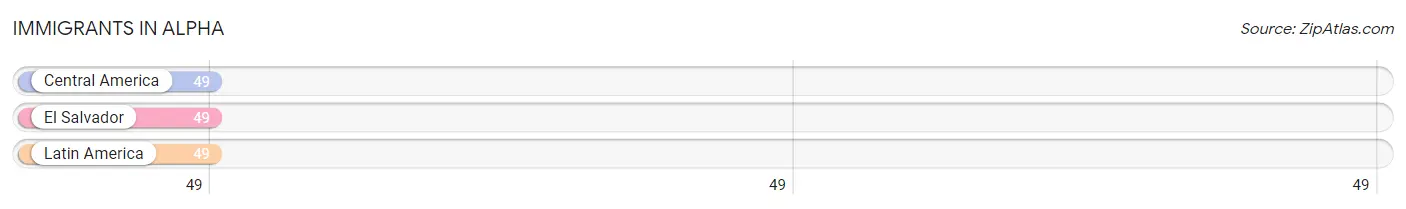
Immigrants in Alpha
The most numerous immigrant groups reported in Alpha came from Central America (49 | 43.0%), El Salvador (49 | 43.0%), and Latin America (49 | 43.0%), together accounting for 128.9% of all Alpha residents.
| Immigration Origin | # Population | % Population |
| Central America | 49 | 43.0% |
| El Salvador | 49 | 43.0% |
| Latin America | 49 | 43.0% | View All 3 Rows |
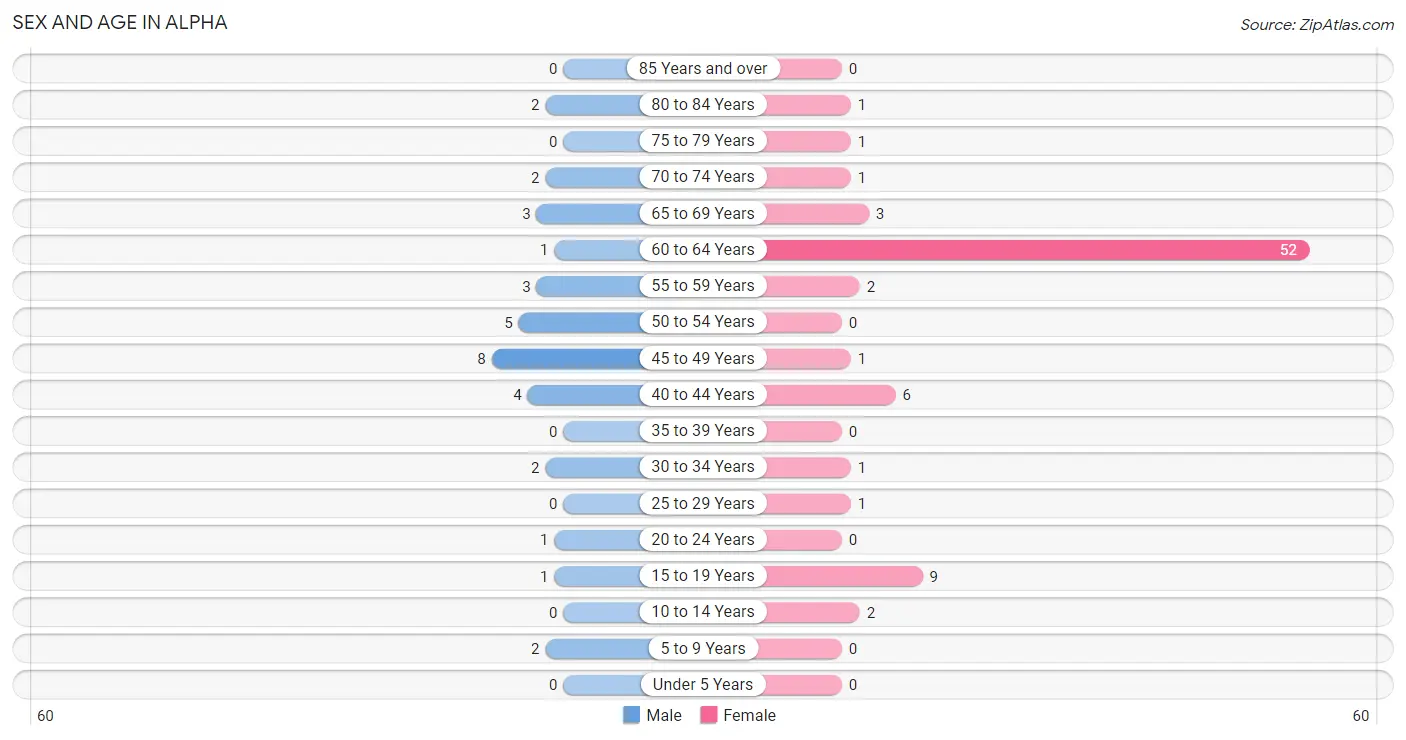
Sex and Age in Alpha
Sex and Age in Alpha
The most populous age groups in Alpha are 45 to 49 Years (8 | 23.5%) for men and 60 to 64 Years (52 | 65.0%) for women.
| Age Bracket | Male | Female |
| Under 5 Years | 0 (0.0%) | 0 (0.0%) |
| 5 to 9 Years | 2 (5.9%) | 0 (0.0%) |
| 10 to 14 Years | 0 (0.0%) | 2 (2.5%) |
| 15 to 19 Years | 1 (2.9%) | 9 (11.3%) |
| 20 to 24 Years | 1 (2.9%) | 0 (0.0%) |
| 25 to 29 Years | 0 (0.0%) | 1 (1.3%) |
| 30 to 34 Years | 2 (5.9%) | 1 (1.3%) |
| 35 to 39 Years | 0 (0.0%) | 0 (0.0%) |
| 40 to 44 Years | 4 (11.8%) | 6 (7.5%) |
| 45 to 49 Years | 8 (23.5%) | 1 (1.3%) |
| 50 to 54 Years | 5 (14.7%) | 0 (0.0%) |
| 55 to 59 Years | 3 (8.8%) | 2 (2.5%) |
| 60 to 64 Years | 1 (2.9%) | 52 (65.0%) |
| 65 to 69 Years | 3 (8.8%) | 3 (3.7%) |
| 70 to 74 Years | 2 (5.9%) | 1 (1.3%) |
| 75 to 79 Years | 0 (0.0%) | 1 (1.3%) |
| 80 to 84 Years | 2 (5.9%) | 1 (1.3%) |
| 85 Years and over | 0 (0.0%) | 0 (0.0%) |
| Total | 34 (100.0%) | 80 (100.0%) |
Families and Households in Alpha
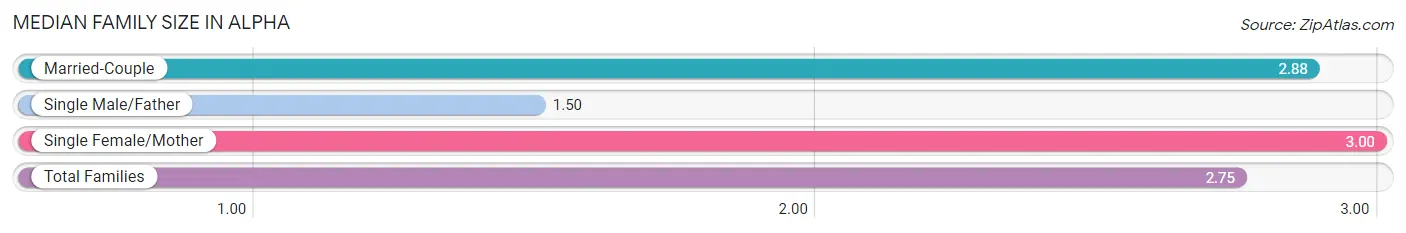
Median Family Size in Alpha
The median family size in Alpha is 2.75 persons per family, with single female/mother families (2 | 10.0%) accounting for the largest median family size of 3 persons per family. On the other hand, single male/father families (2 | 10.0%) represent the smallest median family size with 1.50 persons per family.
| Family Type | # Families | Family Size |
| Married-Couple | 16 (80.0%) | 2.88 |
| Single Male/Father | 2 (10.0%) | 1.50 |
| Single Female/Mother | 2 (10.0%) | 3.00 |
| Total Families | 20 (100.0%) | 2.75 |
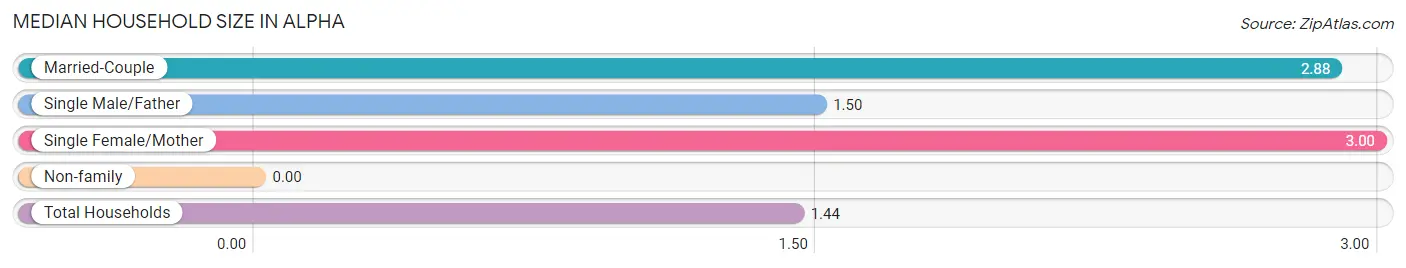
Median Household Size in Alpha
| Household Type | # Households | Household Size |
| Married-Couple | 16 (20.3%) | 2.88 |
| Single Male/Father | 2 (2.5%) | 1.50 |
| Single Female/Mother | 2 (2.5%) | 3.00 |
| Non-family | 59 (74.7%) | - |
| Total Households | 79 (100.0%) | 1.44 |
Household Size by Marriage Status in Alpha
Out of a total of 79 households in Alpha, 20 (25.3%) are family households, while 59 (74.7%) are nonfamily households. The most numerous type of family households are 2-person households, comprising 13, and the most common type of nonfamily households are 1-person households, comprising 59.
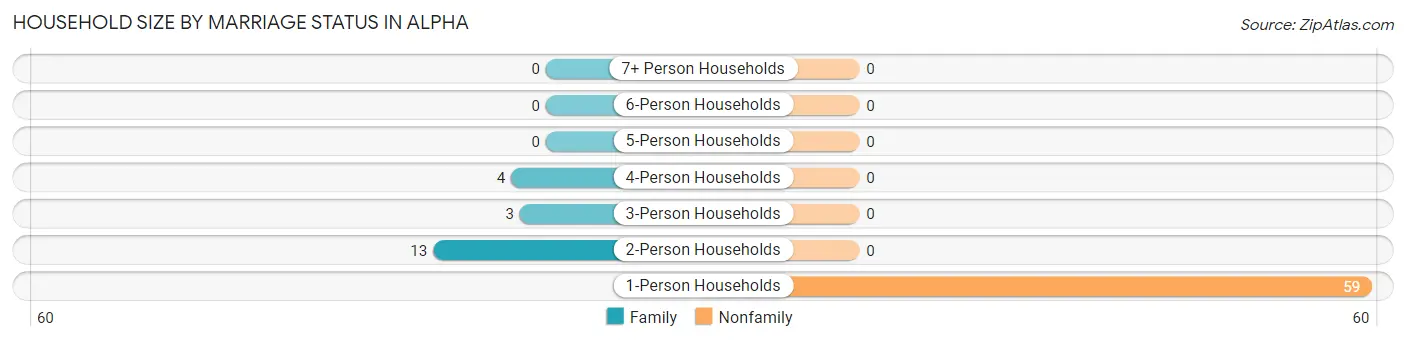
| Household Size | Family Households | Nonfamily Households |
| 1-Person Households | - | 59 (74.7%) |
| 2-Person Households | 13 (16.5%) | 0 (0.0%) |
| 3-Person Households | 3 (3.8%) | 0 (0.0%) |
| 4-Person Households | 4 (5.1%) | 0 (0.0%) |
| 5-Person Households | 0 (0.0%) | 0 (0.0%) |
| 6-Person Households | 0 (0.0%) | 0 (0.0%) |
| 7+ Person Households | 0 (0.0%) | 0 (0.0%) |
| Total | 20 (25.3%) | 59 (74.7%) |
Female Fertility in Alpha
Fertility by Age in Alpha
| Age Bracket | Women with Births | Births / 1,000 Women |
| 15 to 19 years | 0 (0.0%) | 0.0 |
| 20 to 34 years | 0 (0.0%) | 0.0 |
| 35 to 50 years | 0 (0.0%) | 0.0 |
| Total | 0 (0.0%) | 0.0 |
Fertility by Age by Marriage Status in Alpha
| Age Bracket | Married | Unmarried |
| 15 to 19 years | 0 (0.0%) | 0 (0.0%) |
| 20 to 34 years | 0 (0.0%) | 0 (0.0%) |
| 35 to 50 years | 0 (0.0%) | 0 (0.0%) |
| Total | 0 (0.0%) | 0 (0.0%) |
Fertility by Education in Alpha
| Educational Attainment | Women with Births | Births / 1,000 Women |
| Less than High School | 0 (0.0%) | 0.0 |
| High School Diploma | 0 (0.0%) | 0.0 |
| College or Associate's Degree | 0 (0.0%) | 0.0 |
| Bachelor's Degree | 0 (0.0%) | 0.0 |
| Graduate Degree | 0 (0.0%) | 0.0 |
| Total | 0 (0.0%) | 0.0 |
Fertility by Education by Marriage Status in Alpha
| Educational Attainment | Married | Unmarried |
| Less than High School | 0 (0.0%) | 0 (0.0%) |
| High School Diploma | 0 (0.0%) | 0 (0.0%) |
| College or Associate's Degree | 0 (0.0%) | 0 (0.0%) |
| Bachelor's Degree | 0 (0.0%) | 0 (0.0%) |
| Graduate Degree | 0 (0.0%) | 0 (0.0%) |
| Total | 0 (0.0%) | 0 (0.0%) |
Employment Characteristics in Alpha
Employment by Class of Employer in Alpha
Among the 92 employed individuals in Alpha, private company employees (84 | 91.3%), not-for-profit organizations (3 | 3.3%), and self-employed (incorporated) (2 | 2.2%) make up the most common classes of employment.
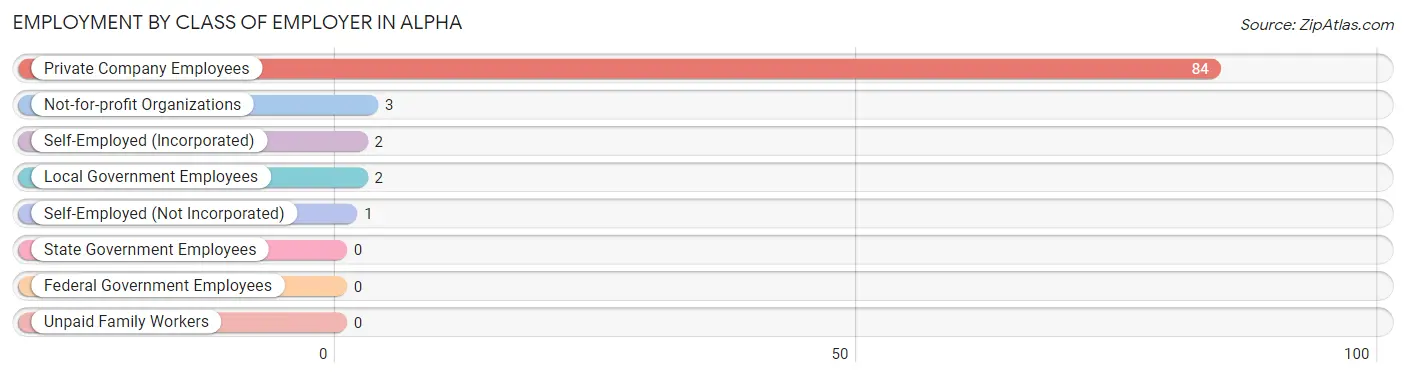
| Employer Class | # Employees | % Employees |
| Private Company Employees | 84 | 91.3% |
| Self-Employed (Incorporated) | 2 | 2.2% |
| Self-Employed (Not Incorporated) | 1 | 1.1% |
| Not-for-profit Organizations | 3 | 3.3% |
| Local Government Employees | 2 | 2.2% |
| State Government Employees | 0 | 0.0% |
| Federal Government Employees | 0 | 0.0% |
| Unpaid Family Workers | 0 | 0.0% |
| Total | 92 | 100.0% |
Employment Status by Age in Alpha
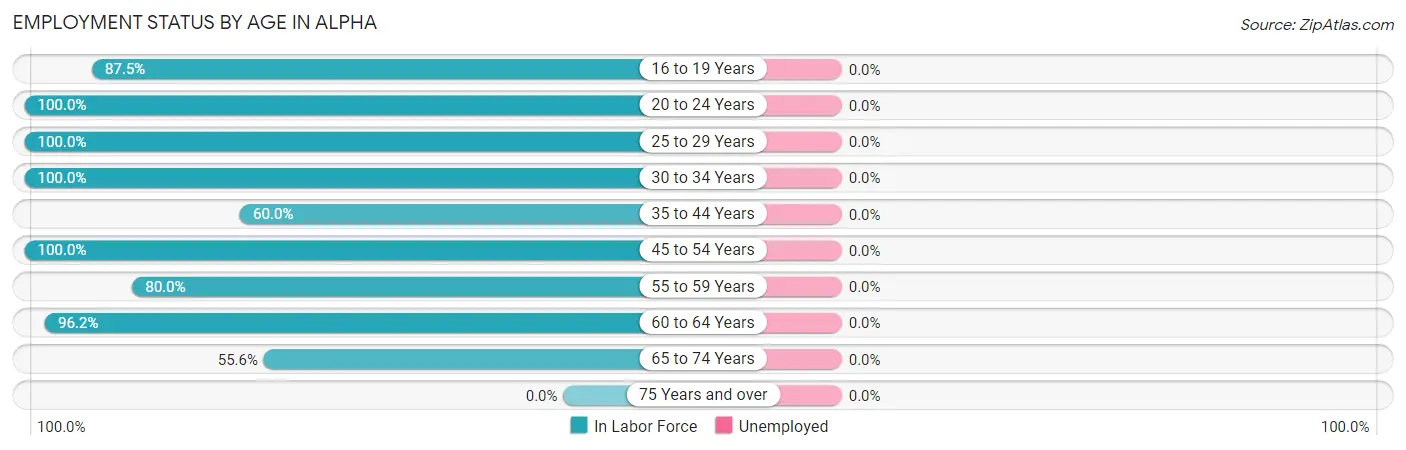
| Age Bracket | In Labor Force | Unemployed |
| 16 to 19 Years | 7 (87.5%) | 0 (0.0%) |
| 20 to 24 Years | 1 (100.0%) | 0 (0.0%) |
| 25 to 29 Years | 1 (100.0%) | 0 (0.0%) |
| 30 to 34 Years | 3 (100.0%) | 0 (0.0%) |
| 35 to 44 Years | 6 (60.0%) | 0 (0.0%) |
| 45 to 54 Years | 14 (100.0%) | 0 (0.0%) |
| 55 to 59 Years | 4 (80.0%) | 0 (0.0%) |
| 60 to 64 Years | 51 (96.2%) | 0 (0.0%) |
| 65 to 74 Years | 5 (55.6%) | 0 (0.0%) |
| 75 Years and over | 0 (0.0%) | 0 (0.0%) |
| Total | 92 (85.2%) | 0 (0.0%) |
Employment Status by Educational Attainment in Alpha
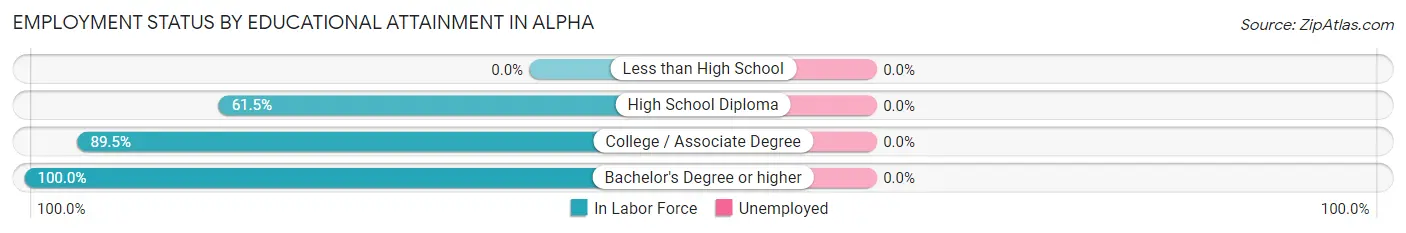
| Educational Attainment | In Labor Force | Unemployed |
| Less than High School | 0 (0.0%) | 0 (0.0%) |
| High School Diploma | 8 (61.5%) | 0 (0.0%) |
| College / Associate Degree | 17 (89.5%) | 0 (0.0%) |
| Bachelor's Degree or higher | 54 (100.0%) | 0 (0.0%) |
| Total | 79 (91.9%) | 0 (0.0%) |
Employment Occupations by Sex in Alpha
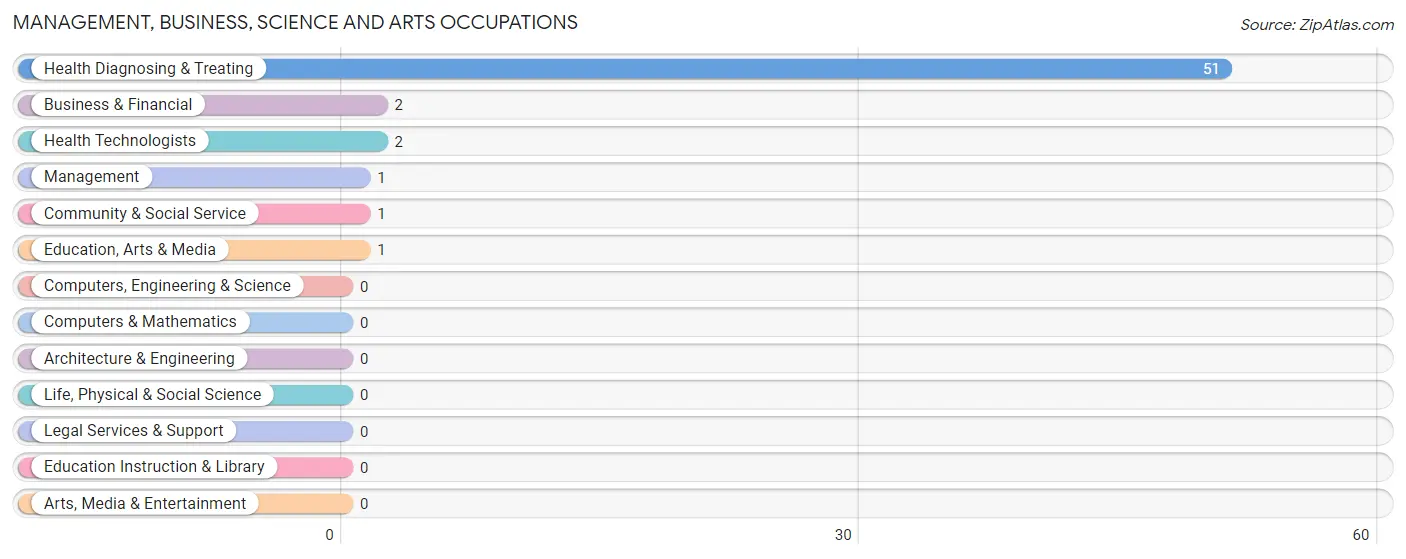
Management, Business, Science and Arts Occupations
The most common Management, Business, Science and Arts occupations in Alpha are Health Diagnosing & Treating (51 | 55.4%), Business & Financial (2 | 2.2%), Health Technologists (2 | 2.2%), Management (1 | 1.1%), and Community & Social Service (1 | 1.1%).
Management, Business, Science and Arts Occupations by Sex
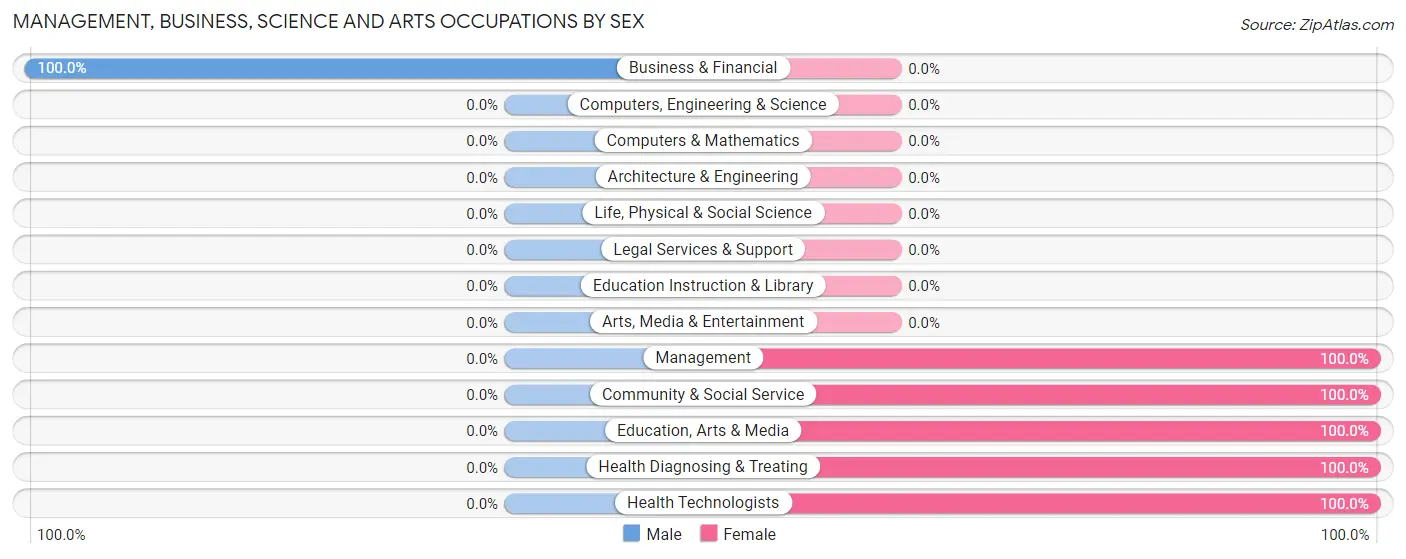
| Occupation | Male | Female |
| Management | 0 (0.0%) | 1 (100.0%) |
| Business & Financial | 2 (100.0%) | 0 (0.0%) |
| Computers, Engineering & Science | 0 (0.0%) | 0 (0.0%) |
| Computers & Mathematics | 0 (0.0%) | 0 (0.0%) |
| Architecture & Engineering | 0 (0.0%) | 0 (0.0%) |
| Life, Physical & Social Science | 0 (0.0%) | 0 (0.0%) |
| Community & Social Service | 0 (0.0%) | 1 (100.0%) |
| Education, Arts & Media | 0 (0.0%) | 1 (100.0%) |
| Legal Services & Support | 0 (0.0%) | 0 (0.0%) |
| Education Instruction & Library | 0 (0.0%) | 0 (0.0%) |
| Arts, Media & Entertainment | 0 (0.0%) | 0 (0.0%) |
| Health Diagnosing & Treating | 0 (0.0%) | 51 (100.0%) |
| Health Technologists | 0 (0.0%) | 2 (100.0%) |
| Total (Category) | 2 (3.6%) | 53 (96.4%) |
| Total (Overall) | 25 (27.2%) | 67 (72.8%) |
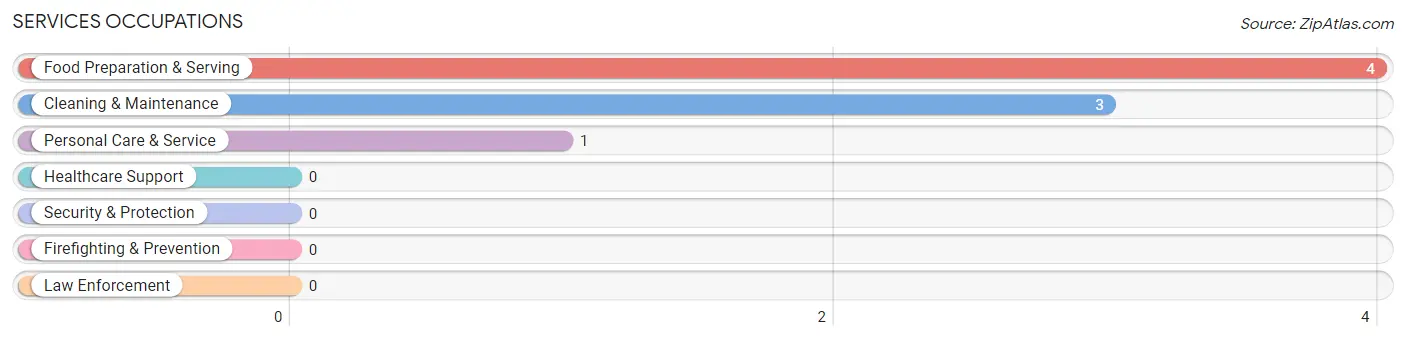
Services Occupations
The most common Services occupations in Alpha are Food Preparation & Serving (4 | 4.3%), Cleaning & Maintenance (3 | 3.3%), and Personal Care & Service (1 | 1.1%).
Services Occupations by Sex
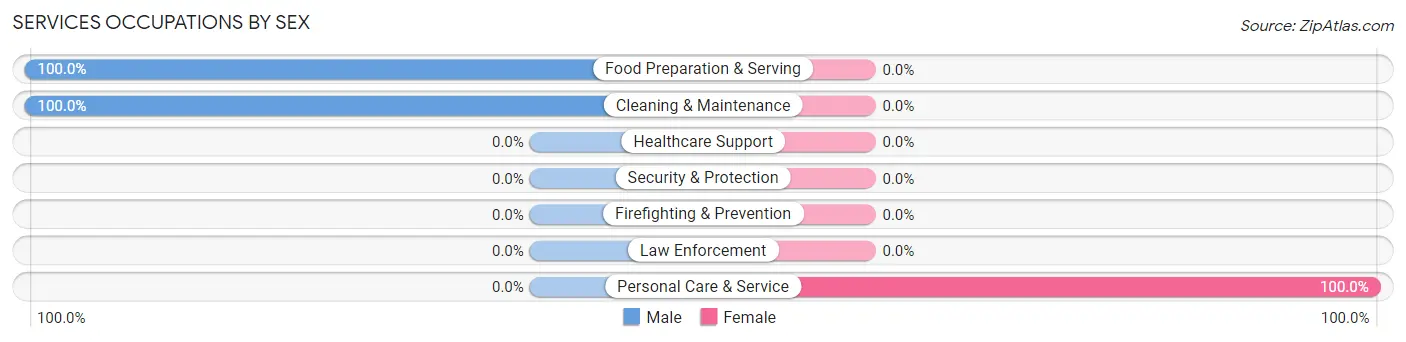
| Occupation | Male | Female |
| Healthcare Support | 0 (0.0%) | 0 (0.0%) |
| Security & Protection | 0 (0.0%) | 0 (0.0%) |
| Firefighting & Prevention | 0 (0.0%) | 0 (0.0%) |
| Law Enforcement | 0 (0.0%) | 0 (0.0%) |
| Food Preparation & Serving | 4 (100.0%) | 0 (0.0%) |
| Cleaning & Maintenance | 3 (100.0%) | 0 (0.0%) |
| Personal Care & Service | 0 (0.0%) | 1 (100.0%) |
| Total (Category) | 7 (87.5%) | 1 (12.5%) |
| Total (Overall) | 25 (27.2%) | 67 (72.8%) |
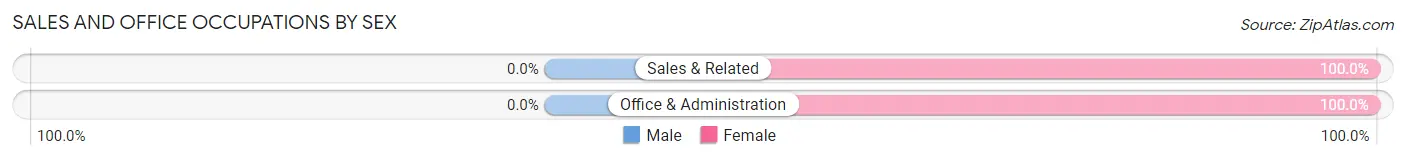
Sales and Office Occupations
The most common Sales and Office occupations in Alpha are Sales & Related (5 | 5.4%), and Office & Administration (3 | 3.3%).
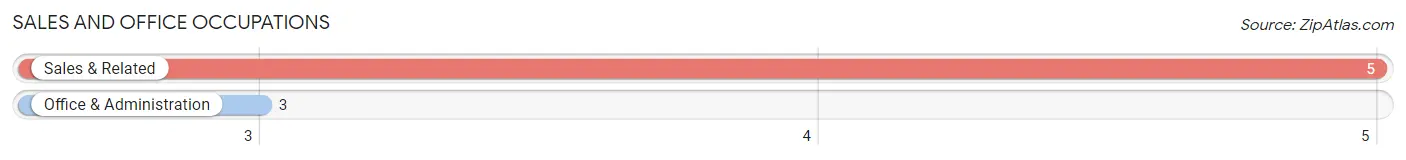
Sales and Office Occupations by Sex
| Occupation | Male | Female |
| Sales & Related | 0 (0.0%) | 5 (100.0%) |
| Office & Administration | 0 (0.0%) | 3 (100.0%) |
| Total (Category) | 0 (0.0%) | 8 (100.0%) |
| Total (Overall) | 25 (27.2%) | 67 (72.8%) |
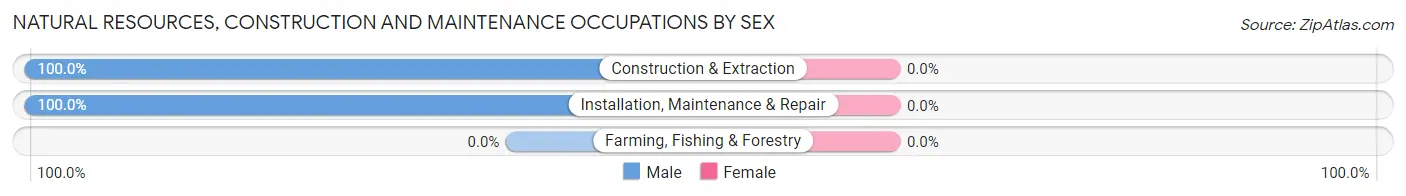
Natural Resources, Construction and Maintenance Occupations
The most common Natural Resources, Construction and Maintenance occupations in Alpha are Installation, Maintenance & Repair (3 | 3.3%), and Construction & Extraction (1 | 1.1%).
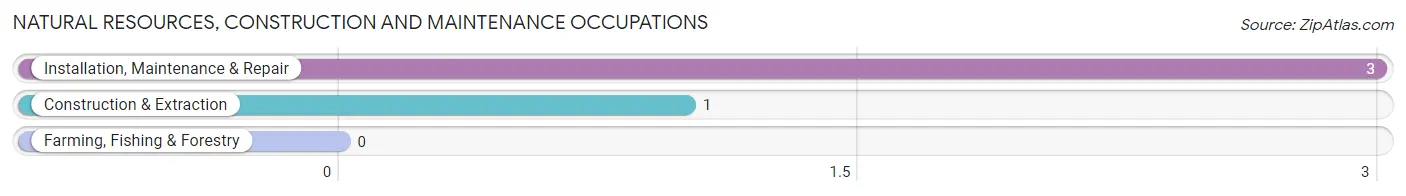
Natural Resources, Construction and Maintenance Occupations by Sex
| Occupation | Male | Female |
| Farming, Fishing & Forestry | 0 (0.0%) | 0 (0.0%) |
| Construction & Extraction | 1 (100.0%) | 0 (0.0%) |
| Installation, Maintenance & Repair | 3 (100.0%) | 0 (0.0%) |
| Total (Category) | 4 (100.0%) | 0 (0.0%) |
| Total (Overall) | 25 (27.2%) | 67 (72.8%) |
Production, Transportation and Moving Occupations
The most common Production, Transportation and Moving occupations in Alpha are Production (15 | 16.3%), Transportation (1 | 1.1%), and Material Moving (1 | 1.1%).
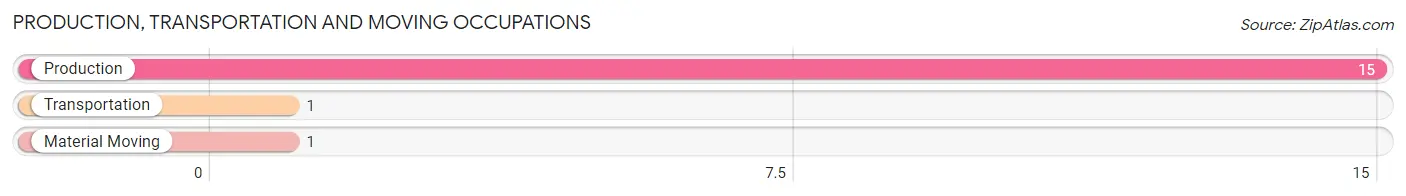
Production, Transportation and Moving Occupations by Sex
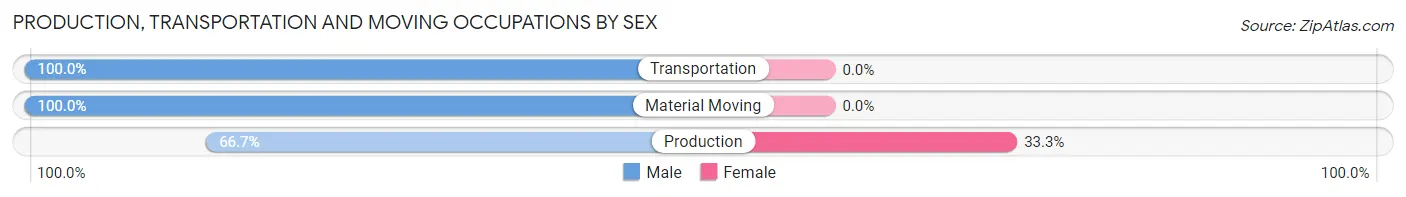
| Occupation | Male | Female |
| Production | 10 (66.7%) | 5 (33.3%) |
| Transportation | 1 (100.0%) | 0 (0.0%) |
| Material Moving | 1 (100.0%) | 0 (0.0%) |
| Total (Category) | 12 (70.6%) | 5 (29.4%) |
| Total (Overall) | 25 (27.2%) | 67 (72.8%) |
Employment Industries by Sex in Alpha
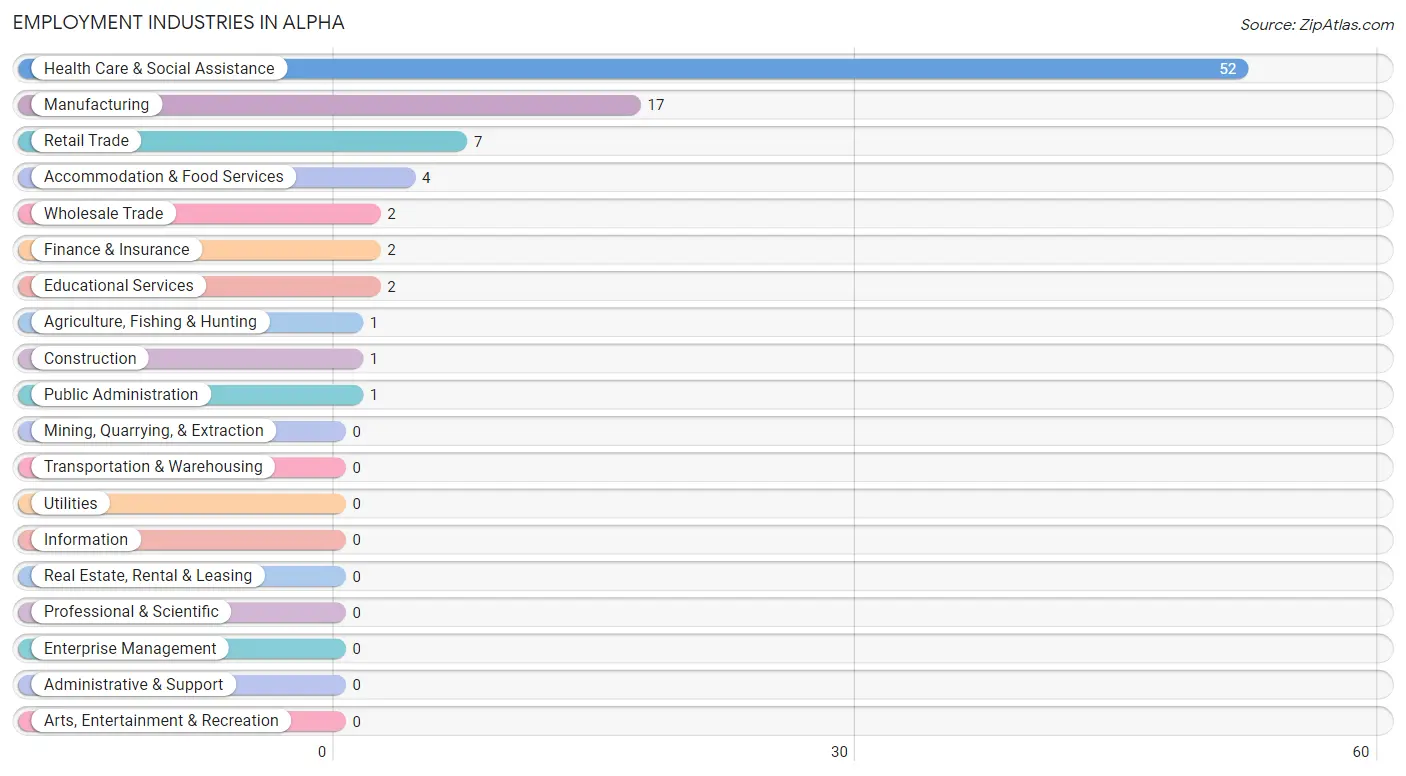
Employment Industries in Alpha
The major employment industries in Alpha include Health Care & Social Assistance (52 | 56.5%), Manufacturing (17 | 18.5%), Retail Trade (7 | 7.6%), Accommodation & Food Services (4 | 4.3%), and Wholesale Trade (2 | 2.2%).
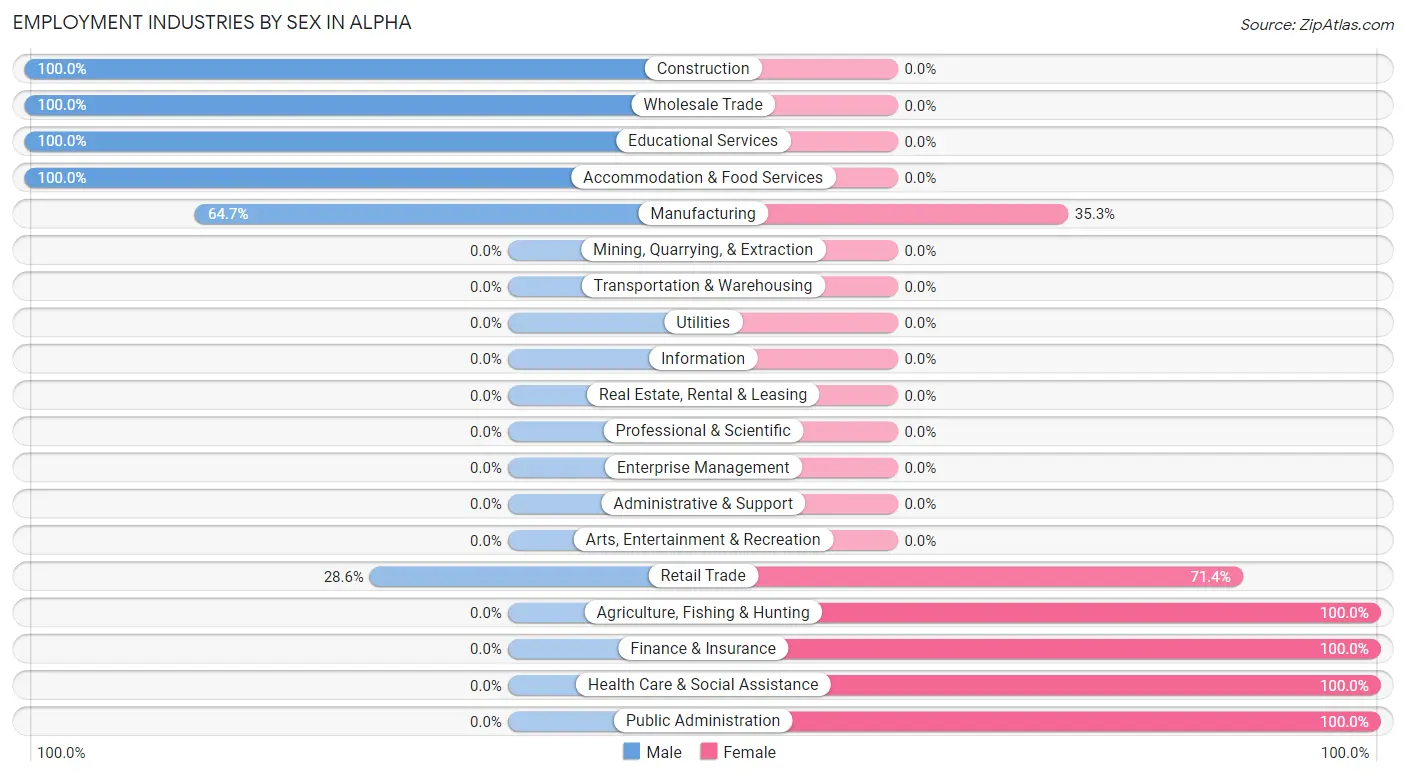
Employment Industries by Sex in Alpha
The Alpha industries that see more men than women are Construction (100.0%), Wholesale Trade (100.0%), and Educational Services (100.0%), whereas the industries that tend to have a higher number of women are Agriculture, Fishing & Hunting (100.0%), Finance & Insurance (100.0%), and Health Care & Social Assistance (100.0%).
| Industry | Male | Female |
| Agriculture, Fishing & Hunting | 0 (0.0%) | 1 (100.0%) |
| Mining, Quarrying, & Extraction | 0 (0.0%) | 0 (0.0%) |
| Construction | 1 (100.0%) | 0 (0.0%) |
| Manufacturing | 11 (64.7%) | 6 (35.3%) |
| Wholesale Trade | 2 (100.0%) | 0 (0.0%) |
| Retail Trade | 2 (28.6%) | 5 (71.4%) |
| Transportation & Warehousing | 0 (0.0%) | 0 (0.0%) |
| Utilities | 0 (0.0%) | 0 (0.0%) |
| Information | 0 (0.0%) | 0 (0.0%) |
| Finance & Insurance | 0 (0.0%) | 2 (100.0%) |
| Real Estate, Rental & Leasing | 0 (0.0%) | 0 (0.0%) |
| Professional & Scientific | 0 (0.0%) | 0 (0.0%) |
| Enterprise Management | 0 (0.0%) | 0 (0.0%) |
| Administrative & Support | 0 (0.0%) | 0 (0.0%) |
| Educational Services | 2 (100.0%) | 0 (0.0%) |
| Health Care & Social Assistance | 0 (0.0%) | 52 (100.0%) |
| Arts, Entertainment & Recreation | 0 (0.0%) | 0 (0.0%) |
| Accommodation & Food Services | 4 (100.0%) | 0 (0.0%) |
| Public Administration | 0 (0.0%) | 1 (100.0%) |
| Total | 25 (27.2%) | 67 (72.8%) |
Education in Alpha
School Enrollment in Alpha
The most common levels of schooling among the 14 students in Alpha are high school (11 | 78.6%), kindergarten (1 | 7.1%), and elementary school (1 | 7.1%).
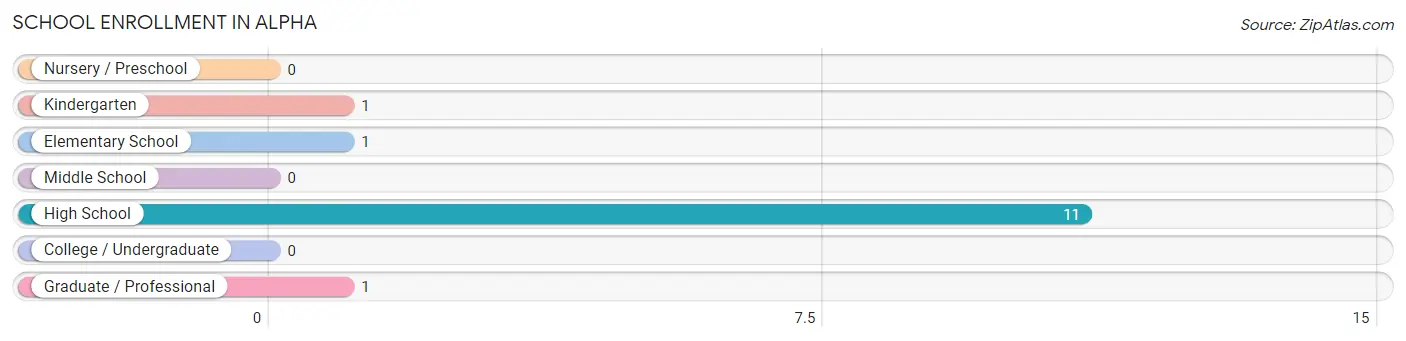
| School Level | # Students | % Students |
| Nursery / Preschool | 0 | 0.0% |
| Kindergarten | 1 | 7.1% |
| Elementary School | 1 | 7.1% |
| Middle School | 0 | 0.0% |
| High School | 11 | 78.6% |
| College / Undergraduate | 0 | 0.0% |
| Graduate / Professional | 1 | 7.1% |
| Total | 14 | 100.0% |
School Enrollment by Age by Funding Source in Alpha
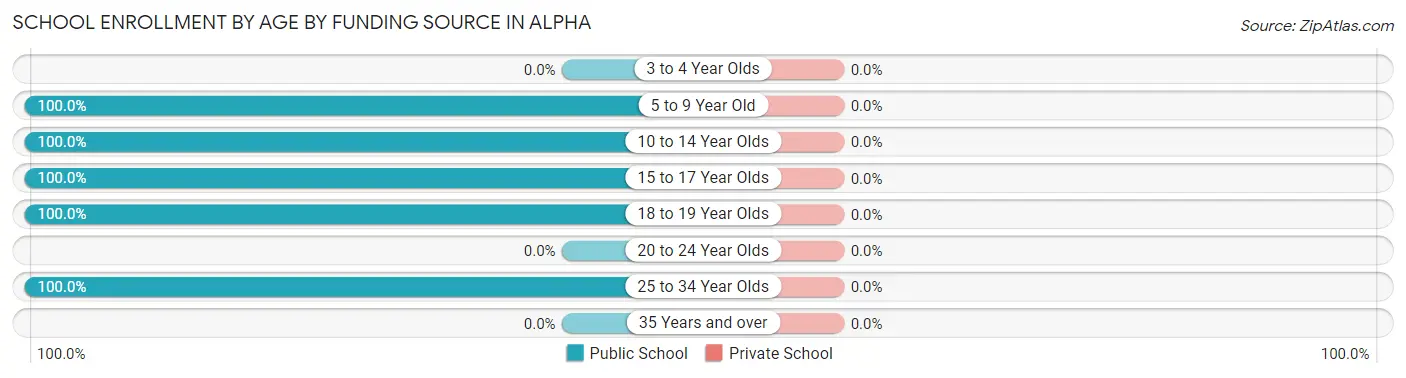
| Age Bracket | Public School | Private School |
| 3 to 4 Year Olds | 0 (0.0%) | 0 (0.0%) |
| 5 to 9 Year Old | 2 (100.0%) | 0 (0.0%) |
| 10 to 14 Year Olds | 2 (100.0%) | 0 (0.0%) |
| 15 to 17 Year Olds | 3 (100.0%) | 0 (0.0%) |
| 18 to 19 Year Olds | 6 (100.0%) | 0 (0.0%) |
| 20 to 24 Year Olds | 0 (0.0%) | 0 (0.0%) |
| 25 to 34 Year Olds | 1 (100.0%) | 0 (0.0%) |
| 35 Years and over | 0 (0.0%) | 0 (0.0%) |
| Total | 14 (100.0%) | 0 (0.0%) |
Educational Attainment by Field of Study in Alpha
Science & technology (50 | 48.5%), education (49 | 47.6%), business (3 | 2.9%), and arts & humanities (1 | 1.0%) are the most common fields of study among 103 individuals in Alpha who have obtained a bachelor's degree or higher.
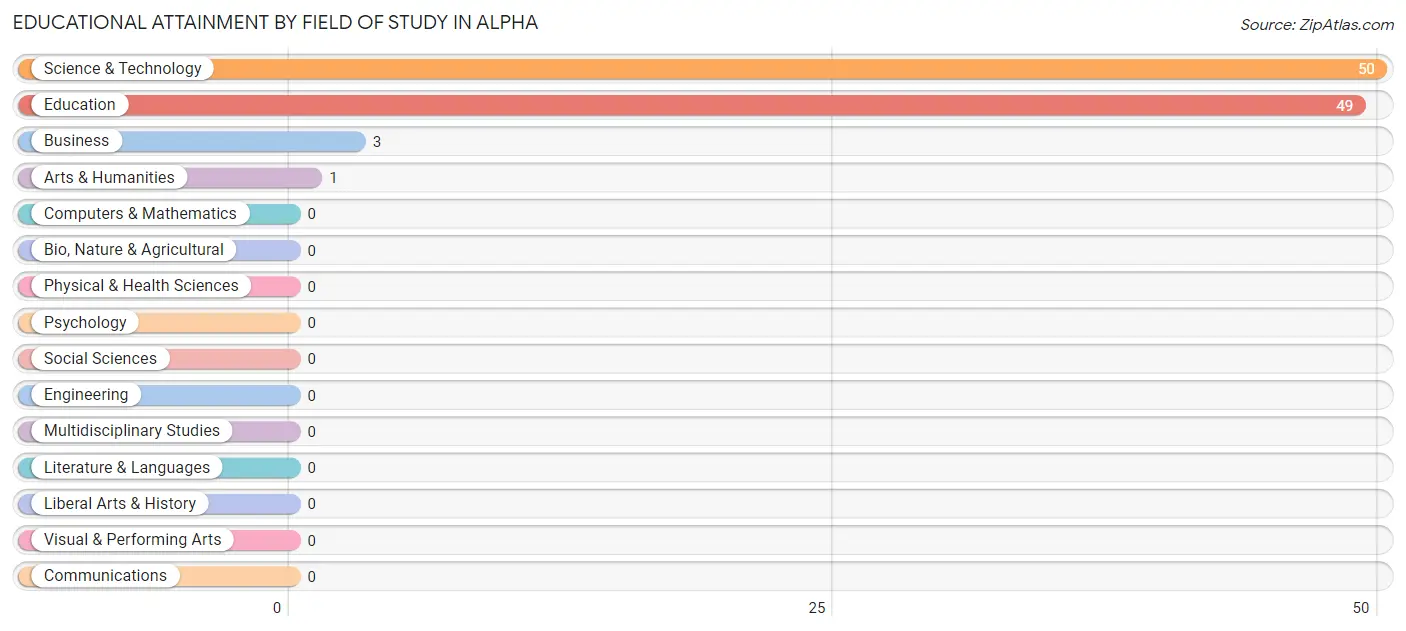
| Field of Study | # Graduates | % Graduates |
| Computers & Mathematics | 0 | 0.0% |
| Bio, Nature & Agricultural | 0 | 0.0% |
| Physical & Health Sciences | 0 | 0.0% |
| Psychology | 0 | 0.0% |
| Social Sciences | 0 | 0.0% |
| Engineering | 0 | 0.0% |
| Multidisciplinary Studies | 0 | 0.0% |
| Science & Technology | 50 | 48.5% |
| Business | 3 | 2.9% |
| Education | 49 | 47.6% |
| Literature & Languages | 0 | 0.0% |
| Liberal Arts & History | 0 | 0.0% |
| Visual & Performing Arts | 0 | 0.0% |
| Communications | 0 | 0.0% |
| Arts & Humanities | 1 | 1.0% |
| Total | 103 | 100.0% |
Transportation & Commute in Alpha
Vehicle Availability by Sex in Alpha
The most prevalent vehicle ownership categories in Alpha are males with 2 vehicles (12, accounting for 48.0%) and females with 2 vehicles (5, making up 17.9%).
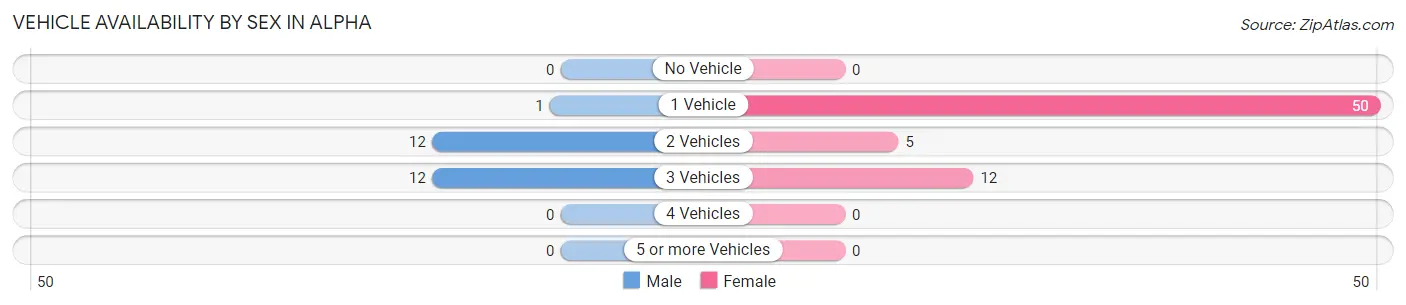
| Vehicles Available | Male | Female |
| No Vehicle | 0 (0.0%) | 0 (0.0%) |
| 1 Vehicle | 1 (4.0%) | 50 (74.6%) |
| 2 Vehicles | 12 (48.0%) | 5 (7.5%) |
| 3 Vehicles | 12 (48.0%) | 12 (17.9%) |
| 4 Vehicles | 0 (0.0%) | 0 (0.0%) |
| 5 or more Vehicles | 0 (0.0%) | 0 (0.0%) |
| Total | 25 (100.0%) | 67 (100.0%) |
Commute Time in Alpha
The most frequently occuring commute durations in Alpha are 30 to 34 minutes (50 commuters, 54.9%), 10 to 14 minutes (17 commuters, 18.7%), and 5 to 9 minutes (6 commuters, 6.6%).
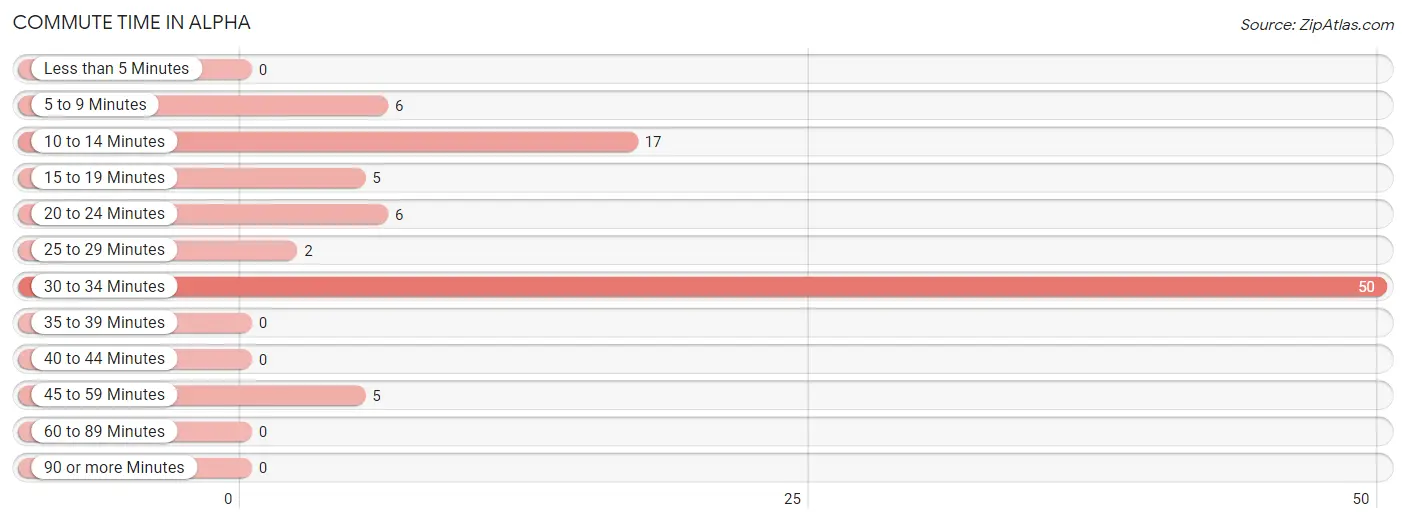
| Commute Time | # Commuters | % Commuters |
| Less than 5 Minutes | 0 | 0.0% |
| 5 to 9 Minutes | 6 | 6.6% |
| 10 to 14 Minutes | 17 | 18.7% |
| 15 to 19 Minutes | 5 | 5.5% |
| 20 to 24 Minutes | 6 | 6.6% |
| 25 to 29 Minutes | 2 | 2.2% |
| 30 to 34 Minutes | 50 | 54.9% |
| 35 to 39 Minutes | 0 | 0.0% |
| 40 to 44 Minutes | 0 | 0.0% |
| 45 to 59 Minutes | 5 | 5.5% |
| 60 to 89 Minutes | 0 | 0.0% |
| 90 or more Minutes | 0 | 0.0% |
Commute Time by Sex in Alpha
The most common commute times in Alpha are 10 to 14 minutes (11 commuters, 45.8%) for males and 30 to 34 minutes (50 commuters, 74.6%) for females.
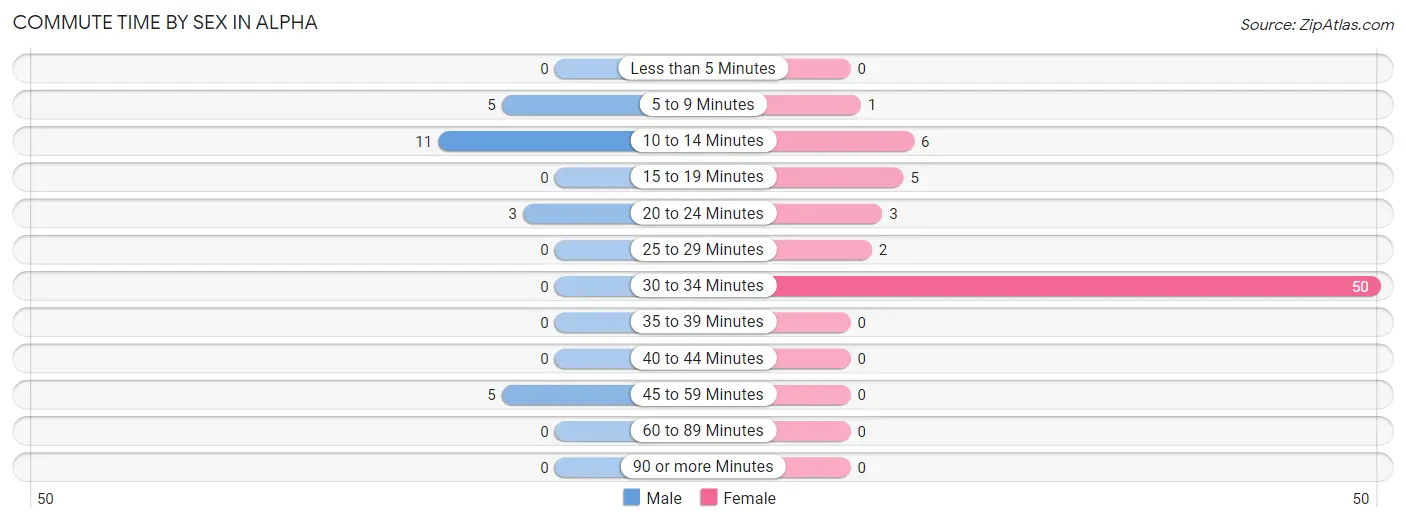
| Commute Time | Male | Female |
| Less than 5 Minutes | 0 (0.0%) | 0 (0.0%) |
| 5 to 9 Minutes | 5 (20.8%) | 1 (1.5%) |
| 10 to 14 Minutes | 11 (45.8%) | 6 (9.0%) |
| 15 to 19 Minutes | 0 (0.0%) | 5 (7.5%) |
| 20 to 24 Minutes | 3 (12.5%) | 3 (4.5%) |
| 25 to 29 Minutes | 0 (0.0%) | 2 (3.0%) |
| 30 to 34 Minutes | 0 (0.0%) | 50 (74.6%) |
| 35 to 39 Minutes | 0 (0.0%) | 0 (0.0%) |
| 40 to 44 Minutes | 0 (0.0%) | 0 (0.0%) |
| 45 to 59 Minutes | 5 (20.8%) | 0 (0.0%) |
| 60 to 89 Minutes | 0 (0.0%) | 0 (0.0%) |
| 90 or more Minutes | 0 (0.0%) | 0 (0.0%) |
Time of Departure to Work by Sex in Alpha
The most frequent times of departure to work in Alpha are 6:00 AM to 6:29 AM (7, 29.2%) for males and 12:00 PM to 3:59 PM (52, 77.6%) for females.
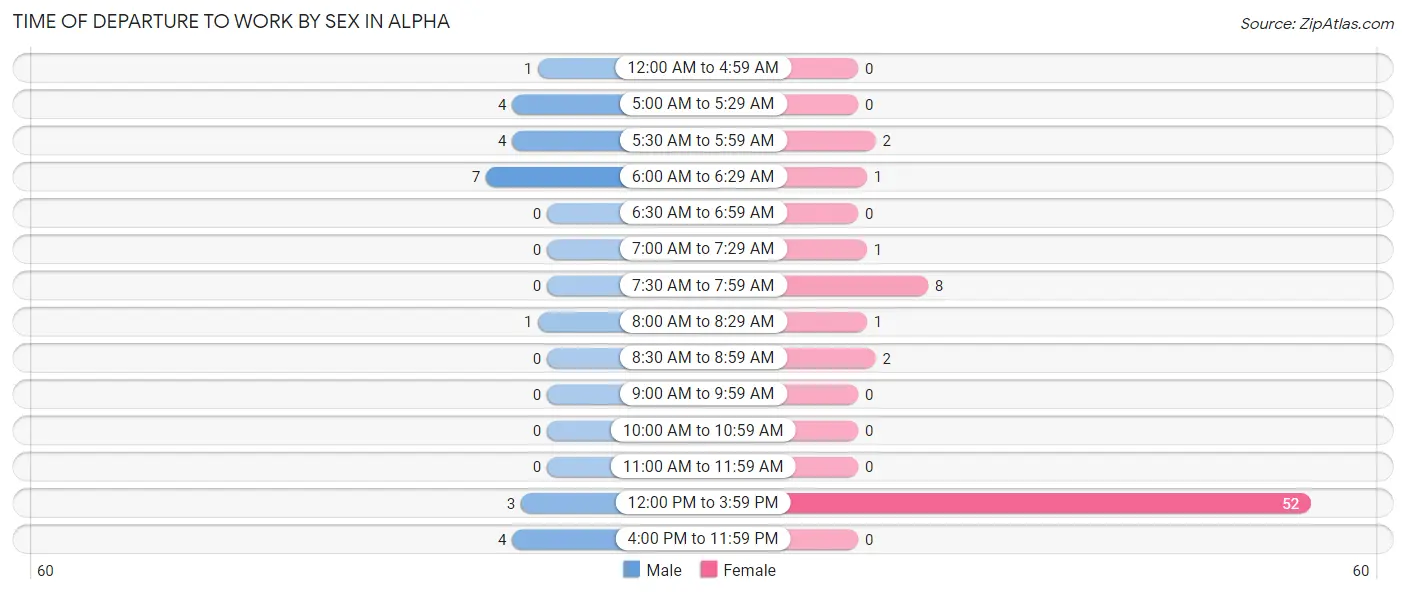
| Time of Departure | Male | Female |
| 12:00 AM to 4:59 AM | 1 (4.2%) | 0 (0.0%) |
| 5:00 AM to 5:29 AM | 4 (16.7%) | 0 (0.0%) |
| 5:30 AM to 5:59 AM | 4 (16.7%) | 2 (3.0%) |
| 6:00 AM to 6:29 AM | 7 (29.2%) | 1 (1.5%) |
| 6:30 AM to 6:59 AM | 0 (0.0%) | 0 (0.0%) |
| 7:00 AM to 7:29 AM | 0 (0.0%) | 1 (1.5%) |
| 7:30 AM to 7:59 AM | 0 (0.0%) | 8 (11.9%) |
| 8:00 AM to 8:29 AM | 1 (4.2%) | 1 (1.5%) |
| 8:30 AM to 8:59 AM | 0 (0.0%) | 2 (3.0%) |
| 9:00 AM to 9:59 AM | 0 (0.0%) | 0 (0.0%) |
| 10:00 AM to 10:59 AM | 0 (0.0%) | 0 (0.0%) |
| 11:00 AM to 11:59 AM | 0 (0.0%) | 0 (0.0%) |
| 12:00 PM to 3:59 PM | 3 (12.5%) | 52 (77.6%) |
| 4:00 PM to 11:59 PM | 4 (16.7%) | 0 (0.0%) |
| Total | 24 (100.0%) | 67 (100.0%) |
Housing Occupancy in Alpha
Occupancy by Ownership in Alpha
Of the total 79 dwellings in Alpha, owner-occupied units account for 72 (91.1%), while renter-occupied units make up 7 (8.9%).
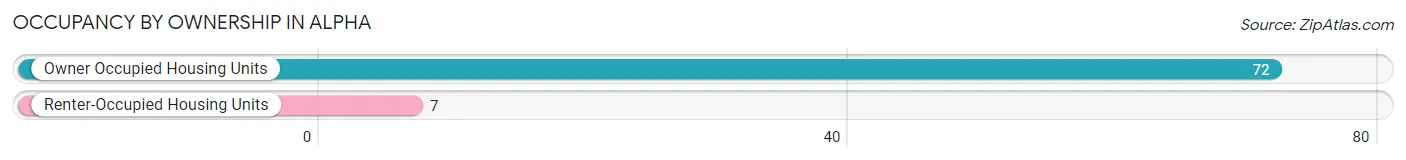
| Occupancy | # Housing Units | % Housing Units |
| Owner Occupied Housing Units | 72 | 91.1% |
| Renter-Occupied Housing Units | 7 | 8.9% |
| Total Occupied Housing Units | 79 | 100.0% |
Occupancy by Household Size in Alpha
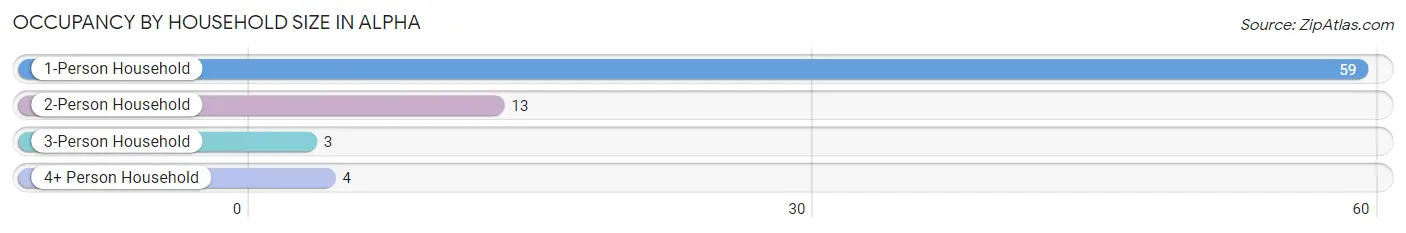
| Household Size | # Housing Units | % Housing Units |
| 1-Person Household | 59 | 74.7% |
| 2-Person Household | 13 | 16.5% |
| 3-Person Household | 3 | 3.8% |
| 4+ Person Household | 4 | 5.1% |
| Total Housing Units | 79 | 100.0% |
Occupancy by Ownership by Household Size in Alpha
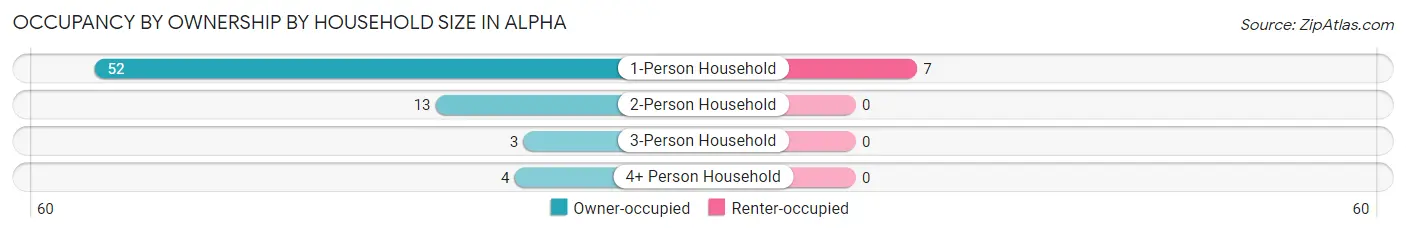
| Household Size | Owner-occupied | Renter-occupied |
| 1-Person Household | 52 (88.1%) | 7 (11.9%) |
| 2-Person Household | 13 (100.0%) | 0 (0.0%) |
| 3-Person Household | 3 (100.0%) | 0 (0.0%) |
| 4+ Person Household | 4 (100.0%) | 0 (0.0%) |
| Total Housing Units | 72 (91.1%) | 7 (8.9%) |
Occupancy by Educational Attainment in Alpha
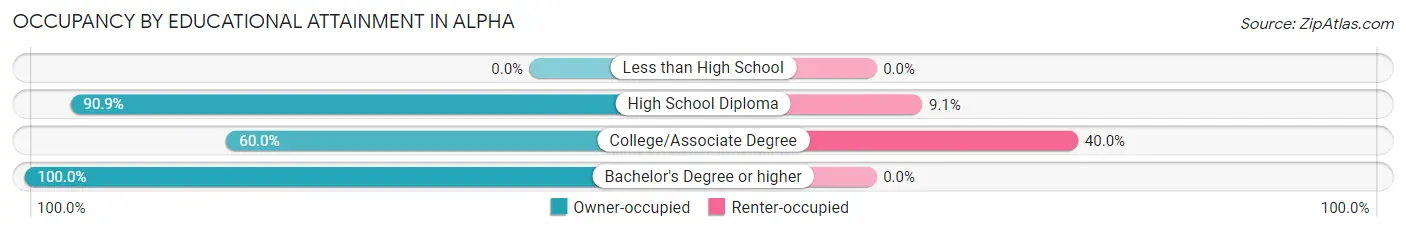
| Household Size | Owner-occupied | Renter-occupied |
| Less than High School | 0 (0.0%) | 0 (0.0%) |
| High School Diploma | 10 (90.9%) | 1 (9.1%) |
| College/Associate Degree | 9 (60.0%) | 6 (40.0%) |
| Bachelor's Degree or higher | 53 (100.0%) | 0 (0.0%) |
Occupancy by Age of Householder in Alpha
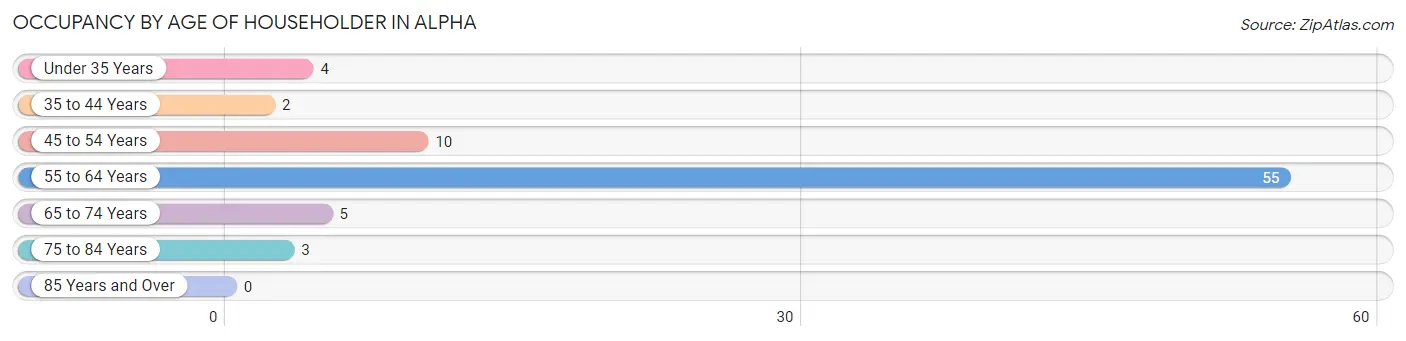
| Age Bracket | # Households | % Households |
| Under 35 Years | 4 | 5.1% |
| 35 to 44 Years | 2 | 2.5% |
| 45 to 54 Years | 10 | 12.7% |
| 55 to 64 Years | 55 | 69.6% |
| 65 to 74 Years | 5 | 6.3% |
| 75 to 84 Years | 3 | 3.8% |
| 85 Years and Over | 0 | 0.0% |
| Total | 79 | 100.0% |
Housing Finances in Alpha
Median Income by Occupancy in Alpha
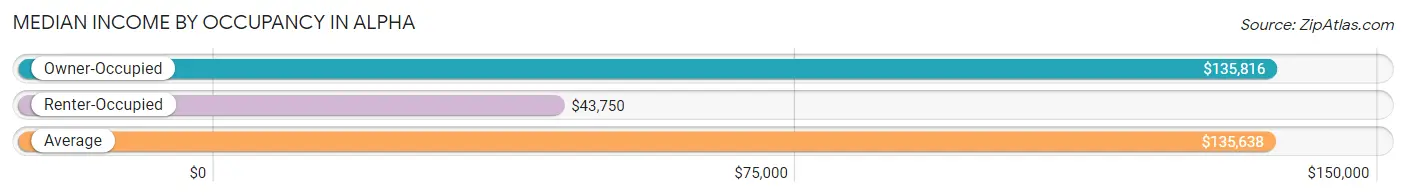
| Occupancy Type | # Households | Median Income |
| Owner-Occupied | 72 (91.1%) | $135,816 |
| Renter-Occupied | 7 (8.9%) | $43,750 |
| Average | 79 (100.0%) | $135,638 |
Occupancy by Householder Income Bracket in Alpha
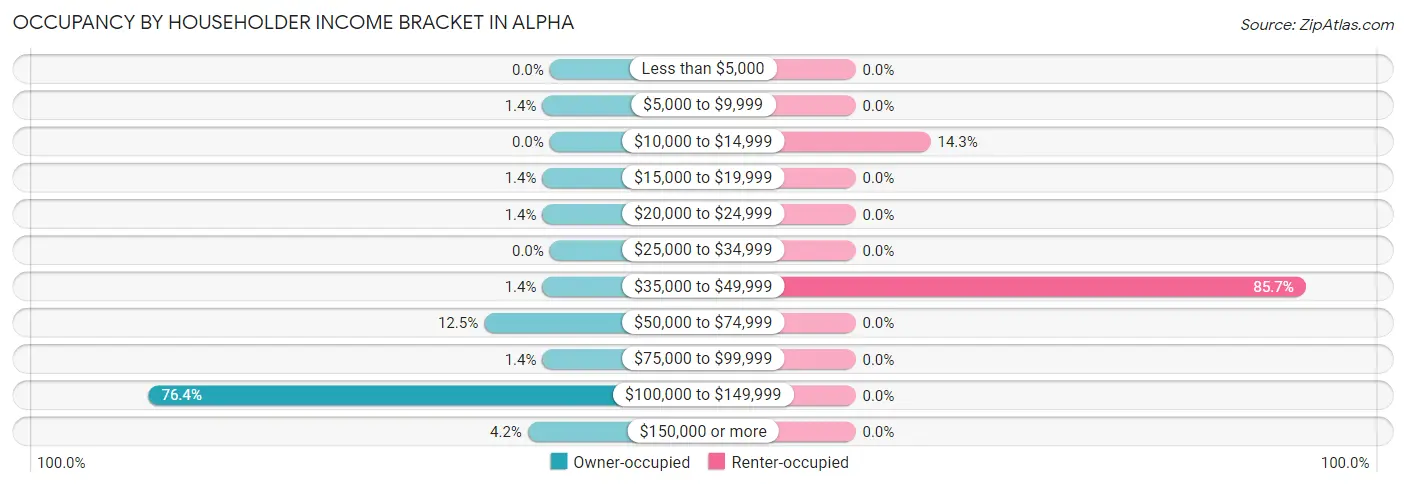
| Income Bracket | Owner-occupied | Renter-occupied |
| Less than $5,000 | 0 (0.0%) | 0 (0.0%) |
| $5,000 to $9,999 | 1 (1.4%) | 0 (0.0%) |
| $10,000 to $14,999 | 0 (0.0%) | 1 (14.3%) |
| $15,000 to $19,999 | 1 (1.4%) | 0 (0.0%) |
| $20,000 to $24,999 | 1 (1.4%) | 0 (0.0%) |
| $25,000 to $34,999 | 0 (0.0%) | 0 (0.0%) |
| $35,000 to $49,999 | 1 (1.4%) | 6 (85.7%) |
| $50,000 to $74,999 | 9 (12.5%) | 0 (0.0%) |
| $75,000 to $99,999 | 1 (1.4%) | 0 (0.0%) |
| $100,000 to $149,999 | 55 (76.4%) | 0 (0.0%) |
| $150,000 or more | 3 (4.2%) | 0 (0.0%) |
| Total | 72 (100.0%) | 7 (100.0%) |
Monthly Housing Cost Tiers in Alpha
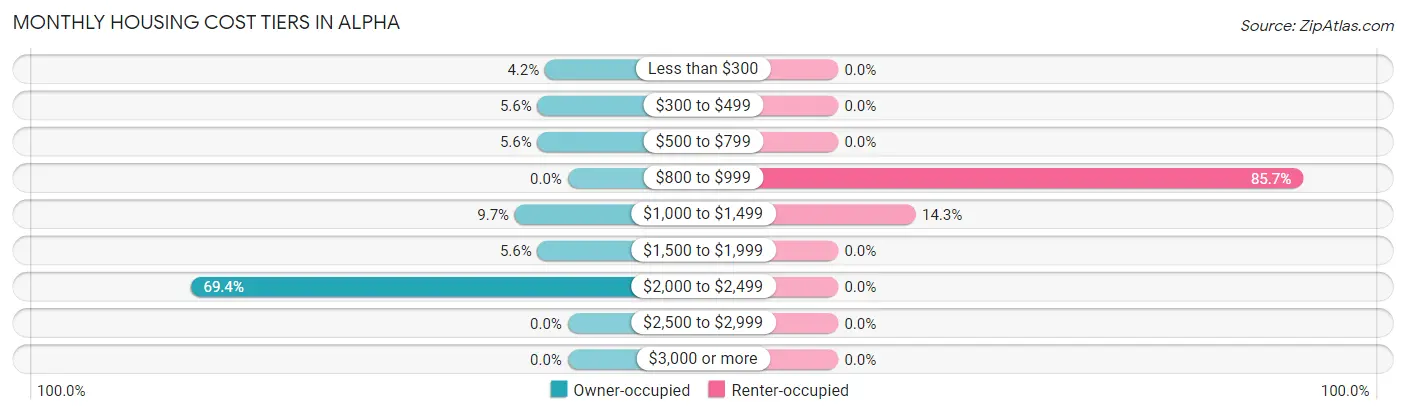
| Monthly Cost | Owner-occupied | Renter-occupied |
| Less than $300 | 3 (4.2%) | 0 (0.0%) |
| $300 to $499 | 4 (5.6%) | 0 (0.0%) |
| $500 to $799 | 4 (5.6%) | 0 (0.0%) |
| $800 to $999 | 0 (0.0%) | 6 (85.7%) |
| $1,000 to $1,499 | 7 (9.7%) | 1 (14.3%) |
| $1,500 to $1,999 | 4 (5.6%) | 0 (0.0%) |
| $2,000 to $2,499 | 50 (69.4%) | 0 (0.0%) |
| $2,500 to $2,999 | 0 (0.0%) | 0 (0.0%) |
| $3,000 or more | 0 (0.0%) | 0 (0.0%) |
| Total | 72 (100.0%) | 7 (100.0%) |
Physical Housing Characteristics in Alpha
Housing Structures in Alpha
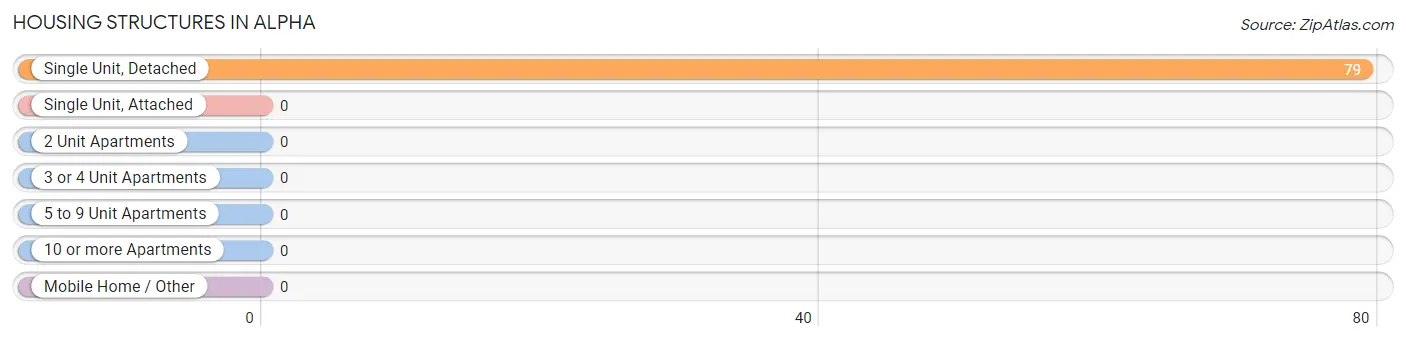
| Structure Type | # Housing Units | % Housing Units |
| Single Unit, Detached | 79 | 100.0% |
| Single Unit, Attached | 0 | 0.0% |
| 2 Unit Apartments | 0 | 0.0% |
| 3 or 4 Unit Apartments | 0 | 0.0% |
| 5 to 9 Unit Apartments | 0 | 0.0% |
| 10 or more Apartments | 0 | 0.0% |
| Mobile Home / Other | 0 | 0.0% |
| Total | 79 | 100.0% |
Housing Structures by Occupancy in Alpha
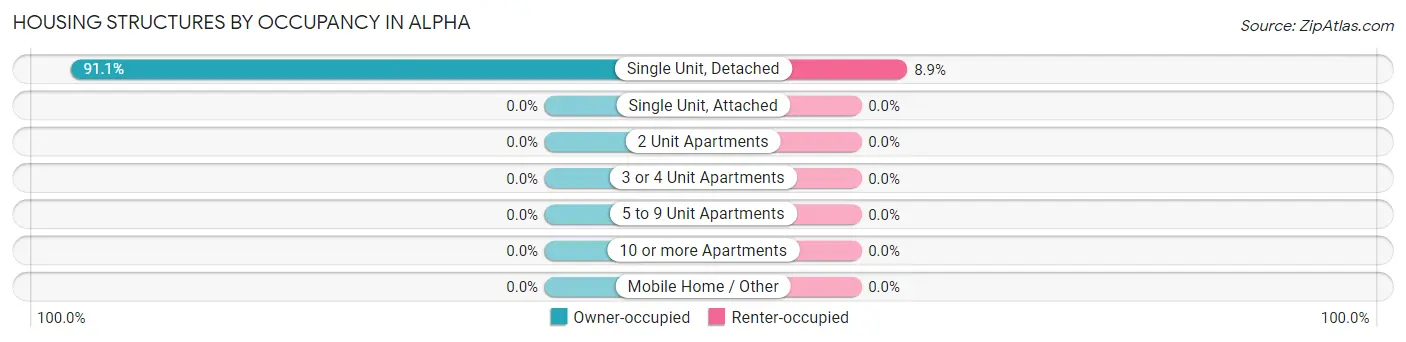
| Structure Type | Owner-occupied | Renter-occupied |
| Single Unit, Detached | 72 (91.1%) | 7 (8.9%) |
| Single Unit, Attached | 0 (0.0%) | 0 (0.0%) |
| 2 Unit Apartments | 0 (0.0%) | 0 (0.0%) |
| 3 or 4 Unit Apartments | 0 (0.0%) | 0 (0.0%) |
| 5 to 9 Unit Apartments | 0 (0.0%) | 0 (0.0%) |
| 10 or more Apartments | 0 (0.0%) | 0 (0.0%) |
| Mobile Home / Other | 0 (0.0%) | 0 (0.0%) |
| Total | 72 (91.1%) | 7 (8.9%) |
Housing Structures by Number of Rooms in Alpha
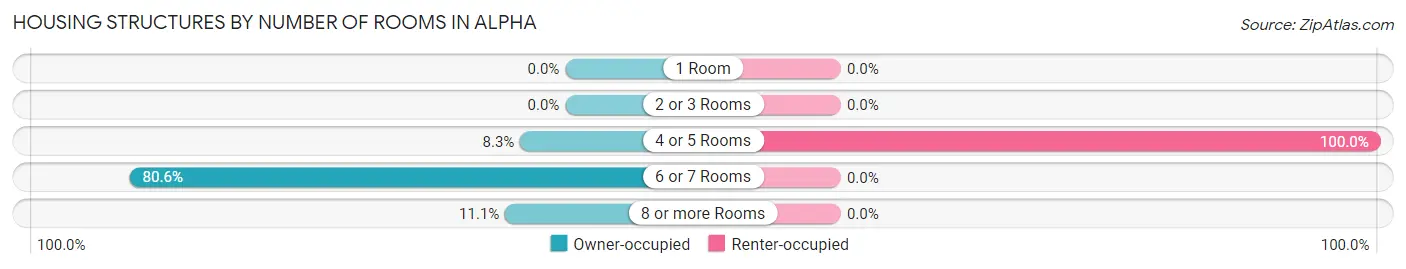
| Number of Rooms | Owner-occupied | Renter-occupied |
| 1 Room | 0 (0.0%) | 0 (0.0%) |
| 2 or 3 Rooms | 0 (0.0%) | 0 (0.0%) |
| 4 or 5 Rooms | 6 (8.3%) | 7 (100.0%) |
| 6 or 7 Rooms | 58 (80.6%) | 0 (0.0%) |
| 8 or more Rooms | 8 (11.1%) | 0 (0.0%) |
| Total | 72 (100.0%) | 7 (100.0%) |
Housing Structure by Heating Type in Alpha
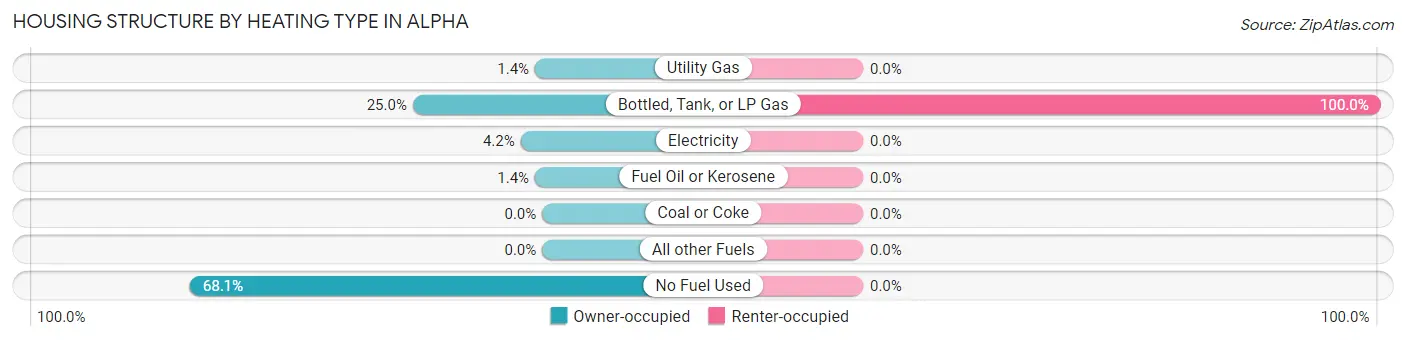
| Heating Type | Owner-occupied | Renter-occupied |
| Utility Gas | 1 (1.4%) | 0 (0.0%) |
| Bottled, Tank, or LP Gas | 18 (25.0%) | 7 (100.0%) |
| Electricity | 3 (4.2%) | 0 (0.0%) |
| Fuel Oil or Kerosene | 1 (1.4%) | 0 (0.0%) |
| Coal or Coke | 0 (0.0%) | 0 (0.0%) |
| All other Fuels | 0 (0.0%) | 0 (0.0%) |
| No Fuel Used | 49 (68.1%) | 0 (0.0%) |
| Total | 72 (100.0%) | 7 (100.0%) |
Household Vehicle Usage in Alpha
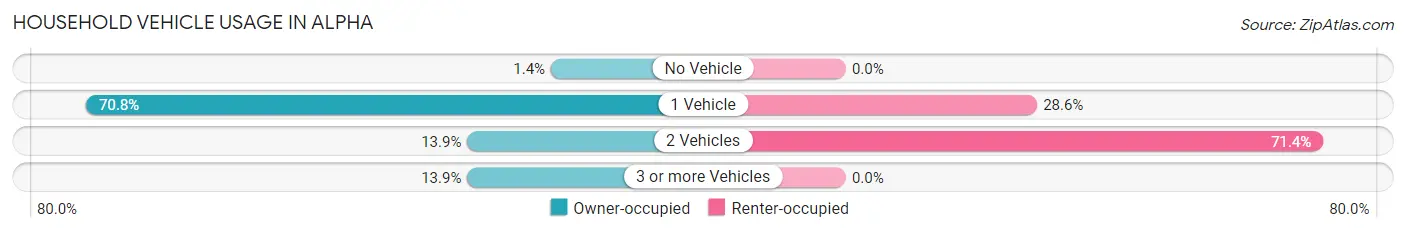
| Vehicles per Household | Owner-occupied | Renter-occupied |
| No Vehicle | 1 (1.4%) | 0 (0.0%) |
| 1 Vehicle | 51 (70.8%) | 2 (28.6%) |
| 2 Vehicles | 10 (13.9%) | 5 (71.4%) |
| 3 or more Vehicles | 10 (13.9%) | 0 (0.0%) |
| Total | 72 (100.0%) | 7 (100.0%) |
Real Estate & Mortgages in Alpha
Real Estate and Mortgage Overview in Alpha
| Characteristic | Without Mortgage | With Mortgage |
| Housing Units | 10 | 62 |
| Median Property Value | $75,000 | $56,100 |
| Median Household Income | $85,000 | $1 |
| Monthly Housing Costs | $333 | $0 |
| Real Estate Taxes | $700 | $0 |
Property Value by Mortgage Status in Alpha
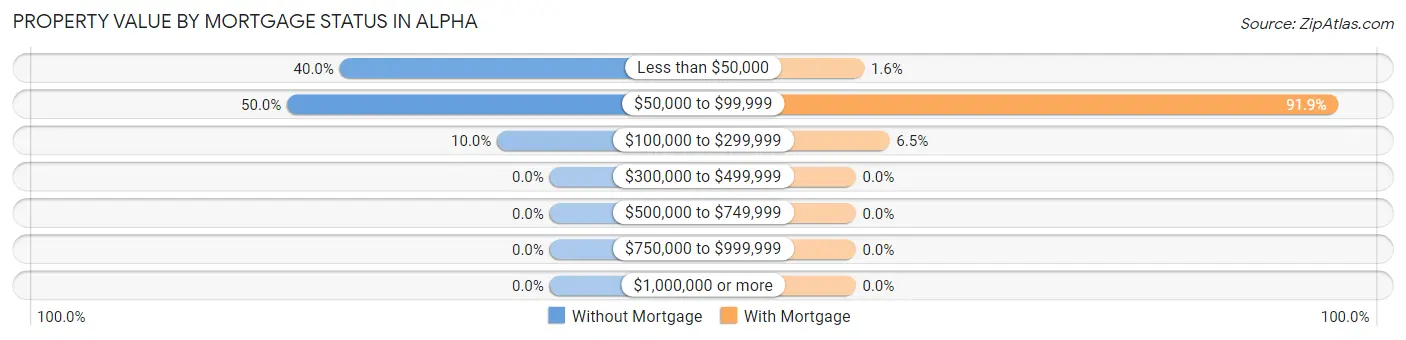
| Property Value | Without Mortgage | With Mortgage |
| Less than $50,000 | 4 (40.0%) | 1 (1.6%) |
| $50,000 to $99,999 | 5 (50.0%) | 57 (91.9%) |
| $100,000 to $299,999 | 1 (10.0%) | 4 (6.5%) |
| $300,000 to $499,999 | 0 (0.0%) | 0 (0.0%) |
| $500,000 to $749,999 | 0 (0.0%) | 0 (0.0%) |
| $750,000 to $999,999 | 0 (0.0%) | 0 (0.0%) |
| $1,000,000 or more | 0 (0.0%) | 0 (0.0%) |
| Total | 10 (100.0%) | 62 (100.0%) |
Household Income by Mortgage Status in Alpha
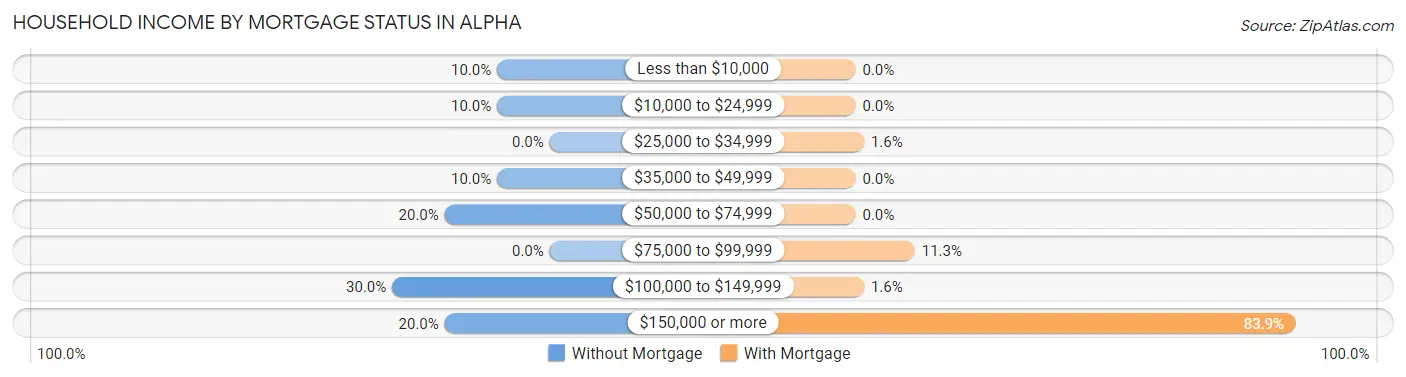
| Household Income | Without Mortgage | With Mortgage |
| Less than $10,000 | 1 (10.0%) | 0 (0.0%) |
| $10,000 to $24,999 | 1 (10.0%) | 0 (0.0%) |
| $25,000 to $34,999 | 0 (0.0%) | 1 (1.6%) |
| $35,000 to $49,999 | 1 (10.0%) | 0 (0.0%) |
| $50,000 to $74,999 | 2 (20.0%) | 0 (0.0%) |
| $75,000 to $99,999 | 0 (0.0%) | 7 (11.3%) |
| $100,000 to $149,999 | 3 (30.0%) | 1 (1.6%) |
| $150,000 or more | 2 (20.0%) | 52 (83.9%) |
| Total | 10 (100.0%) | 62 (100.0%) |
Property Value to Household Income Ratio in Alpha
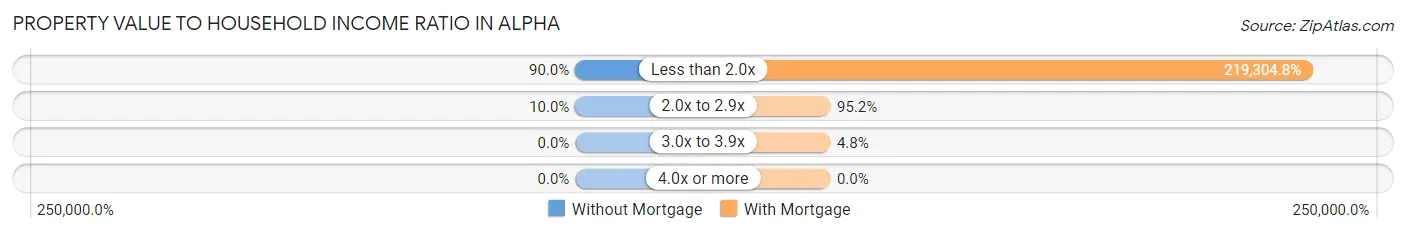
| Value-to-Income Ratio | Without Mortgage | With Mortgage |
| Less than 2.0x | 9 (90.0%) | 135,969 (219,304.8%) |
| 2.0x to 2.9x | 1 (10.0%) | 59 (95.2%) |
| 3.0x to 3.9x | 0 (0.0%) | 3 (4.8%) |
| 4.0x or more | 0 (0.0%) | 0 (0.0%) |
| Total | 10 (100.0%) | 62 (100.0%) |
Real Estate Taxes by Mortgage Status in Alpha
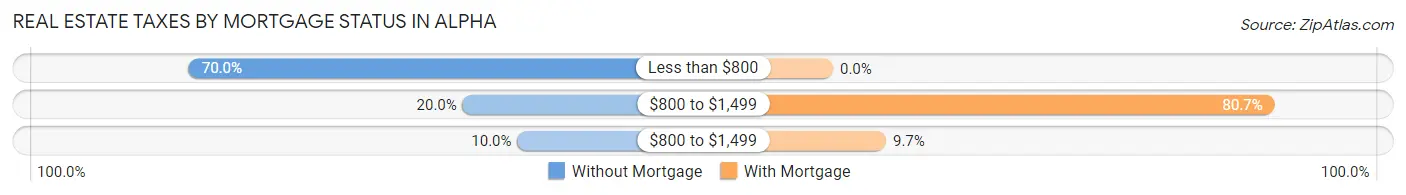
| Property Taxes | Without Mortgage | With Mortgage |
| Less than $800 | 7 (70.0%) | 0 (0.0%) |
| $800 to $1,499 | 2 (20.0%) | 50 (80.6%) |
| $800 to $1,499 | 1 (10.0%) | 6 (9.7%) |
| Total | 10 (100.0%) | 62 (100.0%) |
Health & Disability in Alpha
Health Insurance Coverage by Age in Alpha
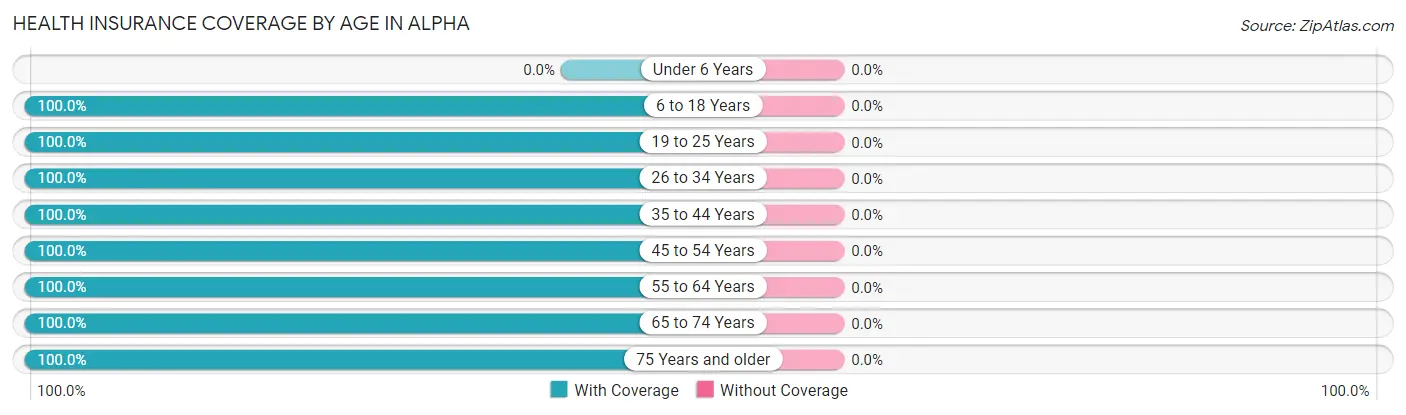
| Age Bracket | With Coverage | Without Coverage |
| Under 6 Years | 0 (0.0%) | 0 (0.0%) |
| 6 to 18 Years | 13 (100.0%) | 0 (0.0%) |
| 19 to 25 Years | 2 (100.0%) | 0 (0.0%) |
| 26 to 34 Years | 4 (100.0%) | 0 (0.0%) |
| 35 to 44 Years | 10 (100.0%) | 0 (0.0%) |
| 45 to 54 Years | 14 (100.0%) | 0 (0.0%) |
| 55 to 64 Years | 58 (100.0%) | 0 (0.0%) |
| 65 to 74 Years | 9 (100.0%) | 0 (0.0%) |
| 75 Years and older | 4 (100.0%) | 0 (0.0%) |
| Total | 114 (100.0%) | 0 (0.0%) |
Health Insurance Coverage by Citizenship Status in Alpha
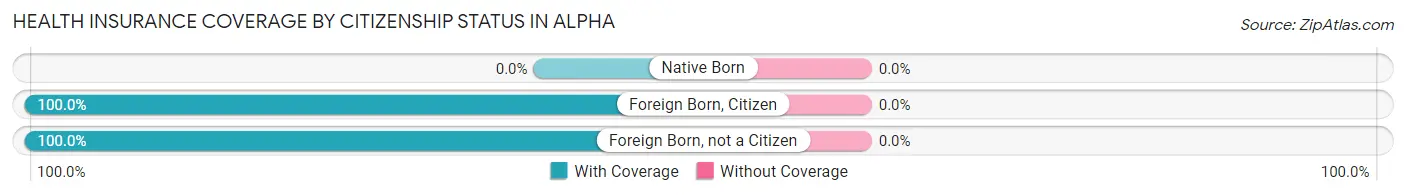
| Citizenship Status | With Coverage | Without Coverage |
| Native Born | 0 (0.0%) | 0 (0.0%) |
| Foreign Born, Citizen | 13 (100.0%) | 0 (0.0%) |
| Foreign Born, not a Citizen | 2 (100.0%) | 0 (0.0%) |
Health Insurance Coverage by Household Income in Alpha
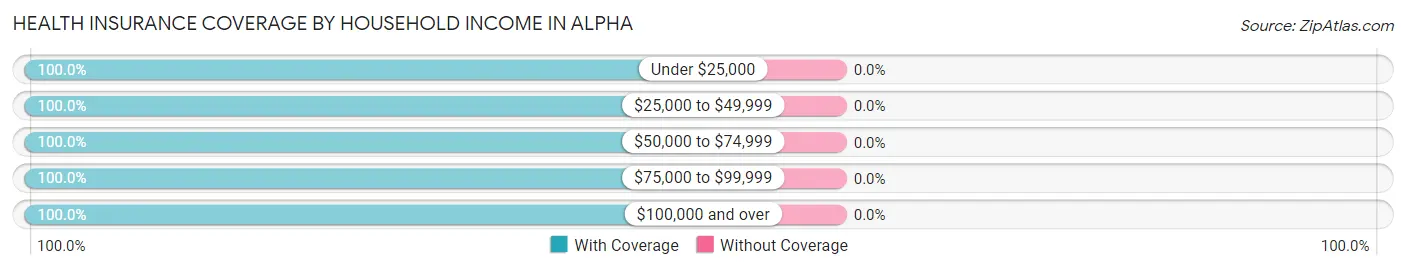
| Household Income | With Coverage | Without Coverage |
| Under $25,000 | 4 (100.0%) | 0 (0.0%) |
| $25,000 to $49,999 | 9 (100.0%) | 0 (0.0%) |
| $50,000 to $74,999 | 26 (100.0%) | 0 (0.0%) |
| $75,000 to $99,999 | 2 (100.0%) | 0 (0.0%) |
| $100,000 and over | 73 (100.0%) | 0 (0.0%) |
Public vs Private Health Insurance Coverage by Age in Alpha
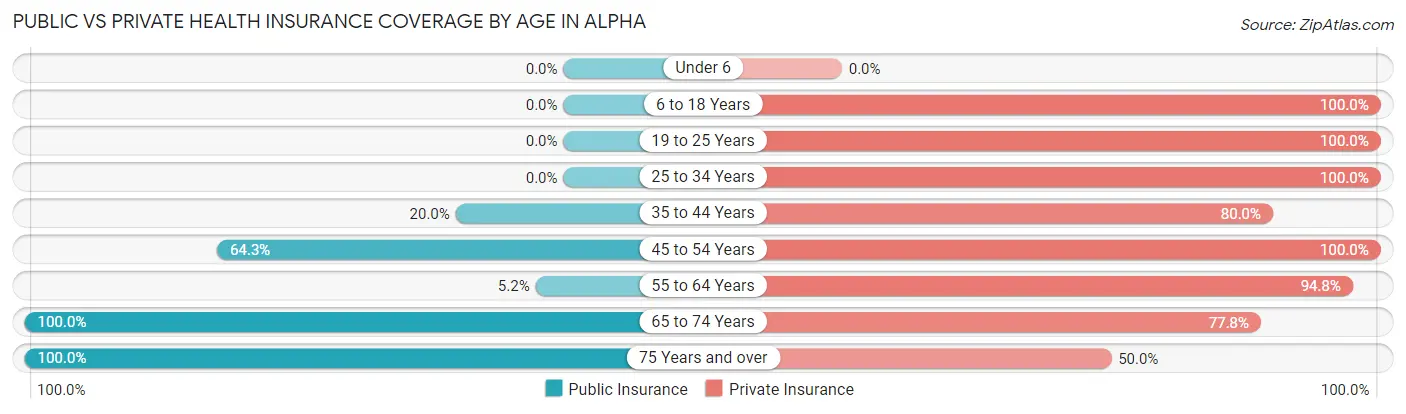
| Age Bracket | Public Insurance | Private Insurance |
| Under 6 | 0 (0.0%) | 0 (0.0%) |
| 6 to 18 Years | 0 (0.0%) | 13 (100.0%) |
| 19 to 25 Years | 0 (0.0%) | 2 (100.0%) |
| 25 to 34 Years | 0 (0.0%) | 4 (100.0%) |
| 35 to 44 Years | 2 (20.0%) | 8 (80.0%) |
| 45 to 54 Years | 9 (64.3%) | 14 (100.0%) |
| 55 to 64 Years | 3 (5.2%) | 55 (94.8%) |
| 65 to 74 Years | 9 (100.0%) | 7 (77.8%) |
| 75 Years and over | 4 (100.0%) | 2 (50.0%) |
| Total | 27 (23.7%) | 105 (92.1%) |
Disability Status by Sex by Age in Alpha
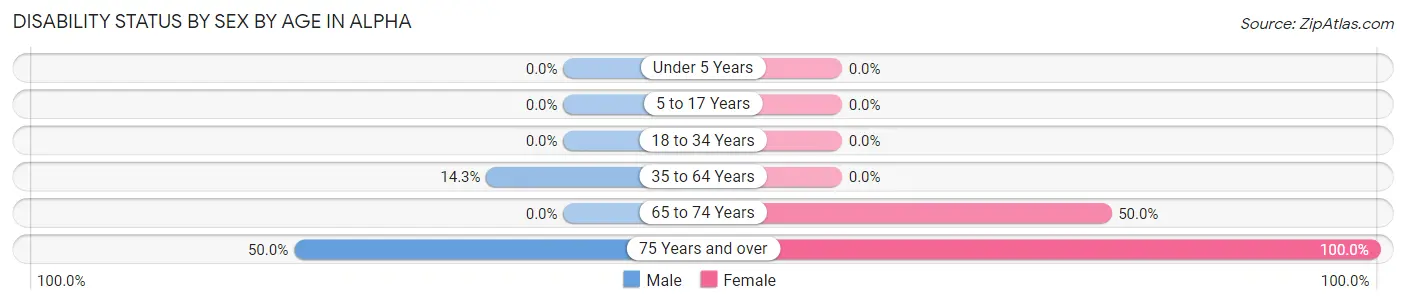
| Age Bracket | Male | Female |
| Under 5 Years | 0 (0.0%) | 0 (0.0%) |
| 5 to 17 Years | 0 (0.0%) | 0 (0.0%) |
| 18 to 34 Years | 0 (0.0%) | 0 (0.0%) |
| 35 to 64 Years | 3 (14.3%) | 0 (0.0%) |
| 65 to 74 Years | 0 (0.0%) | 2 (50.0%) |
| 75 Years and over | 1 (50.0%) | 2 (100.0%) |
Disability Class by Sex by Age in Alpha
Disability Class: Hearing Difficulty
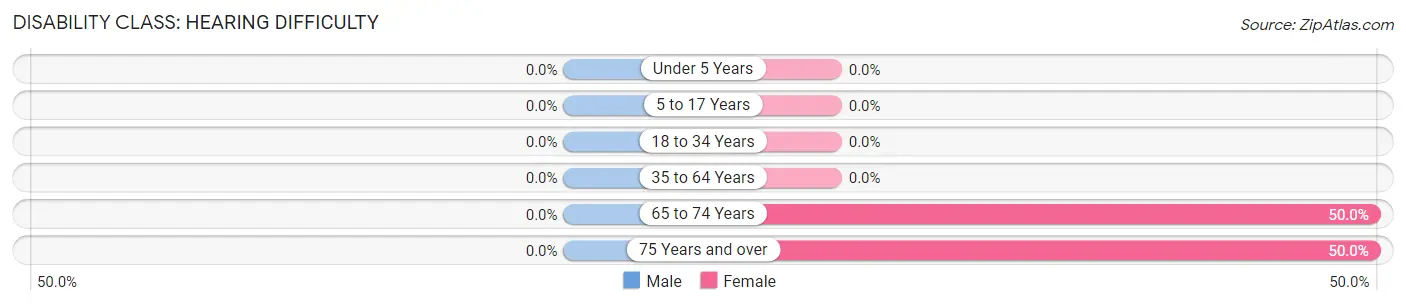
| Age Bracket | Male | Female |
| Under 5 Years | 0 (0.0%) | 0 (0.0%) |
| 5 to 17 Years | 0 (0.0%) | 0 (0.0%) |
| 18 to 34 Years | 0 (0.0%) | 0 (0.0%) |
| 35 to 64 Years | 0 (0.0%) | 0 (0.0%) |
| 65 to 74 Years | 0 (0.0%) | 2 (50.0%) |
| 75 Years and over | 0 (0.0%) | 1 (50.0%) |
Disability Class: Vision Difficulty
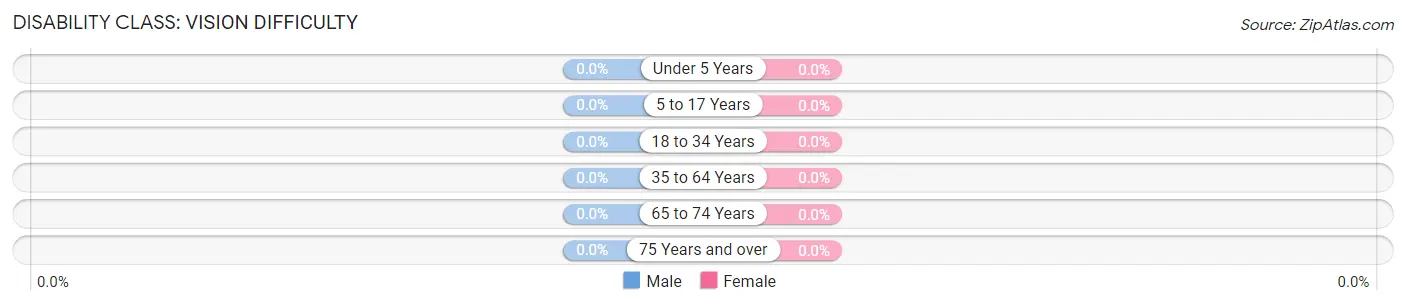
| Age Bracket | Male | Female |
| Under 5 Years | 0 (0.0%) | 0 (0.0%) |
| 5 to 17 Years | 0 (0.0%) | 0 (0.0%) |
| 18 to 34 Years | 0 (0.0%) | 0 (0.0%) |
| 35 to 64 Years | 0 (0.0%) | 0 (0.0%) |
| 65 to 74 Years | 0 (0.0%) | 0 (0.0%) |
| 75 Years and over | 0 (0.0%) | 0 (0.0%) |
Disability Class: Cognitive Difficulty
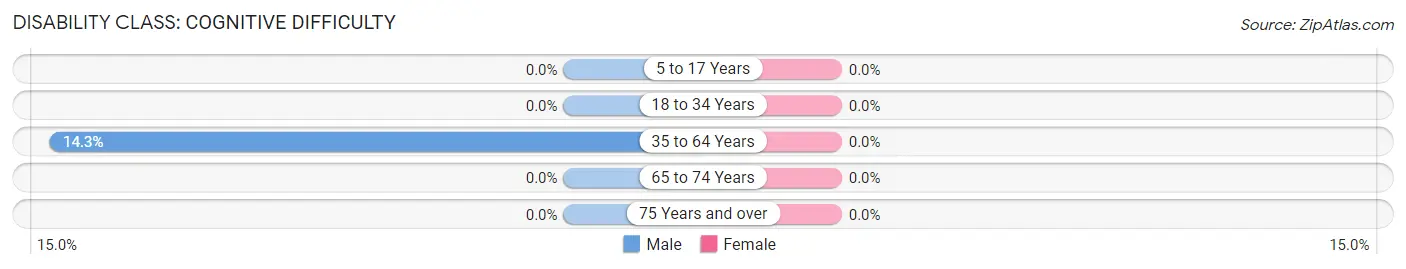
| Age Bracket | Male | Female |
| 5 to 17 Years | 0 (0.0%) | 0 (0.0%) |
| 18 to 34 Years | 0 (0.0%) | 0 (0.0%) |
| 35 to 64 Years | 3 (14.3%) | 0 (0.0%) |
| 65 to 74 Years | 0 (0.0%) | 0 (0.0%) |
| 75 Years and over | 0 (0.0%) | 0 (0.0%) |
Disability Class: Ambulatory Difficulty
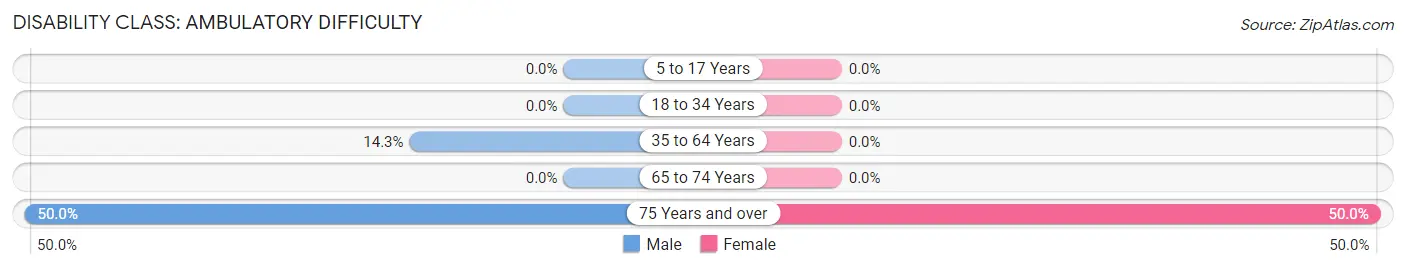
| Age Bracket | Male | Female |
| 5 to 17 Years | 0 (0.0%) | 0 (0.0%) |
| 18 to 34 Years | 0 (0.0%) | 0 (0.0%) |
| 35 to 64 Years | 3 (14.3%) | 0 (0.0%) |
| 65 to 74 Years | 0 (0.0%) | 0 (0.0%) |
| 75 Years and over | 1 (50.0%) | 1 (50.0%) |
Disability Class: Self-Care Difficulty
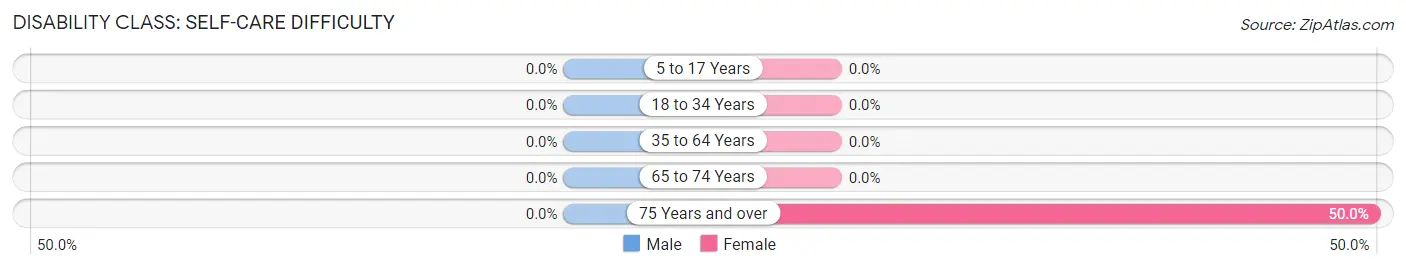
| Age Bracket | Male | Female |
| 5 to 17 Years | 0 (0.0%) | 0 (0.0%) |
| 18 to 34 Years | 0 (0.0%) | 0 (0.0%) |
| 35 to 64 Years | 0 (0.0%) | 0 (0.0%) |
| 65 to 74 Years | 0 (0.0%) | 0 (0.0%) |
| 75 Years and over | 0 (0.0%) | 1 (50.0%) |
Technology Access in Alpha
Computing Device Access in Alpha
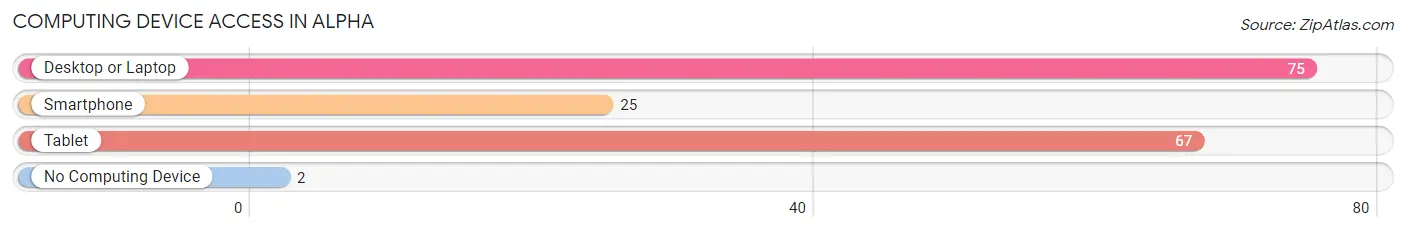
| Device Type | # Households | % Households |
| Desktop or Laptop | 75 | 94.9% |
| Smartphone | 25 | 31.7% |
| Tablet | 67 | 84.8% |
| No Computing Device | 2 | 2.5% |
| Total | 79 | 100.0% |
Internet Access in Alpha
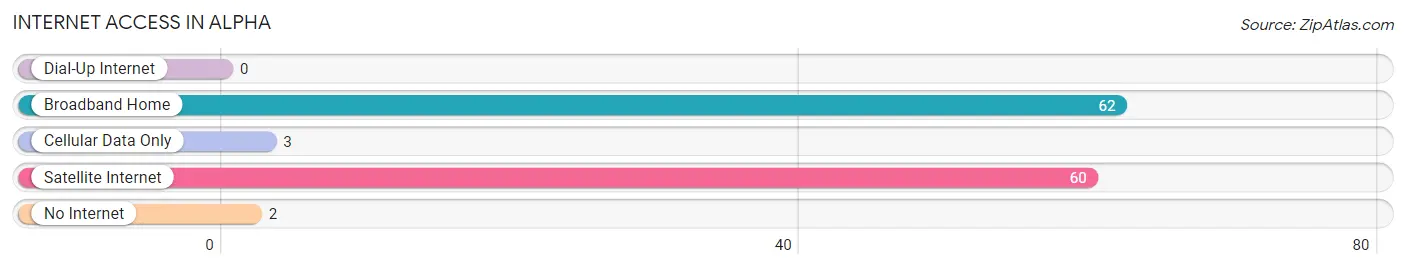
| Internet Type | # Households | % Households |
| Dial-Up Internet | 0 | 0.0% |
| Broadband Home | 62 | 78.5% |
| Cellular Data Only | 3 | 3.8% |
| Satellite Internet | 60 | 75.9% |
| No Internet | 2 | 2.5% |
| Total | 79 | 100.0% |
Alpha Summary
Minnesota is a state located in the Midwestern United States. It is bordered by Wisconsin to the east, Iowa to the south, North Dakota and South Dakota to the west, and the Canadian provinces of Ontario and Manitoba to the north. Minnesota is the 12th largest state in the United States, with an area of 86,943 square miles (225,181 km2). It is the 21st most populous state, with a population of 5.6 million people as of 2020.
Geography
Minnesota is located in the Upper Midwest region of the United States. It is bordered by Wisconsin to the east, Iowa to the south, North Dakota and South Dakota to the west, and the Canadian provinces of Ontario and Manitoba to the north. Minnesota is the 12th largest state in the United States, with an area of 86,943 square miles (225,181 km2). It is the 21st most populous state, with a population of 5.6 million people as of 2020.
Minnesota is divided into 87 counties and contains 87 incorporated cities. The state is divided into five distinct geographic regions: the Minnesota River Valley, the Iron Range, the North Woods, the Central Plains, and the Twin Cities metropolitan area. The state is home to the Boundary Waters Canoe Area Wilderness, the largest wilderness area in the United States east of the Mississippi River.
History
The area that is now Minnesota was first inhabited by Native American tribes, including the Dakota, Ojibwe, and Sioux. The first Europeans to explore the area were French fur traders, who arrived in the late 17th century. The area was part of the French colony of New France until 1763, when it was ceded to Great Britain after the French and Indian War. The area was then part of the British colony of Canada until 1803, when it was ceded to the United States as part of the Louisiana Purchase.
In 1805, the Minnesota Territory was organized, and in 1858, Minnesota became the 32nd state in the Union. During the Civil War, Minnesota was a Union state and provided more than 40,000 soldiers to the Union Army. After the war, Minnesota experienced rapid growth and development, becoming an important center of industry and agriculture.
Economy
Minnesota has a diversified economy, with a mix of industries including agriculture, manufacturing, technology, and services. The state is a major producer of corn, soybeans, and hogs, and is also a major producer of dairy products. Minnesota is also a major producer of iron ore, and is home to the world’s largest iron ore mine, located in the city of Hibbing.
Manufacturing is a major part of the state’s economy, with products ranging from medical devices to food products. Minnesota is also a major producer of computer and electronic products, and is home to several major technology companies, including 3M, Best Buy, and Cargill.
The state’s service sector is also a major contributor to the economy, with major industries including finance, insurance, real estate, and health care. Tourism is also an important part of the economy, with the state’s many lakes and forests attracting visitors from around the world.
Demographics
As of 2020, the population of Minnesota was estimated to be 5.6 million people. The state is predominantly white, with 84.2% of the population identifying as white. The largest minority groups are African Americans (5.7%), Hispanics (4.9%), and Asians (3.2%).
Minnesota is also home to a large number of immigrants, with 11.2% of the population being foreign-born. The largest immigrant groups are from Mexico (25.3%), India (7.2%), and Somalia (6.2%).
Minnesota is also home to a large number of Native Americans, with 1.5% of the population identifying as Native American. The largest Native American tribes in the state are the Ojibwe, Dakota, and Sioux.
Conclusion
Minnesota is a state located in the Midwestern United States. It is bordered by Wisconsin to the east, Iowa to the south, North Dakota and South Dakota to the west, and the Canadian provinces of Ontario and Manitoba to the north. Minnesota is the 12th largest state in the United States, with an area of 86,943 square miles (225,181 km2). It is the 21st most populous state, with a population of 5.6 million people as of 2020. Minnesota has a diversified economy, with a mix of industries including agriculture, manufacturing, technology, and services. The state is predominantly white, with 84.2% of the population identifying as white. The largest minority groups are African Americans (5.7%), Hispanics (4.9%), and Asians (3.2%). Minnesota is also home to a large number of immigrants, with 11.2% of the population being foreign-born. The largest Native American tribes in the state are the Ojibwe, Dakota, and Sioux.
Common Questions
What is Per Capita Income in Alpha?
Per Capita income in Alpha is $80,502.
What is the Median Family Income in Alpha?
Median Family Income in Alpha is $81,250.
What is the Median Household income in Alpha?
Median Household Income in Alpha is $135,638.
What is Income or Wage Gap in Alpha?
Income or Wage Gap in Alpha is 30.5%.
Women in Alpha earn 69.5 cents for every dollar earned by a man.
What is Inequality or Gini Index in Alpha?
Inequality or Gini Index in Alpha is 0.18.
What is the Total Population of Alpha?
Total Population of Alpha is 114.
What is the Total Male Population of Alpha?
Total Male Population of Alpha is 34.
What is the Total Female Population of Alpha?
Total Female Population of Alpha is 80.
What is the Ratio of Males per 100 Females in Alpha?
There are 42.50 Males per 100 Females in Alpha.
What is the Ratio of Females per 100 Males in Alpha?
There are 235.29 Females per 100 Males in Alpha.
What is the Median Population Age in Alpha?
Median Population Age in Alpha is 60.2 Years.
What is the Average Family Size in Alpha
Average Family Size in Alpha is 2.8 People.
What is the Average Household Size in Alpha
Average Household Size in Alpha is 1.4 People.
How Large is the Labor Force in Alpha?
There are 92 People in the Labor Forcein in Alpha.
What is the Percentage of People in the Labor Force in Alpha?
85.2% of People are in the Labor Force in Alpha.