Pine Ridge, AL Map & Demographics
Pine Ridge Map
Pine Ridge Overview
$20,543
PER CAPITA INCOME
$78,500
AVG FAMILY INCOME
$77,969
AVG HOUSEHOLD INCOME
28.6%
WAGE / INCOME GAP [ % ]
71.4¢/ $1
WAGE / INCOME GAP [ $ ]
0.32
INEQUALITY / GINI INDEX
635
TOTAL POPULATION
316
MALE POPULATION
319
FEMALE POPULATION
99.06
MALES / 100 FEMALES
100.95
FEMALES / 100 MALES
26.6
MEDIAN AGE
3.6
AVG FAMILY SIZE
3.4
AVG HOUSEHOLD SIZE
319
LABOR FORCE [ PEOPLE ]
60.6%
PERCENT IN LABOR FORCE
2.5%
UNEMPLOYMENT RATE
Pine Ridge Area Codes
Income in Pine Ridge
Income Overview in Pine Ridge
Per Capita Income in Pine Ridge is $20,543, while median incomes of families and households are $78,500 and $77,969 respectively.
| Characteristic | Number | Measure |
| Per Capita Income | 635 | $20,543 |
| Median Family Income | 160 | $78,500 |
| Mean Family Income | 160 | $79,921 |
| Median Household Income | 187 | $77,969 |
| Mean Household Income | 187 | $75,272 |
| Income Deficit | 160 | $0 |
| Wage / Income Gap (%) | 635 | 28.57% |
| Wage / Income Gap ($) | 635 | 71.43¢ per $1 |
| Gini / Inequality Index | 635 | 0.32 |
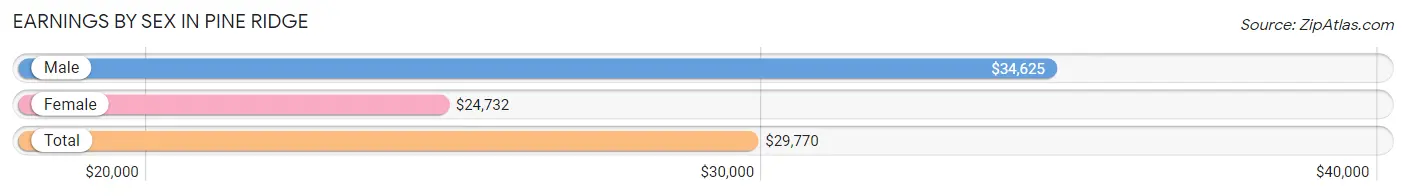
Earnings by Sex in Pine Ridge
Average Earnings in Pine Ridge are $29,770, $34,625 for men and $24,732 for women, a difference of 28.6%.
| Sex | Number | Average Earnings |
| Male | 157 (49.2%) | $34,625 |
| Female | 162 (50.8%) | $24,732 |
| Total | 319 (100.0%) | $29,770 |
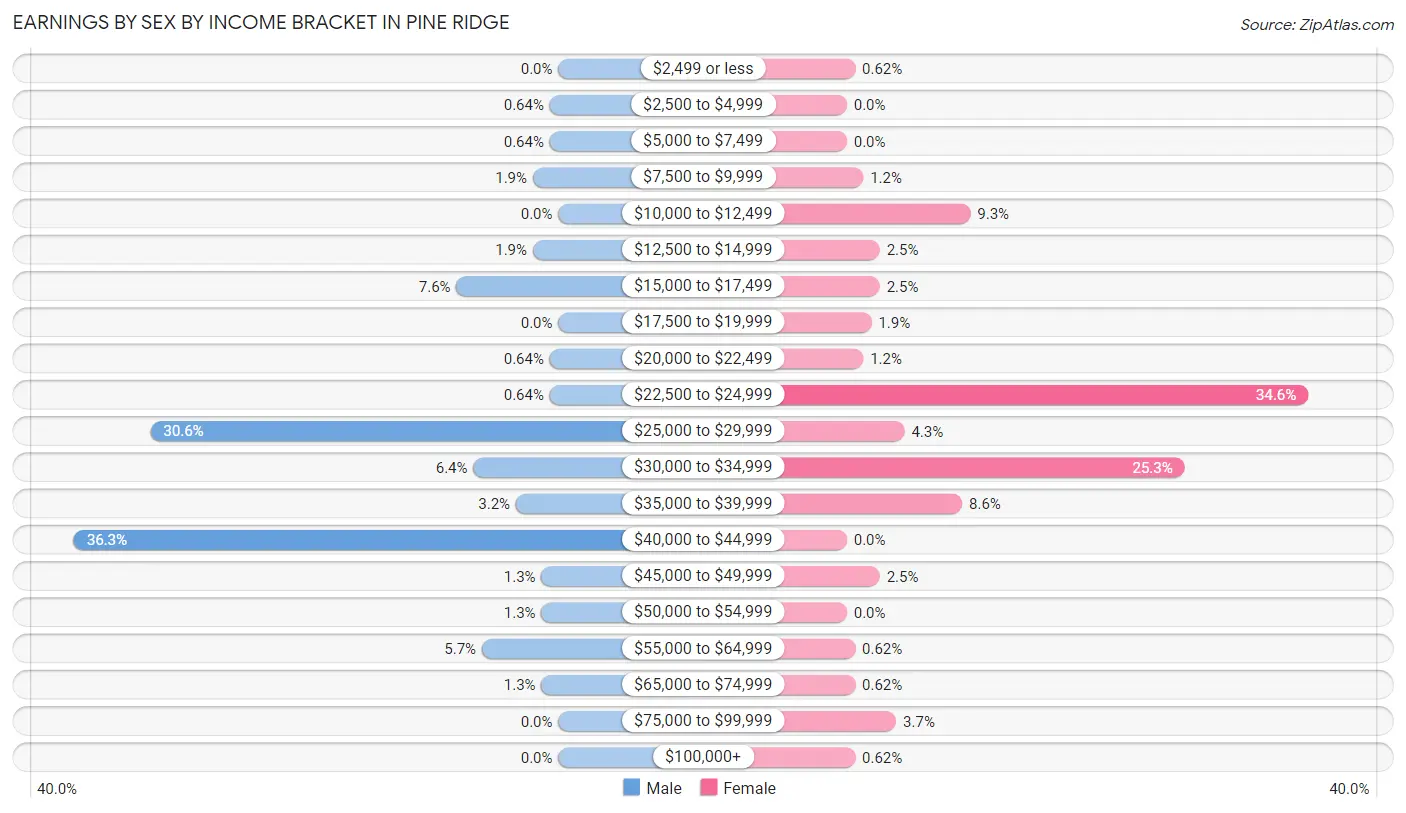
Earnings by Sex by Income Bracket in Pine Ridge
The most common earnings brackets in Pine Ridge are $40,000 to $44,999 for men (57 | 36.3%) and $22,500 to $24,999 for women (56 | 34.6%).
| Income | Male | Female |
| $2,499 or less | 0 (0.0%) | 1 (0.6%) |
| $2,500 to $4,999 | 1 (0.6%) | 0 (0.0%) |
| $5,000 to $7,499 | 1 (0.6%) | 0 (0.0%) |
| $7,500 to $9,999 | 3 (1.9%) | 2 (1.2%) |
| $10,000 to $12,499 | 0 (0.0%) | 15 (9.3%) |
| $12,500 to $14,999 | 3 (1.9%) | 4 (2.5%) |
| $15,000 to $17,499 | 12 (7.6%) | 4 (2.5%) |
| $17,500 to $19,999 | 0 (0.0%) | 3 (1.8%) |
| $20,000 to $22,499 | 1 (0.6%) | 2 (1.2%) |
| $22,500 to $24,999 | 1 (0.6%) | 56 (34.6%) |
| $25,000 to $29,999 | 48 (30.6%) | 7 (4.3%) |
| $30,000 to $34,999 | 10 (6.4%) | 41 (25.3%) |
| $35,000 to $39,999 | 5 (3.2%) | 14 (8.6%) |
| $40,000 to $44,999 | 57 (36.3%) | 0 (0.0%) |
| $45,000 to $49,999 | 2 (1.3%) | 4 (2.5%) |
| $50,000 to $54,999 | 2 (1.3%) | 0 (0.0%) |
| $55,000 to $64,999 | 9 (5.7%) | 1 (0.6%) |
| $65,000 to $74,999 | 2 (1.3%) | 1 (0.6%) |
| $75,000 to $99,999 | 0 (0.0%) | 6 (3.7%) |
| $100,000+ | 0 (0.0%) | 1 (0.6%) |
| Total | 157 (100.0%) | 162 (100.0%) |
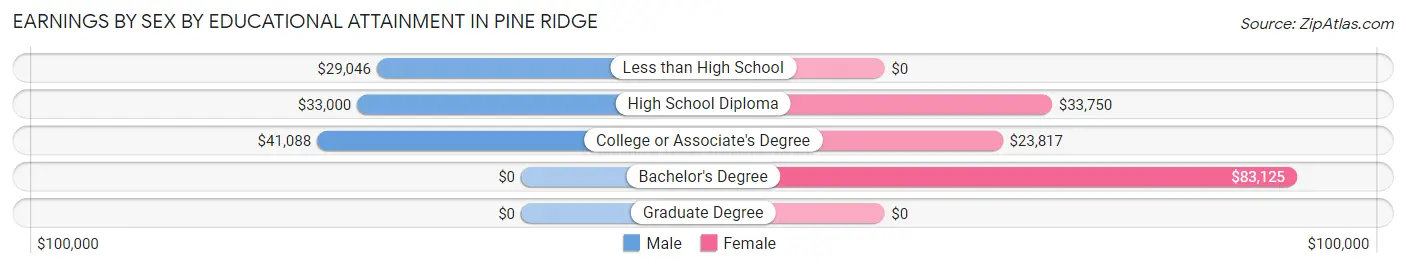
Earnings by Sex by Educational Attainment in Pine Ridge
Average earnings in Pine Ridge are $34,750 for men and $24,129 for women, a difference of 30.6%. Men with an educational attainment of college or associate's degree enjoy the highest average annual earnings of $41,088, while those with less than high school education earn the least with $29,046. Women with an educational attainment of bachelor's degree earn the most with the average annual earnings of $83,125, while those with college or associate's degree education have the smallest earnings of $23,817.
| Educational Attainment | Male Income | Female Income |
| Less than High School | $29,046 | $0 |
| High School Diploma | $33,000 | $33,750 |
| College or Associate's Degree | $41,088 | $23,817 |
| Bachelor's Degree | - | - |
| Graduate Degree | - | - |
| Total | $34,750 | $24,129 |
Family Income in Pine Ridge
Family Income Brackets in Pine Ridge
According to the Pine Ridge family income data, there are 48 families falling into the $100,000 to $149,999 income range, which is the most common income bracket and makes up 30.0% of all families.
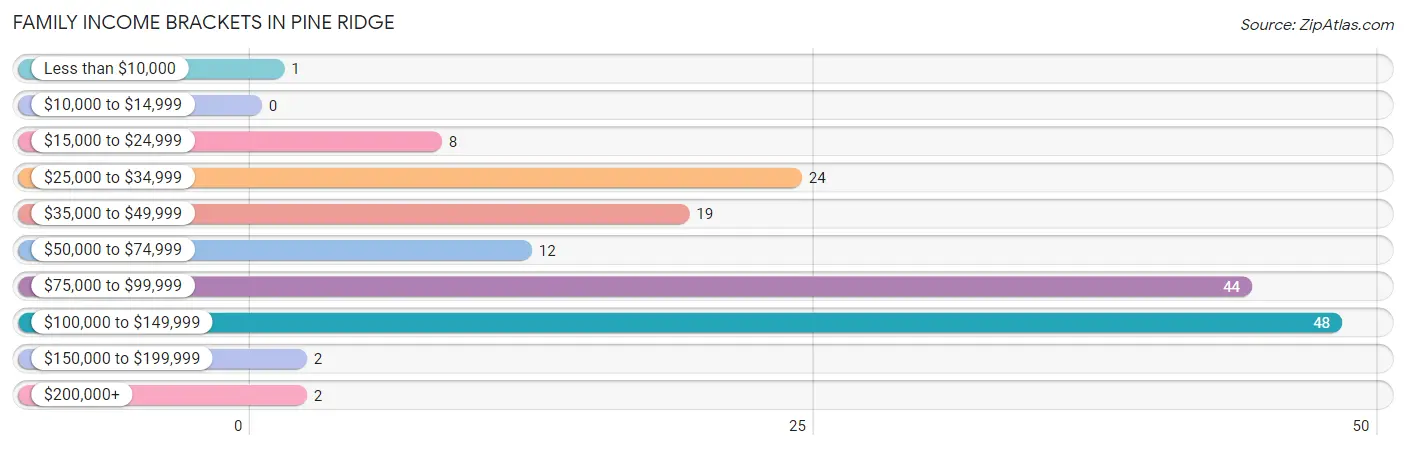
| Income Bracket | # Families | % Families |
| Less than $10,000 | 1 | 0.6% |
| $10,000 to $14,999 | 0 | 0.0% |
| $15,000 to $24,999 | 8 | 5.0% |
| $25,000 to $34,999 | 24 | 15.0% |
| $35,000 to $49,999 | 19 | 11.9% |
| $50,000 to $74,999 | 12 | 7.5% |
| $75,000 to $99,999 | 44 | 27.5% |
| $100,000 to $149,999 | 48 | 30.0% |
| $150,000 to $199,999 | 2 | 1.3% |
| $200,000+ | 2 | 1.3% |
Family Income by Famaliy Size in Pine Ridge
5-person families (44 | 27.5%) account for the highest median family income in Pine Ridge with $78,553 per family, while 5-person families (44 | 27.5%) have the highest median income of $15,711 per family member.
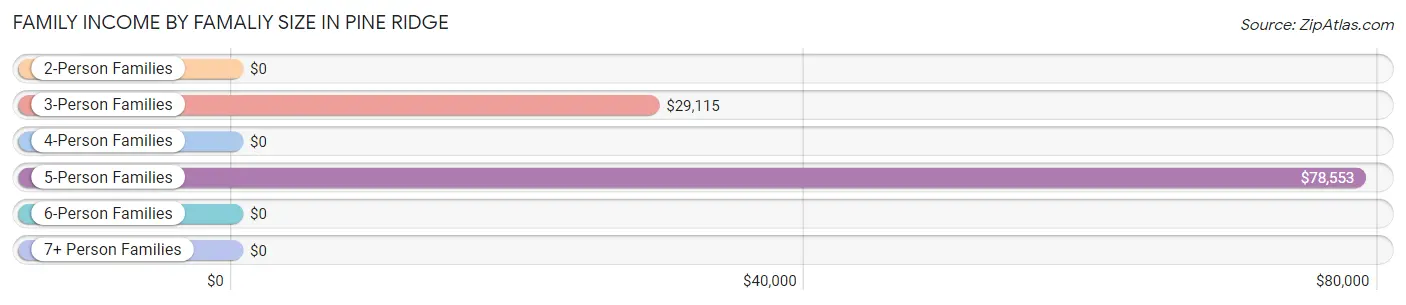
| Income Bracket | # Families | Median Income |
| 2-Person Families | 34 (21.2%) | $0 |
| 3-Person Families | 33 (20.6%) | $29,115 |
| 4-Person Families | 14 (8.7%) | $0 |
| 5-Person Families | 44 (27.5%) | $78,553 |
| 6-Person Families | 35 (21.9%) | $0 |
| 7+ Person Families | 0 (0.0%) | $0 |
| Total | 160 (100.0%) | $78,500 |
Family Income by Number of Earners in Pine Ridge
The median family income in Pine Ridge is $78,500, with families comprising 3+ earners (38) having the highest median family income of $116,143, while families with 1 earner (39) have the lowest median family income of $29,427, accounting for 23.7% and 24.4% of families, respectively.
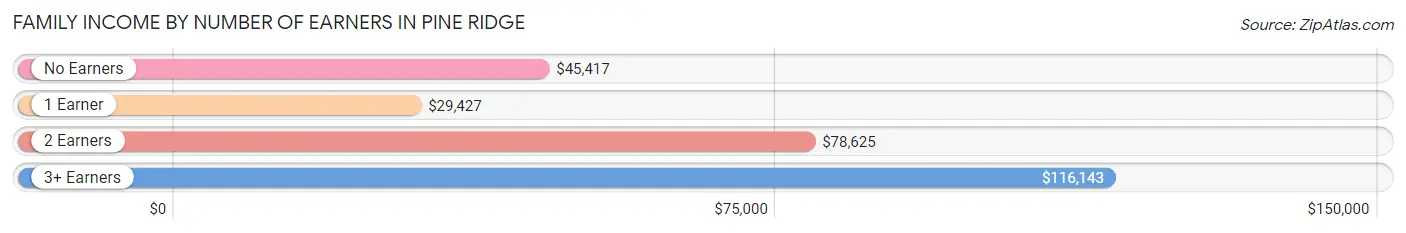
| Number of Earners | # Families | Median Income |
| No Earners | 17 (10.6%) | $45,417 |
| 1 Earner | 39 (24.4%) | $29,427 |
| 2 Earners | 66 (41.2%) | $78,625 |
| 3+ Earners | 38 (23.7%) | $116,143 |
| Total | 160 (100.0%) | $78,500 |
Household Income in Pine Ridge
Household Income Brackets in Pine Ridge
With 49 households falling in the category, the $75,000 to $99,999 income range is the most frequent in Pine Ridge, accounting for 26.2% of all households. In contrast, only 2 households (1.1%) fall into the $150,000 to $199,999 income bracket, making it the least populous group.
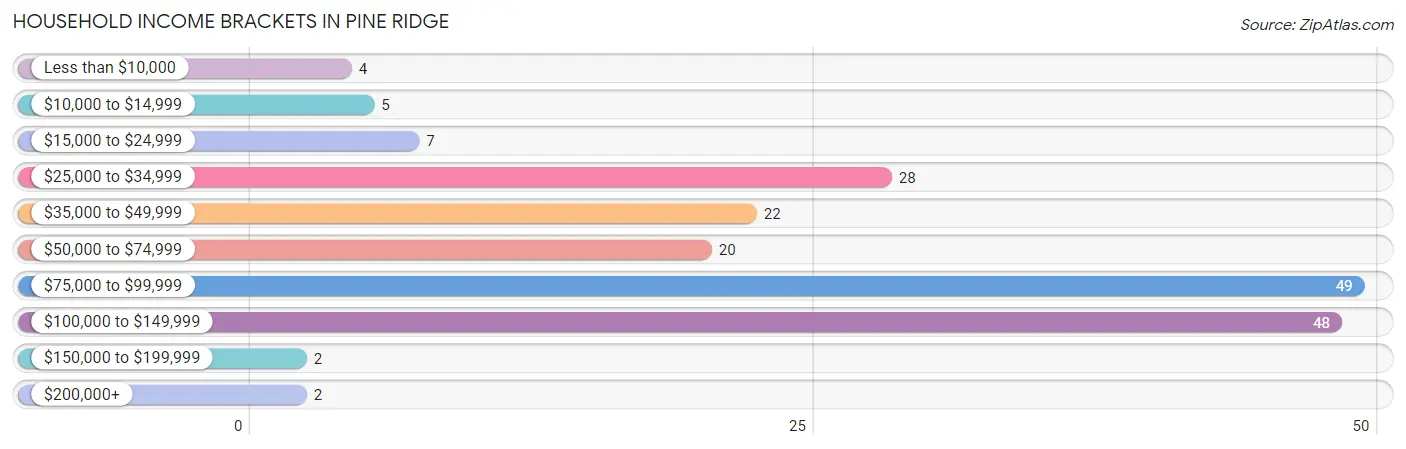
| Income Bracket | # Households | % Households |
| Less than $10,000 | 4 | 2.1% |
| $10,000 to $14,999 | 5 | 2.7% |
| $15,000 to $24,999 | 7 | 3.7% |
| $25,000 to $34,999 | 28 | 15.0% |
| $35,000 to $49,999 | 22 | 11.8% |
| $50,000 to $74,999 | 20 | 10.7% |
| $75,000 to $99,999 | 49 | 26.2% |
| $100,000 to $149,999 | 48 | 25.7% |
| $150,000 to $199,999 | 2 | 1.1% |
| $200,000+ | 2 | 1.1% |
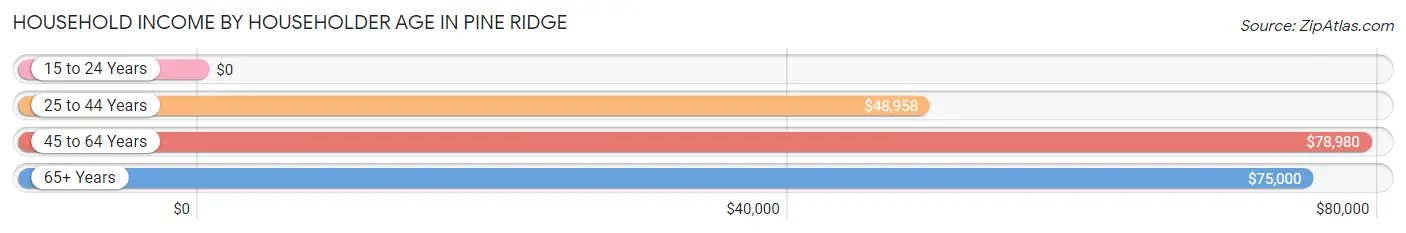
Household Income by Householder Age in Pine Ridge
The median household income in Pine Ridge is $77,969, with the highest median household income of $78,980 found in the 45 to 64 years age bracket for the primary householder. A total of 129 households (69.0%) fall into this category. Meanwhile, the 15 to 24 years age bracket for the primary householder has the lowest median household income of $0, with 1 households (0.5%) in this group.
| Income Bracket | # Households | Median Income |
| 15 to 24 Years | 1 (0.5%) | $0 |
| 25 to 44 Years | 33 (17.6%) | $48,958 |
| 45 to 64 Years | 129 (69.0%) | $78,980 |
| 65+ Years | 24 (12.8%) | $75,000 |
| Total | 187 (100.0%) | $77,969 |
Poverty in Pine Ridge
Income Below Poverty by Sex and Age in Pine Ridge
With 10.2% poverty level for males and 5.5% for females among the residents of Pine Ridge, 5 year old males and 5 year old females are the most vulnerable to poverty, with 3 males (42.9%) and 4 females (100.0%) in their respective age groups living below the poverty level.
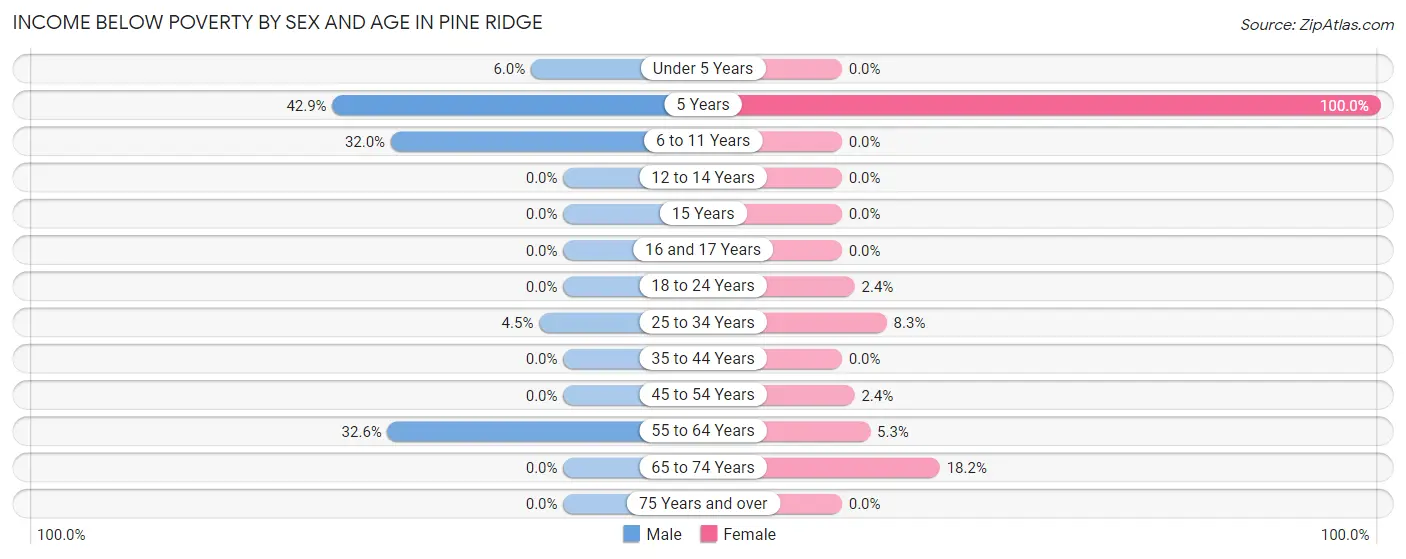
| Age Bracket | Male | Female |
| Under 5 Years | 3 (6.0%) | 0 (0.0%) |
| 5 Years | 3 (42.9%) | 4 (100.0%) |
| 6 to 11 Years | 8 (32.0%) | 0 (0.0%) |
| 12 to 14 Years | 0 (0.0%) | 0 (0.0%) |
| 15 Years | 0 (0.0%) | 0 (0.0%) |
| 16 and 17 Years | 0 (0.0%) | 0 (0.0%) |
| 18 to 24 Years | 0 (0.0%) | 1 (2.4%) |
| 25 to 34 Years | 3 (4.5%) | 7 (8.3%) |
| 35 to 44 Years | 0 (0.0%) | 0 (0.0%) |
| 45 to 54 Years | 0 (0.0%) | 2 (2.4%) |
| 55 to 64 Years | 15 (32.6%) | 1 (5.3%) |
| 65 to 74 Years | 0 (0.0%) | 2 (18.2%) |
| 75 Years and over | 0 (0.0%) | 0 (0.0%) |
| Total | 32 (10.2%) | 17 (5.5%) |
Income Above Poverty by Sex and Age in Pine Ridge
According to the poverty statistics in Pine Ridge, males aged 15 years and females aged 6 to 11 years are the age groups that are most secure financially, with 100.0% of males and 100.0% of females in these age groups living above the poverty line.
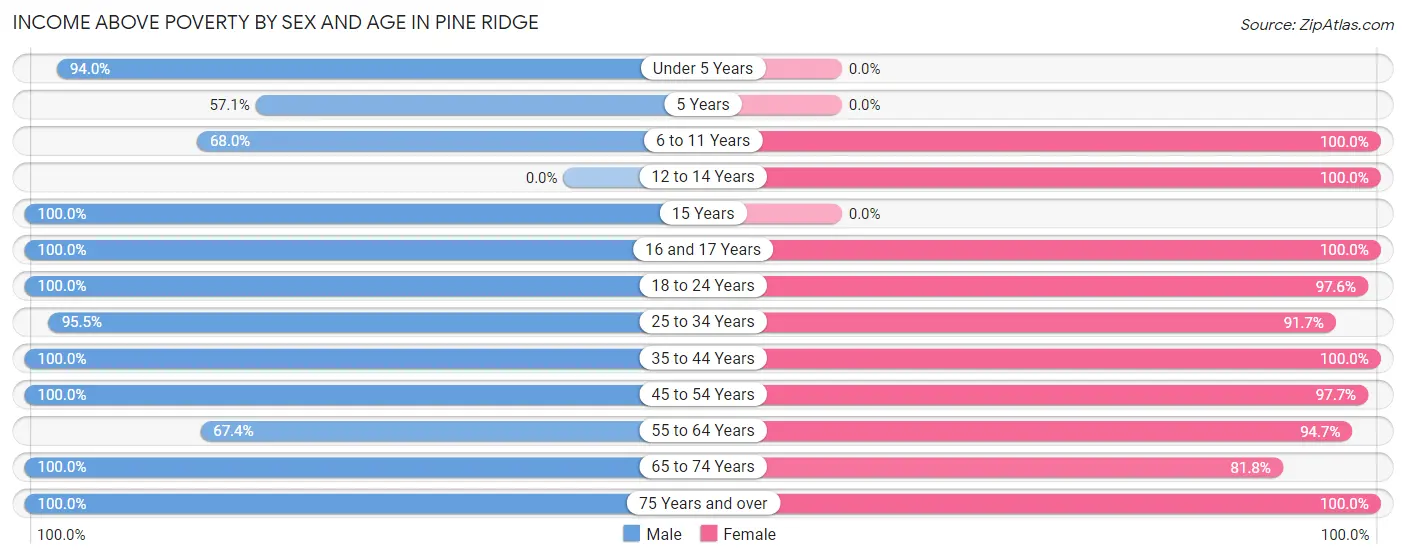
| Age Bracket | Male | Female |
| Under 5 Years | 47 (94.0%) | 0 (0.0%) |
| 5 Years | 4 (57.1%) | 0 (0.0%) |
| 6 to 11 Years | 17 (68.0%) | 7 (100.0%) |
| 12 to 14 Years | 0 (0.0%) | 6 (100.0%) |
| 15 Years | 1 (100.0%) | 0 (0.0%) |
| 16 and 17 Years | 5 (100.0%) | 33 (100.0%) |
| 18 to 24 Years | 36 (100.0%) | 41 (97.6%) |
| 25 to 34 Years | 64 (95.5%) | 77 (91.7%) |
| 35 to 44 Years | 17 (100.0%) | 10 (100.0%) |
| 45 to 54 Years | 43 (100.0%) | 83 (97.7%) |
| 55 to 64 Years | 31 (67.4%) | 18 (94.7%) |
| 65 to 74 Years | 9 (100.0%) | 9 (81.8%) |
| 75 Years and over | 9 (100.0%) | 10 (100.0%) |
| Total | 283 (89.8%) | 294 (94.5%) |
Income Below Poverty Among Married-Couple Families in Pine Ridge
The poverty statistics for married-couple families in Pine Ridge show that 2.1% or 3 of the total 141 families live below the poverty line. Families with no children have the highest poverty rate of 6.5%, comprising of 2 families. On the other hand, families with 3 or 4 children have the lowest poverty rate of 0.0%, which includes 0 families.
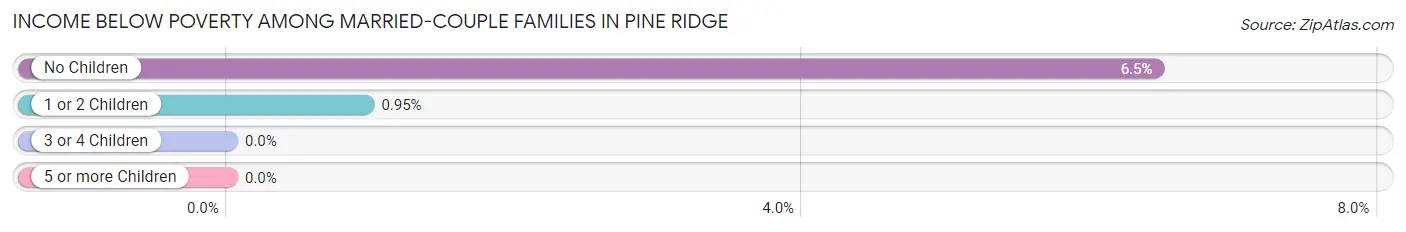
| Children | Above Poverty | Below Poverty |
| No Children | 29 (93.5%) | 2 (6.5%) |
| 1 or 2 Children | 104 (99.1%) | 1 (0.9%) |
| 3 or 4 Children | 5 (100.0%) | 0 (0.0%) |
| 5 or more Children | 0 (0.0%) | 0 (0.0%) |
| Total | 138 (97.9%) | 3 (2.1%) |
Income Below Poverty Among Single-Parent Households in Pine Ridge
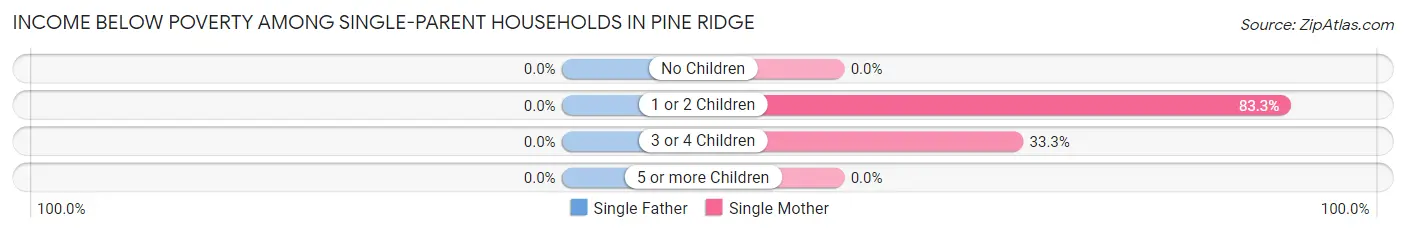
| Children | Single Father | Single Mother |
| No Children | 0 (0.0%) | 0 (0.0%) |
| 1 or 2 Children | 0 (0.0%) | 5 (83.3%) |
| 3 or 4 Children | 0 (0.0%) | 1 (33.3%) |
| 5 or more Children | 0 (0.0%) | 0 (0.0%) |
| Total | 0 (0.0%) | 6 (37.5%) |
Income Below Poverty Among Married-Couple vs Single-Parent Households in Pine Ridge
The poverty data for Pine Ridge shows that 3 of the married-couple family households (2.1%) and 6 of the single-parent households (31.6%) are living below the poverty level. Within the married-couple family households, those with no children have the highest poverty rate, with 2 households (6.5%) falling below the poverty line. Among the single-parent households, those with 1 or 2 children have the highest poverty rate, with 5 household (62.5%) living below poverty.
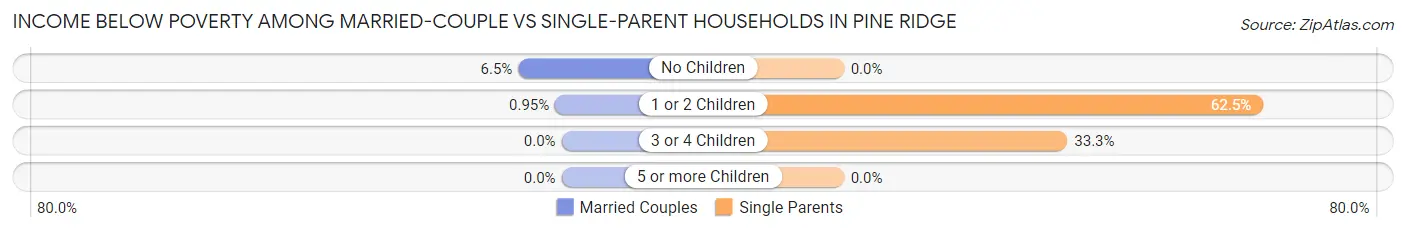
| Children | Married-Couple Families | Single-Parent Households |
| No Children | 2 (6.5%) | 0 (0.0%) |
| 1 or 2 Children | 1 (0.9%) | 5 (62.5%) |
| 3 or 4 Children | 0 (0.0%) | 1 (33.3%) |
| 5 or more Children | 0 (0.0%) | 0 (0.0%) |
| Total | 3 (2.1%) | 6 (31.6%) |
Race in Pine Ridge
The most populous races in Pine Ridge are White / Caucasian (384 | 60.5%), Hispanic or Latino (240 | 37.8%), and Some other Race (222 | 35.0%).
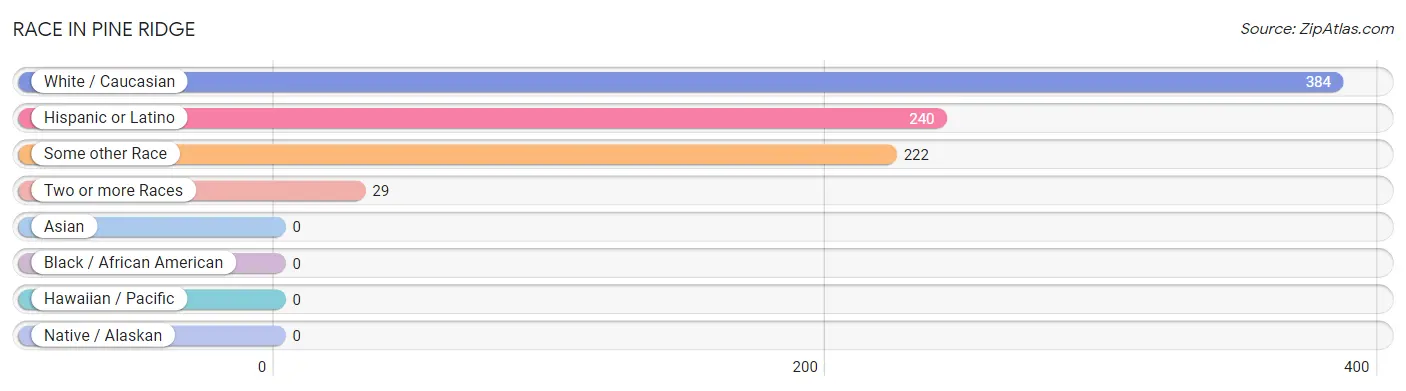
| Race | # Population | % Population |
| Asian | 0 | 0.0% |
| Black / African American | 0 | 0.0% |
| Hawaiian / Pacific | 0 | 0.0% |
| Hispanic or Latino | 240 | 37.8% |
| Native / Alaskan | 0 | 0.0% |
| White / Caucasian | 384 | 60.5% |
| Two or more Races | 29 | 4.6% |
| Some other Race | 222 | 35.0% |
| Total | 635 | 100.0% |
Ancestry in Pine Ridge
The most populous ancestries reported in Pine Ridge are Central American (194 | 30.5%), Guatemalan (194 | 30.5%), German (139 | 21.9%), Irish (85 | 13.4%), and English (41 | 6.5%), together accounting for 102.8% of all Pine Ridge residents.
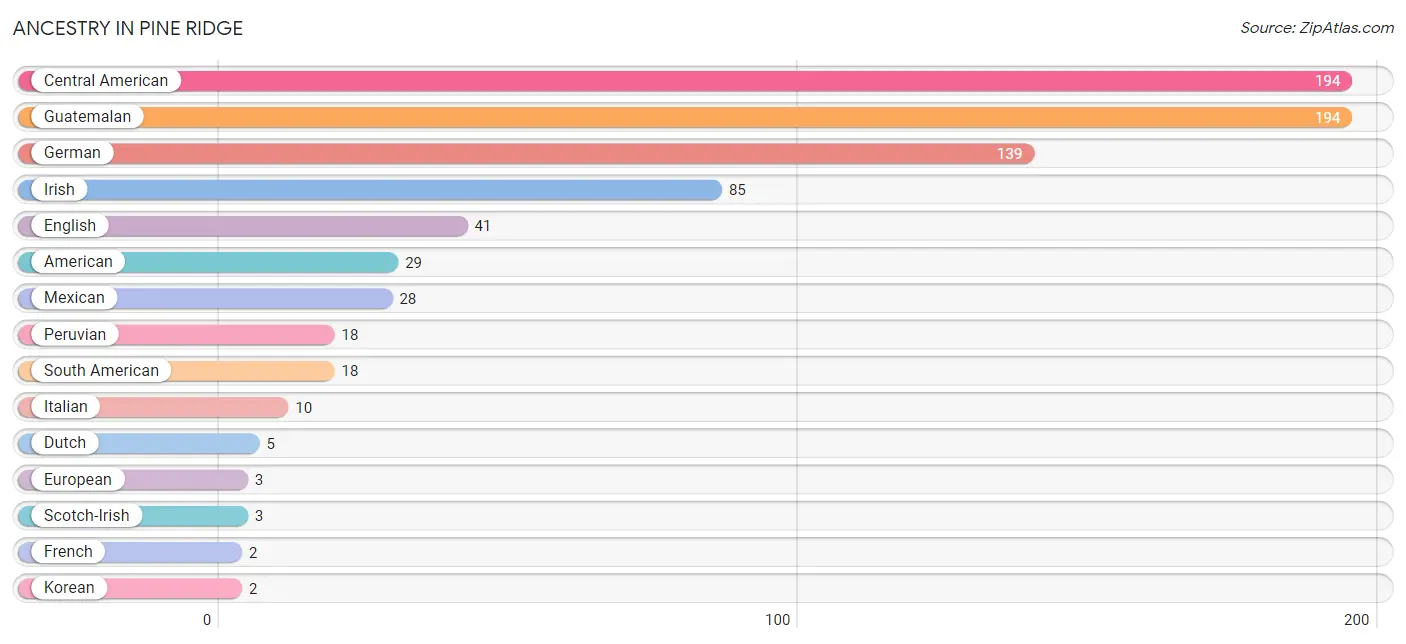
| Ancestry | # Population | % Population |
| American | 29 | 4.6% |
| Central American | 194 | 30.5% |
| Dutch | 5 | 0.8% |
| English | 41 | 6.5% |
| European | 3 | 0.5% |
| French | 2 | 0.3% |
| German | 139 | 21.9% |
| Guatemalan | 194 | 30.5% |
| Hungarian | 1 | 0.2% |
| Irish | 85 | 13.4% |
| Italian | 10 | 1.6% |
| Korean | 2 | 0.3% |
| Mexican | 28 | 4.4% |
| Peruvian | 18 | 2.8% |
| Scotch-Irish | 3 | 0.5% |
| South American | 18 | 2.8% | View All 16 Rows |
Immigrants in Pine Ridge
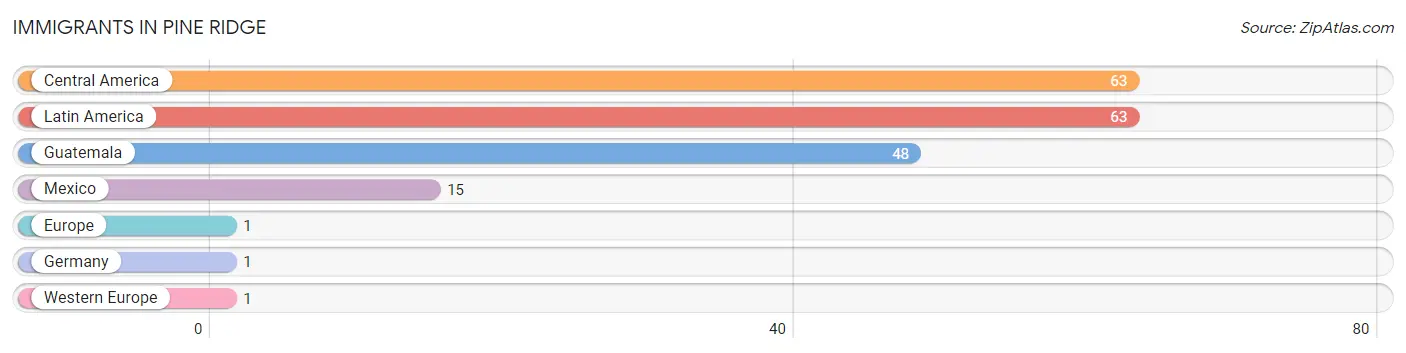
The most numerous immigrant groups reported in Pine Ridge came from Central America (63 | 9.9%), Latin America (63 | 9.9%), Guatemala (48 | 7.6%), Mexico (15 | 2.4%), and Europe (1 | 0.2%), together accounting for 29.9% of all Pine Ridge residents.
| Immigration Origin | # Population | % Population |
| Central America | 63 | 9.9% |
| Europe | 1 | 0.2% |
| Germany | 1 | 0.2% |
| Guatemala | 48 | 7.6% |
| Latin America | 63 | 9.9% |
| Mexico | 15 | 2.4% |
| Western Europe | 1 | 0.2% | View All 7 Rows |
Sex and Age in Pine Ridge
Sex and Age in Pine Ridge
The most populous age groups in Pine Ridge are 25 to 29 Years (65 | 20.6%) for men and 25 to 29 Years (74 | 23.2%) for women.
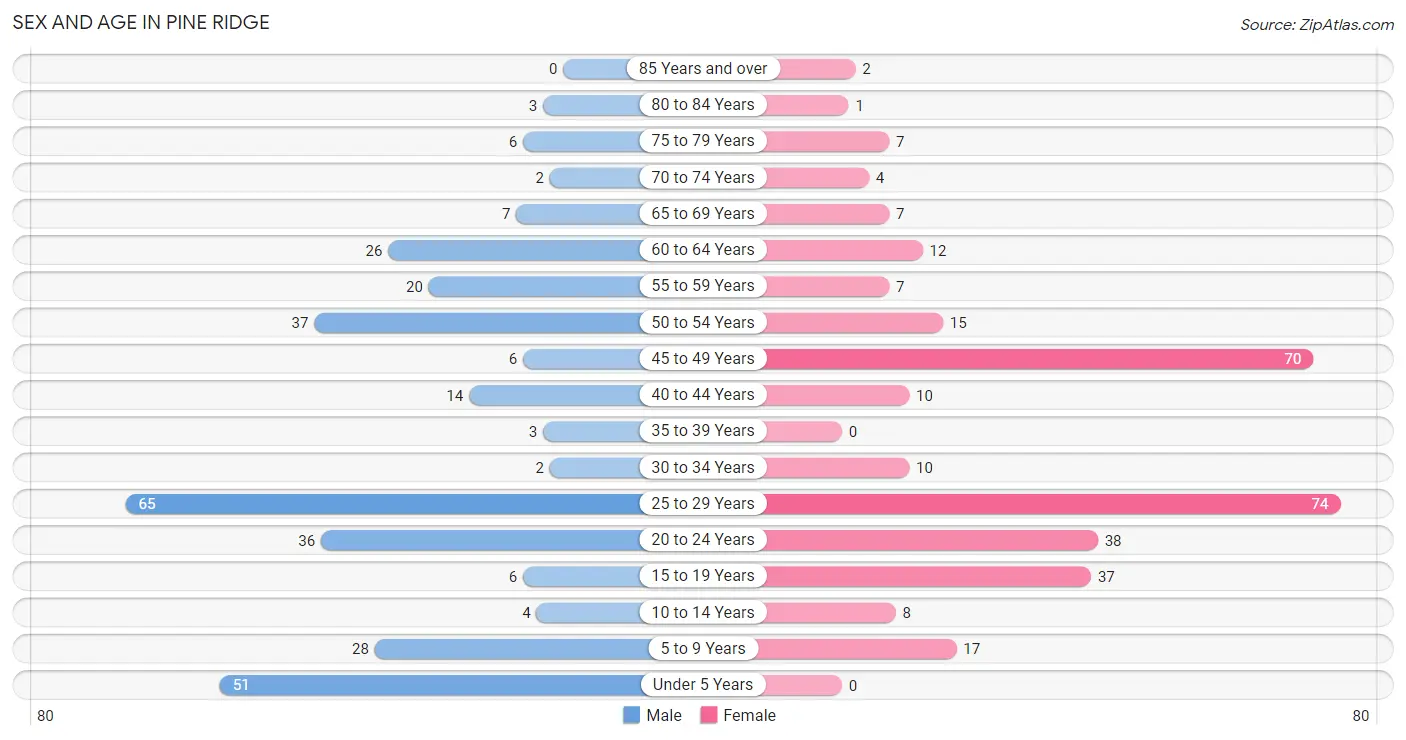
| Age Bracket | Male | Female |
| Under 5 Years | 51 (16.1%) | 0 (0.0%) |
| 5 to 9 Years | 28 (8.9%) | 17 (5.3%) |
| 10 to 14 Years | 4 (1.3%) | 8 (2.5%) |
| 15 to 19 Years | 6 (1.9%) | 37 (11.6%) |
| 20 to 24 Years | 36 (11.4%) | 38 (11.9%) |
| 25 to 29 Years | 65 (20.6%) | 74 (23.2%) |
| 30 to 34 Years | 2 (0.6%) | 10 (3.1%) |
| 35 to 39 Years | 3 (0.9%) | 0 (0.0%) |
| 40 to 44 Years | 14 (4.4%) | 10 (3.1%) |
| 45 to 49 Years | 6 (1.9%) | 70 (21.9%) |
| 50 to 54 Years | 37 (11.7%) | 15 (4.7%) |
| 55 to 59 Years | 20 (6.3%) | 7 (2.2%) |
| 60 to 64 Years | 26 (8.2%) | 12 (3.8%) |
| 65 to 69 Years | 7 (2.2%) | 7 (2.2%) |
| 70 to 74 Years | 2 (0.6%) | 4 (1.3%) |
| 75 to 79 Years | 6 (1.9%) | 7 (2.2%) |
| 80 to 84 Years | 3 (0.9%) | 1 (0.3%) |
| 85 Years and over | 0 (0.0%) | 2 (0.6%) |
| Total | 316 (100.0%) | 319 (100.0%) |
Families and Households in Pine Ridge
Median Family Size in Pine Ridge
The median family size in Pine Ridge is 3.58 persons per family, with single female/mother families (16 | 10.0%) accounting for the largest median family size of 4.5 persons per family. On the other hand, single male/father families (3 | 1.9%) represent the smallest median family size with 2.33 persons per family.
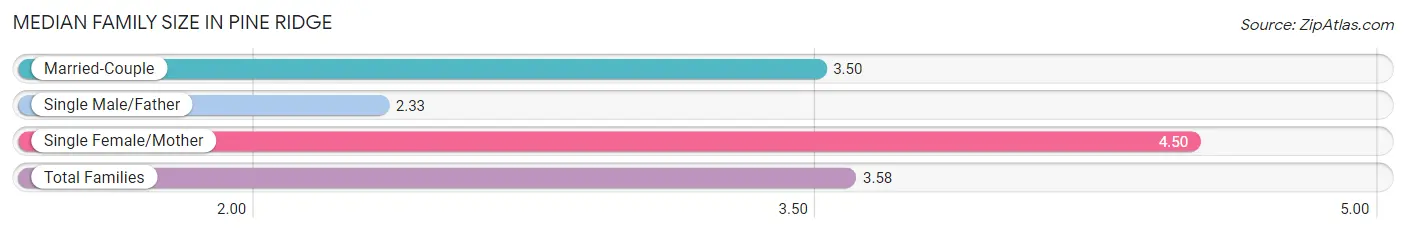
| Family Type | # Families | Family Size |
| Married-Couple | 141 (88.1%) | 3.50 |
| Single Male/Father | 3 (1.9%) | 2.33 |
| Single Female/Mother | 16 (10.0%) | 4.50 |
| Total Families | 160 (100.0%) | 3.58 |
Median Household Size in Pine Ridge
The median household size in Pine Ridge is 3.40 persons per household, with single female/mother households (16 | 8.6%) accounting for the largest median household size of 4.81 persons per household. non-family households (27 | 14.4%) represent the smallest median household size with 2.04 persons per household.
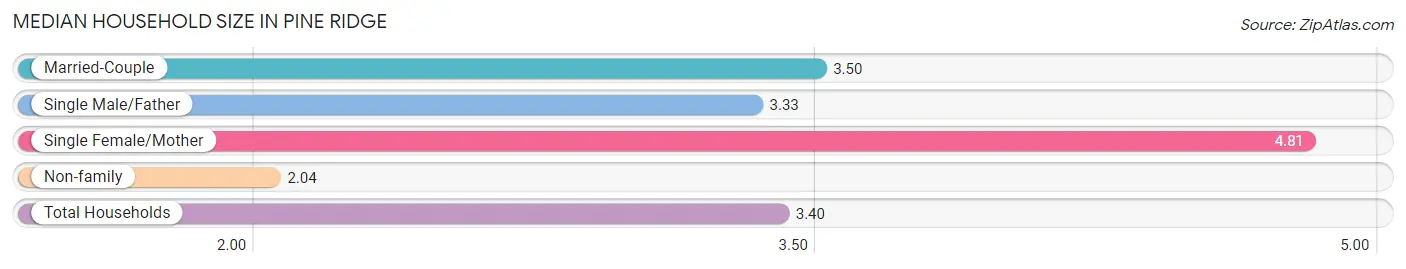
| Household Type | # Households | Household Size |
| Married-Couple | 141 (75.4%) | 3.50 |
| Single Male/Father | 3 (1.6%) | 3.33 |
| Single Female/Mother | 16 (8.6%) | 4.81 |
| Non-family | 27 (14.4%) | 2.04 |
| Total Households | 187 (100.0%) | 3.40 |
Household Size by Marriage Status in Pine Ridge
Out of a total of 187 households in Pine Ridge, 160 (85.6%) are family households, while 27 (14.4%) are nonfamily households. The most numerous type of family households are 5-person households, comprising 45, and the most common type of nonfamily households are 1-person households, comprising 16.
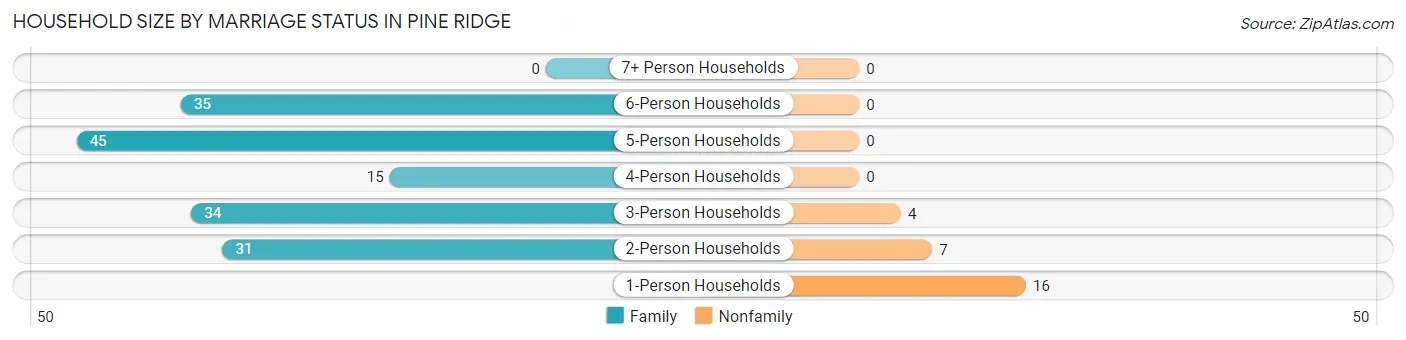
| Household Size | Family Households | Nonfamily Households |
| 1-Person Households | - | 16 (8.6%) |
| 2-Person Households | 31 (16.6%) | 7 (3.7%) |
| 3-Person Households | 34 (18.2%) | 4 (2.1%) |
| 4-Person Households | 15 (8.0%) | 0 (0.0%) |
| 5-Person Households | 45 (24.1%) | 0 (0.0%) |
| 6-Person Households | 35 (18.7%) | 0 (0.0%) |
| 7+ Person Households | 0 (0.0%) | 0 (0.0%) |
| Total | 160 (85.6%) | 27 (14.4%) |
Female Fertility in Pine Ridge
Fertility by Age in Pine Ridge
Average fertility rate in Pine Ridge is 142.0 births per 1,000 women. Women in the age bracket of 20 to 34 years have the highest fertility rate with 279.0 births per 1,000 women. Women in the age bracket of 20 to 34 years acount for 100.0% of all women with births.
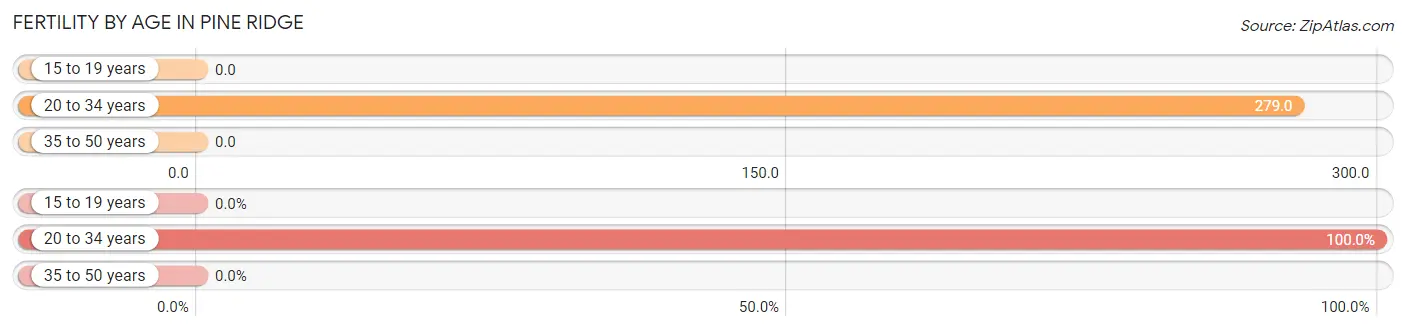
| Age Bracket | Women with Births | Births / 1,000 Women |
| 15 to 19 years | 0 (0.0%) | 0.0 |
| 20 to 34 years | 34 (100.0%) | 279.0 |
| 35 to 50 years | 0 (0.0%) | 0.0 |
| Total | 34 (100.0%) | 142.0 |
Fertility by Age by Marriage Status in Pine Ridge
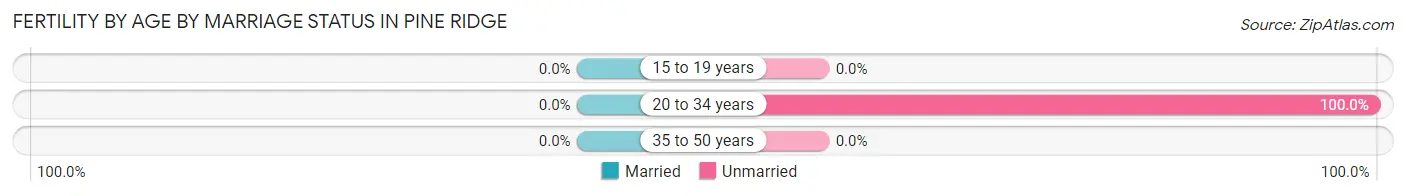
| Age Bracket | Married | Unmarried |
| 15 to 19 years | 0 (0.0%) | 0 (0.0%) |
| 20 to 34 years | 0 (0.0%) | 34 (100.0%) |
| 35 to 50 years | 0 (0.0%) | 0 (0.0%) |
| Total | 0 (0.0%) | 34 (100.0%) |
Fertility by Education in Pine Ridge
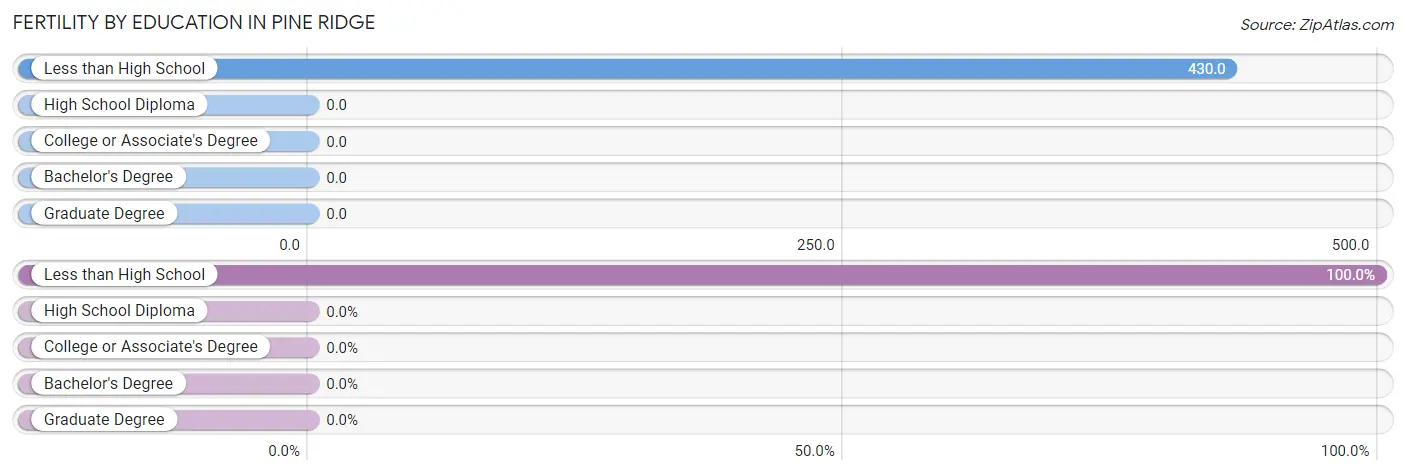
| Educational Attainment | Women with Births | Births / 1,000 Women |
| Less than High School | 34 (100.0%) | 430.0 |
| High School Diploma | 0 (0.0%) | 0.0 |
| College or Associate's Degree | 0 (0.0%) | 0.0 |
| Bachelor's Degree | 0 (0.0%) | 0.0 |
| Graduate Degree | 0 (0.0%) | 0.0 |
| Total | 34 (100.0%) | 142.0 |
Fertility by Education by Marriage Status in Pine Ridge
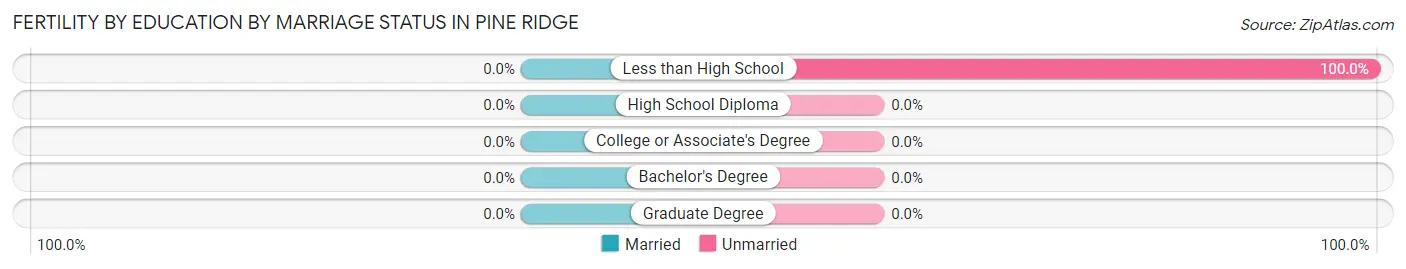
| Educational Attainment | Married | Unmarried |
| Less than High School | 0 (0.0%) | 34 (100.0%) |
| High School Diploma | 0 (0.0%) | 0 (0.0%) |
| College or Associate's Degree | 0 (0.0%) | 0 (0.0%) |
| Bachelor's Degree | 0 (0.0%) | 0 (0.0%) |
| Graduate Degree | 0 (0.0%) | 0 (0.0%) |
| Total | 0 (0.0%) | 34 (100.0%) |
Employment Characteristics in Pine Ridge
Employment by Class of Employer in Pine Ridge
Among the 308 employed individuals in Pine Ridge, private company employees (242 | 78.6%), self-employed (incorporated) (42 | 13.6%), and self-employed (not incorporated) (11 | 3.6%) make up the most common classes of employment.
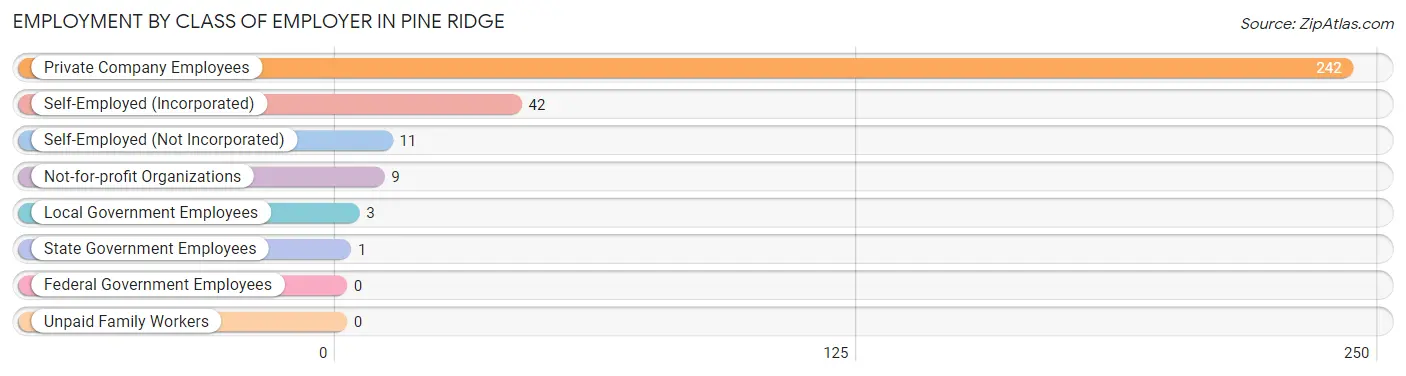
| Employer Class | # Employees | % Employees |
| Private Company Employees | 242 | 78.6% |
| Self-Employed (Incorporated) | 42 | 13.6% |
| Self-Employed (Not Incorporated) | 11 | 3.6% |
| Not-for-profit Organizations | 9 | 2.9% |
| Local Government Employees | 3 | 1.0% |
| State Government Employees | 1 | 0.3% |
| Federal Government Employees | 0 | 0.0% |
| Unpaid Family Workers | 0 | 0.0% |
| Total | 308 | 100.0% |
Employment Status by Age in Pine Ridge
According to the labor force statistics for Pine Ridge, out of the total population over 16 years of age (526), 60.6% or 319 individuals are in the labor force, with 2.5% or 8 of them unemployed. The age group with the highest labor force participation rate is 30 to 34 years, with 100.0% or 12 individuals in the labor force. Within the labor force, the 60 to 64 years age range has the highest percentage of unemployed individuals, with 31.3% or 5 of them being unemployed.
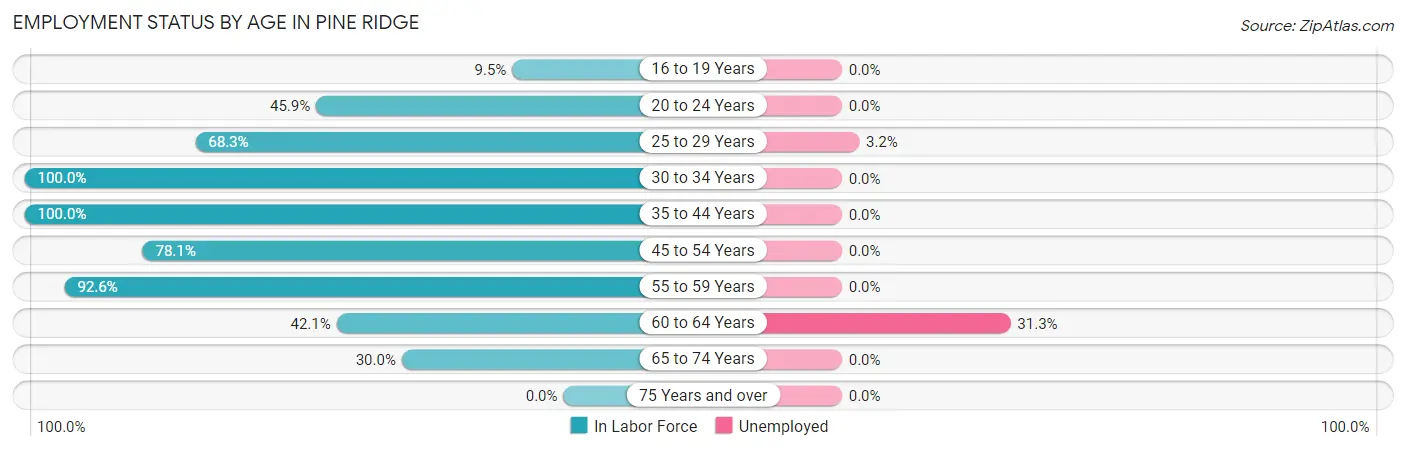
| Age Bracket | In Labor Force | Unemployed |
| 16 to 19 Years | 4 (9.5%) | 0 (0.0%) |
| 20 to 24 Years | 34 (45.9%) | 0 (0.0%) |
| 25 to 29 Years | 95 (68.3%) | 3 (3.2%) |
| 30 to 34 Years | 12 (100.0%) | 0 (0.0%) |
| 35 to 44 Years | 27 (100.0%) | 0 (0.0%) |
| 45 to 54 Years | 100 (78.1%) | 0 (0.0%) |
| 55 to 59 Years | 25 (92.6%) | 0 (0.0%) |
| 60 to 64 Years | 16 (42.1%) | 5 (31.3%) |
| 65 to 74 Years | 6 (30.0%) | 0 (0.0%) |
| 75 Years and over | 0 (0.0%) | 0 (0.0%) |
| Total | 319 (60.6%) | 8 (2.5%) |
Employment Status by Educational Attainment in Pine Ridge
According to labor force statistics for Pine Ridge, 74.1% of individuals (275) out of the total population between 25 and 64 years of age (371) are in the labor force, with 2.9% or 8 of them being unemployed. The group with the highest labor force participation rate are those with the educational attainment of college / associate degree, with 95.4% or 125 individuals in the labor force. Within the labor force, individuals with high school diploma education have the highest percentage of unemployment, with 9.6% or 5 of them being unemployed.
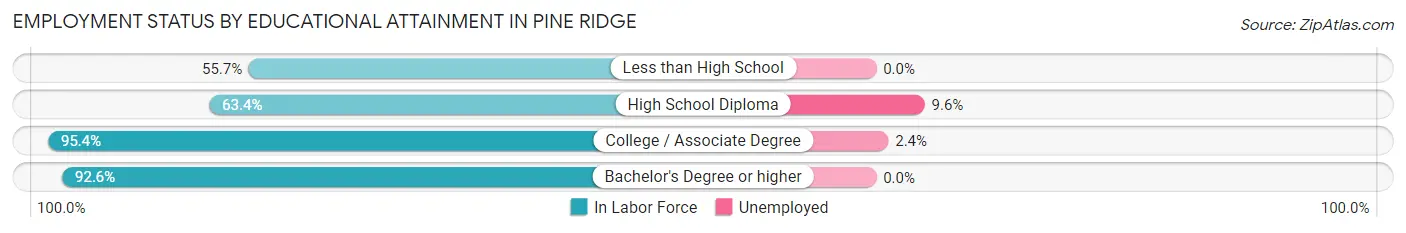
| Educational Attainment | In Labor Force | Unemployed |
| Less than High School | 73 (55.7%) | 0 (0.0%) |
| High School Diploma | 52 (63.4%) | 8 (9.6%) |
| College / Associate Degree | 125 (95.4%) | 3 (2.4%) |
| Bachelor's Degree or higher | 25 (92.6%) | 0 (0.0%) |
| Total | 275 (74.1%) | 11 (2.9%) |
Employment Occupations by Sex in Pine Ridge
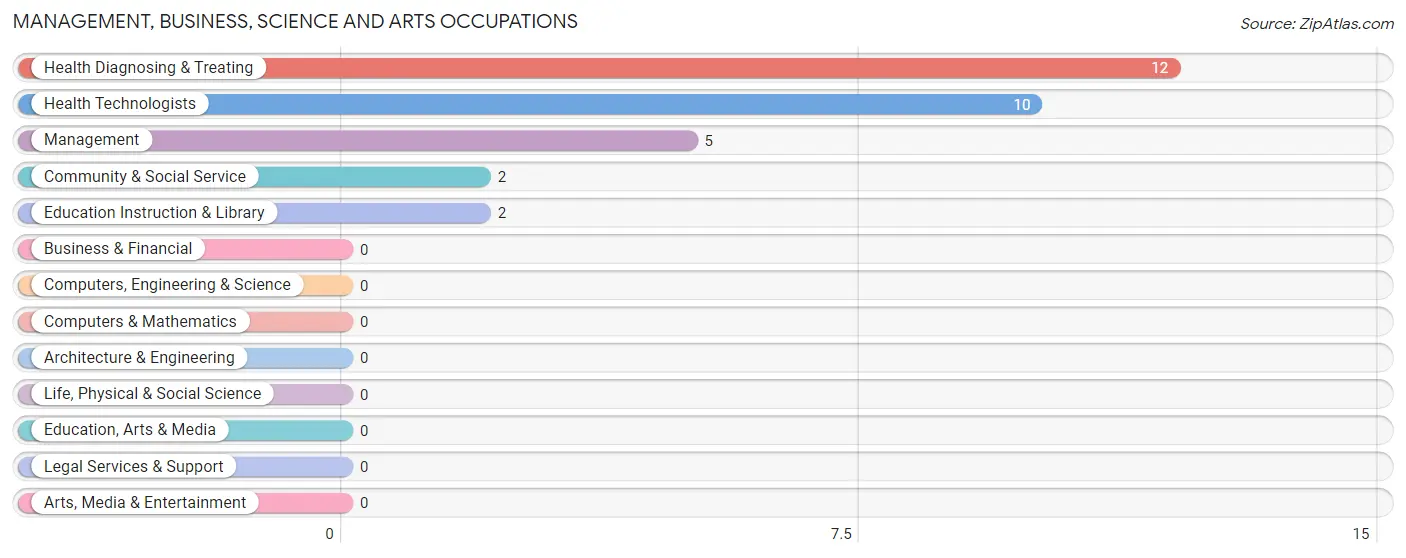
Management, Business, Science and Arts Occupations
The most common Management, Business, Science and Arts occupations in Pine Ridge are Health Diagnosing & Treating (12 | 3.9%), Health Technologists (10 | 3.2%), Management (5 | 1.6%), Community & Social Service (2 | 0.6%), and Education Instruction & Library (2 | 0.6%).
Management, Business, Science and Arts Occupations by Sex
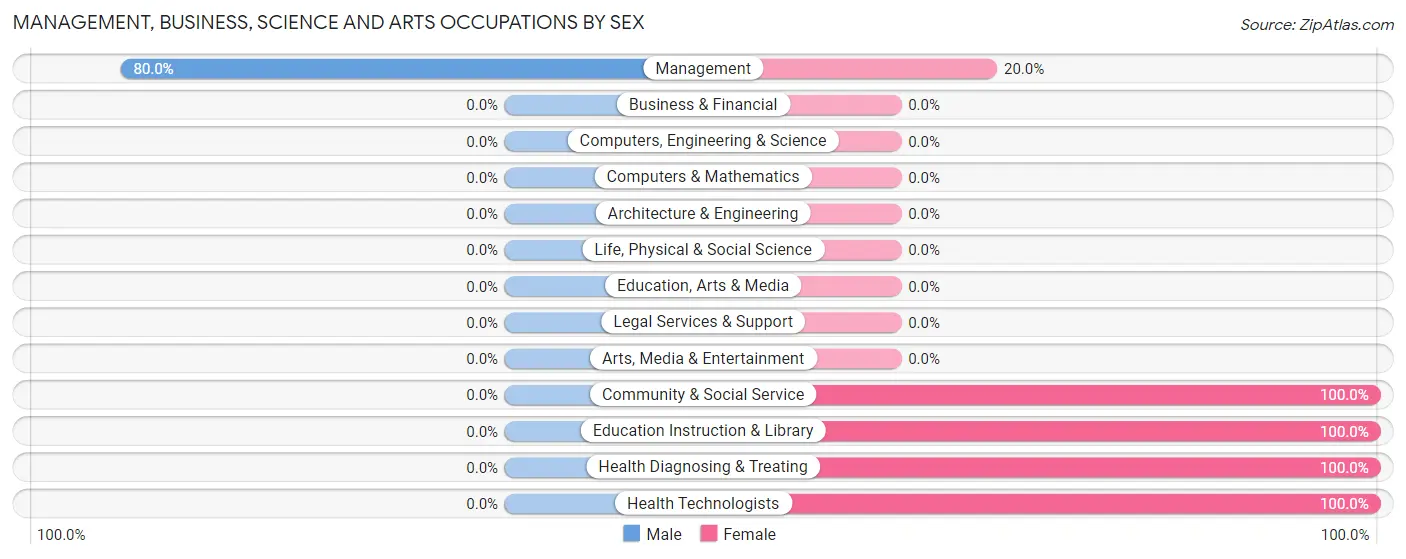
| Occupation | Male | Female |
| Management | 4 (80.0%) | 1 (20.0%) |
| Business & Financial | 0 (0.0%) | 0 (0.0%) |
| Computers, Engineering & Science | 0 (0.0%) | 0 (0.0%) |
| Computers & Mathematics | 0 (0.0%) | 0 (0.0%) |
| Architecture & Engineering | 0 (0.0%) | 0 (0.0%) |
| Life, Physical & Social Science | 0 (0.0%) | 0 (0.0%) |
| Community & Social Service | 0 (0.0%) | 2 (100.0%) |
| Education, Arts & Media | 0 (0.0%) | 0 (0.0%) |
| Legal Services & Support | 0 (0.0%) | 0 (0.0%) |
| Education Instruction & Library | 0 (0.0%) | 2 (100.0%) |
| Arts, Media & Entertainment | 0 (0.0%) | 0 (0.0%) |
| Health Diagnosing & Treating | 0 (0.0%) | 12 (100.0%) |
| Health Technologists | 0 (0.0%) | 10 (100.0%) |
| Total (Category) | 4 (21.0%) | 15 (78.9%) |
| Total (Overall) | 152 (48.9%) | 159 (51.1%) |
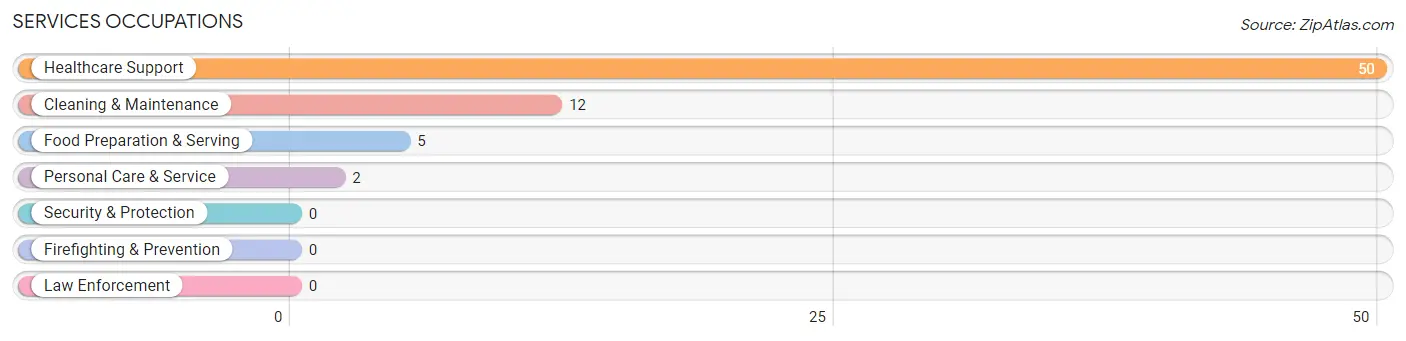
Services Occupations
The most common Services occupations in Pine Ridge are Healthcare Support (50 | 16.1%), Cleaning & Maintenance (12 | 3.9%), Food Preparation & Serving (5 | 1.6%), and Personal Care & Service (2 | 0.6%).
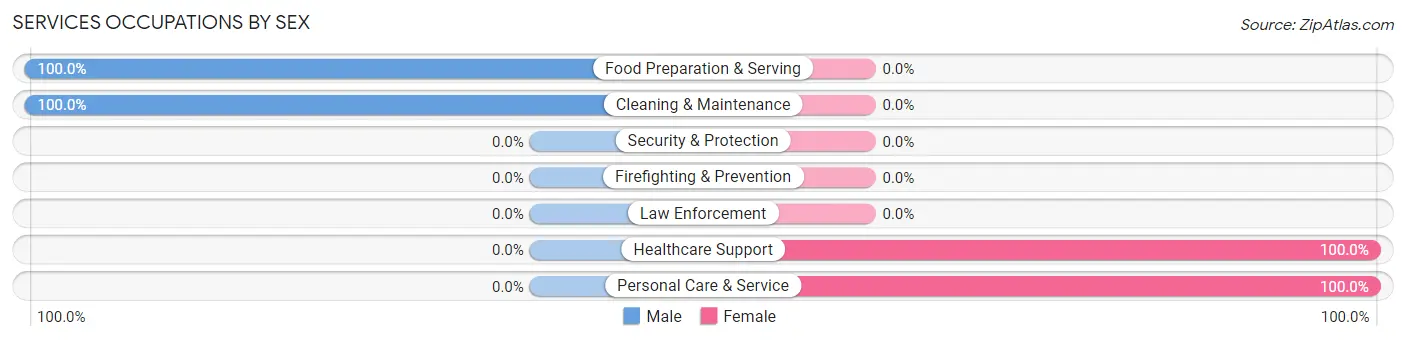
Services Occupations by Sex
Within the Services occupations in Pine Ridge, the most male-oriented occupations are Food Preparation & Serving (100.0%), and Cleaning & Maintenance (100.0%), while the most female-oriented occupations are Healthcare Support (100.0%), and Personal Care & Service (100.0%).
| Occupation | Male | Female |
| Healthcare Support | 0 (0.0%) | 50 (100.0%) |
| Security & Protection | 0 (0.0%) | 0 (0.0%) |
| Firefighting & Prevention | 0 (0.0%) | 0 (0.0%) |
| Law Enforcement | 0 (0.0%) | 0 (0.0%) |
| Food Preparation & Serving | 5 (100.0%) | 0 (0.0%) |
| Cleaning & Maintenance | 12 (100.0%) | 0 (0.0%) |
| Personal Care & Service | 0 (0.0%) | 2 (100.0%) |
| Total (Category) | 17 (24.6%) | 52 (75.4%) |
| Total (Overall) | 152 (48.9%) | 159 (51.1%) |
Sales and Office Occupations
The most common Sales and Office occupations in Pine Ridge are Sales & Related (106 | 34.1%), and Office & Administration (6 | 1.9%).

Sales and Office Occupations by Sex

| Occupation | Male | Female |
| Sales & Related | 60 (56.6%) | 46 (43.4%) |
| Office & Administration | 0 (0.0%) | 6 (100.0%) |
| Total (Category) | 60 (53.6%) | 52 (46.4%) |
| Total (Overall) | 152 (48.9%) | 159 (51.1%) |
Natural Resources, Construction and Maintenance Occupations
The most common Natural Resources, Construction and Maintenance occupations in Pine Ridge are Construction & Extraction (7 | 2.2%), and Installation, Maintenance & Repair (6 | 1.9%).
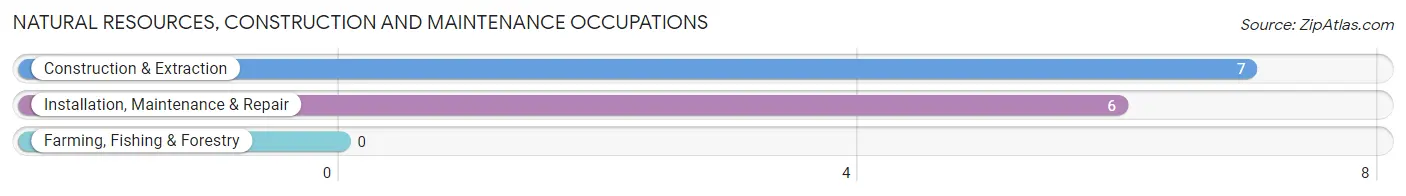
Natural Resources, Construction and Maintenance Occupations by Sex

| Occupation | Male | Female |
| Farming, Fishing & Forestry | 0 (0.0%) | 0 (0.0%) |
| Construction & Extraction | 7 (100.0%) | 0 (0.0%) |
| Installation, Maintenance & Repair | 2 (33.3%) | 4 (66.7%) |
| Total (Category) | 9 (69.2%) | 4 (30.8%) |
| Total (Overall) | 152 (48.9%) | 159 (51.1%) |
Production, Transportation and Moving Occupations
The most common Production, Transportation and Moving occupations in Pine Ridge are Material Moving (68 | 21.9%), Production (22 | 7.1%), and Transportation (8 | 2.6%).
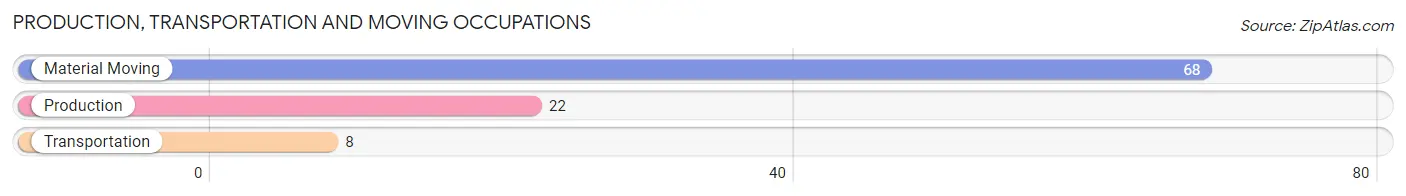
Production, Transportation and Moving Occupations by Sex
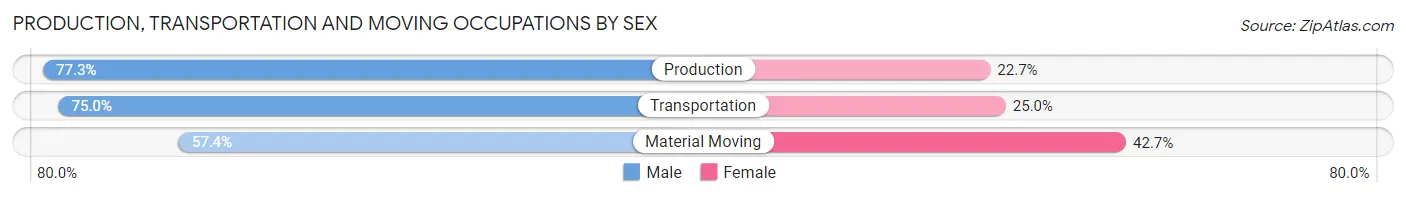
| Occupation | Male | Female |
| Production | 17 (77.3%) | 5 (22.7%) |
| Transportation | 6 (75.0%) | 2 (25.0%) |
| Material Moving | 39 (57.4%) | 29 (42.6%) |
| Total (Category) | 62 (63.3%) | 36 (36.7%) |
| Total (Overall) | 152 (48.9%) | 159 (51.1%) |
Employment Industries by Sex in Pine Ridge
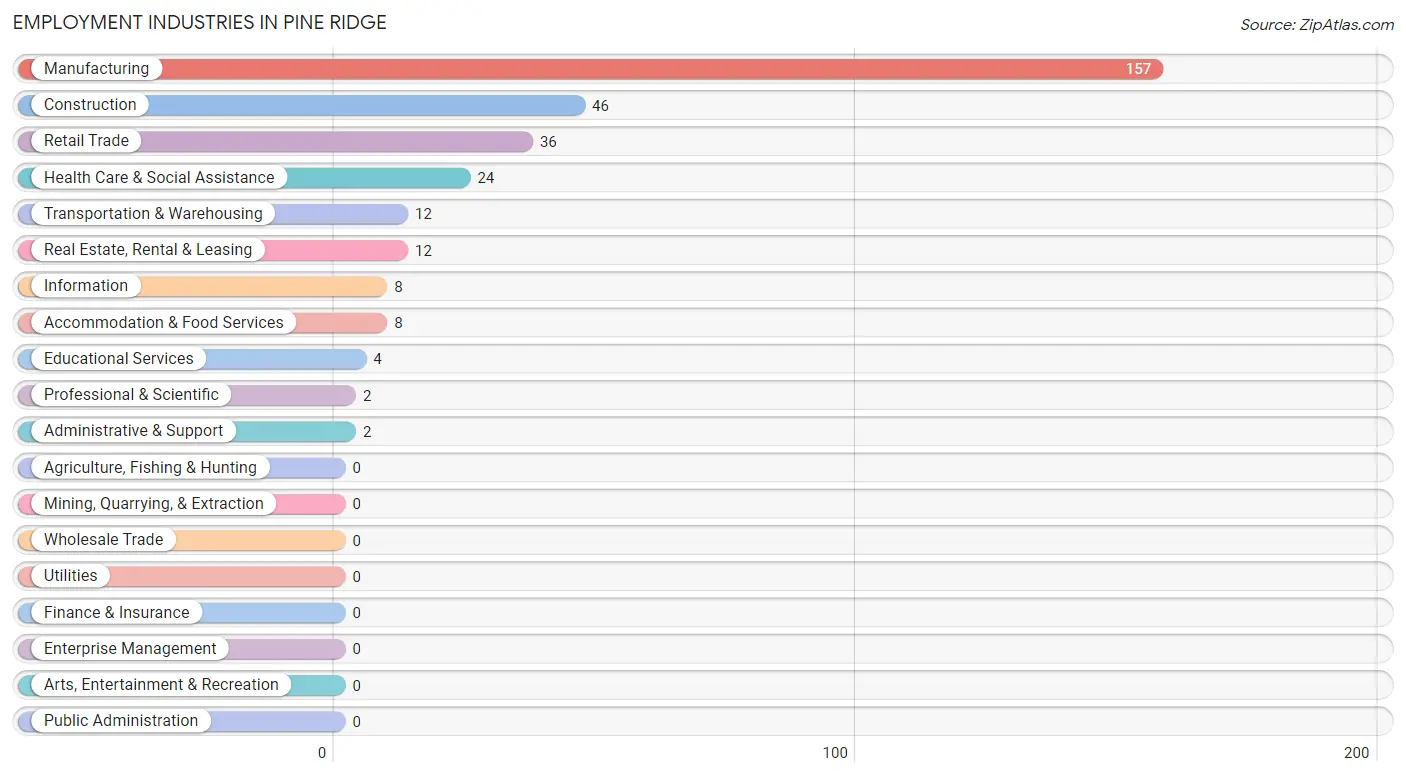
Employment Industries in Pine Ridge
The major employment industries in Pine Ridge include Manufacturing (157 | 50.5%), Construction (46 | 14.8%), Retail Trade (36 | 11.6%), Health Care & Social Assistance (24 | 7.7%), and Transportation & Warehousing (12 | 3.9%).
Employment Industries by Sex in Pine Ridge
The Pine Ridge industries that see more men than women are Real Estate, Rental & Leasing (100.0%), Administrative & Support (100.0%), and Accommodation & Food Services (100.0%), whereas the industries that tend to have a higher number of women are Information (100.0%), Professional & Scientific (100.0%), and Educational Services (100.0%).
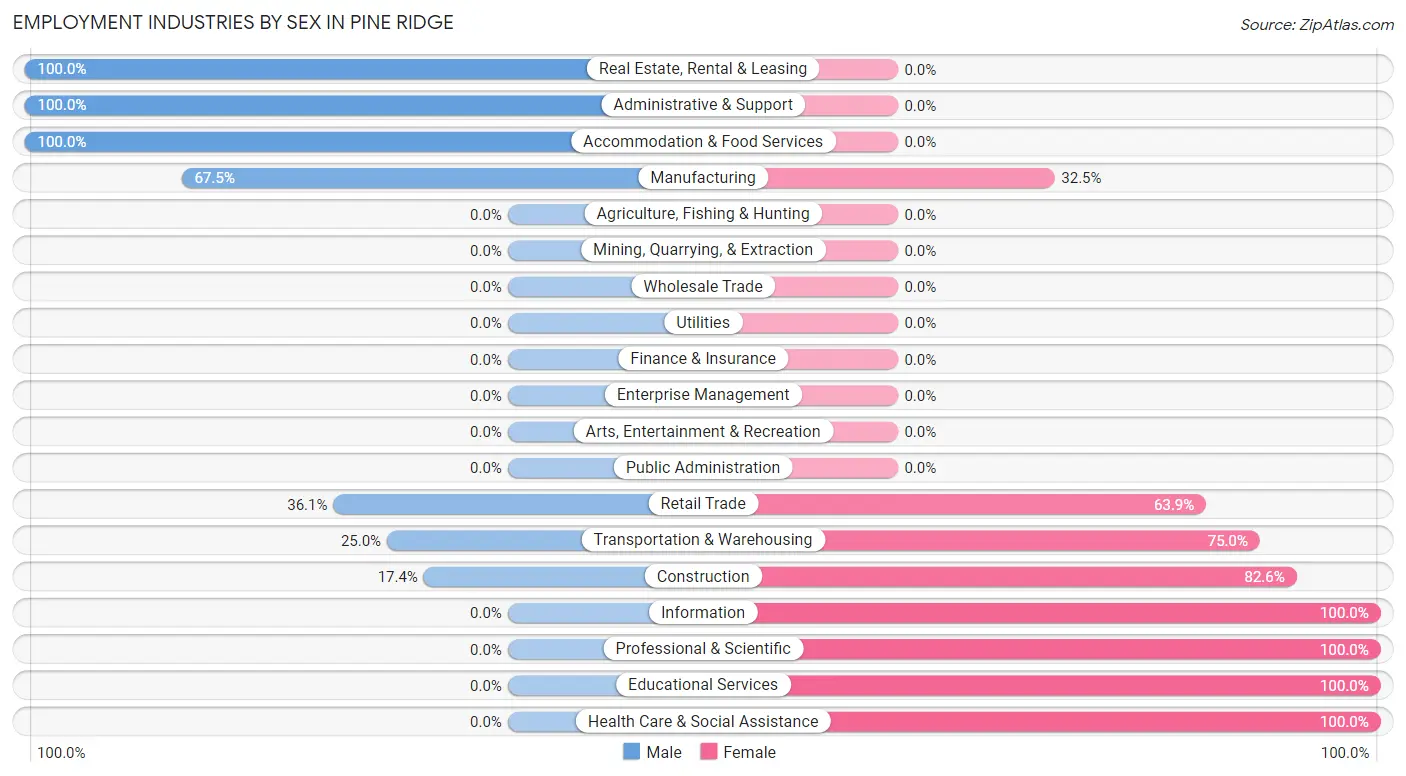
| Industry | Male | Female |
| Agriculture, Fishing & Hunting | 0 (0.0%) | 0 (0.0%) |
| Mining, Quarrying, & Extraction | 0 (0.0%) | 0 (0.0%) |
| Construction | 8 (17.4%) | 38 (82.6%) |
| Manufacturing | 106 (67.5%) | 51 (32.5%) |
| Wholesale Trade | 0 (0.0%) | 0 (0.0%) |
| Retail Trade | 13 (36.1%) | 23 (63.9%) |
| Transportation & Warehousing | 3 (25.0%) | 9 (75.0%) |
| Utilities | 0 (0.0%) | 0 (0.0%) |
| Information | 0 (0.0%) | 8 (100.0%) |
| Finance & Insurance | 0 (0.0%) | 0 (0.0%) |
| Real Estate, Rental & Leasing | 12 (100.0%) | 0 (0.0%) |
| Professional & Scientific | 0 (0.0%) | 2 (100.0%) |
| Enterprise Management | 0 (0.0%) | 0 (0.0%) |
| Administrative & Support | 2 (100.0%) | 0 (0.0%) |
| Educational Services | 0 (0.0%) | 4 (100.0%) |
| Health Care & Social Assistance | 0 (0.0%) | 24 (100.0%) |
| Arts, Entertainment & Recreation | 0 (0.0%) | 0 (0.0%) |
| Accommodation & Food Services | 8 (100.0%) | 0 (0.0%) |
| Public Administration | 0 (0.0%) | 0 (0.0%) |
| Total | 152 (48.9%) | 159 (51.1%) |
Education in Pine Ridge
School Enrollment in Pine Ridge
The most common levels of schooling among the 139 students in Pine Ridge are college / undergraduate (43 | 30.9%), high school (39 | 28.1%), and elementary school (32 | 23.0%).
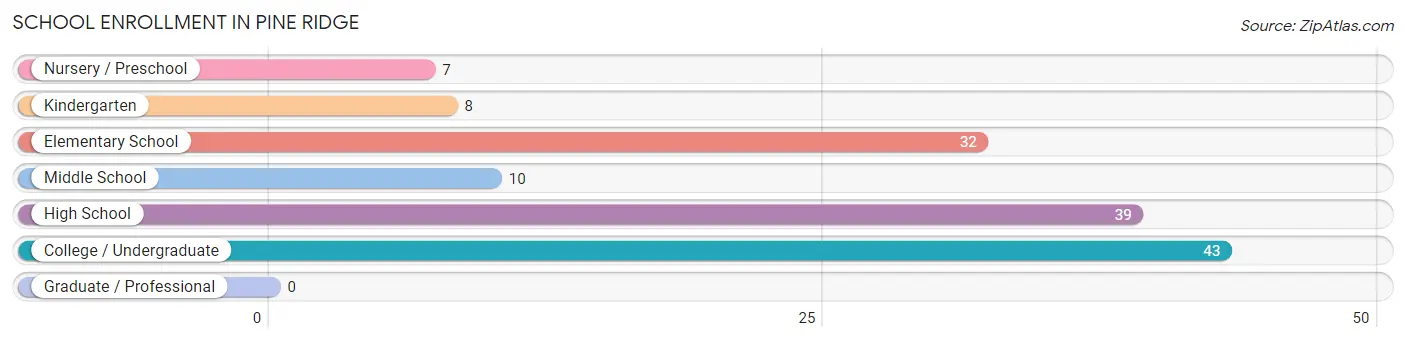
| School Level | # Students | % Students |
| Nursery / Preschool | 7 | 5.0% |
| Kindergarten | 8 | 5.8% |
| Elementary School | 32 | 23.0% |
| Middle School | 10 | 7.2% |
| High School | 39 | 28.1% |
| College / Undergraduate | 43 | 30.9% |
| Graduate / Professional | 0 | 0.0% |
| Total | 139 | 100.0% |
School Enrollment by Age by Funding Source in Pine Ridge
Out of a total of 139 students who are enrolled in schools in Pine Ridge, 41 (29.5%) attend a private institution, while the remaining 98 (70.5%) are enrolled in public schools. The age group of 35 years and over has the highest likelihood of being enrolled in private schools, with 4 (100.0% in the age bracket) enrolled. Conversely, the age group of 10 to 14 year olds has the lowest likelihood of being enrolled in a private school, with 12 (100.0% in the age bracket) attending a public institution.
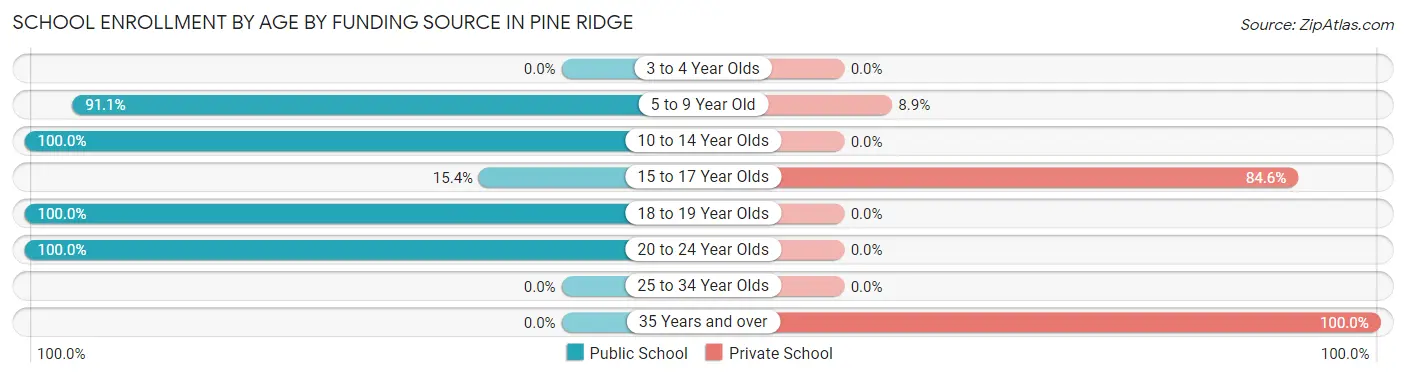
| Age Bracket | Public School | Private School |
| 3 to 4 Year Olds | 0 (0.0%) | 0 (0.0%) |
| 5 to 9 Year Old | 41 (91.1%) | 4 (8.9%) |
| 10 to 14 Year Olds | 12 (100.0%) | 0 (0.0%) |
| 15 to 17 Year Olds | 6 (15.4%) | 33 (84.6%) |
| 18 to 19 Year Olds | 4 (100.0%) | 0 (0.0%) |
| 20 to 24 Year Olds | 35 (100.0%) | 0 (0.0%) |
| 25 to 34 Year Olds | 0 (0.0%) | 0 (0.0%) |
| 35 Years and over | 0 (0.0%) | 4 (100.0%) |
| Total | 98 (70.5%) | 41 (29.5%) |
Educational Attainment by Field of Study in Pine Ridge
Liberal arts & history (12 | 29.3%), business (8 | 19.5%), education (8 | 19.5%), arts & humanities (8 | 19.5%), and engineering (2 | 4.9%) are the most common fields of study among 41 individuals in Pine Ridge who have obtained a bachelor's degree or higher.
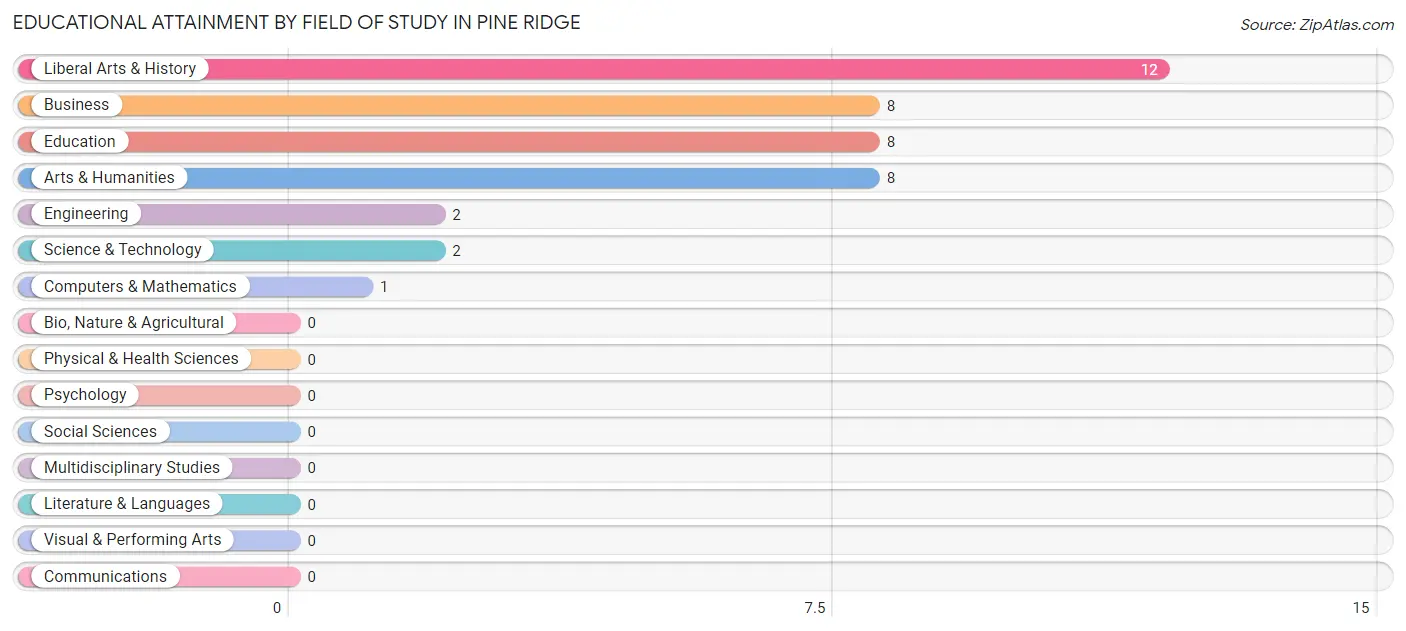
| Field of Study | # Graduates | % Graduates |
| Computers & Mathematics | 1 | 2.4% |
| Bio, Nature & Agricultural | 0 | 0.0% |
| Physical & Health Sciences | 0 | 0.0% |
| Psychology | 0 | 0.0% |
| Social Sciences | 0 | 0.0% |
| Engineering | 2 | 4.9% |
| Multidisciplinary Studies | 0 | 0.0% |
| Science & Technology | 2 | 4.9% |
| Business | 8 | 19.5% |
| Education | 8 | 19.5% |
| Literature & Languages | 0 | 0.0% |
| Liberal Arts & History | 12 | 29.3% |
| Visual & Performing Arts | 0 | 0.0% |
| Communications | 0 | 0.0% |
| Arts & Humanities | 8 | 19.5% |
| Total | 41 | 100.0% |
Transportation & Commute in Pine Ridge
Vehicle Availability by Sex in Pine Ridge
The most prevalent vehicle ownership categories in Pine Ridge are males with 4 vehicles (94, accounting for 62.3%) and females with 4 vehicles (62, making up 59.9%).
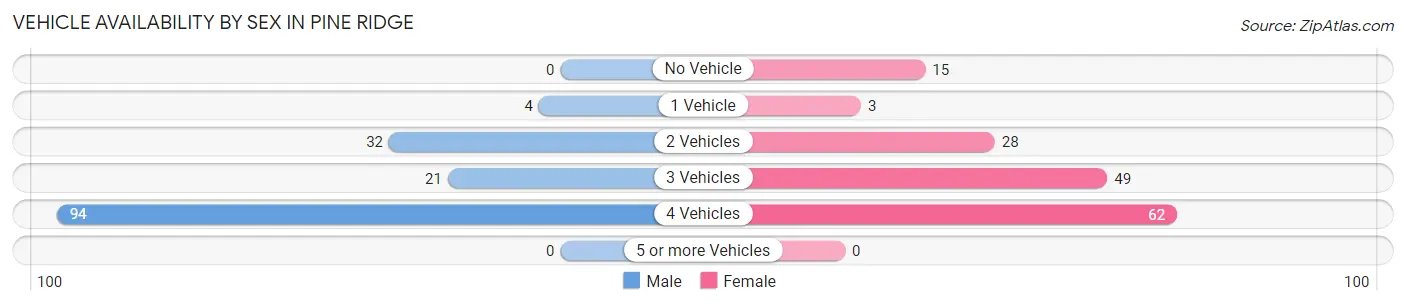
| Vehicles Available | Male | Female |
| No Vehicle | 0 (0.0%) | 15 (9.6%) |
| 1 Vehicle | 4 (2.6%) | 3 (1.9%) |
| 2 Vehicles | 32 (21.2%) | 28 (17.8%) |
| 3 Vehicles | 21 (13.9%) | 49 (31.2%) |
| 4 Vehicles | 94 (62.3%) | 62 (39.5%) |
| 5 or more Vehicles | 0 (0.0%) | 0 (0.0%) |
| Total | 151 (100.0%) | 157 (100.0%) |
Commute Time in Pine Ridge
The most frequently occuring commute durations in Pine Ridge are 10 to 14 minutes (185 commuters, 60.1%), 15 to 19 minutes (27 commuters, 8.8%), and 20 to 24 minutes (26 commuters, 8.4%).
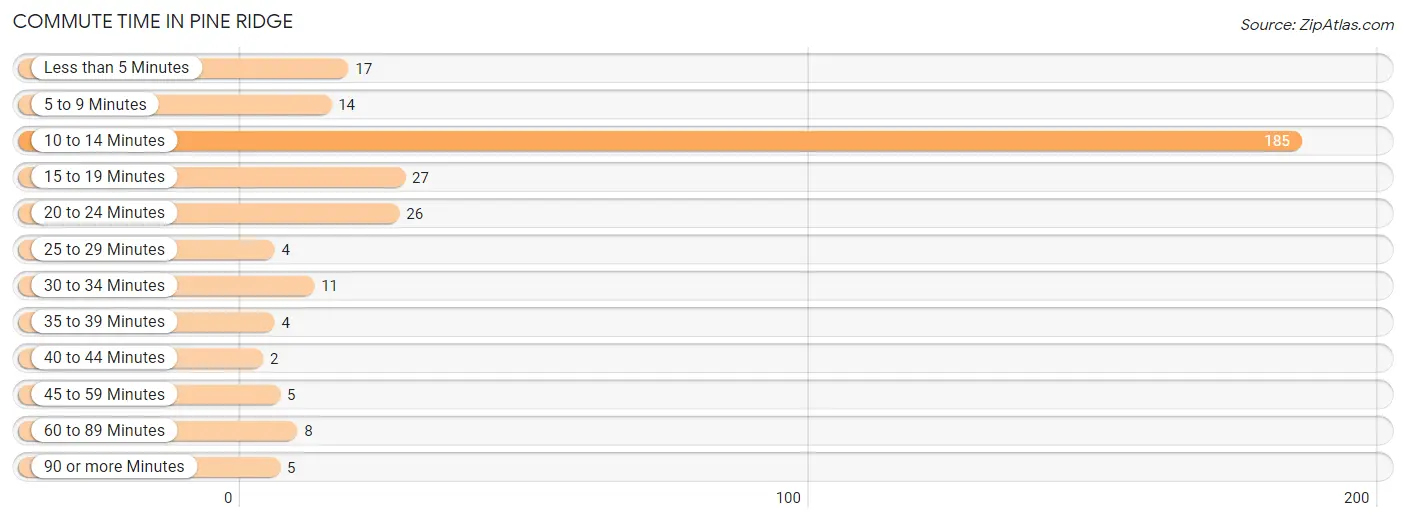
| Commute Time | # Commuters | % Commuters |
| Less than 5 Minutes | 17 | 5.5% |
| 5 to 9 Minutes | 14 | 4.5% |
| 10 to 14 Minutes | 185 | 60.1% |
| 15 to 19 Minutes | 27 | 8.8% |
| 20 to 24 Minutes | 26 | 8.4% |
| 25 to 29 Minutes | 4 | 1.3% |
| 30 to 34 Minutes | 11 | 3.6% |
| 35 to 39 Minutes | 4 | 1.3% |
| 40 to 44 Minutes | 2 | 0.6% |
| 45 to 59 Minutes | 5 | 1.6% |
| 60 to 89 Minutes | 8 | 2.6% |
| 90 or more Minutes | 5 | 1.6% |
Commute Time by Sex in Pine Ridge
The most common commute times in Pine Ridge are 10 to 14 minutes (103 commuters, 68.2%) for males and 10 to 14 minutes (82 commuters, 52.2%) for females.
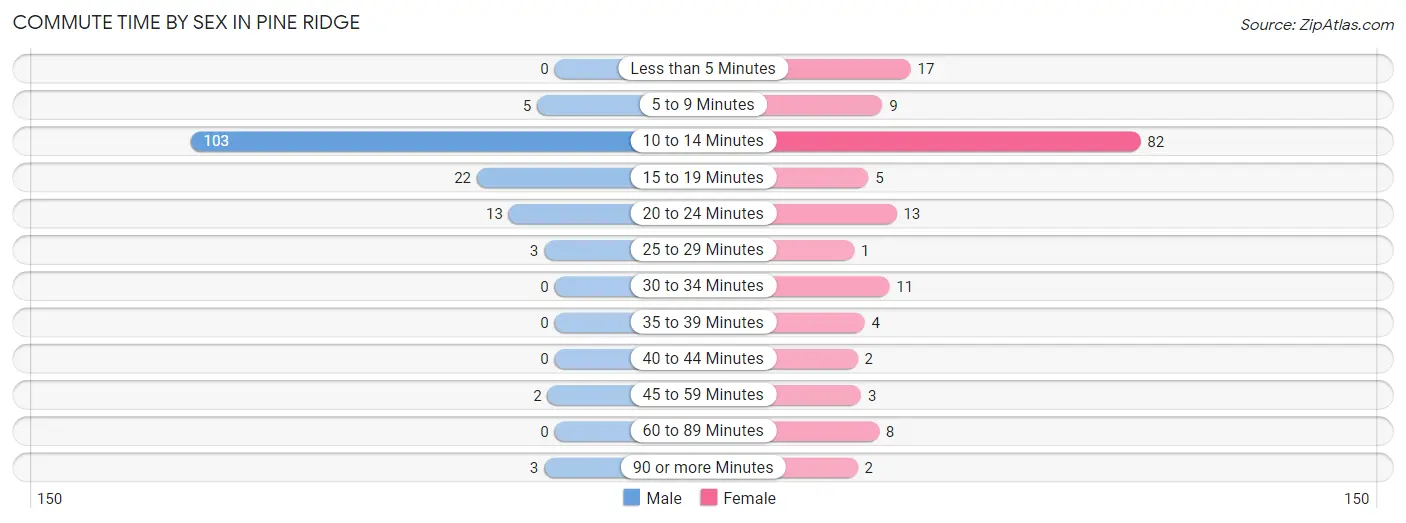
| Commute Time | Male | Female |
| Less than 5 Minutes | 0 (0.0%) | 17 (10.8%) |
| 5 to 9 Minutes | 5 (3.3%) | 9 (5.7%) |
| 10 to 14 Minutes | 103 (68.2%) | 82 (52.2%) |
| 15 to 19 Minutes | 22 (14.6%) | 5 (3.2%) |
| 20 to 24 Minutes | 13 (8.6%) | 13 (8.3%) |
| 25 to 29 Minutes | 3 (2.0%) | 1 (0.6%) |
| 30 to 34 Minutes | 0 (0.0%) | 11 (7.0%) |
| 35 to 39 Minutes | 0 (0.0%) | 4 (2.5%) |
| 40 to 44 Minutes | 0 (0.0%) | 2 (1.3%) |
| 45 to 59 Minutes | 2 (1.3%) | 3 (1.9%) |
| 60 to 89 Minutes | 0 (0.0%) | 8 (5.1%) |
| 90 or more Minutes | 3 (2.0%) | 2 (1.3%) |
Time of Departure to Work by Sex in Pine Ridge
The most frequent times of departure to work in Pine Ridge are 4:00 PM to 11:59 PM (55, 36.4%) for males and 6:30 AM to 6:59 AM (40, 25.5%) for females.
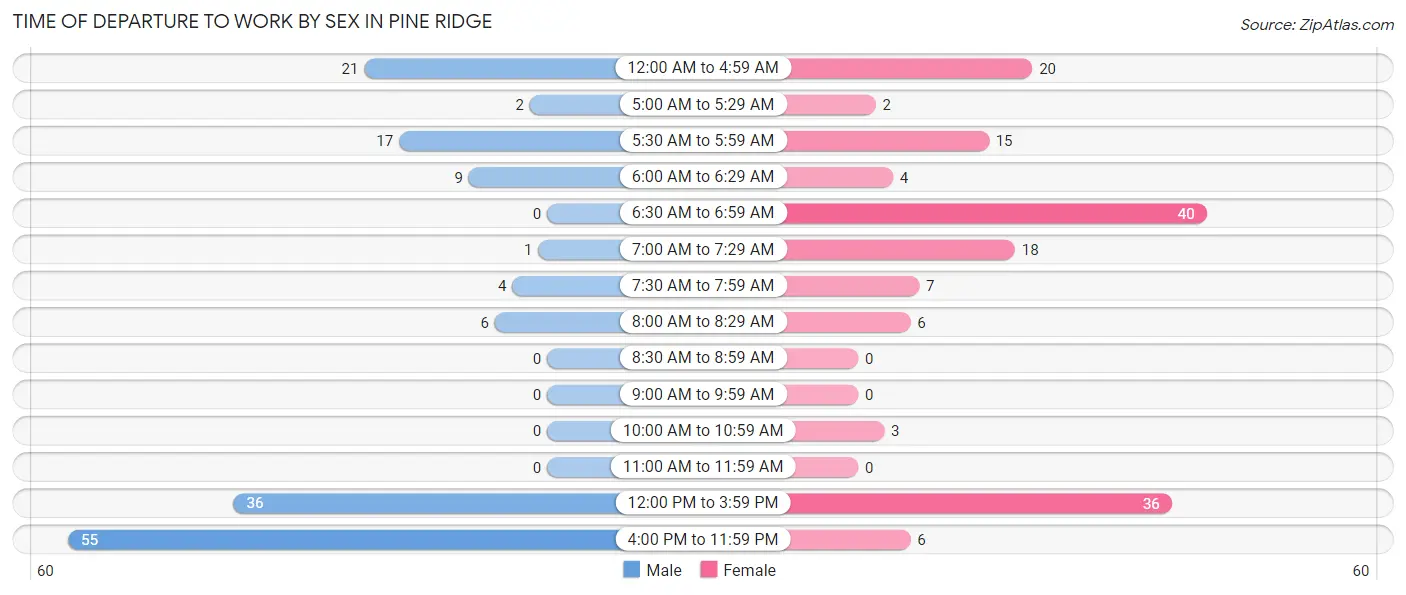
| Time of Departure | Male | Female |
| 12:00 AM to 4:59 AM | 21 (13.9%) | 20 (12.7%) |
| 5:00 AM to 5:29 AM | 2 (1.3%) | 2 (1.3%) |
| 5:30 AM to 5:59 AM | 17 (11.3%) | 15 (9.6%) |
| 6:00 AM to 6:29 AM | 9 (6.0%) | 4 (2.5%) |
| 6:30 AM to 6:59 AM | 0 (0.0%) | 40 (25.5%) |
| 7:00 AM to 7:29 AM | 1 (0.7%) | 18 (11.5%) |
| 7:30 AM to 7:59 AM | 4 (2.6%) | 7 (4.5%) |
| 8:00 AM to 8:29 AM | 6 (4.0%) | 6 (3.8%) |
| 8:30 AM to 8:59 AM | 0 (0.0%) | 0 (0.0%) |
| 9:00 AM to 9:59 AM | 0 (0.0%) | 0 (0.0%) |
| 10:00 AM to 10:59 AM | 0 (0.0%) | 3 (1.9%) |
| 11:00 AM to 11:59 AM | 0 (0.0%) | 0 (0.0%) |
| 12:00 PM to 3:59 PM | 36 (23.8%) | 36 (22.9%) |
| 4:00 PM to 11:59 PM | 55 (36.4%) | 6 (3.8%) |
| Total | 151 (100.0%) | 157 (100.0%) |
Housing Occupancy in Pine Ridge
Occupancy by Ownership in Pine Ridge
Of the total 187 dwellings in Pine Ridge, owner-occupied units account for 141 (75.4%), while renter-occupied units make up 46 (24.6%).
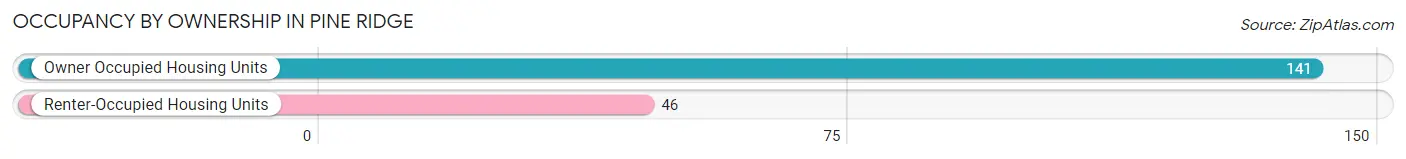
| Occupancy | # Housing Units | % Housing Units |
| Owner Occupied Housing Units | 141 | 75.4% |
| Renter-Occupied Housing Units | 46 | 24.6% |
| Total Occupied Housing Units | 187 | 100.0% |
Occupancy by Household Size in Pine Ridge
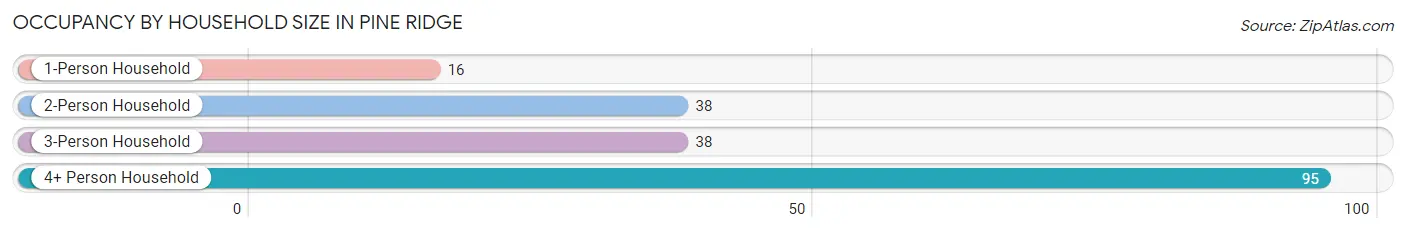
| Household Size | # Housing Units | % Housing Units |
| 1-Person Household | 16 | 8.6% |
| 2-Person Household | 38 | 20.3% |
| 3-Person Household | 38 | 20.3% |
| 4+ Person Household | 95 | 50.8% |
| Total Housing Units | 187 | 100.0% |
Occupancy by Ownership by Household Size in Pine Ridge
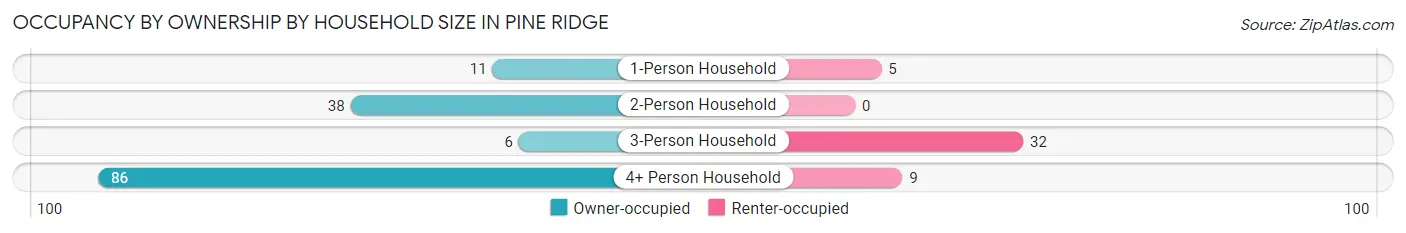
| Household Size | Owner-occupied | Renter-occupied |
| 1-Person Household | 11 (68.8%) | 5 (31.2%) |
| 2-Person Household | 38 (100.0%) | 0 (0.0%) |
| 3-Person Household | 6 (15.8%) | 32 (84.2%) |
| 4+ Person Household | 86 (90.5%) | 9 (9.5%) |
| Total Housing Units | 141 (75.4%) | 46 (24.6%) |
Occupancy by Educational Attainment in Pine Ridge
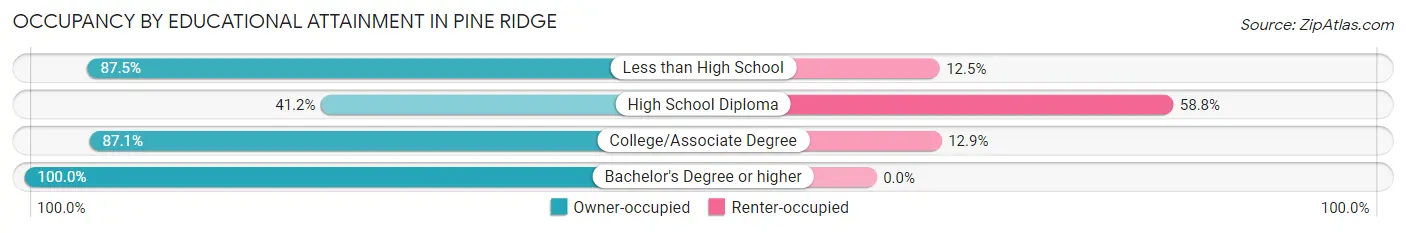
| Household Size | Owner-occupied | Renter-occupied |
| Less than High School | 56 (87.5%) | 8 (12.5%) |
| High School Diploma | 21 (41.2%) | 30 (58.8%) |
| College/Associate Degree | 54 (87.1%) | 8 (12.9%) |
| Bachelor's Degree or higher | 10 (100.0%) | 0 (0.0%) |
Occupancy by Age of Householder in Pine Ridge
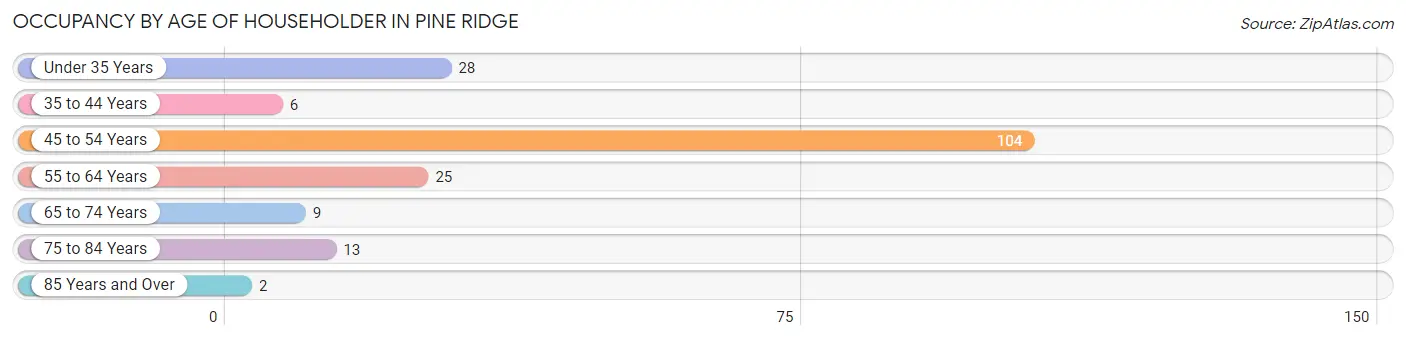
| Age Bracket | # Households | % Households |
| Under 35 Years | 28 | 15.0% |
| 35 to 44 Years | 6 | 3.2% |
| 45 to 54 Years | 104 | 55.6% |
| 55 to 64 Years | 25 | 13.4% |
| 65 to 74 Years | 9 | 4.8% |
| 75 to 84 Years | 13 | 7.0% |
| 85 Years and Over | 2 | 1.1% |
| Total | 187 | 100.0% |
Housing Finances in Pine Ridge
Median Income by Occupancy in Pine Ridge
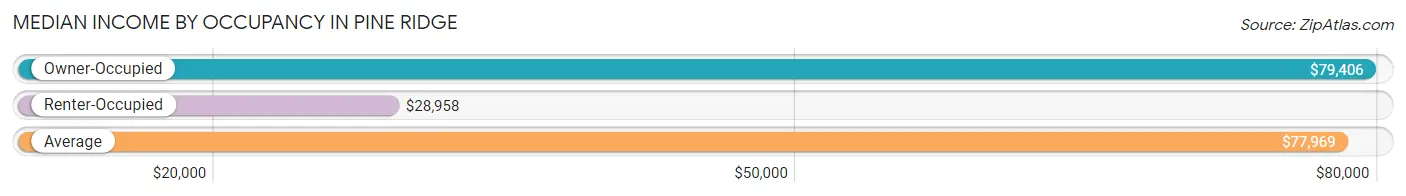
| Occupancy Type | # Households | Median Income |
| Owner-Occupied | 141 (75.4%) | $79,406 |
| Renter-Occupied | 46 (24.6%) | $28,958 |
| Average | 187 (100.0%) | $77,969 |
Occupancy by Householder Income Bracket in Pine Ridge
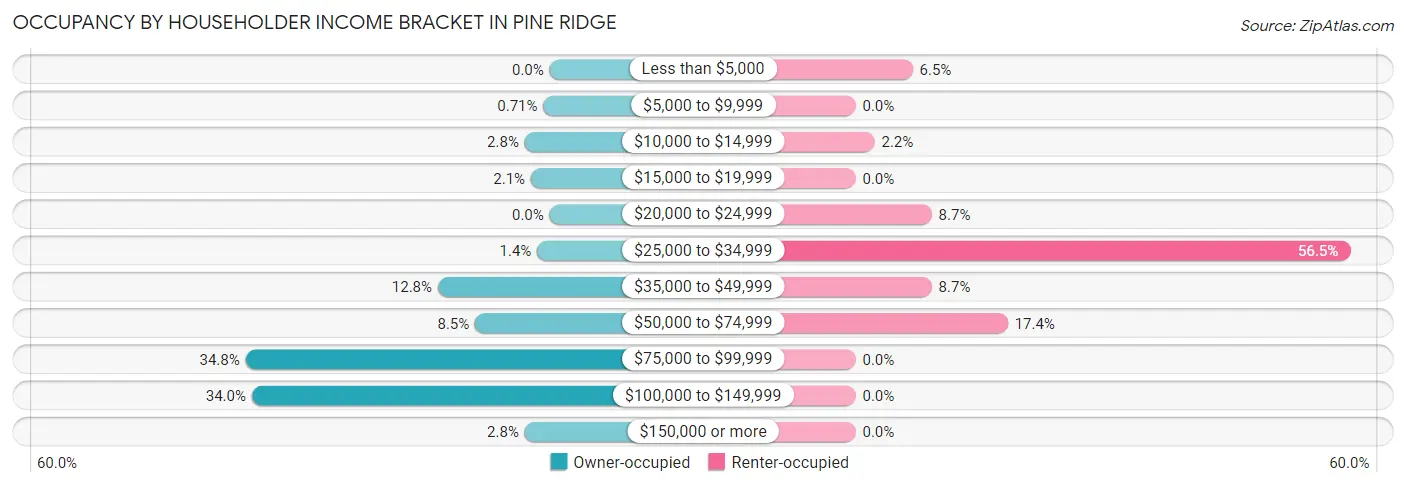
| Income Bracket | Owner-occupied | Renter-occupied |
| Less than $5,000 | 0 (0.0%) | 3 (6.5%) |
| $5,000 to $9,999 | 1 (0.7%) | 0 (0.0%) |
| $10,000 to $14,999 | 4 (2.8%) | 1 (2.2%) |
| $15,000 to $19,999 | 3 (2.1%) | 0 (0.0%) |
| $20,000 to $24,999 | 0 (0.0%) | 4 (8.7%) |
| $25,000 to $34,999 | 2 (1.4%) | 26 (56.5%) |
| $35,000 to $49,999 | 18 (12.8%) | 4 (8.7%) |
| $50,000 to $74,999 | 12 (8.5%) | 8 (17.4%) |
| $75,000 to $99,999 | 49 (34.7%) | 0 (0.0%) |
| $100,000 to $149,999 | 48 (34.0%) | 0 (0.0%) |
| $150,000 or more | 4 (2.8%) | 0 (0.0%) |
| Total | 141 (100.0%) | 46 (100.0%) |
Monthly Housing Cost Tiers in Pine Ridge
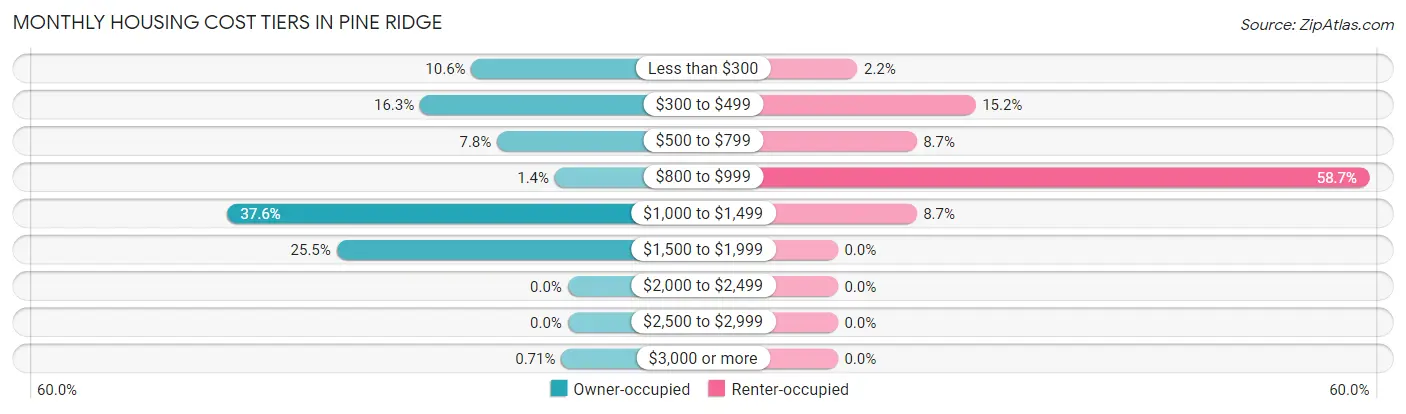
| Monthly Cost | Owner-occupied | Renter-occupied |
| Less than $300 | 15 (10.6%) | 1 (2.2%) |
| $300 to $499 | 23 (16.3%) | 7 (15.2%) |
| $500 to $799 | 11 (7.8%) | 4 (8.7%) |
| $800 to $999 | 2 (1.4%) | 27 (58.7%) |
| $1,000 to $1,499 | 53 (37.6%) | 4 (8.7%) |
| $1,500 to $1,999 | 36 (25.5%) | 0 (0.0%) |
| $2,000 to $2,499 | 0 (0.0%) | 0 (0.0%) |
| $2,500 to $2,999 | 0 (0.0%) | 0 (0.0%) |
| $3,000 or more | 1 (0.7%) | 0 (0.0%) |
| Total | 141 (100.0%) | 46 (100.0%) |
Physical Housing Characteristics in Pine Ridge
Housing Structures in Pine Ridge
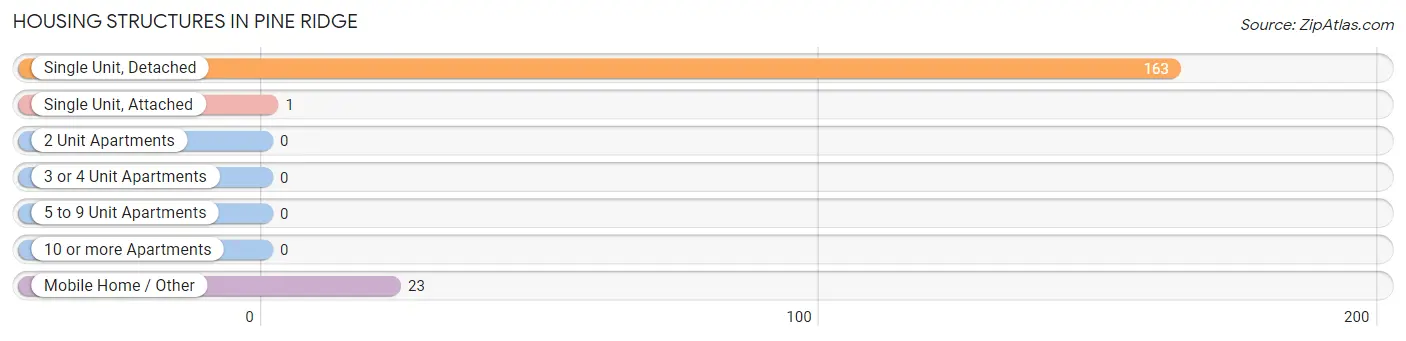
| Structure Type | # Housing Units | % Housing Units |
| Single Unit, Detached | 163 | 87.2% |
| Single Unit, Attached | 1 | 0.5% |
| 2 Unit Apartments | 0 | 0.0% |
| 3 or 4 Unit Apartments | 0 | 0.0% |
| 5 to 9 Unit Apartments | 0 | 0.0% |
| 10 or more Apartments | 0 | 0.0% |
| Mobile Home / Other | 23 | 12.3% |
| Total | 187 | 100.0% |
Housing Structures by Occupancy in Pine Ridge
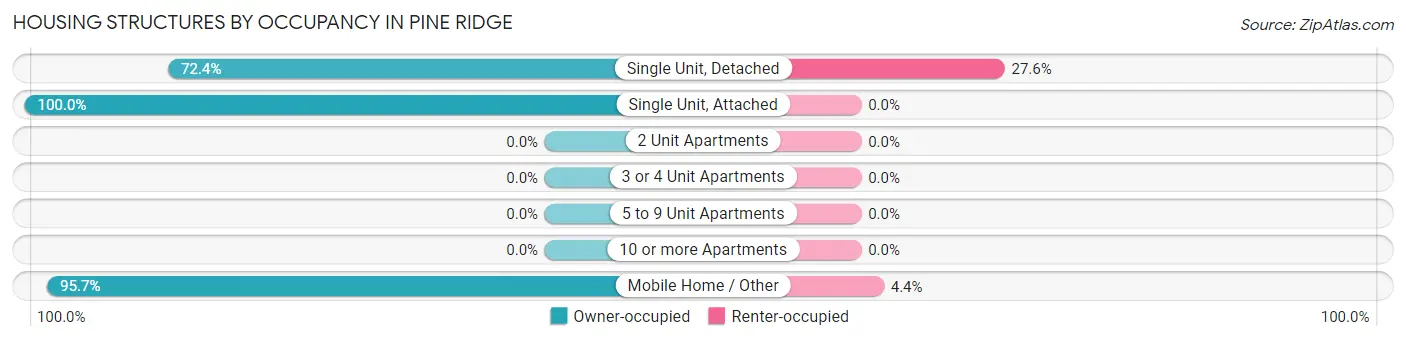
| Structure Type | Owner-occupied | Renter-occupied |
| Single Unit, Detached | 118 (72.4%) | 45 (27.6%) |
| Single Unit, Attached | 1 (100.0%) | 0 (0.0%) |
| 2 Unit Apartments | 0 (0.0%) | 0 (0.0%) |
| 3 or 4 Unit Apartments | 0 (0.0%) | 0 (0.0%) |
| 5 to 9 Unit Apartments | 0 (0.0%) | 0 (0.0%) |
| 10 or more Apartments | 0 (0.0%) | 0 (0.0%) |
| Mobile Home / Other | 22 (95.7%) | 1 (4.3%) |
| Total | 141 (75.4%) | 46 (24.6%) |
Housing Structures by Number of Rooms in Pine Ridge
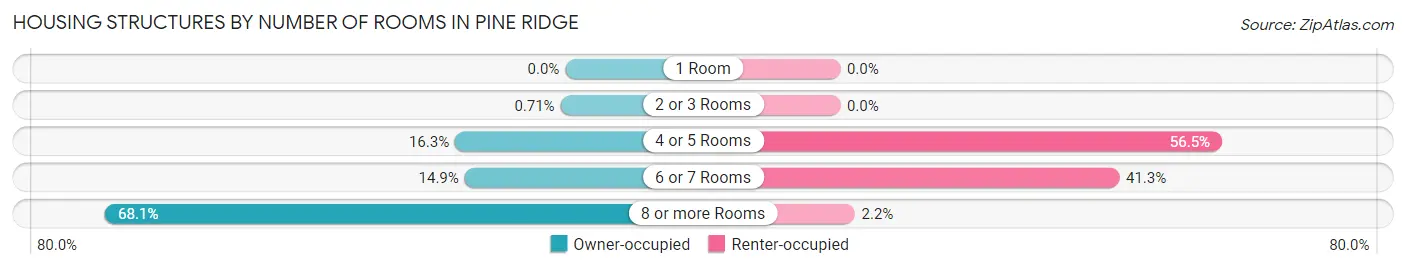
| Number of Rooms | Owner-occupied | Renter-occupied |
| 1 Room | 0 (0.0%) | 0 (0.0%) |
| 2 or 3 Rooms | 1 (0.7%) | 0 (0.0%) |
| 4 or 5 Rooms | 23 (16.3%) | 26 (56.5%) |
| 6 or 7 Rooms | 21 (14.9%) | 19 (41.3%) |
| 8 or more Rooms | 96 (68.1%) | 1 (2.2%) |
| Total | 141 (100.0%) | 46 (100.0%) |
Housing Structure by Heating Type in Pine Ridge
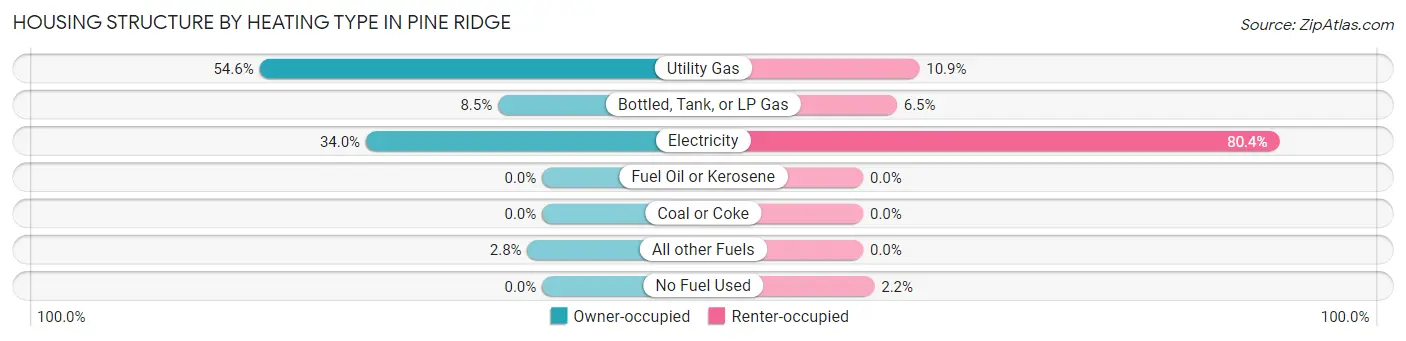
| Heating Type | Owner-occupied | Renter-occupied |
| Utility Gas | 77 (54.6%) | 5 (10.9%) |
| Bottled, Tank, or LP Gas | 12 (8.5%) | 3 (6.5%) |
| Electricity | 48 (34.0%) | 37 (80.4%) |
| Fuel Oil or Kerosene | 0 (0.0%) | 0 (0.0%) |
| Coal or Coke | 0 (0.0%) | 0 (0.0%) |
| All other Fuels | 4 (2.8%) | 0 (0.0%) |
| No Fuel Used | 0 (0.0%) | 1 (2.2%) |
| Total | 141 (100.0%) | 46 (100.0%) |
Household Vehicle Usage in Pine Ridge
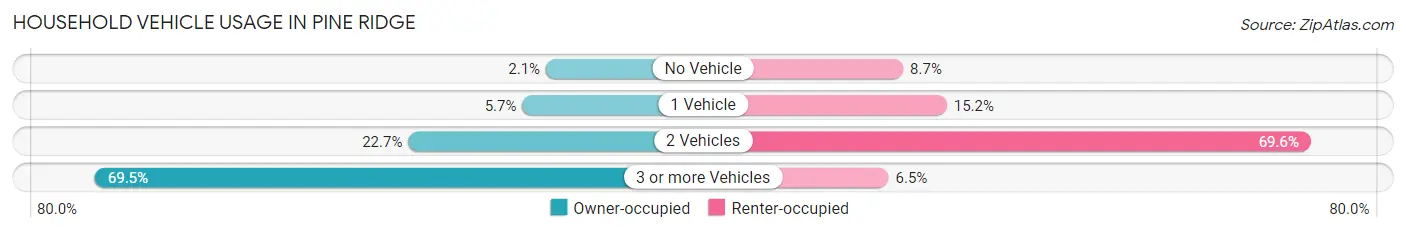
| Vehicles per Household | Owner-occupied | Renter-occupied |
| No Vehicle | 3 (2.1%) | 4 (8.7%) |
| 1 Vehicle | 8 (5.7%) | 7 (15.2%) |
| 2 Vehicles | 32 (22.7%) | 32 (69.6%) |
| 3 or more Vehicles | 98 (69.5%) | 3 (6.5%) |
| Total | 141 (100.0%) | 46 (100.0%) |
Real Estate & Mortgages in Pine Ridge
Real Estate and Mortgage Overview in Pine Ridge
| Characteristic | Without Mortgage | With Mortgage |
| Housing Units | 45 | 96 |
| Median Property Value | - | - |
| Median Household Income | $67,679 | $0 |
| Monthly Housing Costs | $338 | $1 |
| Real Estate Taxes | $320 | $3 |
Property Value by Mortgage Status in Pine Ridge
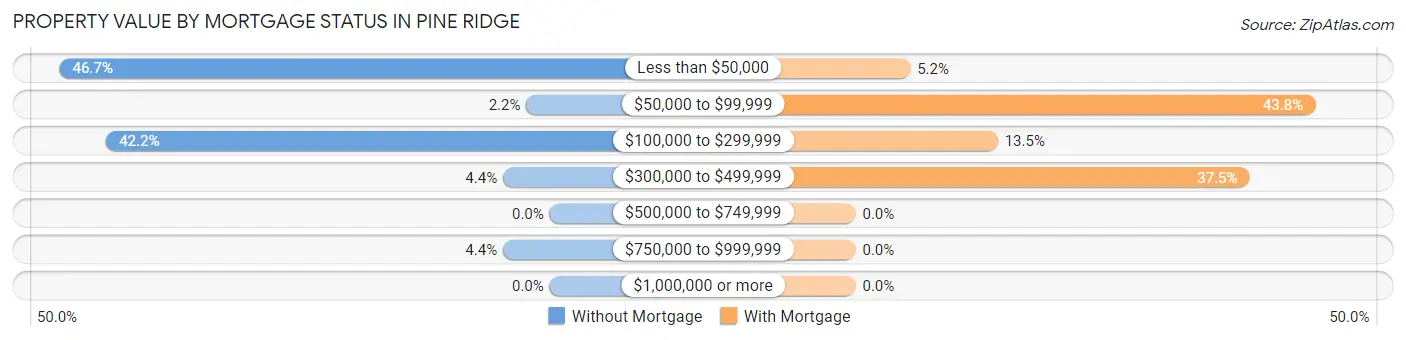
| Property Value | Without Mortgage | With Mortgage |
| Less than $50,000 | 21 (46.7%) | 5 (5.2%) |
| $50,000 to $99,999 | 1 (2.2%) | 42 (43.8%) |
| $100,000 to $299,999 | 19 (42.2%) | 13 (13.5%) |
| $300,000 to $499,999 | 2 (4.4%) | 36 (37.5%) |
| $500,000 to $749,999 | 0 (0.0%) | 0 (0.0%) |
| $750,000 to $999,999 | 2 (4.4%) | 0 (0.0%) |
| $1,000,000 or more | 0 (0.0%) | 0 (0.0%) |
| Total | 45 (100.0%) | 96 (100.0%) |
Household Income by Mortgage Status in Pine Ridge
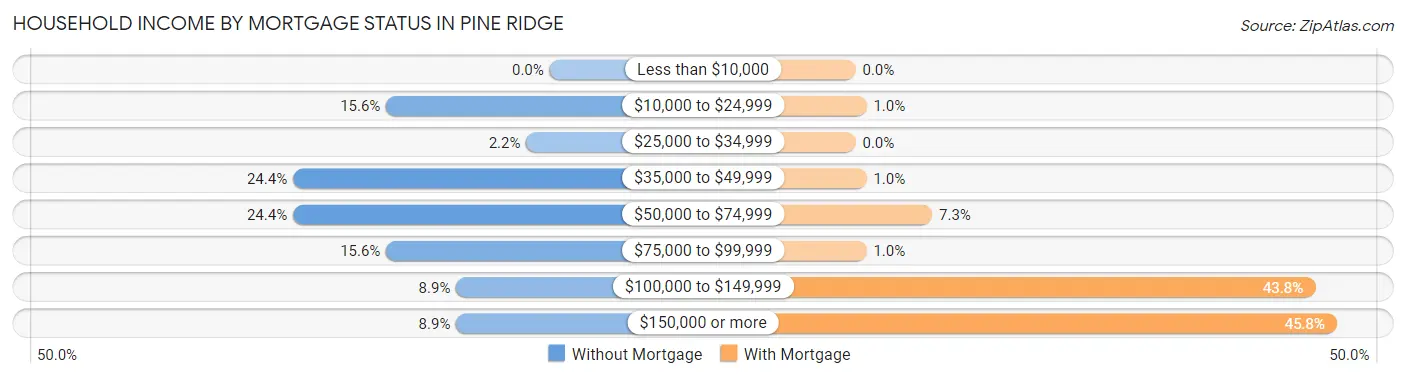
| Household Income | Without Mortgage | With Mortgage |
| Less than $10,000 | 0 (0.0%) | 0 (0.0%) |
| $10,000 to $24,999 | 7 (15.6%) | 1 (1.0%) |
| $25,000 to $34,999 | 1 (2.2%) | 0 (0.0%) |
| $35,000 to $49,999 | 11 (24.4%) | 1 (1.0%) |
| $50,000 to $74,999 | 11 (24.4%) | 7 (7.3%) |
| $75,000 to $99,999 | 7 (15.6%) | 1 (1.0%) |
| $100,000 to $149,999 | 4 (8.9%) | 42 (43.8%) |
| $150,000 or more | 4 (8.9%) | 44 (45.8%) |
| Total | 45 (100.0%) | 96 (100.0%) |
Property Value to Household Income Ratio in Pine Ridge
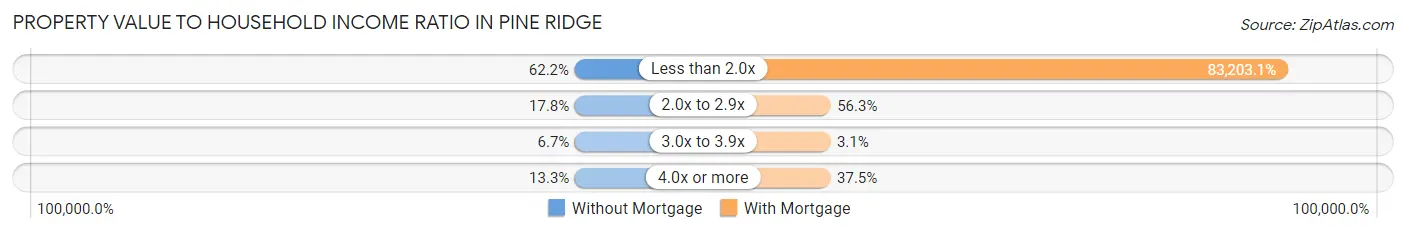
| Value-to-Income Ratio | Without Mortgage | With Mortgage |
| Less than 2.0x | 28 (62.2%) | 79,875 (83,203.1%) |
| 2.0x to 2.9x | 8 (17.8%) | 54 (56.2%) |
| 3.0x to 3.9x | 3 (6.7%) | 3 (3.1%) |
| 4.0x or more | 6 (13.3%) | 36 (37.5%) |
| Total | 45 (100.0%) | 96 (100.0%) |
Real Estate Taxes by Mortgage Status in Pine Ridge
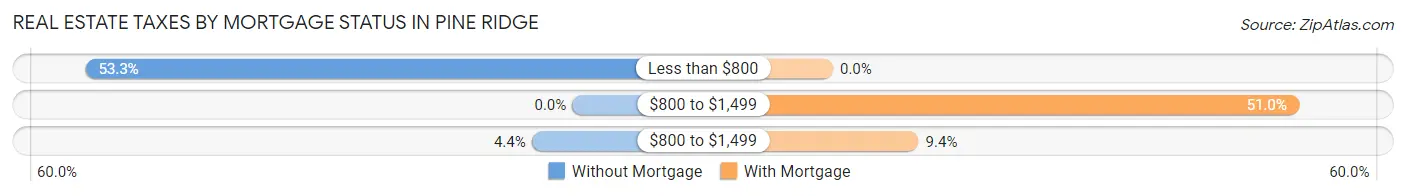
| Property Taxes | Without Mortgage | With Mortgage |
| Less than $800 | 24 (53.3%) | 0 (0.0%) |
| $800 to $1,499 | 0 (0.0%) | 49 (51.0%) |
| $800 to $1,499 | 2 (4.4%) | 9 (9.4%) |
| Total | 45 (100.0%) | 96 (100.0%) |
Health & Disability in Pine Ridge
Health Insurance Coverage by Age in Pine Ridge
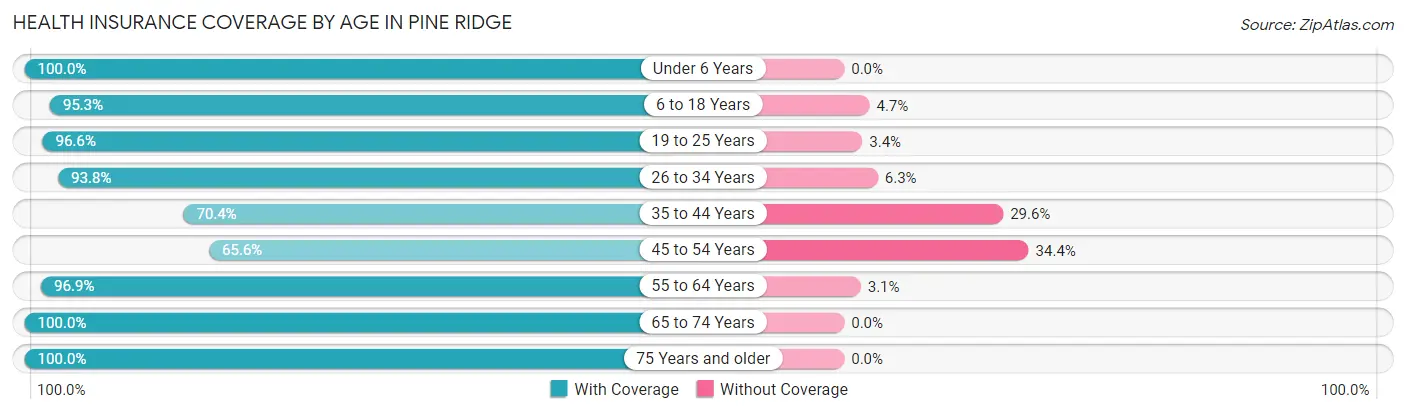
| Age Bracket | With Coverage | Without Coverage |
| Under 6 Years | 62 (100.0%) | 0 (0.0%) |
| 6 to 18 Years | 81 (95.3%) | 4 (4.7%) |
| 19 to 25 Years | 144 (96.6%) | 5 (3.4%) |
| 26 to 34 Years | 75 (93.8%) | 5 (6.2%) |
| 35 to 44 Years | 19 (70.4%) | 8 (29.6%) |
| 45 to 54 Years | 84 (65.6%) | 44 (34.4%) |
| 55 to 64 Years | 63 (96.9%) | 2 (3.1%) |
| 65 to 74 Years | 20 (100.0%) | 0 (0.0%) |
| 75 Years and older | 19 (100.0%) | 0 (0.0%) |
| Total | 567 (89.3%) | 68 (10.7%) |
Health Insurance Coverage by Citizenship Status in Pine Ridge
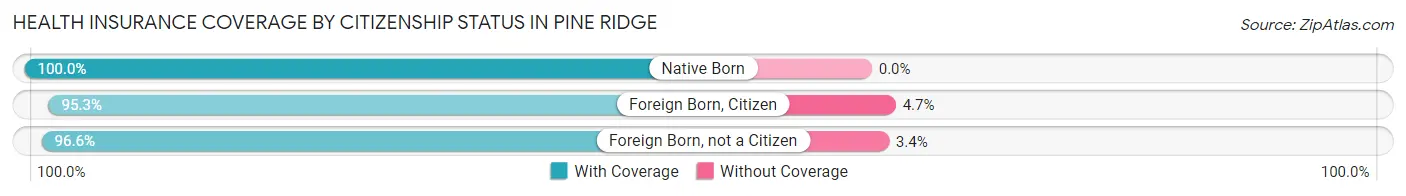
| Citizenship Status | With Coverage | Without Coverage |
| Native Born | 62 (100.0%) | 0 (0.0%) |
| Foreign Born, Citizen | 81 (95.3%) | 4 (4.7%) |
| Foreign Born, not a Citizen | 144 (96.6%) | 5 (3.4%) |
Health Insurance Coverage by Household Income in Pine Ridge
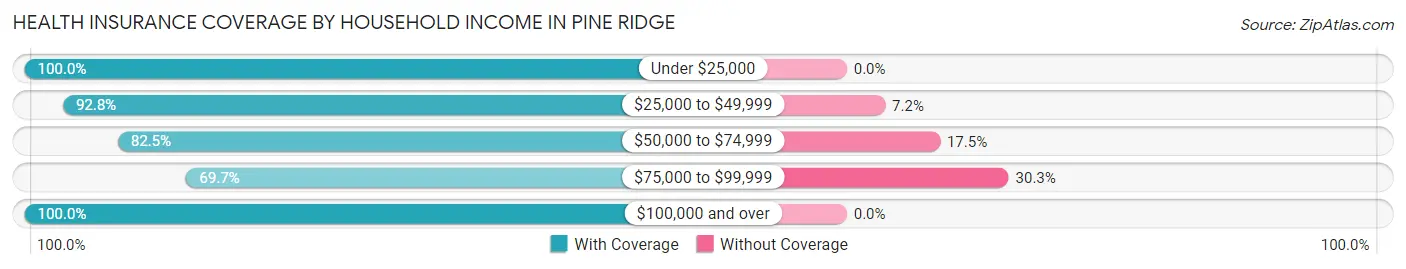
| Household Income | With Coverage | Without Coverage |
| Under $25,000 | 37 (100.0%) | 0 (0.0%) |
| $25,000 to $49,999 | 129 (92.8%) | 10 (7.2%) |
| $50,000 to $74,999 | 52 (82.5%) | 11 (17.5%) |
| $75,000 to $99,999 | 108 (69.7%) | 47 (30.3%) |
| $100,000 and over | 241 (100.0%) | 0 (0.0%) |
Public vs Private Health Insurance Coverage by Age in Pine Ridge
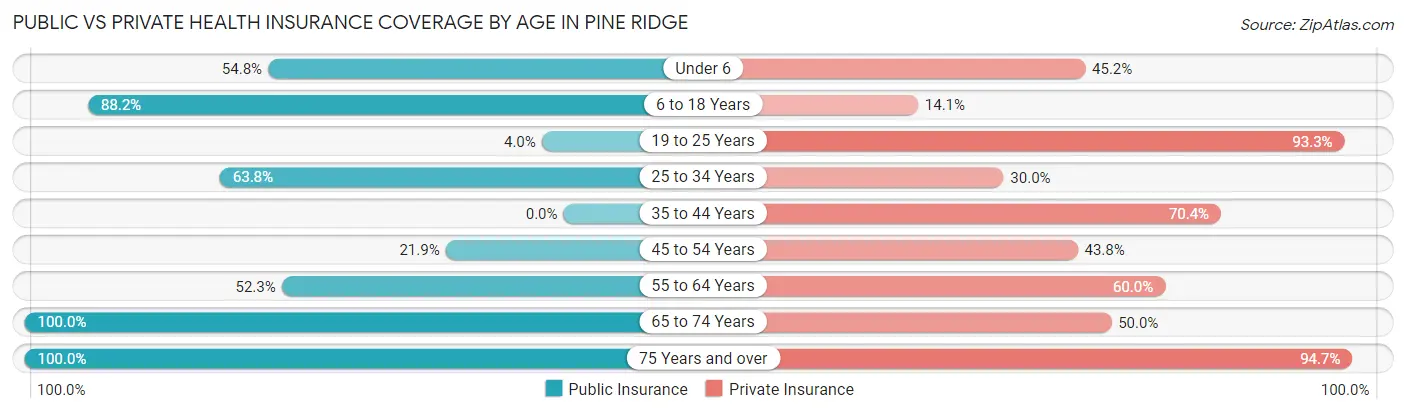
| Age Bracket | Public Insurance | Private Insurance |
| Under 6 | 34 (54.8%) | 28 (45.2%) |
| 6 to 18 Years | 75 (88.2%) | 12 (14.1%) |
| 19 to 25 Years | 6 (4.0%) | 139 (93.3%) |
| 25 to 34 Years | 51 (63.7%) | 24 (30.0%) |
| 35 to 44 Years | 0 (0.0%) | 19 (70.4%) |
| 45 to 54 Years | 28 (21.9%) | 56 (43.8%) |
| 55 to 64 Years | 34 (52.3%) | 39 (60.0%) |
| 65 to 74 Years | 20 (100.0%) | 10 (50.0%) |
| 75 Years and over | 19 (100.0%) | 18 (94.7%) |
| Total | 267 (42.0%) | 345 (54.3%) |
Disability Status by Sex by Age in Pine Ridge
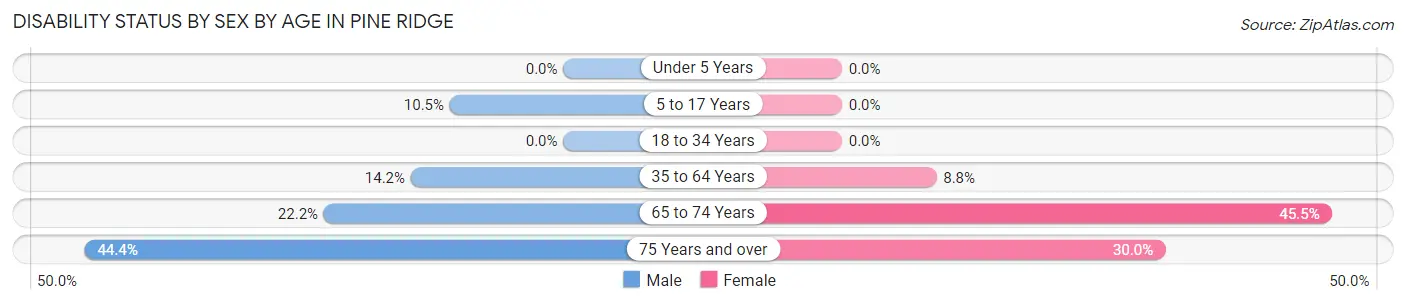
| Age Bracket | Male | Female |
| Under 5 Years | 0 (0.0%) | 0 (0.0%) |
| 5 to 17 Years | 4 (10.5%) | 0 (0.0%) |
| 18 to 34 Years | 0 (0.0%) | 0 (0.0%) |
| 35 to 64 Years | 15 (14.1%) | 10 (8.8%) |
| 65 to 74 Years | 2 (22.2%) | 5 (45.5%) |
| 75 Years and over | 4 (44.4%) | 3 (30.0%) |
Disability Class by Sex by Age in Pine Ridge
Disability Class: Hearing Difficulty
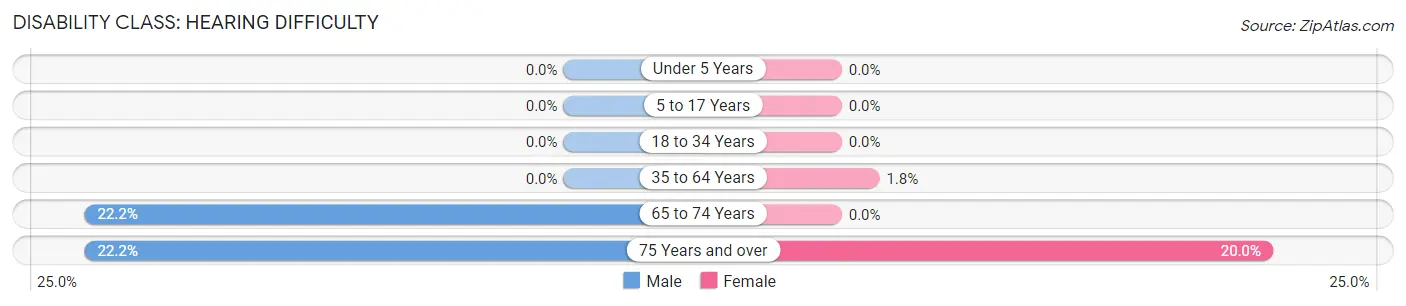
| Age Bracket | Male | Female |
| Under 5 Years | 0 (0.0%) | 0 (0.0%) |
| 5 to 17 Years | 0 (0.0%) | 0 (0.0%) |
| 18 to 34 Years | 0 (0.0%) | 0 (0.0%) |
| 35 to 64 Years | 0 (0.0%) | 2 (1.8%) |
| 65 to 74 Years | 2 (22.2%) | 0 (0.0%) |
| 75 Years and over | 2 (22.2%) | 2 (20.0%) |
Disability Class: Vision Difficulty
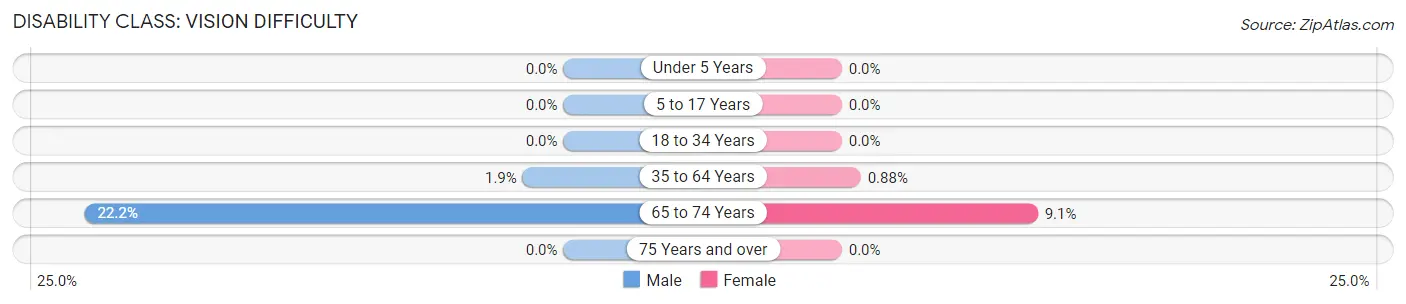
| Age Bracket | Male | Female |
| Under 5 Years | 0 (0.0%) | 0 (0.0%) |
| 5 to 17 Years | 0 (0.0%) | 0 (0.0%) |
| 18 to 34 Years | 0 (0.0%) | 0 (0.0%) |
| 35 to 64 Years | 2 (1.9%) | 1 (0.9%) |
| 65 to 74 Years | 2 (22.2%) | 1 (9.1%) |
| 75 Years and over | 0 (0.0%) | 0 (0.0%) |
Disability Class: Cognitive Difficulty
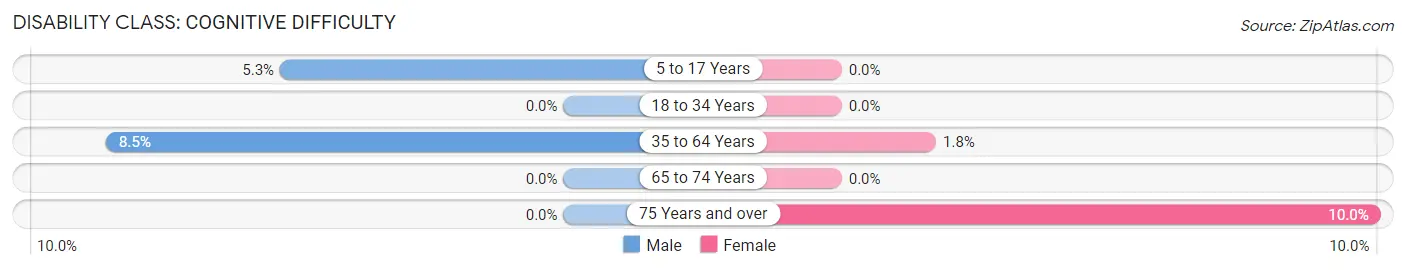
| Age Bracket | Male | Female |
| 5 to 17 Years | 2 (5.3%) | 0 (0.0%) |
| 18 to 34 Years | 0 (0.0%) | 0 (0.0%) |
| 35 to 64 Years | 9 (8.5%) | 2 (1.8%) |
| 65 to 74 Years | 0 (0.0%) | 0 (0.0%) |
| 75 Years and over | 0 (0.0%) | 1 (10.0%) |
Disability Class: Ambulatory Difficulty
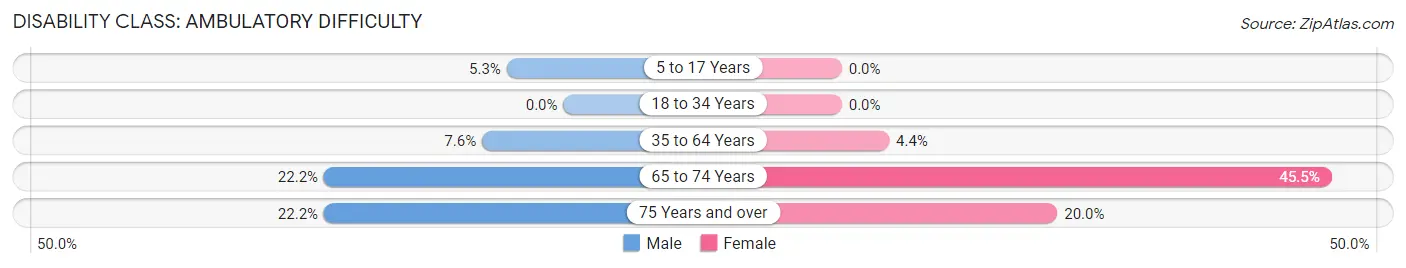
| Age Bracket | Male | Female |
| 5 to 17 Years | 2 (5.3%) | 0 (0.0%) |
| 18 to 34 Years | 0 (0.0%) | 0 (0.0%) |
| 35 to 64 Years | 8 (7.5%) | 5 (4.4%) |
| 65 to 74 Years | 2 (22.2%) | 5 (45.5%) |
| 75 Years and over | 2 (22.2%) | 2 (20.0%) |
Disability Class: Self-Care Difficulty
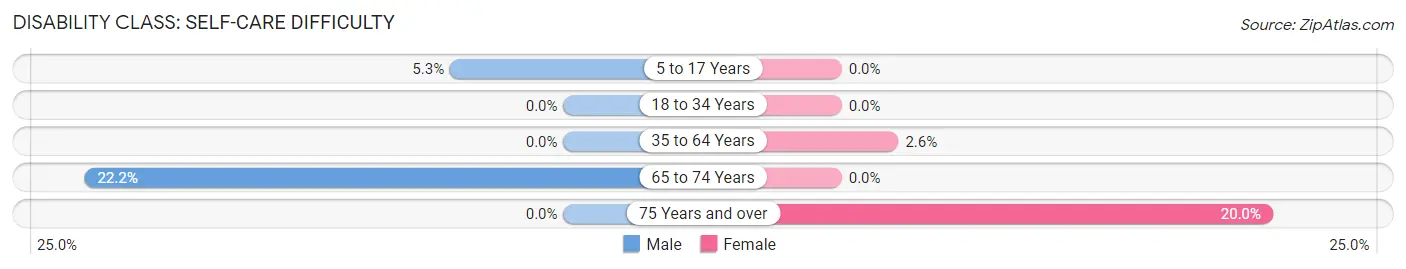
| Age Bracket | Male | Female |
| 5 to 17 Years | 2 (5.3%) | 0 (0.0%) |
| 18 to 34 Years | 0 (0.0%) | 0 (0.0%) |
| 35 to 64 Years | 0 (0.0%) | 3 (2.6%) |
| 65 to 74 Years | 2 (22.2%) | 0 (0.0%) |
| 75 Years and over | 0 (0.0%) | 2 (20.0%) |
Technology Access in Pine Ridge
Computing Device Access in Pine Ridge
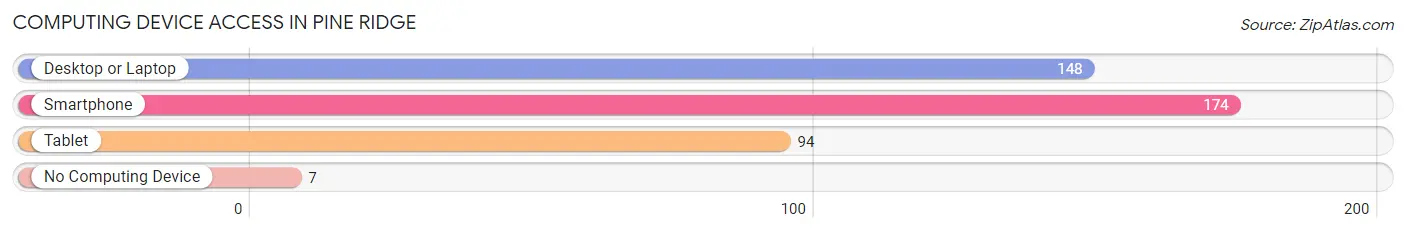
| Device Type | # Households | % Households |
| Desktop or Laptop | 148 | 79.1% |
| Smartphone | 174 | 93.0% |
| Tablet | 94 | 50.3% |
| No Computing Device | 7 | 3.7% |
| Total | 187 | 100.0% |
Internet Access in Pine Ridge
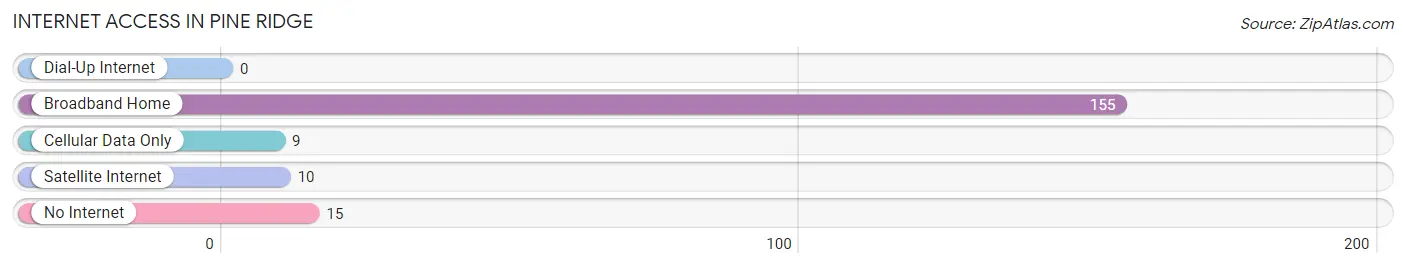
| Internet Type | # Households | % Households |
| Dial-Up Internet | 0 | 0.0% |
| Broadband Home | 155 | 82.9% |
| Cellular Data Only | 9 | 4.8% |
| Satellite Internet | 10 | 5.3% |
| No Internet | 15 | 8.0% |
| Total | 187 | 100.0% |
Pine Ridge Summary
Pine Ridge is a small unincorporated community located in the northwest corner of Alabama, in the foothills of the Appalachian Mountains. It is situated in the northwest corner of Winston County, and is bordered by the towns of Double Springs and Haleyville. The population of Pine Ridge was estimated to be around 500 people in 2000.
History
Pine Ridge was first settled in the early 1800s by settlers from North Carolina and Virginia. The area was originally known as “Piney Ridge”, and was later shortened to “Pine Ridge”. The first post office in the area was established in 1845, and the town was officially incorporated in 1887.
The town was originally a farming community, and the main crops grown were cotton, corn, and tobacco. The town also had a sawmill and a gristmill, which were important to the local economy.
In the late 1800s, the town began to grow and develop. The first school was built in 1891, and the first church was built in 1895. The town also had a general store, a blacksmith shop, and a hotel.
Geography
Pine Ridge is located in the northwest corner of Winston County, Alabama. It is situated in the foothills of the Appalachian Mountains, and is surrounded by rolling hills and forests. The town is located about 25 miles from the city of Birmingham, and is about an hour and a half drive from the state capital of Montgomery.
The town is located at the intersection of two major highways, US Highway 278 and Alabama State Route 13. The town is also located near the Sipsey Wilderness, which is a popular destination for hikers and campers.
Economy
The economy of Pine Ridge is largely based on agriculture. The main crops grown in the area are cotton, corn, and tobacco. The town also has a few small businesses, including a general store, a gas station, and a few restaurants.
The town is also home to a few small manufacturing companies, including a furniture factory and a woodworking shop. The town also has a few small service businesses, such as a barber shop and a beauty salon.
Demographics
The population of Pine Ridge was estimated to be around 500 people in 2000. The town is predominantly white, with a small African American population. The median household income in the town is around $30,000, and the median home value is around $80,000.
The town is served by the Winston County School District, and the town has one elementary school and one high school. The town also has a few churches, including a Baptist church, a Methodist church, and a Pentecostal church.
Conclusion
Pine Ridge is a small unincorporated community located in the northwest corner of Alabama. The town has a long history, and was originally a farming community. The economy of the town is largely based on agriculture, and the town also has a few small businesses. The population of Pine Ridge was estimated to be around 500 people in 2000, and the town is predominantly white. The town is served by the Winston County School District, and the town has one elementary school and one high school.
Common Questions
What is Per Capita Income in Pine Ridge?
Per Capita income in Pine Ridge is $20,543.
What is the Median Family Income in Pine Ridge?
Median Family Income in Pine Ridge is $78,500.
What is the Median Household income in Pine Ridge?
Median Household Income in Pine Ridge is $77,969.
What is Income or Wage Gap in Pine Ridge?
Income or Wage Gap in Pine Ridge is 28.6%.
Women in Pine Ridge earn 71.4 cents for every dollar earned by a man.
What is Inequality or Gini Index in Pine Ridge?
Inequality or Gini Index in Pine Ridge is 0.32.
What is the Total Population of Pine Ridge?
Total Population of Pine Ridge is 635.
What is the Total Male Population of Pine Ridge?
Total Male Population of Pine Ridge is 316.
What is the Total Female Population of Pine Ridge?
Total Female Population of Pine Ridge is 319.
What is the Ratio of Males per 100 Females in Pine Ridge?
There are 99.06 Males per 100 Females in Pine Ridge.
What is the Ratio of Females per 100 Males in Pine Ridge?
There are 100.95 Females per 100 Males in Pine Ridge.
What is the Median Population Age in Pine Ridge?
Median Population Age in Pine Ridge is 26.6 Years.
What is the Average Family Size in Pine Ridge
Average Family Size in Pine Ridge is 3.6 People.
What is the Average Household Size in Pine Ridge
Average Household Size in Pine Ridge is 3.4 People.
How Large is the Labor Force in Pine Ridge?
There are 319 People in the Labor Forcein in Pine Ridge.
What is the Percentage of People in the Labor Force in Pine Ridge?
60.6% of People are in the Labor Force in Pine Ridge.
What is the Unemployment Rate in Pine Ridge?
Unemployment Rate in Pine Ridge is 2.5%.