Ginger Blue, MO Map & Demographics
Ginger Blue Map
Ginger Blue Overview
$24,835
PER CAPITA INCOME
$84,167
AVG FAMILY INCOME
$36,181
AVG HOUSEHOLD INCOME
30.0%
WAGE / INCOME GAP [ % ]
70.0¢/ $1
WAGE / INCOME GAP [ $ ]
0.24
INEQUALITY / GINI INDEX
113
TOTAL POPULATION
74
MALE POPULATION
39
FEMALE POPULATION
189.74
MALES / 100 FEMALES
52.70
FEMALES / 100 MALES
52.4
MEDIAN AGE
11.2
AVG FAMILY SIZE
2.2
AVG HOUSEHOLD SIZE
76
LABOR FORCE [ PEOPLE ]
83.5%
PERCENT IN LABOR FORCE
Income in Ginger Blue
Income Overview in Ginger Blue
Per Capita Income in Ginger Blue is $24,835, while median incomes of families and households are $84,167 and $36,181 respectively.
| Characteristic | Number | Measure |
| Per Capita Income | 113 | $24,835 |
| Median Family Income | 6 | $84,167 |
| Mean Family Income | 6 | $81,467 |
| Median Household Income | 52 | $36,181 |
| Mean Household Income | 52 | $36,756 |
| Income Deficit | 6 | $0 |
| Wage / Income Gap (%) | 113 | 29.96% |
| Wage / Income Gap ($) | 113 | 70.04¢ per $1 |
| Gini / Inequality Index | 113 | 0.24 |
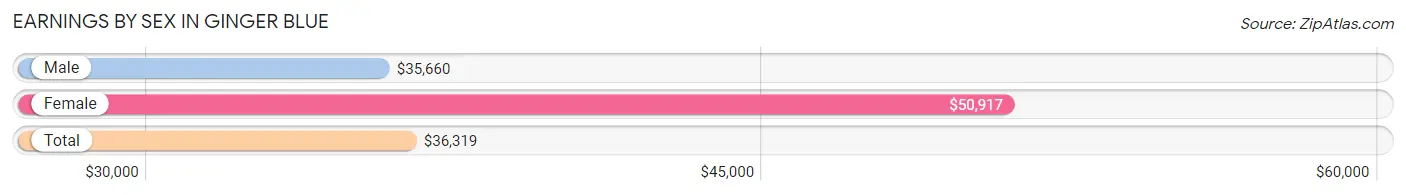
Earnings by Sex in Ginger Blue
Average Earnings in Ginger Blue are $36,319, $35,660 for men and $50,917 for women, a difference of 30.0%.
| Sex | Number | Average Earnings |
| Male | 57 (75.0%) | $35,660 |
| Female | 19 (25.0%) | $50,917 |
| Total | 76 (100.0%) | $36,319 |
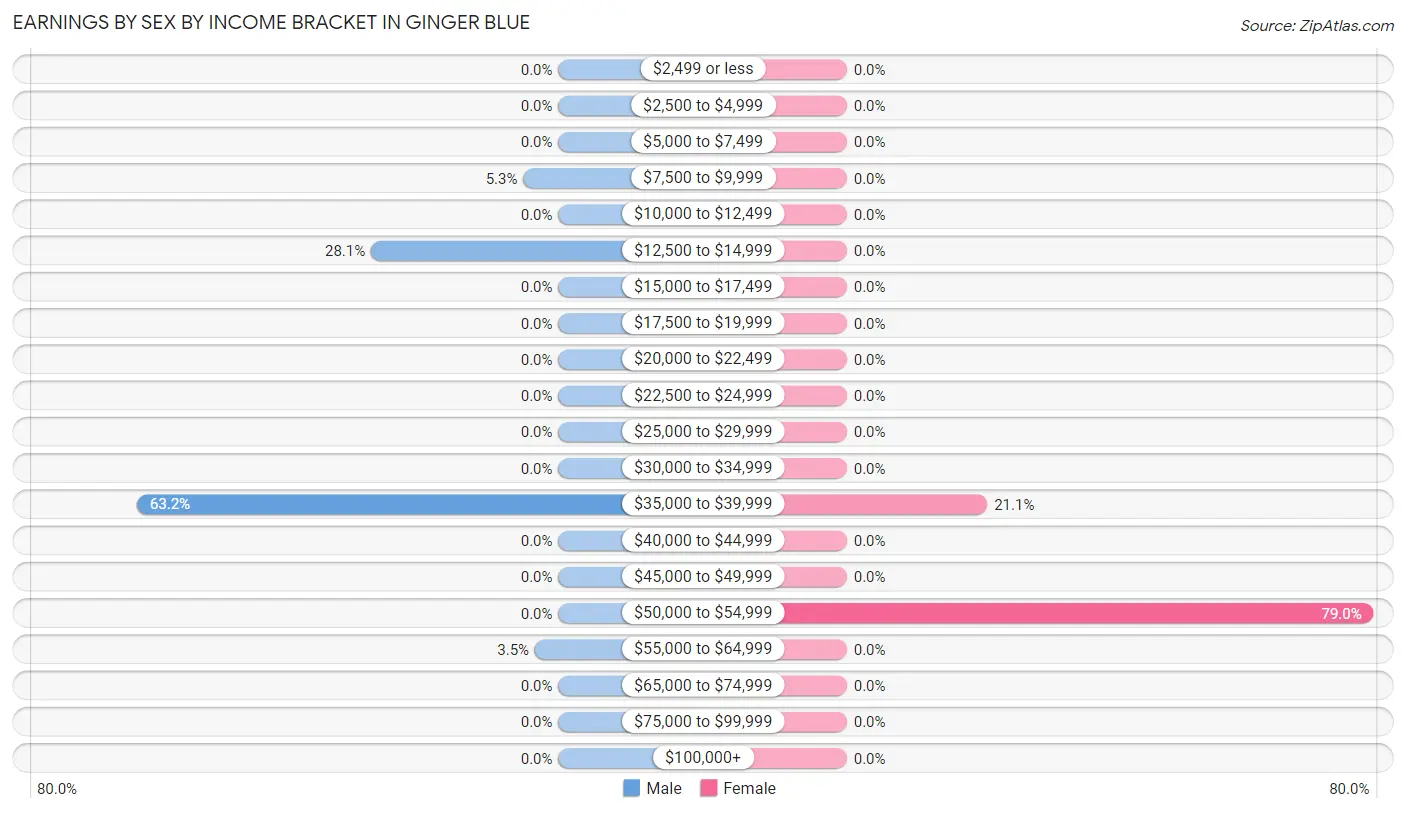
Earnings by Sex by Income Bracket in Ginger Blue
The most common earnings brackets in Ginger Blue are $35,000 to $39,999 for men (36 | 63.2%) and $50,000 to $54,999 for women (15 | 78.9%).
| Income | Male | Female |
| $2,499 or less | 0 (0.0%) | 0 (0.0%) |
| $2,500 to $4,999 | 0 (0.0%) | 0 (0.0%) |
| $5,000 to $7,499 | 0 (0.0%) | 0 (0.0%) |
| $7,500 to $9,999 | 3 (5.3%) | 0 (0.0%) |
| $10,000 to $12,499 | 0 (0.0%) | 0 (0.0%) |
| $12,500 to $14,999 | 16 (28.1%) | 0 (0.0%) |
| $15,000 to $17,499 | 0 (0.0%) | 0 (0.0%) |
| $17,500 to $19,999 | 0 (0.0%) | 0 (0.0%) |
| $20,000 to $22,499 | 0 (0.0%) | 0 (0.0%) |
| $22,500 to $24,999 | 0 (0.0%) | 0 (0.0%) |
| $25,000 to $29,999 | 0 (0.0%) | 0 (0.0%) |
| $30,000 to $34,999 | 0 (0.0%) | 0 (0.0%) |
| $35,000 to $39,999 | 36 (63.2%) | 4 (21.0%) |
| $40,000 to $44,999 | 0 (0.0%) | 0 (0.0%) |
| $45,000 to $49,999 | 0 (0.0%) | 0 (0.0%) |
| $50,000 to $54,999 | 0 (0.0%) | 15 (78.9%) |
| $55,000 to $64,999 | 2 (3.5%) | 0 (0.0%) |
| $65,000 to $74,999 | 0 (0.0%) | 0 (0.0%) |
| $75,000 to $99,999 | 0 (0.0%) | 0 (0.0%) |
| $100,000+ | 0 (0.0%) | 0 (0.0%) |
| Total | 57 (100.0%) | 19 (100.0%) |
Earnings by Sex by Educational Attainment in Ginger Blue
| Educational Attainment | Male Income | Female Income |
| Less than High School | - | - |
| High School Diploma | - | - |
| College or Associate's Degree | - | - |
| Bachelor's Degree | - | - |
| Graduate Degree | - | - |
| Total | $35,660 | $50,917 |
Family Income in Ginger Blue
Family Income Brackets in Ginger Blue
According to the Ginger Blue family income data, there are 5 families falling into the $75,000 to $99,999 income range, which is the most common income bracket and makes up 83.3% of all families.
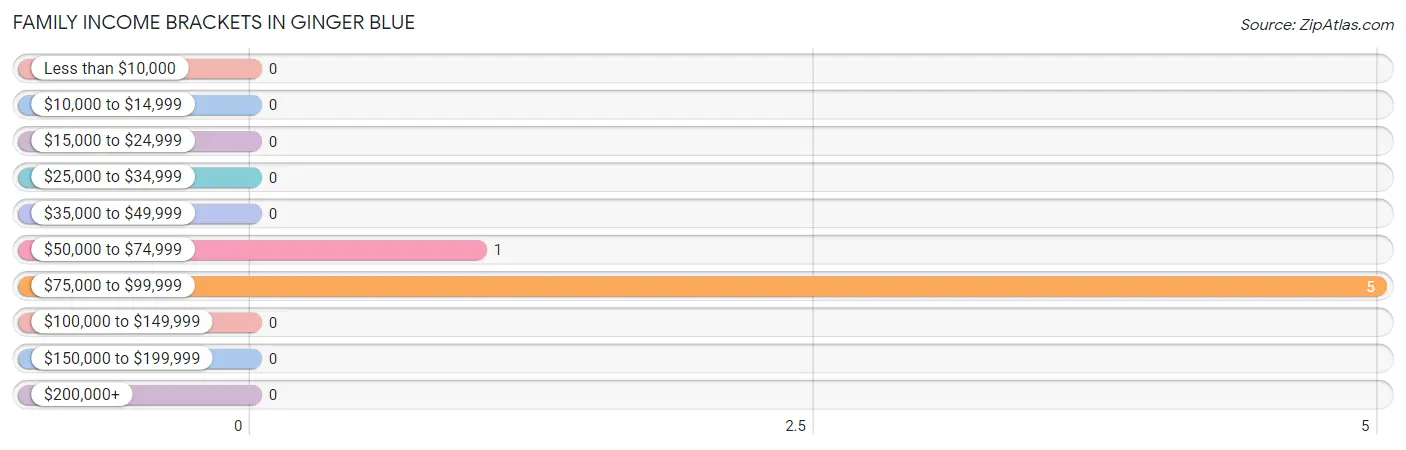
| Income Bracket | # Families | % Families |
| Less than $10,000 | 0 | 0.0% |
| $10,000 to $14,999 | 0 | 0.0% |
| $15,000 to $24,999 | 0 | 0.0% |
| $25,000 to $34,999 | 0 | 0.0% |
| $35,000 to $49,999 | 0 | 0.0% |
| $50,000 to $74,999 | 1 | 16.7% |
| $75,000 to $99,999 | 5 | 83.3% |
| $100,000 to $149,999 | 0 | 0.0% |
| $150,000 to $199,999 | 0 | 0.0% |
| $200,000+ | 0 | 0.0% |
Family Income by Famaliy Size in Ginger Blue
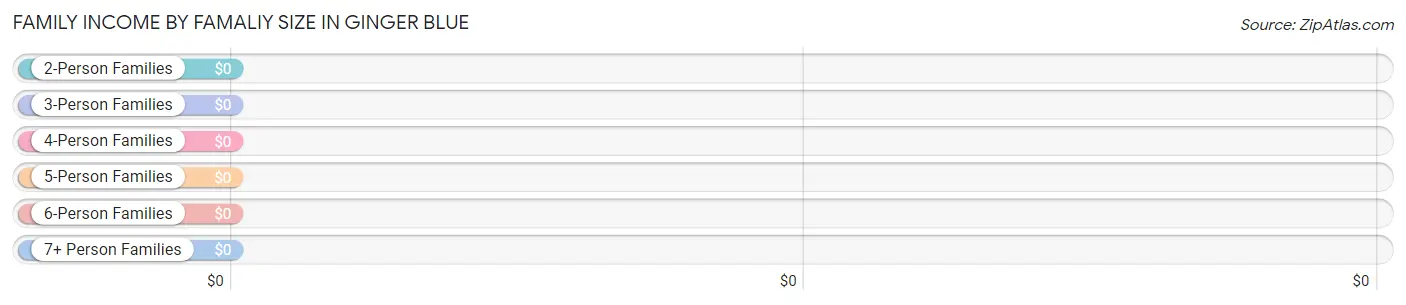
| Income Bracket | # Families | Median Income |
| 2-Person Families | 3 (50.0%) | $0 |
| 3-Person Families | 0 (0.0%) | $0 |
| 4-Person Families | 0 (0.0%) | $0 |
| 5-Person Families | 0 (0.0%) | $0 |
| 6-Person Families | 0 (0.0%) | $0 |
| 7+ Person Families | 3 (50.0%) | $0 |
| Total | 6 (100.0%) | $84,167 |
Family Income by Number of Earners in Ginger Blue
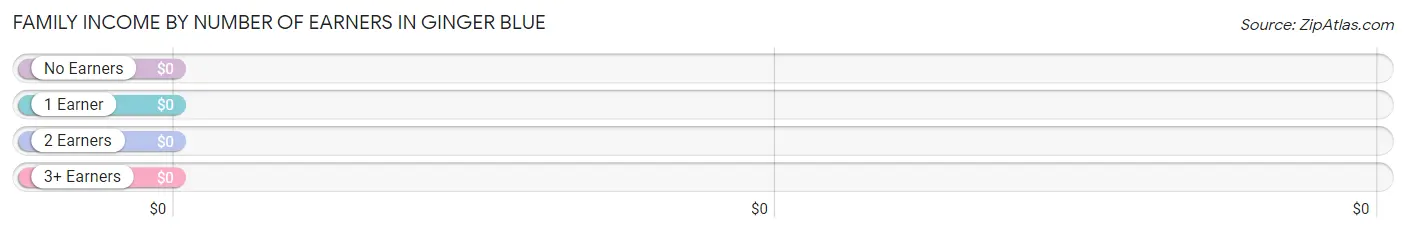
| Number of Earners | # Families | Median Income |
| No Earners | 0 (0.0%) | $0 |
| 1 Earner | 3 (50.0%) | $0 |
| 2 Earners | 0 (0.0%) | $0 |
| 3+ Earners | 3 (50.0%) | $0 |
| Total | 6 (100.0%) | $84,167 |
Household Income in Ginger Blue
Household Income Brackets in Ginger Blue
With 37 households falling in the category, the $35,000 to $49,999 income range is the most frequent in Ginger Blue, accounting for 71.2% of all households.
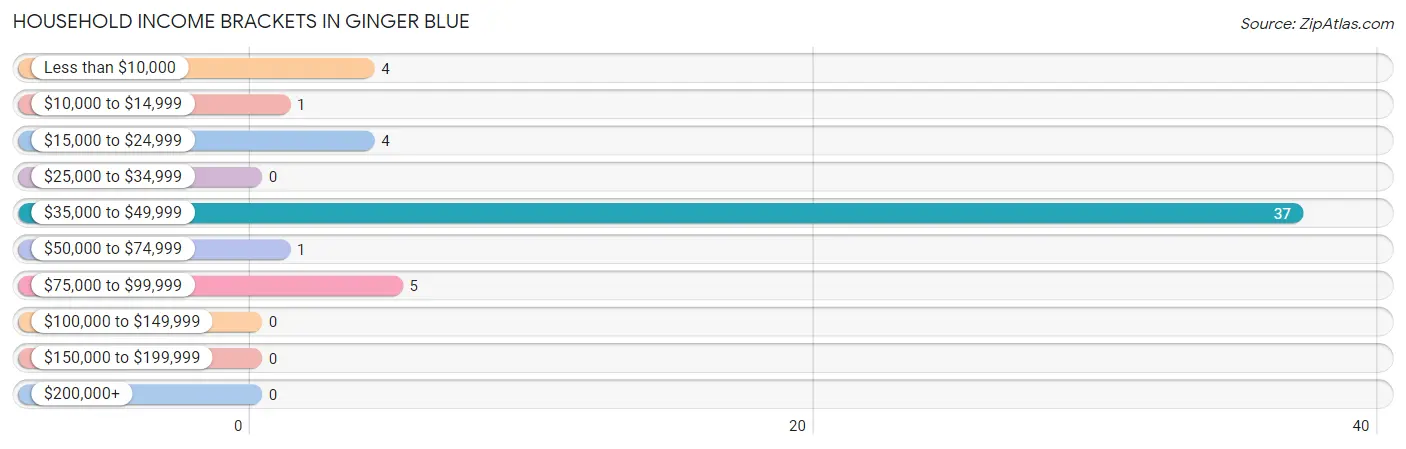
| Income Bracket | # Households | % Households |
| Less than $10,000 | 4 | 7.7% |
| $10,000 to $14,999 | 1 | 1.9% |
| $15,000 to $24,999 | 4 | 7.7% |
| $25,000 to $34,999 | 0 | 0.0% |
| $35,000 to $49,999 | 37 | 71.2% |
| $50,000 to $74,999 | 1 | 1.9% |
| $75,000 to $99,999 | 5 | 9.6% |
| $100,000 to $149,999 | 0 | 0.0% |
| $150,000 to $199,999 | 0 | 0.0% |
| $200,000+ | 0 | 0.0% |
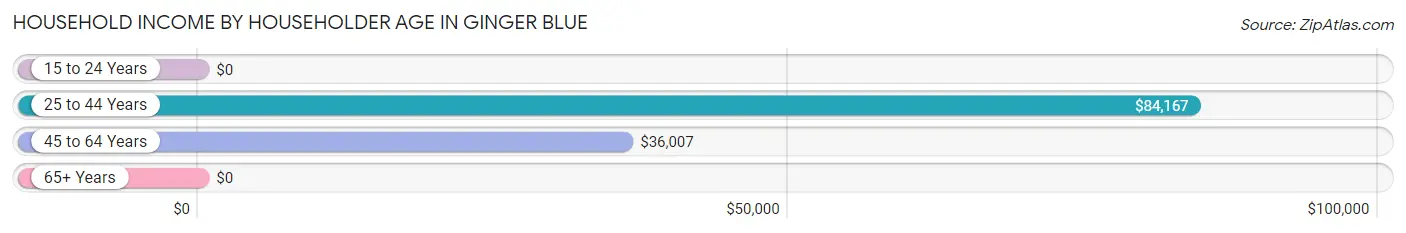
Household Income by Householder Age in Ginger Blue
The median household income in Ginger Blue is $36,181, with the highest median household income of $84,167 found in the 25 to 44 years age bracket for the primary householder. A total of 6 households (11.5%) fall into this category.
| Income Bracket | # Households | Median Income |
| 15 to 24 Years | 0 (0.0%) | $0 |
| 25 to 44 Years | 6 (11.5%) | $84,167 |
| 45 to 64 Years | 45 (86.5%) | $36,007 |
| 65+ Years | 1 (1.9%) | $0 |
| Total | 52 (100.0%) | $36,181 |
Poverty in Ginger Blue
Income Below Poverty by Sex and Age in Ginger Blue
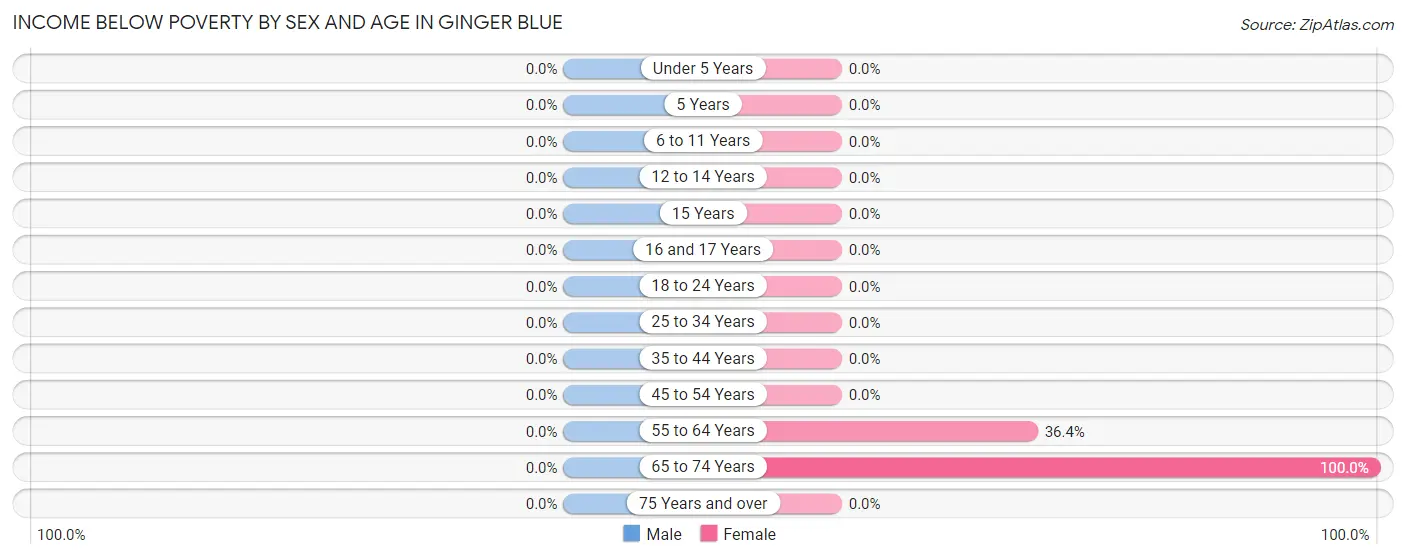
| Age Bracket | Male | Female |
| Under 5 Years | 0 (0.0%) | 0 (0.0%) |
| 5 Years | 0 (0.0%) | 0 (0.0%) |
| 6 to 11 Years | 0 (0.0%) | 0 (0.0%) |
| 12 to 14 Years | 0 (0.0%) | 0 (0.0%) |
| 15 Years | 0 (0.0%) | 0 (0.0%) |
| 16 and 17 Years | 0 (0.0%) | 0 (0.0%) |
| 18 to 24 Years | 0 (0.0%) | 0 (0.0%) |
| 25 to 34 Years | 0 (0.0%) | 0 (0.0%) |
| 35 to 44 Years | 0 (0.0%) | 0 (0.0%) |
| 45 to 54 Years | 0 (0.0%) | 0 (0.0%) |
| 55 to 64 Years | 0 (0.0%) | 4 (36.4%) |
| 65 to 74 Years | 0 (0.0%) | 1 (100.0%) |
| 75 Years and over | 0 (0.0%) | 0 (0.0%) |
| Total | 0 (0.0%) | 5 (12.8%) |
Income Above Poverty by Sex and Age in Ginger Blue
According to the poverty statistics in Ginger Blue, males aged under 5 years and females aged under 5 years are the age groups that are most secure financially, with 100.0% of males and 100.0% of females in these age groups living above the poverty line.
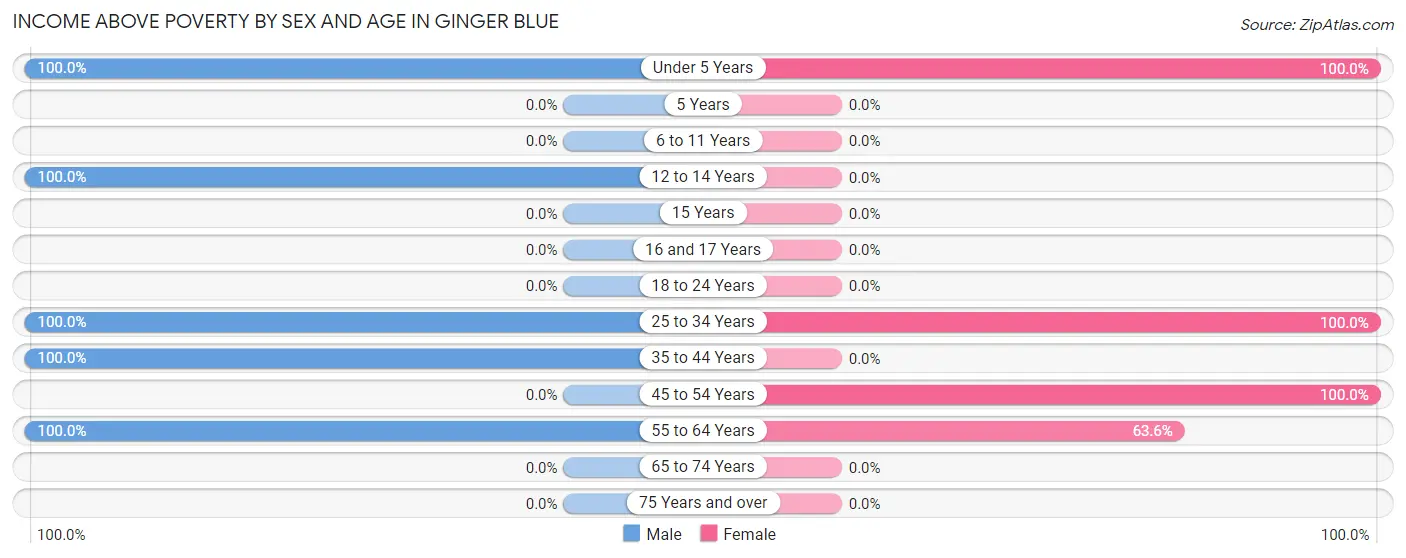
| Age Bracket | Male | Female |
| Under 5 Years | 12 (100.0%) | 5 (100.0%) |
| 5 Years | 0 (0.0%) | 0 (0.0%) |
| 6 to 11 Years | 0 (0.0%) | 0 (0.0%) |
| 12 to 14 Years | 5 (100.0%) | 0 (0.0%) |
| 15 Years | 0 (0.0%) | 0 (0.0%) |
| 16 and 17 Years | 0 (0.0%) | 0 (0.0%) |
| 18 to 24 Years | 0 (0.0%) | 0 (0.0%) |
| 25 to 34 Years | 3 (100.0%) | 7 (100.0%) |
| 35 to 44 Years | 18 (100.0%) | 0 (0.0%) |
| 45 to 54 Years | 0 (0.0%) | 15 (100.0%) |
| 55 to 64 Years | 36 (100.0%) | 7 (63.6%) |
| 65 to 74 Years | 0 (0.0%) | 0 (0.0%) |
| 75 Years and over | 0 (0.0%) | 0 (0.0%) |
| Total | 74 (100.0%) | 34 (87.2%) |
Income Below Poverty Among Married-Couple Families in Ginger Blue
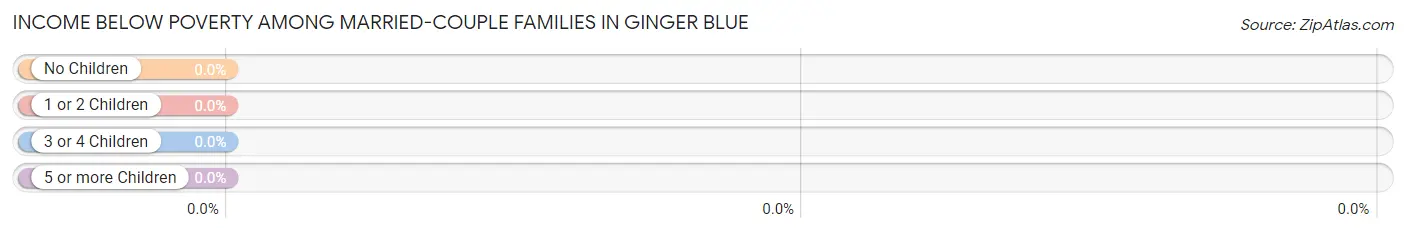
| Children | Above Poverty | Below Poverty |
| No Children | 0 (0.0%) | 0 (0.0%) |
| 1 or 2 Children | 0 (0.0%) | 0 (0.0%) |
| 3 or 4 Children | 3 (100.0%) | 0 (0.0%) |
| 5 or more Children | 0 (0.0%) | 0 (0.0%) |
| Total | 3 (100.0%) | 0 (0.0%) |
Income Below Poverty Among Single-Parent Households in Ginger Blue
| Children | Single Father | Single Mother |
| No Children | 0 (0.0%) | 0 (0.0%) |
| 1 or 2 Children | 0 (0.0%) | 0 (0.0%) |
| 3 or 4 Children | 0 (0.0%) | 0 (0.0%) |
| 5 or more Children | 0 (0.0%) | 0 (0.0%) |
| Total | 0 (0.0%) | 0 (0.0%) |
Income Below Poverty Among Married-Couple vs Single-Parent Households in Ginger Blue
| Children | Married-Couple Families | Single-Parent Households |
| No Children | 0 (0.0%) | 0 (0.0%) |
| 1 or 2 Children | 0 (0.0%) | 0 (0.0%) |
| 3 or 4 Children | 0 (0.0%) | 0 (0.0%) |
| 5 or more Children | 0 (0.0%) | 0 (0.0%) |
| Total | 0 (0.0%) | 0 (0.0%) |
Race in Ginger Blue
The most populous races in Ginger Blue are Hispanic or Latino (95 | 84.1%), White / Caucasian (77 | 68.1%), and Some other Race (36 | 31.9%).
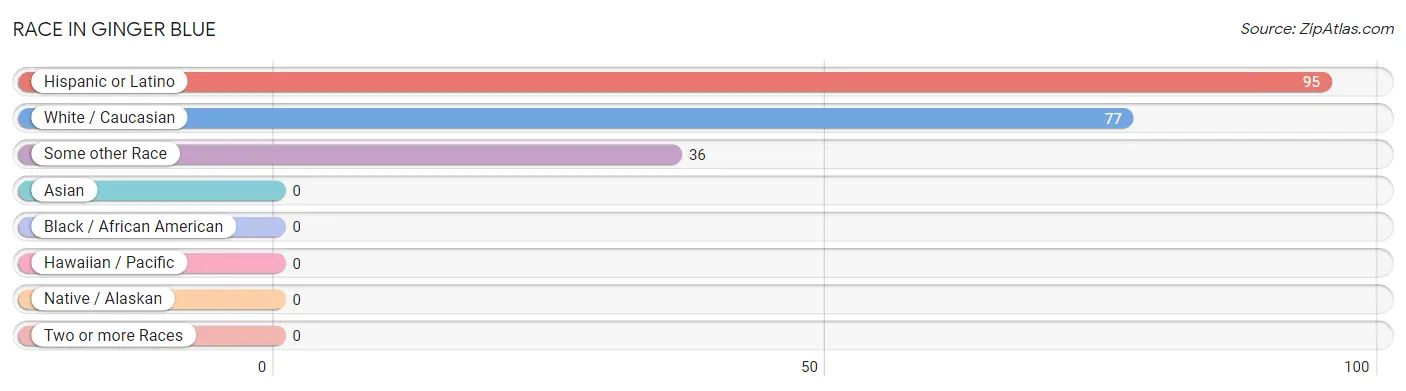
| Race | # Population | % Population |
| Asian | 0 | 0.0% |
| Black / African American | 0 | 0.0% |
| Hawaiian / Pacific | 0 | 0.0% |
| Hispanic or Latino | 95 | 84.1% |
| Native / Alaskan | 0 | 0.0% |
| White / Caucasian | 77 | 68.1% |
| Two or more Races | 0 | 0.0% |
| Some other Race | 36 | 31.9% |
| Total | 113 | 100.0% |
Ancestry in Ginger Blue
The most populous ancestries reported in Ginger Blue are Central American (59 | 52.2%), Guatemalan (59 | 52.2%), Mexican (36 | 31.9%), Irish (4 | 3.5%), and American (2 | 1.8%), together accounting for 141.6% of all Ginger Blue residents.
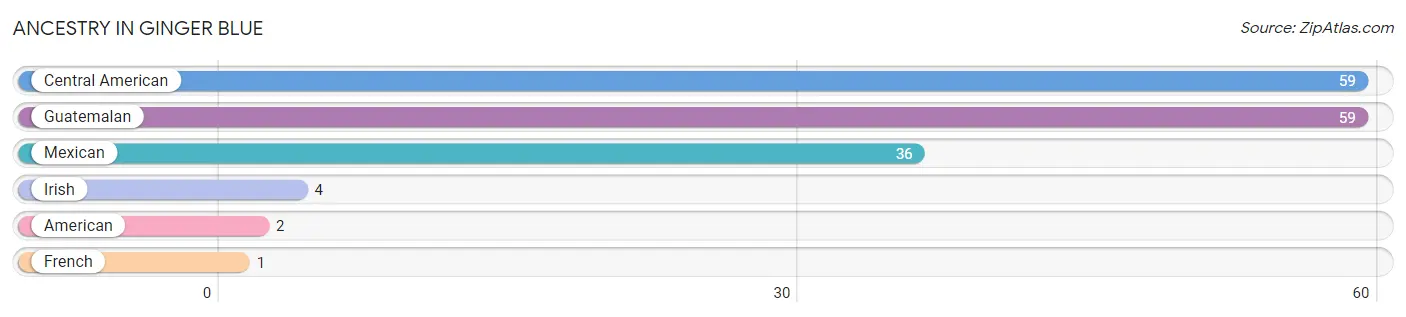
| Ancestry | # Population | % Population |
| American | 2 | 1.8% |
| Central American | 59 | 52.2% |
| French | 1 | 0.9% |
| Guatemalan | 59 | 52.2% |
| Irish | 4 | 3.5% |
| Mexican | 36 | 31.9% | View All 6 Rows |
Immigrants in Ginger Blue
The most numerous immigrant groups reported in Ginger Blue came from Central America (67 | 59.3%), Latin America (67 | 59.3%), and Mexico (67 | 59.3%), together accounting for 177.9% of all Ginger Blue residents.
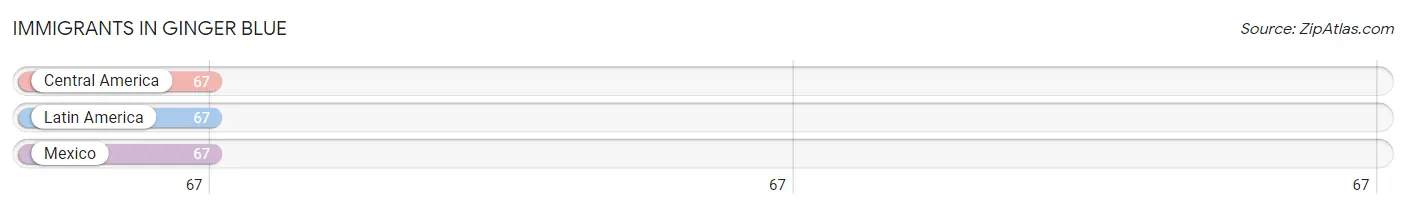
| Immigration Origin | # Population | % Population |
| Central America | 67 | 59.3% |
| Latin America | 67 | 59.3% |
| Mexico | 67 | 59.3% | View All 3 Rows |
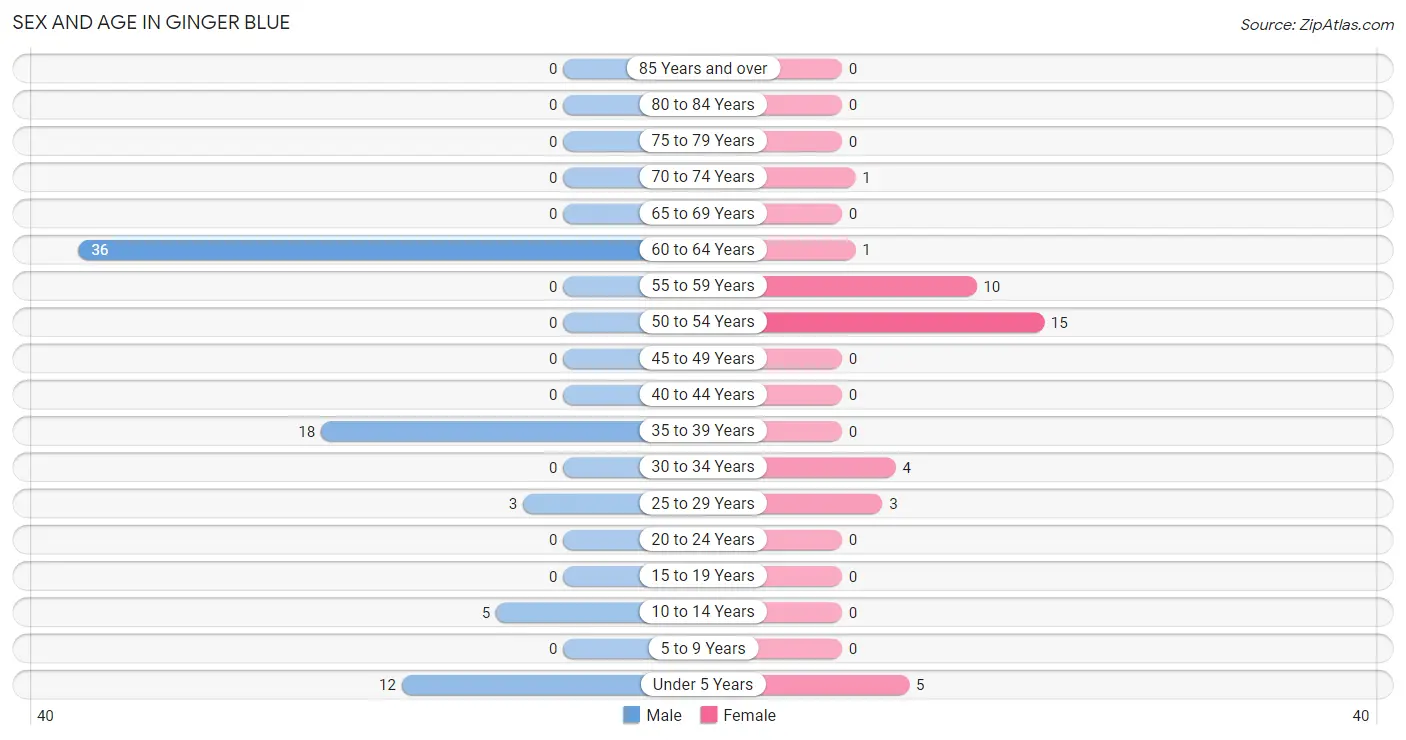
Sex and Age in Ginger Blue
Sex and Age in Ginger Blue
The most populous age groups in Ginger Blue are 60 to 64 Years (36 | 48.6%) for men and 50 to 54 Years (15 | 38.5%) for women.
| Age Bracket | Male | Female |
| Under 5 Years | 12 (16.2%) | 5 (12.8%) |
| 5 to 9 Years | 0 (0.0%) | 0 (0.0%) |
| 10 to 14 Years | 5 (6.8%) | 0 (0.0%) |
| 15 to 19 Years | 0 (0.0%) | 0 (0.0%) |
| 20 to 24 Years | 0 (0.0%) | 0 (0.0%) |
| 25 to 29 Years | 3 (4.1%) | 3 (7.7%) |
| 30 to 34 Years | 0 (0.0%) | 4 (10.3%) |
| 35 to 39 Years | 18 (24.3%) | 0 (0.0%) |
| 40 to 44 Years | 0 (0.0%) | 0 (0.0%) |
| 45 to 49 Years | 0 (0.0%) | 0 (0.0%) |
| 50 to 54 Years | 0 (0.0%) | 15 (38.5%) |
| 55 to 59 Years | 0 (0.0%) | 10 (25.6%) |
| 60 to 64 Years | 36 (48.6%) | 1 (2.6%) |
| 65 to 69 Years | 0 (0.0%) | 0 (0.0%) |
| 70 to 74 Years | 0 (0.0%) | 1 (2.6%) |
| 75 to 79 Years | 0 (0.0%) | 0 (0.0%) |
| 80 to 84 Years | 0 (0.0%) | 0 (0.0%) |
| 85 Years and over | 0 (0.0%) | 0 (0.0%) |
| Total | 74 (100.0%) | 39 (100.0%) |
Families and Households in Ginger Blue
Median Family Size in Ginger Blue
The median family size in Ginger Blue is 11.17 persons per family, with married-couple families (3 | 50.0%) accounting for the largest median family size of 19.67 persons per family. On the other hand, single male/father families (2 | 33.3%) represent the smallest median family size with 2.00 persons per family.
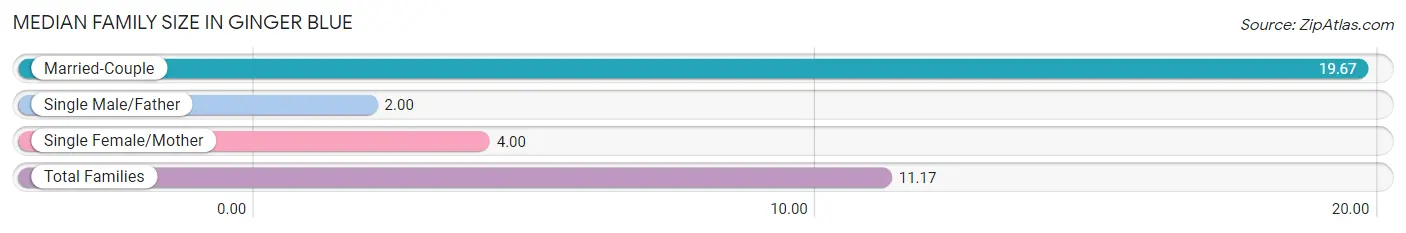
| Family Type | # Families | Family Size |
| Married-Couple | 3 (50.0%) | 19.67 |
| Single Male/Father | 2 (33.3%) | 2.00 |
| Single Female/Mother | 1 (16.7%) | 4.00 |
| Total Families | 6 (100.0%) | 11.17 |
Median Household Size in Ginger Blue
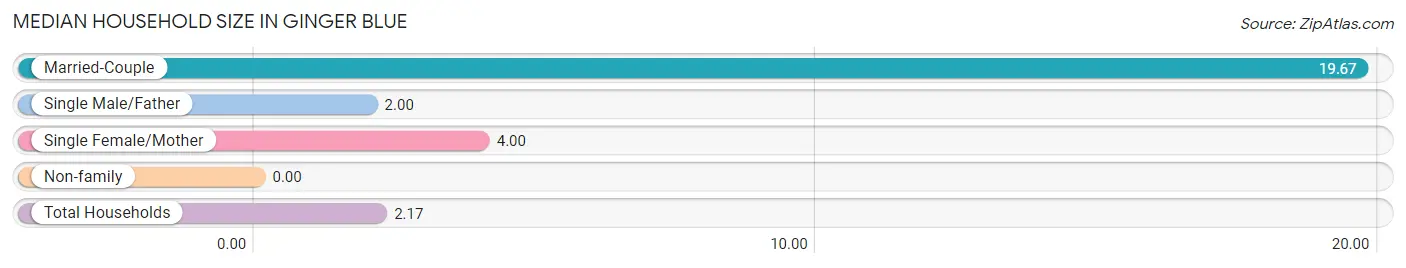
| Household Type | # Households | Household Size |
| Married-Couple | 3 (5.8%) | 19.67 |
| Single Male/Father | 2 (3.8%) | 2.00 |
| Single Female/Mother | 1 (1.9%) | 4.00 |
| Non-family | 46 (88.5%) | - |
| Total Households | 52 (100.0%) | 2.17 |
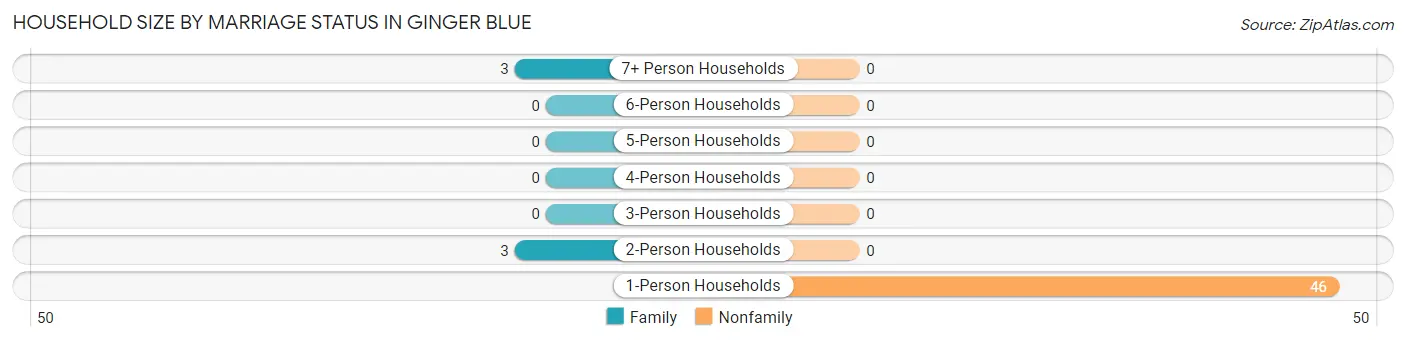
Household Size by Marriage Status in Ginger Blue
Out of a total of 52 households in Ginger Blue, 6 (11.5%) are family households, while 46 (88.5%) are nonfamily households. The most numerous type of family households are 2-person households, comprising 3, and the most common type of nonfamily households are 1-person households, comprising 46.
| Household Size | Family Households | Nonfamily Households |
| 1-Person Households | - | 46 (88.5%) |
| 2-Person Households | 3 (5.8%) | 0 (0.0%) |
| 3-Person Households | 0 (0.0%) | 0 (0.0%) |
| 4-Person Households | 0 (0.0%) | 0 (0.0%) |
| 5-Person Households | 0 (0.0%) | 0 (0.0%) |
| 6-Person Households | 0 (0.0%) | 0 (0.0%) |
| 7+ Person Households | 3 (5.8%) | 0 (0.0%) |
| Total | 6 (11.5%) | 46 (88.5%) |
Female Fertility in Ginger Blue
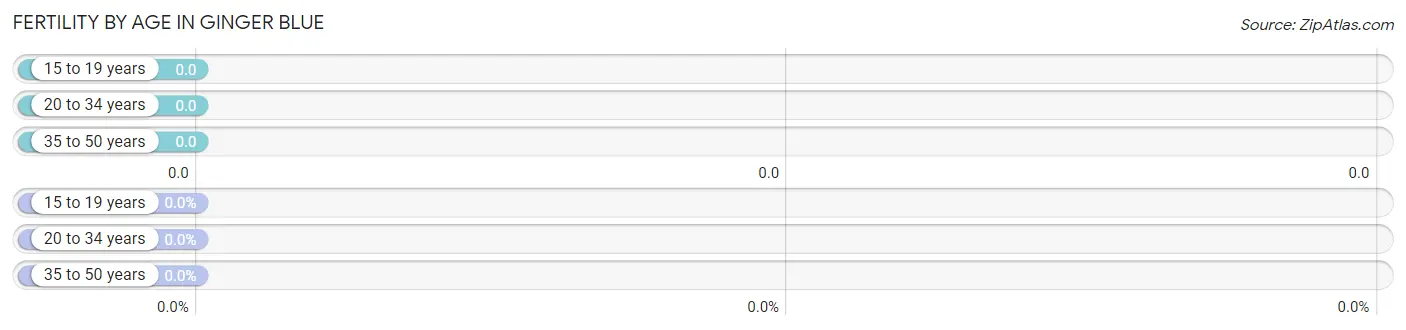
Fertility by Age in Ginger Blue
| Age Bracket | Women with Births | Births / 1,000 Women |
| 15 to 19 years | 0 (0.0%) | 0.0 |
| 20 to 34 years | 0 (0.0%) | 0.0 |
| 35 to 50 years | 0 (0.0%) | 0.0 |
| Total | 0 (0.0%) | 0.0 |
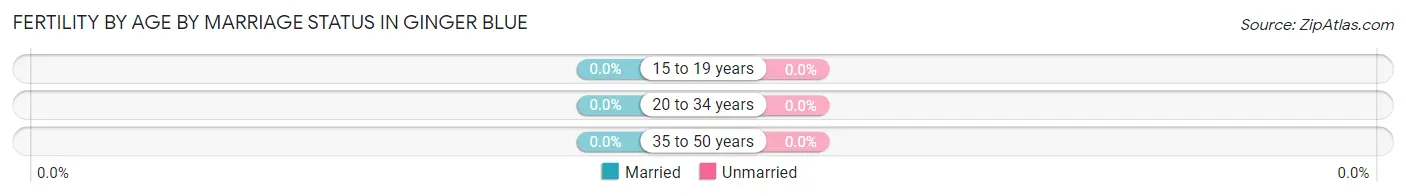
Fertility by Age by Marriage Status in Ginger Blue
| Age Bracket | Married | Unmarried |
| 15 to 19 years | 0 (0.0%) | 0 (0.0%) |
| 20 to 34 years | 0 (0.0%) | 0 (0.0%) |
| 35 to 50 years | 0 (0.0%) | 0 (0.0%) |
| Total | 0 (0.0%) | 0 (0.0%) |
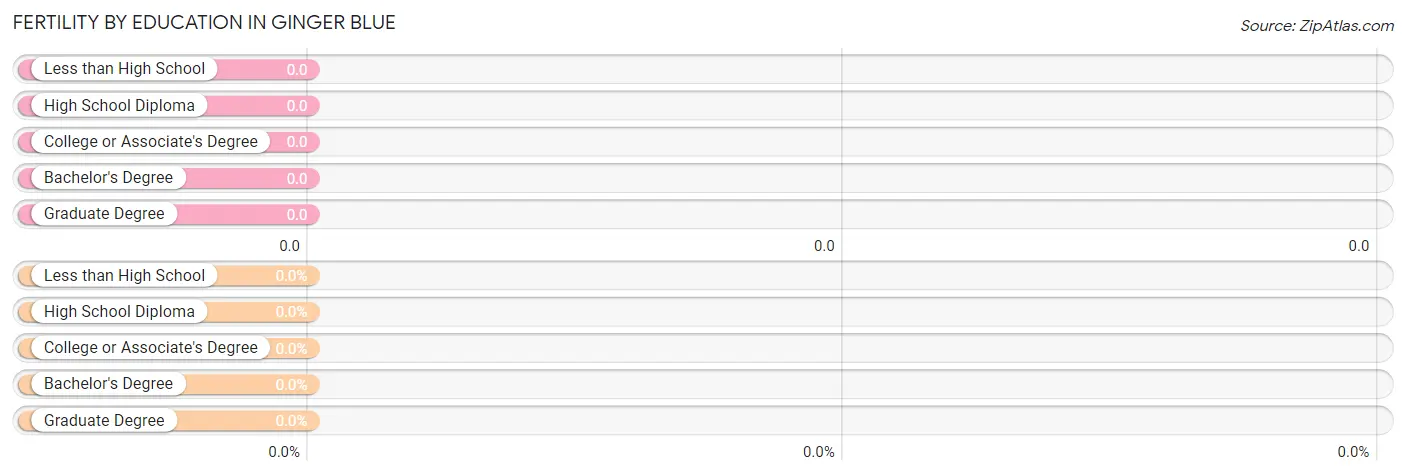
Fertility by Education in Ginger Blue
| Educational Attainment | Women with Births | Births / 1,000 Women |
| Less than High School | 0 (0.0%) | 0.0 |
| High School Diploma | 0 (0.0%) | 0.0 |
| College or Associate's Degree | 0 (0.0%) | 0.0 |
| Bachelor's Degree | 0 (0.0%) | 0.0 |
| Graduate Degree | 0 (0.0%) | 0.0 |
| Total | 0 (0.0%) | 0.0 |
Fertility by Education by Marriage Status in Ginger Blue
| Educational Attainment | Married | Unmarried |
| Less than High School | 0 (0.0%) | 0 (0.0%) |
| High School Diploma | 0 (0.0%) | 0 (0.0%) |
| College or Associate's Degree | 0 (0.0%) | 0 (0.0%) |
| Bachelor's Degree | 0 (0.0%) | 0 (0.0%) |
| Graduate Degree | 0 (0.0%) | 0 (0.0%) |
| Total | 0 (0.0%) | 0 (0.0%) |
Employment Characteristics in Ginger Blue
Employment by Class of Employer in Ginger Blue
Among the 76 employed individuals in Ginger Blue, private company employees (61 | 80.3%), and self-employed (incorporated) (15 | 19.7%) make up the most common classes of employment.
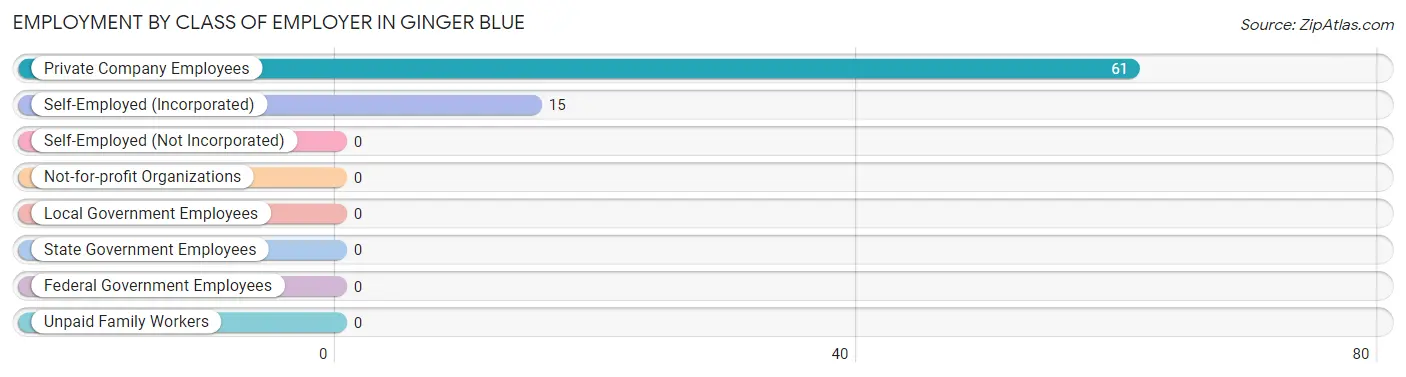
| Employer Class | # Employees | % Employees |
| Private Company Employees | 61 | 80.3% |
| Self-Employed (Incorporated) | 15 | 19.7% |
| Self-Employed (Not Incorporated) | 0 | 0.0% |
| Not-for-profit Organizations | 0 | 0.0% |
| Local Government Employees | 0 | 0.0% |
| State Government Employees | 0 | 0.0% |
| Federal Government Employees | 0 | 0.0% |
| Unpaid Family Workers | 0 | 0.0% |
| Total | 76 | 100.0% |
Employment Status by Age in Ginger Blue
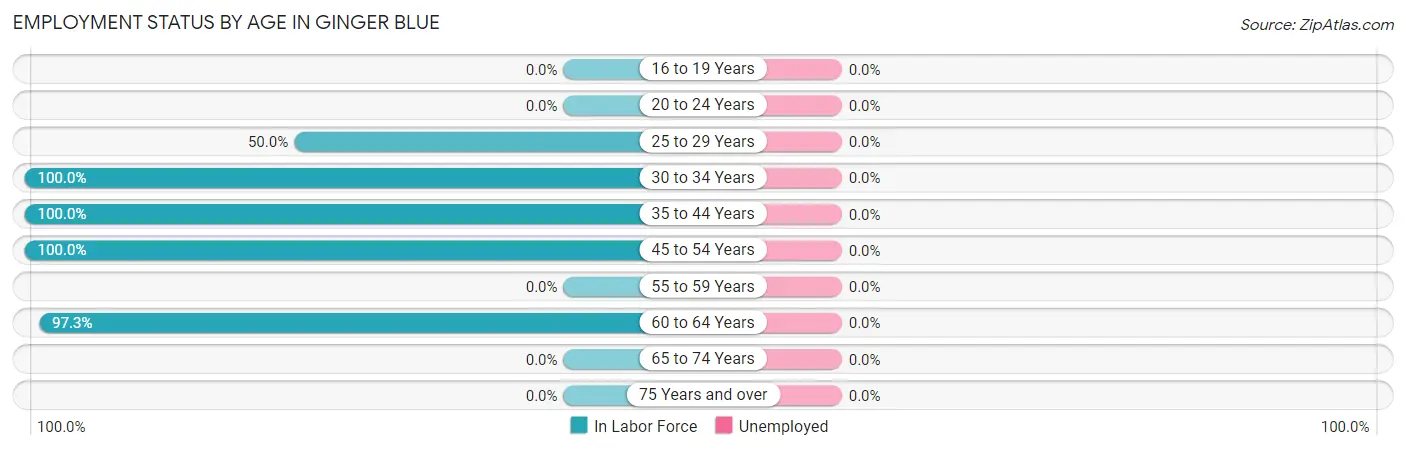
| Age Bracket | In Labor Force | Unemployed |
| 16 to 19 Years | 0 (0.0%) | 0 (0.0%) |
| 20 to 24 Years | 0 (0.0%) | 0 (0.0%) |
| 25 to 29 Years | 3 (50.0%) | 0 (0.0%) |
| 30 to 34 Years | 4 (100.0%) | 0 (0.0%) |
| 35 to 44 Years | 18 (100.0%) | 0 (0.0%) |
| 45 to 54 Years | 15 (100.0%) | 0 (0.0%) |
| 55 to 59 Years | 0 (0.0%) | 0 (0.0%) |
| 60 to 64 Years | 36 (97.3%) | 0 (0.0%) |
| 65 to 74 Years | 0 (0.0%) | 0 (0.0%) |
| 75 Years and over | 0 (0.0%) | 0 (0.0%) |
| Total | 76 (83.5%) | 0 (0.0%) |
Employment Status by Educational Attainment in Ginger Blue
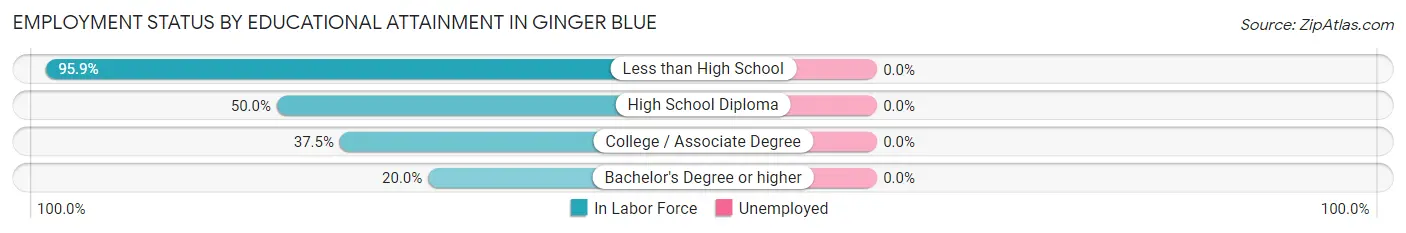
| Educational Attainment | In Labor Force | Unemployed |
| Less than High School | 70 (95.9%) | 0 (0.0%) |
| High School Diploma | 2 (50.0%) | 0 (0.0%) |
| College / Associate Degree | 3 (37.5%) | 0 (0.0%) |
| Bachelor's Degree or higher | 1 (20.0%) | 0 (0.0%) |
| Total | 76 (84.4%) | 0 (0.0%) |
Employment Occupations by Sex in Ginger Blue
Management, Business, Science and Arts Occupations
The most common Management, Business, Science and Arts occupations in Ginger Blue are Community & Social Service (15 | 19.7%), Legal Services & Support (15 | 19.7%), Business & Financial (3 | 4.0%), and Management (1 | 1.3%).
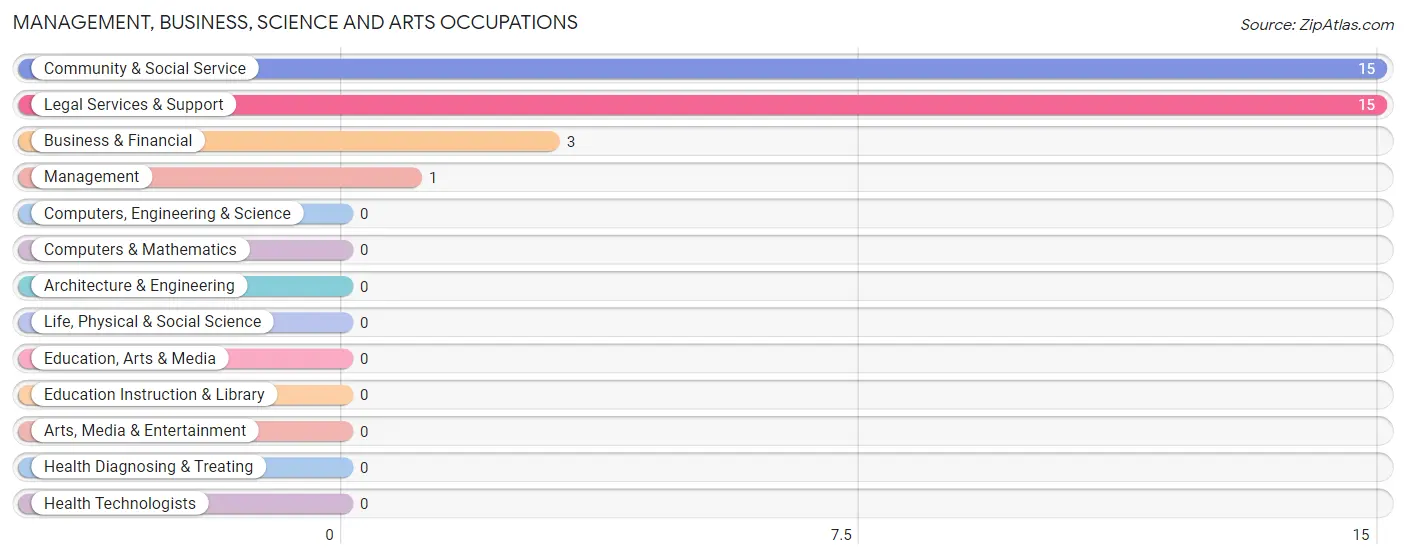
Management, Business, Science and Arts Occupations by Sex
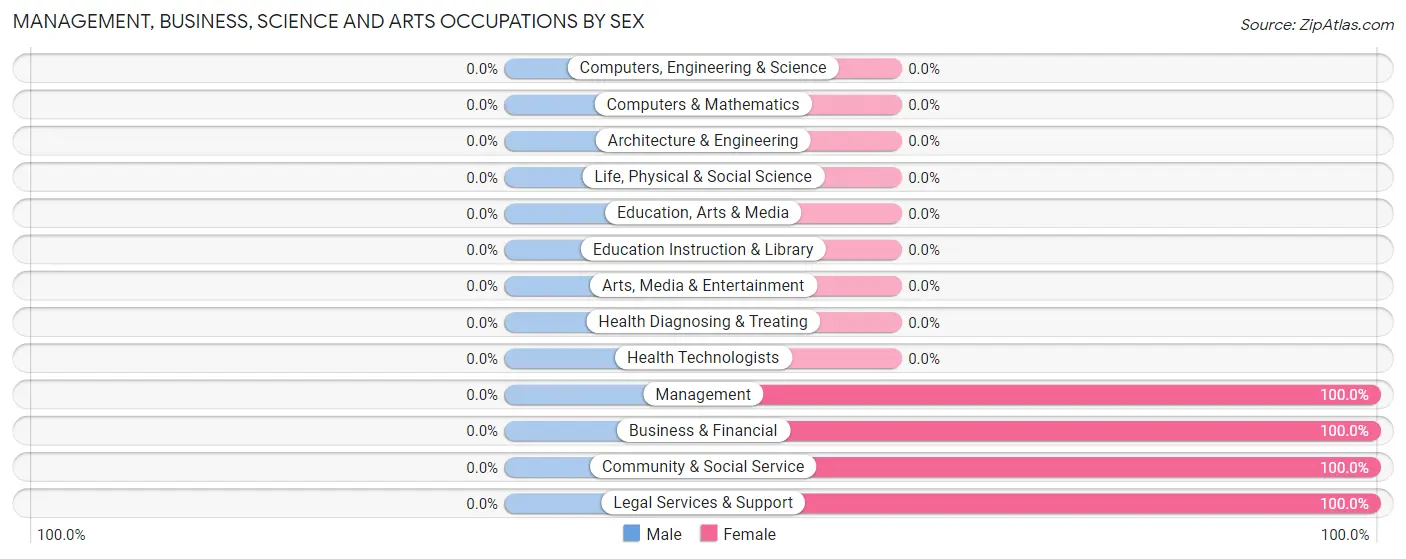
| Occupation | Male | Female |
| Management | 0 (0.0%) | 1 (100.0%) |
| Business & Financial | 0 (0.0%) | 3 (100.0%) |
| Computers, Engineering & Science | 0 (0.0%) | 0 (0.0%) |
| Computers & Mathematics | 0 (0.0%) | 0 (0.0%) |
| Architecture & Engineering | 0 (0.0%) | 0 (0.0%) |
| Life, Physical & Social Science | 0 (0.0%) | 0 (0.0%) |
| Community & Social Service | 0 (0.0%) | 15 (100.0%) |
| Education, Arts & Media | 0 (0.0%) | 0 (0.0%) |
| Legal Services & Support | 0 (0.0%) | 15 (100.0%) |
| Education Instruction & Library | 0 (0.0%) | 0 (0.0%) |
| Arts, Media & Entertainment | 0 (0.0%) | 0 (0.0%) |
| Health Diagnosing & Treating | 0 (0.0%) | 0 (0.0%) |
| Health Technologists | 0 (0.0%) | 0 (0.0%) |
| Total (Category) | 0 (0.0%) | 19 (100.0%) |
| Total (Overall) | 57 (75.0%) | 19 (25.0%) |
Services Occupations
The most common Services occupations in Ginger Blue are , and Food Preparation & Serving (19 | 25.0%).
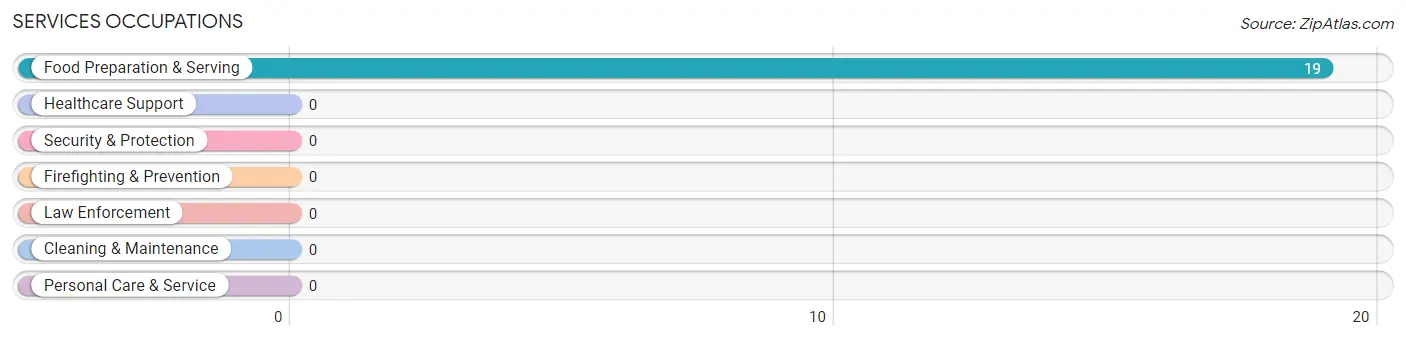
Services Occupations by Sex

| Occupation | Male | Female |
| Healthcare Support | 0 (0.0%) | 0 (0.0%) |
| Security & Protection | 0 (0.0%) | 0 (0.0%) |
| Firefighting & Prevention | 0 (0.0%) | 0 (0.0%) |
| Law Enforcement | 0 (0.0%) | 0 (0.0%) |
| Food Preparation & Serving | 19 (100.0%) | 0 (0.0%) |
| Cleaning & Maintenance | 0 (0.0%) | 0 (0.0%) |
| Personal Care & Service | 0 (0.0%) | 0 (0.0%) |
| Total (Category) | 19 (100.0%) | 0 (0.0%) |
| Total (Overall) | 57 (75.0%) | 19 (25.0%) |
Sales and Office Occupations
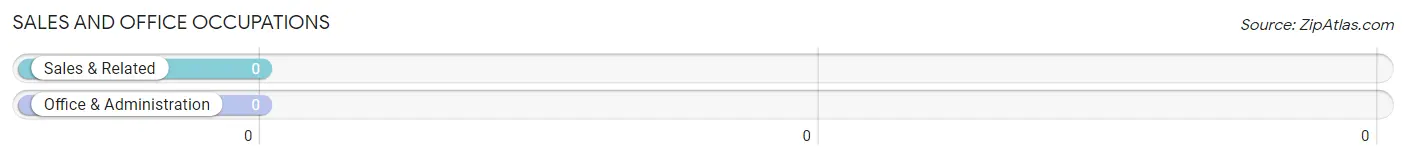
Sales and Office Occupations by Sex
| Occupation | Male | Female |
| Sales & Related | 0 (0.0%) | 0 (0.0%) |
| Office & Administration | 0 (0.0%) | 0 (0.0%) |
| Total (Category) | 0 (0.0%) | 0 (0.0%) |
| Total (Overall) | 57 (75.0%) | 19 (25.0%) |
Natural Resources, Construction and Maintenance Occupations
The most common Natural Resources, Construction and Maintenance occupations in Ginger Blue are , and Construction & Extraction (2 | 2.6%).
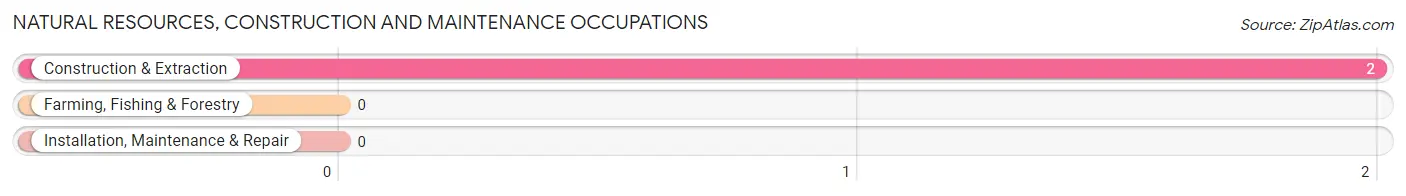
Natural Resources, Construction and Maintenance Occupations by Sex
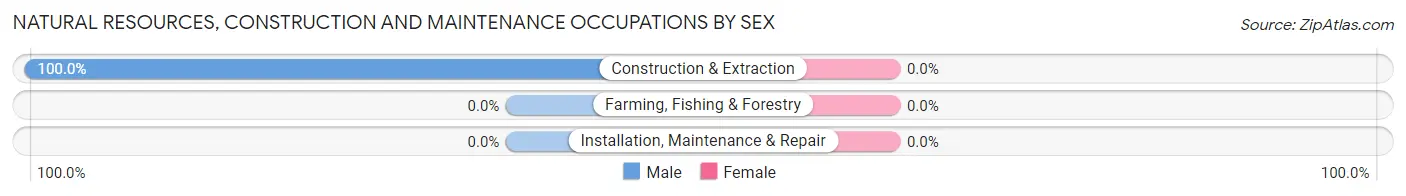
| Occupation | Male | Female |
| Farming, Fishing & Forestry | 0 (0.0%) | 0 (0.0%) |
| Construction & Extraction | 2 (100.0%) | 0 (0.0%) |
| Installation, Maintenance & Repair | 0 (0.0%) | 0 (0.0%) |
| Total (Category) | 2 (100.0%) | 0 (0.0%) |
| Total (Overall) | 57 (75.0%) | 19 (25.0%) |
Production, Transportation and Moving Occupations
The most common Production, Transportation and Moving occupations in Ginger Blue are , and Production (36 | 47.4%).
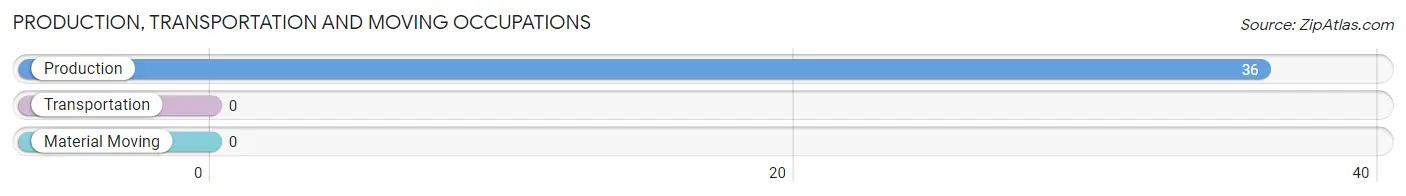
Production, Transportation and Moving Occupations by Sex
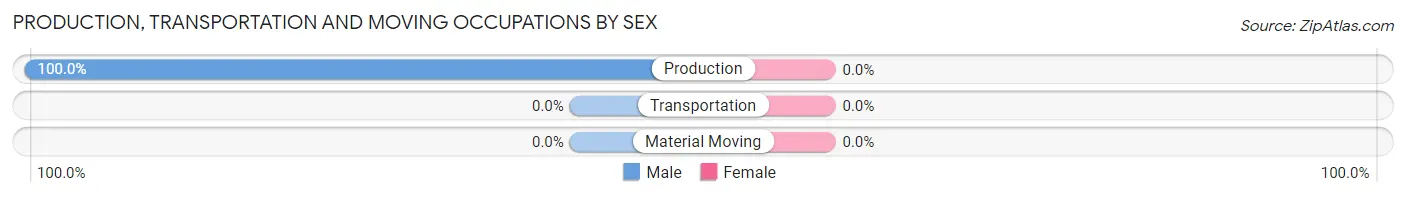
| Occupation | Male | Female |
| Production | 36 (100.0%) | 0 (0.0%) |
| Transportation | 0 (0.0%) | 0 (0.0%) |
| Material Moving | 0 (0.0%) | 0 (0.0%) |
| Total (Category) | 36 (100.0%) | 0 (0.0%) |
| Total (Overall) | 57 (75.0%) | 19 (25.0%) |
Employment Industries by Sex in Ginger Blue
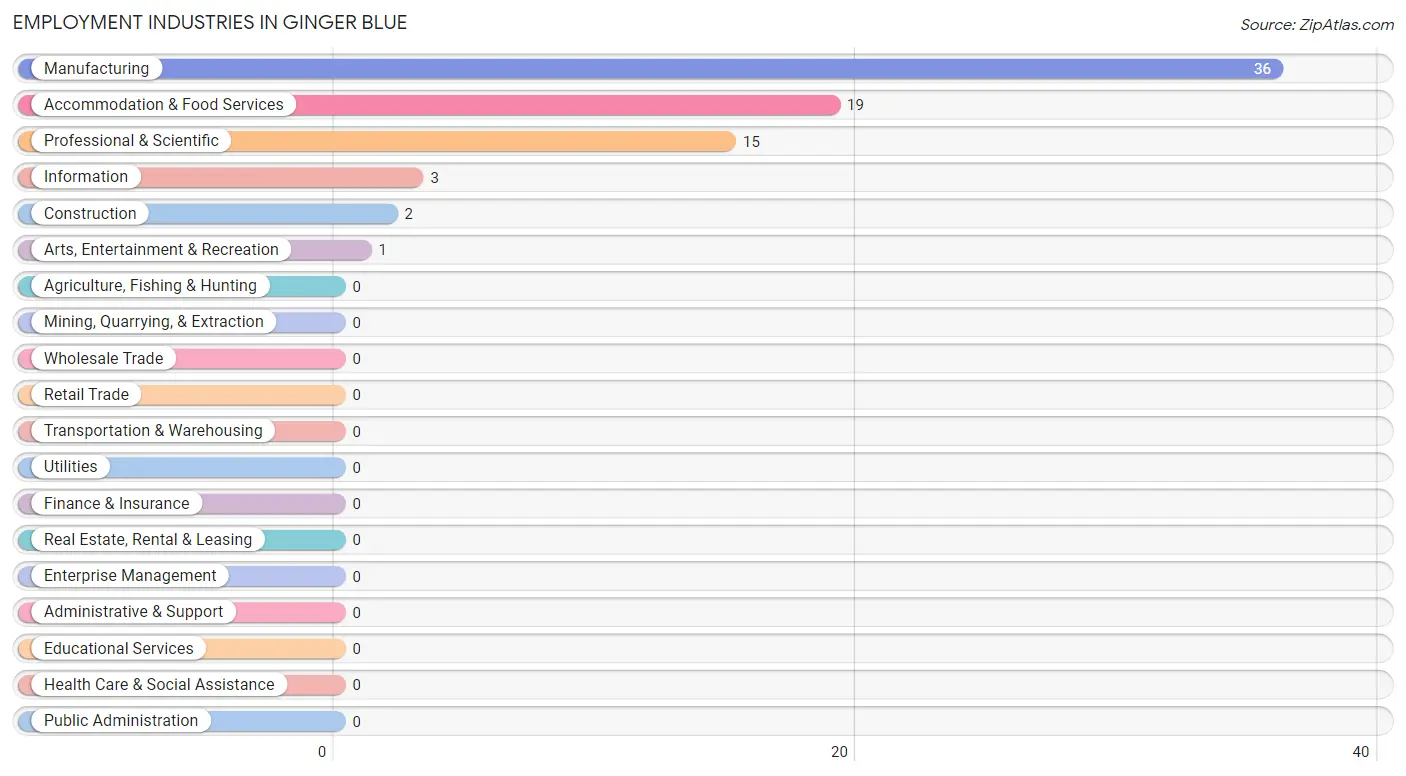
Employment Industries in Ginger Blue
The major employment industries in Ginger Blue include Manufacturing (36 | 47.4%), Accommodation & Food Services (19 | 25.0%), Professional & Scientific (15 | 19.7%), Information (3 | 4.0%), and Construction (2 | 2.6%).
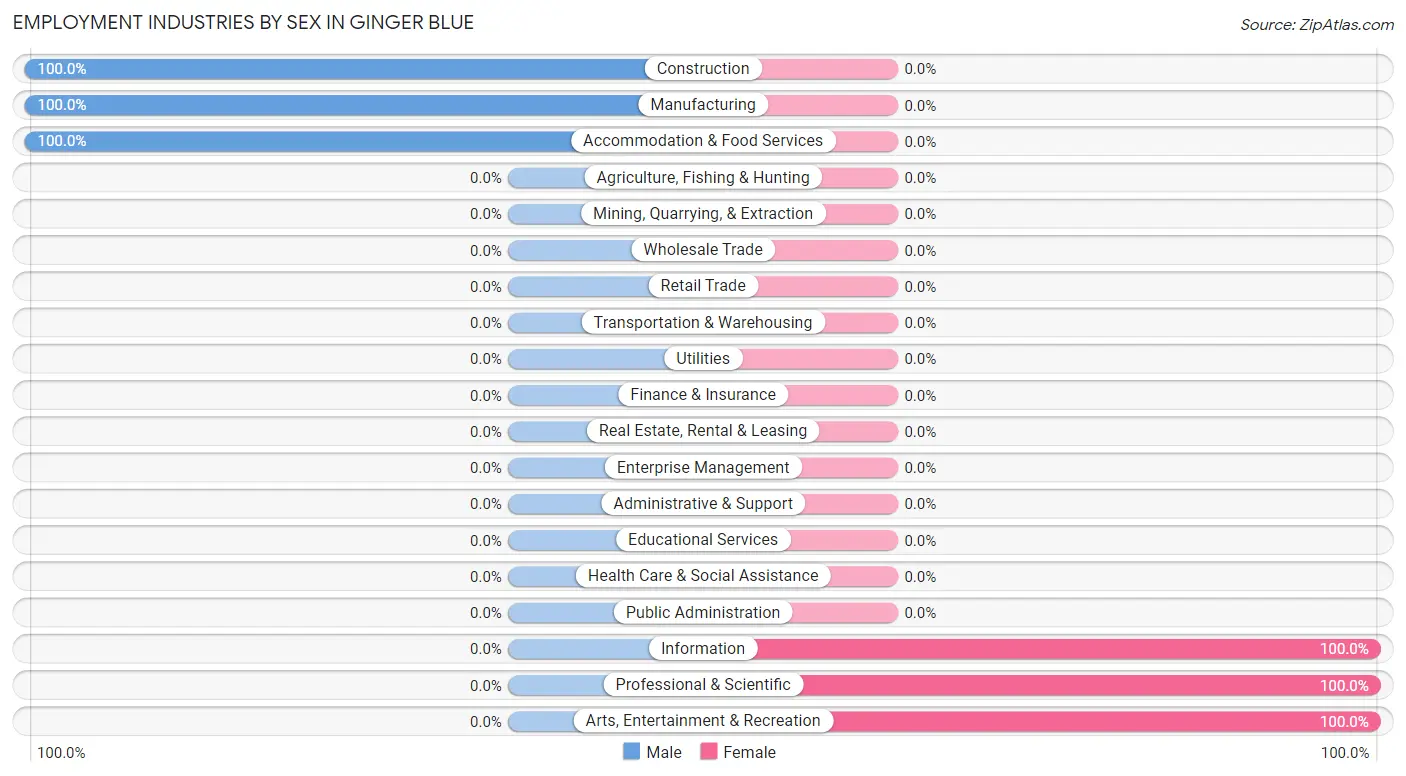
Employment Industries by Sex in Ginger Blue
The Ginger Blue industries that see more men than women are Construction (100.0%), Manufacturing (100.0%), and Accommodation & Food Services (100.0%), whereas the industries that tend to have a higher number of women are Information (100.0%), Professional & Scientific (100.0%), and Arts, Entertainment & Recreation (100.0%).
| Industry | Male | Female |
| Agriculture, Fishing & Hunting | 0 (0.0%) | 0 (0.0%) |
| Mining, Quarrying, & Extraction | 0 (0.0%) | 0 (0.0%) |
| Construction | 2 (100.0%) | 0 (0.0%) |
| Manufacturing | 36 (100.0%) | 0 (0.0%) |
| Wholesale Trade | 0 (0.0%) | 0 (0.0%) |
| Retail Trade | 0 (0.0%) | 0 (0.0%) |
| Transportation & Warehousing | 0 (0.0%) | 0 (0.0%) |
| Utilities | 0 (0.0%) | 0 (0.0%) |
| Information | 0 (0.0%) | 3 (100.0%) |
| Finance & Insurance | 0 (0.0%) | 0 (0.0%) |
| Real Estate, Rental & Leasing | 0 (0.0%) | 0 (0.0%) |
| Professional & Scientific | 0 (0.0%) | 15 (100.0%) |
| Enterprise Management | 0 (0.0%) | 0 (0.0%) |
| Administrative & Support | 0 (0.0%) | 0 (0.0%) |
| Educational Services | 0 (0.0%) | 0 (0.0%) |
| Health Care & Social Assistance | 0 (0.0%) | 0 (0.0%) |
| Arts, Entertainment & Recreation | 0 (0.0%) | 1 (100.0%) |
| Accommodation & Food Services | 19 (100.0%) | 0 (0.0%) |
| Public Administration | 0 (0.0%) | 0 (0.0%) |
| Total | 57 (75.0%) | 19 (25.0%) |
Education in Ginger Blue
School Enrollment in Ginger Blue
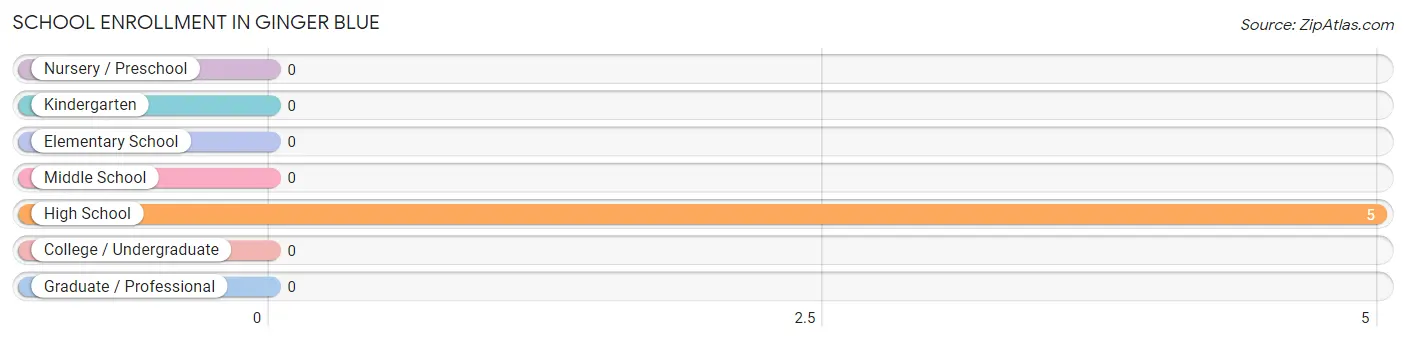
| School Level | # Students | % Students |
| Nursery / Preschool | 0 | 0.0% |
| Kindergarten | 0 | 0.0% |
| Elementary School | 0 | 0.0% |
| Middle School | 0 | 0.0% |
| High School | 5 | 100.0% |
| College / Undergraduate | 0 | 0.0% |
| Graduate / Professional | 0 | 0.0% |
| Total | 5 | 100.0% |
School Enrollment by Age by Funding Source in Ginger Blue
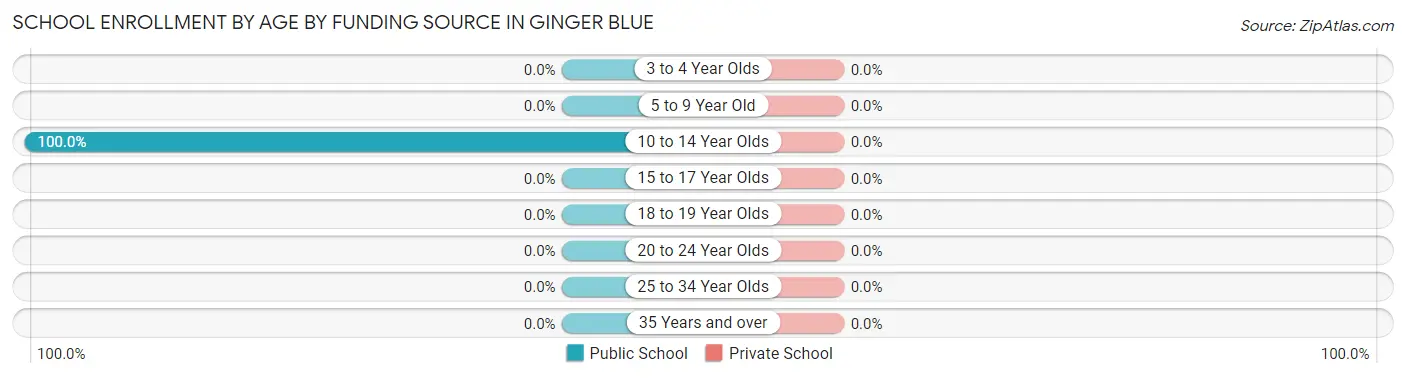
| Age Bracket | Public School | Private School |
| 3 to 4 Year Olds | 0 (0.0%) | 0 (0.0%) |
| 5 to 9 Year Old | 0 (0.0%) | 0 (0.0%) |
| 10 to 14 Year Olds | 5 (100.0%) | 0 (0.0%) |
| 15 to 17 Year Olds | 0 (0.0%) | 0 (0.0%) |
| 18 to 19 Year Olds | 0 (0.0%) | 0 (0.0%) |
| 20 to 24 Year Olds | 0 (0.0%) | 0 (0.0%) |
| 25 to 34 Year Olds | 0 (0.0%) | 0 (0.0%) |
| 35 Years and over | 0 (0.0%) | 0 (0.0%) |
| Total | 5 (100.0%) | 0 (0.0%) |
Educational Attainment by Field of Study in Ginger Blue
Bio, nature & agricultural (4 | 66.7%), physical & health sciences (1 | 16.7%), and business (1 | 16.7%) are the most common fields of study among 6 individuals in Ginger Blue who have obtained a bachelor's degree or higher.
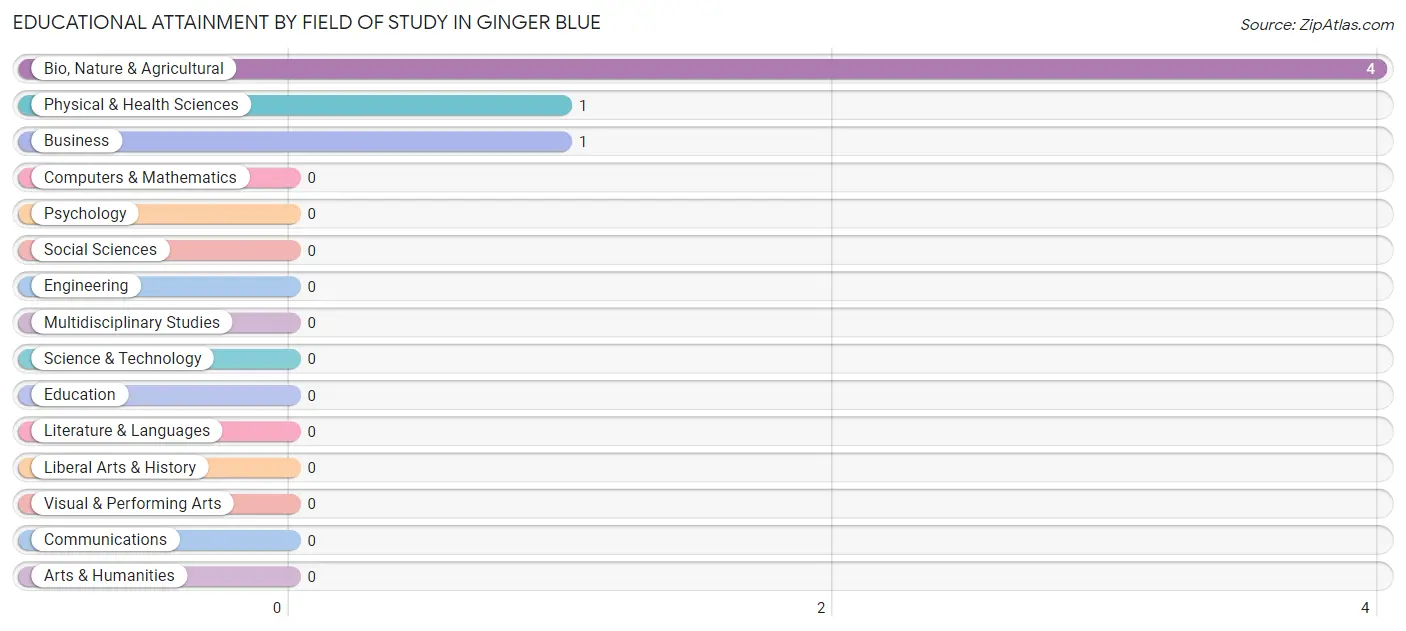
| Field of Study | # Graduates | % Graduates |
| Computers & Mathematics | 0 | 0.0% |
| Bio, Nature & Agricultural | 4 | 66.7% |
| Physical & Health Sciences | 1 | 16.7% |
| Psychology | 0 | 0.0% |
| Social Sciences | 0 | 0.0% |
| Engineering | 0 | 0.0% |
| Multidisciplinary Studies | 0 | 0.0% |
| Science & Technology | 0 | 0.0% |
| Business | 1 | 16.7% |
| Education | 0 | 0.0% |
| Literature & Languages | 0 | 0.0% |
| Liberal Arts & History | 0 | 0.0% |
| Visual & Performing Arts | 0 | 0.0% |
| Communications | 0 | 0.0% |
| Arts & Humanities | 0 | 0.0% |
| Total | 6 | 100.0% |
Transportation & Commute in Ginger Blue
Vehicle Availability by Sex in Ginger Blue
The most prevalent vehicle ownership categories in Ginger Blue are males with 1 vehicle (36, accounting for 63.2%) and females with 1 vehicle (1, making up 189.5%).
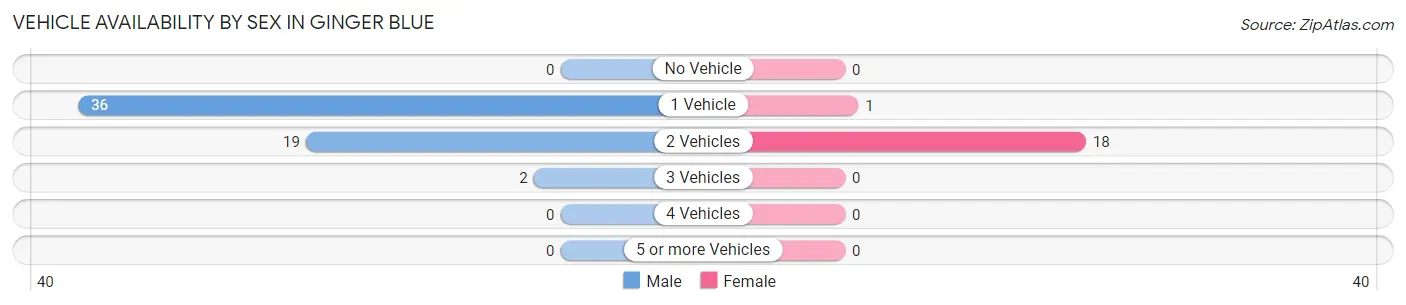
| Vehicles Available | Male | Female |
| No Vehicle | 0 (0.0%) | 0 (0.0%) |
| 1 Vehicle | 36 (63.2%) | 1 (5.3%) |
| 2 Vehicles | 19 (33.3%) | 18 (94.7%) |
| 3 Vehicles | 2 (3.5%) | 0 (0.0%) |
| 4 Vehicles | 0 (0.0%) | 0 (0.0%) |
| 5 or more Vehicles | 0 (0.0%) | 0 (0.0%) |
| Total | 57 (100.0%) | 19 (100.0%) |
Commute Time in Ginger Blue
The most frequently occuring commute durations in Ginger Blue are 10 to 14 minutes (70 commuters, 95.9%), 20 to 24 minutes (3 commuters, 4.1%), and less than 5 minutes (0 commuters, 0.0%).
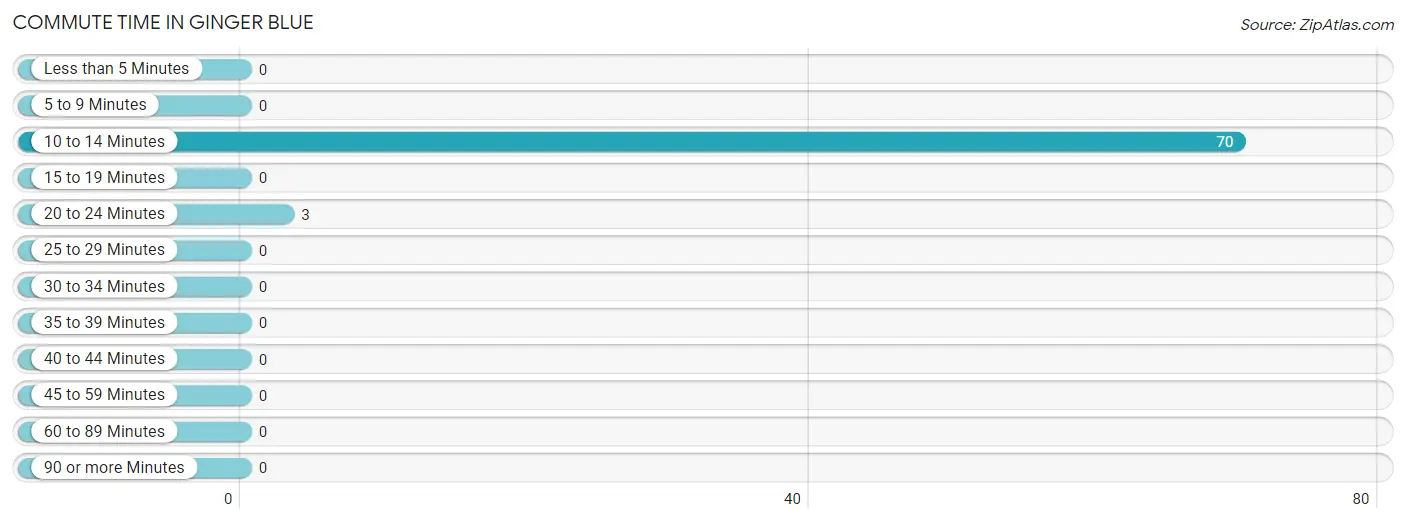
| Commute Time | # Commuters | % Commuters |
| Less than 5 Minutes | 0 | 0.0% |
| 5 to 9 Minutes | 0 | 0.0% |
| 10 to 14 Minutes | 70 | 95.9% |
| 15 to 19 Minutes | 0 | 0.0% |
| 20 to 24 Minutes | 3 | 4.1% |
| 25 to 29 Minutes | 0 | 0.0% |
| 30 to 34 Minutes | 0 | 0.0% |
| 35 to 39 Minutes | 0 | 0.0% |
| 40 to 44 Minutes | 0 | 0.0% |
| 45 to 59 Minutes | 0 | 0.0% |
| 60 to 89 Minutes | 0 | 0.0% |
| 90 or more Minutes | 0 | 0.0% |
Commute Time by Sex in Ginger Blue
The most common commute times in Ginger Blue are 10 to 14 minutes (54 commuters, 94.7%) for males and 10 to 14 minutes (16 commuters, 100.0%) for females.
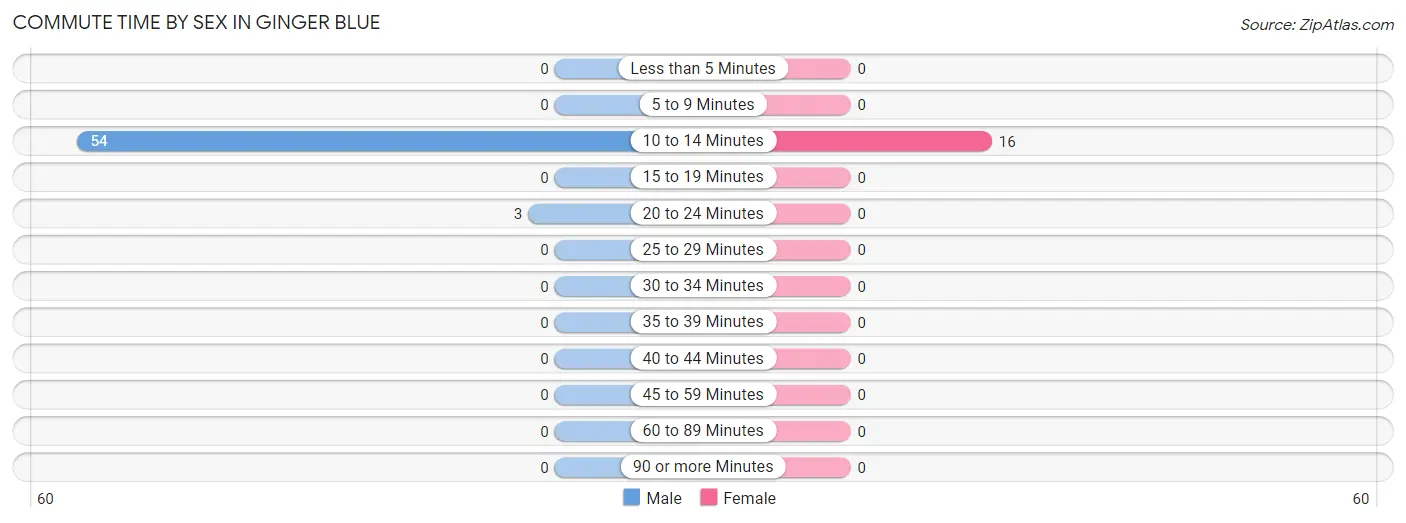
| Commute Time | Male | Female |
| Less than 5 Minutes | 0 (0.0%) | 0 (0.0%) |
| 5 to 9 Minutes | 0 (0.0%) | 0 (0.0%) |
| 10 to 14 Minutes | 54 (94.7%) | 16 (100.0%) |
| 15 to 19 Minutes | 0 (0.0%) | 0 (0.0%) |
| 20 to 24 Minutes | 3 (5.3%) | 0 (0.0%) |
| 25 to 29 Minutes | 0 (0.0%) | 0 (0.0%) |
| 30 to 34 Minutes | 0 (0.0%) | 0 (0.0%) |
| 35 to 39 Minutes | 0 (0.0%) | 0 (0.0%) |
| 40 to 44 Minutes | 0 (0.0%) | 0 (0.0%) |
| 45 to 59 Minutes | 0 (0.0%) | 0 (0.0%) |
| 60 to 89 Minutes | 0 (0.0%) | 0 (0.0%) |
| 90 or more Minutes | 0 (0.0%) | 0 (0.0%) |
Time of Departure to Work by Sex in Ginger Blue
The most frequent times of departure to work in Ginger Blue are 12:00 PM to 3:59 PM (36, 63.2%) for males and 7:00 AM to 7:29 AM (16, 100.0%) for females.
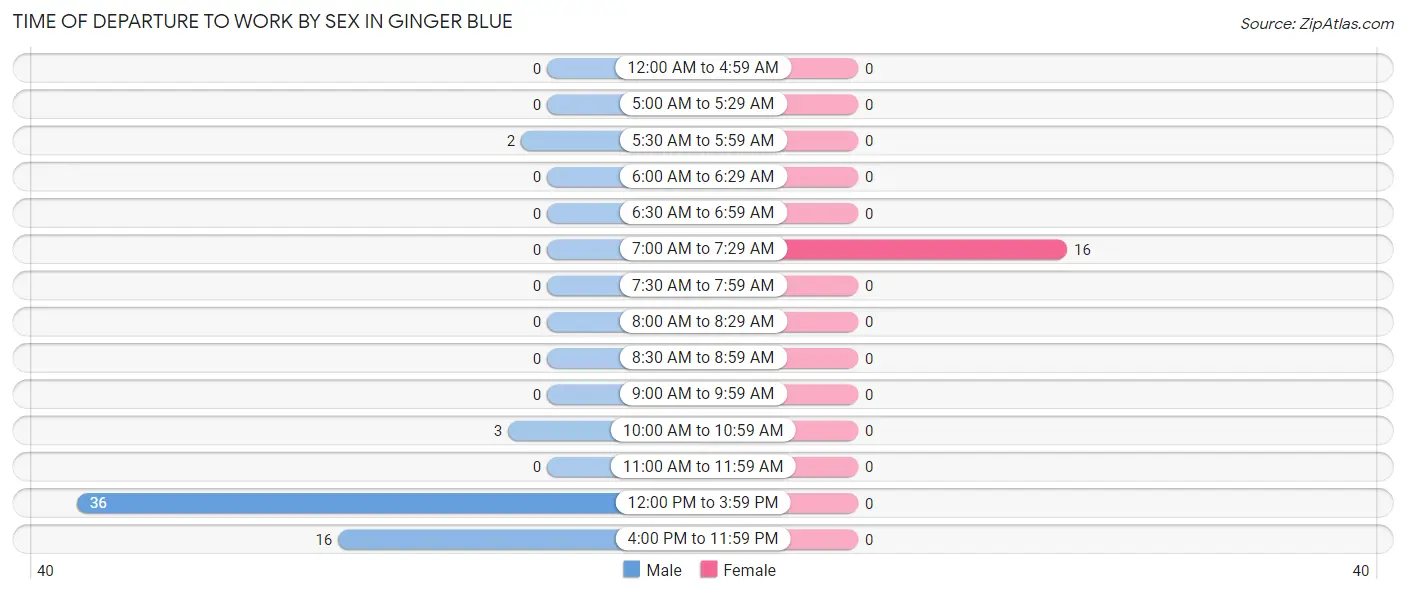
| Time of Departure | Male | Female |
| 12:00 AM to 4:59 AM | 0 (0.0%) | 0 (0.0%) |
| 5:00 AM to 5:29 AM | 0 (0.0%) | 0 (0.0%) |
| 5:30 AM to 5:59 AM | 2 (3.5%) | 0 (0.0%) |
| 6:00 AM to 6:29 AM | 0 (0.0%) | 0 (0.0%) |
| 6:30 AM to 6:59 AM | 0 (0.0%) | 0 (0.0%) |
| 7:00 AM to 7:29 AM | 0 (0.0%) | 16 (100.0%) |
| 7:30 AM to 7:59 AM | 0 (0.0%) | 0 (0.0%) |
| 8:00 AM to 8:29 AM | 0 (0.0%) | 0 (0.0%) |
| 8:30 AM to 8:59 AM | 0 (0.0%) | 0 (0.0%) |
| 9:00 AM to 9:59 AM | 0 (0.0%) | 0 (0.0%) |
| 10:00 AM to 10:59 AM | 3 (5.3%) | 0 (0.0%) |
| 11:00 AM to 11:59 AM | 0 (0.0%) | 0 (0.0%) |
| 12:00 PM to 3:59 PM | 36 (63.2%) | 0 (0.0%) |
| 4:00 PM to 11:59 PM | 16 (28.1%) | 0 (0.0%) |
| Total | 57 (100.0%) | 16 (100.0%) |
Housing Occupancy in Ginger Blue
Occupancy by Ownership in Ginger Blue
Of the total 52 dwellings in Ginger Blue, owner-occupied units account for 47 (90.4%), while renter-occupied units make up 5 (9.6%).
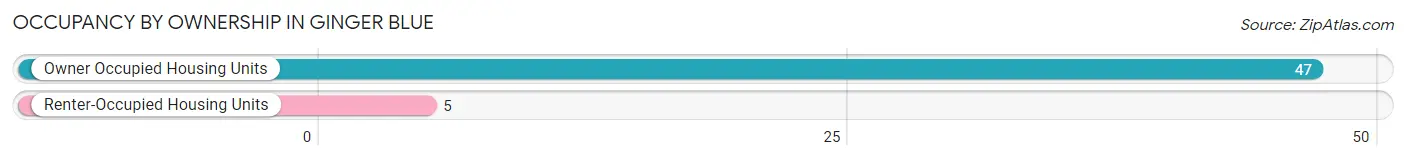
| Occupancy | # Housing Units | % Housing Units |
| Owner Occupied Housing Units | 47 | 90.4% |
| Renter-Occupied Housing Units | 5 | 9.6% |
| Total Occupied Housing Units | 52 | 100.0% |
Occupancy by Household Size in Ginger Blue
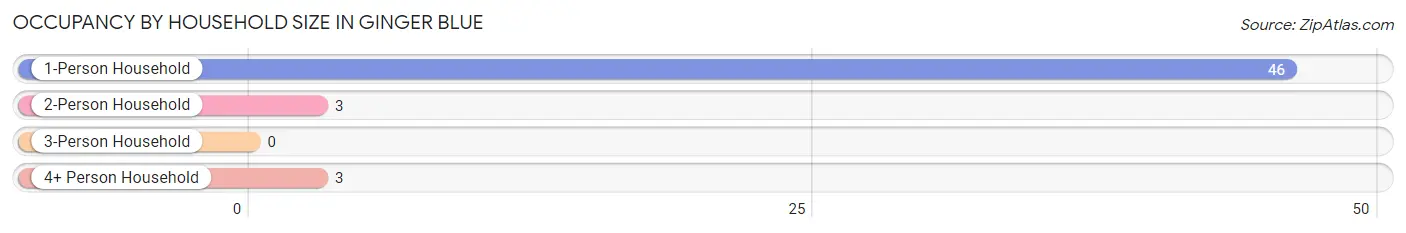
| Household Size | # Housing Units | % Housing Units |
| 1-Person Household | 46 | 88.5% |
| 2-Person Household | 3 | 5.8% |
| 3-Person Household | 0 | 0.0% |
| 4+ Person Household | 3 | 5.8% |
| Total Housing Units | 52 | 100.0% |
Occupancy by Ownership by Household Size in Ginger Blue
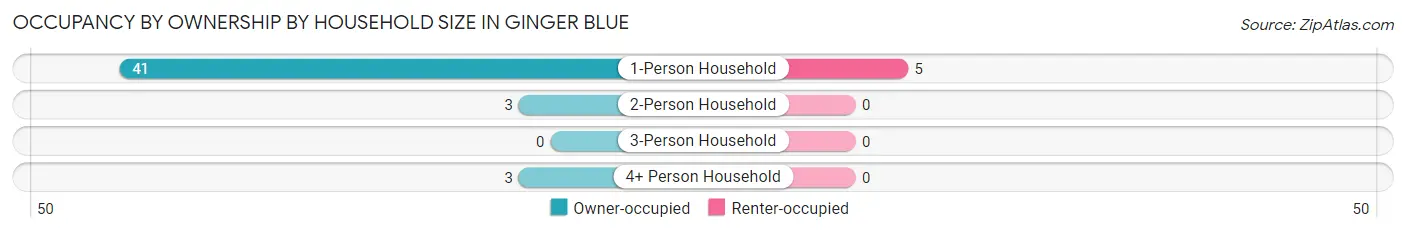
| Household Size | Owner-occupied | Renter-occupied |
| 1-Person Household | 41 (89.1%) | 5 (10.9%) |
| 2-Person Household | 3 (100.0%) | 0 (0.0%) |
| 3-Person Household | 0 (0.0%) | 0 (0.0%) |
| 4+ Person Household | 3 (100.0%) | 0 (0.0%) |
| Total Housing Units | 47 (90.4%) | 5 (9.6%) |
Occupancy by Educational Attainment in Ginger Blue
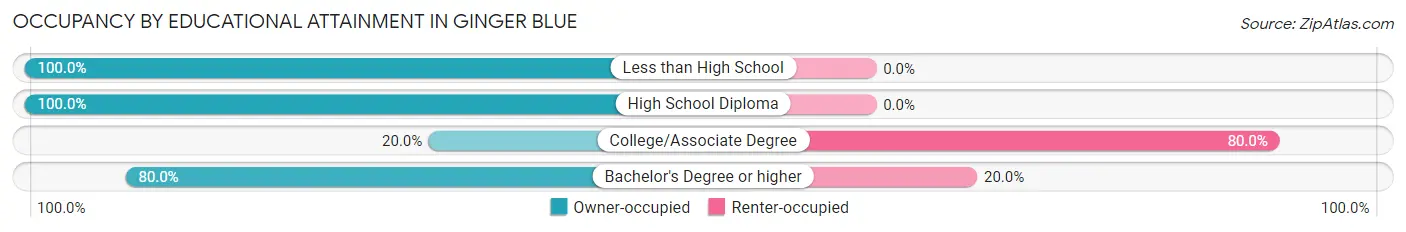
| Household Size | Owner-occupied | Renter-occupied |
| Less than High School | 39 (100.0%) | 0 (0.0%) |
| High School Diploma | 3 (100.0%) | 0 (0.0%) |
| College/Associate Degree | 1 (20.0%) | 4 (80.0%) |
| Bachelor's Degree or higher | 4 (80.0%) | 1 (20.0%) |
Occupancy by Age of Householder in Ginger Blue
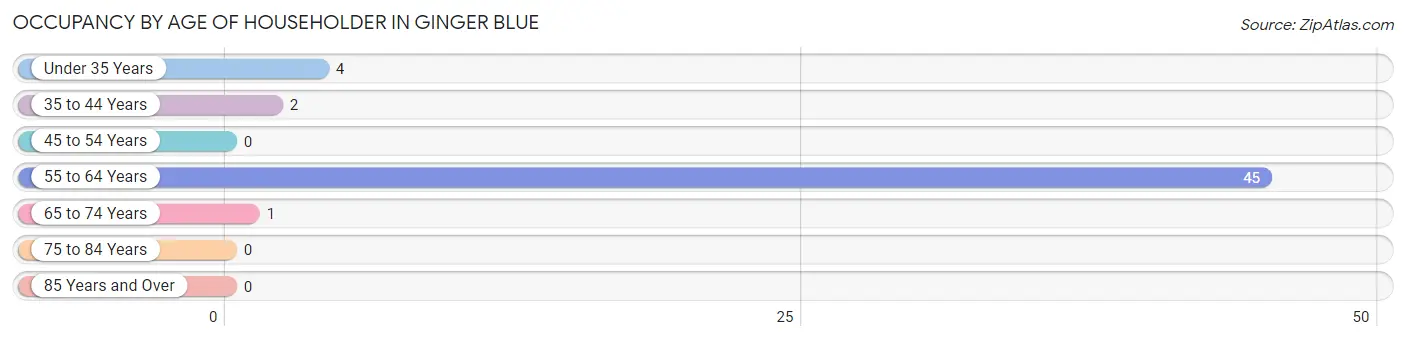
| Age Bracket | # Households | % Households |
| Under 35 Years | 4 | 7.7% |
| 35 to 44 Years | 2 | 3.8% |
| 45 to 54 Years | 0 | 0.0% |
| 55 to 64 Years | 45 | 86.5% |
| 65 to 74 Years | 1 | 1.9% |
| 75 to 84 Years | 0 | 0.0% |
| 85 Years and Over | 0 | 0.0% |
| Total | 52 | 100.0% |
Housing Finances in Ginger Blue
Median Income by Occupancy in Ginger Blue
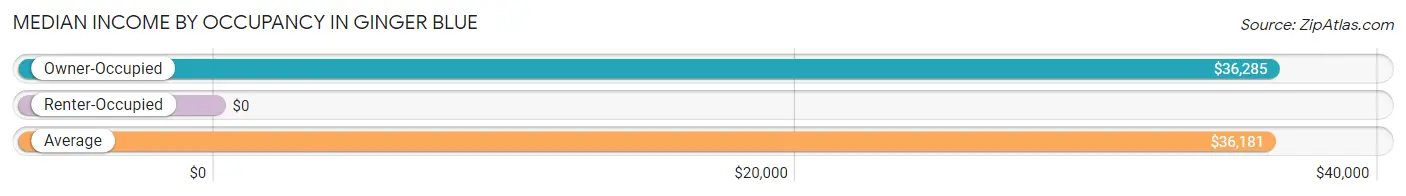
| Occupancy Type | # Households | Median Income |
| Owner-Occupied | 47 (90.4%) | $36,285 |
| Renter-Occupied | 5 (9.6%) | $0 |
| Average | 52 (100.0%) | $36,181 |
Occupancy by Householder Income Bracket in Ginger Blue
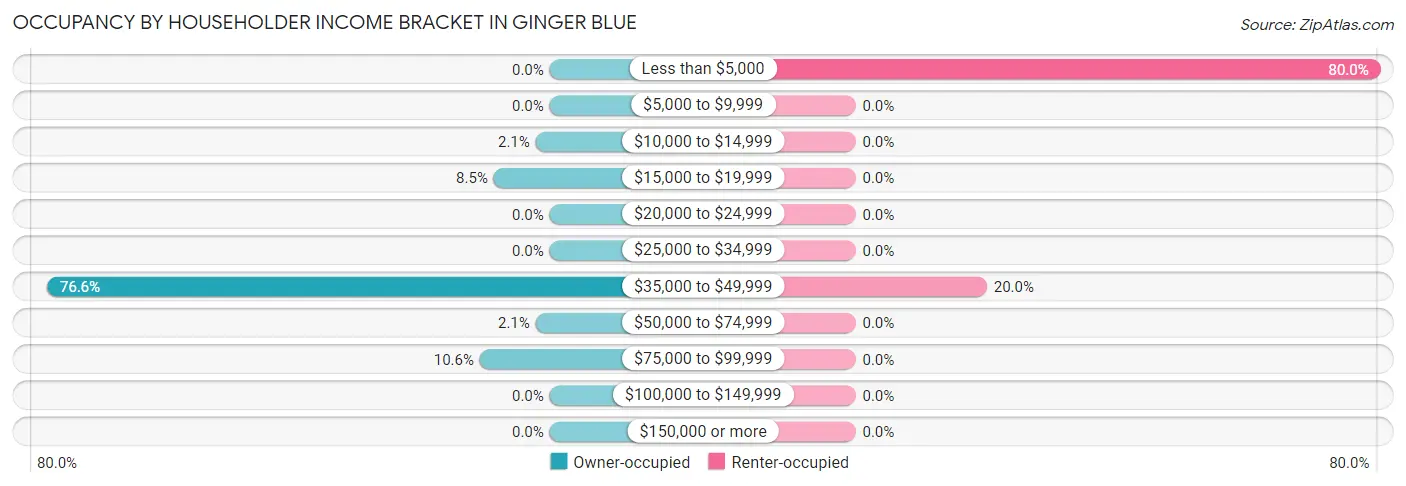
| Income Bracket | Owner-occupied | Renter-occupied |
| Less than $5,000 | 0 (0.0%) | 4 (80.0%) |
| $5,000 to $9,999 | 0 (0.0%) | 0 (0.0%) |
| $10,000 to $14,999 | 1 (2.1%) | 0 (0.0%) |
| $15,000 to $19,999 | 4 (8.5%) | 0 (0.0%) |
| $20,000 to $24,999 | 0 (0.0%) | 0 (0.0%) |
| $25,000 to $34,999 | 0 (0.0%) | 0 (0.0%) |
| $35,000 to $49,999 | 36 (76.6%) | 1 (20.0%) |
| $50,000 to $74,999 | 1 (2.1%) | 0 (0.0%) |
| $75,000 to $99,999 | 5 (10.6%) | 0 (0.0%) |
| $100,000 to $149,999 | 0 (0.0%) | 0 (0.0%) |
| $150,000 or more | 0 (0.0%) | 0 (0.0%) |
| Total | 47 (100.0%) | 5 (100.0%) |
Monthly Housing Cost Tiers in Ginger Blue
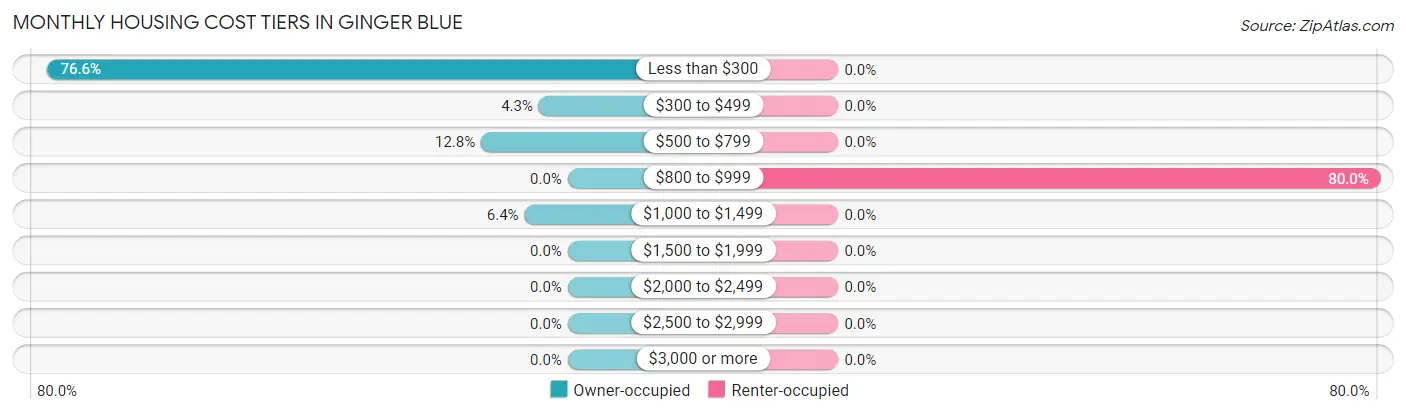
| Monthly Cost | Owner-occupied | Renter-occupied |
| Less than $300 | 36 (76.6%) | 0 (0.0%) |
| $300 to $499 | 2 (4.3%) | 0 (0.0%) |
| $500 to $799 | 6 (12.8%) | 0 (0.0%) |
| $800 to $999 | 0 (0.0%) | 4 (80.0%) |
| $1,000 to $1,499 | 3 (6.4%) | 0 (0.0%) |
| $1,500 to $1,999 | 0 (0.0%) | 0 (0.0%) |
| $2,000 to $2,499 | 0 (0.0%) | 0 (0.0%) |
| $2,500 to $2,999 | 0 (0.0%) | 0 (0.0%) |
| $3,000 or more | 0 (0.0%) | 0 (0.0%) |
| Total | 47 (100.0%) | 5 (100.0%) |
Physical Housing Characteristics in Ginger Blue
Housing Structures in Ginger Blue
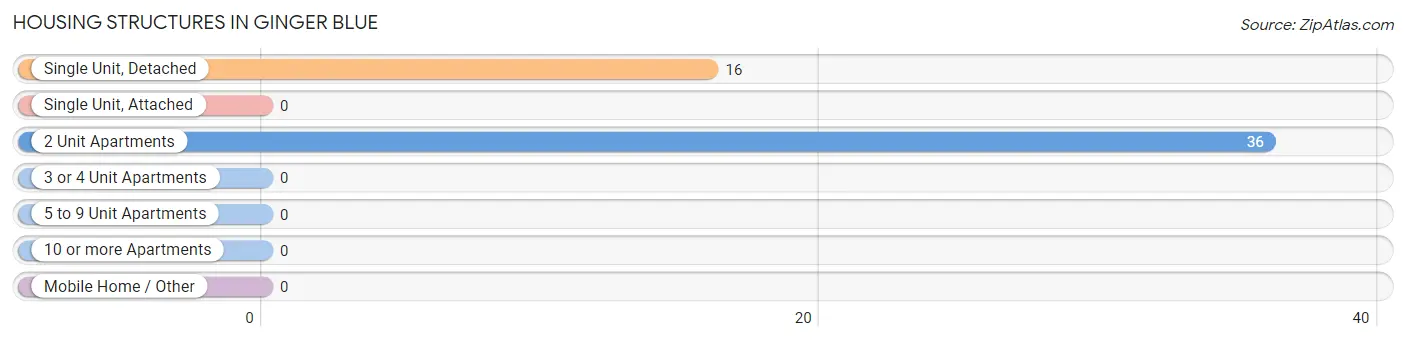
| Structure Type | # Housing Units | % Housing Units |
| Single Unit, Detached | 16 | 30.8% |
| Single Unit, Attached | 0 | 0.0% |
| 2 Unit Apartments | 36 | 69.2% |
| 3 or 4 Unit Apartments | 0 | 0.0% |
| 5 to 9 Unit Apartments | 0 | 0.0% |
| 10 or more Apartments | 0 | 0.0% |
| Mobile Home / Other | 0 | 0.0% |
| Total | 52 | 100.0% |
Housing Structures by Occupancy in Ginger Blue
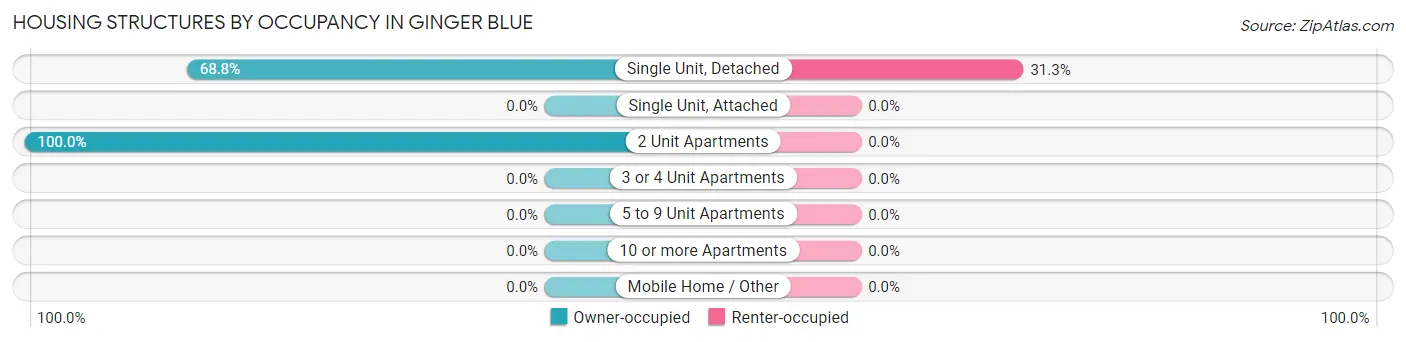
| Structure Type | Owner-occupied | Renter-occupied |
| Single Unit, Detached | 11 (68.8%) | 5 (31.2%) |
| Single Unit, Attached | 0 (0.0%) | 0 (0.0%) |
| 2 Unit Apartments | 36 (100.0%) | 0 (0.0%) |
| 3 or 4 Unit Apartments | 0 (0.0%) | 0 (0.0%) |
| 5 to 9 Unit Apartments | 0 (0.0%) | 0 (0.0%) |
| 10 or more Apartments | 0 (0.0%) | 0 (0.0%) |
| Mobile Home / Other | 0 (0.0%) | 0 (0.0%) |
| Total | 47 (90.4%) | 5 (9.6%) |
Housing Structures by Number of Rooms in Ginger Blue
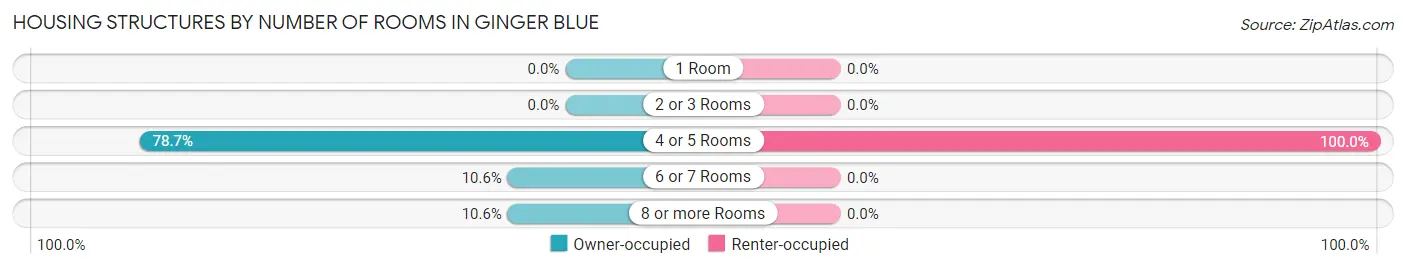
| Number of Rooms | Owner-occupied | Renter-occupied |
| 1 Room | 0 (0.0%) | 0 (0.0%) |
| 2 or 3 Rooms | 0 (0.0%) | 0 (0.0%) |
| 4 or 5 Rooms | 37 (78.7%) | 5 (100.0%) |
| 6 or 7 Rooms | 5 (10.6%) | 0 (0.0%) |
| 8 or more Rooms | 5 (10.6%) | 0 (0.0%) |
| Total | 47 (100.0%) | 5 (100.0%) |
Housing Structure by Heating Type in Ginger Blue
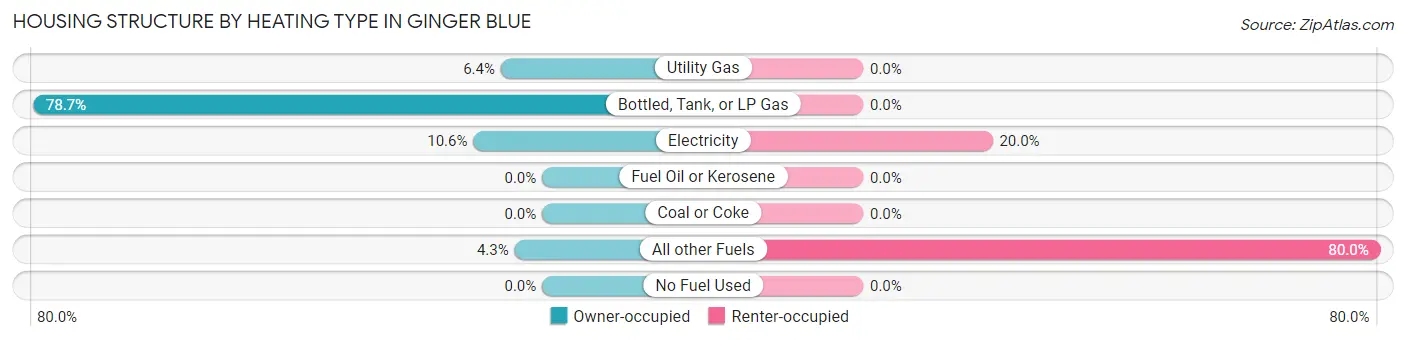
| Heating Type | Owner-occupied | Renter-occupied |
| Utility Gas | 3 (6.4%) | 0 (0.0%) |
| Bottled, Tank, or LP Gas | 37 (78.7%) | 0 (0.0%) |
| Electricity | 5 (10.6%) | 1 (20.0%) |
| Fuel Oil or Kerosene | 0 (0.0%) | 0 (0.0%) |
| Coal or Coke | 0 (0.0%) | 0 (0.0%) |
| All other Fuels | 2 (4.3%) | 4 (80.0%) |
| No Fuel Used | 0 (0.0%) | 0 (0.0%) |
| Total | 47 (100.0%) | 5 (100.0%) |
Household Vehicle Usage in Ginger Blue
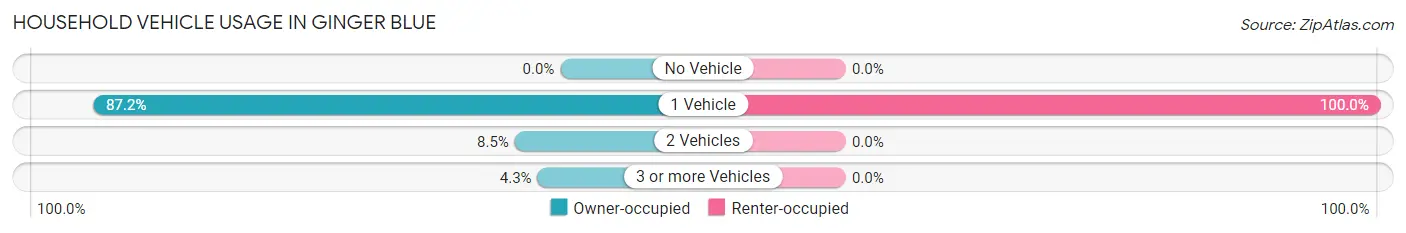
| Vehicles per Household | Owner-occupied | Renter-occupied |
| No Vehicle | 0 (0.0%) | 0 (0.0%) |
| 1 Vehicle | 41 (87.2%) | 5 (100.0%) |
| 2 Vehicles | 4 (8.5%) | 0 (0.0%) |
| 3 or more Vehicles | 2 (4.3%) | 0 (0.0%) |
| Total | 47 (100.0%) | 5 (100.0%) |
Real Estate & Mortgages in Ginger Blue
Real Estate and Mortgage Overview in Ginger Blue
| Characteristic | Without Mortgage | With Mortgage |
| Housing Units | 44 | 3 |
| Median Property Value | $45,900 | $0 |
| Median Household Income | $36,181 | $0 |
| Monthly Housing Costs | $181 | $0 |
| Real Estate Taxes | $517 | $0 |
Property Value by Mortgage Status in Ginger Blue
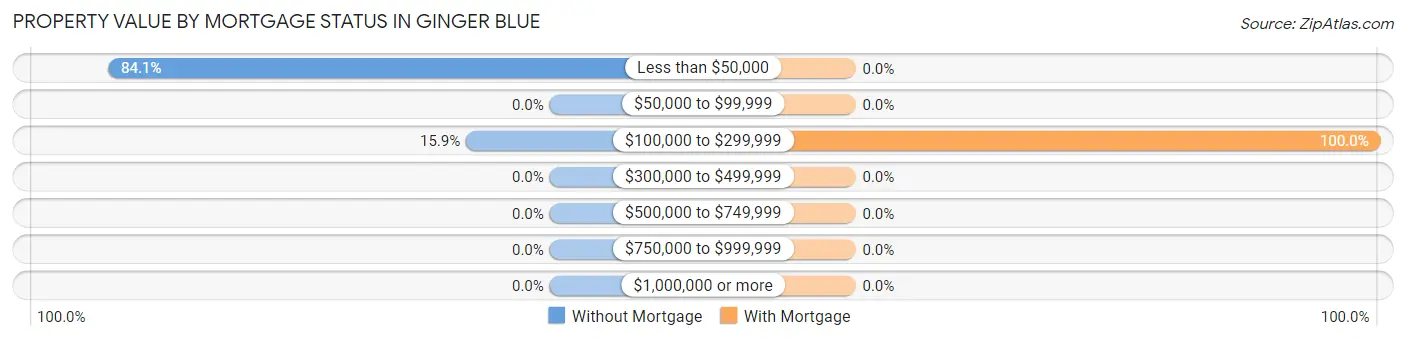
| Property Value | Without Mortgage | With Mortgage |
| Less than $50,000 | 37 (84.1%) | 0 (0.0%) |
| $50,000 to $99,999 | 0 (0.0%) | 0 (0.0%) |
| $100,000 to $299,999 | 7 (15.9%) | 3 (100.0%) |
| $300,000 to $499,999 | 0 (0.0%) | 0 (0.0%) |
| $500,000 to $749,999 | 0 (0.0%) | 0 (0.0%) |
| $750,000 to $999,999 | 0 (0.0%) | 0 (0.0%) |
| $1,000,000 or more | 0 (0.0%) | 0 (0.0%) |
| Total | 44 (100.0%) | 3 (100.0%) |
Household Income by Mortgage Status in Ginger Blue
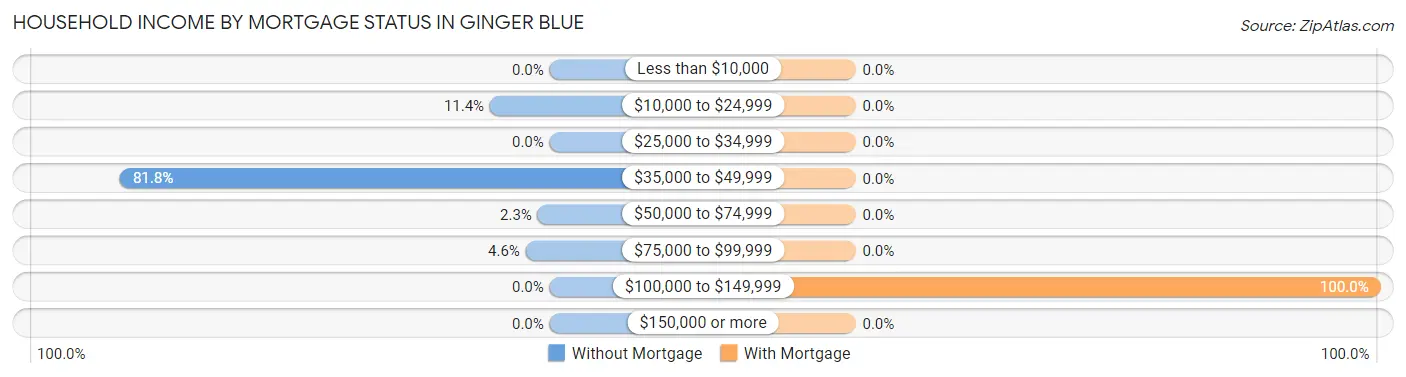
| Household Income | Without Mortgage | With Mortgage |
| Less than $10,000 | 0 (0.0%) | 0 (0.0%) |
| $10,000 to $24,999 | 5 (11.4%) | 0 (0.0%) |
| $25,000 to $34,999 | 0 (0.0%) | 0 (0.0%) |
| $35,000 to $49,999 | 36 (81.8%) | 0 (0.0%) |
| $50,000 to $74,999 | 1 (2.3%) | 0 (0.0%) |
| $75,000 to $99,999 | 2 (4.5%) | 0 (0.0%) |
| $100,000 to $149,999 | 0 (0.0%) | 3 (100.0%) |
| $150,000 or more | 0 (0.0%) | 0 (0.0%) |
| Total | 44 (100.0%) | 3 (100.0%) |
Property Value to Household Income Ratio in Ginger Blue
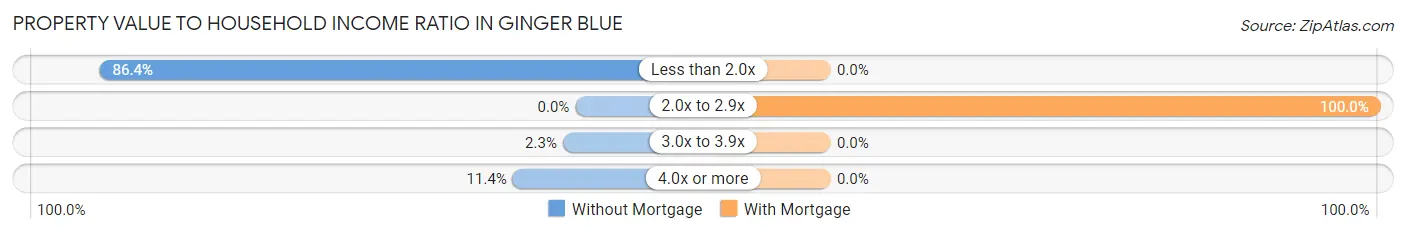
| Value-to-Income Ratio | Without Mortgage | With Mortgage |
| Less than 2.0x | 38 (86.4%) | 0 (0.0%) |
| 2.0x to 2.9x | 0 (0.0%) | 3 (100.0%) |
| 3.0x to 3.9x | 1 (2.3%) | 0 (0.0%) |
| 4.0x or more | 5 (11.4%) | 0 (0.0%) |
| Total | 44 (100.0%) | 3 (100.0%) |
Real Estate Taxes by Mortgage Status in Ginger Blue
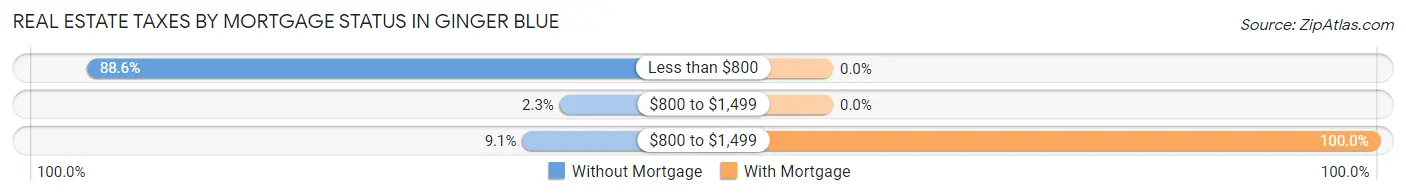
| Property Taxes | Without Mortgage | With Mortgage |
| Less than $800 | 39 (88.6%) | 0 (0.0%) |
| $800 to $1,499 | 1 (2.3%) | 0 (0.0%) |
| $800 to $1,499 | 4 (9.1%) | 3 (100.0%) |
| Total | 44 (100.0%) | 3 (100.0%) |
Health & Disability in Ginger Blue
Health Insurance Coverage by Age in Ginger Blue
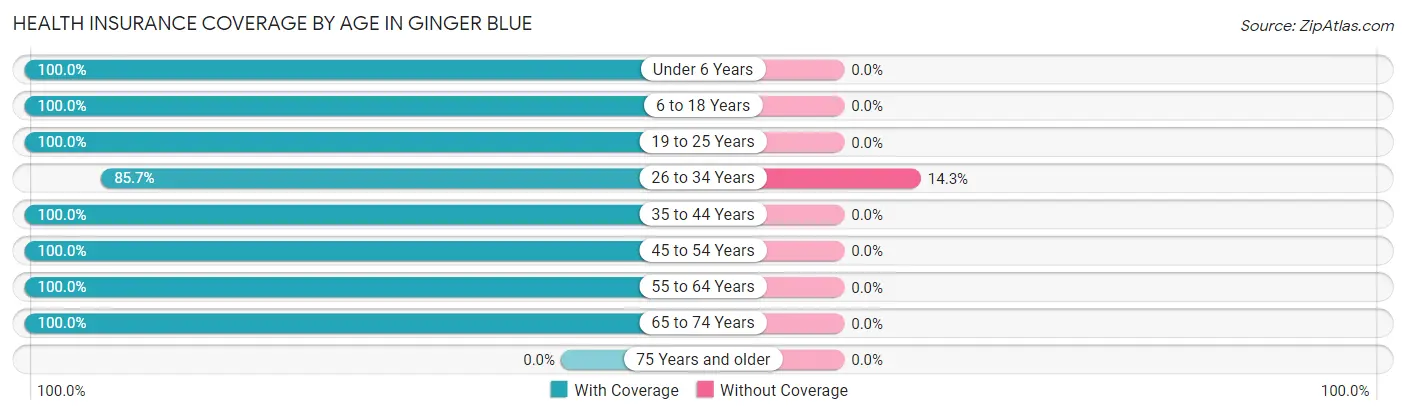
| Age Bracket | With Coverage | Without Coverage |
| Under 6 Years | 17 (100.0%) | 0 (0.0%) |
| 6 to 18 Years | 5 (100.0%) | 0 (0.0%) |
| 19 to 25 Years | 3 (100.0%) | 0 (0.0%) |
| 26 to 34 Years | 6 (85.7%) | 1 (14.3%) |
| 35 to 44 Years | 18 (100.0%) | 0 (0.0%) |
| 45 to 54 Years | 15 (100.0%) | 0 (0.0%) |
| 55 to 64 Years | 47 (100.0%) | 0 (0.0%) |
| 65 to 74 Years | 1 (100.0%) | 0 (0.0%) |
| 75 Years and older | 0 (0.0%) | 0 (0.0%) |
| Total | 112 (99.1%) | 1 (0.9%) |
Health Insurance Coverage by Citizenship Status in Ginger Blue
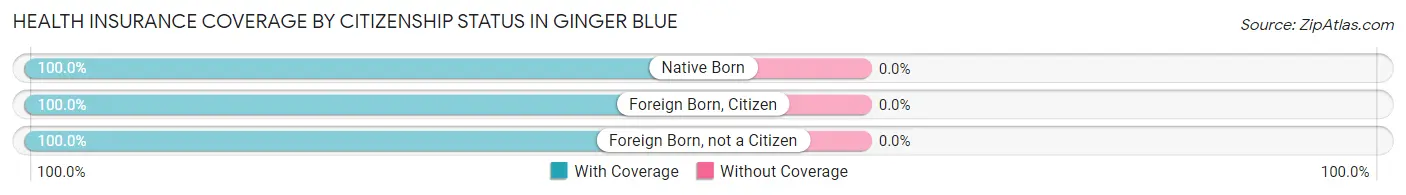
| Citizenship Status | With Coverage | Without Coverage |
| Native Born | 17 (100.0%) | 0 (0.0%) |
| Foreign Born, Citizen | 5 (100.0%) | 0 (0.0%) |
| Foreign Born, not a Citizen | 3 (100.0%) | 0 (0.0%) |
Health Insurance Coverage by Household Income in Ginger Blue
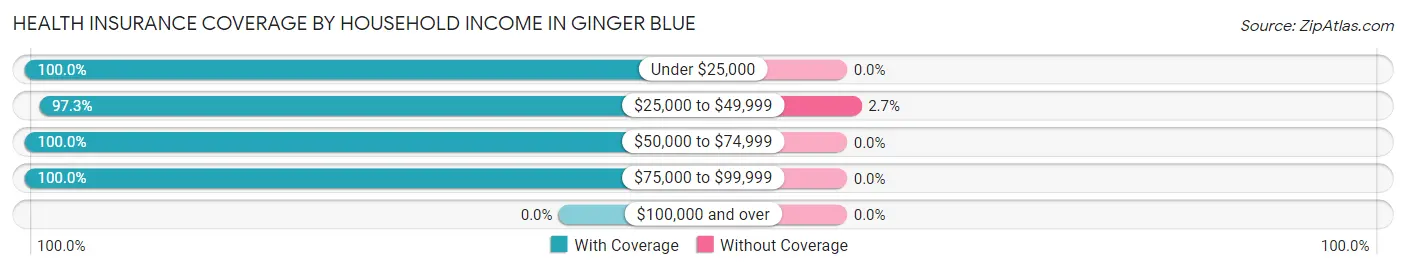
| Household Income | With Coverage | Without Coverage |
| Under $25,000 | 9 (100.0%) | 0 (0.0%) |
| $25,000 to $49,999 | 36 (97.3%) | 1 (2.7%) |
| $50,000 to $74,999 | 4 (100.0%) | 0 (0.0%) |
| $75,000 to $99,999 | 63 (100.0%) | 0 (0.0%) |
| $100,000 and over | 0 (0.0%) | 0 (0.0%) |
Public vs Private Health Insurance Coverage by Age in Ginger Blue
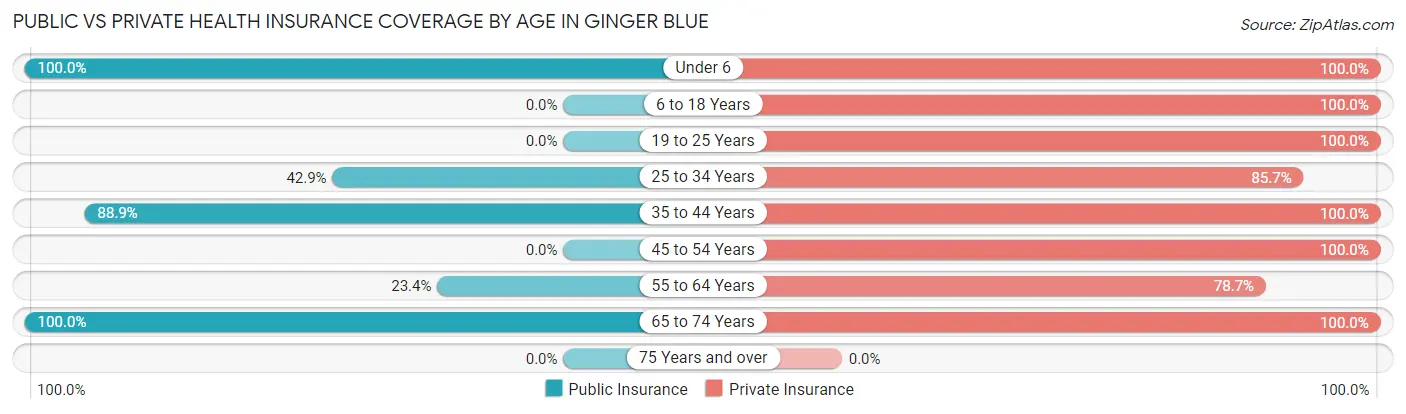
| Age Bracket | Public Insurance | Private Insurance |
| Under 6 | 17 (100.0%) | 17 (100.0%) |
| 6 to 18 Years | 0 (0.0%) | 5 (100.0%) |
| 19 to 25 Years | 0 (0.0%) | 3 (100.0%) |
| 25 to 34 Years | 3 (42.9%) | 6 (85.7%) |
| 35 to 44 Years | 16 (88.9%) | 18 (100.0%) |
| 45 to 54 Years | 0 (0.0%) | 15 (100.0%) |
| 55 to 64 Years | 11 (23.4%) | 37 (78.7%) |
| 65 to 74 Years | 1 (100.0%) | 1 (100.0%) |
| 75 Years and over | 0 (0.0%) | 0 (0.0%) |
| Total | 48 (42.5%) | 102 (90.3%) |
Disability Status by Sex by Age in Ginger Blue
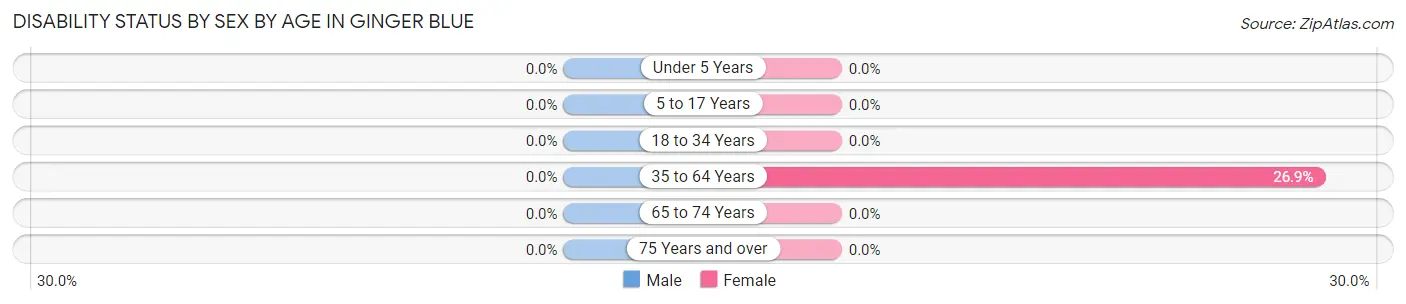
| Age Bracket | Male | Female |
| Under 5 Years | 0 (0.0%) | 0 (0.0%) |
| 5 to 17 Years | 0 (0.0%) | 0 (0.0%) |
| 18 to 34 Years | 0 (0.0%) | 0 (0.0%) |
| 35 to 64 Years | 0 (0.0%) | 7 (26.9%) |
| 65 to 74 Years | 0 (0.0%) | 0 (0.0%) |
| 75 Years and over | 0 (0.0%) | 0 (0.0%) |
Disability Class by Sex by Age in Ginger Blue
Disability Class: Hearing Difficulty
| Age Bracket | Male | Female |
| Under 5 Years | 0 (0.0%) | 0 (0.0%) |
| 5 to 17 Years | 0 (0.0%) | 0 (0.0%) |
| 18 to 34 Years | 0 (0.0%) | 0 (0.0%) |
| 35 to 64 Years | 0 (0.0%) | 0 (0.0%) |
| 65 to 74 Years | 0 (0.0%) | 0 (0.0%) |
| 75 Years and over | 0 (0.0%) | 0 (0.0%) |
Disability Class: Vision Difficulty
| Age Bracket | Male | Female |
| Under 5 Years | 0 (0.0%) | 0 (0.0%) |
| 5 to 17 Years | 0 (0.0%) | 0 (0.0%) |
| 18 to 34 Years | 0 (0.0%) | 0 (0.0%) |
| 35 to 64 Years | 0 (0.0%) | 0 (0.0%) |
| 65 to 74 Years | 0 (0.0%) | 0 (0.0%) |
| 75 Years and over | 0 (0.0%) | 0 (0.0%) |
Disability Class: Cognitive Difficulty
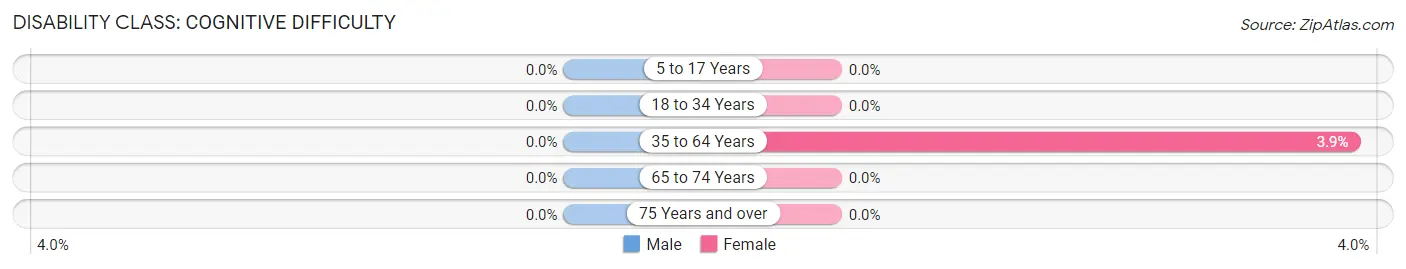
| Age Bracket | Male | Female |
| 5 to 17 Years | 0 (0.0%) | 0 (0.0%) |
| 18 to 34 Years | 0 (0.0%) | 0 (0.0%) |
| 35 to 64 Years | 0 (0.0%) | 1 (3.8%) |
| 65 to 74 Years | 0 (0.0%) | 0 (0.0%) |
| 75 Years and over | 0 (0.0%) | 0 (0.0%) |
Disability Class: Ambulatory Difficulty
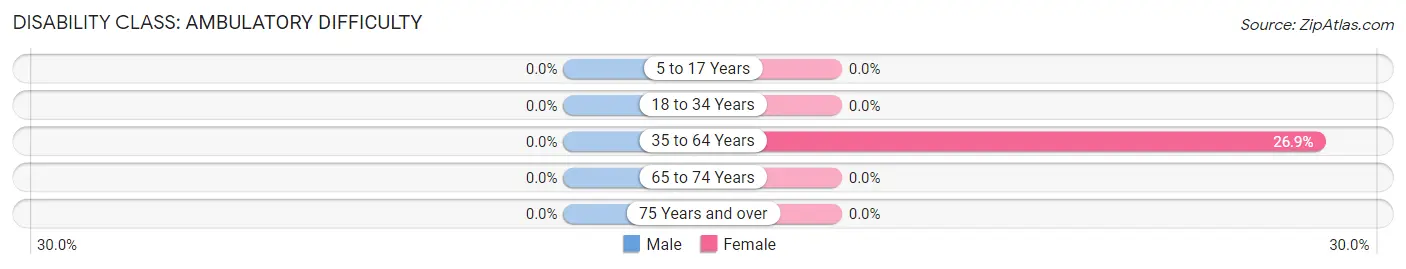
| Age Bracket | Male | Female |
| 5 to 17 Years | 0 (0.0%) | 0 (0.0%) |
| 18 to 34 Years | 0 (0.0%) | 0 (0.0%) |
| 35 to 64 Years | 0 (0.0%) | 7 (26.9%) |
| 65 to 74 Years | 0 (0.0%) | 0 (0.0%) |
| 75 Years and over | 0 (0.0%) | 0 (0.0%) |
Disability Class: Self-Care Difficulty
| Age Bracket | Male | Female |
| 5 to 17 Years | 0 (0.0%) | 0 (0.0%) |
| 18 to 34 Years | 0 (0.0%) | 0 (0.0%) |
| 35 to 64 Years | 0 (0.0%) | 0 (0.0%) |
| 65 to 74 Years | 0 (0.0%) | 0 (0.0%) |
| 75 Years and over | 0 (0.0%) | 0 (0.0%) |
Technology Access in Ginger Blue
Computing Device Access in Ginger Blue
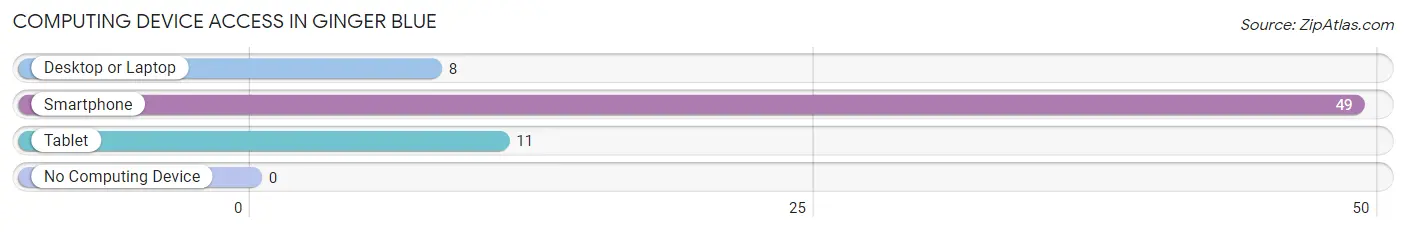
| Device Type | # Households | % Households |
| Desktop or Laptop | 8 | 15.4% |
| Smartphone | 49 | 94.2% |
| Tablet | 11 | 21.1% |
| No Computing Device | 0 | 0.0% |
| Total | 52 | 100.0% |
Internet Access in Ginger Blue
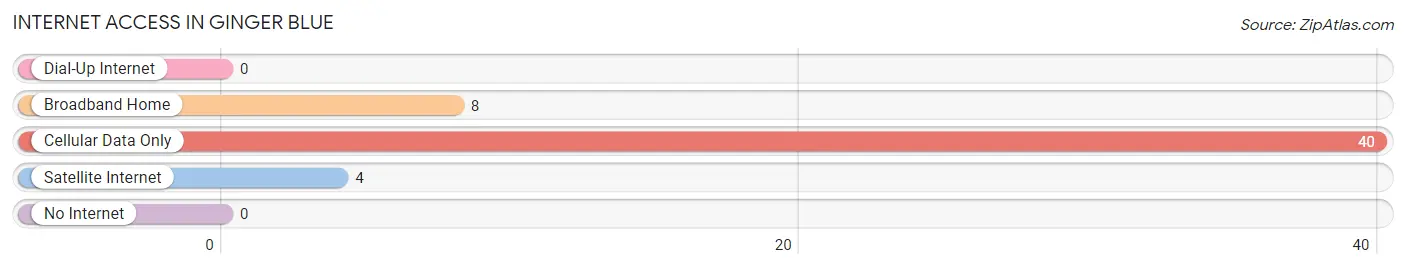
| Internet Type | # Households | % Households |
| Dial-Up Internet | 0 | 0.0% |
| Broadband Home | 8 | 15.4% |
| Cellular Data Only | 40 | 76.9% |
| Satellite Internet | 4 | 7.7% |
| No Internet | 0 | 0.0% |
| Total | 52 | 100.0% |
Ginger Blue Summary
Ginger Blue is a small city located in the state of Missouri, in the United States. It is situated in the southeastern corner of the state, near the Mississippi River. The city has a population of approximately 8,000 people, and is part of the St. Louis metropolitan area.
Geography
Ginger Blue is located in the southeastern corner of Missouri, near the Mississippi River. The city is situated on the banks of the Big River, which is a tributary of the Mississippi. The city is surrounded by rolling hills and wooded areas, and is located in the Ozark Plateau region. The climate in Ginger Blue is humid subtropical, with hot summers and mild winters.
Economy
Ginger Blue is a small city, but it has a diverse economy. The city is home to several manufacturing companies, including a paper mill, a furniture factory, and a plastics plant. The city also has a thriving agricultural sector, with several farms located in the area. The city is also home to several retail stores, restaurants, and other businesses.
Demographics
Ginger Blue has a population of approximately 8,000 people. The city is predominantly white, with a small African American population. The median household income in the city is $45,000, and the median home value is $150,000. The city has a low unemployment rate, and the poverty rate is below the national average.
Education
Ginger Blue is served by the Ginger Blue School District, which includes two elementary schools, one middle school, and one high school. The city also has several private schools, including a Catholic school and a Montessori school. The city is home to several colleges and universities, including the University of Missouri-St. Louis and St. Louis Community College.
Conclusion
Ginger Blue is a small city located in the southeastern corner of Missouri. The city has a population of approximately 8,000 people, and is part of the St. Louis metropolitan area. The city has a diverse economy, with several manufacturing companies, farms, and other businesses. The city is predominantly white, with a small African American population. The city is served by the Ginger Blue School District, and is home to several colleges and universities.
Common Questions
What is Per Capita Income in Ginger Blue?
Per Capita income in Ginger Blue is $24,835.
What is the Median Family Income in Ginger Blue?
Median Family Income in Ginger Blue is $84,167.
What is the Median Household income in Ginger Blue?
Median Household Income in Ginger Blue is $36,181.
What is Income or Wage Gap in Ginger Blue?
Income or Wage Gap in Ginger Blue is 30.0%.
Women in Ginger Blue earn 70.0 cents for every dollar earned by a man.
What is Inequality or Gini Index in Ginger Blue?
Inequality or Gini Index in Ginger Blue is 0.24.
What is the Total Population of Ginger Blue?
Total Population of Ginger Blue is 113.
What is the Total Male Population of Ginger Blue?
Total Male Population of Ginger Blue is 74.
What is the Total Female Population of Ginger Blue?
Total Female Population of Ginger Blue is 39.
What is the Ratio of Males per 100 Females in Ginger Blue?
There are 189.74 Males per 100 Females in Ginger Blue.
What is the Ratio of Females per 100 Males in Ginger Blue?
There are 52.70 Females per 100 Males in Ginger Blue.
What is the Median Population Age in Ginger Blue?
Median Population Age in Ginger Blue is 52.4 Years.
What is the Average Family Size in Ginger Blue
Average Family Size in Ginger Blue is 11.2 People.
What is the Average Household Size in Ginger Blue
Average Household Size in Ginger Blue is 2.2 People.
How Large is the Labor Force in Ginger Blue?
There are 76 People in the Labor Forcein in Ginger Blue.
What is the Percentage of People in the Labor Force in Ginger Blue?
83.5% of People are in the Labor Force in Ginger Blue.