Alpena, SD Map & Demographics
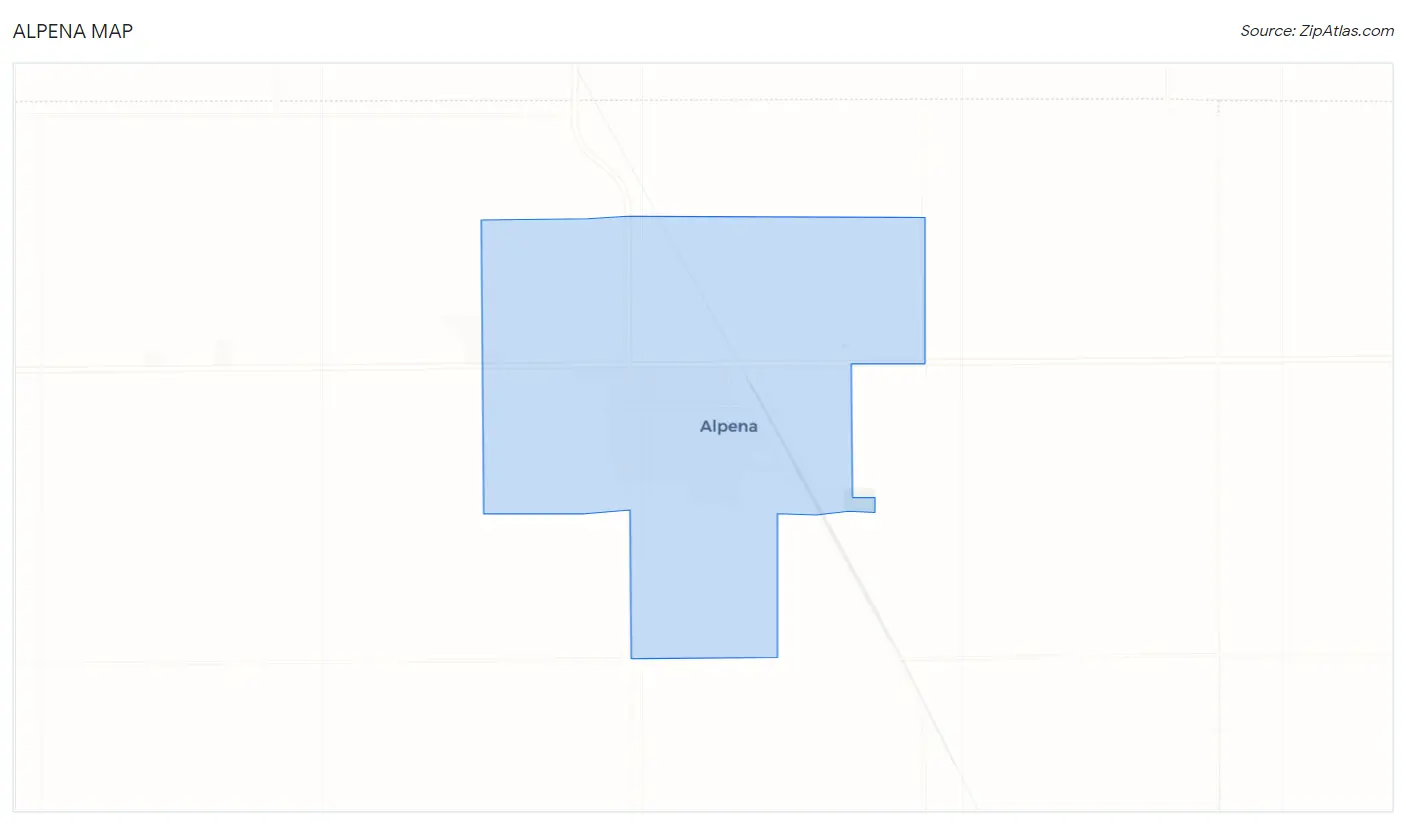
Alpena Map
Alpena Overview
$48,852
PER CAPITA INCOME
$84,167
AVG FAMILY INCOME
$67,500
AVG HOUSEHOLD INCOME
53.8%
WAGE / INCOME GAP [ % ]
46.2¢/ $1
WAGE / INCOME GAP [ $ ]
0.56
INEQUALITY / GINI INDEX
407
TOTAL POPULATION
195
MALE POPULATION
212
FEMALE POPULATION
91.98
MALES / 100 FEMALES
108.72
FEMALES / 100 MALES
40.1
MEDIAN AGE
2.8
AVG FAMILY SIZE
2.4
AVG HOUSEHOLD SIZE
188
LABOR FORCE [ PEOPLE ]
63.5%
PERCENT IN LABOR FORCE
Alpena Zip Codes
Alpena Area Codes
Income in Alpena
Income Overview in Alpena
Per Capita Income in Alpena is $48,852, while median incomes of families and households are $84,167 and $67,500 respectively.
| Characteristic | Number | Measure |
| Per Capita Income | 407 | $48,852 |
| Median Family Income | 128 | $84,167 |
| Mean Family Income | 128 | $147,785 |
| Median Household Income | 170 | $67,500 |
| Mean Household Income | 170 | $124,936 |
| Income Deficit | 128 | $0 |
| Wage / Income Gap (%) | 407 | 53.85% |
| Wage / Income Gap ($) | 407 | 46.15¢ per $1 |
| Gini / Inequality Index | 407 | 0.56 |
Earnings by Sex in Alpena
Average Earnings in Alpena are $47,045, $65,000 for men and $30,000 for women, a difference of 53.8%.
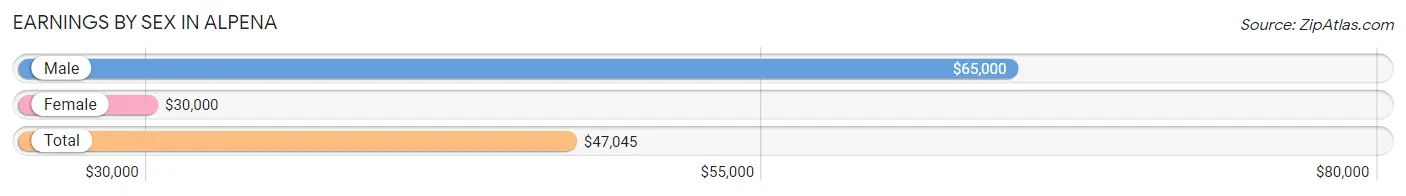
| Sex | Number | Average Earnings |
| Male | 114 (56.4%) | $65,000 |
| Female | 88 (43.6%) | $30,000 |
| Total | 202 (100.0%) | $47,045 |
Earnings by Sex by Income Bracket in Alpena
The most common earnings brackets in Alpena are $75,000 to $99,999 for men (32 | 28.1%) and $17,500 to $19,999 for women (18 | 20.4%).
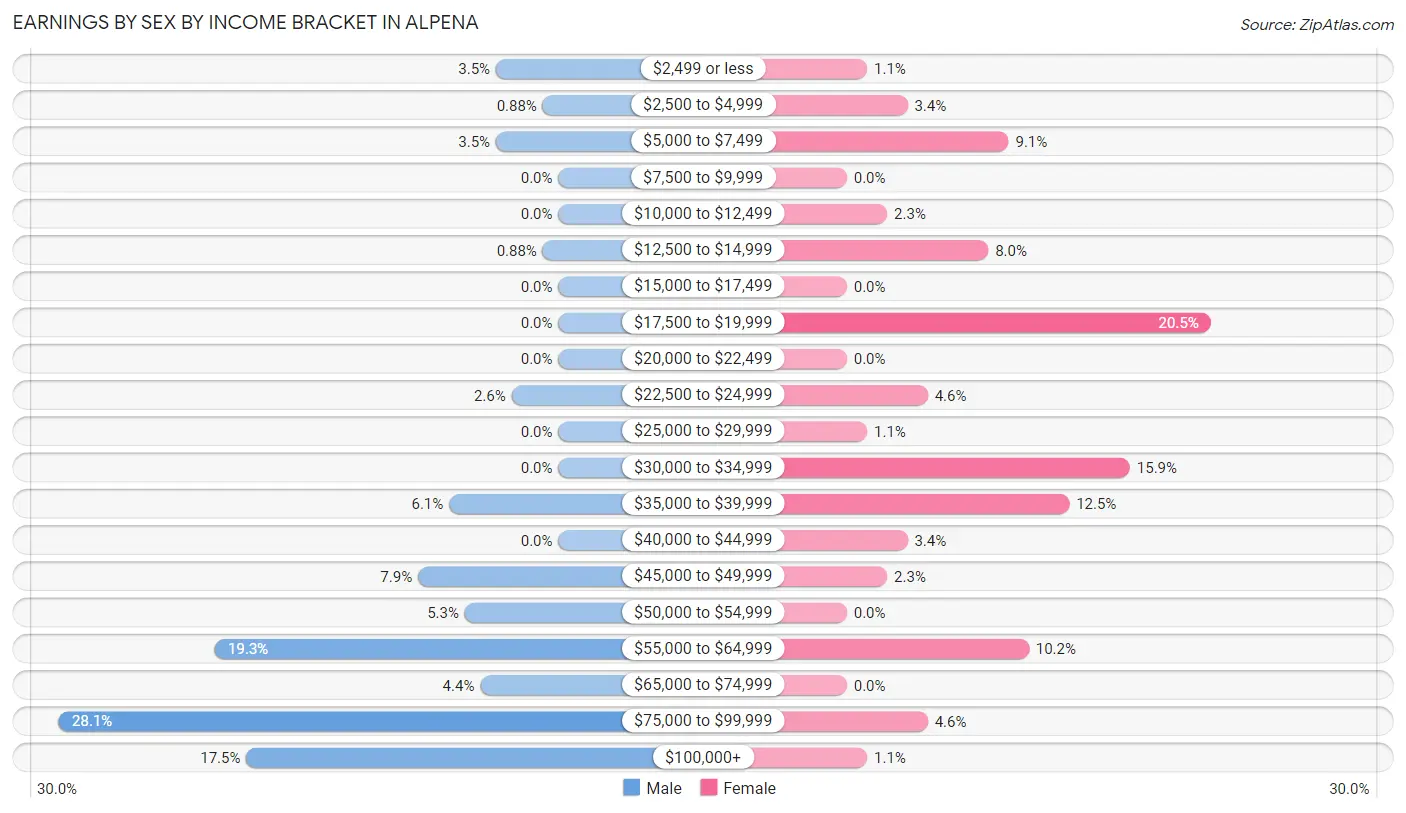
| Income | Male | Female |
| $2,499 or less | 4 (3.5%) | 1 (1.1%) |
| $2,500 to $4,999 | 1 (0.9%) | 3 (3.4%) |
| $5,000 to $7,499 | 4 (3.5%) | 8 (9.1%) |
| $7,500 to $9,999 | 0 (0.0%) | 0 (0.0%) |
| $10,000 to $12,499 | 0 (0.0%) | 2 (2.3%) |
| $12,500 to $14,999 | 1 (0.9%) | 7 (8.0%) |
| $15,000 to $17,499 | 0 (0.0%) | 0 (0.0%) |
| $17,500 to $19,999 | 0 (0.0%) | 18 (20.4%) |
| $20,000 to $22,499 | 0 (0.0%) | 0 (0.0%) |
| $22,500 to $24,999 | 3 (2.6%) | 4 (4.5%) |
| $25,000 to $29,999 | 0 (0.0%) | 1 (1.1%) |
| $30,000 to $34,999 | 0 (0.0%) | 14 (15.9%) |
| $35,000 to $39,999 | 7 (6.1%) | 11 (12.5%) |
| $40,000 to $44,999 | 0 (0.0%) | 3 (3.4%) |
| $45,000 to $49,999 | 9 (7.9%) | 2 (2.3%) |
| $50,000 to $54,999 | 6 (5.3%) | 0 (0.0%) |
| $55,000 to $64,999 | 22 (19.3%) | 9 (10.2%) |
| $65,000 to $74,999 | 5 (4.4%) | 0 (0.0%) |
| $75,000 to $99,999 | 32 (28.1%) | 4 (4.5%) |
| $100,000+ | 20 (17.5%) | 1 (1.1%) |
| Total | 114 (100.0%) | 88 (100.0%) |
Earnings by Sex by Educational Attainment in Alpena
Average earnings in Alpena are $66,667 for men and $26,250 for women, a difference of 60.6%. Men with an educational attainment of college or associate's degree enjoy the highest average annual earnings of $83,125, while those with high school diploma education earn the least with $58,942. Women with an educational attainment of high school diploma earn the most with the average annual earnings of $27,500, while those with less than high school education have the smallest earnings of $18,125.
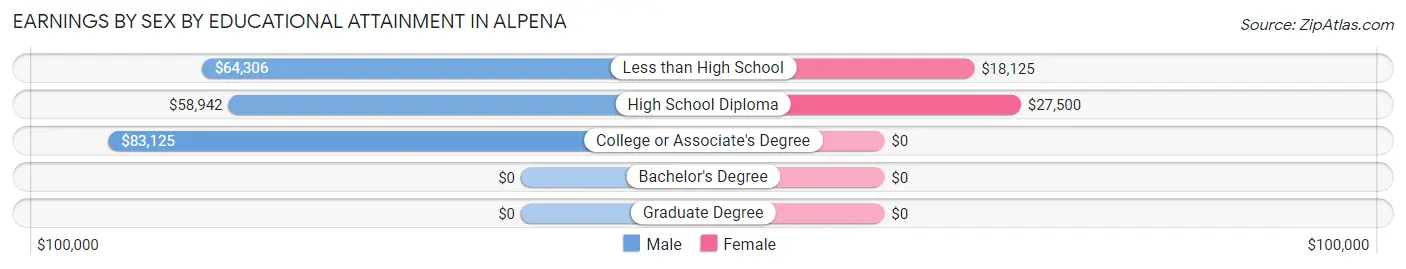
| Educational Attainment | Male Income | Female Income |
| Less than High School | $64,306 | $18,125 |
| High School Diploma | $58,942 | $27,500 |
| College or Associate's Degree | $83,125 | $0 |
| Bachelor's Degree | - | - |
| Graduate Degree | - | - |
| Total | $66,667 | $26,250 |
Family Income in Alpena
Family Income Brackets in Alpena
According to the Alpena family income data, there are 35 families falling into the $75,000 to $99,999 income range, which is the most common income bracket and makes up 27.3% of all families.
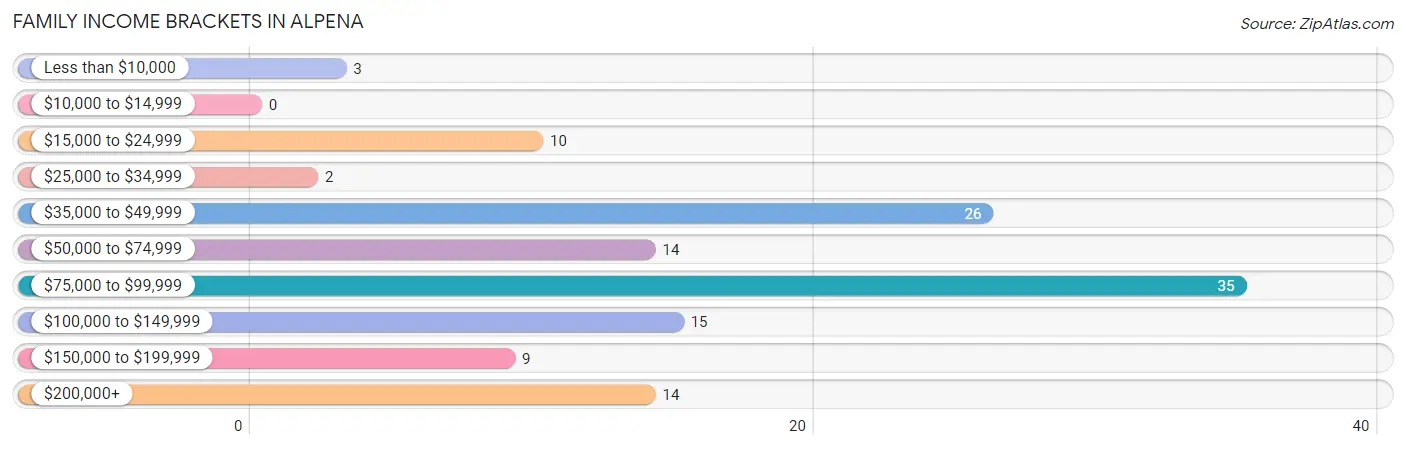
| Income Bracket | # Families | % Families |
| Less than $10,000 | 3 | 2.3% |
| $10,000 to $14,999 | 0 | 0.0% |
| $15,000 to $24,999 | 10 | 7.8% |
| $25,000 to $34,999 | 2 | 1.6% |
| $35,000 to $49,999 | 26 | 20.3% |
| $50,000 to $74,999 | 14 | 10.9% |
| $75,000 to $99,999 | 35 | 27.3% |
| $100,000 to $149,999 | 15 | 11.7% |
| $150,000 to $199,999 | 9 | 7.0% |
| $200,000+ | 14 | 10.9% |
Family Income by Famaliy Size in Alpena
4-person families (38 | 29.7%) account for the highest median family income in Alpena with $85,521 per family, while 2-person families (53 | 41.4%) have the highest median income of $34,375 per family member.
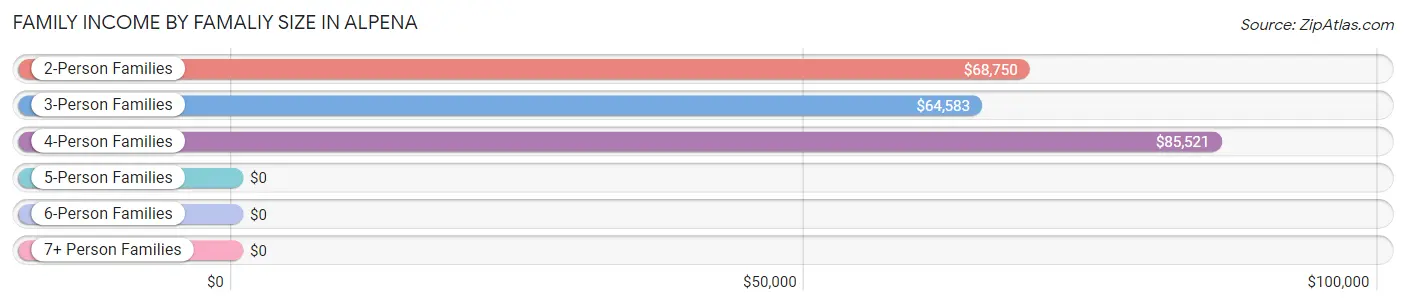
| Income Bracket | # Families | Median Income |
| 2-Person Families | 53 (41.4%) | $68,750 |
| 3-Person Families | 15 (11.7%) | $64,583 |
| 4-Person Families | 38 (29.7%) | $85,521 |
| 5-Person Families | 10 (7.8%) | $0 |
| 6-Person Families | 11 (8.6%) | $0 |
| 7+ Person Families | 1 (0.8%) | $0 |
| Total | 128 (100.0%) | $84,167 |
Family Income by Number of Earners in Alpena
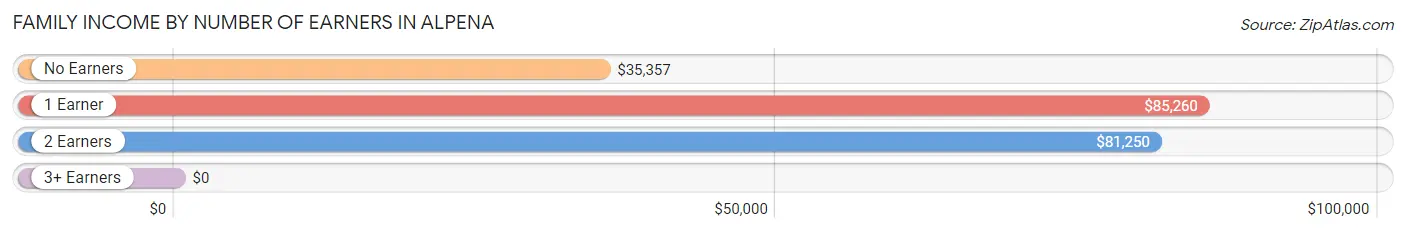
| Number of Earners | # Families | Median Income |
| No Earners | 12 (9.4%) | $35,357 |
| 1 Earner | 65 (50.8%) | $85,260 |
| 2 Earners | 36 (28.1%) | $81,250 |
| 3+ Earners | 15 (11.7%) | $0 |
| Total | 128 (100.0%) | $84,167 |
Household Income in Alpena
Household Income Brackets in Alpena
With 49 households falling in the category, the $35,000 to $49,999 income range is the most frequent in Alpena, accounting for 28.8% of all households. In contrast, only 1 households (0.6%) fall into the $10,000 to $14,999 income bracket, making it the least populous group.
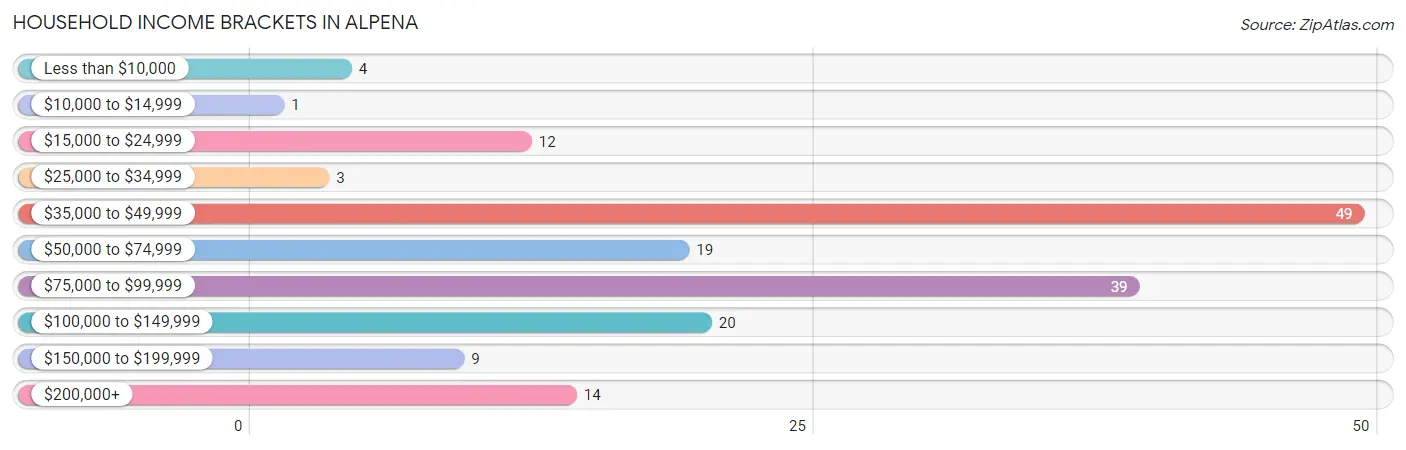
| Income Bracket | # Households | % Households |
| Less than $10,000 | 4 | 2.4% |
| $10,000 to $14,999 | 1 | 0.6% |
| $15,000 to $24,999 | 12 | 7.1% |
| $25,000 to $34,999 | 3 | 1.8% |
| $35,000 to $49,999 | 49 | 28.8% |
| $50,000 to $74,999 | 19 | 11.2% |
| $75,000 to $99,999 | 39 | 22.9% |
| $100,000 to $149,999 | 20 | 11.8% |
| $150,000 to $199,999 | 9 | 5.3% |
| $200,000+ | 14 | 8.2% |
Household Income by Householder Age in Alpena
The median household income in Alpena is $67,500, with the highest median household income of $85,000 found in the 25 to 44 years age bracket for the primary householder. A total of 56 households (32.9%) fall into this category. Meanwhile, the 15 to 24 years age bracket for the primary householder has the lowest median household income of $0, with 2 households (1.2%) in this group.
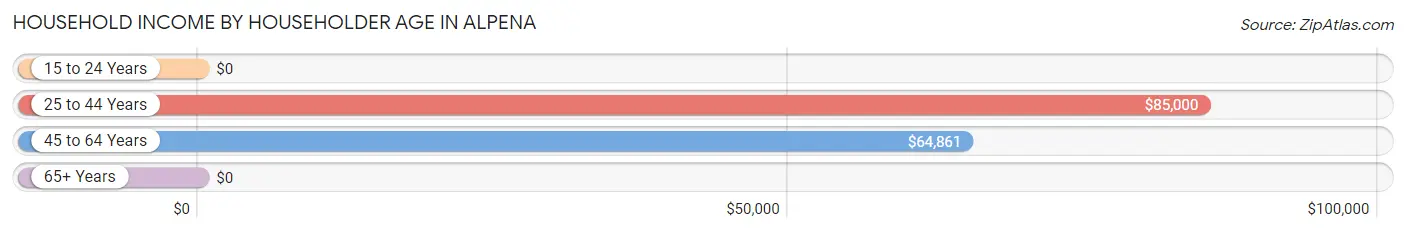
| Income Bracket | # Households | Median Income |
| 15 to 24 Years | 2 (1.2%) | $0 |
| 25 to 44 Years | 56 (32.9%) | $85,000 |
| 45 to 64 Years | 53 (31.2%) | $64,861 |
| 65+ Years | 59 (34.7%) | $0 |
| Total | 170 (100.0%) | $67,500 |
Poverty in Alpena
Income Below Poverty by Sex and Age in Alpena
With 12.8% poverty level for males and 16.0% for females among the residents of Alpena, 18 to 24 year old males and under 5 year old females are the most vulnerable to poverty, with 4 males (100.0%) and 6 females (66.7%) in their respective age groups living below the poverty level.
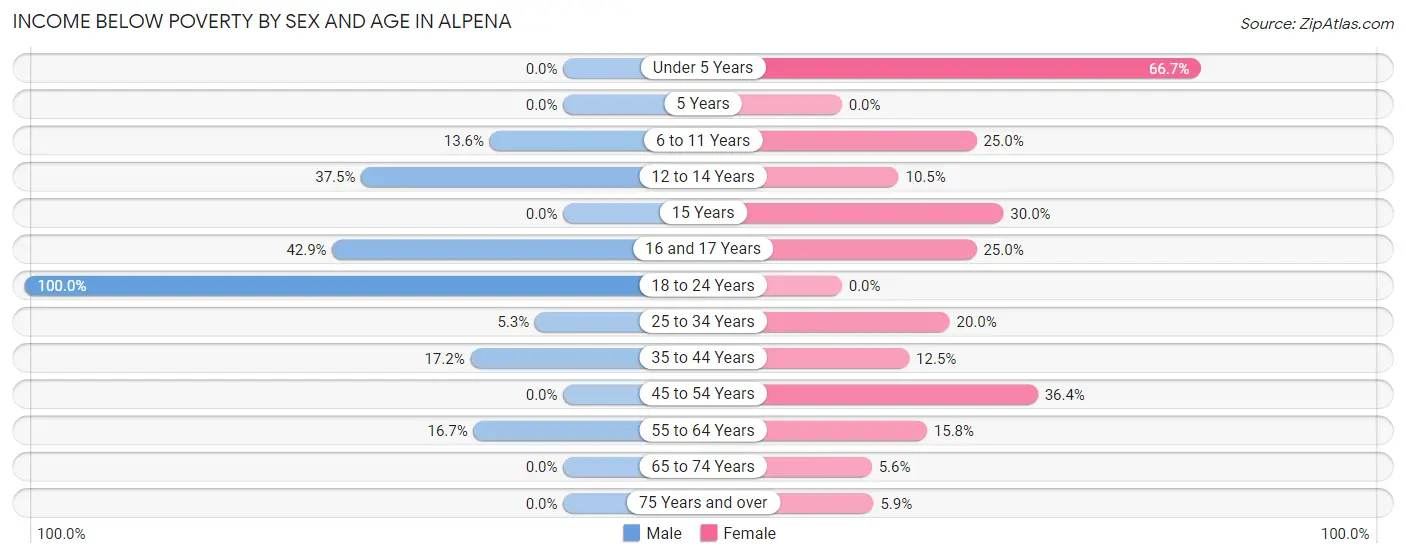
| Age Bracket | Male | Female |
| Under 5 Years | 0 (0.0%) | 6 (66.7%) |
| 5 Years | 0 (0.0%) | 0 (0.0%) |
| 6 to 11 Years | 6 (13.6%) | 5 (25.0%) |
| 12 to 14 Years | 3 (37.5%) | 2 (10.5%) |
| 15 Years | 0 (0.0%) | 3 (30.0%) |
| 16 and 17 Years | 3 (42.9%) | 1 (25.0%) |
| 18 to 24 Years | 4 (100.0%) | 0 (0.0%) |
| 25 to 34 Years | 1 (5.3%) | 1 (20.0%) |
| 35 to 44 Years | 5 (17.2%) | 6 (12.5%) |
| 45 to 54 Years | 0 (0.0%) | 4 (36.4%) |
| 55 to 64 Years | 3 (16.7%) | 3 (15.8%) |
| 65 to 74 Years | 0 (0.0%) | 2 (5.6%) |
| 75 Years and over | 0 (0.0%) | 1 (5.9%) |
| Total | 25 (12.8%) | 34 (16.0%) |
Income Above Poverty by Sex and Age in Alpena
According to the poverty statistics in Alpena, males aged 5 years and females aged 18 to 24 years are the age groups that are most secure financially, with 100.0% of males and 100.0% of females in these age groups living above the poverty line.
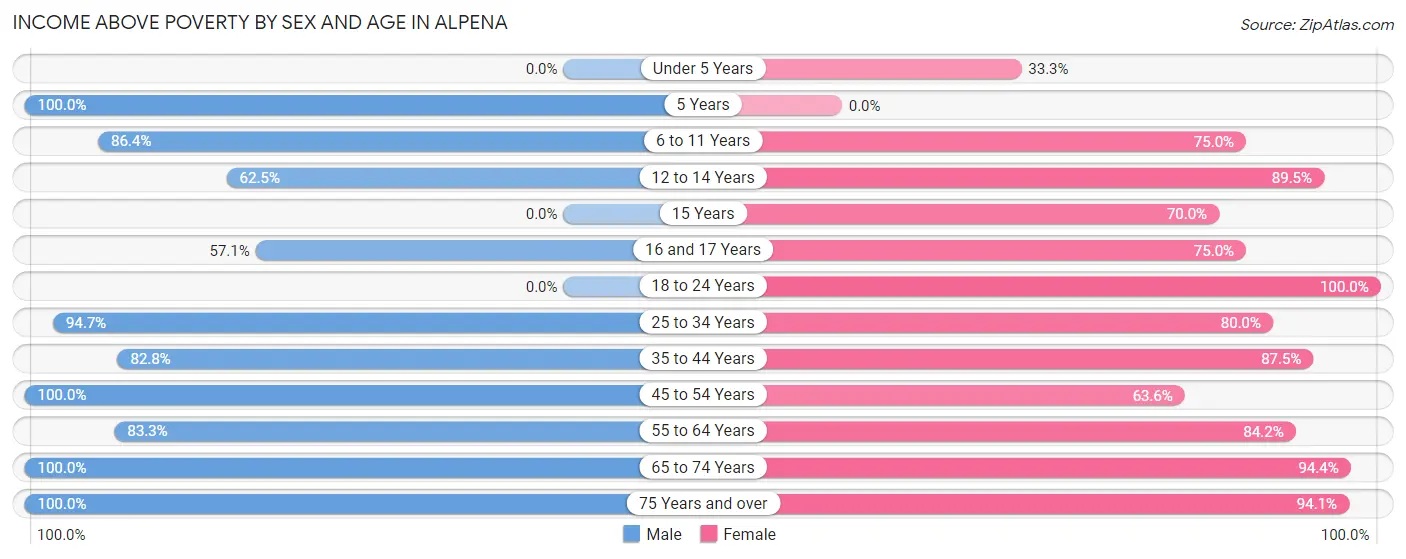
| Age Bracket | Male | Female |
| Under 5 Years | 0 (0.0%) | 3 (33.3%) |
| 5 Years | 1 (100.0%) | 0 (0.0%) |
| 6 to 11 Years | 38 (86.4%) | 15 (75.0%) |
| 12 to 14 Years | 5 (62.5%) | 17 (89.5%) |
| 15 Years | 0 (0.0%) | 7 (70.0%) |
| 16 and 17 Years | 4 (57.1%) | 3 (75.0%) |
| 18 to 24 Years | 0 (0.0%) | 14 (100.0%) |
| 25 to 34 Years | 18 (94.7%) | 4 (80.0%) |
| 35 to 44 Years | 24 (82.8%) | 42 (87.5%) |
| 45 to 54 Years | 32 (100.0%) | 7 (63.6%) |
| 55 to 64 Years | 15 (83.3%) | 16 (84.2%) |
| 65 to 74 Years | 16 (100.0%) | 34 (94.4%) |
| 75 Years and over | 17 (100.0%) | 16 (94.1%) |
| Total | 170 (87.2%) | 178 (84.0%) |
Income Below Poverty Among Married-Couple Families in Alpena
The poverty statistics for married-couple families in Alpena show that 7.3% or 8 of the total 109 families live below the poverty line. Families with 5 or more children have the highest poverty rate of 100.0%, comprising of 1 families. On the other hand, families with 1 or 2 children have the lowest poverty rate of 0.0%, which includes 0 families.
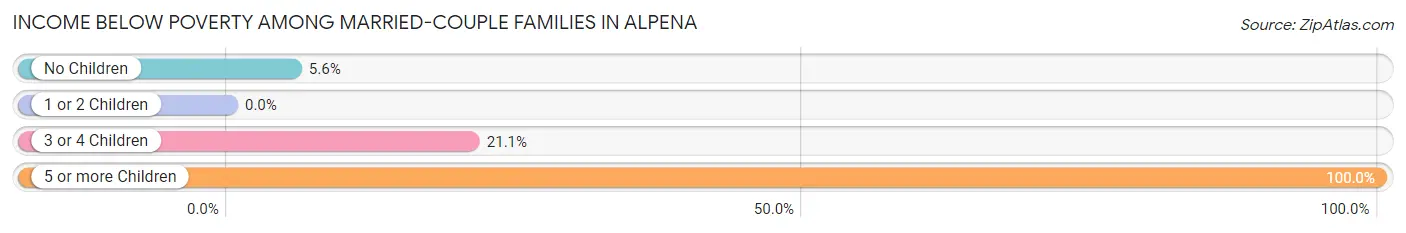
| Children | Above Poverty | Below Poverty |
| No Children | 51 (94.4%) | 3 (5.6%) |
| 1 or 2 Children | 35 (100.0%) | 0 (0.0%) |
| 3 or 4 Children | 15 (78.9%) | 4 (21.0%) |
| 5 or more Children | 0 (0.0%) | 1 (100.0%) |
| Total | 101 (92.7%) | 8 (7.3%) |
Income Below Poverty Among Single-Parent Households in Alpena
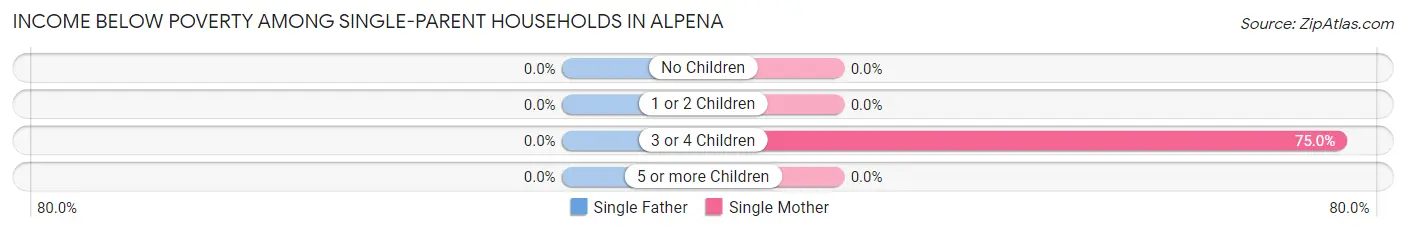
| Children | Single Father | Single Mother |
| No Children | 0 (0.0%) | 0 (0.0%) |
| 1 or 2 Children | 0 (0.0%) | 0 (0.0%) |
| 3 or 4 Children | 0 (0.0%) | 6 (75.0%) |
| 5 or more Children | 0 (0.0%) | 0 (0.0%) |
| Total | 0 (0.0%) | 6 (60.0%) |
Income Below Poverty Among Married-Couple vs Single-Parent Households in Alpena
The poverty data for Alpena shows that 8 of the married-couple family households (7.3%) and 6 of the single-parent households (31.6%) are living below the poverty level. Within the married-couple family households, those with 5 or more children have the highest poverty rate, with 1 households (100.0%) falling below the poverty line. Among the single-parent households, those with 3 or 4 children have the highest poverty rate, with 6 household (75.0%) living below poverty.
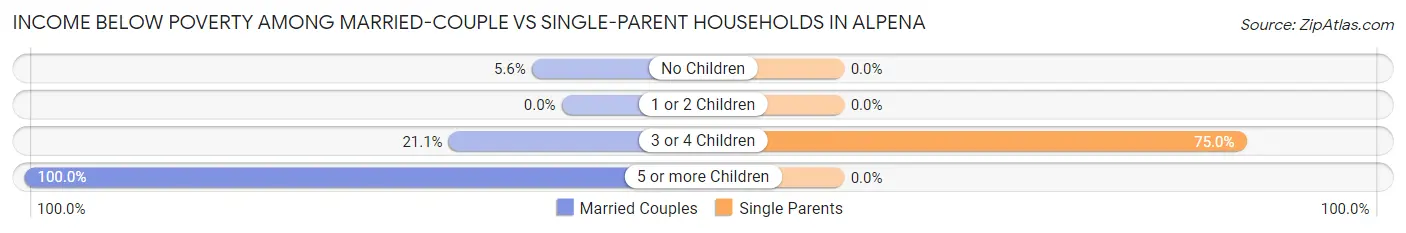
| Children | Married-Couple Families | Single-Parent Households |
| No Children | 3 (5.6%) | 0 (0.0%) |
| 1 or 2 Children | 0 (0.0%) | 0 (0.0%) |
| 3 or 4 Children | 4 (21.0%) | 6 (75.0%) |
| 5 or more Children | 1 (100.0%) | 0 (0.0%) |
| Total | 8 (7.3%) | 6 (31.6%) |
Race in Alpena
The most populous races in Alpena are White / Caucasian (283 | 69.5%), Hispanic or Latino (119 | 29.2%), and Some other Race (66 | 16.2%).
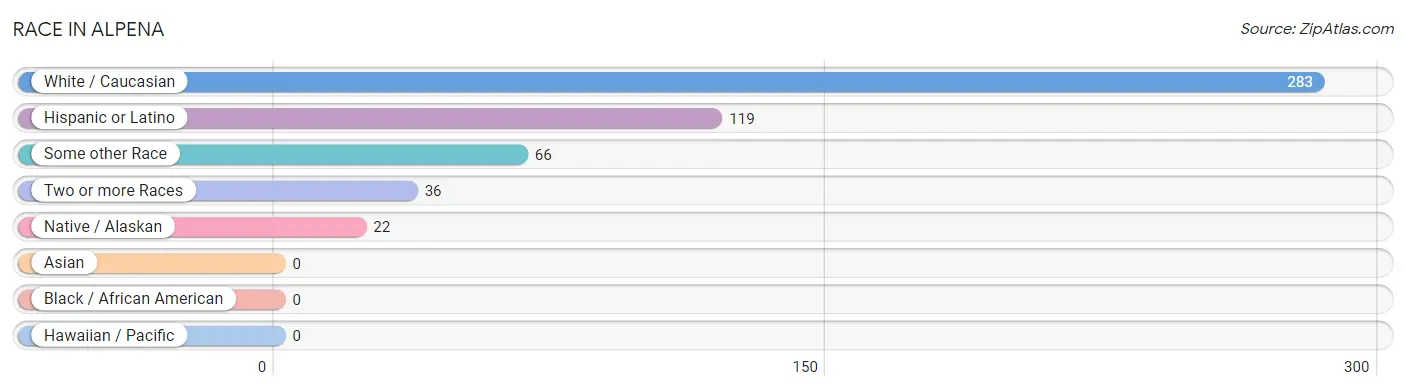
| Race | # Population | % Population |
| Asian | 0 | 0.0% |
| Black / African American | 0 | 0.0% |
| Hawaiian / Pacific | 0 | 0.0% |
| Hispanic or Latino | 119 | 29.2% |
| Native / Alaskan | 22 | 5.4% |
| White / Caucasian | 283 | 69.5% |
| Two or more Races | 36 | 8.8% |
| Some other Race | 66 | 16.2% |
| Total | 407 | 100.0% |
Ancestry in Alpena
The most populous ancestries reported in Alpena are American (113 | 27.8%), Central American (104 | 25.6%), Guatemalan (104 | 25.6%), German (101 | 24.8%), and Norwegian (47 | 11.6%), together accounting for 115.2% of all Alpena residents.
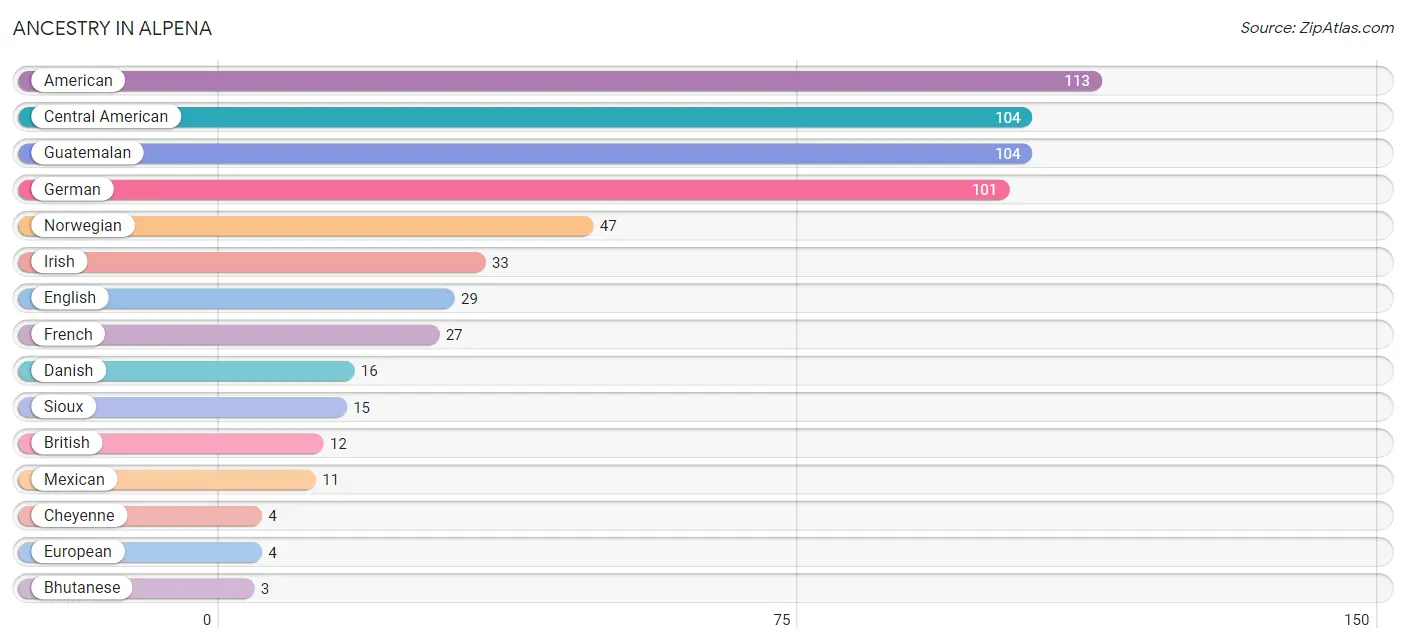
| Ancestry | # Population | % Population |
| American | 113 | 27.8% |
| Bhutanese | 3 | 0.7% |
| British | 12 | 2.9% |
| Central American | 104 | 25.6% |
| Cheyenne | 4 | 1.0% |
| Czech | 2 | 0.5% |
| Danish | 16 | 3.9% |
| Dutch | 1 | 0.3% |
| English | 29 | 7.1% |
| European | 4 | 1.0% |
| Finnish | 2 | 0.5% |
| French | 27 | 6.6% |
| German | 101 | 24.8% |
| Guatemalan | 104 | 25.6% |
| Hungarian | 1 | 0.3% |
| Irish | 33 | 8.1% |
| Mexican | 11 | 2.7% |
| Norwegian | 47 | 11.6% |
| Russian | 3 | 0.7% |
| Sioux | 15 | 3.7% | View All 20 Rows |
Immigrants in Alpena
The most numerous immigrant groups reported in Alpena came from Central America (50 | 12.3%), Latin America (50 | 12.3%), Guatemala (44 | 10.8%), and Mexico (6 | 1.5%), together accounting for 36.9% of all Alpena residents.
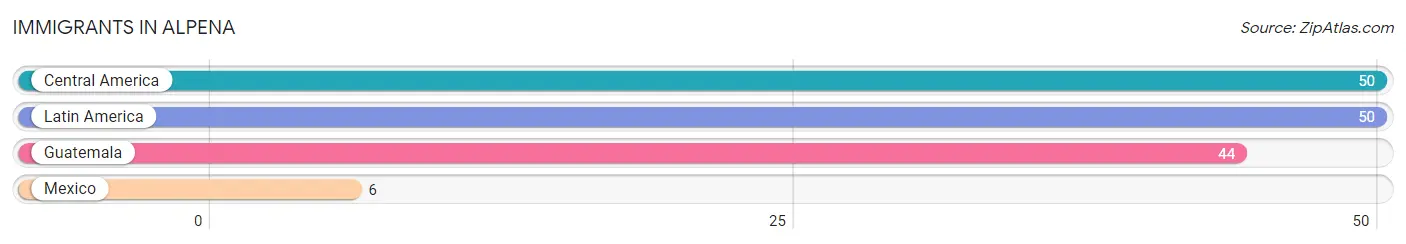
| Immigration Origin | # Population | % Population |
| Central America | 50 | 12.3% |
| Guatemala | 44 | 10.8% |
| Latin America | 50 | 12.3% |
| Mexico | 6 | 1.5% | View All 4 Rows |
Sex and Age in Alpena
Sex and Age in Alpena
The most populous age groups in Alpena are 10 to 14 Years (29 | 14.9%) for men and 35 to 39 Years (37 | 17.4%) for women.
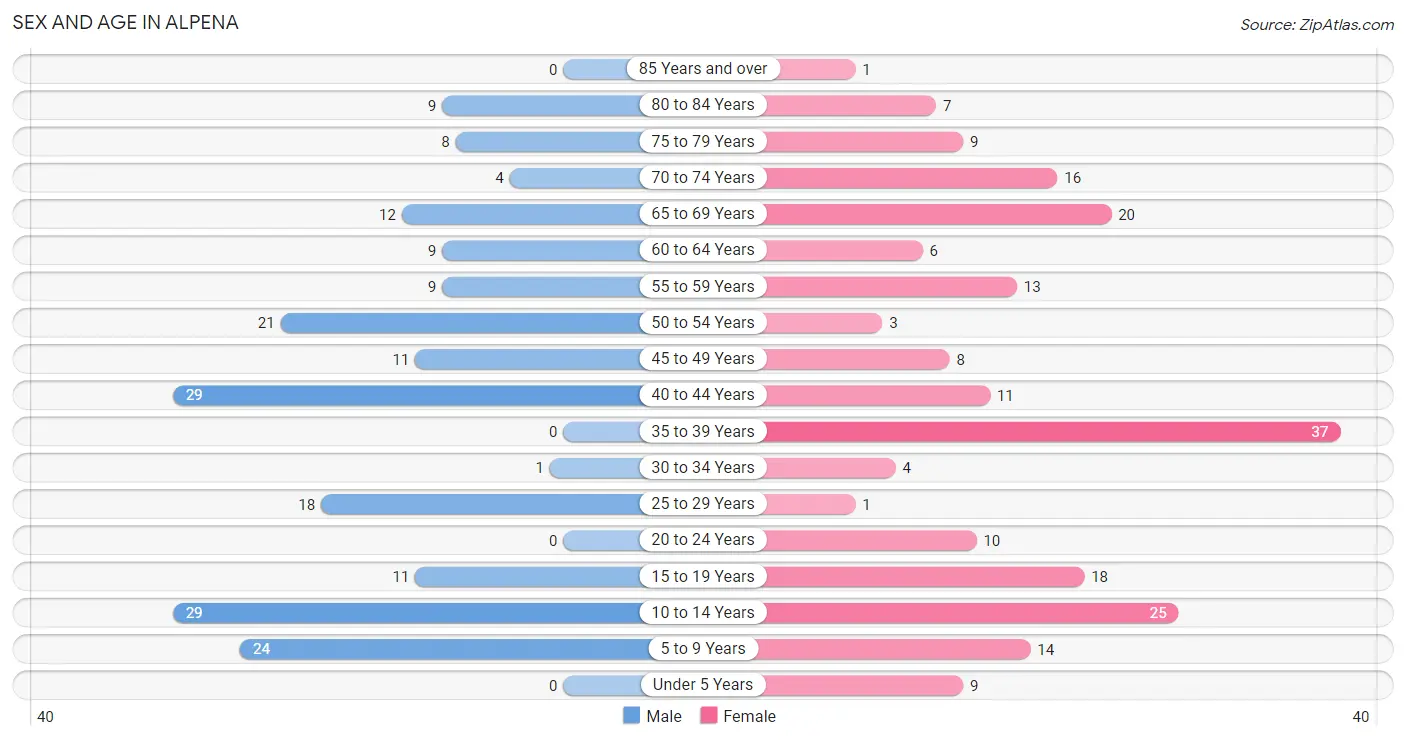
| Age Bracket | Male | Female |
| Under 5 Years | 0 (0.0%) | 9 (4.3%) |
| 5 to 9 Years | 24 (12.3%) | 14 (6.6%) |
| 10 to 14 Years | 29 (14.9%) | 25 (11.8%) |
| 15 to 19 Years | 11 (5.6%) | 18 (8.5%) |
| 20 to 24 Years | 0 (0.0%) | 10 (4.7%) |
| 25 to 29 Years | 18 (9.2%) | 1 (0.5%) |
| 30 to 34 Years | 1 (0.5%) | 4 (1.9%) |
| 35 to 39 Years | 0 (0.0%) | 37 (17.4%) |
| 40 to 44 Years | 29 (14.9%) | 11 (5.2%) |
| 45 to 49 Years | 11 (5.6%) | 8 (3.8%) |
| 50 to 54 Years | 21 (10.8%) | 3 (1.4%) |
| 55 to 59 Years | 9 (4.6%) | 13 (6.1%) |
| 60 to 64 Years | 9 (4.6%) | 6 (2.8%) |
| 65 to 69 Years | 12 (6.1%) | 20 (9.4%) |
| 70 to 74 Years | 4 (2.1%) | 16 (7.5%) |
| 75 to 79 Years | 8 (4.1%) | 9 (4.3%) |
| 80 to 84 Years | 9 (4.6%) | 7 (3.3%) |
| 85 Years and over | 0 (0.0%) | 1 (0.5%) |
| Total | 195 (100.0%) | 212 (100.0%) |
Families and Households in Alpena
Median Family Size in Alpena
The median family size in Alpena is 2.79 persons per family, with single female/mother families (10 | 7.8%) accounting for the largest median family size of 3.7 persons per family. On the other hand, single male/father families (9 | 7.0%) represent the smallest median family size with 2.33 persons per family.
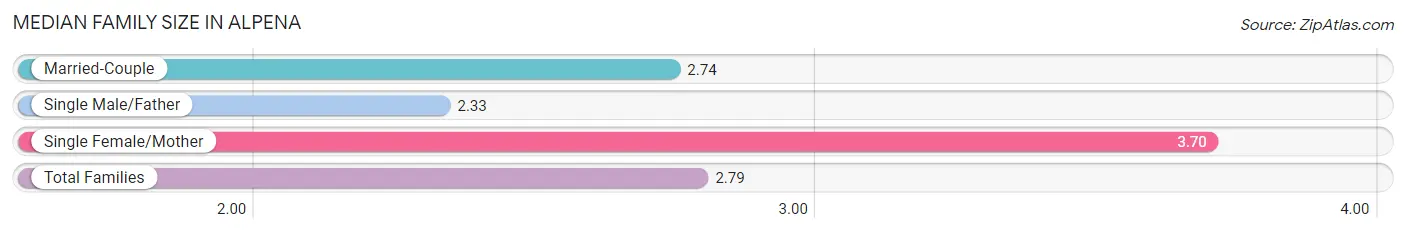
| Family Type | # Families | Family Size |
| Married-Couple | 109 (85.2%) | 2.74 |
| Single Male/Father | 9 (7.0%) | 2.33 |
| Single Female/Mother | 10 (7.8%) | 3.70 |
| Total Families | 128 (100.0%) | 2.79 |
Median Household Size in Alpena
The median household size in Alpena is 2.39 persons per household, with single female/mother households (10 | 5.9%) accounting for the largest median household size of 3.7 persons per household. non-family households (42 | 24.7%) represent the smallest median household size with 1.19 persons per household.
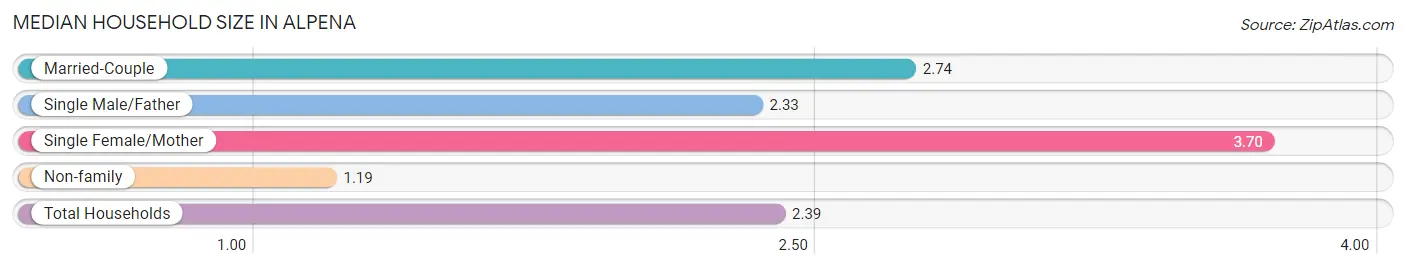
| Household Type | # Households | Household Size |
| Married-Couple | 109 (64.1%) | 2.74 |
| Single Male/Father | 9 (5.3%) | 2.33 |
| Single Female/Mother | 10 (5.9%) | 3.70 |
| Non-family | 42 (24.7%) | 1.19 |
| Total Households | 170 (100.0%) | 2.39 |
Household Size by Marriage Status in Alpena
Out of a total of 170 households in Alpena, 128 (75.3%) are family households, while 42 (24.7%) are nonfamily households. The most numerous type of family households are 2-person households, comprising 53, and the most common type of nonfamily households are 1-person households, comprising 35.
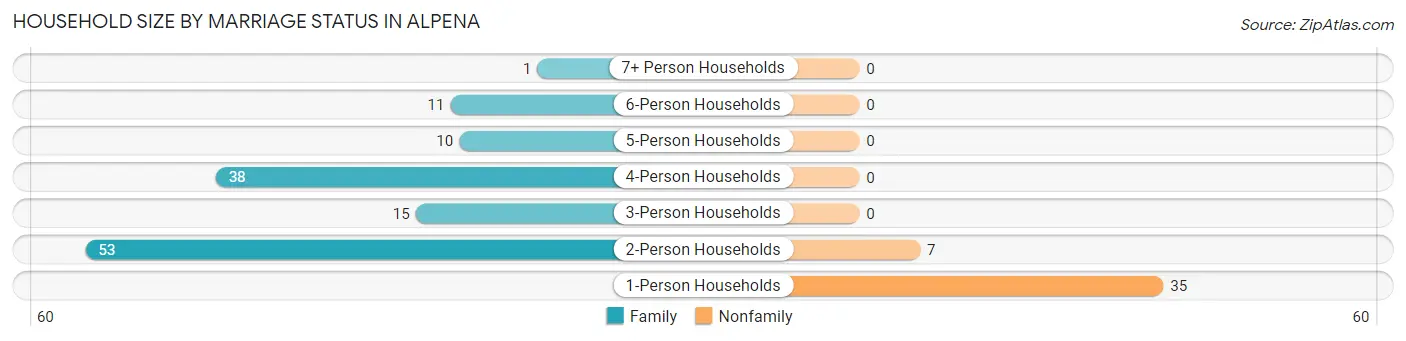
| Household Size | Family Households | Nonfamily Households |
| 1-Person Households | - | 35 (20.6%) |
| 2-Person Households | 53 (31.2%) | 7 (4.1%) |
| 3-Person Households | 15 (8.8%) | 0 (0.0%) |
| 4-Person Households | 38 (22.4%) | 0 (0.0%) |
| 5-Person Households | 10 (5.9%) | 0 (0.0%) |
| 6-Person Households | 11 (6.5%) | 0 (0.0%) |
| 7+ Person Households | 1 (0.6%) | 0 (0.0%) |
| Total | 128 (75.3%) | 42 (24.7%) |
Female Fertility in Alpena
Fertility by Age in Alpena
Average fertility rate in Alpena is 315.0 births per 1,000 women. Women in the age bracket of 35 to 50 years have the highest fertility rate with 500.0 births per 1,000 women. Women in the age bracket of 35 to 50 years acount for 100.0% of all women with births.
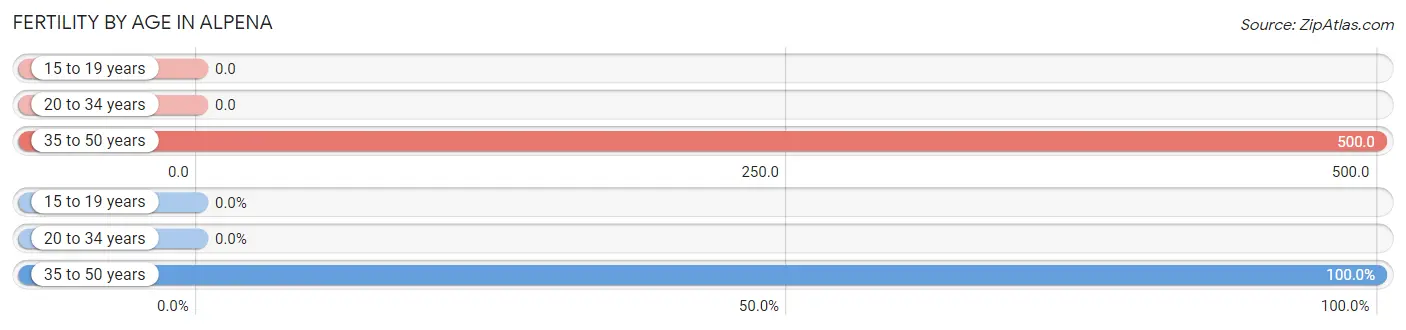
| Age Bracket | Women with Births | Births / 1,000 Women |
| 15 to 19 years | 0 (0.0%) | 0.0 |
| 20 to 34 years | 0 (0.0%) | 0.0 |
| 35 to 50 years | 28 (100.0%) | 500.0 |
| Total | 28 (100.0%) | 315.0 |
Fertility by Age by Marriage Status in Alpena
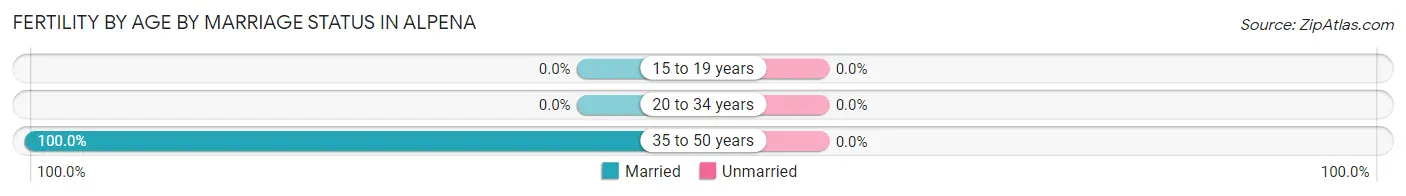
| Age Bracket | Married | Unmarried |
| 15 to 19 years | 0 (0.0%) | 0 (0.0%) |
| 20 to 34 years | 0 (0.0%) | 0 (0.0%) |
| 35 to 50 years | 28 (100.0%) | 0 (0.0%) |
| Total | 28 (100.0%) | 0 (0.0%) |
Fertility by Education in Alpena
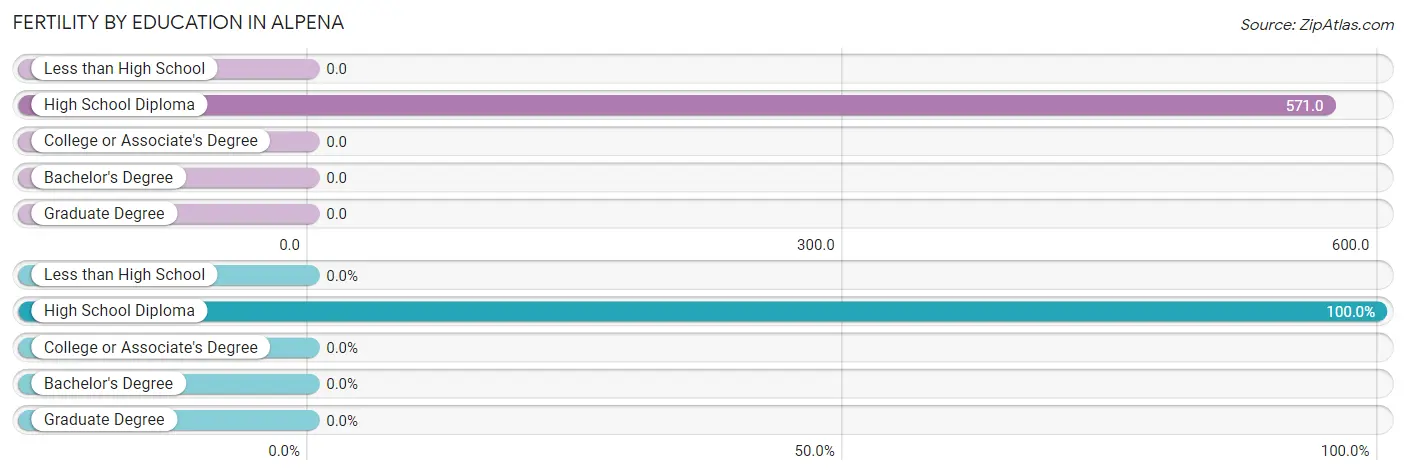
| Educational Attainment | Women with Births | Births / 1,000 Women |
| Less than High School | 0 (0.0%) | 0.0 |
| High School Diploma | 28 (100.0%) | 571.0 |
| College or Associate's Degree | 0 (0.0%) | 0.0 |
| Bachelor's Degree | 0 (0.0%) | 0.0 |
| Graduate Degree | 0 (0.0%) | 0.0 |
| Total | 28 (100.0%) | 315.0 |
Fertility by Education by Marriage Status in Alpena
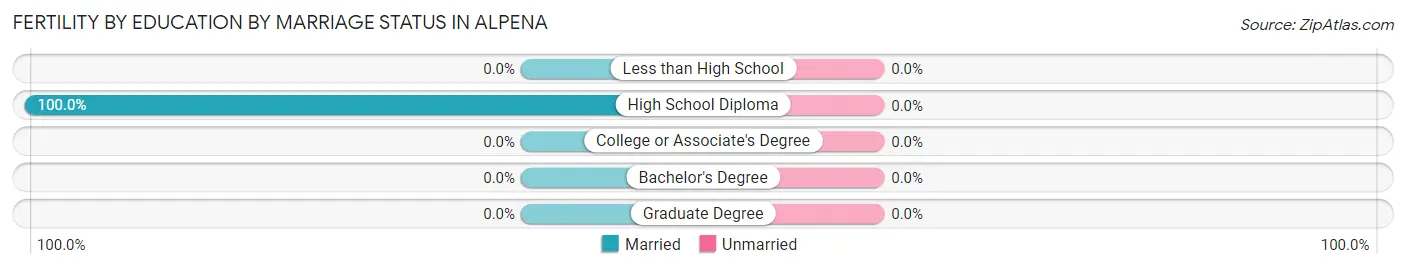
| Educational Attainment | Married | Unmarried |
| Less than High School | 0 (0.0%) | 0 (0.0%) |
| High School Diploma | 28 (100.0%) | 0 (0.0%) |
| College or Associate's Degree | 0 (0.0%) | 0 (0.0%) |
| Bachelor's Degree | 0 (0.0%) | 0 (0.0%) |
| Graduate Degree | 0 (0.0%) | 0 (0.0%) |
| Total | 28 (100.0%) | 0 (0.0%) |
Employment Characteristics in Alpena
Employment by Class of Employer in Alpena
Among the 186 employed individuals in Alpena, private company employees (147 | 79.0%), self-employed (not incorporated) (18 | 9.7%), and local government employees (16 | 8.6%) make up the most common classes of employment.
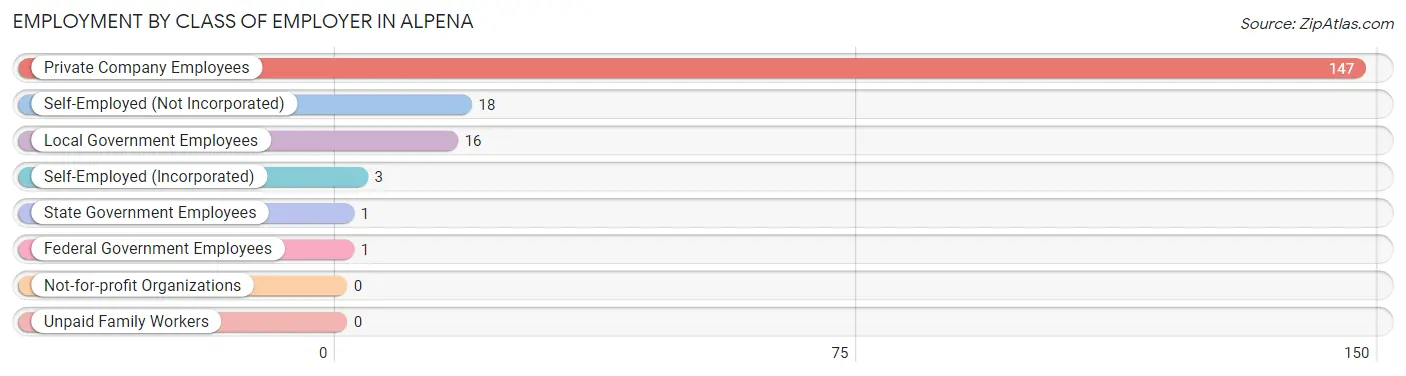
| Employer Class | # Employees | % Employees |
| Private Company Employees | 147 | 79.0% |
| Self-Employed (Incorporated) | 3 | 1.6% |
| Self-Employed (Not Incorporated) | 18 | 9.7% |
| Not-for-profit Organizations | 0 | 0.0% |
| Local Government Employees | 16 | 8.6% |
| State Government Employees | 1 | 0.5% |
| Federal Government Employees | 1 | 0.5% |
| Unpaid Family Workers | 0 | 0.0% |
| Total | 186 | 100.0% |
Employment Status by Age in Alpena
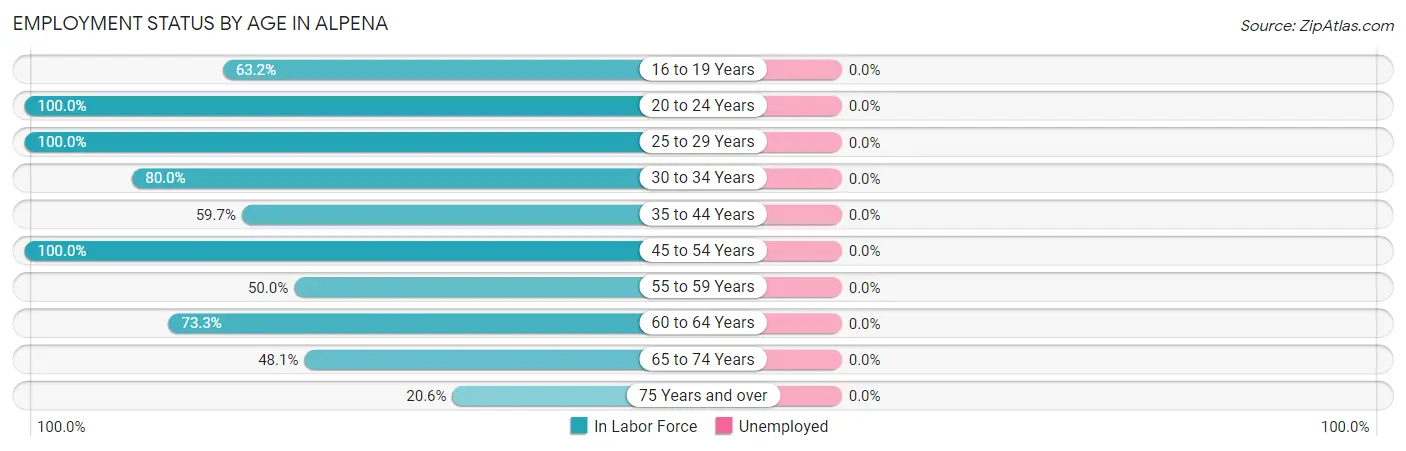
| Age Bracket | In Labor Force | Unemployed |
| 16 to 19 Years | 12 (63.2%) | 0 (0.0%) |
| 20 to 24 Years | 10 (100.0%) | 0 (0.0%) |
| 25 to 29 Years | 19 (100.0%) | 0 (0.0%) |
| 30 to 34 Years | 4 (80.0%) | 0 (0.0%) |
| 35 to 44 Years | 46 (59.7%) | 0 (0.0%) |
| 45 to 54 Years | 43 (100.0%) | 0 (0.0%) |
| 55 to 59 Years | 11 (50.0%) | 0 (0.0%) |
| 60 to 64 Years | 11 (73.3%) | 0 (0.0%) |
| 65 to 74 Years | 25 (48.1%) | 0 (0.0%) |
| 75 Years and over | 7 (20.6%) | 0 (0.0%) |
| Total | 188 (63.5%) | 0 (0.0%) |
Employment Status by Educational Attainment in Alpena
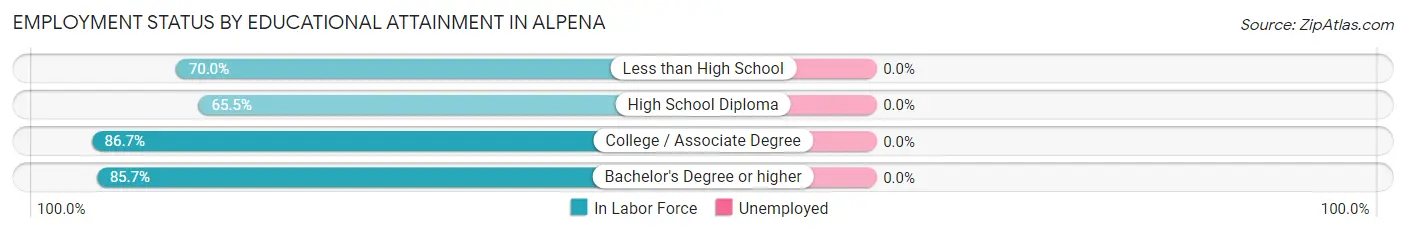
| Educational Attainment | In Labor Force | Unemployed |
| Less than High School | 21 (70.0%) | 0 (0.0%) |
| High School Diploma | 55 (65.5%) | 0 (0.0%) |
| College / Associate Degree | 52 (86.7%) | 0 (0.0%) |
| Bachelor's Degree or higher | 6 (85.7%) | 0 (0.0%) |
| Total | 134 (74.0%) | 0 (0.0%) |
Employment Occupations by Sex in Alpena
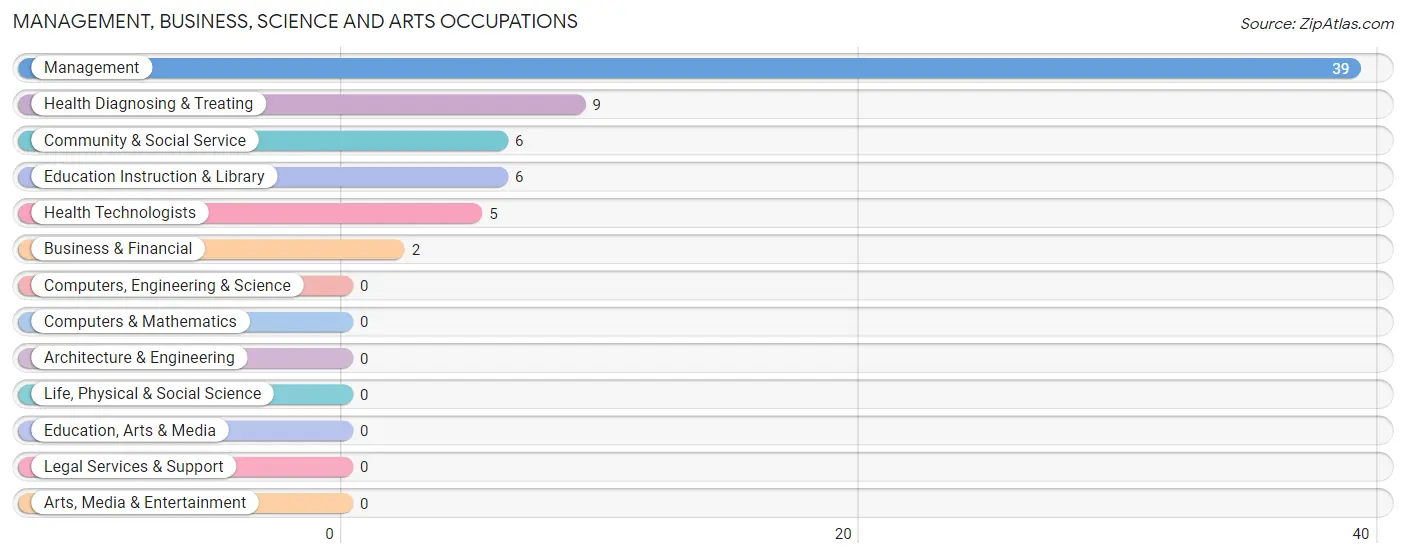
Management, Business, Science and Arts Occupations
The most common Management, Business, Science and Arts occupations in Alpena are Management (39 | 20.7%), Health Diagnosing & Treating (9 | 4.8%), Community & Social Service (6 | 3.2%), Education Instruction & Library (6 | 3.2%), and Health Technologists (5 | 2.7%).
Management, Business, Science and Arts Occupations by Sex
Within the Management, Business, Science and Arts occupations in Alpena, the most male-oriented occupations are Management (97.4%), Community & Social Service (16.7%), and Education Instruction & Library (16.7%), while the most female-oriented occupations are Business & Financial (100.0%), Health Diagnosing & Treating (100.0%), and Health Technologists (100.0%).
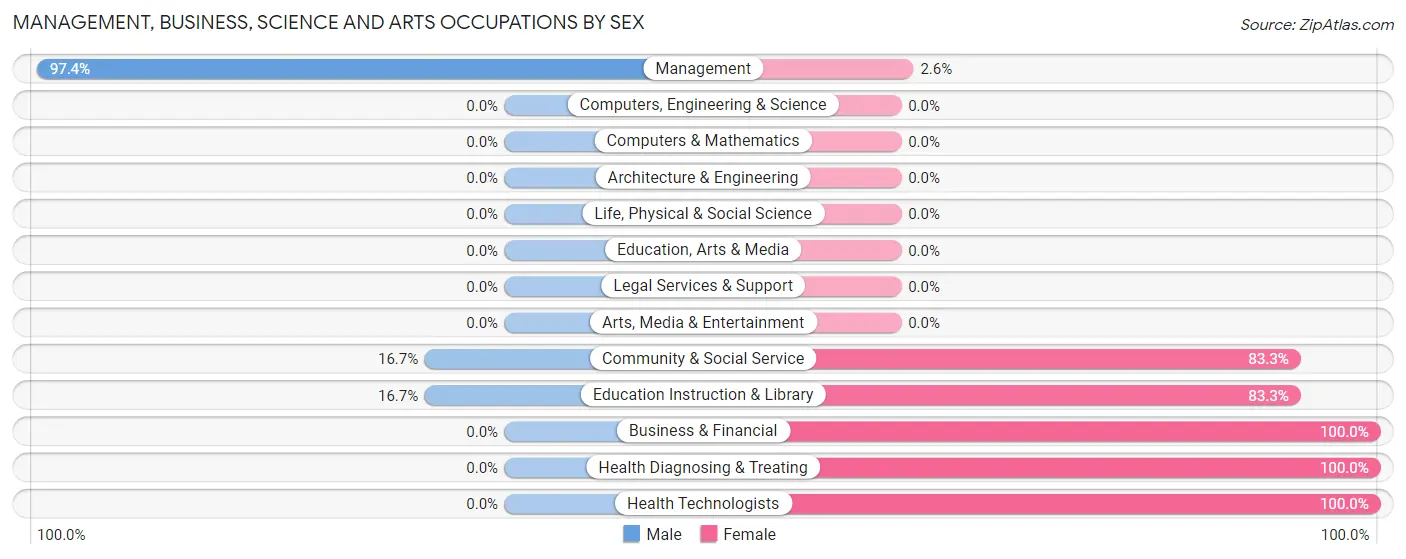
| Occupation | Male | Female |
| Management | 38 (97.4%) | 1 (2.6%) |
| Business & Financial | 0 (0.0%) | 2 (100.0%) |
| Computers, Engineering & Science | 0 (0.0%) | 0 (0.0%) |
| Computers & Mathematics | 0 (0.0%) | 0 (0.0%) |
| Architecture & Engineering | 0 (0.0%) | 0 (0.0%) |
| Life, Physical & Social Science | 0 (0.0%) | 0 (0.0%) |
| Community & Social Service | 1 (16.7%) | 5 (83.3%) |
| Education, Arts & Media | 0 (0.0%) | 0 (0.0%) |
| Legal Services & Support | 0 (0.0%) | 0 (0.0%) |
| Education Instruction & Library | 1 (16.7%) | 5 (83.3%) |
| Arts, Media & Entertainment | 0 (0.0%) | 0 (0.0%) |
| Health Diagnosing & Treating | 0 (0.0%) | 9 (100.0%) |
| Health Technologists | 0 (0.0%) | 5 (100.0%) |
| Total (Category) | 39 (69.6%) | 17 (30.4%) |
| Total (Overall) | 113 (60.1%) | 75 (39.9%) |
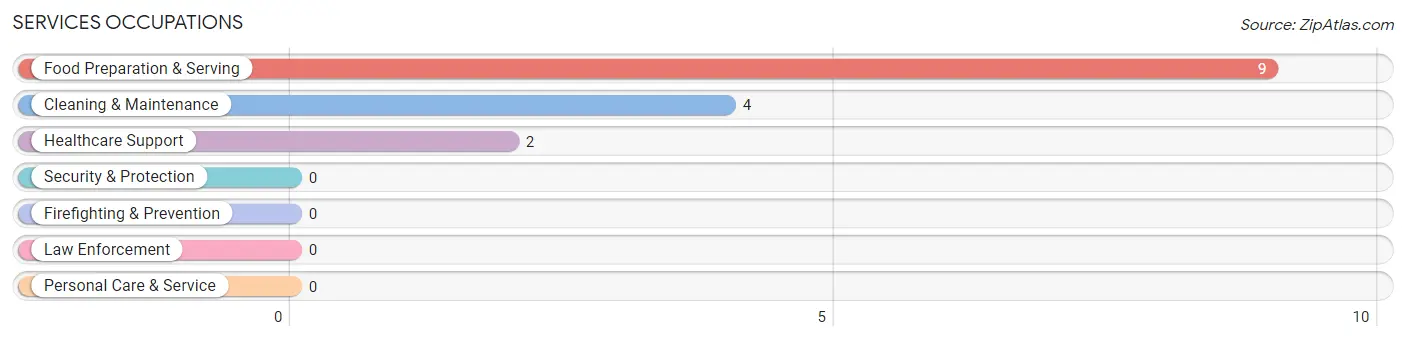
Services Occupations
The most common Services occupations in Alpena are Food Preparation & Serving (9 | 4.8%), Cleaning & Maintenance (4 | 2.1%), and Healthcare Support (2 | 1.1%).
Services Occupations by Sex
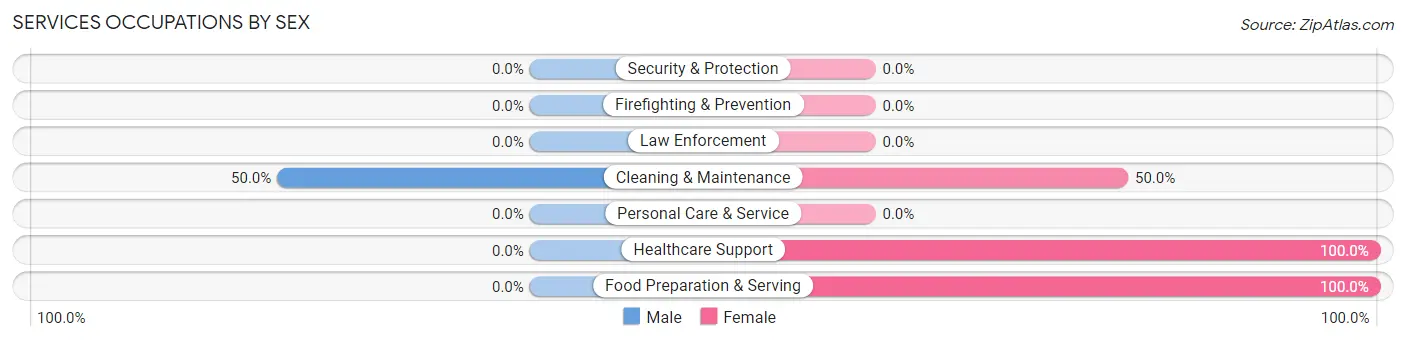
| Occupation | Male | Female |
| Healthcare Support | 0 (0.0%) | 2 (100.0%) |
| Security & Protection | 0 (0.0%) | 0 (0.0%) |
| Firefighting & Prevention | 0 (0.0%) | 0 (0.0%) |
| Law Enforcement | 0 (0.0%) | 0 (0.0%) |
| Food Preparation & Serving | 0 (0.0%) | 9 (100.0%) |
| Cleaning & Maintenance | 2 (50.0%) | 2 (50.0%) |
| Personal Care & Service | 0 (0.0%) | 0 (0.0%) |
| Total (Category) | 2 (13.3%) | 13 (86.7%) |
| Total (Overall) | 113 (60.1%) | 75 (39.9%) |
Sales and Office Occupations
The most common Sales and Office occupations in Alpena are Office & Administration (32 | 17.0%), and Sales & Related (14 | 7.4%).
Sales and Office Occupations by Sex
| Occupation | Male | Female |
| Sales & Related | 6 (42.9%) | 8 (57.1%) |
| Office & Administration | 11 (34.4%) | 21 (65.6%) |
| Total (Category) | 17 (37.0%) | 29 (63.0%) |
| Total (Overall) | 113 (60.1%) | 75 (39.9%) |
Natural Resources, Construction and Maintenance Occupations
The most common Natural Resources, Construction and Maintenance occupations in Alpena are Installation, Maintenance & Repair (10 | 5.3%), Farming, Fishing & Forestry (6 | 3.2%), and Construction & Extraction (5 | 2.7%).
Natural Resources, Construction and Maintenance Occupations by Sex
| Occupation | Male | Female |
| Farming, Fishing & Forestry | 6 (100.0%) | 0 (0.0%) |
| Construction & Extraction | 5 (100.0%) | 0 (0.0%) |
| Installation, Maintenance & Repair | 10 (100.0%) | 0 (0.0%) |
| Total (Category) | 21 (100.0%) | 0 (0.0%) |
| Total (Overall) | 113 (60.1%) | 75 (39.9%) |
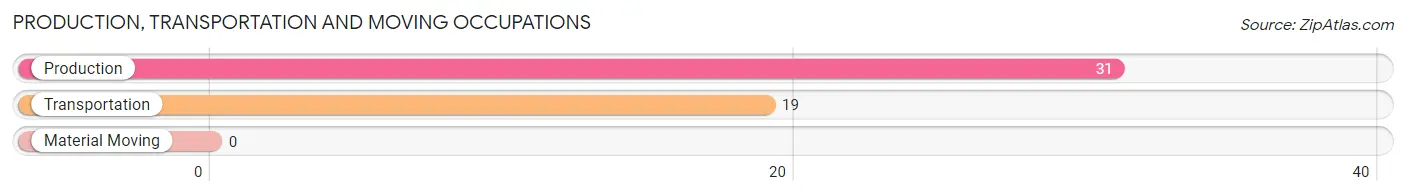
Production, Transportation and Moving Occupations
The most common Production, Transportation and Moving occupations in Alpena are Production (31 | 16.5%), and Transportation (19 | 10.1%).
Production, Transportation and Moving Occupations by Sex
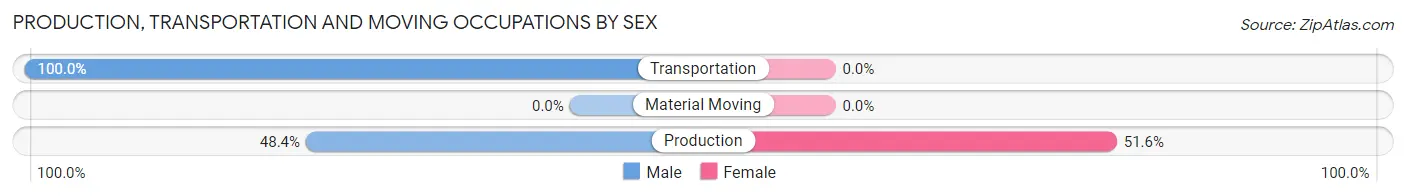
| Occupation | Male | Female |
| Production | 15 (48.4%) | 16 (51.6%) |
| Transportation | 19 (100.0%) | 0 (0.0%) |
| Material Moving | 0 (0.0%) | 0 (0.0%) |
| Total (Category) | 34 (68.0%) | 16 (32.0%) |
| Total (Overall) | 113 (60.1%) | 75 (39.9%) |
Employment Industries by Sex in Alpena
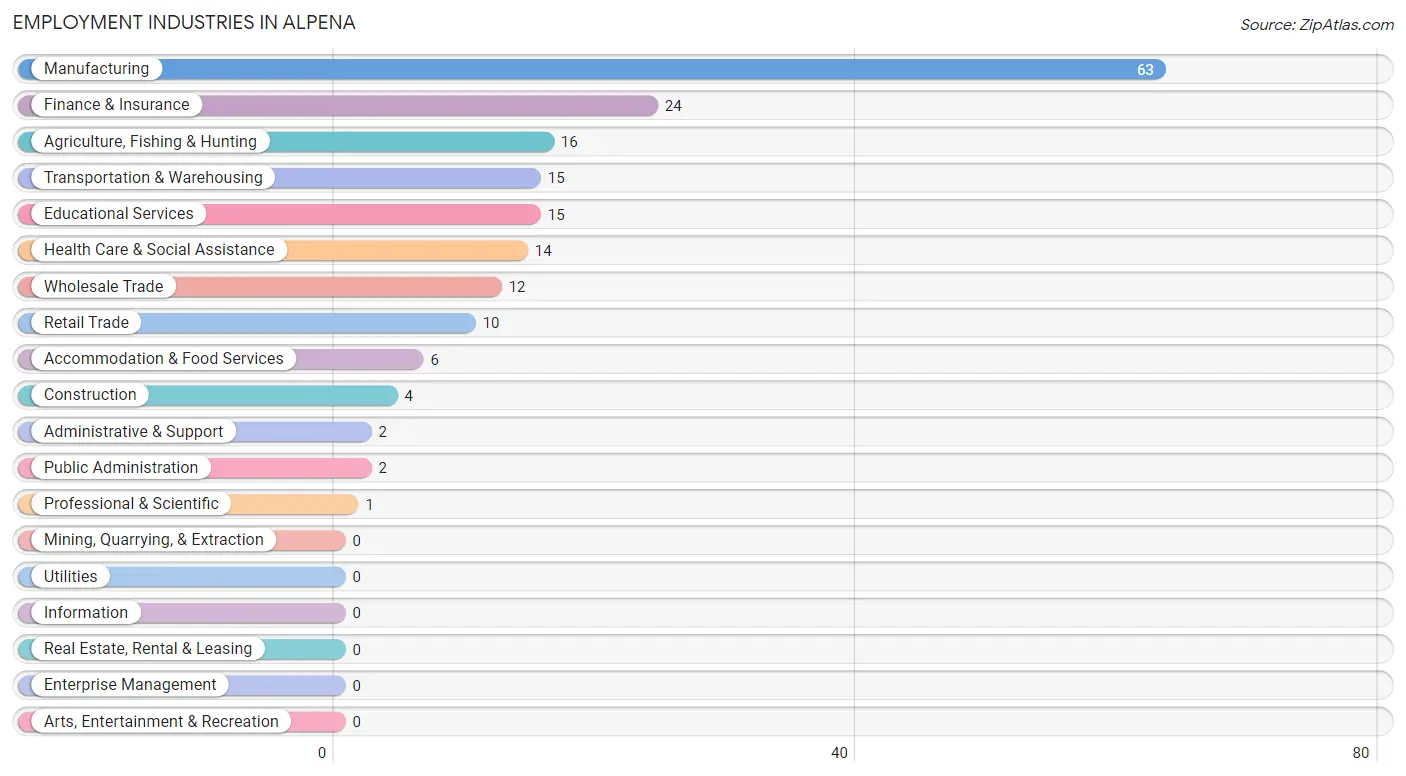
Employment Industries in Alpena
The major employment industries in Alpena include Manufacturing (63 | 33.5%), Finance & Insurance (24 | 12.8%), Agriculture, Fishing & Hunting (16 | 8.5%), Transportation & Warehousing (15 | 8.0%), and Educational Services (15 | 8.0%).
Employment Industries by Sex in Alpena
The Alpena industries that see more men than women are Construction (100.0%), Wholesale Trade (100.0%), and Transportation & Warehousing (93.3%), whereas the industries that tend to have a higher number of women are Finance & Insurance (100.0%), Professional & Scientific (100.0%), and Administrative & Support (100.0%).
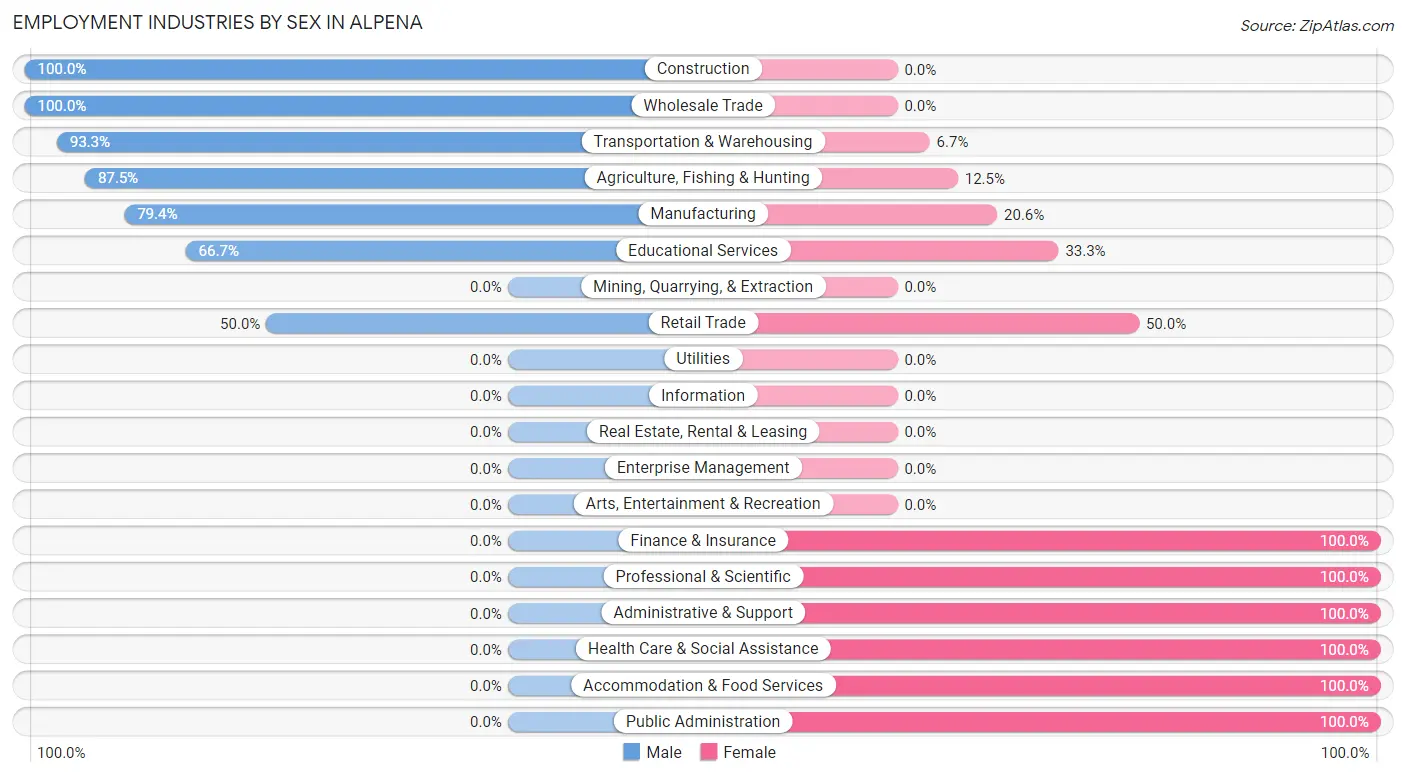
| Industry | Male | Female |
| Agriculture, Fishing & Hunting | 14 (87.5%) | 2 (12.5%) |
| Mining, Quarrying, & Extraction | 0 (0.0%) | 0 (0.0%) |
| Construction | 4 (100.0%) | 0 (0.0%) |
| Manufacturing | 50 (79.4%) | 13 (20.6%) |
| Wholesale Trade | 12 (100.0%) | 0 (0.0%) |
| Retail Trade | 5 (50.0%) | 5 (50.0%) |
| Transportation & Warehousing | 14 (93.3%) | 1 (6.7%) |
| Utilities | 0 (0.0%) | 0 (0.0%) |
| Information | 0 (0.0%) | 0 (0.0%) |
| Finance & Insurance | 0 (0.0%) | 24 (100.0%) |
| Real Estate, Rental & Leasing | 0 (0.0%) | 0 (0.0%) |
| Professional & Scientific | 0 (0.0%) | 1 (100.0%) |
| Enterprise Management | 0 (0.0%) | 0 (0.0%) |
| Administrative & Support | 0 (0.0%) | 2 (100.0%) |
| Educational Services | 10 (66.7%) | 5 (33.3%) |
| Health Care & Social Assistance | 0 (0.0%) | 14 (100.0%) |
| Arts, Entertainment & Recreation | 0 (0.0%) | 0 (0.0%) |
| Accommodation & Food Services | 0 (0.0%) | 6 (100.0%) |
| Public Administration | 0 (0.0%) | 2 (100.0%) |
| Total | 113 (60.1%) | 75 (39.9%) |
Education in Alpena
School Enrollment in Alpena
The most common levels of schooling among the 125 students in Alpena are high school (38 | 30.4%), elementary school (37 | 29.6%), and middle school (33 | 26.4%).
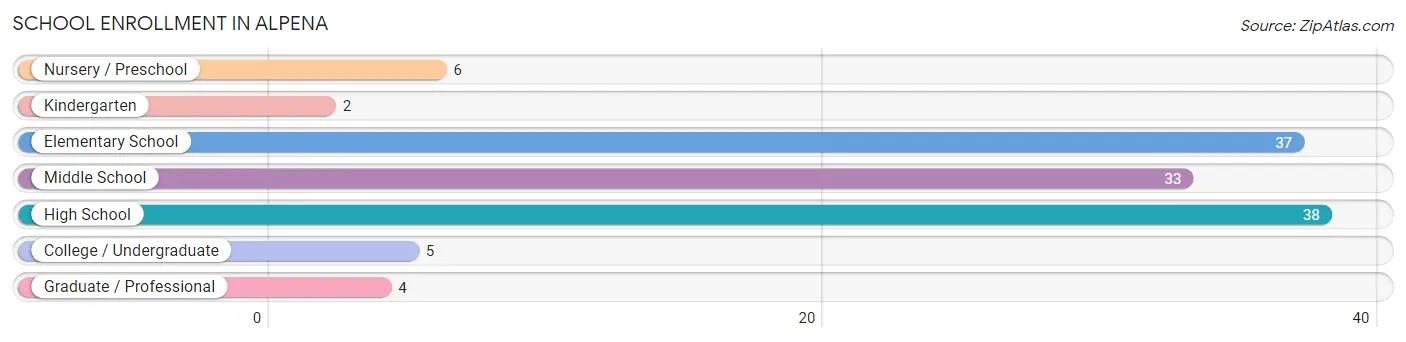
| School Level | # Students | % Students |
| Nursery / Preschool | 6 | 4.8% |
| Kindergarten | 2 | 1.6% |
| Elementary School | 37 | 29.6% |
| Middle School | 33 | 26.4% |
| High School | 38 | 30.4% |
| College / Undergraduate | 5 | 4.0% |
| Graduate / Professional | 4 | 3.2% |
| Total | 125 | 100.0% |
School Enrollment by Age by Funding Source in Alpena
Out of a total of 125 students who are enrolled in schools in Alpena, 11 (8.8%) attend a private institution, while the remaining 114 (91.2%) are enrolled in public schools. The age group of 35 years and over has the highest likelihood of being enrolled in private schools, with 7 (100.0% in the age bracket) enrolled. Conversely, the age group of 3 to 4 year olds has the lowest likelihood of being enrolled in a private school, with 1 (100.0% in the age bracket) attending a public institution.
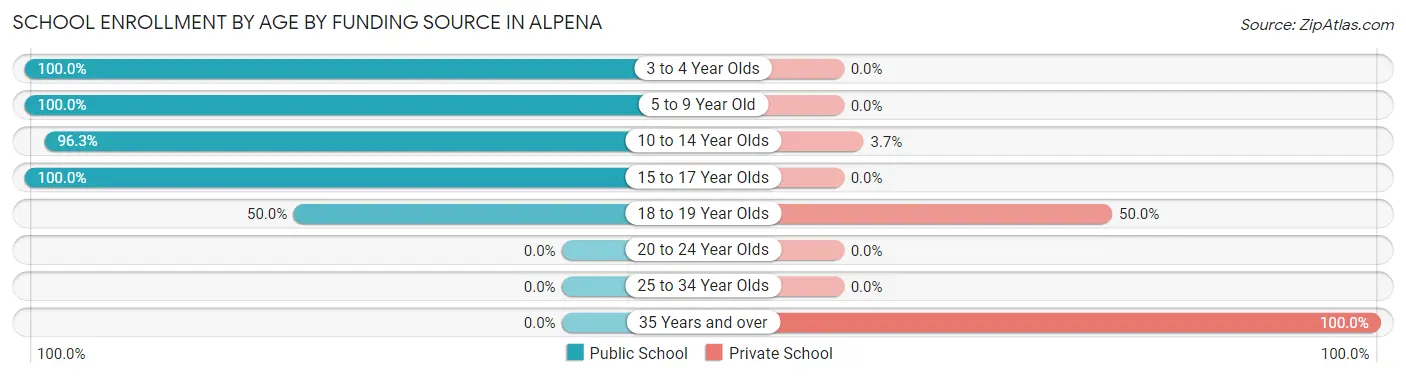
| Age Bracket | Public School | Private School |
| 3 to 4 Year Olds | 1 (100.0%) | 0 (0.0%) |
| 5 to 9 Year Old | 38 (100.0%) | 0 (0.0%) |
| 10 to 14 Year Olds | 52 (96.3%) | 2 (3.7%) |
| 15 to 17 Year Olds | 21 (100.0%) | 0 (0.0%) |
| 18 to 19 Year Olds | 2 (50.0%) | 2 (50.0%) |
| 20 to 24 Year Olds | 0 (0.0%) | 0 (0.0%) |
| 25 to 34 Year Olds | 0 (0.0%) | 0 (0.0%) |
| 35 Years and over | 0 (0.0%) | 7 (100.0%) |
| Total | 114 (91.2%) | 11 (8.8%) |
Educational Attainment by Field of Study in Alpena
Education (14 | 58.3%), social sciences (7 | 29.2%), arts & humanities (2 | 8.3%), and science & technology (1 | 4.2%) are the most common fields of study among 24 individuals in Alpena who have obtained a bachelor's degree or higher.
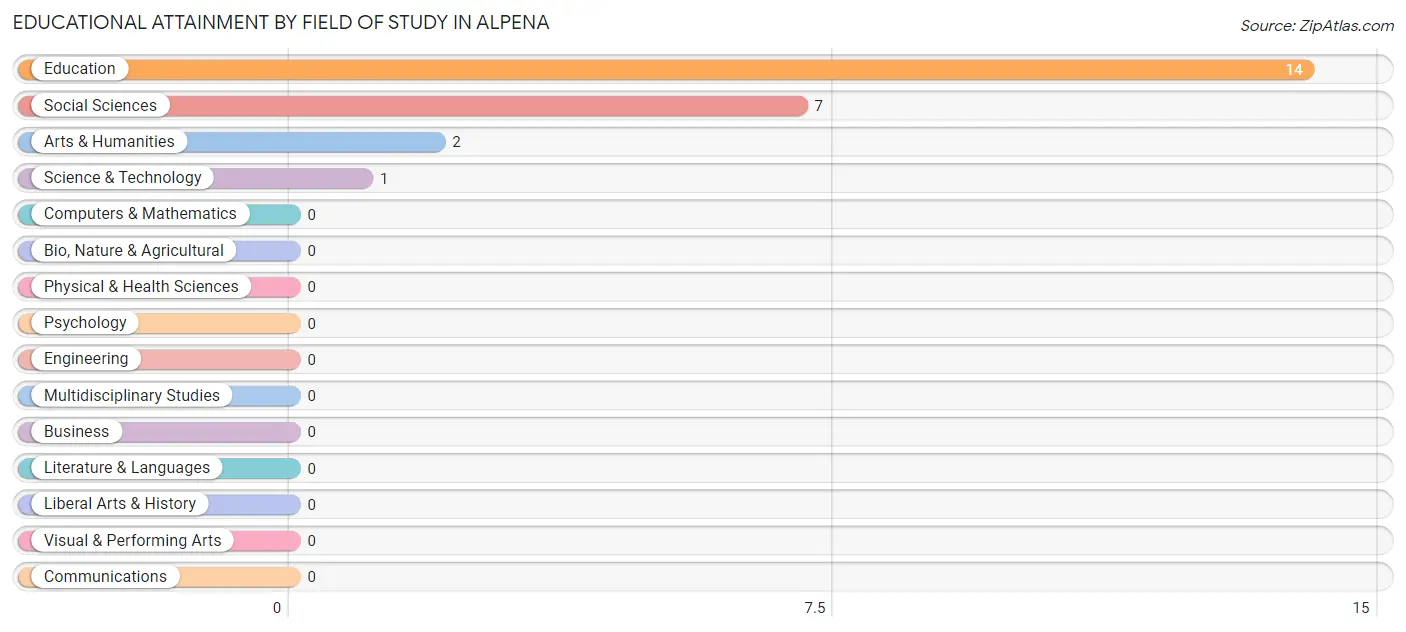
| Field of Study | # Graduates | % Graduates |
| Computers & Mathematics | 0 | 0.0% |
| Bio, Nature & Agricultural | 0 | 0.0% |
| Physical & Health Sciences | 0 | 0.0% |
| Psychology | 0 | 0.0% |
| Social Sciences | 7 | 29.2% |
| Engineering | 0 | 0.0% |
| Multidisciplinary Studies | 0 | 0.0% |
| Science & Technology | 1 | 4.2% |
| Business | 0 | 0.0% |
| Education | 14 | 58.3% |
| Literature & Languages | 0 | 0.0% |
| Liberal Arts & History | 0 | 0.0% |
| Visual & Performing Arts | 0 | 0.0% |
| Communications | 0 | 0.0% |
| Arts & Humanities | 2 | 8.3% |
| Total | 24 | 100.0% |
Transportation & Commute in Alpena
Vehicle Availability by Sex in Alpena
The most prevalent vehicle ownership categories in Alpena are males with 2 vehicles (51, accounting for 45.1%) and females with 2 vehicles (27, making up 69.9%).
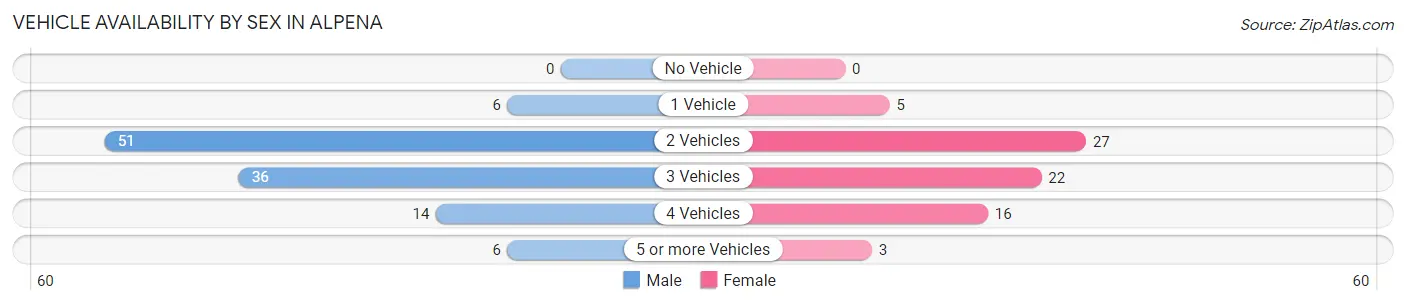
| Vehicles Available | Male | Female |
| No Vehicle | 0 (0.0%) | 0 (0.0%) |
| 1 Vehicle | 6 (5.3%) | 5 (6.9%) |
| 2 Vehicles | 51 (45.1%) | 27 (37.0%) |
| 3 Vehicles | 36 (31.9%) | 22 (30.1%) |
| 4 Vehicles | 14 (12.4%) | 16 (21.9%) |
| 5 or more Vehicles | 6 (5.3%) | 3 (4.1%) |
| Total | 113 (100.0%) | 73 (100.0%) |
Commute Time in Alpena
The most frequently occuring commute durations in Alpena are less than 5 minutes (73 commuters, 42.4%), 5 to 9 minutes (32 commuters, 18.6%), and 20 to 24 minutes (31 commuters, 18.0%).
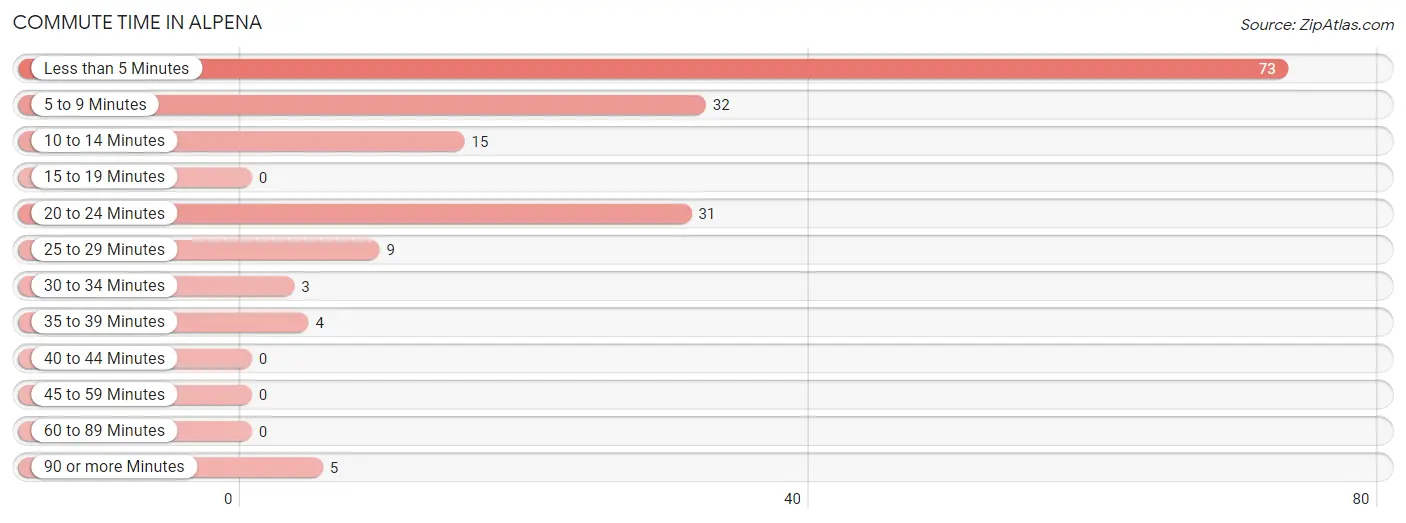
| Commute Time | # Commuters | % Commuters |
| Less than 5 Minutes | 73 | 42.4% |
| 5 to 9 Minutes | 32 | 18.6% |
| 10 to 14 Minutes | 15 | 8.7% |
| 15 to 19 Minutes | 0 | 0.0% |
| 20 to 24 Minutes | 31 | 18.0% |
| 25 to 29 Minutes | 9 | 5.2% |
| 30 to 34 Minutes | 3 | 1.7% |
| 35 to 39 Minutes | 4 | 2.3% |
| 40 to 44 Minutes | 0 | 0.0% |
| 45 to 59 Minutes | 0 | 0.0% |
| 60 to 89 Minutes | 0 | 0.0% |
| 90 or more Minutes | 5 | 2.9% |
Commute Time by Sex in Alpena
The most common commute times in Alpena are less than 5 minutes (50 commuters, 45.9%) for males and less than 5 minutes (23 commuters, 36.5%) for females.
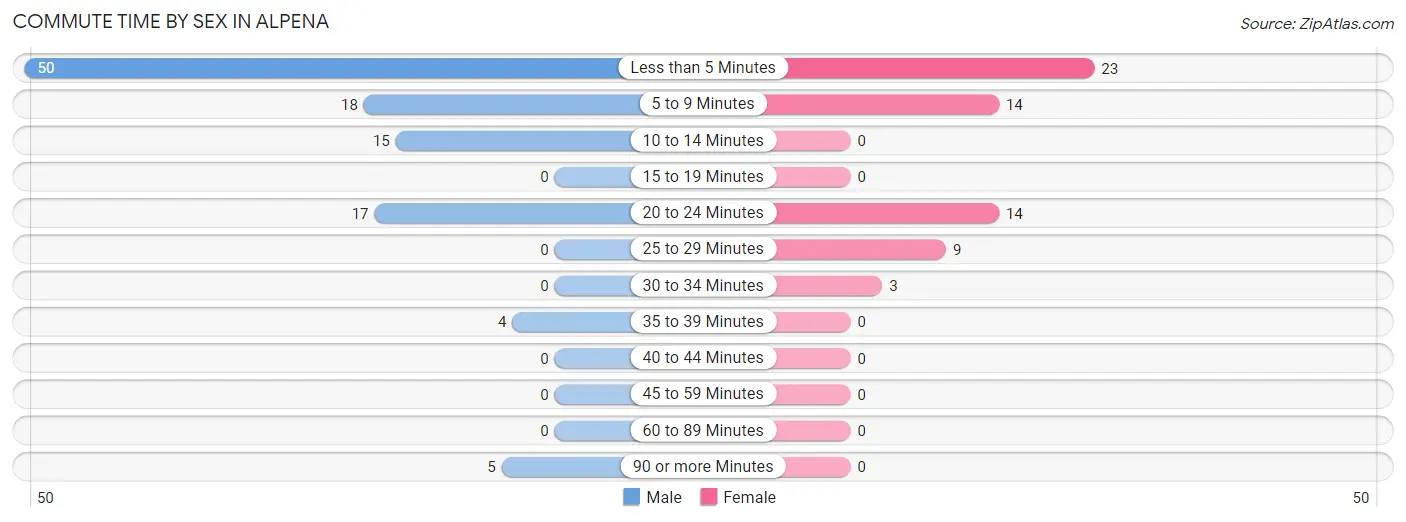
| Commute Time | Male | Female |
| Less than 5 Minutes | 50 (45.9%) | 23 (36.5%) |
| 5 to 9 Minutes | 18 (16.5%) | 14 (22.2%) |
| 10 to 14 Minutes | 15 (13.8%) | 0 (0.0%) |
| 15 to 19 Minutes | 0 (0.0%) | 0 (0.0%) |
| 20 to 24 Minutes | 17 (15.6%) | 14 (22.2%) |
| 25 to 29 Minutes | 0 (0.0%) | 9 (14.3%) |
| 30 to 34 Minutes | 0 (0.0%) | 3 (4.8%) |
| 35 to 39 Minutes | 4 (3.7%) | 0 (0.0%) |
| 40 to 44 Minutes | 0 (0.0%) | 0 (0.0%) |
| 45 to 59 Minutes | 0 (0.0%) | 0 (0.0%) |
| 60 to 89 Minutes | 0 (0.0%) | 0 (0.0%) |
| 90 or more Minutes | 5 (4.6%) | 0 (0.0%) |
Time of Departure to Work by Sex in Alpena
The most frequent times of departure to work in Alpena are 4:00 PM to 11:59 PM (47, 43.1%) for males and 8:00 AM to 8:29 AM (11, 17.5%) for females.
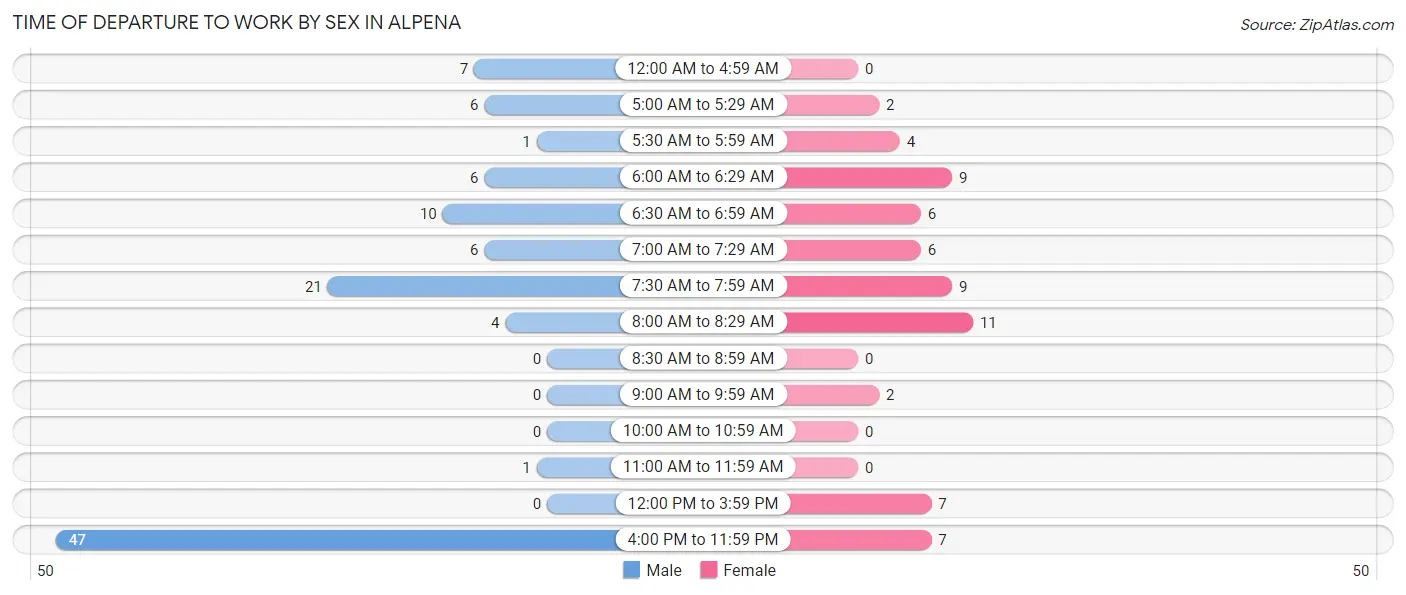
| Time of Departure | Male | Female |
| 12:00 AM to 4:59 AM | 7 (6.4%) | 0 (0.0%) |
| 5:00 AM to 5:29 AM | 6 (5.5%) | 2 (3.2%) |
| 5:30 AM to 5:59 AM | 1 (0.9%) | 4 (6.4%) |
| 6:00 AM to 6:29 AM | 6 (5.5%) | 9 (14.3%) |
| 6:30 AM to 6:59 AM | 10 (9.2%) | 6 (9.5%) |
| 7:00 AM to 7:29 AM | 6 (5.5%) | 6 (9.5%) |
| 7:30 AM to 7:59 AM | 21 (19.3%) | 9 (14.3%) |
| 8:00 AM to 8:29 AM | 4 (3.7%) | 11 (17.5%) |
| 8:30 AM to 8:59 AM | 0 (0.0%) | 0 (0.0%) |
| 9:00 AM to 9:59 AM | 0 (0.0%) | 2 (3.2%) |
| 10:00 AM to 10:59 AM | 0 (0.0%) | 0 (0.0%) |
| 11:00 AM to 11:59 AM | 1 (0.9%) | 0 (0.0%) |
| 12:00 PM to 3:59 PM | 0 (0.0%) | 7 (11.1%) |
| 4:00 PM to 11:59 PM | 47 (43.1%) | 7 (11.1%) |
| Total | 109 (100.0%) | 63 (100.0%) |
Housing Occupancy in Alpena
Occupancy by Ownership in Alpena
Of the total 170 dwellings in Alpena, owner-occupied units account for 163 (95.9%), while renter-occupied units make up 7 (4.1%).
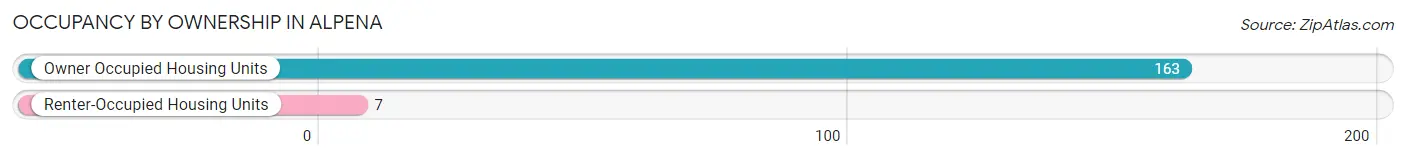
| Occupancy | # Housing Units | % Housing Units |
| Owner Occupied Housing Units | 163 | 95.9% |
| Renter-Occupied Housing Units | 7 | 4.1% |
| Total Occupied Housing Units | 170 | 100.0% |
Occupancy by Household Size in Alpena
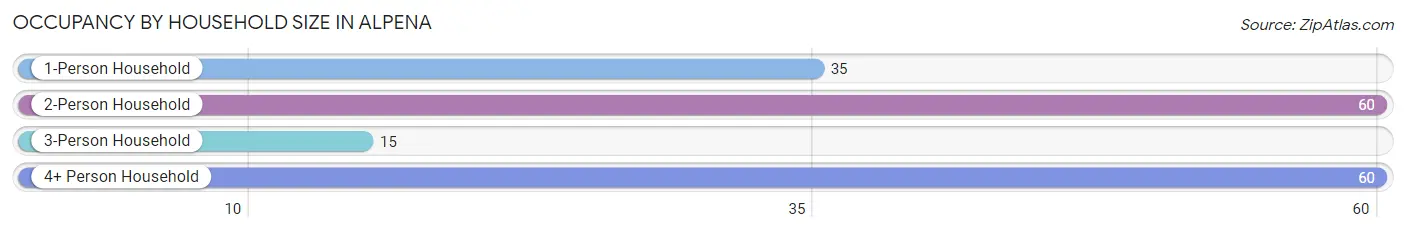
| Household Size | # Housing Units | % Housing Units |
| 1-Person Household | 35 | 20.6% |
| 2-Person Household | 60 | 35.3% |
| 3-Person Household | 15 | 8.8% |
| 4+ Person Household | 60 | 35.3% |
| Total Housing Units | 170 | 100.0% |
Occupancy by Ownership by Household Size in Alpena
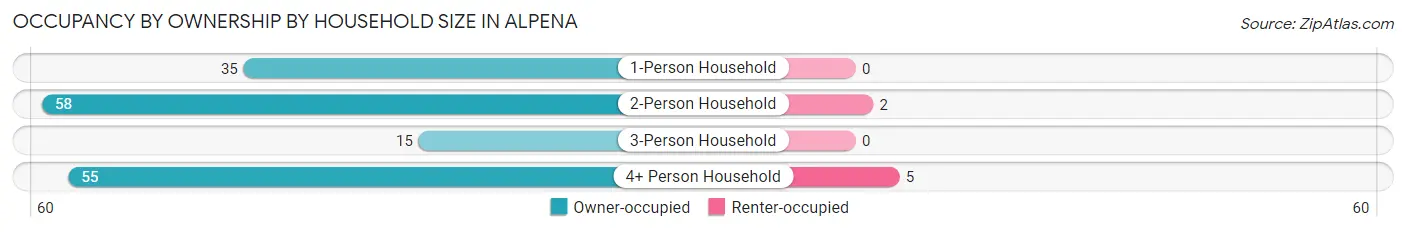
| Household Size | Owner-occupied | Renter-occupied |
| 1-Person Household | 35 (100.0%) | 0 (0.0%) |
| 2-Person Household | 58 (96.7%) | 2 (3.3%) |
| 3-Person Household | 15 (100.0%) | 0 (0.0%) |
| 4+ Person Household | 55 (91.7%) | 5 (8.3%) |
| Total Housing Units | 163 (95.9%) | 7 (4.1%) |
Occupancy by Educational Attainment in Alpena
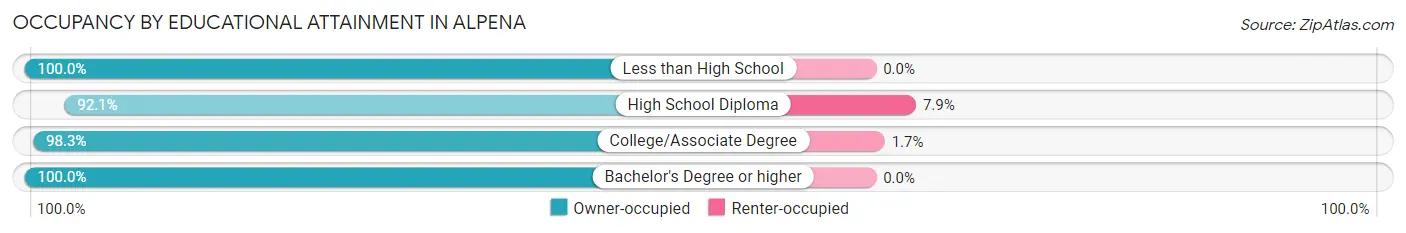
| Household Size | Owner-occupied | Renter-occupied |
| Less than High School | 22 (100.0%) | 0 (0.0%) |
| High School Diploma | 70 (92.1%) | 6 (7.9%) |
| College/Associate Degree | 58 (98.3%) | 1 (1.7%) |
| Bachelor's Degree or higher | 13 (100.0%) | 0 (0.0%) |
Occupancy by Age of Householder in Alpena
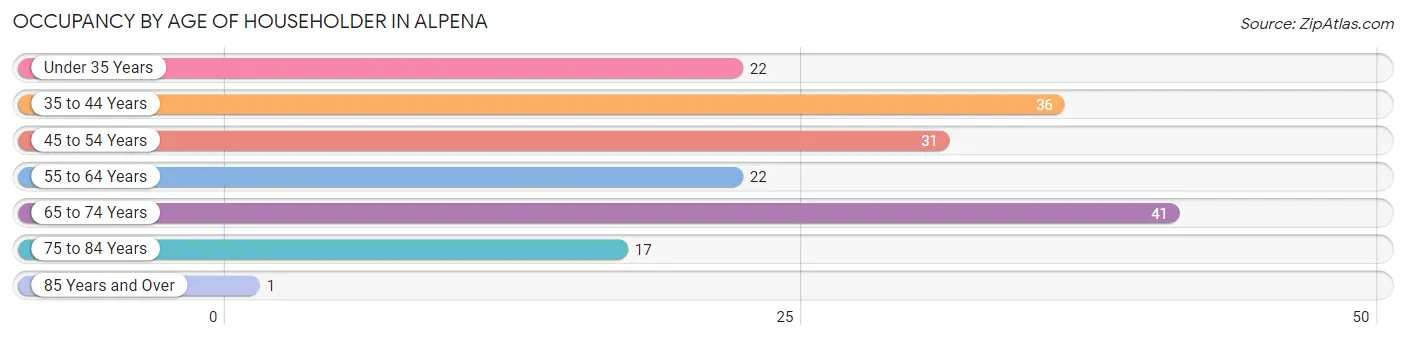
| Age Bracket | # Households | % Households |
| Under 35 Years | 22 | 12.9% |
| 35 to 44 Years | 36 | 21.2% |
| 45 to 54 Years | 31 | 18.2% |
| 55 to 64 Years | 22 | 12.9% |
| 65 to 74 Years | 41 | 24.1% |
| 75 to 84 Years | 17 | 10.0% |
| 85 Years and Over | 1 | 0.6% |
| Total | 170 | 100.0% |
Housing Finances in Alpena
Median Income by Occupancy in Alpena
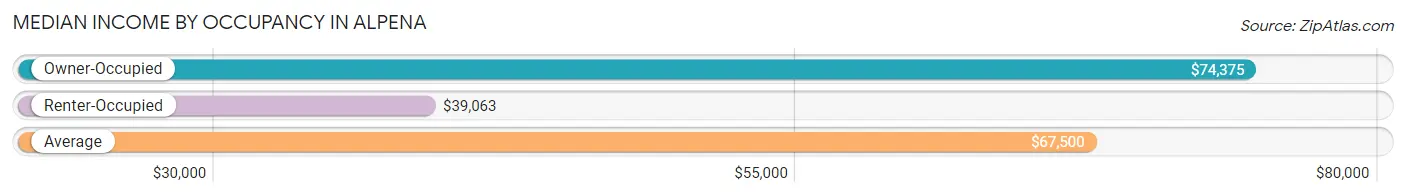
| Occupancy Type | # Households | Median Income |
| Owner-Occupied | 163 (95.9%) | $74,375 |
| Renter-Occupied | 7 (4.1%) | $39,063 |
| Average | 170 (100.0%) | $67,500 |
Occupancy by Householder Income Bracket in Alpena
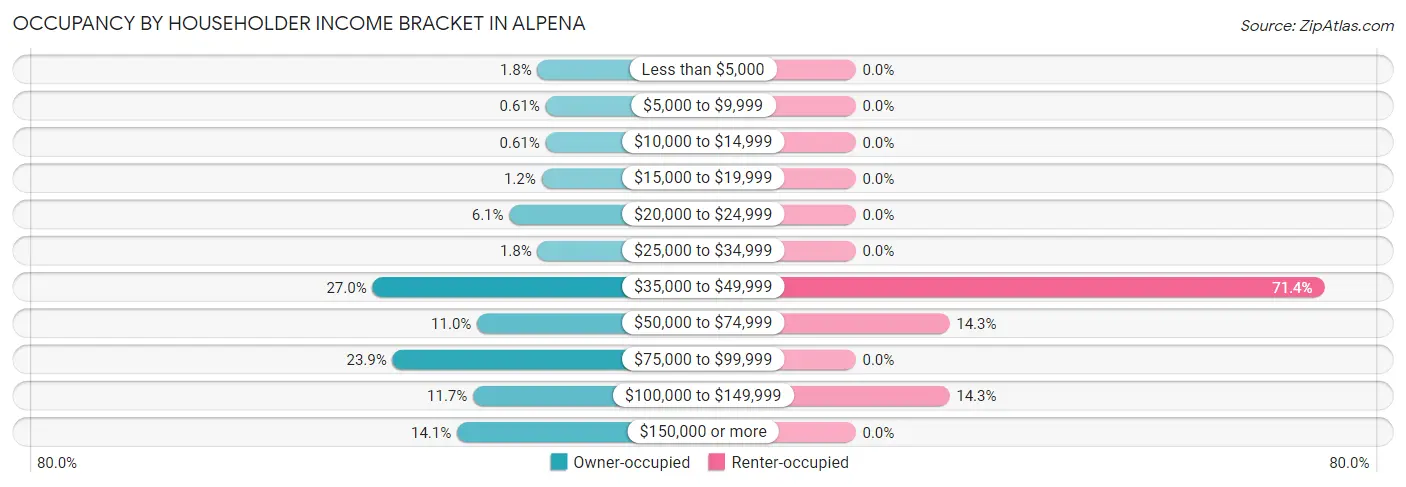
| Income Bracket | Owner-occupied | Renter-occupied |
| Less than $5,000 | 3 (1.8%) | 0 (0.0%) |
| $5,000 to $9,999 | 1 (0.6%) | 0 (0.0%) |
| $10,000 to $14,999 | 1 (0.6%) | 0 (0.0%) |
| $15,000 to $19,999 | 2 (1.2%) | 0 (0.0%) |
| $20,000 to $24,999 | 10 (6.1%) | 0 (0.0%) |
| $25,000 to $34,999 | 3 (1.8%) | 0 (0.0%) |
| $35,000 to $49,999 | 44 (27.0%) | 5 (71.4%) |
| $50,000 to $74,999 | 18 (11.0%) | 1 (14.3%) |
| $75,000 to $99,999 | 39 (23.9%) | 0 (0.0%) |
| $100,000 to $149,999 | 19 (11.7%) | 1 (14.3%) |
| $150,000 or more | 23 (14.1%) | 0 (0.0%) |
| Total | 163 (100.0%) | 7 (100.0%) |
Monthly Housing Cost Tiers in Alpena
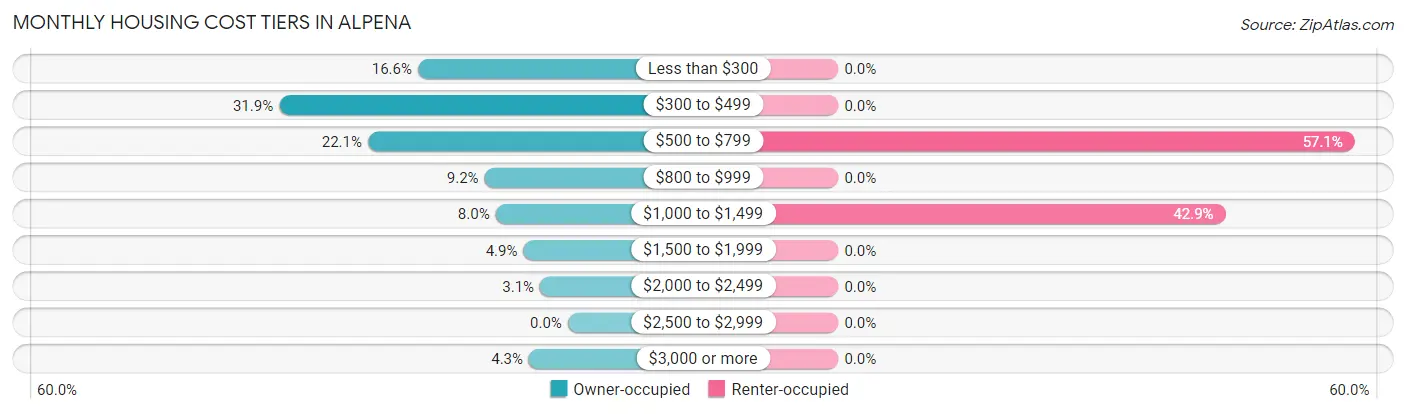
| Monthly Cost | Owner-occupied | Renter-occupied |
| Less than $300 | 27 (16.6%) | 0 (0.0%) |
| $300 to $499 | 52 (31.9%) | 0 (0.0%) |
| $500 to $799 | 36 (22.1%) | 4 (57.1%) |
| $800 to $999 | 15 (9.2%) | 0 (0.0%) |
| $1,000 to $1,499 | 13 (8.0%) | 3 (42.9%) |
| $1,500 to $1,999 | 8 (4.9%) | 0 (0.0%) |
| $2,000 to $2,499 | 5 (3.1%) | 0 (0.0%) |
| $2,500 to $2,999 | 0 (0.0%) | 0 (0.0%) |
| $3,000 or more | 7 (4.3%) | 0 (0.0%) |
| Total | 163 (100.0%) | 7 (100.0%) |
Physical Housing Characteristics in Alpena
Housing Structures in Alpena
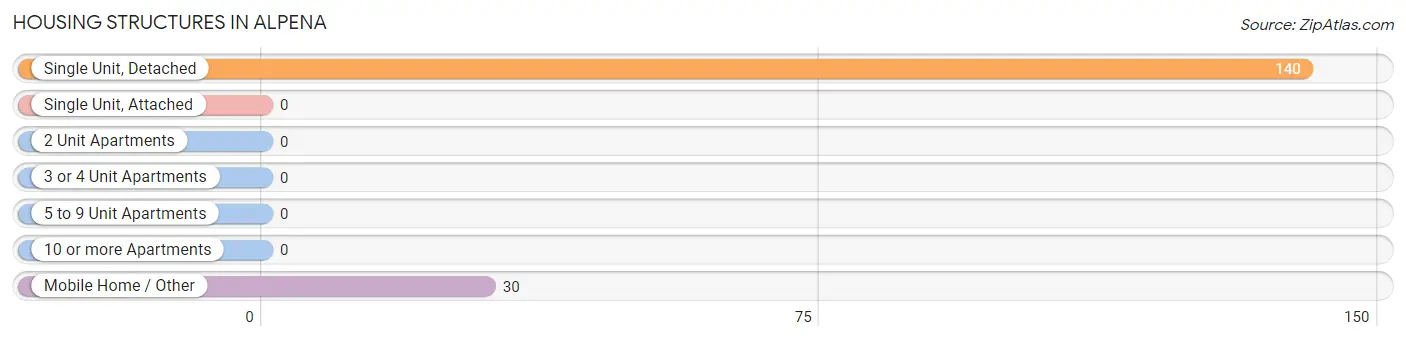
| Structure Type | # Housing Units | % Housing Units |
| Single Unit, Detached | 140 | 82.4% |
| Single Unit, Attached | 0 | 0.0% |
| 2 Unit Apartments | 0 | 0.0% |
| 3 or 4 Unit Apartments | 0 | 0.0% |
| 5 to 9 Unit Apartments | 0 | 0.0% |
| 10 or more Apartments | 0 | 0.0% |
| Mobile Home / Other | 30 | 17.6% |
| Total | 170 | 100.0% |
Housing Structures by Occupancy in Alpena
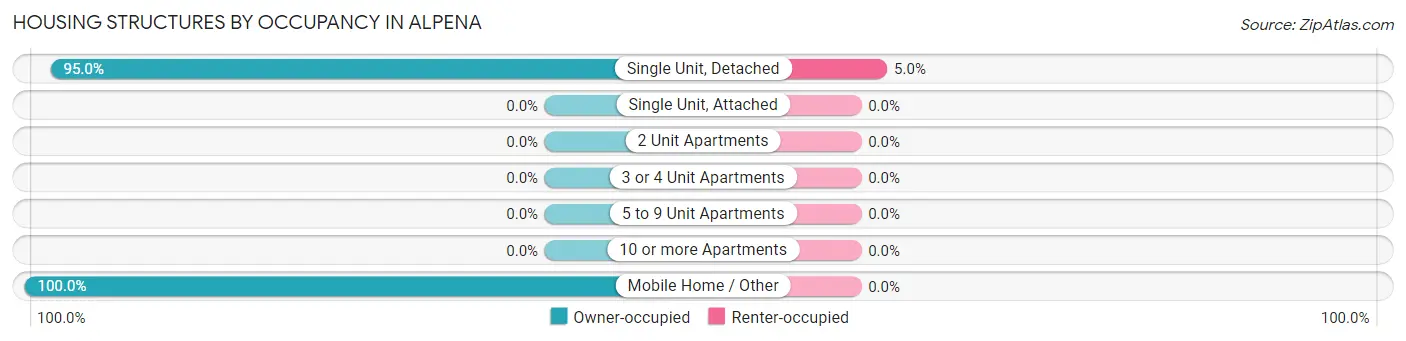
| Structure Type | Owner-occupied | Renter-occupied |
| Single Unit, Detached | 133 (95.0%) | 7 (5.0%) |
| Single Unit, Attached | 0 (0.0%) | 0 (0.0%) |
| 2 Unit Apartments | 0 (0.0%) | 0 (0.0%) |
| 3 or 4 Unit Apartments | 0 (0.0%) | 0 (0.0%) |
| 5 to 9 Unit Apartments | 0 (0.0%) | 0 (0.0%) |
| 10 or more Apartments | 0 (0.0%) | 0 (0.0%) |
| Mobile Home / Other | 30 (100.0%) | 0 (0.0%) |
| Total | 163 (95.9%) | 7 (4.1%) |
Housing Structures by Number of Rooms in Alpena
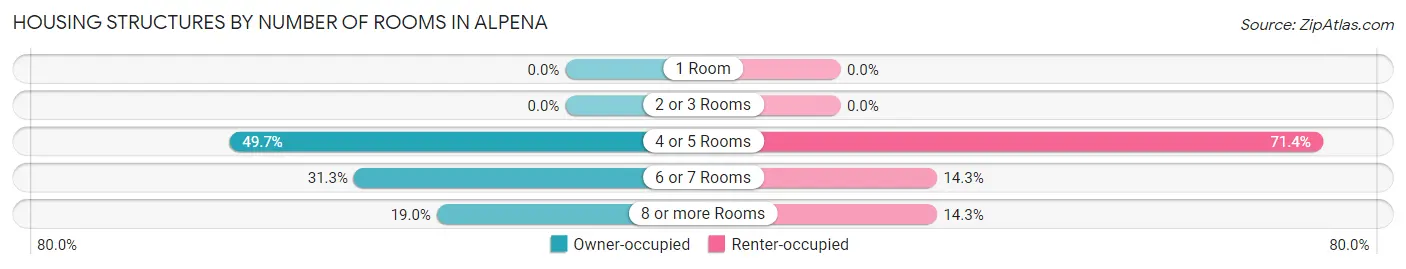
| Number of Rooms | Owner-occupied | Renter-occupied |
| 1 Room | 0 (0.0%) | 0 (0.0%) |
| 2 or 3 Rooms | 0 (0.0%) | 0 (0.0%) |
| 4 or 5 Rooms | 81 (49.7%) | 5 (71.4%) |
| 6 or 7 Rooms | 51 (31.3%) | 1 (14.3%) |
| 8 or more Rooms | 31 (19.0%) | 1 (14.3%) |
| Total | 163 (100.0%) | 7 (100.0%) |
Housing Structure by Heating Type in Alpena
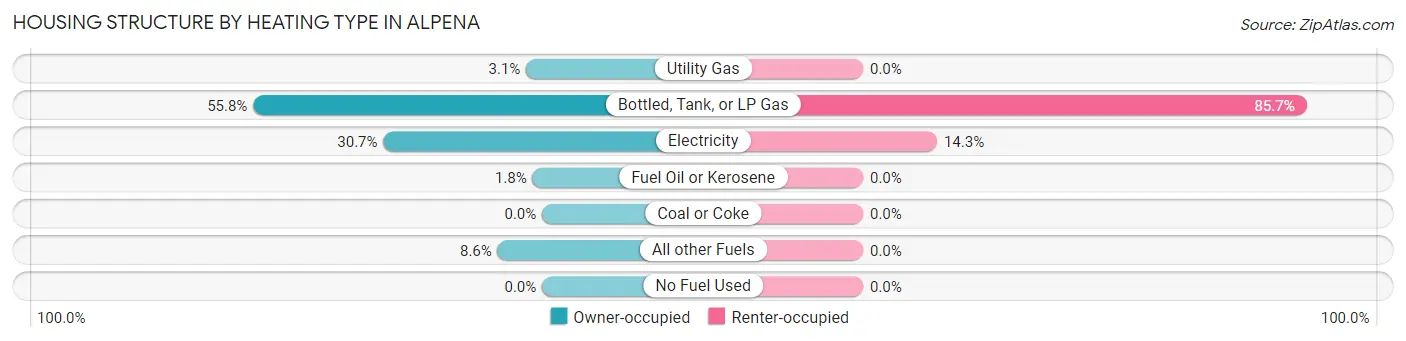
| Heating Type | Owner-occupied | Renter-occupied |
| Utility Gas | 5 (3.1%) | 0 (0.0%) |
| Bottled, Tank, or LP Gas | 91 (55.8%) | 6 (85.7%) |
| Electricity | 50 (30.7%) | 1 (14.3%) |
| Fuel Oil or Kerosene | 3 (1.8%) | 0 (0.0%) |
| Coal or Coke | 0 (0.0%) | 0 (0.0%) |
| All other Fuels | 14 (8.6%) | 0 (0.0%) |
| No Fuel Used | 0 (0.0%) | 0 (0.0%) |
| Total | 163 (100.0%) | 7 (100.0%) |
Household Vehicle Usage in Alpena
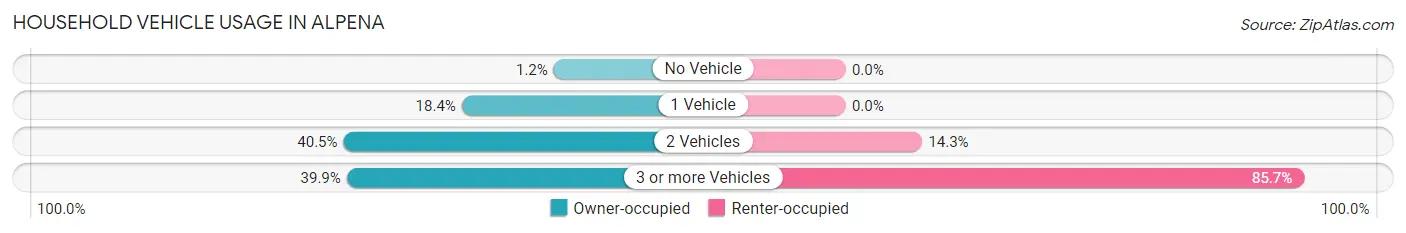
| Vehicles per Household | Owner-occupied | Renter-occupied |
| No Vehicle | 2 (1.2%) | 0 (0.0%) |
| 1 Vehicle | 30 (18.4%) | 0 (0.0%) |
| 2 Vehicles | 66 (40.5%) | 1 (14.3%) |
| 3 or more Vehicles | 65 (39.9%) | 6 (85.7%) |
| Total | 163 (100.0%) | 7 (100.0%) |
Real Estate & Mortgages in Alpena
Real Estate and Mortgage Overview in Alpena
| Characteristic | Without Mortgage | With Mortgage |
| Housing Units | 98 | 65 |
| Median Property Value | $40,000 | $67,700 |
| Median Household Income | $65,000 | $15 |
| Monthly Housing Costs | $342 | $7 |
| Real Estate Taxes | $447 | $0 |
Property Value by Mortgage Status in Alpena
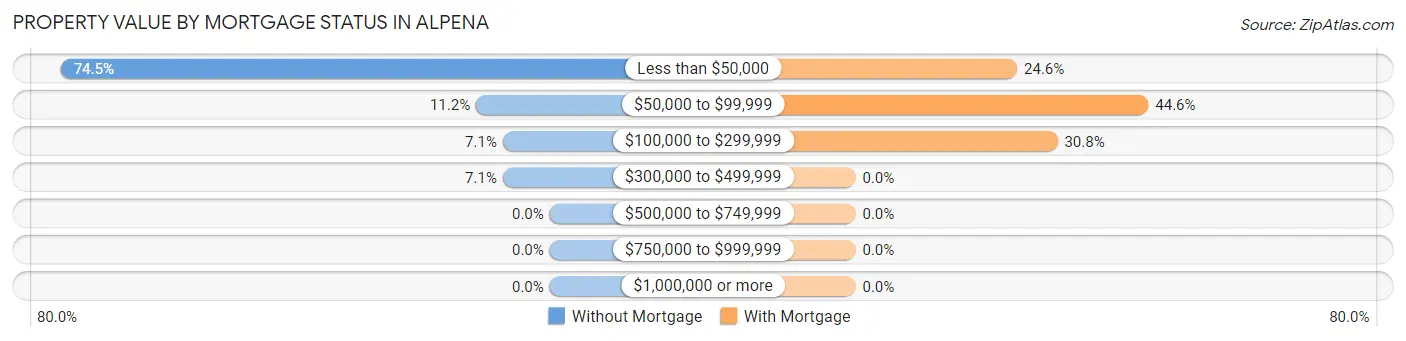
| Property Value | Without Mortgage | With Mortgage |
| Less than $50,000 | 73 (74.5%) | 16 (24.6%) |
| $50,000 to $99,999 | 11 (11.2%) | 29 (44.6%) |
| $100,000 to $299,999 | 7 (7.1%) | 20 (30.8%) |
| $300,000 to $499,999 | 7 (7.1%) | 0 (0.0%) |
| $500,000 to $749,999 | 0 (0.0%) | 0 (0.0%) |
| $750,000 to $999,999 | 0 (0.0%) | 0 (0.0%) |
| $1,000,000 or more | 0 (0.0%) | 0 (0.0%) |
| Total | 98 (100.0%) | 65 (100.0%) |
Household Income by Mortgage Status in Alpena
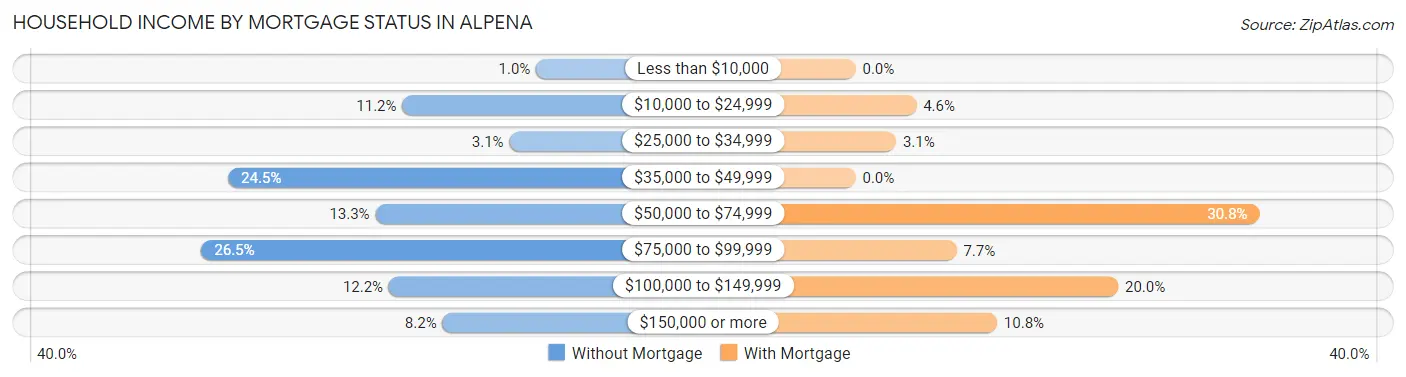
| Household Income | Without Mortgage | With Mortgage |
| Less than $10,000 | 1 (1.0%) | 0 (0.0%) |
| $10,000 to $24,999 | 11 (11.2%) | 3 (4.6%) |
| $25,000 to $34,999 | 3 (3.1%) | 2 (3.1%) |
| $35,000 to $49,999 | 24 (24.5%) | 0 (0.0%) |
| $50,000 to $74,999 | 13 (13.3%) | 20 (30.8%) |
| $75,000 to $99,999 | 26 (26.5%) | 5 (7.7%) |
| $100,000 to $149,999 | 12 (12.2%) | 13 (20.0%) |
| $150,000 or more | 8 (8.2%) | 7 (10.8%) |
| Total | 98 (100.0%) | 65 (100.0%) |
Property Value to Household Income Ratio in Alpena
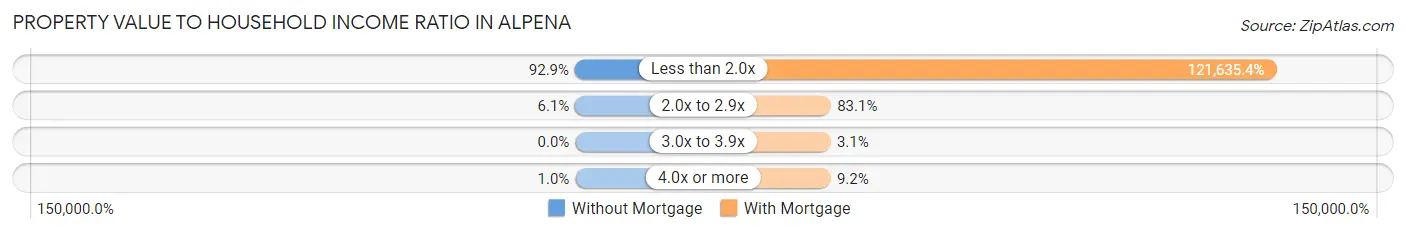
| Value-to-Income Ratio | Without Mortgage | With Mortgage |
| Less than 2.0x | 91 (92.9%) | 79,063 (121,635.4%) |
| 2.0x to 2.9x | 6 (6.1%) | 54 (83.1%) |
| 3.0x to 3.9x | 0 (0.0%) | 2 (3.1%) |
| 4.0x or more | 1 (1.0%) | 6 (9.2%) |
| Total | 98 (100.0%) | 65 (100.0%) |
Real Estate Taxes by Mortgage Status in Alpena
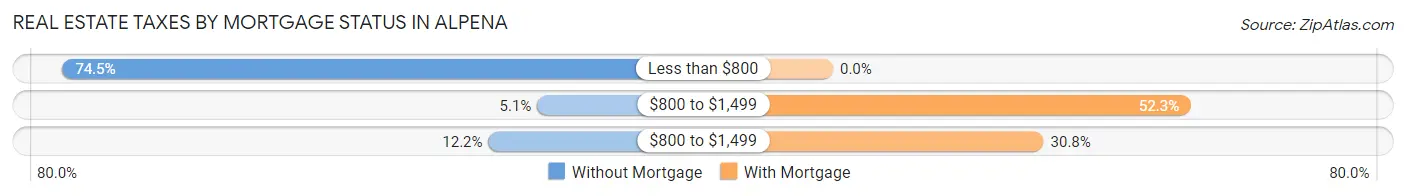
| Property Taxes | Without Mortgage | With Mortgage |
| Less than $800 | 73 (74.5%) | 0 (0.0%) |
| $800 to $1,499 | 5 (5.1%) | 34 (52.3%) |
| $800 to $1,499 | 12 (12.2%) | 20 (30.8%) |
| Total | 98 (100.0%) | 65 (100.0%) |
Health & Disability in Alpena
Health Insurance Coverage by Age in Alpena
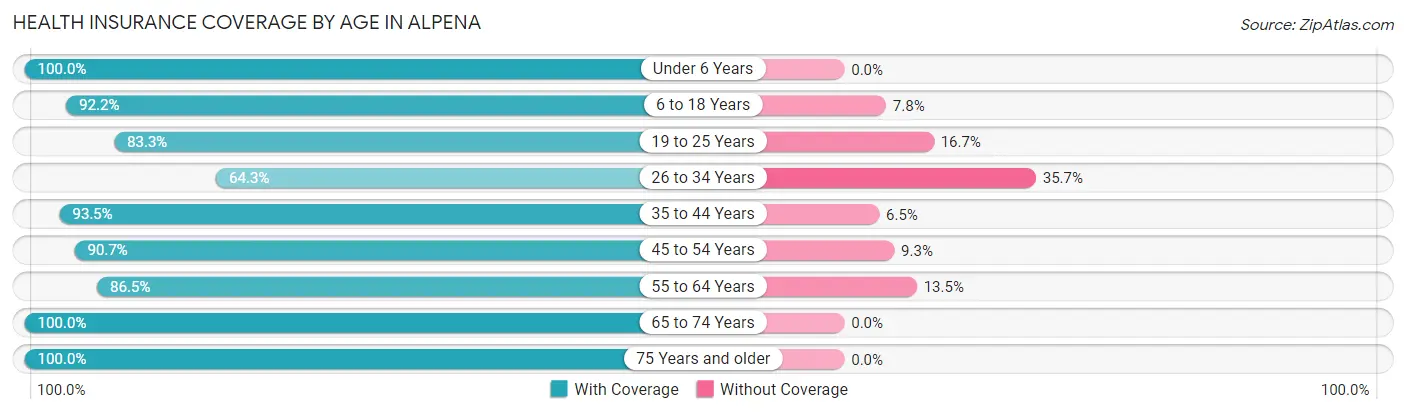
| Age Bracket | With Coverage | Without Coverage |
| Under 6 Years | 10 (100.0%) | 0 (0.0%) |
| 6 to 18 Years | 107 (92.2%) | 9 (7.8%) |
| 19 to 25 Years | 20 (83.3%) | 4 (16.7%) |
| 26 to 34 Years | 9 (64.3%) | 5 (35.7%) |
| 35 to 44 Years | 72 (93.5%) | 5 (6.5%) |
| 45 to 54 Years | 39 (90.7%) | 4 (9.3%) |
| 55 to 64 Years | 32 (86.5%) | 5 (13.5%) |
| 65 to 74 Years | 52 (100.0%) | 0 (0.0%) |
| 75 Years and older | 34 (100.0%) | 0 (0.0%) |
| Total | 375 (92.1%) | 32 (7.9%) |
Health Insurance Coverage by Citizenship Status in Alpena
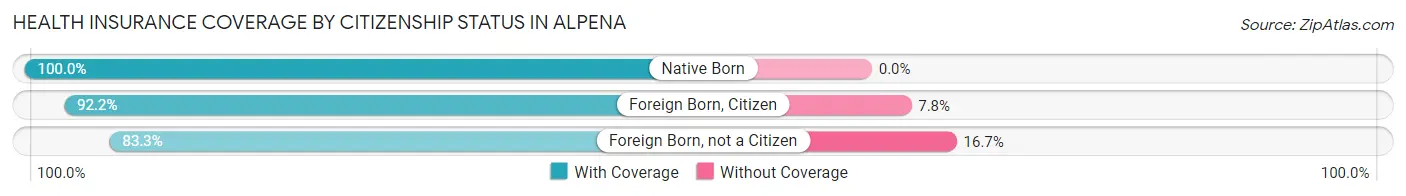
| Citizenship Status | With Coverage | Without Coverage |
| Native Born | 10 (100.0%) | 0 (0.0%) |
| Foreign Born, Citizen | 107 (92.2%) | 9 (7.8%) |
| Foreign Born, not a Citizen | 20 (83.3%) | 4 (16.7%) |
Health Insurance Coverage by Household Income in Alpena
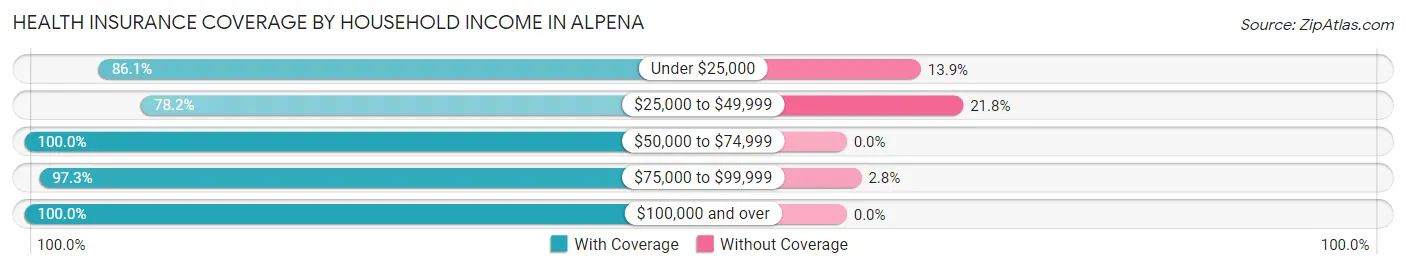
| Household Income | With Coverage | Without Coverage |
| Under $25,000 | 31 (86.1%) | 5 (13.9%) |
| $25,000 to $49,999 | 86 (78.2%) | 24 (21.8%) |
| $50,000 to $74,999 | 40 (100.0%) | 0 (0.0%) |
| $75,000 to $99,999 | 106 (97.3%) | 3 (2.8%) |
| $100,000 and over | 112 (100.0%) | 0 (0.0%) |
Public vs Private Health Insurance Coverage by Age in Alpena
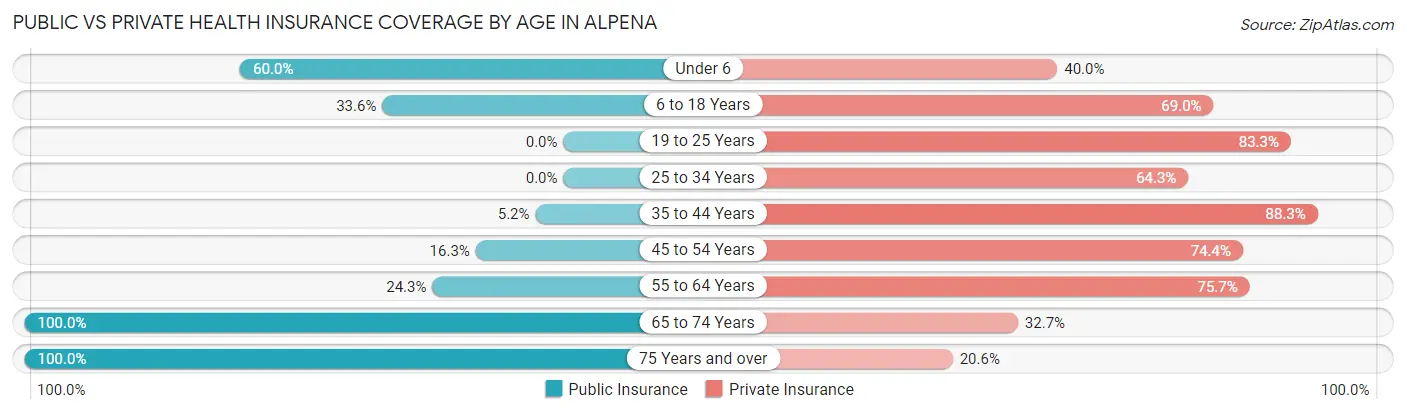
| Age Bracket | Public Insurance | Private Insurance |
| Under 6 | 6 (60.0%) | 4 (40.0%) |
| 6 to 18 Years | 39 (33.6%) | 80 (69.0%) |
| 19 to 25 Years | 0 (0.0%) | 20 (83.3%) |
| 25 to 34 Years | 0 (0.0%) | 9 (64.3%) |
| 35 to 44 Years | 4 (5.2%) | 68 (88.3%) |
| 45 to 54 Years | 7 (16.3%) | 32 (74.4%) |
| 55 to 64 Years | 9 (24.3%) | 28 (75.7%) |
| 65 to 74 Years | 52 (100.0%) | 17 (32.7%) |
| 75 Years and over | 34 (100.0%) | 7 (20.6%) |
| Total | 151 (37.1%) | 265 (65.1%) |
Disability Status by Sex by Age in Alpena
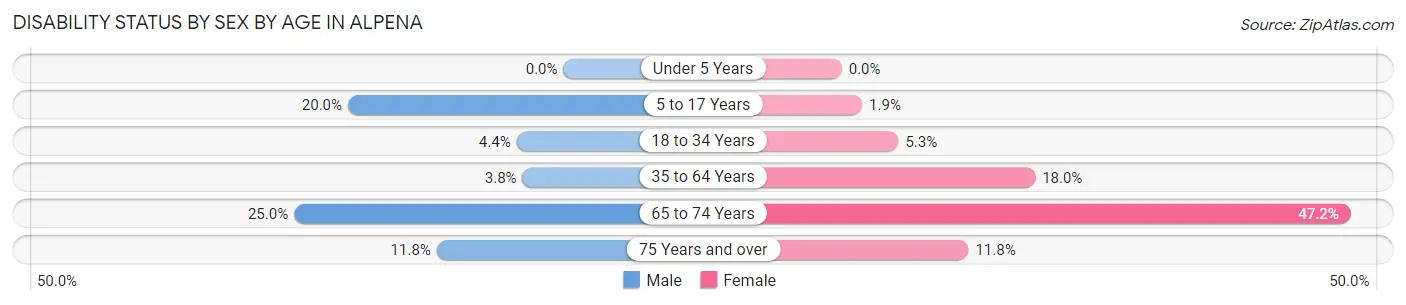
| Age Bracket | Male | Female |
| Under 5 Years | 0 (0.0%) | 0 (0.0%) |
| 5 to 17 Years | 12 (20.0%) | 1 (1.9%) |
| 18 to 34 Years | 1 (4.3%) | 1 (5.3%) |
| 35 to 64 Years | 3 (3.8%) | 14 (17.9%) |
| 65 to 74 Years | 4 (25.0%) | 17 (47.2%) |
| 75 Years and over | 2 (11.8%) | 2 (11.8%) |
Disability Class by Sex by Age in Alpena
Disability Class: Hearing Difficulty
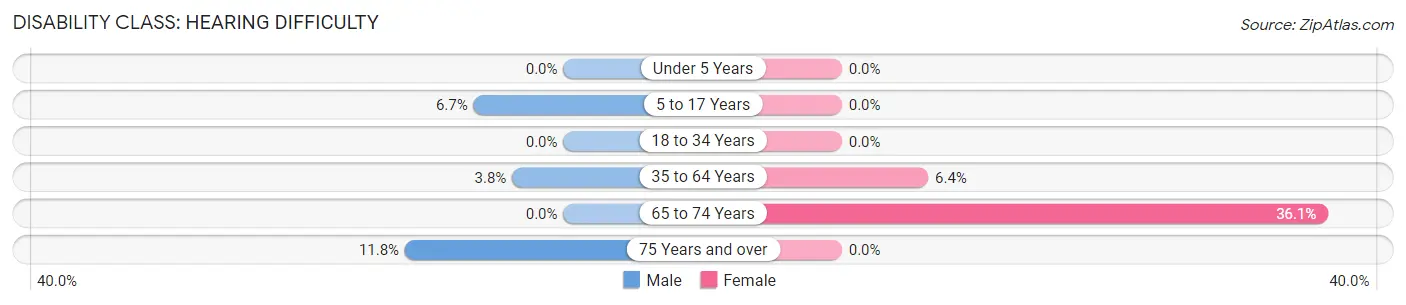
| Age Bracket | Male | Female |
| Under 5 Years | 0 (0.0%) | 0 (0.0%) |
| 5 to 17 Years | 4 (6.7%) | 0 (0.0%) |
| 18 to 34 Years | 0 (0.0%) | 0 (0.0%) |
| 35 to 64 Years | 3 (3.8%) | 5 (6.4%) |
| 65 to 74 Years | 0 (0.0%) | 13 (36.1%) |
| 75 Years and over | 2 (11.8%) | 0 (0.0%) |
Disability Class: Vision Difficulty
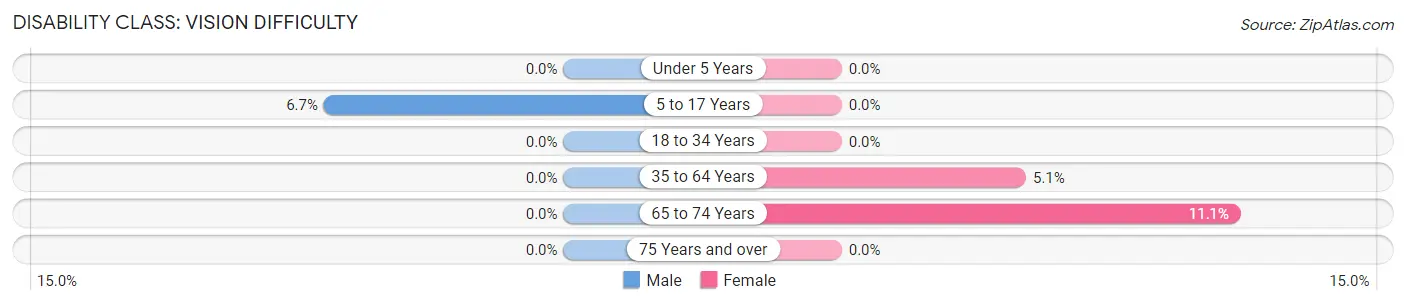
| Age Bracket | Male | Female |
| Under 5 Years | 0 (0.0%) | 0 (0.0%) |
| 5 to 17 Years | 4 (6.7%) | 0 (0.0%) |
| 18 to 34 Years | 0 (0.0%) | 0 (0.0%) |
| 35 to 64 Years | 0 (0.0%) | 4 (5.1%) |
| 65 to 74 Years | 0 (0.0%) | 4 (11.1%) |
| 75 Years and over | 0 (0.0%) | 0 (0.0%) |
Disability Class: Cognitive Difficulty
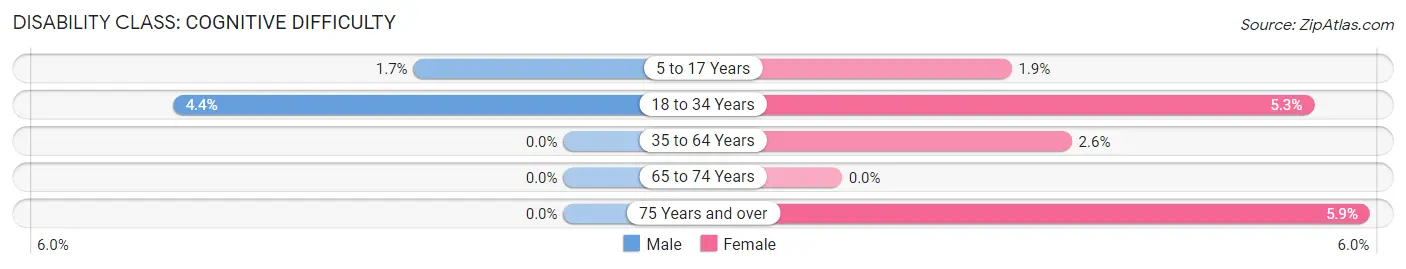
| Age Bracket | Male | Female |
| 5 to 17 Years | 1 (1.7%) | 1 (1.9%) |
| 18 to 34 Years | 1 (4.3%) | 1 (5.3%) |
| 35 to 64 Years | 0 (0.0%) | 2 (2.6%) |
| 65 to 74 Years | 0 (0.0%) | 0 (0.0%) |
| 75 Years and over | 0 (0.0%) | 1 (5.9%) |
Disability Class: Ambulatory Difficulty
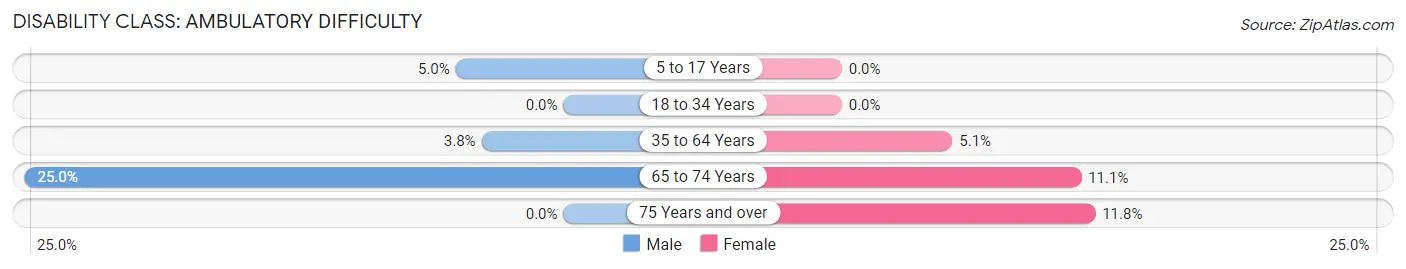
| Age Bracket | Male | Female |
| 5 to 17 Years | 3 (5.0%) | 0 (0.0%) |
| 18 to 34 Years | 0 (0.0%) | 0 (0.0%) |
| 35 to 64 Years | 3 (3.8%) | 4 (5.1%) |
| 65 to 74 Years | 4 (25.0%) | 4 (11.1%) |
| 75 Years and over | 0 (0.0%) | 2 (11.8%) |
Disability Class: Self-Care Difficulty
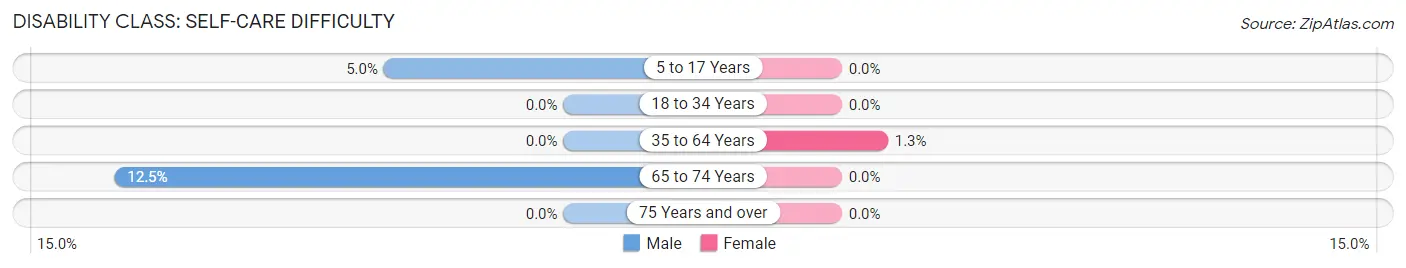
| Age Bracket | Male | Female |
| 5 to 17 Years | 3 (5.0%) | 0 (0.0%) |
| 18 to 34 Years | 0 (0.0%) | 0 (0.0%) |
| 35 to 64 Years | 0 (0.0%) | 1 (1.3%) |
| 65 to 74 Years | 2 (12.5%) | 0 (0.0%) |
| 75 Years and over | 0 (0.0%) | 0 (0.0%) |
Technology Access in Alpena
Computing Device Access in Alpena
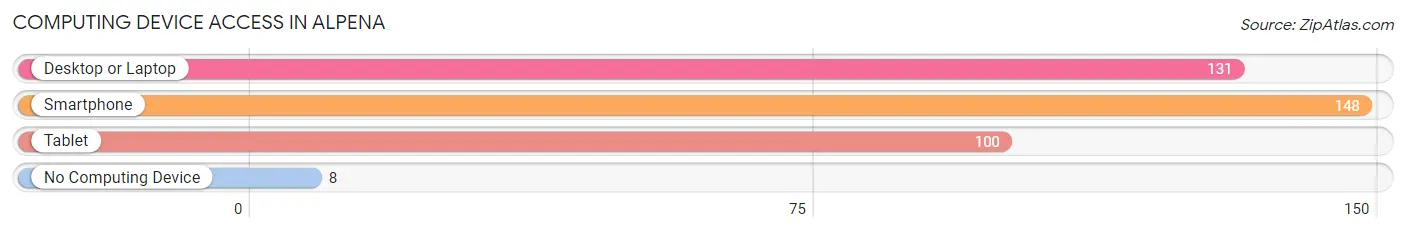
| Device Type | # Households | % Households |
| Desktop or Laptop | 131 | 77.1% |
| Smartphone | 148 | 87.1% |
| Tablet | 100 | 58.8% |
| No Computing Device | 8 | 4.7% |
| Total | 170 | 100.0% |
Internet Access in Alpena
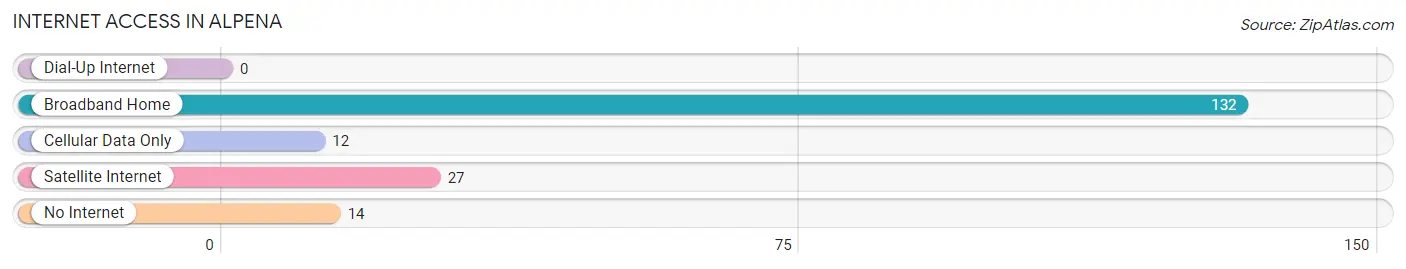
| Internet Type | # Households | % Households |
| Dial-Up Internet | 0 | 0.0% |
| Broadband Home | 132 | 77.6% |
| Cellular Data Only | 12 | 7.1% |
| Satellite Internet | 27 | 15.9% |
| No Internet | 14 | 8.2% |
| Total | 170 | 100.0% |
Alpena Summary
Alpena, South Dakota is a small town located in the northeastern corner of the state. It is situated in the rolling hills of the Missouri Coteau, a region of the Great Plains. The town is located in Brown County, and is the county seat. As of the 2010 census, the population of Alpena was 545.
History
Alpena was founded in 1883 by German immigrants who had come to the area to homestead. The town was named after Alpena, Michigan, which was the hometown of one of the settlers. The town was incorporated in 1887.
In the early years, Alpena was a farming community, with the main crops being wheat, oats, and barley. The town also had a small sawmill and a flour mill. In the late 19th century, the railroad came to Alpena, bringing with it new opportunities for growth. The town became a shipping point for grain and livestock, and the population began to grow.
In the early 20th century, Alpena began to diversify its economy. A creamery was established, and the town became a center for the dairy industry. The town also had a brickyard, a furniture factory, and a canning factory.
Geography
Alpena is located in the northeastern corner of South Dakota, in Brown County. The town is situated in the rolling hills of the Missouri Coteau, a region of the Great Plains. The town is located at an elevation of 1,845 feet (562 m).
The climate in Alpena is semi-arid, with hot summers and cold winters. The average annual temperature is 48°F (9°C). The average annual precipitation is 17.5 inches (44.5 cm).
Economy
Alpena’s economy is largely based on agriculture. The main crops are wheat, oats, and barley. The town also has a small sawmill and a flour mill.
The town is also home to several small businesses, including a grocery store, a hardware store, a restaurant, and a gas station.
Demographics
As of the 2010 census, the population of Alpena was 545. The racial makeup of the town was 97.3% White, 0.2% African American, 0.2% Native American, 0.2% Asian, 0.4% from other races, and 1.7% from two or more races. Hispanic or Latino of any race were 1.3% of the population.
The median income for a household in Alpena was $37,500, and the median income for a family was $45,000. The per capita income for the town was $17,845. About 11.2% of families and 14.2% of the population were below the poverty line, including 18.2% of those under age 18 and 8.3% of those age 65 or over.
Common Questions
What is Per Capita Income in Alpena?
Per Capita income in Alpena is $48,852.
What is the Median Family Income in Alpena?
Median Family Income in Alpena is $84,167.
What is the Median Household income in Alpena?
Median Household Income in Alpena is $67,500.
What is Income or Wage Gap in Alpena?
Income or Wage Gap in Alpena is 53.8%.
Women in Alpena earn 46.2 cents for every dollar earned by a man.
What is Inequality or Gini Index in Alpena?
Inequality or Gini Index in Alpena is 0.56.
What is the Total Population of Alpena?
Total Population of Alpena is 407.
What is the Total Male Population of Alpena?
Total Male Population of Alpena is 195.
What is the Total Female Population of Alpena?
Total Female Population of Alpena is 212.
What is the Ratio of Males per 100 Females in Alpena?
There are 91.98 Males per 100 Females in Alpena.
What is the Ratio of Females per 100 Males in Alpena?
There are 108.72 Females per 100 Males in Alpena.
What is the Median Population Age in Alpena?
Median Population Age in Alpena is 40.1 Years.
What is the Average Family Size in Alpena
Average Family Size in Alpena is 2.8 People.
What is the Average Household Size in Alpena
Average Household Size in Alpena is 2.4 People.
How Large is the Labor Force in Alpena?
There are 188 People in the Labor Forcein in Alpena.
What is the Percentage of People in the Labor Force in Alpena?
63.5% of People are in the Labor Force in Alpena.