Juno Ridge, FL Map & Demographics
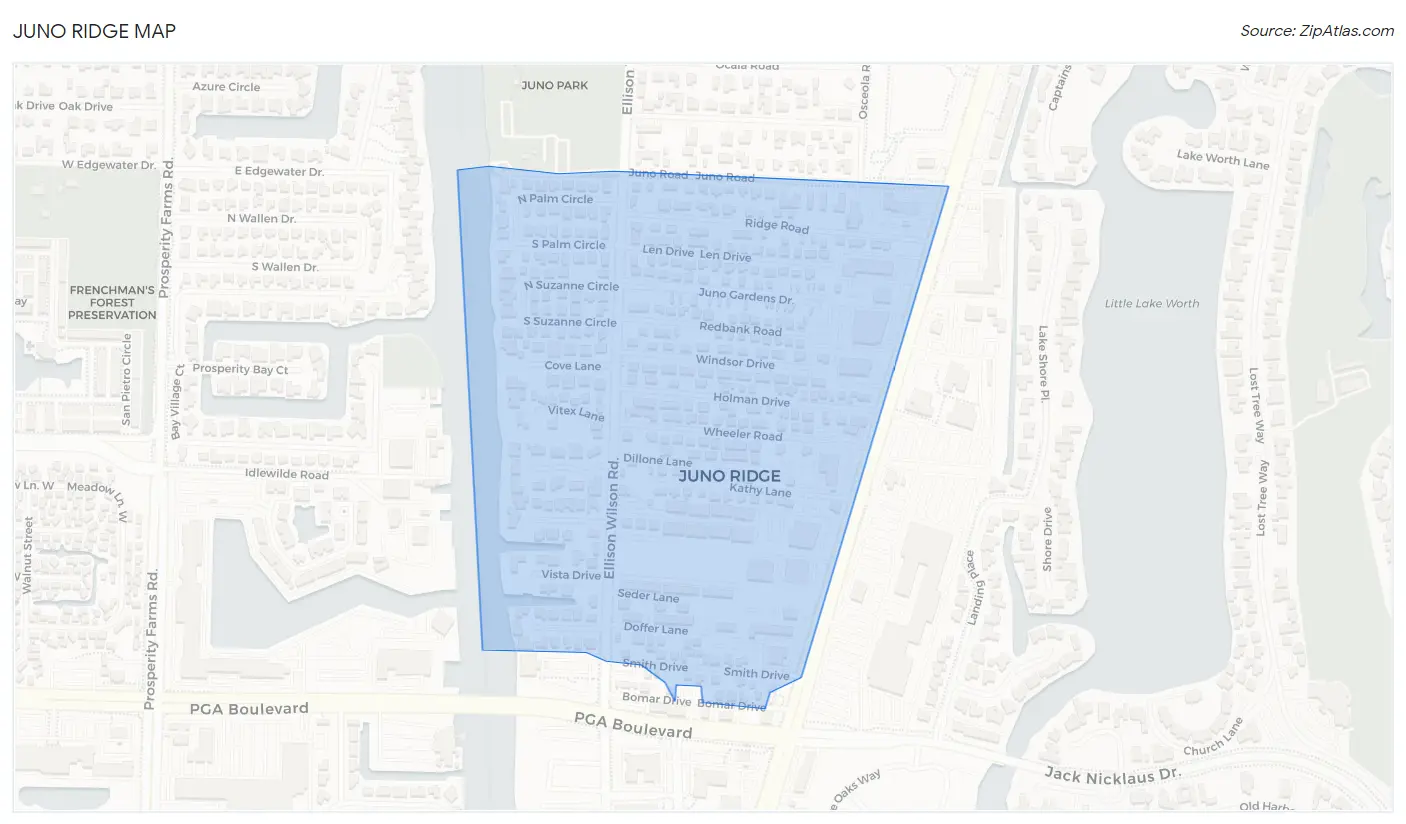
Juno Ridge Map
Juno Ridge Overview
$60,893
PER CAPITA INCOME
$135,214
AVG FAMILY INCOME
$90,972
AVG HOUSEHOLD INCOME
24.8%
WAGE / INCOME GAP [ % ]
75.2¢/ $1
WAGE / INCOME GAP [ $ ]
0.51
INEQUALITY / GINI INDEX
1,245
TOTAL POPULATION
586
MALE POPULATION
659
FEMALE POPULATION
88.92
MALES / 100 FEMALES
112.46
FEMALES / 100 MALES
48.7
MEDIAN AGE
2.4
AVG FAMILY SIZE
2.0
AVG HOUSEHOLD SIZE
671
LABOR FORCE [ PEOPLE ]
64.6%
PERCENT IN LABOR FORCE
2.4%
UNEMPLOYMENT RATE
Income in Juno Ridge
Income Overview in Juno Ridge
Per Capita Income in Juno Ridge is $60,893, while median incomes of families and households are $135,214 and $90,972 respectively.
| Characteristic | Number | Measure |
| Per Capita Income | 1,245 | $60,893 |
| Median Family Income | 404 | $135,214 |
| Mean Family Income | 404 | $163,467 |
| Median Household Income | 630 | $90,972 |
| Mean Household Income | 630 | $123,792 |
| Income Deficit | 404 | $0 |
| Wage / Income Gap (%) | 1,245 | 24.76% |
| Wage / Income Gap ($) | 1,245 | 75.24¢ per $1 |
| Gini / Inequality Index | 1,245 | 0.51 |
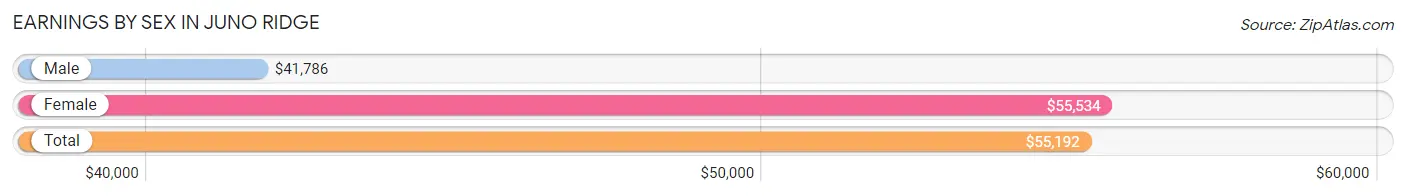
Earnings by Sex in Juno Ridge
Average Earnings in Juno Ridge are $55,192, $41,786 for men and $55,534 for women, a difference of 24.8%.
| Sex | Number | Average Earnings |
| Male | 282 (42.7%) | $41,786 |
| Female | 378 (57.3%) | $55,534 |
| Total | 660 (100.0%) | $55,192 |
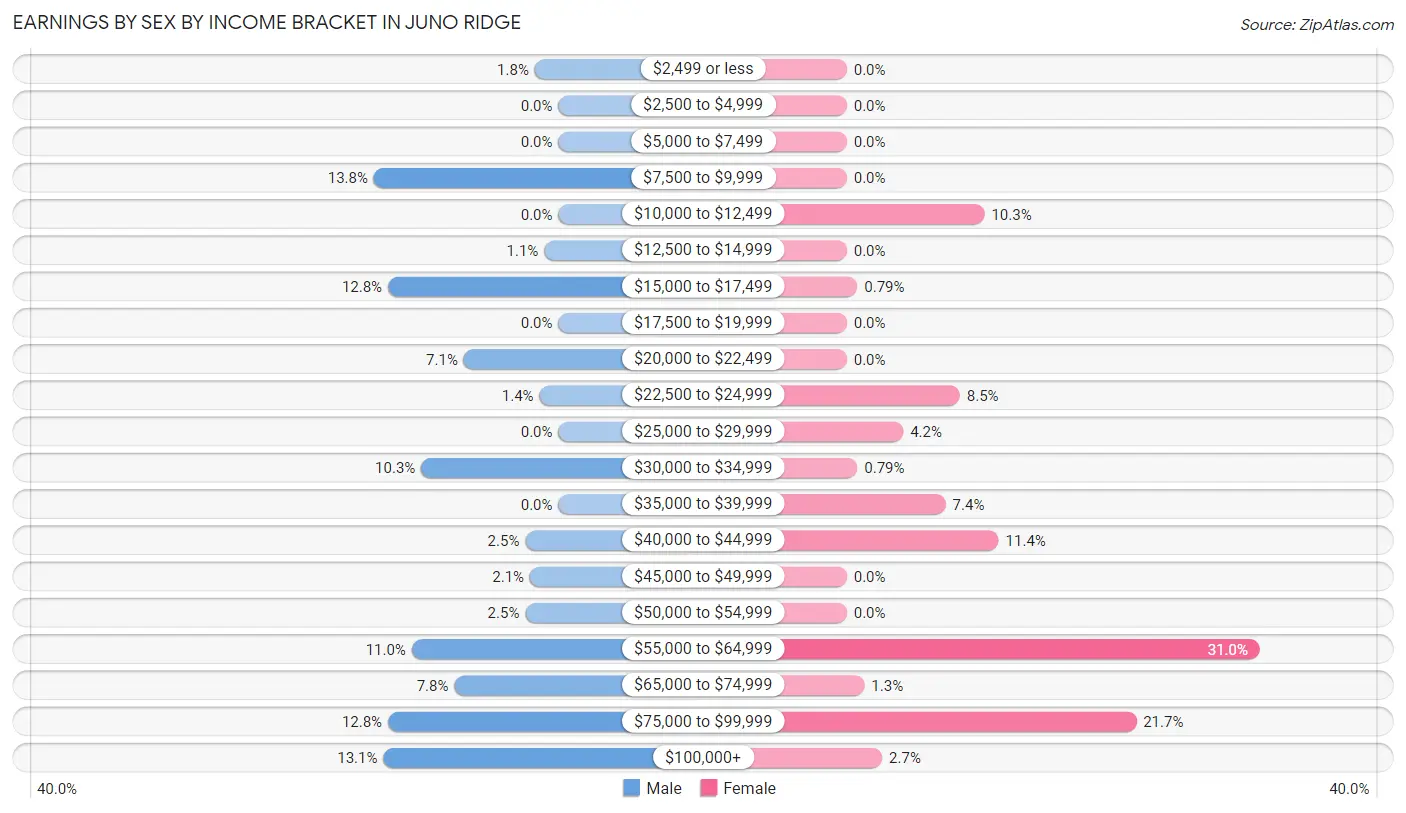
Earnings by Sex by Income Bracket in Juno Ridge
The most common earnings brackets in Juno Ridge are $7,500 to $9,999 for men (39 | 13.8%) and $55,000 to $64,999 for women (117 | 30.9%).
| Income | Male | Female |
| $2,499 or less | 5 (1.8%) | 0 (0.0%) |
| $2,500 to $4,999 | 0 (0.0%) | 0 (0.0%) |
| $5,000 to $7,499 | 0 (0.0%) | 0 (0.0%) |
| $7,500 to $9,999 | 39 (13.8%) | 0 (0.0%) |
| $10,000 to $12,499 | 0 (0.0%) | 39 (10.3%) |
| $12,500 to $14,999 | 3 (1.1%) | 0 (0.0%) |
| $15,000 to $17,499 | 36 (12.8%) | 3 (0.8%) |
| $17,500 to $19,999 | 0 (0.0%) | 0 (0.0%) |
| $20,000 to $22,499 | 20 (7.1%) | 0 (0.0%) |
| $22,500 to $24,999 | 4 (1.4%) | 32 (8.5%) |
| $25,000 to $29,999 | 0 (0.0%) | 16 (4.2%) |
| $30,000 to $34,999 | 29 (10.3%) | 3 (0.8%) |
| $35,000 to $39,999 | 0 (0.0%) | 28 (7.4%) |
| $40,000 to $44,999 | 7 (2.5%) | 43 (11.4%) |
| $45,000 to $49,999 | 6 (2.1%) | 0 (0.0%) |
| $50,000 to $54,999 | 7 (2.5%) | 0 (0.0%) |
| $55,000 to $64,999 | 31 (11.0%) | 117 (30.9%) |
| $65,000 to $74,999 | 22 (7.8%) | 5 (1.3%) |
| $75,000 to $99,999 | 36 (12.8%) | 82 (21.7%) |
| $100,000+ | 37 (13.1%) | 10 (2.6%) |
| Total | 282 (100.0%) | 378 (100.0%) |
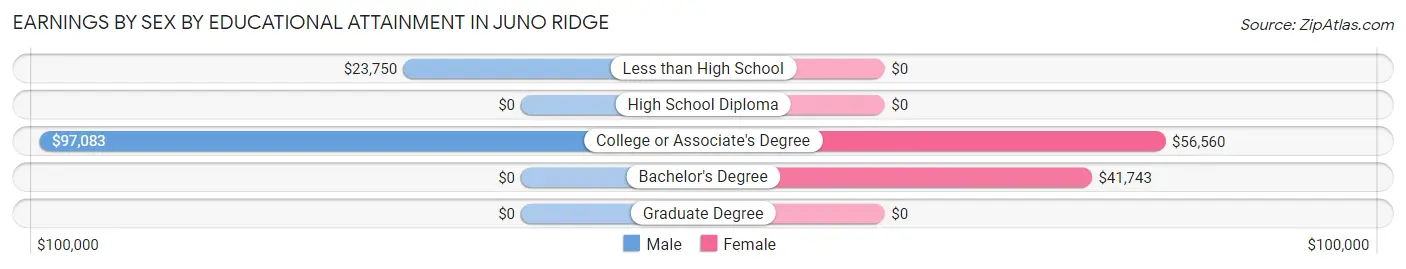
Earnings by Sex by Educational Attainment in Juno Ridge
Average earnings in Juno Ridge are $41,786 for men and $55,972 for women, a difference of 25.3%. Men with an educational attainment of college or associate's degree enjoy the highest average annual earnings of $97,083, while those with less than high school education earn the least with $23,750. Women with an educational attainment of college or associate's degree earn the most with the average annual earnings of $56,560, while those with bachelor's degree education have the smallest earnings of $41,743.
| Educational Attainment | Male Income | Female Income |
| Less than High School | $23,750 | $0 |
| High School Diploma | - | - |
| College or Associate's Degree | $97,083 | $56,560 |
| Bachelor's Degree | - | - |
| Graduate Degree | - | - |
| Total | $41,786 | $55,972 |
Family Income in Juno Ridge
Family Income Brackets in Juno Ridge
According to the Juno Ridge family income data, there are 186 families falling into the $100,000 to $149,999 income range, which is the most common income bracket and makes up 46.0% of all families.
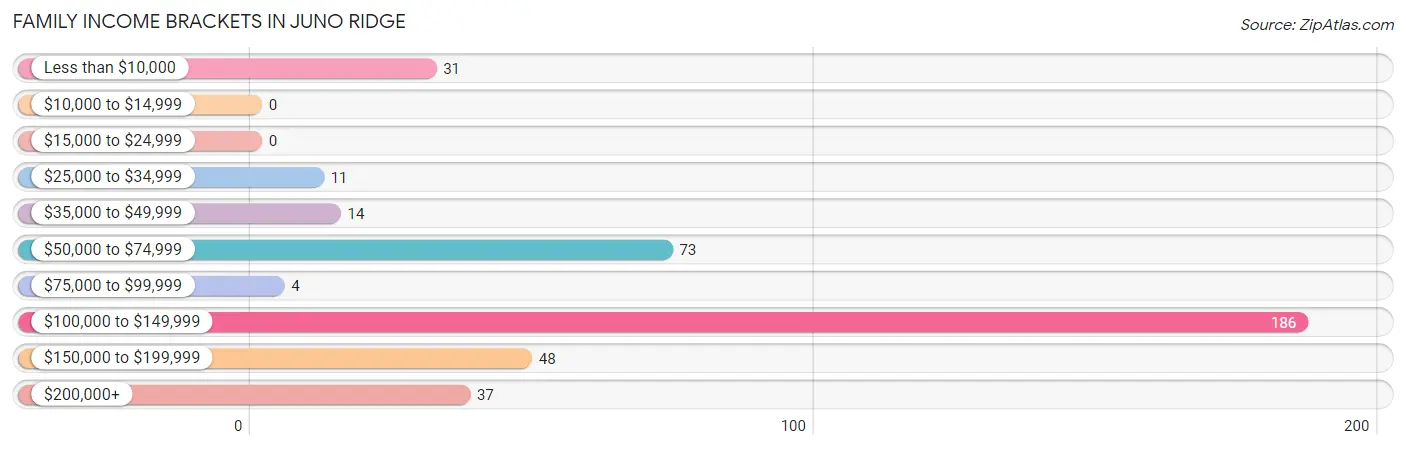
| Income Bracket | # Families | % Families |
| Less than $10,000 | 31 | 7.7% |
| $10,000 to $14,999 | 0 | 0.0% |
| $15,000 to $24,999 | 0 | 0.0% |
| $25,000 to $34,999 | 11 | 2.7% |
| $35,000 to $49,999 | 14 | 3.5% |
| $50,000 to $74,999 | 73 | 18.1% |
| $75,000 to $99,999 | 4 | 1.0% |
| $100,000 to $149,999 | 186 | 46.0% |
| $150,000 to $199,999 | 48 | 11.9% |
| $200,000+ | 37 | 9.2% |
Family Income by Famaliy Size in Juno Ridge
2-person families (308 | 76.2%) account for the highest median family income in Juno Ridge with $136,239 per family, while 2-person families (308 | 76.2%) have the highest median income of $68,120 per family member.
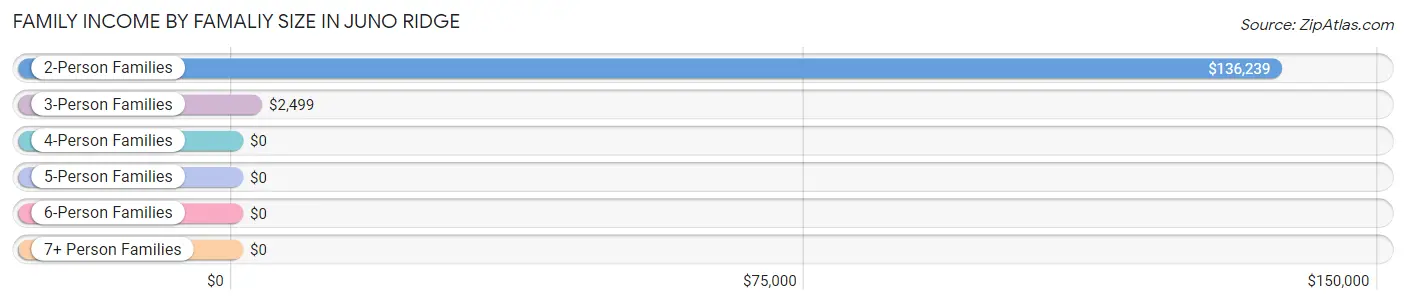
| Income Bracket | # Families | Median Income |
| 2-Person Families | 308 (76.2%) | $136,239 |
| 3-Person Families | 59 (14.6%) | $2,499 |
| 4-Person Families | 3 (0.7%) | $0 |
| 5-Person Families | 13 (3.2%) | $0 |
| 6-Person Families | 21 (5.2%) | $0 |
| 7+ Person Families | 0 (0.0%) | $0 |
| Total | 404 (100.0%) | $135,214 |
Family Income by Number of Earners in Juno Ridge
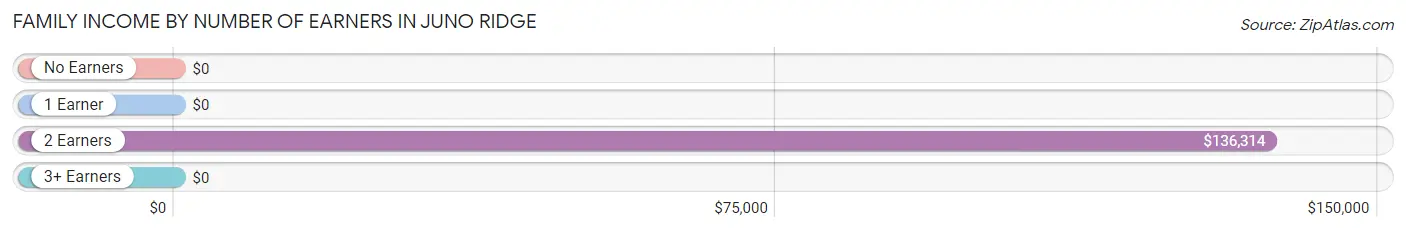
| Number of Earners | # Families | Median Income |
| No Earners | 114 (28.2%) | $0 |
| 1 Earner | 77 (19.1%) | $0 |
| 2 Earners | 209 (51.7%) | $136,314 |
| 3+ Earners | 4 (1.0%) | $0 |
| Total | 404 (100.0%) | $135,214 |
Household Income in Juno Ridge
Household Income Brackets in Juno Ridge
With 219 households falling in the category, the $100,000 to $149,999 income range is the most frequent in Juno Ridge, accounting for 34.8% of all households. In contrast, only 5 households (0.8%) fall into the less than $10,000 income bracket, making it the least populous group.
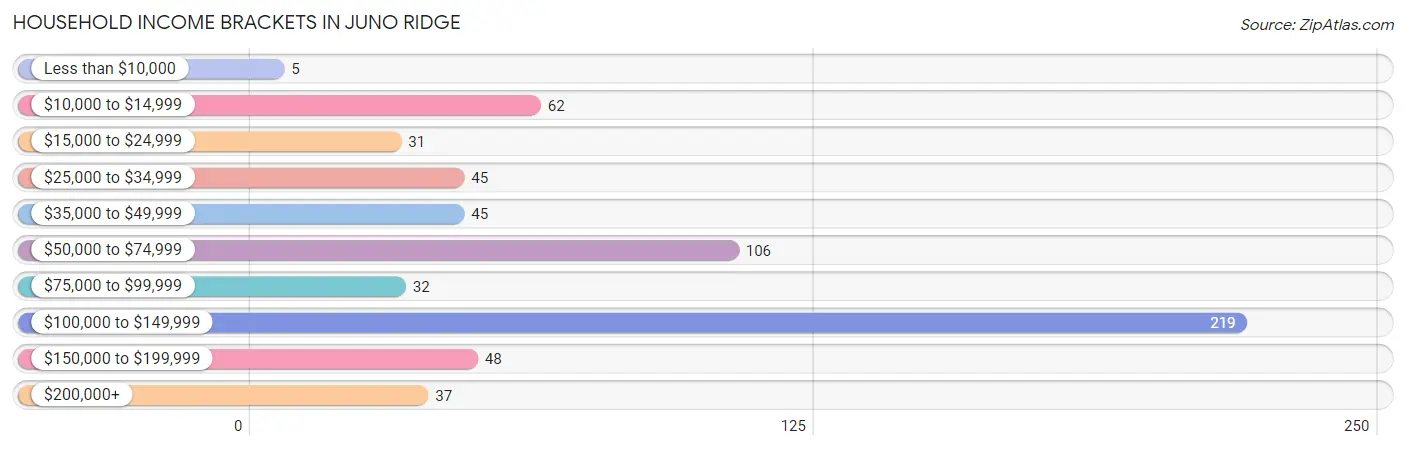
| Income Bracket | # Households | % Households |
| Less than $10,000 | 5 | 0.8% |
| $10,000 to $14,999 | 62 | 9.8% |
| $15,000 to $24,999 | 31 | 4.9% |
| $25,000 to $34,999 | 45 | 7.1% |
| $35,000 to $49,999 | 45 | 7.1% |
| $50,000 to $74,999 | 106 | 16.8% |
| $75,000 to $99,999 | 32 | 5.1% |
| $100,000 to $149,999 | 219 | 34.8% |
| $150,000 to $199,999 | 48 | 7.6% |
| $200,000+ | 37 | 5.9% |
Household Income by Householder Age in Juno Ridge
The median household income in Juno Ridge is $90,972, with the highest median household income of $135,224 found in the 25 to 44 years age bracket for the primary householder. A total of 213 households (33.8%) fall into this category. Meanwhile, the 15 to 24 years age bracket for the primary householder has the lowest median household income of $0, with 30 households (4.8%) in this group.
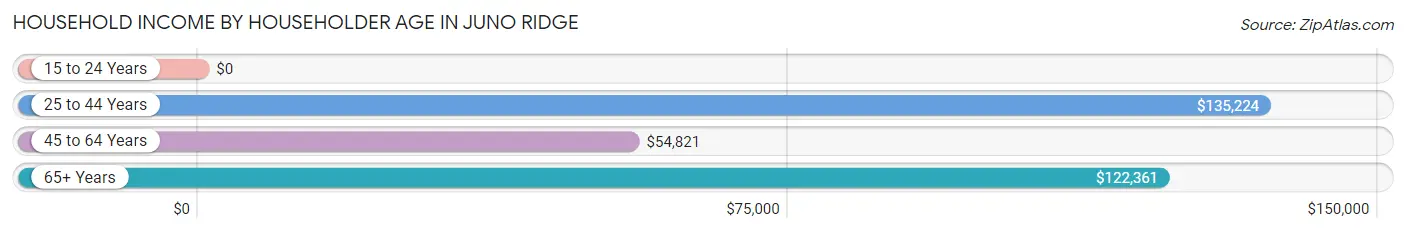
| Income Bracket | # Households | Median Income |
| 15 to 24 Years | 30 (4.8%) | $0 |
| 25 to 44 Years | 213 (33.8%) | $135,224 |
| 45 to 64 Years | 175 (27.8%) | $54,821 |
| 65+ Years | 212 (33.7%) | $122,361 |
| Total | 630 (100.0%) | $90,972 |
Poverty in Juno Ridge
Income Below Poverty by Sex and Age in Juno Ridge
With 16.4% poverty level for males and 11.5% for females among the residents of Juno Ridge, 6 to 11 year old males and 18 to 24 year old females are the most vulnerable to poverty, with 64 males (91.4%) and 27 females (42.9%) in their respective age groups living below the poverty level.
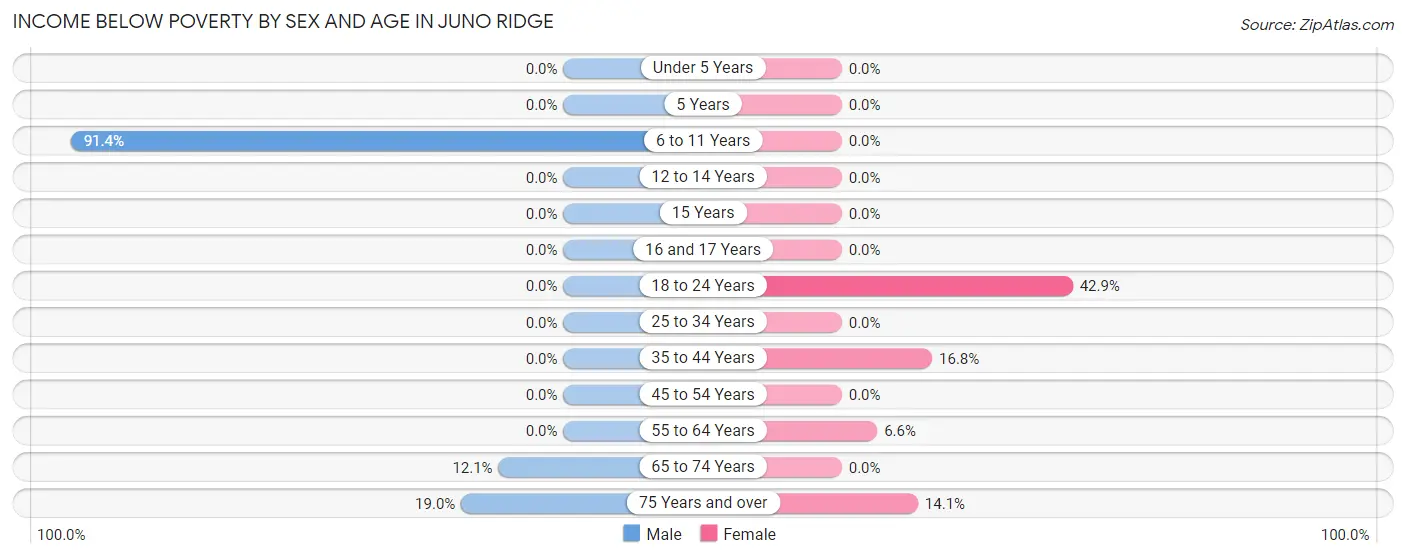
| Age Bracket | Male | Female |
| Under 5 Years | 0 (0.0%) | 0 (0.0%) |
| 5 Years | 0 (0.0%) | 0 (0.0%) |
| 6 to 11 Years | 64 (91.4%) | 0 (0.0%) |
| 12 to 14 Years | 0 (0.0%) | 0 (0.0%) |
| 15 Years | 0 (0.0%) | 0 (0.0%) |
| 16 and 17 Years | 0 (0.0%) | 0 (0.0%) |
| 18 to 24 Years | 0 (0.0%) | 27 (42.9%) |
| 25 to 34 Years | 0 (0.0%) | 0 (0.0%) |
| 35 to 44 Years | 0 (0.0%) | 31 (16.8%) |
| 45 to 54 Years | 0 (0.0%) | 0 (0.0%) |
| 55 to 64 Years | 0 (0.0%) | 5 (6.6%) |
| 65 to 74 Years | 10 (12.0%) | 0 (0.0%) |
| 75 Years and over | 22 (19.0%) | 13 (14.1%) |
| Total | 96 (16.4%) | 76 (11.5%) |
Income Above Poverty by Sex and Age in Juno Ridge
According to the poverty statistics in Juno Ridge, males aged under 5 years and females aged under 5 years are the age groups that are most secure financially, with 100.0% of males and 100.0% of females in these age groups living above the poverty line.
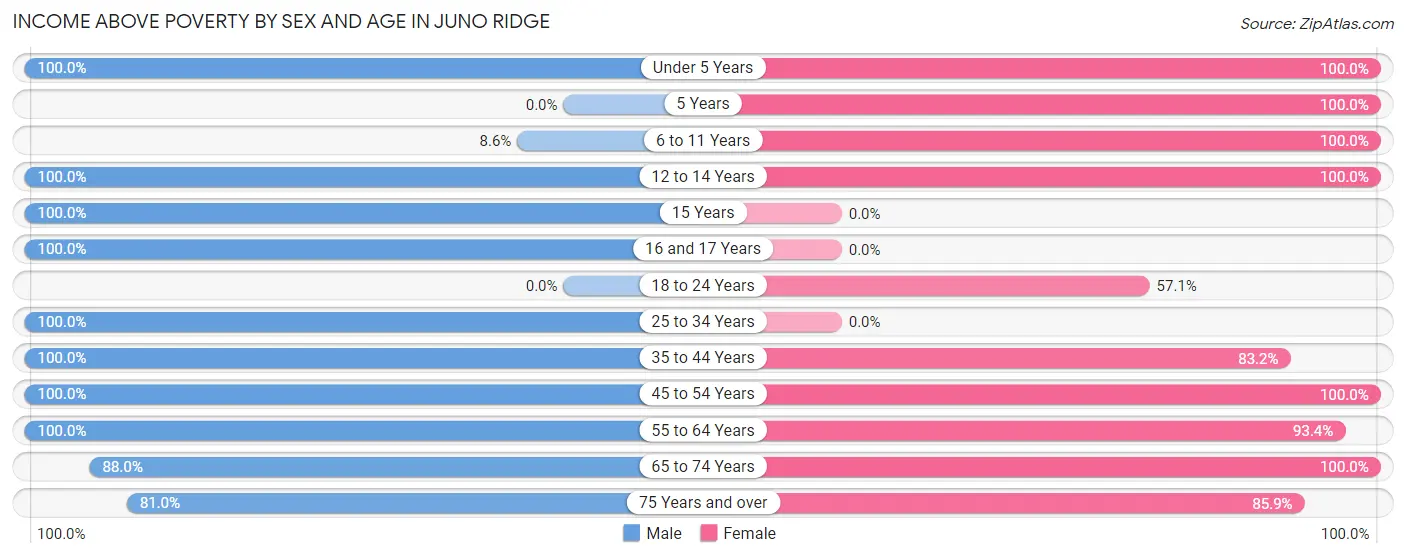
| Age Bracket | Male | Female |
| Under 5 Years | 37 (100.0%) | 31 (100.0%) |
| 5 Years | 0 (0.0%) | 5 (100.0%) |
| 6 to 11 Years | 6 (8.6%) | 16 (100.0%) |
| 12 to 14 Years | 27 (100.0%) | 12 (100.0%) |
| 15 Years | 8 (100.0%) | 0 (0.0%) |
| 16 and 17 Years | 16 (100.0%) | 0 (0.0%) |
| 18 to 24 Years | 0 (0.0%) | 36 (57.1%) |
| 25 to 34 Years | 29 (100.0%) | 0 (0.0%) |
| 35 to 44 Years | 78 (100.0%) | 154 (83.2%) |
| 45 to 54 Years | 46 (100.0%) | 43 (100.0%) |
| 55 to 64 Years | 76 (100.0%) | 71 (93.4%) |
| 65 to 74 Years | 73 (87.9%) | 136 (100.0%) |
| 75 Years and over | 94 (81.0%) | 79 (85.9%) |
| Total | 490 (83.6%) | 583 (88.5%) |
Income Below Poverty Among Married-Couple Families in Juno Ridge
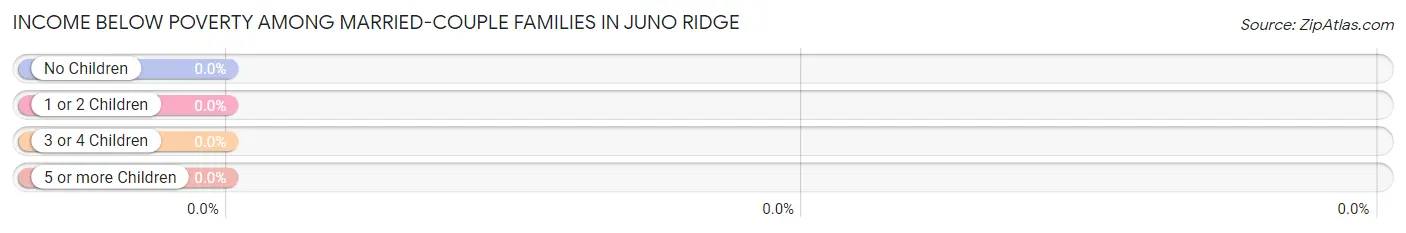
| Children | Above Poverty | Below Poverty |
| No Children | 155 (100.0%) | 0 (0.0%) |
| 1 or 2 Children | 22 (100.0%) | 0 (0.0%) |
| 3 or 4 Children | 34 (100.0%) | 0 (0.0%) |
| 5 or more Children | 0 (0.0%) | 0 (0.0%) |
| Total | 211 (100.0%) | 0 (0.0%) |
Income Below Poverty Among Single-Parent Households in Juno Ridge
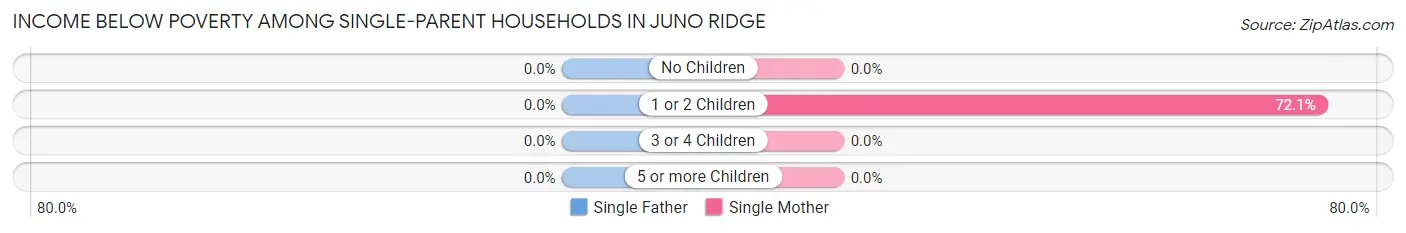
| Children | Single Father | Single Mother |
| No Children | 0 (0.0%) | 0 (0.0%) |
| 1 or 2 Children | 0 (0.0%) | 31 (72.1%) |
| 3 or 4 Children | 0 (0.0%) | 0 (0.0%) |
| 5 or more Children | 0 (0.0%) | 0 (0.0%) |
| Total | 0 (0.0%) | 31 (18.9%) |
Income Below Poverty Among Married-Couple vs Single-Parent Households in Juno Ridge
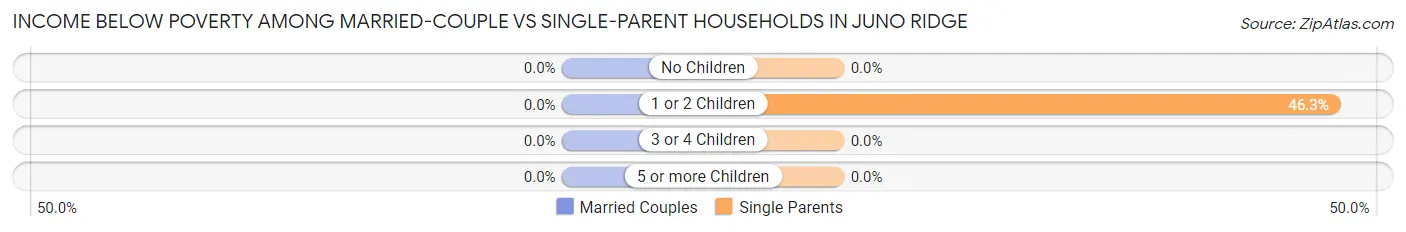
| Children | Married-Couple Families | Single-Parent Households |
| No Children | 0 (0.0%) | 0 (0.0%) |
| 1 or 2 Children | 0 (0.0%) | 31 (46.3%) |
| 3 or 4 Children | 0 (0.0%) | 0 (0.0%) |
| 5 or more Children | 0 (0.0%) | 0 (0.0%) |
| Total | 0 (0.0%) | 31 (16.1%) |
Race in Juno Ridge
The most populous races in Juno Ridge are White / Caucasian (899 | 72.2%), Hispanic or Latino (328 | 26.4%), and Some other Race (196 | 15.7%).
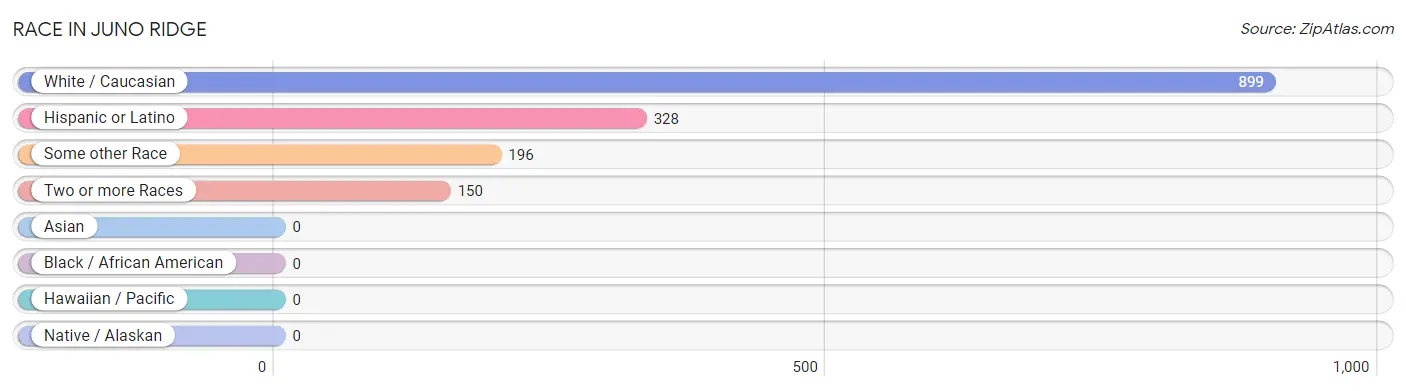
| Race | # Population | % Population |
| Asian | 0 | 0.0% |
| Black / African American | 0 | 0.0% |
| Hawaiian / Pacific | 0 | 0.0% |
| Hispanic or Latino | 328 | 26.4% |
| Native / Alaskan | 0 | 0.0% |
| White / Caucasian | 899 | 72.2% |
| Two or more Races | 150 | 12.0% |
| Some other Race | 196 | 15.7% |
| Total | 1,245 | 100.0% |
Ancestry in Juno Ridge
The most populous ancestries reported in Juno Ridge are Central American (312 | 25.1%), Guatemalan (309 | 24.8%), Greek (199 | 16.0%), Irish (148 | 11.9%), and English (96 | 7.7%), together accounting for 85.5% of all Juno Ridge residents.
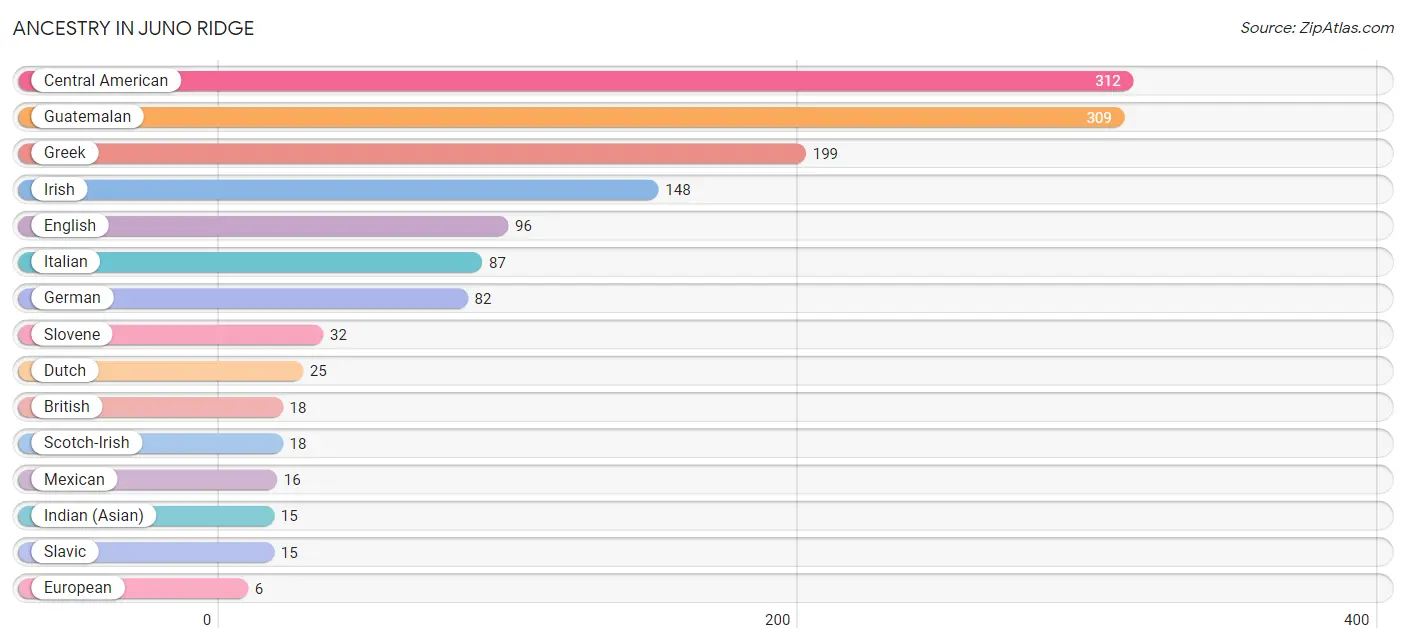
| Ancestry | # Population | % Population |
| British | 18 | 1.5% |
| Central American | 312 | 25.1% |
| Dutch | 25 | 2.0% |
| English | 96 | 7.7% |
| European | 6 | 0.5% |
| German | 82 | 6.6% |
| Greek | 199 | 16.0% |
| Guatemalan | 309 | 24.8% |
| Hungarian | 3 | 0.2% |
| Indian (Asian) | 15 | 1.2% |
| Irish | 148 | 11.9% |
| Iroquois | 4 | 0.3% |
| Italian | 87 | 7.0% |
| Jamaican | 5 | 0.4% |
| Mexican | 16 | 1.3% |
| Salvadoran | 3 | 0.2% |
| Scotch-Irish | 18 | 1.5% |
| Scottish | 5 | 0.4% |
| Slavic | 15 | 1.2% |
| Slovene | 32 | 2.6% |
| Swedish | 6 | 0.5% | View All 21 Rows |
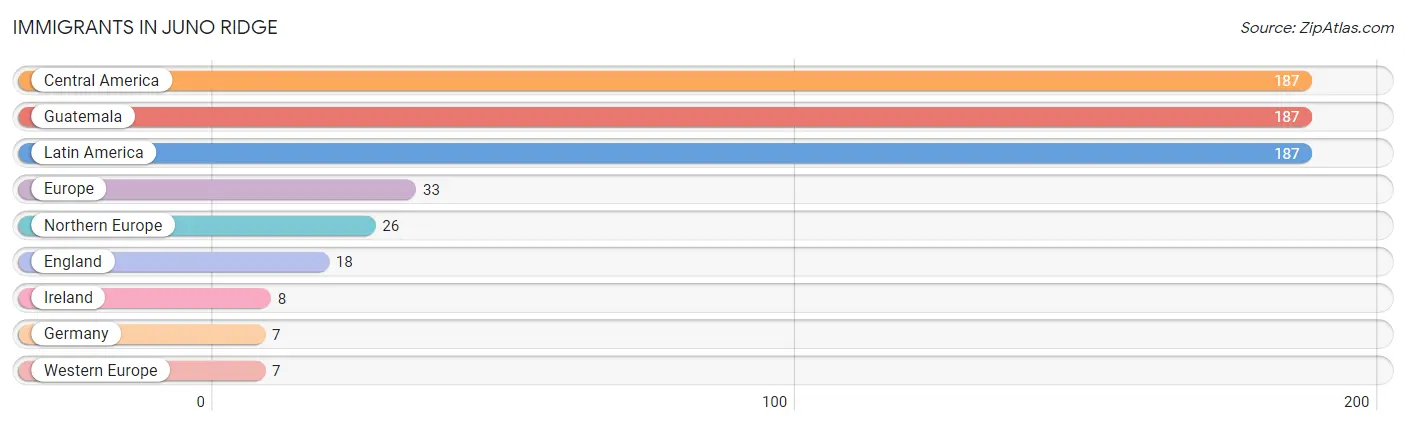
Immigrants in Juno Ridge
The most numerous immigrant groups reported in Juno Ridge came from Central America (187 | 15.0%), Guatemala (187 | 15.0%), Latin America (187 | 15.0%), Europe (33 | 2.6%), and Northern Europe (26 | 2.1%), together accounting for 49.8% of all Juno Ridge residents.
| Immigration Origin | # Population | % Population |
| Central America | 187 | 15.0% |
| England | 18 | 1.5% |
| Europe | 33 | 2.6% |
| Germany | 7 | 0.6% |
| Guatemala | 187 | 15.0% |
| Ireland | 8 | 0.6% |
| Latin America | 187 | 15.0% |
| Northern Europe | 26 | 2.1% |
| Western Europe | 7 | 0.6% | View All 9 Rows |
Sex and Age in Juno Ridge
Sex and Age in Juno Ridge
The most populous age groups in Juno Ridge are 40 to 44 Years (78 | 13.3%) for men and 40 to 44 Years (133 | 20.2%) for women.
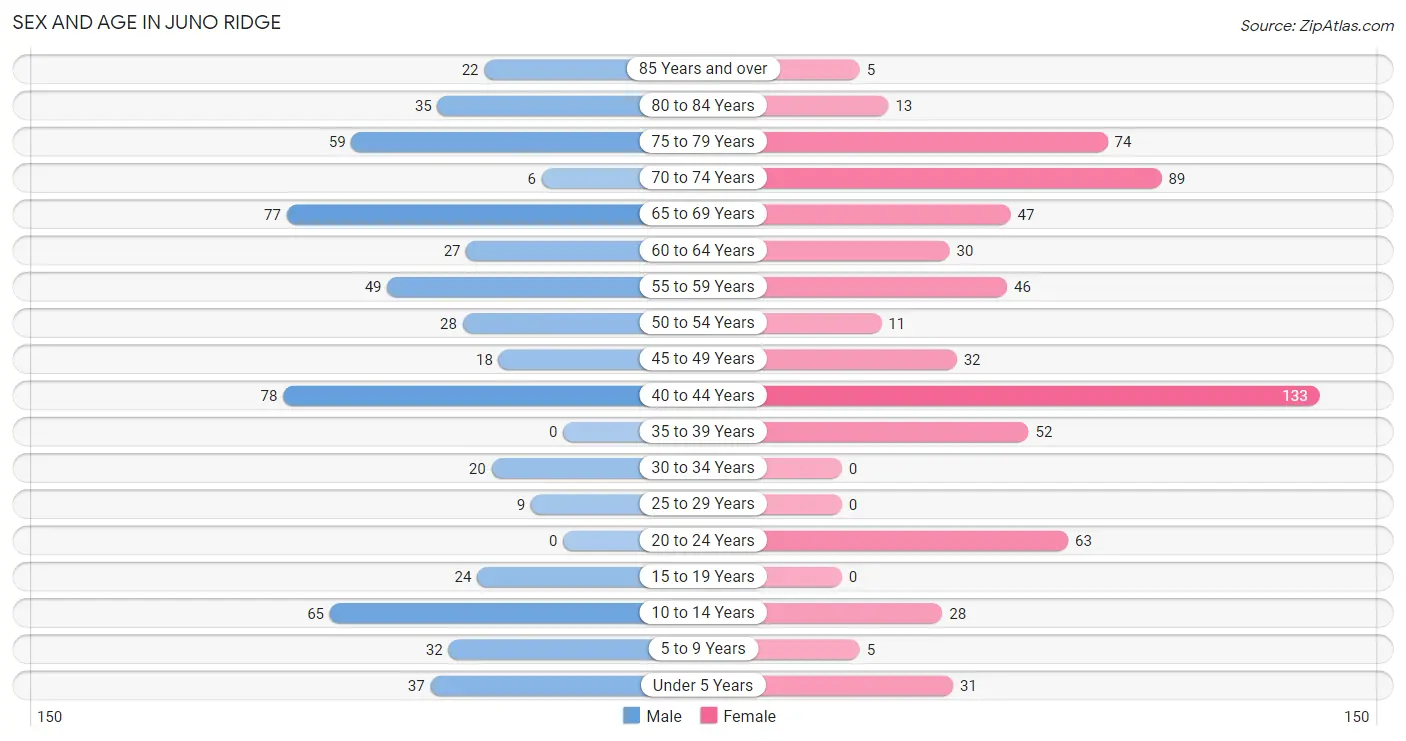
| Age Bracket | Male | Female |
| Under 5 Years | 37 (6.3%) | 31 (4.7%) |
| 5 to 9 Years | 32 (5.5%) | 5 (0.8%) |
| 10 to 14 Years | 65 (11.1%) | 28 (4.3%) |
| 15 to 19 Years | 24 (4.1%) | 0 (0.0%) |
| 20 to 24 Years | 0 (0.0%) | 63 (9.6%) |
| 25 to 29 Years | 9 (1.5%) | 0 (0.0%) |
| 30 to 34 Years | 20 (3.4%) | 0 (0.0%) |
| 35 to 39 Years | 0 (0.0%) | 52 (7.9%) |
| 40 to 44 Years | 78 (13.3%) | 133 (20.2%) |
| 45 to 49 Years | 18 (3.1%) | 32 (4.9%) |
| 50 to 54 Years | 28 (4.8%) | 11 (1.7%) |
| 55 to 59 Years | 49 (8.4%) | 46 (7.0%) |
| 60 to 64 Years | 27 (4.6%) | 30 (4.5%) |
| 65 to 69 Years | 77 (13.1%) | 47 (7.1%) |
| 70 to 74 Years | 6 (1.0%) | 89 (13.5%) |
| 75 to 79 Years | 59 (10.1%) | 74 (11.2%) |
| 80 to 84 Years | 35 (6.0%) | 13 (2.0%) |
| 85 Years and over | 22 (3.7%) | 5 (0.8%) |
| Total | 586 (100.0%) | 659 (100.0%) |
Families and Households in Juno Ridge
Median Family Size in Juno Ridge
The median family size in Juno Ridge is 2.39 persons per family, with married-couple families (211 | 52.2%) accounting for the largest median family size of 2.7 persons per family. On the other hand, single male/father families (29 | 7.2%) represent the smallest median family size with 2.00 persons per family.
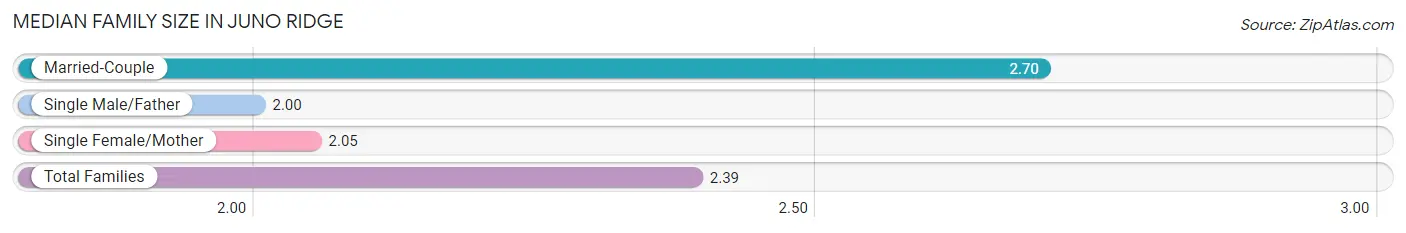
| Family Type | # Families | Family Size |
| Married-Couple | 211 (52.2%) | 2.70 |
| Single Male/Father | 29 (7.2%) | 2.00 |
| Single Female/Mother | 164 (40.6%) | 2.05 |
| Total Families | 404 (100.0%) | 2.39 |
Median Household Size in Juno Ridge
The median household size in Juno Ridge is 1.97 persons per household, with married-couple households (211 | 33.5%) accounting for the largest median household size of 2.73 persons per household. non-family households (226 | 35.9%) represent the smallest median household size with 1.04 persons per household.
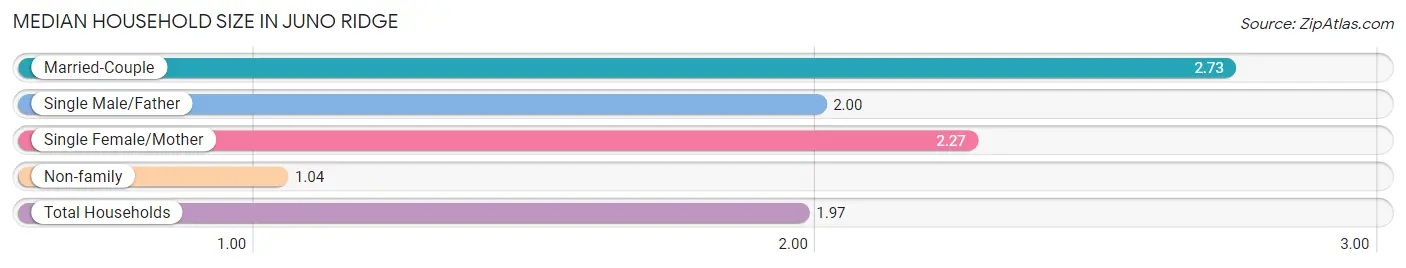
| Household Type | # Households | Household Size |
| Married-Couple | 211 (33.5%) | 2.73 |
| Single Male/Father | 29 (4.6%) | 2.00 |
| Single Female/Mother | 164 (26.0%) | 2.27 |
| Non-family | 226 (35.9%) | 1.04 |
| Total Households | 630 (100.0%) | 1.97 |
Household Size by Marriage Status in Juno Ridge
Out of a total of 630 households in Juno Ridge, 404 (64.1%) are family households, while 226 (35.9%) are nonfamily households. The most numerous type of family households are 2-person households, comprising 308, and the most common type of nonfamily households are 1-person households, comprising 218.
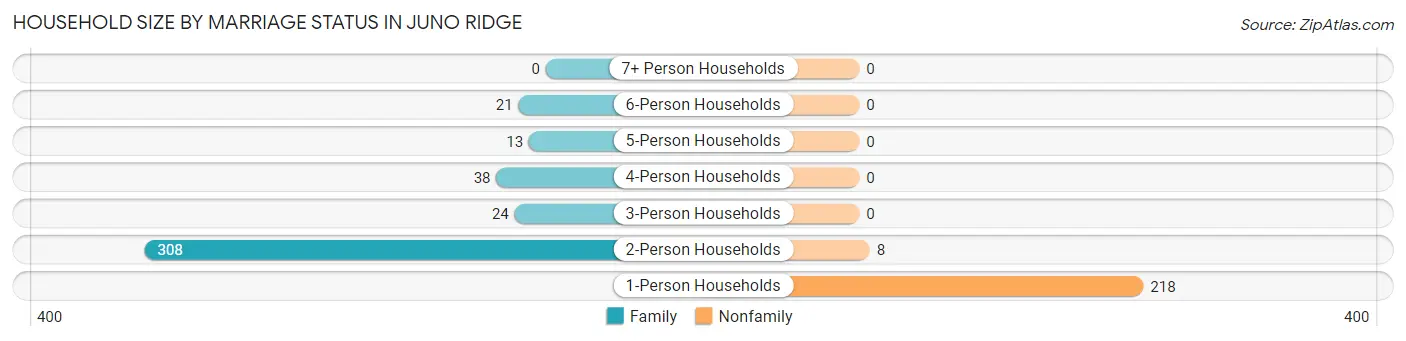
| Household Size | Family Households | Nonfamily Households |
| 1-Person Households | - | 218 (34.6%) |
| 2-Person Households | 308 (48.9%) | 8 (1.3%) |
| 3-Person Households | 24 (3.8%) | 0 (0.0%) |
| 4-Person Households | 38 (6.0%) | 0 (0.0%) |
| 5-Person Households | 13 (2.1%) | 0 (0.0%) |
| 6-Person Households | 21 (3.3%) | 0 (0.0%) |
| 7+ Person Households | 0 (0.0%) | 0 (0.0%) |
| Total | 404 (64.1%) | 226 (35.9%) |
Female Fertility in Juno Ridge
Fertility by Age in Juno Ridge
Average fertility rate in Juno Ridge is 79.0 births per 1,000 women. Women in the age bracket of 20 to 34 years have the highest fertility rate with 349.0 births per 1,000 women. Women in the age bracket of 20 to 34 years acount for 100.0% of all women with births.
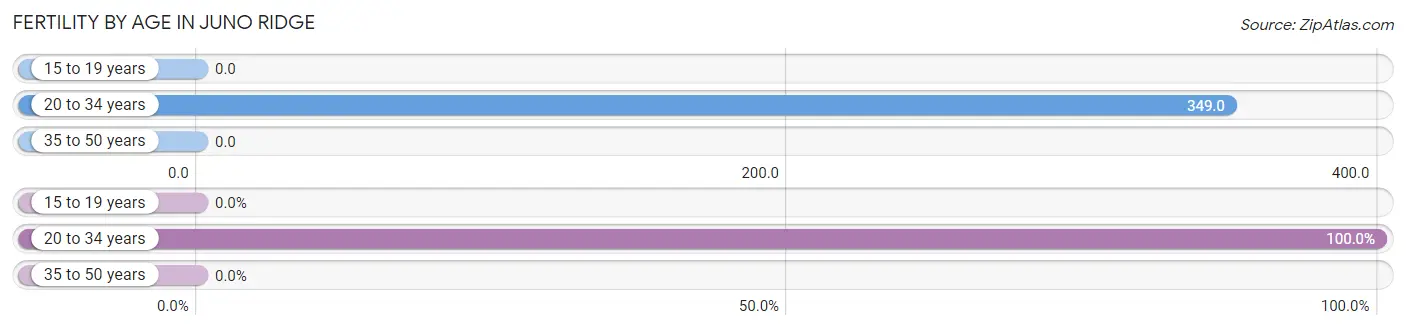
| Age Bracket | Women with Births | Births / 1,000 Women |
| 15 to 19 years | 0 (0.0%) | 0.0 |
| 20 to 34 years | 22 (100.0%) | 349.0 |
| 35 to 50 years | 0 (0.0%) | 0.0 |
| Total | 22 (100.0%) | 79.0 |
Fertility by Age by Marriage Status in Juno Ridge
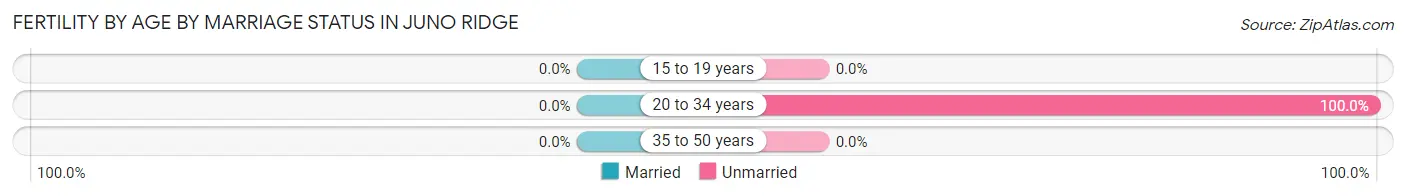
| Age Bracket | Married | Unmarried |
| 15 to 19 years | 0 (0.0%) | 0 (0.0%) |
| 20 to 34 years | 0 (0.0%) | 22 (100.0%) |
| 35 to 50 years | 0 (0.0%) | 0 (0.0%) |
| Total | 0 (0.0%) | 22 (100.0%) |
Fertility by Education in Juno Ridge
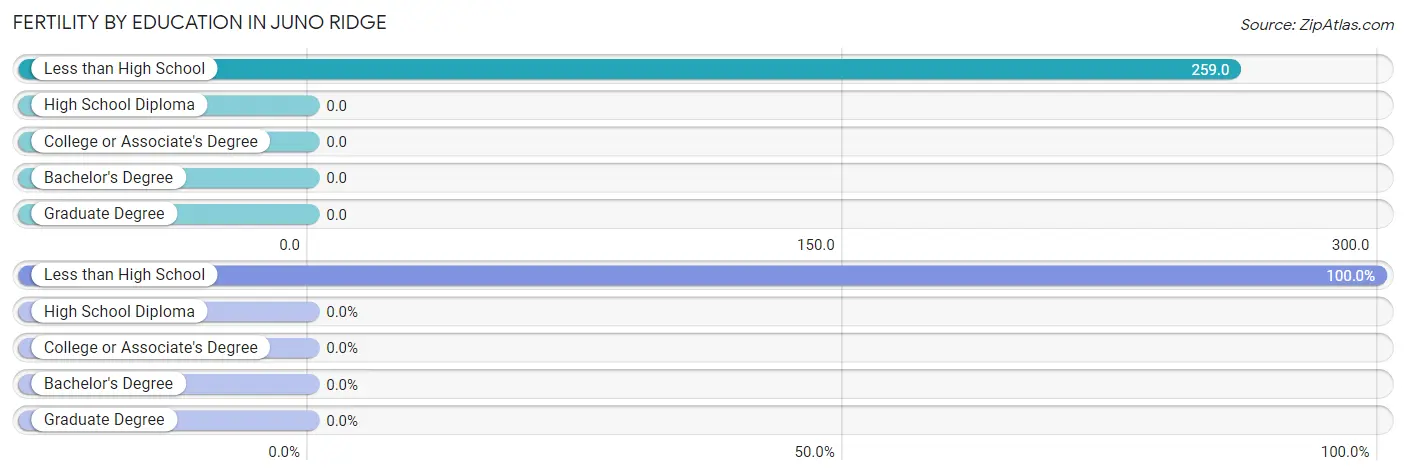
| Educational Attainment | Women with Births | Births / 1,000 Women |
| Less than High School | 22 (100.0%) | 259.0 |
| High School Diploma | 0 (0.0%) | 0.0 |
| College or Associate's Degree | 0 (0.0%) | 0.0 |
| Bachelor's Degree | 0 (0.0%) | 0.0 |
| Graduate Degree | 0 (0.0%) | 0.0 |
| Total | 22 (100.0%) | 79.0 |
Fertility by Education by Marriage Status in Juno Ridge
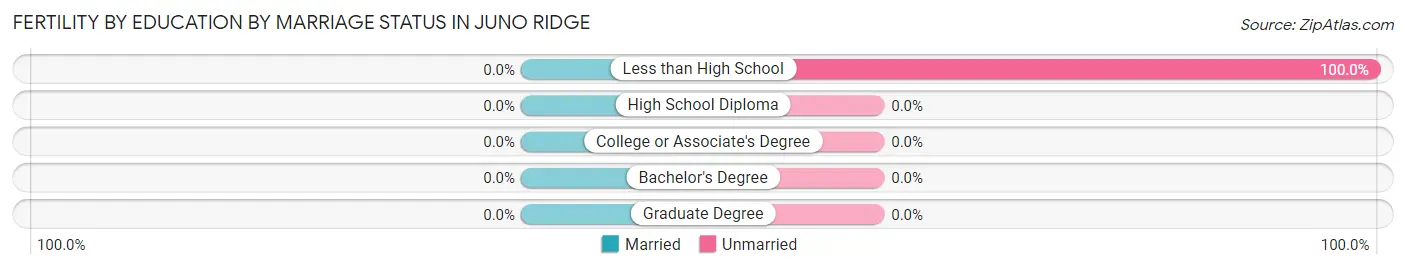
| Educational Attainment | Married | Unmarried |
| Less than High School | 0 (0.0%) | 22 (100.0%) |
| High School Diploma | 0 (0.0%) | 0 (0.0%) |
| College or Associate's Degree | 0 (0.0%) | 0 (0.0%) |
| Bachelor's Degree | 0 (0.0%) | 0 (0.0%) |
| Graduate Degree | 0 (0.0%) | 0 (0.0%) |
| Total | 0 (0.0%) | 22 (100.0%) |
Employment Characteristics in Juno Ridge
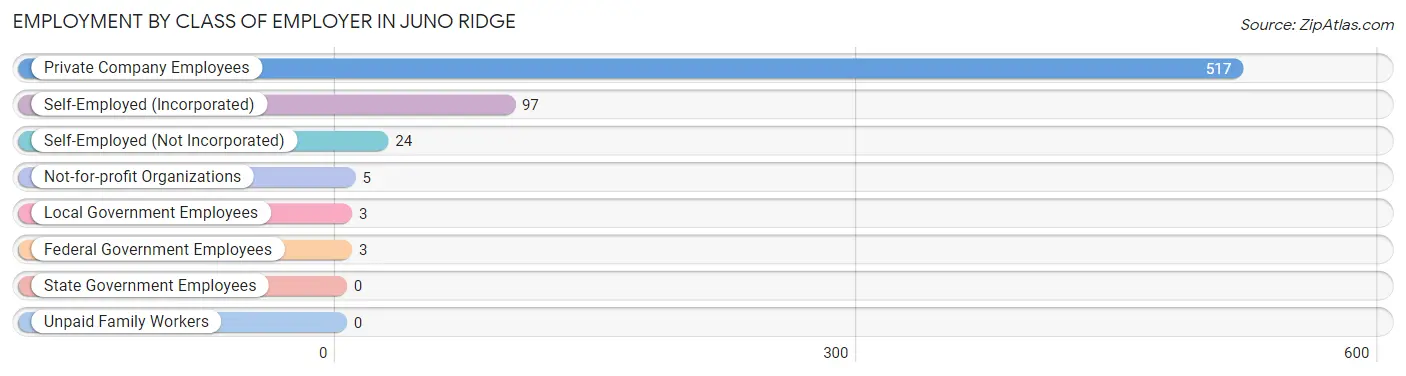
Employment by Class of Employer in Juno Ridge
Among the 649 employed individuals in Juno Ridge, private company employees (517 | 79.7%), self-employed (incorporated) (97 | 14.9%), and self-employed (not incorporated) (24 | 3.7%) make up the most common classes of employment.
| Employer Class | # Employees | % Employees |
| Private Company Employees | 517 | 79.7% |
| Self-Employed (Incorporated) | 97 | 14.9% |
| Self-Employed (Not Incorporated) | 24 | 3.7% |
| Not-for-profit Organizations | 5 | 0.8% |
| Local Government Employees | 3 | 0.5% |
| State Government Employees | 0 | 0.0% |
| Federal Government Employees | 3 | 0.5% |
| Unpaid Family Workers | 0 | 0.0% |
| Total | 649 | 100.0% |
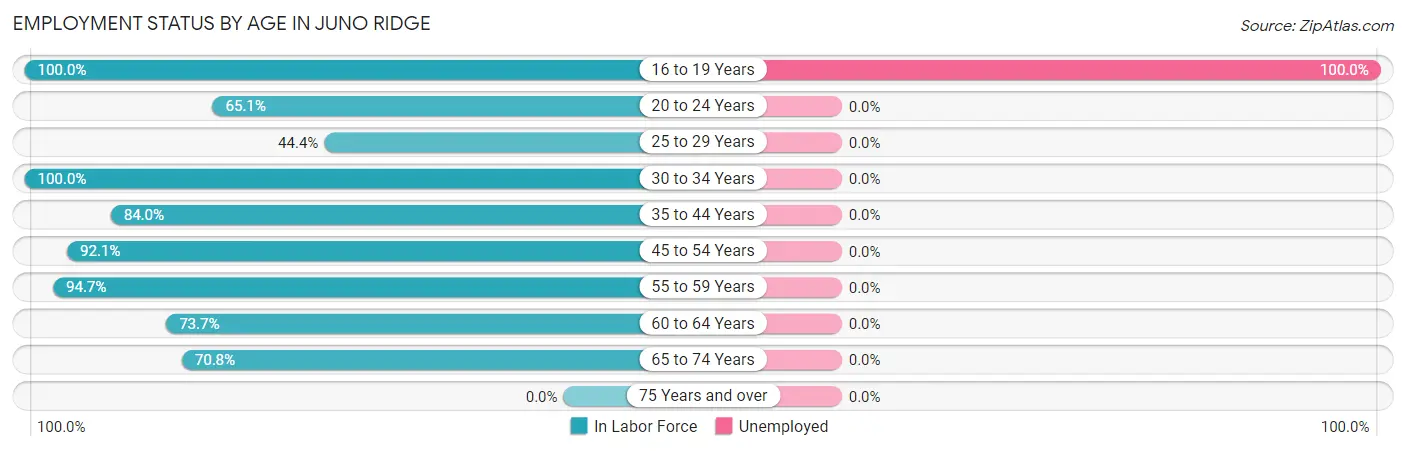
Employment Status by Age in Juno Ridge
According to the labor force statistics for Juno Ridge, out of the total population over 16 years of age (1,039), 64.6% or 671 individuals are in the labor force, with 2.4% or 16 of them unemployed. The age group with the highest labor force participation rate is 16 to 19 years, with 100.0% or 16 individuals in the labor force. Within the labor force, the 16 to 19 years age range has the highest percentage of unemployed individuals, with 100.0% or 16 of them being unemployed.
| Age Bracket | In Labor Force | Unemployed |
| 16 to 19 Years | 16 (100.0%) | 16 (100.0%) |
| 20 to 24 Years | 41 (65.1%) | 0 (0.0%) |
| 25 to 29 Years | 4 (44.4%) | 0 (0.0%) |
| 30 to 34 Years | 20 (100.0%) | 0 (0.0%) |
| 35 to 44 Years | 221 (84.0%) | 0 (0.0%) |
| 45 to 54 Years | 82 (92.1%) | 0 (0.0%) |
| 55 to 59 Years | 90 (94.7%) | 0 (0.0%) |
| 60 to 64 Years | 42 (73.7%) | 0 (0.0%) |
| 65 to 74 Years | 155 (70.8%) | 0 (0.0%) |
| 75 Years and over | 0 (0.0%) | 0 (0.0%) |
| Total | 671 (64.6%) | 16 (2.4%) |
Employment Status by Educational Attainment in Juno Ridge
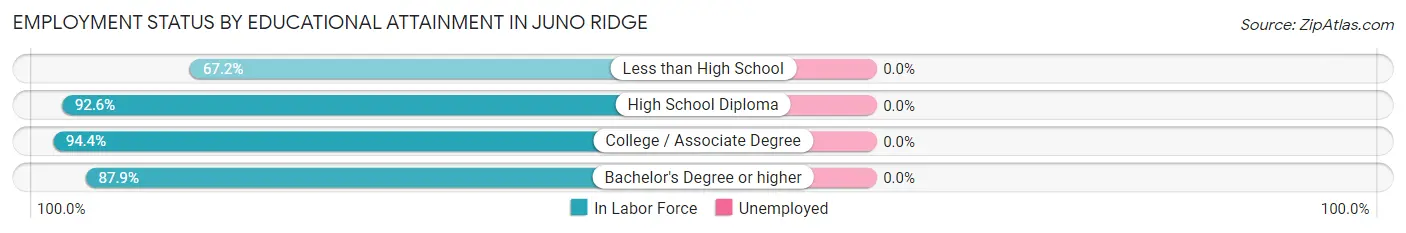
| Educational Attainment | In Labor Force | Unemployed |
| Less than High School | 86 (67.2%) | 0 (0.0%) |
| High School Diploma | 63 (92.6%) | 0 (0.0%) |
| College / Associate Degree | 201 (94.4%) | 0 (0.0%) |
| Bachelor's Degree or higher | 109 (87.9%) | 0 (0.0%) |
| Total | 459 (86.1%) | 0 (0.0%) |
Employment Occupations by Sex in Juno Ridge
Management, Business, Science and Arts Occupations
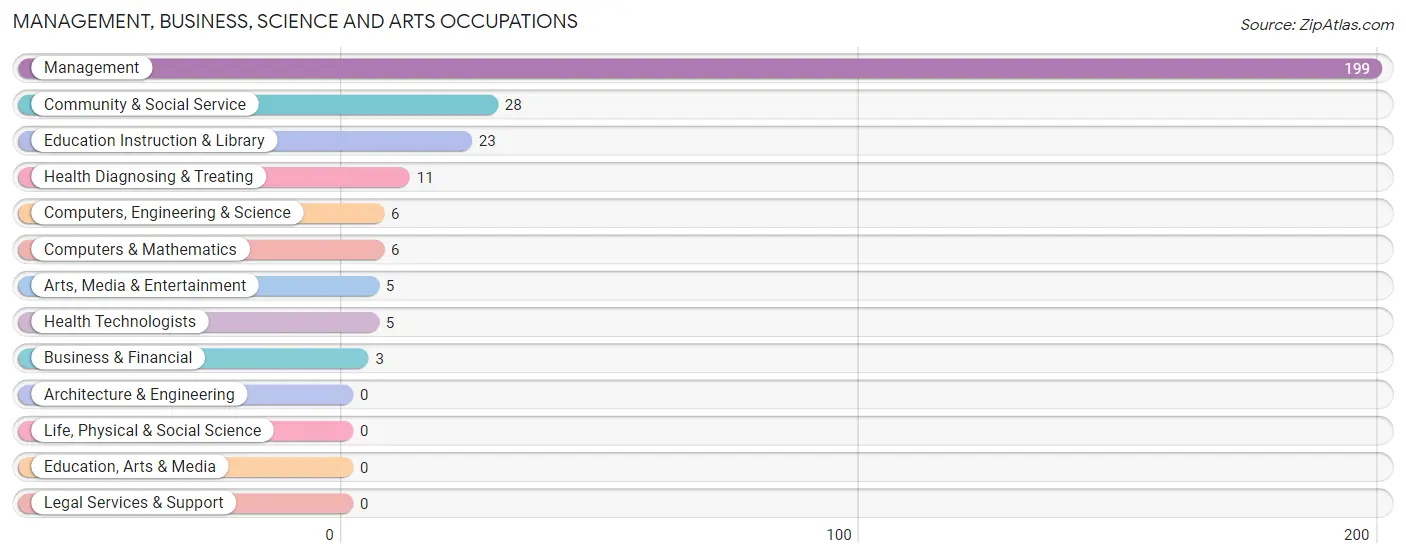
The most common Management, Business, Science and Arts occupations in Juno Ridge are Management (199 | 30.4%), Community & Social Service (28 | 4.3%), Education Instruction & Library (23 | 3.5%), Health Diagnosing & Treating (11 | 1.7%), and Computers, Engineering & Science (6 | 0.9%).
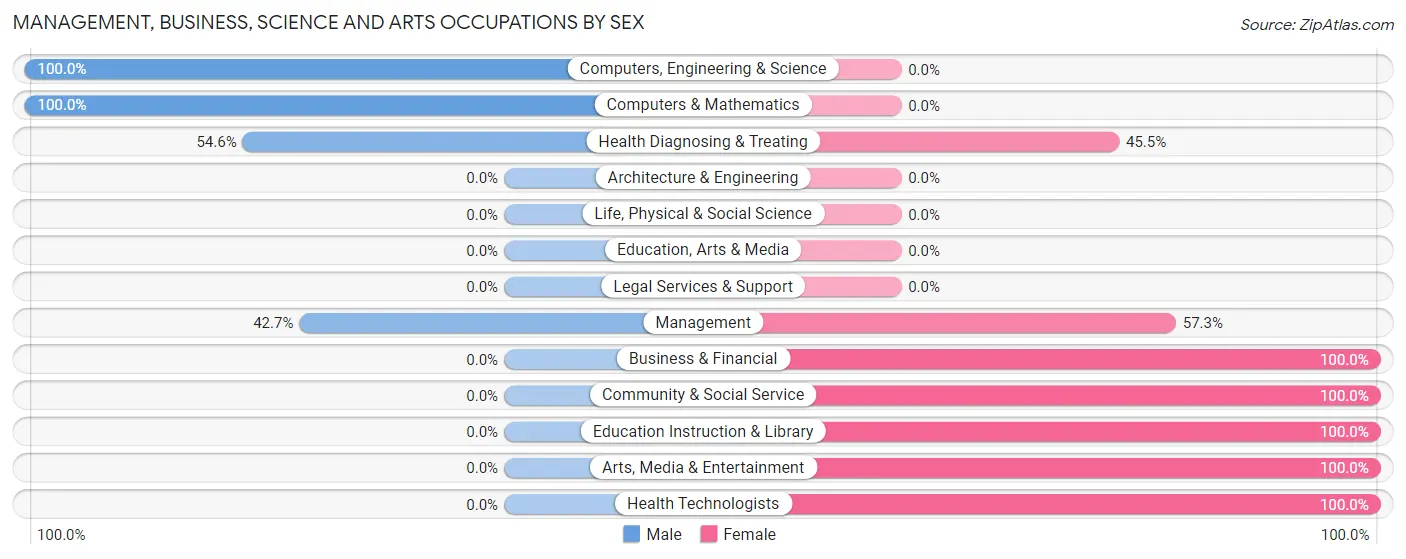
Management, Business, Science and Arts Occupations by Sex
Within the Management, Business, Science and Arts occupations in Juno Ridge, the most male-oriented occupations are Computers, Engineering & Science (100.0%), Computers & Mathematics (100.0%), and Health Diagnosing & Treating (54.5%), while the most female-oriented occupations are Business & Financial (100.0%), Community & Social Service (100.0%), and Education Instruction & Library (100.0%).
| Occupation | Male | Female |
| Management | 85 (42.7%) | 114 (57.3%) |
| Business & Financial | 0 (0.0%) | 3 (100.0%) |
| Computers, Engineering & Science | 6 (100.0%) | 0 (0.0%) |
| Computers & Mathematics | 6 (100.0%) | 0 (0.0%) |
| Architecture & Engineering | 0 (0.0%) | 0 (0.0%) |
| Life, Physical & Social Science | 0 (0.0%) | 0 (0.0%) |
| Community & Social Service | 0 (0.0%) | 28 (100.0%) |
| Education, Arts & Media | 0 (0.0%) | 0 (0.0%) |
| Legal Services & Support | 0 (0.0%) | 0 (0.0%) |
| Education Instruction & Library | 0 (0.0%) | 23 (100.0%) |
| Arts, Media & Entertainment | 0 (0.0%) | 5 (100.0%) |
| Health Diagnosing & Treating | 6 (54.5%) | 5 (45.5%) |
| Health Technologists | 0 (0.0%) | 5 (100.0%) |
| Total (Category) | 97 (39.3%) | 150 (60.7%) |
| Total (Overall) | 277 (42.3%) | 378 (57.7%) |
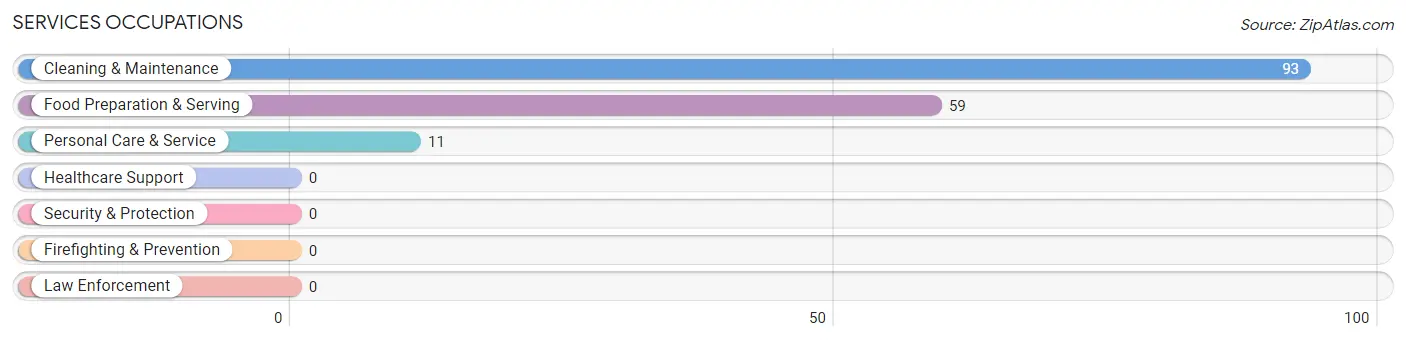
Services Occupations
The most common Services occupations in Juno Ridge are Cleaning & Maintenance (93 | 14.2%), Food Preparation & Serving (59 | 9.0%), and Personal Care & Service (11 | 1.7%).
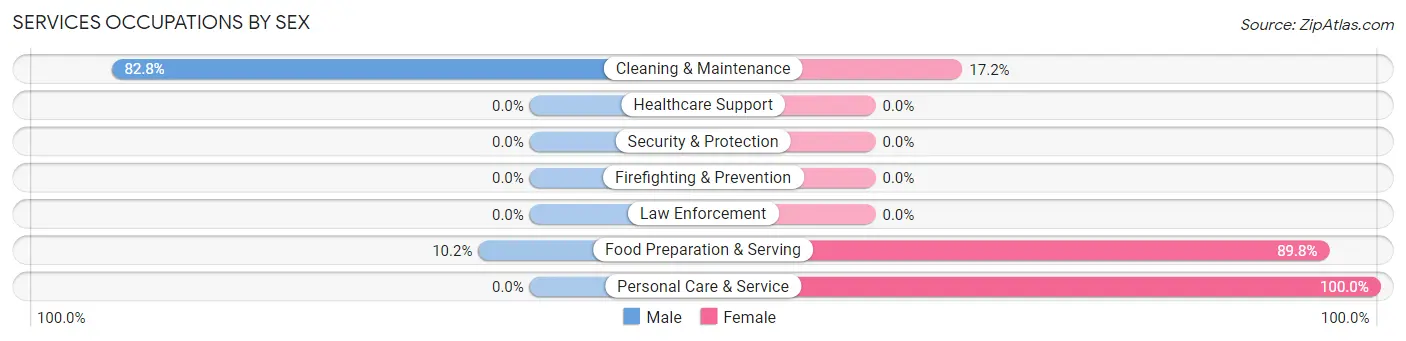
Services Occupations by Sex
Within the Services occupations in Juno Ridge, the most male-oriented occupations are Cleaning & Maintenance (82.8%), and Food Preparation & Serving (10.2%), while the most female-oriented occupations are Personal Care & Service (100.0%), Food Preparation & Serving (89.8%), and Cleaning & Maintenance (17.2%).
| Occupation | Male | Female |
| Healthcare Support | 0 (0.0%) | 0 (0.0%) |
| Security & Protection | 0 (0.0%) | 0 (0.0%) |
| Firefighting & Prevention | 0 (0.0%) | 0 (0.0%) |
| Law Enforcement | 0 (0.0%) | 0 (0.0%) |
| Food Preparation & Serving | 6 (10.2%) | 53 (89.8%) |
| Cleaning & Maintenance | 77 (82.8%) | 16 (17.2%) |
| Personal Care & Service | 0 (0.0%) | 11 (100.0%) |
| Total (Category) | 83 (50.9%) | 80 (49.1%) |
| Total (Overall) | 277 (42.3%) | 378 (57.7%) |
Sales and Office Occupations
The most common Sales and Office occupations in Juno Ridge are Office & Administration (128 | 19.5%), and Sales & Related (33 | 5.0%).
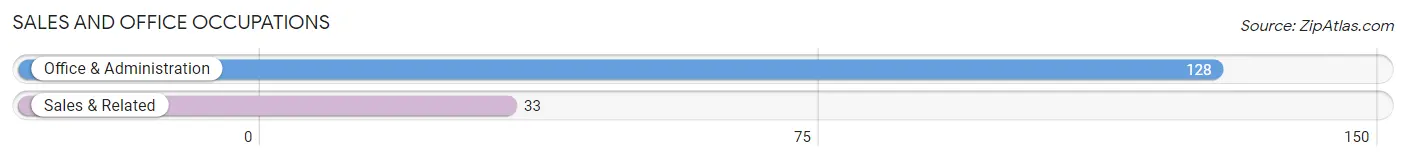
Sales and Office Occupations by Sex

| Occupation | Male | Female |
| Sales & Related | 12 (36.4%) | 21 (63.6%) |
| Office & Administration | 11 (8.6%) | 117 (91.4%) |
| Total (Category) | 23 (14.3%) | 138 (85.7%) |
| Total (Overall) | 277 (42.3%) | 378 (57.7%) |
Natural Resources, Construction and Maintenance Occupations
The most common Natural Resources, Construction and Maintenance occupations in Juno Ridge are Construction & Extraction (28 | 4.3%), and Installation, Maintenance & Repair (4 | 0.6%).
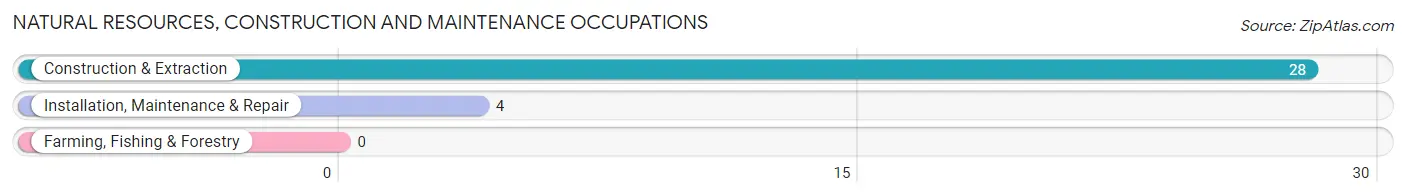
Natural Resources, Construction and Maintenance Occupations by Sex
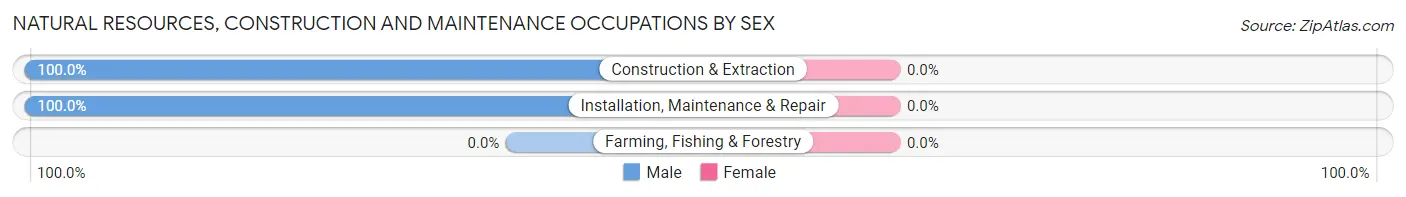
| Occupation | Male | Female |
| Farming, Fishing & Forestry | 0 (0.0%) | 0 (0.0%) |
| Construction & Extraction | 28 (100.0%) | 0 (0.0%) |
| Installation, Maintenance & Repair | 4 (100.0%) | 0 (0.0%) |
| Total (Category) | 32 (100.0%) | 0 (0.0%) |
| Total (Overall) | 277 (42.3%) | 378 (57.7%) |
Production, Transportation and Moving Occupations
The most common Production, Transportation and Moving occupations in Juno Ridge are Transportation (36 | 5.5%), and Production (16 | 2.4%).
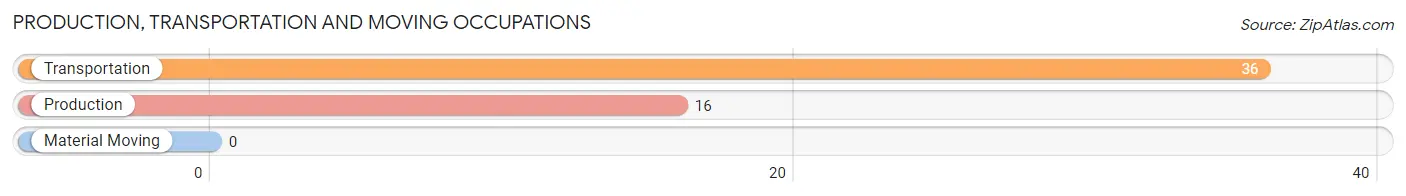
Production, Transportation and Moving Occupations by Sex
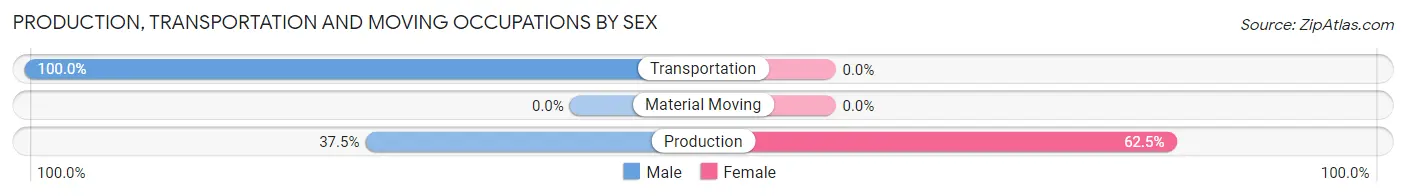
| Occupation | Male | Female |
| Production | 6 (37.5%) | 10 (62.5%) |
| Transportation | 36 (100.0%) | 0 (0.0%) |
| Material Moving | 0 (0.0%) | 0 (0.0%) |
| Total (Category) | 42 (80.8%) | 10 (19.2%) |
| Total (Overall) | 277 (42.3%) | 378 (57.7%) |
Employment Industries by Sex in Juno Ridge
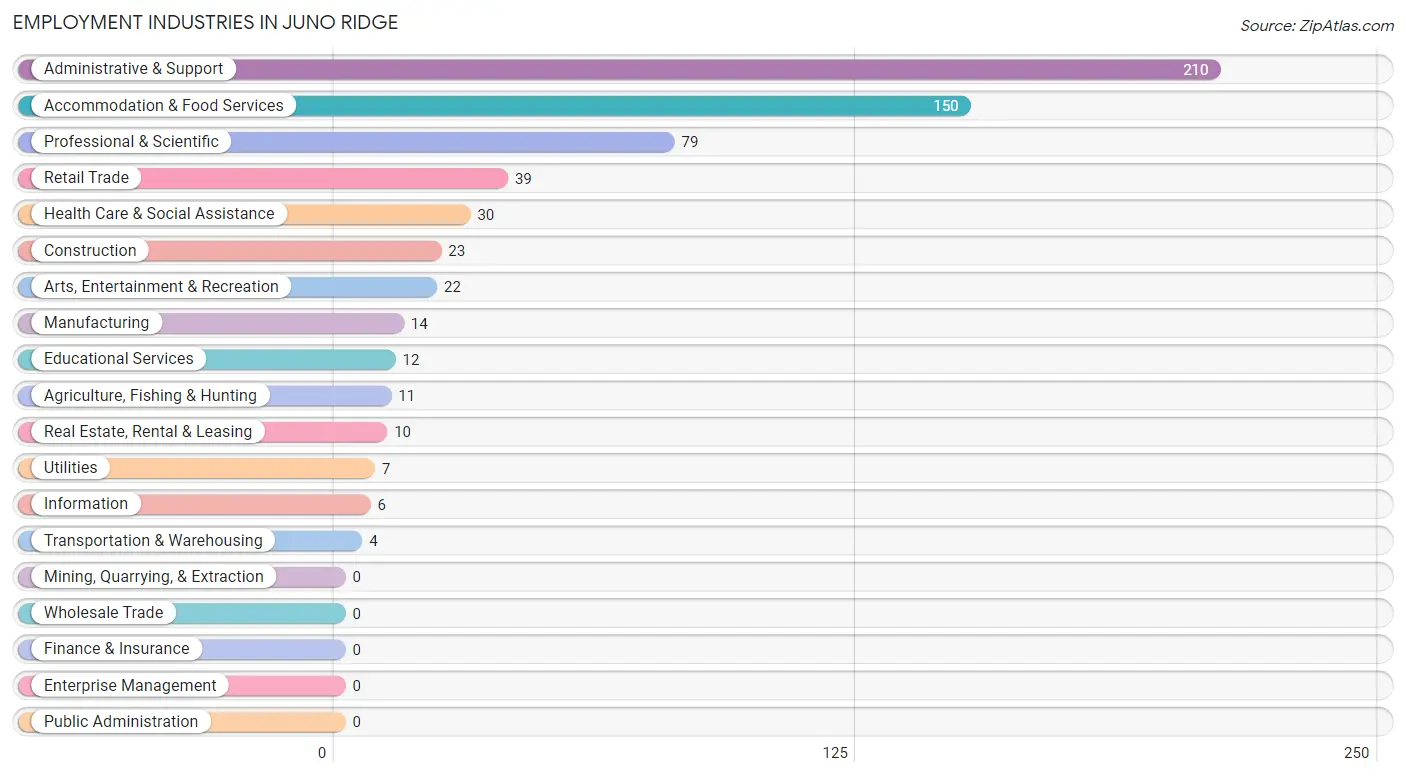
Employment Industries in Juno Ridge
The major employment industries in Juno Ridge include Administrative & Support (210 | 32.1%), Accommodation & Food Services (150 | 22.9%), Professional & Scientific (79 | 12.1%), Retail Trade (39 | 5.9%), and Health Care & Social Assistance (30 | 4.6%).
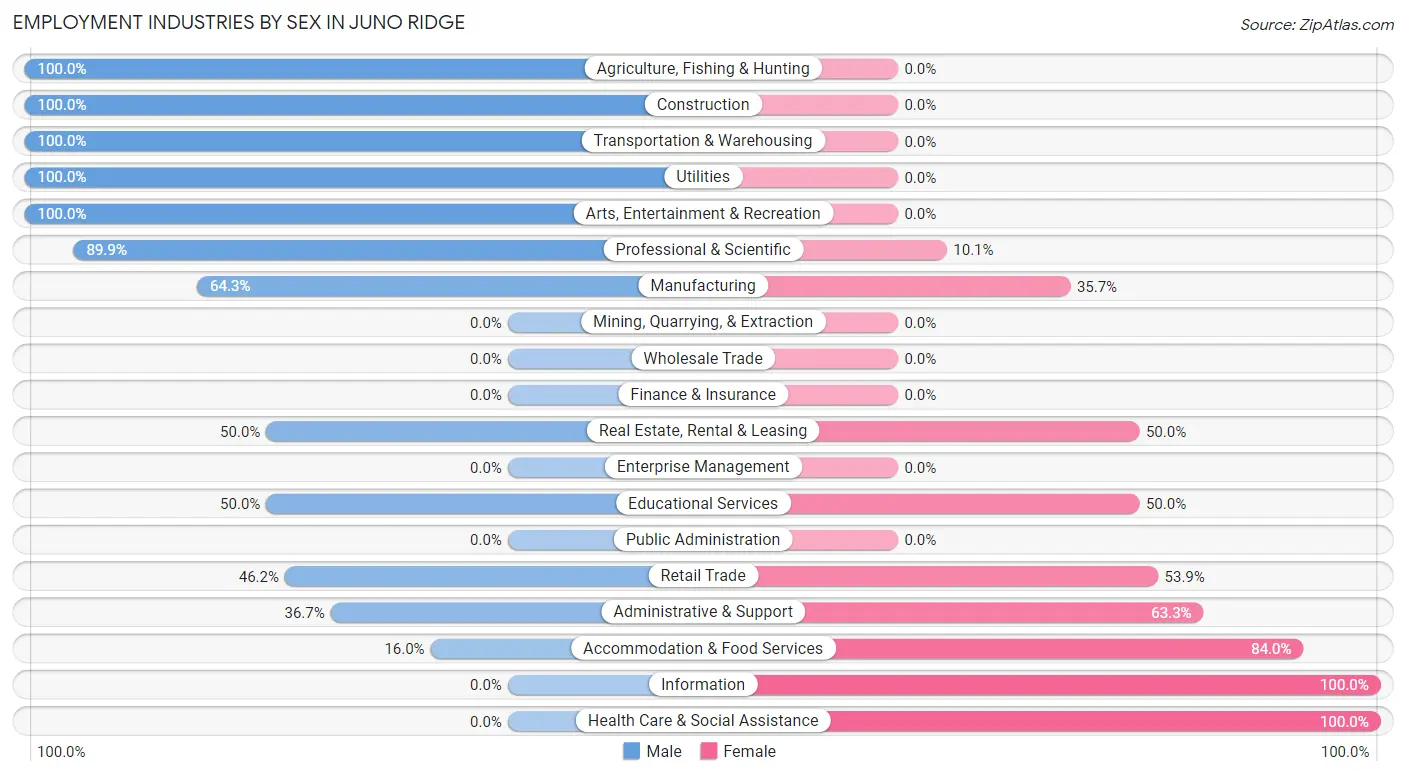
Employment Industries by Sex in Juno Ridge
The Juno Ridge industries that see more men than women are Agriculture, Fishing & Hunting (100.0%), Construction (100.0%), and Transportation & Warehousing (100.0%), whereas the industries that tend to have a higher number of women are Information (100.0%), Health Care & Social Assistance (100.0%), and Accommodation & Food Services (84.0%).
| Industry | Male | Female |
| Agriculture, Fishing & Hunting | 11 (100.0%) | 0 (0.0%) |
| Mining, Quarrying, & Extraction | 0 (0.0%) | 0 (0.0%) |
| Construction | 23 (100.0%) | 0 (0.0%) |
| Manufacturing | 9 (64.3%) | 5 (35.7%) |
| Wholesale Trade | 0 (0.0%) | 0 (0.0%) |
| Retail Trade | 18 (46.2%) | 21 (53.8%) |
| Transportation & Warehousing | 4 (100.0%) | 0 (0.0%) |
| Utilities | 7 (100.0%) | 0 (0.0%) |
| Information | 0 (0.0%) | 6 (100.0%) |
| Finance & Insurance | 0 (0.0%) | 0 (0.0%) |
| Real Estate, Rental & Leasing | 5 (50.0%) | 5 (50.0%) |
| Professional & Scientific | 71 (89.9%) | 8 (10.1%) |
| Enterprise Management | 0 (0.0%) | 0 (0.0%) |
| Administrative & Support | 77 (36.7%) | 133 (63.3%) |
| Educational Services | 6 (50.0%) | 6 (50.0%) |
| Health Care & Social Assistance | 0 (0.0%) | 30 (100.0%) |
| Arts, Entertainment & Recreation | 22 (100.0%) | 0 (0.0%) |
| Accommodation & Food Services | 24 (16.0%) | 126 (84.0%) |
| Public Administration | 0 (0.0%) | 0 (0.0%) |
| Total | 277 (42.3%) | 378 (57.7%) |
Education in Juno Ridge
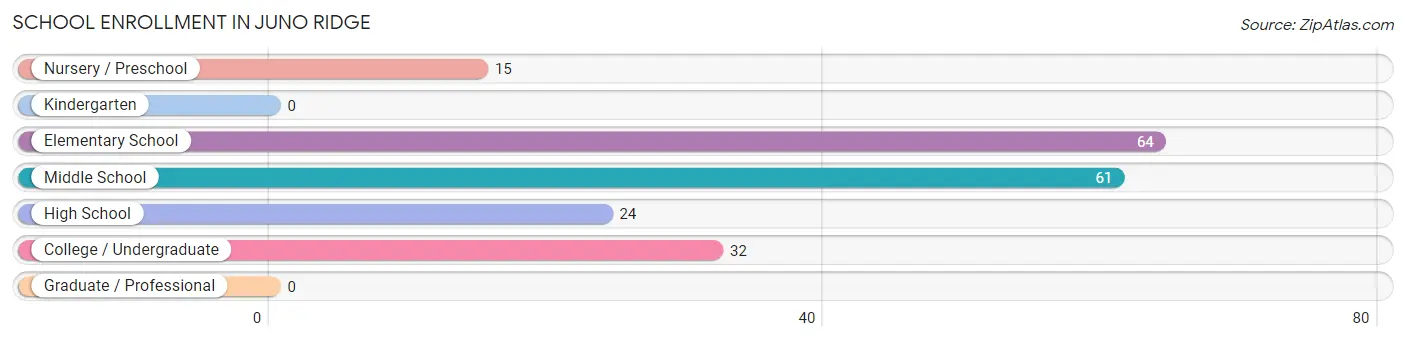
School Enrollment in Juno Ridge
The most common levels of schooling among the 196 students in Juno Ridge are elementary school (64 | 32.7%), middle school (61 | 31.1%), and college / undergraduate (32 | 16.3%).
| School Level | # Students | % Students |
| Nursery / Preschool | 15 | 7.6% |
| Kindergarten | 0 | 0.0% |
| Elementary School | 64 | 32.7% |
| Middle School | 61 | 31.1% |
| High School | 24 | 12.2% |
| College / Undergraduate | 32 | 16.3% |
| Graduate / Professional | 0 | 0.0% |
| Total | 196 | 100.0% |
School Enrollment by Age by Funding Source in Juno Ridge
Out of a total of 196 students who are enrolled in schools in Juno Ridge, 24 (12.2%) attend a private institution, while the remaining 172 (87.8%) are enrolled in public schools. The age group of 3 to 4 year olds has the highest likelihood of being enrolled in private schools, with 4 (40.0% in the age bracket) enrolled. Conversely, the age group of 15 to 17 year olds has the lowest likelihood of being enrolled in a private school, with 24 (100.0% in the age bracket) attending a public institution.
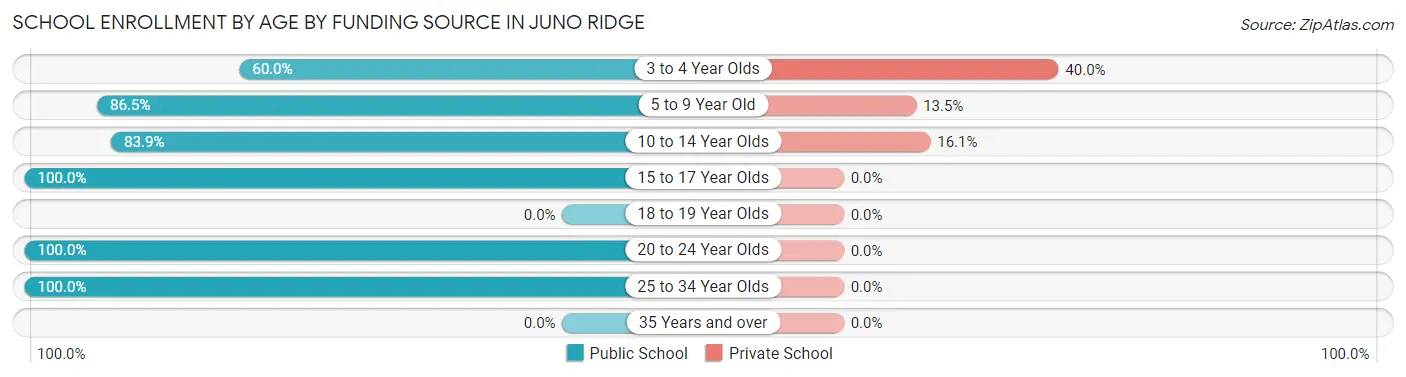
| Age Bracket | Public School | Private School |
| 3 to 4 Year Olds | 6 (60.0%) | 4 (40.0%) |
| 5 to 9 Year Old | 32 (86.5%) | 5 (13.5%) |
| 10 to 14 Year Olds | 78 (83.9%) | 15 (16.1%) |
| 15 to 17 Year Olds | 24 (100.0%) | 0 (0.0%) |
| 18 to 19 Year Olds | 0 (0.0%) | 0 (0.0%) |
| 20 to 24 Year Olds | 27 (100.0%) | 0 (0.0%) |
| 25 to 34 Year Olds | 5 (100.0%) | 0 (0.0%) |
| 35 Years and over | 0 (0.0%) | 0 (0.0%) |
| Total | 172 (87.8%) | 24 (12.2%) |
Educational Attainment by Field of Study in Juno Ridge
Literature & languages (57 | 26.0%), communications (39 | 17.8%), arts & humanities (38 | 17.3%), psychology (16 | 7.3%), and business (15 | 6.9%) are the most common fields of study among 219 individuals in Juno Ridge who have obtained a bachelor's degree or higher.
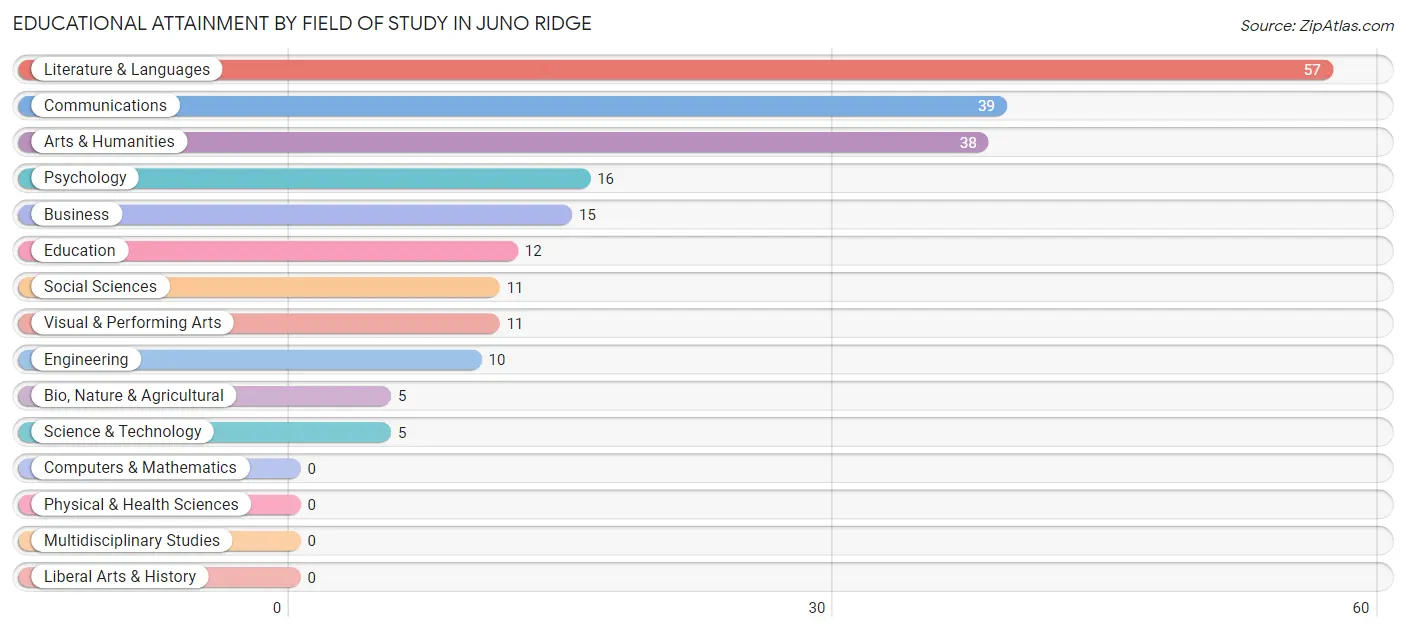
| Field of Study | # Graduates | % Graduates |
| Computers & Mathematics | 0 | 0.0% |
| Bio, Nature & Agricultural | 5 | 2.3% |
| Physical & Health Sciences | 0 | 0.0% |
| Psychology | 16 | 7.3% |
| Social Sciences | 11 | 5.0% |
| Engineering | 10 | 4.6% |
| Multidisciplinary Studies | 0 | 0.0% |
| Science & Technology | 5 | 2.3% |
| Business | 15 | 6.9% |
| Education | 12 | 5.5% |
| Literature & Languages | 57 | 26.0% |
| Liberal Arts & History | 0 | 0.0% |
| Visual & Performing Arts | 11 | 5.0% |
| Communications | 39 | 17.8% |
| Arts & Humanities | 38 | 17.3% |
| Total | 219 | 100.0% |
Transportation & Commute in Juno Ridge
Vehicle Availability by Sex in Juno Ridge
The most prevalent vehicle ownership categories in Juno Ridge are males with 1 vehicle (185, accounting for 68.3%) and females with 1 vehicle (336, making up 48.9%).
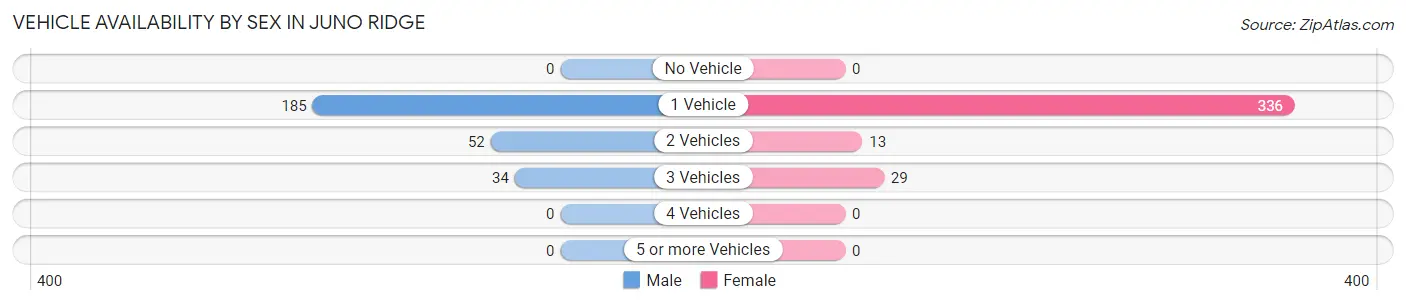
| Vehicles Available | Male | Female |
| No Vehicle | 0 (0.0%) | 0 (0.0%) |
| 1 Vehicle | 185 (68.3%) | 336 (88.9%) |
| 2 Vehicles | 52 (19.2%) | 13 (3.4%) |
| 3 Vehicles | 34 (12.6%) | 29 (7.7%) |
| 4 Vehicles | 0 (0.0%) | 0 (0.0%) |
| 5 or more Vehicles | 0 (0.0%) | 0 (0.0%) |
| Total | 271 (100.0%) | 378 (100.0%) |
Commute Time in Juno Ridge
The most frequently occuring commute durations in Juno Ridge are 15 to 19 minutes (99 commuters, 24.4%), 5 to 9 minutes (97 commuters, 23.9%), and 25 to 29 minutes (61 commuters, 15.1%).
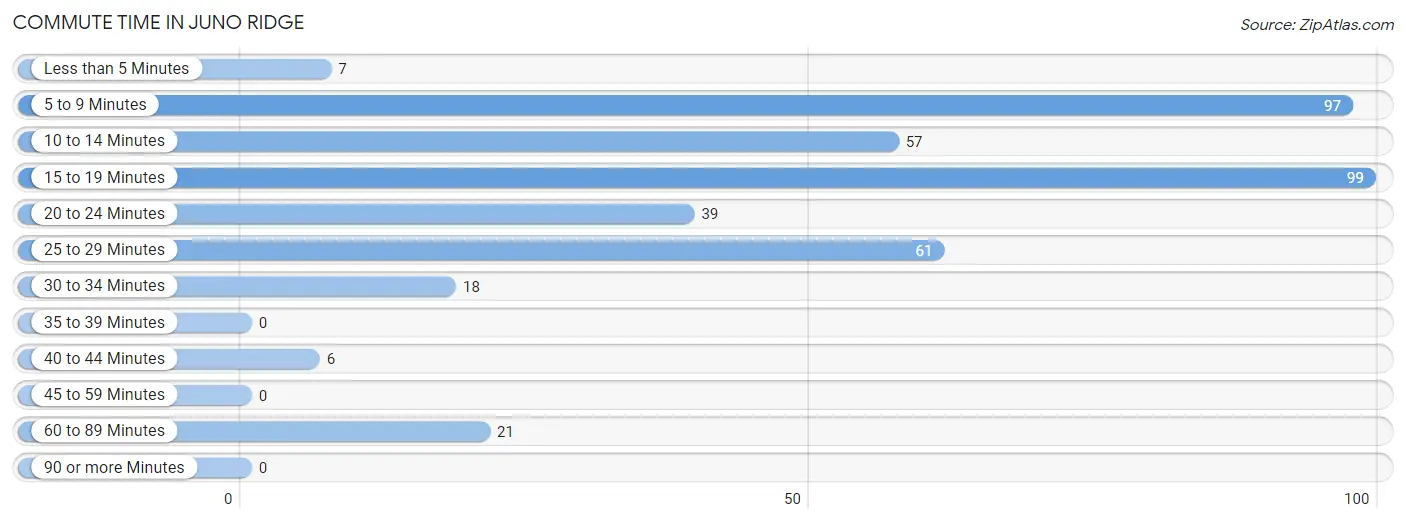
| Commute Time | # Commuters | % Commuters |
| Less than 5 Minutes | 7 | 1.7% |
| 5 to 9 Minutes | 97 | 23.9% |
| 10 to 14 Minutes | 57 | 14.1% |
| 15 to 19 Minutes | 99 | 24.4% |
| 20 to 24 Minutes | 39 | 9.6% |
| 25 to 29 Minutes | 61 | 15.1% |
| 30 to 34 Minutes | 18 | 4.4% |
| 35 to 39 Minutes | 0 | 0.0% |
| 40 to 44 Minutes | 6 | 1.5% |
| 45 to 59 Minutes | 0 | 0.0% |
| 60 to 89 Minutes | 21 | 5.2% |
| 90 or more Minutes | 0 | 0.0% |
Commute Time by Sex in Juno Ridge
The most common commute times in Juno Ridge are 15 to 19 minutes (56 commuters, 24.2%) for males and 5 to 9 minutes (97 commuters, 55.7%) for females.
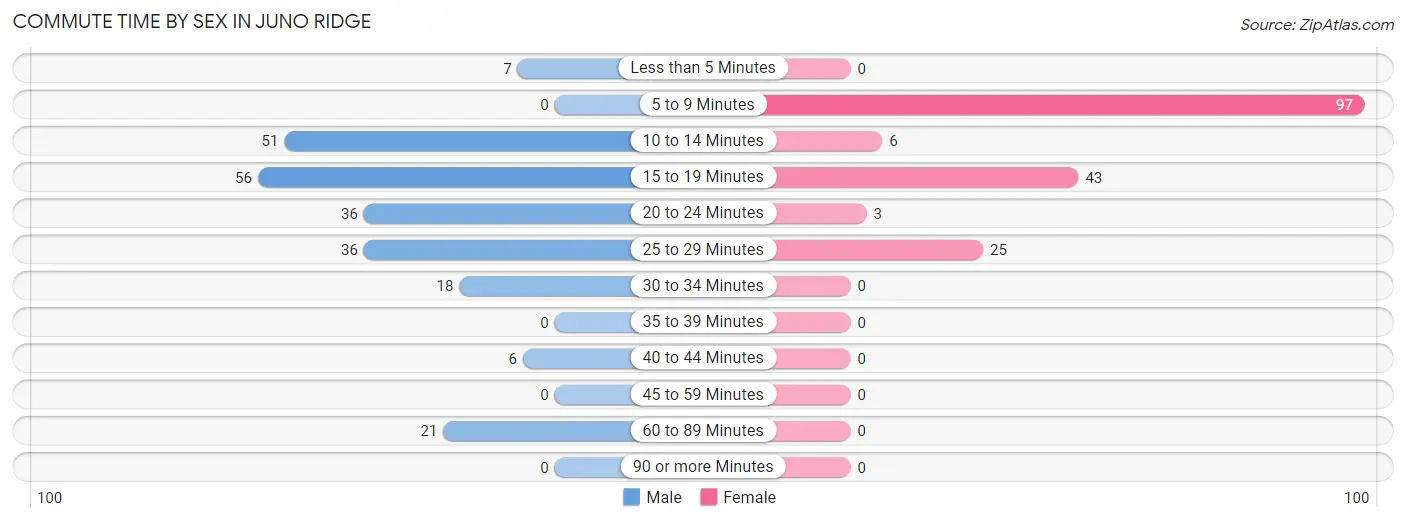
| Commute Time | Male | Female |
| Less than 5 Minutes | 7 (3.0%) | 0 (0.0%) |
| 5 to 9 Minutes | 0 (0.0%) | 97 (55.7%) |
| 10 to 14 Minutes | 51 (22.1%) | 6 (3.5%) |
| 15 to 19 Minutes | 56 (24.2%) | 43 (24.7%) |
| 20 to 24 Minutes | 36 (15.6%) | 3 (1.7%) |
| 25 to 29 Minutes | 36 (15.6%) | 25 (14.4%) |
| 30 to 34 Minutes | 18 (7.8%) | 0 (0.0%) |
| 35 to 39 Minutes | 0 (0.0%) | 0 (0.0%) |
| 40 to 44 Minutes | 6 (2.6%) | 0 (0.0%) |
| 45 to 59 Minutes | 0 (0.0%) | 0 (0.0%) |
| 60 to 89 Minutes | 21 (9.1%) | 0 (0.0%) |
| 90 or more Minutes | 0 (0.0%) | 0 (0.0%) |
Time of Departure to Work by Sex in Juno Ridge
The most frequent times of departure to work in Juno Ridge are 6:00 AM to 6:29 AM (60, 26.0%) for males and 9:00 AM to 9:59 AM (53, 30.5%) for females.
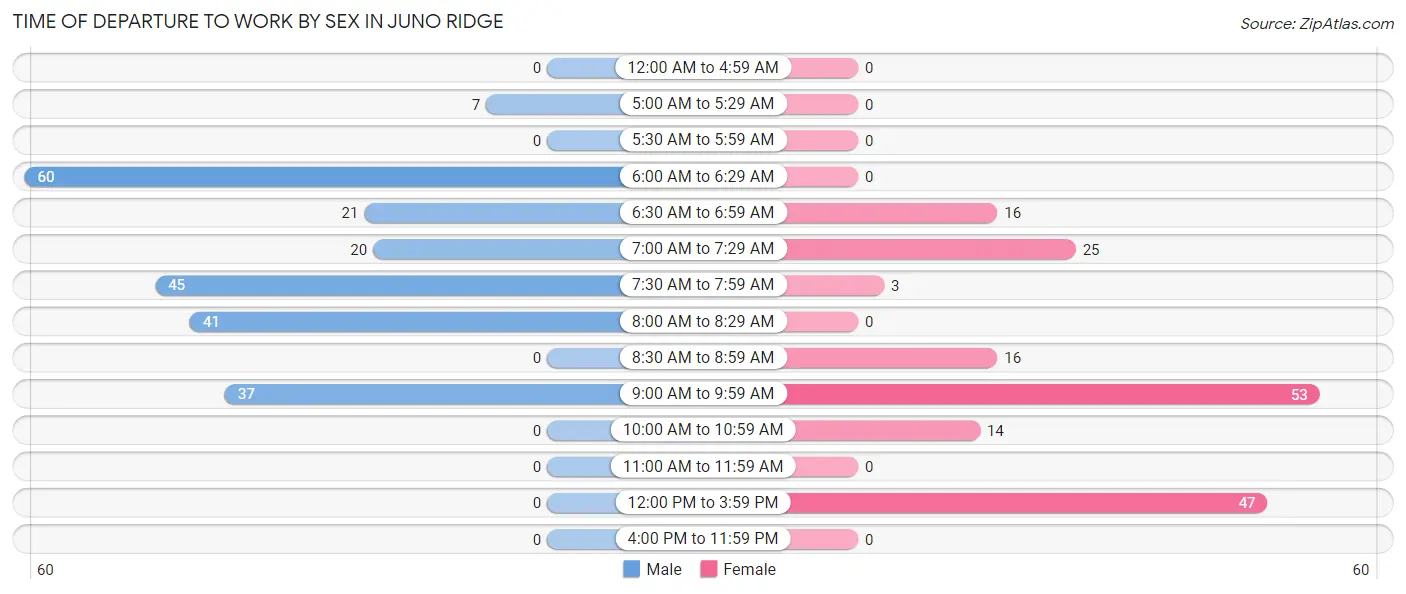
| Time of Departure | Male | Female |
| 12:00 AM to 4:59 AM | 0 (0.0%) | 0 (0.0%) |
| 5:00 AM to 5:29 AM | 7 (3.0%) | 0 (0.0%) |
| 5:30 AM to 5:59 AM | 0 (0.0%) | 0 (0.0%) |
| 6:00 AM to 6:29 AM | 60 (26.0%) | 0 (0.0%) |
| 6:30 AM to 6:59 AM | 21 (9.1%) | 16 (9.2%) |
| 7:00 AM to 7:29 AM | 20 (8.7%) | 25 (14.4%) |
| 7:30 AM to 7:59 AM | 45 (19.5%) | 3 (1.7%) |
| 8:00 AM to 8:29 AM | 41 (17.7%) | 0 (0.0%) |
| 8:30 AM to 8:59 AM | 0 (0.0%) | 16 (9.2%) |
| 9:00 AM to 9:59 AM | 37 (16.0%) | 53 (30.5%) |
| 10:00 AM to 10:59 AM | 0 (0.0%) | 14 (8.1%) |
| 11:00 AM to 11:59 AM | 0 (0.0%) | 0 (0.0%) |
| 12:00 PM to 3:59 PM | 0 (0.0%) | 47 (27.0%) |
| 4:00 PM to 11:59 PM | 0 (0.0%) | 0 (0.0%) |
| Total | 231 (100.0%) | 174 (100.0%) |
Housing Occupancy in Juno Ridge
Occupancy by Ownership in Juno Ridge
Of the total 630 dwellings in Juno Ridge, owner-occupied units account for 311 (49.4%), while renter-occupied units make up 319 (50.6%).
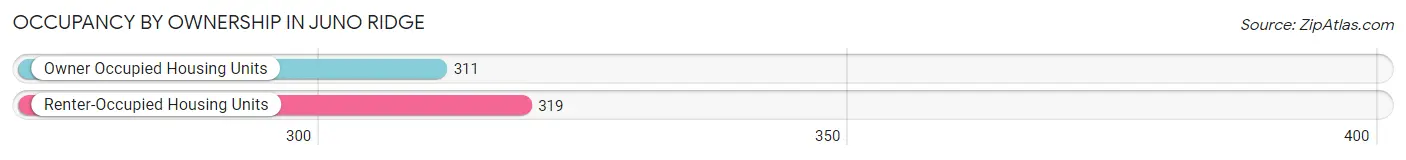
| Occupancy | # Housing Units | % Housing Units |
| Owner Occupied Housing Units | 311 | 49.4% |
| Renter-Occupied Housing Units | 319 | 50.6% |
| Total Occupied Housing Units | 630 | 100.0% |
Occupancy by Household Size in Juno Ridge
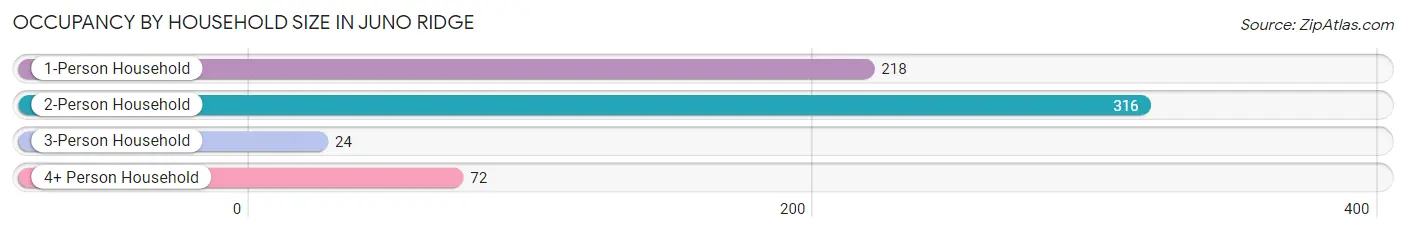
| Household Size | # Housing Units | % Housing Units |
| 1-Person Household | 218 | 34.6% |
| 2-Person Household | 316 | 50.2% |
| 3-Person Household | 24 | 3.8% |
| 4+ Person Household | 72 | 11.4% |
| Total Housing Units | 630 | 100.0% |
Occupancy by Ownership by Household Size in Juno Ridge
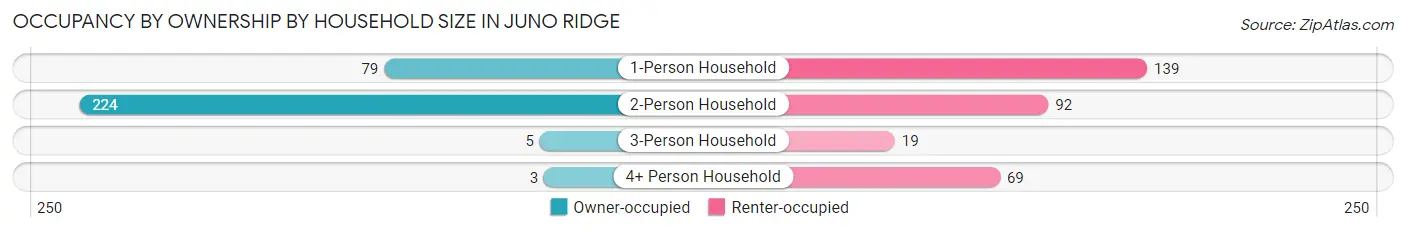
| Household Size | Owner-occupied | Renter-occupied |
| 1-Person Household | 79 (36.2%) | 139 (63.8%) |
| 2-Person Household | 224 (70.9%) | 92 (29.1%) |
| 3-Person Household | 5 (20.8%) | 19 (79.2%) |
| 4+ Person Household | 3 (4.2%) | 69 (95.8%) |
| Total Housing Units | 311 (49.4%) | 319 (50.6%) |
Occupancy by Educational Attainment in Juno Ridge
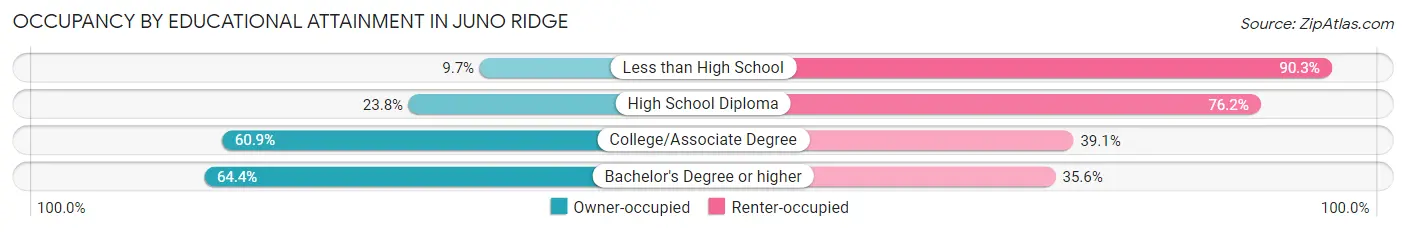
| Household Size | Owner-occupied | Renter-occupied |
| Less than High School | 7 (9.7%) | 65 (90.3%) |
| High School Diploma | 25 (23.8%) | 80 (76.2%) |
| College/Associate Degree | 221 (60.9%) | 142 (39.1%) |
| Bachelor's Degree or higher | 58 (64.4%) | 32 (35.6%) |
Occupancy by Age of Householder in Juno Ridge
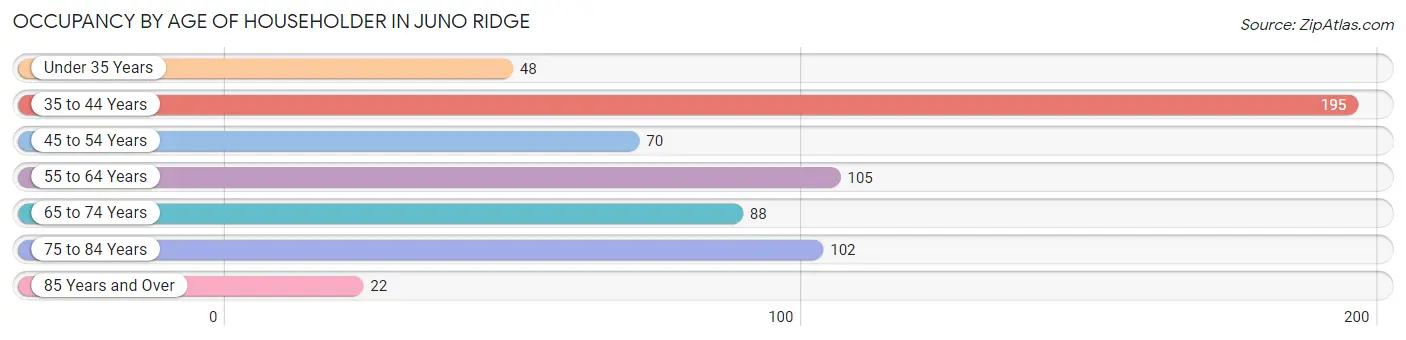
| Age Bracket | # Households | % Households |
| Under 35 Years | 48 | 7.6% |
| 35 to 44 Years | 195 | 30.9% |
| 45 to 54 Years | 70 | 11.1% |
| 55 to 64 Years | 105 | 16.7% |
| 65 to 74 Years | 88 | 14.0% |
| 75 to 84 Years | 102 | 16.2% |
| 85 Years and Over | 22 | 3.5% |
| Total | 630 | 100.0% |
Housing Finances in Juno Ridge
Median Income by Occupancy in Juno Ridge
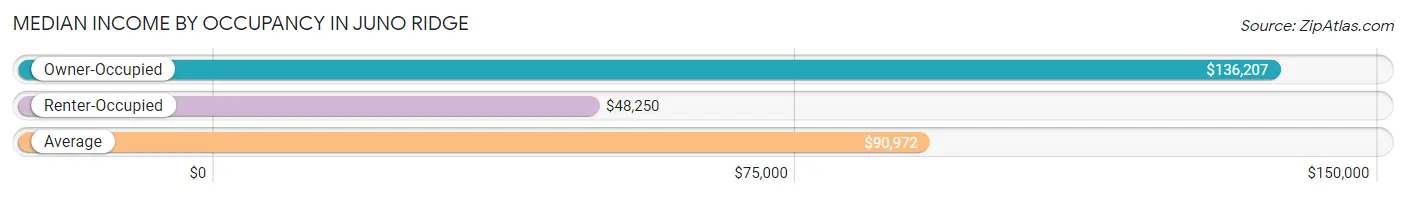
| Occupancy Type | # Households | Median Income |
| Owner-Occupied | 311 (49.4%) | $136,207 |
| Renter-Occupied | 319 (50.6%) | $48,250 |
| Average | 630 (100.0%) | $90,972 |
Occupancy by Householder Income Bracket in Juno Ridge
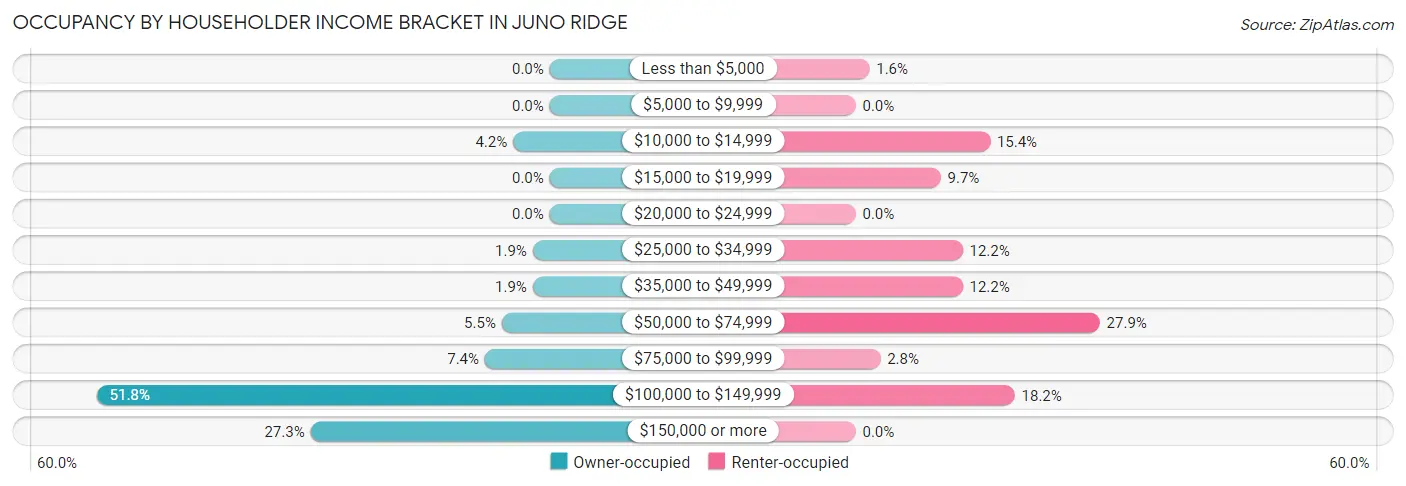
| Income Bracket | Owner-occupied | Renter-occupied |
| Less than $5,000 | 0 (0.0%) | 5 (1.6%) |
| $5,000 to $9,999 | 0 (0.0%) | 0 (0.0%) |
| $10,000 to $14,999 | 13 (4.2%) | 49 (15.4%) |
| $15,000 to $19,999 | 0 (0.0%) | 31 (9.7%) |
| $20,000 to $24,999 | 0 (0.0%) | 0 (0.0%) |
| $25,000 to $34,999 | 6 (1.9%) | 39 (12.2%) |
| $35,000 to $49,999 | 6 (1.9%) | 39 (12.2%) |
| $50,000 to $74,999 | 17 (5.5%) | 89 (27.9%) |
| $75,000 to $99,999 | 23 (7.4%) | 9 (2.8%) |
| $100,000 to $149,999 | 161 (51.8%) | 58 (18.2%) |
| $150,000 or more | 85 (27.3%) | 0 (0.0%) |
| Total | 311 (100.0%) | 319 (100.0%) |
Monthly Housing Cost Tiers in Juno Ridge
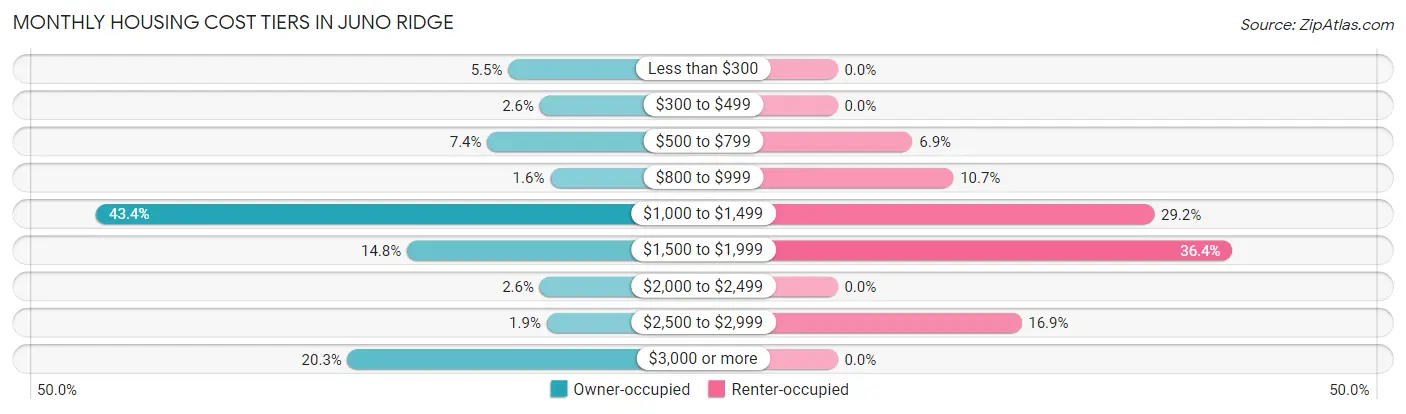
| Monthly Cost | Owner-occupied | Renter-occupied |
| Less than $300 | 17 (5.5%) | 0 (0.0%) |
| $300 to $499 | 8 (2.6%) | 0 (0.0%) |
| $500 to $799 | 23 (7.4%) | 22 (6.9%) |
| $800 to $999 | 5 (1.6%) | 34 (10.7%) |
| $1,000 to $1,499 | 135 (43.4%) | 93 (29.1%) |
| $1,500 to $1,999 | 46 (14.8%) | 116 (36.4%) |
| $2,000 to $2,499 | 8 (2.6%) | 0 (0.0%) |
| $2,500 to $2,999 | 6 (1.9%) | 54 (16.9%) |
| $3,000 or more | 63 (20.3%) | 0 (0.0%) |
| Total | 311 (100.0%) | 319 (100.0%) |
Physical Housing Characteristics in Juno Ridge
Housing Structures in Juno Ridge
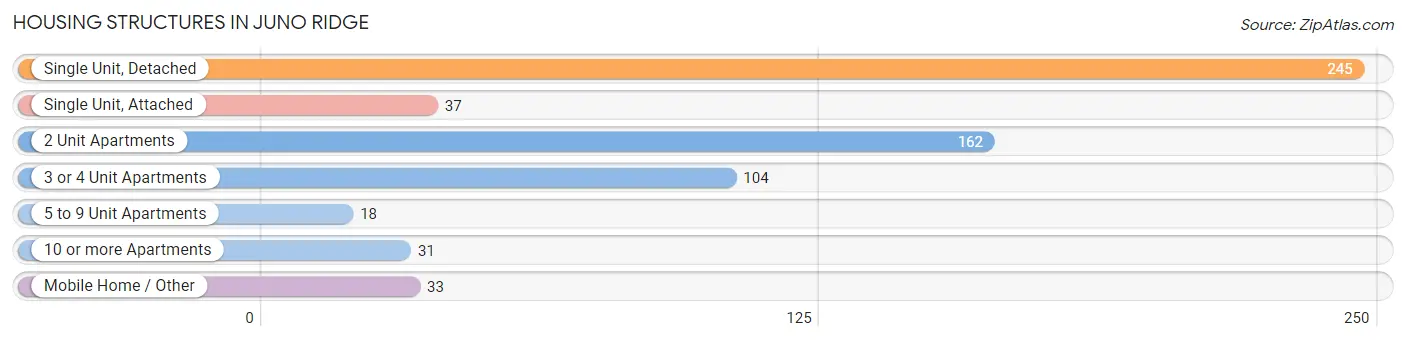
| Structure Type | # Housing Units | % Housing Units |
| Single Unit, Detached | 245 | 38.9% |
| Single Unit, Attached | 37 | 5.9% |
| 2 Unit Apartments | 162 | 25.7% |
| 3 or 4 Unit Apartments | 104 | 16.5% |
| 5 to 9 Unit Apartments | 18 | 2.9% |
| 10 or more Apartments | 31 | 4.9% |
| Mobile Home / Other | 33 | 5.2% |
| Total | 630 | 100.0% |
Housing Structures by Occupancy in Juno Ridge
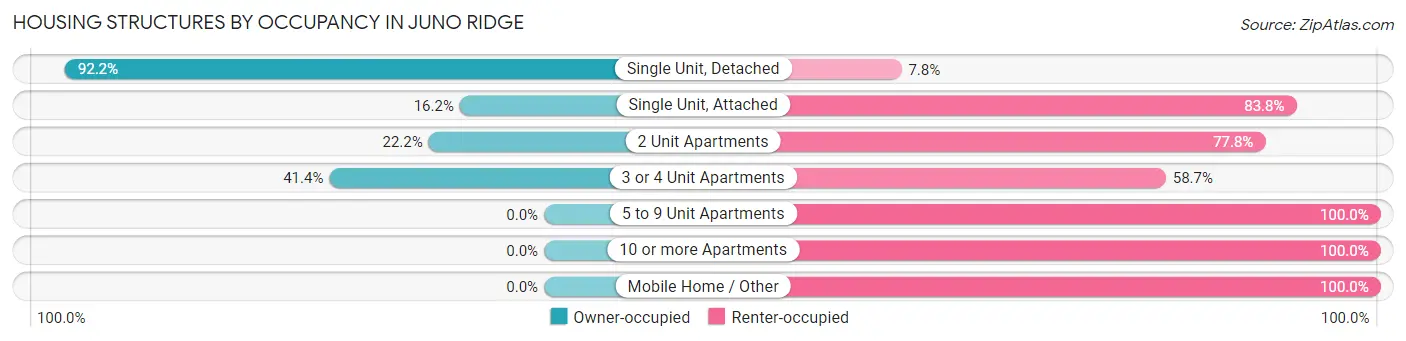
| Structure Type | Owner-occupied | Renter-occupied |
| Single Unit, Detached | 226 (92.2%) | 19 (7.8%) |
| Single Unit, Attached | 6 (16.2%) | 31 (83.8%) |
| 2 Unit Apartments | 36 (22.2%) | 126 (77.8%) |
| 3 or 4 Unit Apartments | 43 (41.3%) | 61 (58.7%) |
| 5 to 9 Unit Apartments | 0 (0.0%) | 18 (100.0%) |
| 10 or more Apartments | 0 (0.0%) | 31 (100.0%) |
| Mobile Home / Other | 0 (0.0%) | 33 (100.0%) |
| Total | 311 (49.4%) | 319 (50.6%) |
Housing Structures by Number of Rooms in Juno Ridge
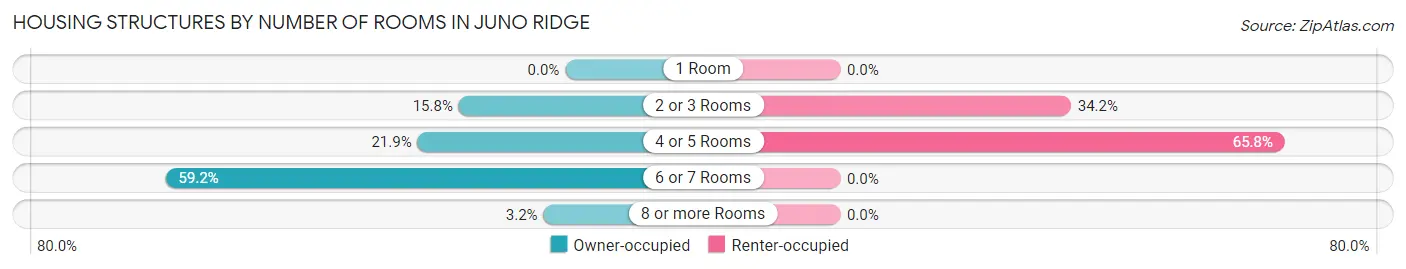
| Number of Rooms | Owner-occupied | Renter-occupied |
| 1 Room | 0 (0.0%) | 0 (0.0%) |
| 2 or 3 Rooms | 49 (15.8%) | 109 (34.2%) |
| 4 or 5 Rooms | 68 (21.9%) | 210 (65.8%) |
| 6 or 7 Rooms | 184 (59.2%) | 0 (0.0%) |
| 8 or more Rooms | 10 (3.2%) | 0 (0.0%) |
| Total | 311 (100.0%) | 319 (100.0%) |
Housing Structure by Heating Type in Juno Ridge
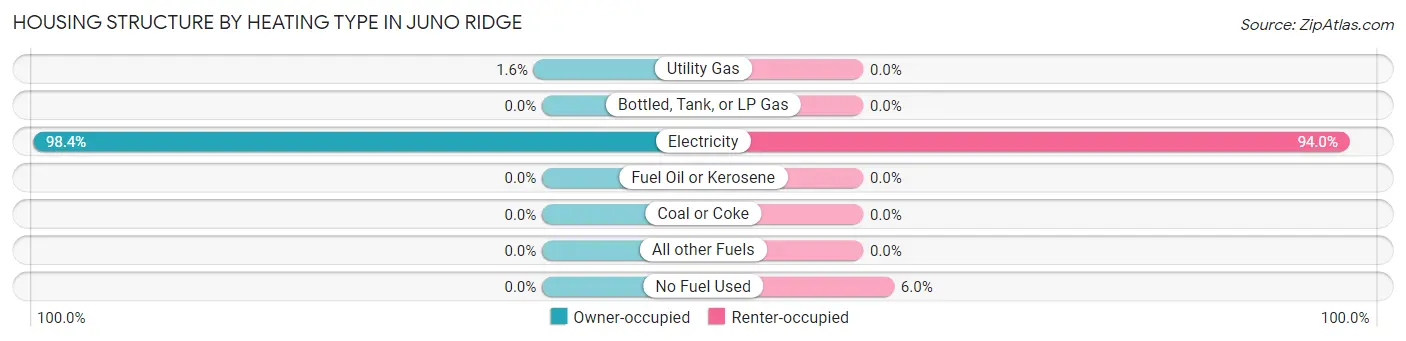
| Heating Type | Owner-occupied | Renter-occupied |
| Utility Gas | 5 (1.6%) | 0 (0.0%) |
| Bottled, Tank, or LP Gas | 0 (0.0%) | 0 (0.0%) |
| Electricity | 306 (98.4%) | 300 (94.0%) |
| Fuel Oil or Kerosene | 0 (0.0%) | 0 (0.0%) |
| Coal or Coke | 0 (0.0%) | 0 (0.0%) |
| All other Fuels | 0 (0.0%) | 0 (0.0%) |
| No Fuel Used | 0 (0.0%) | 19 (6.0%) |
| Total | 311 (100.0%) | 319 (100.0%) |
Household Vehicle Usage in Juno Ridge
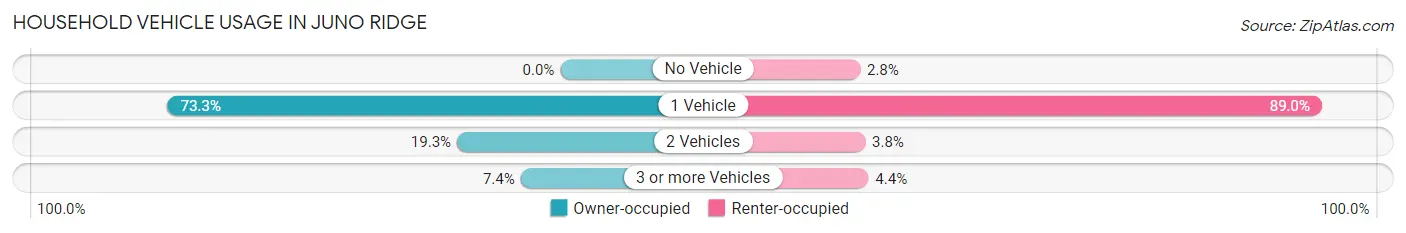
| Vehicles per Household | Owner-occupied | Renter-occupied |
| No Vehicle | 0 (0.0%) | 9 (2.8%) |
| 1 Vehicle | 228 (73.3%) | 284 (89.0%) |
| 2 Vehicles | 60 (19.3%) | 12 (3.8%) |
| 3 or more Vehicles | 23 (7.4%) | 14 (4.4%) |
| Total | 311 (100.0%) | 319 (100.0%) |
Real Estate & Mortgages in Juno Ridge
Real Estate and Mortgage Overview in Juno Ridge
| Characteristic | Without Mortgage | With Mortgage |
| Housing Units | 94 | 217 |
| Median Property Value | - | - |
| Median Household Income | $109,583 | $49 |
| Monthly Housing Costs | - | - |
| Real Estate Taxes | - | - |
Property Value by Mortgage Status in Juno Ridge
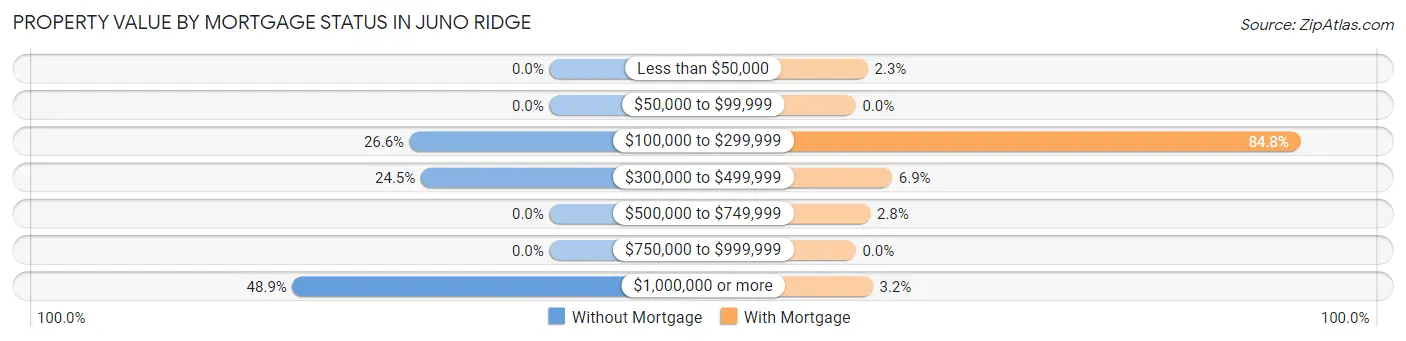
| Property Value | Without Mortgage | With Mortgage |
| Less than $50,000 | 0 (0.0%) | 5 (2.3%) |
| $50,000 to $99,999 | 0 (0.0%) | 0 (0.0%) |
| $100,000 to $299,999 | 25 (26.6%) | 184 (84.8%) |
| $300,000 to $499,999 | 23 (24.5%) | 15 (6.9%) |
| $500,000 to $749,999 | 0 (0.0%) | 6 (2.8%) |
| $750,000 to $999,999 | 0 (0.0%) | 0 (0.0%) |
| $1,000,000 or more | 46 (48.9%) | 7 (3.2%) |
| Total | 94 (100.0%) | 217 (100.0%) |
Household Income by Mortgage Status in Juno Ridge
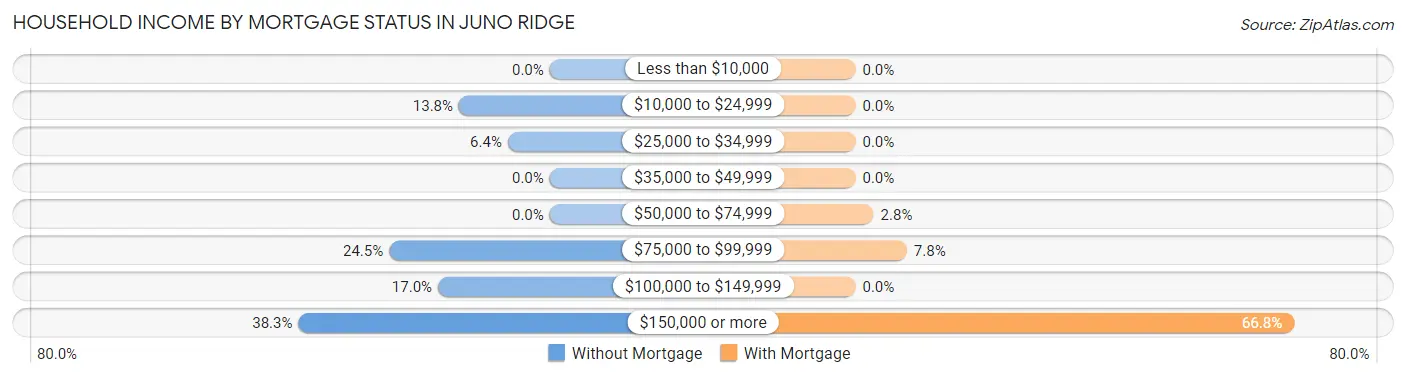
| Household Income | Without Mortgage | With Mortgage |
| Less than $10,000 | 0 (0.0%) | 0 (0.0%) |
| $10,000 to $24,999 | 13 (13.8%) | 0 (0.0%) |
| $25,000 to $34,999 | 6 (6.4%) | 0 (0.0%) |
| $35,000 to $49,999 | 0 (0.0%) | 0 (0.0%) |
| $50,000 to $74,999 | 0 (0.0%) | 6 (2.8%) |
| $75,000 to $99,999 | 23 (24.5%) | 17 (7.8%) |
| $100,000 to $149,999 | 16 (17.0%) | 0 (0.0%) |
| $150,000 or more | 36 (38.3%) | 145 (66.8%) |
| Total | 94 (100.0%) | 217 (100.0%) |
Property Value to Household Income Ratio in Juno Ridge
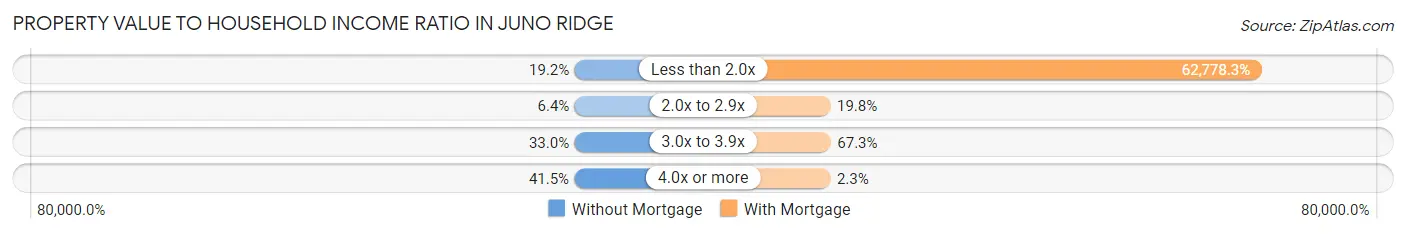
| Value-to-Income Ratio | Without Mortgage | With Mortgage |
| Less than 2.0x | 18 (19.2%) | 136,229 (62,778.3%) |
| 2.0x to 2.9x | 6 (6.4%) | 43 (19.8%) |
| 3.0x to 3.9x | 31 (33.0%) | 146 (67.3%) |
| 4.0x or more | 39 (41.5%) | 5 (2.3%) |
| Total | 94 (100.0%) | 217 (100.0%) |
Real Estate Taxes by Mortgage Status in Juno Ridge
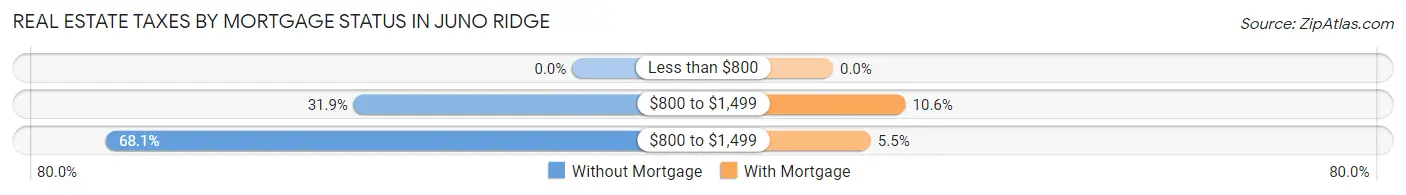
| Property Taxes | Without Mortgage | With Mortgage |
| Less than $800 | 0 (0.0%) | 0 (0.0%) |
| $800 to $1,499 | 30 (31.9%) | 23 (10.6%) |
| $800 to $1,499 | 64 (68.1%) | 12 (5.5%) |
| Total | 94 (100.0%) | 217 (100.0%) |
Health & Disability in Juno Ridge
Health Insurance Coverage by Age in Juno Ridge
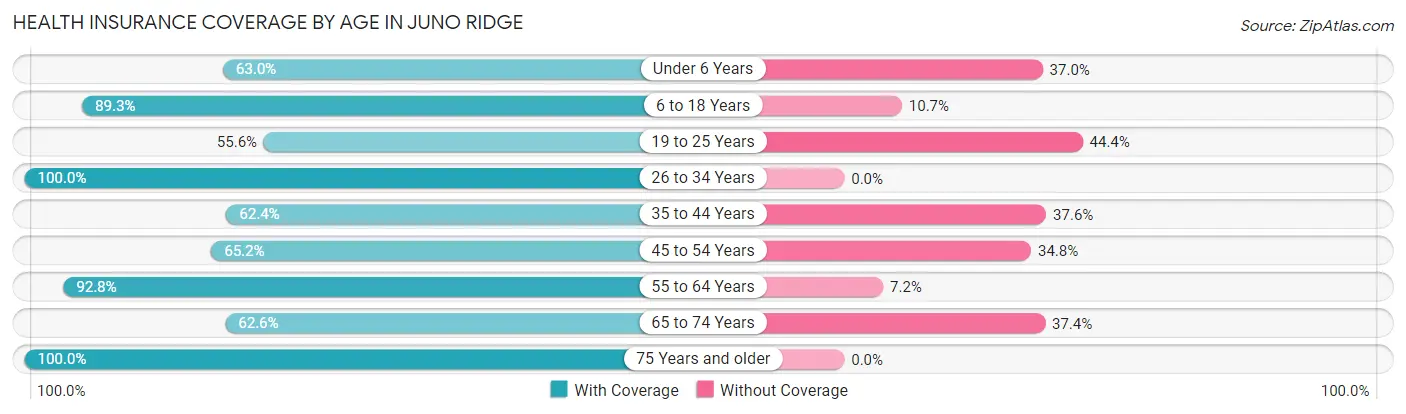
| Age Bracket | With Coverage | Without Coverage |
| Under 6 Years | 46 (63.0%) | 27 (37.0%) |
| 6 to 18 Years | 133 (89.3%) | 16 (10.7%) |
| 19 to 25 Years | 35 (55.6%) | 28 (44.4%) |
| 26 to 34 Years | 29 (100.0%) | 0 (0.0%) |
| 35 to 44 Years | 164 (62.4%) | 99 (37.6%) |
| 45 to 54 Years | 58 (65.2%) | 31 (34.8%) |
| 55 to 64 Years | 141 (92.8%) | 11 (7.2%) |
| 65 to 74 Years | 137 (62.6%) | 82 (37.4%) |
| 75 Years and older | 208 (100.0%) | 0 (0.0%) |
| Total | 951 (76.4%) | 294 (23.6%) |
Health Insurance Coverage by Citizenship Status in Juno Ridge
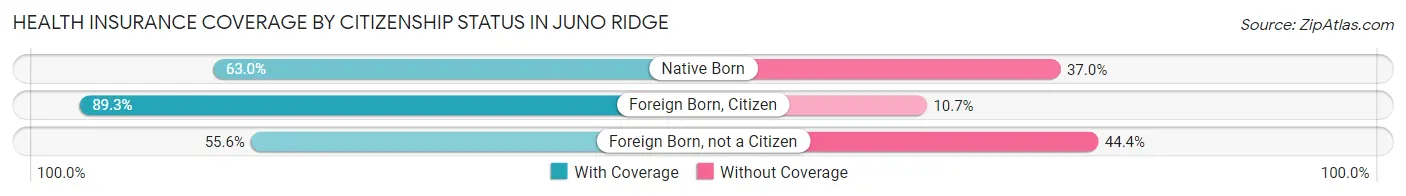
| Citizenship Status | With Coverage | Without Coverage |
| Native Born | 46 (63.0%) | 27 (37.0%) |
| Foreign Born, Citizen | 133 (89.3%) | 16 (10.7%) |
| Foreign Born, not a Citizen | 35 (55.6%) | 28 (44.4%) |
Health Insurance Coverage by Household Income in Juno Ridge
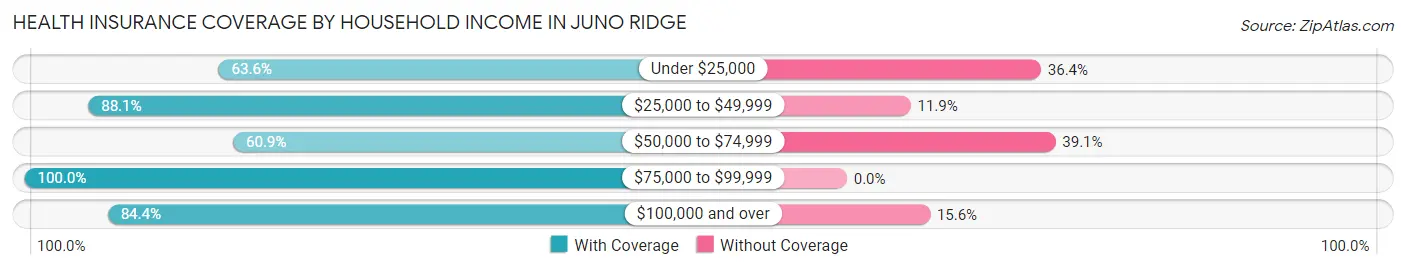
| Household Income | With Coverage | Without Coverage |
| Under $25,000 | 126 (63.6%) | 72 (36.4%) |
| $25,000 to $49,999 | 118 (88.1%) | 16 (11.9%) |
| $50,000 to $74,999 | 184 (60.9%) | 118 (39.1%) |
| $75,000 to $99,999 | 41 (100.0%) | 0 (0.0%) |
| $100,000 and over | 477 (84.4%) | 88 (15.6%) |
Public vs Private Health Insurance Coverage by Age in Juno Ridge
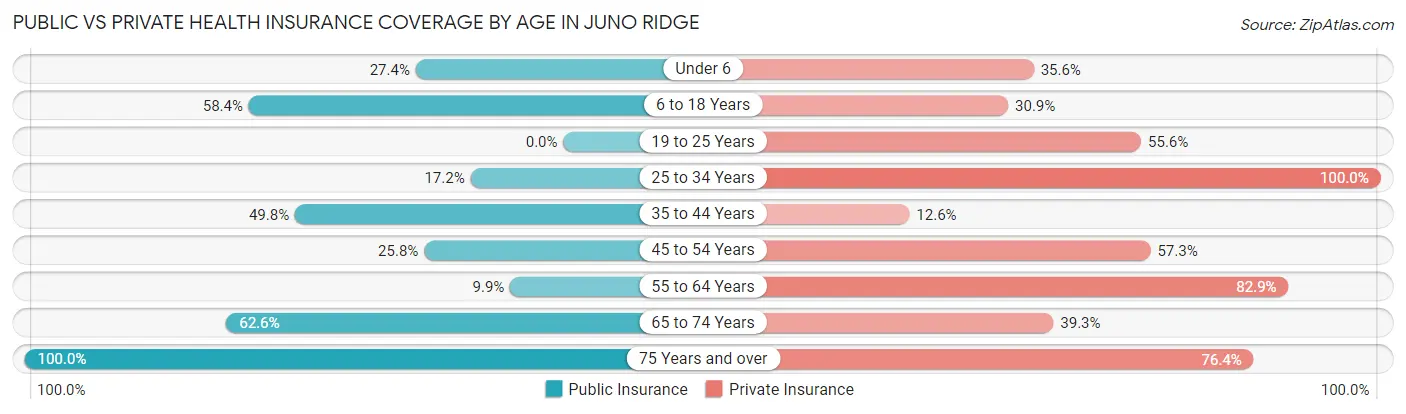
| Age Bracket | Public Insurance | Private Insurance |
| Under 6 | 20 (27.4%) | 26 (35.6%) |
| 6 to 18 Years | 87 (58.4%) | 46 (30.9%) |
| 19 to 25 Years | 0 (0.0%) | 35 (55.6%) |
| 25 to 34 Years | 5 (17.2%) | 29 (100.0%) |
| 35 to 44 Years | 131 (49.8%) | 33 (12.6%) |
| 45 to 54 Years | 23 (25.8%) | 51 (57.3%) |
| 55 to 64 Years | 15 (9.9%) | 126 (82.9%) |
| 65 to 74 Years | 137 (62.6%) | 86 (39.3%) |
| 75 Years and over | 208 (100.0%) | 159 (76.4%) |
| Total | 626 (50.3%) | 591 (47.5%) |
Disability Status by Sex by Age in Juno Ridge
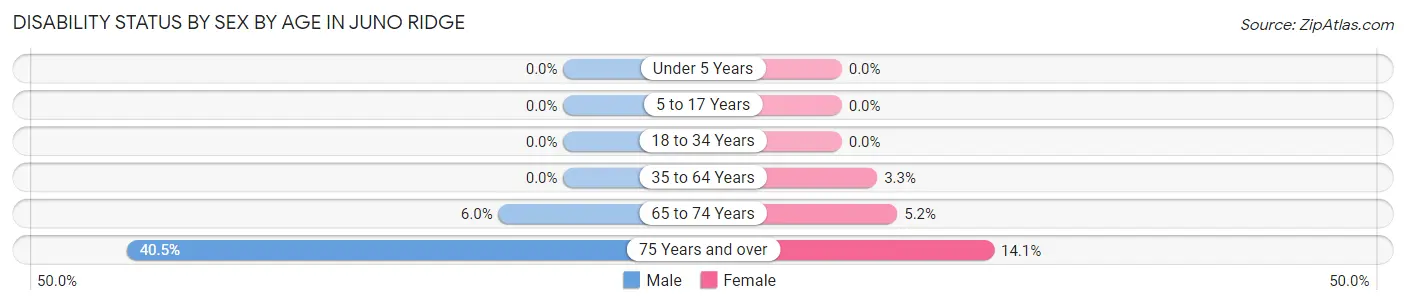
| Age Bracket | Male | Female |
| Under 5 Years | 0 (0.0%) | 0 (0.0%) |
| 5 to 17 Years | 0 (0.0%) | 0 (0.0%) |
| 18 to 34 Years | 0 (0.0%) | 0 (0.0%) |
| 35 to 64 Years | 0 (0.0%) | 10 (3.3%) |
| 65 to 74 Years | 5 (6.0%) | 7 (5.1%) |
| 75 Years and over | 47 (40.5%) | 13 (14.1%) |
Disability Class by Sex by Age in Juno Ridge
Disability Class: Hearing Difficulty
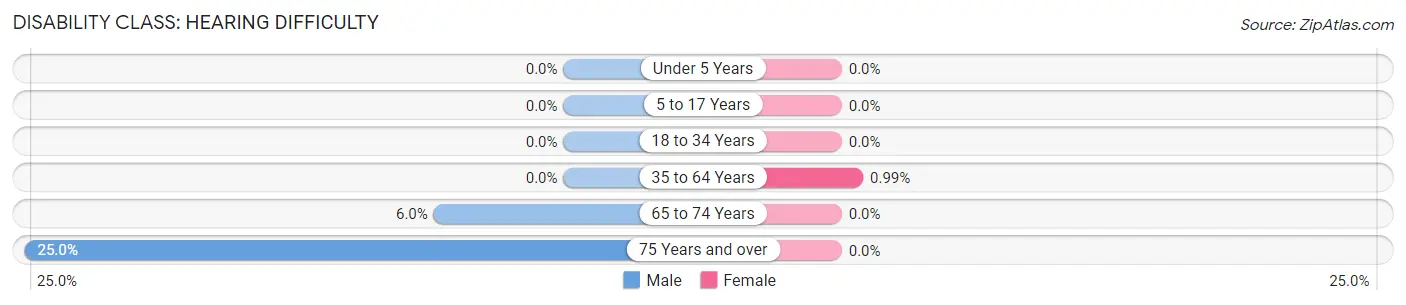
| Age Bracket | Male | Female |
| Under 5 Years | 0 (0.0%) | 0 (0.0%) |
| 5 to 17 Years | 0 (0.0%) | 0 (0.0%) |
| 18 to 34 Years | 0 (0.0%) | 0 (0.0%) |
| 35 to 64 Years | 0 (0.0%) | 3 (1.0%) |
| 65 to 74 Years | 5 (6.0%) | 0 (0.0%) |
| 75 Years and over | 29 (25.0%) | 0 (0.0%) |
Disability Class: Vision Difficulty
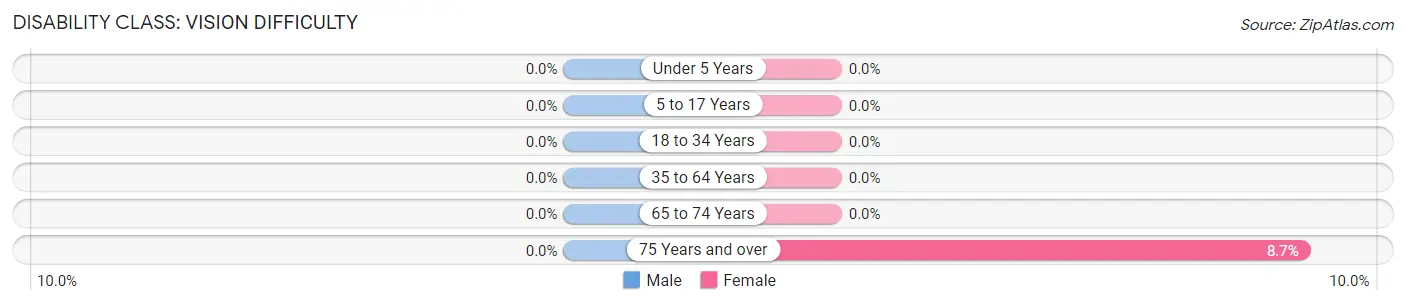
| Age Bracket | Male | Female |
| Under 5 Years | 0 (0.0%) | 0 (0.0%) |
| 5 to 17 Years | 0 (0.0%) | 0 (0.0%) |
| 18 to 34 Years | 0 (0.0%) | 0 (0.0%) |
| 35 to 64 Years | 0 (0.0%) | 0 (0.0%) |
| 65 to 74 Years | 0 (0.0%) | 0 (0.0%) |
| 75 Years and over | 0 (0.0%) | 8 (8.7%) |
Disability Class: Cognitive Difficulty
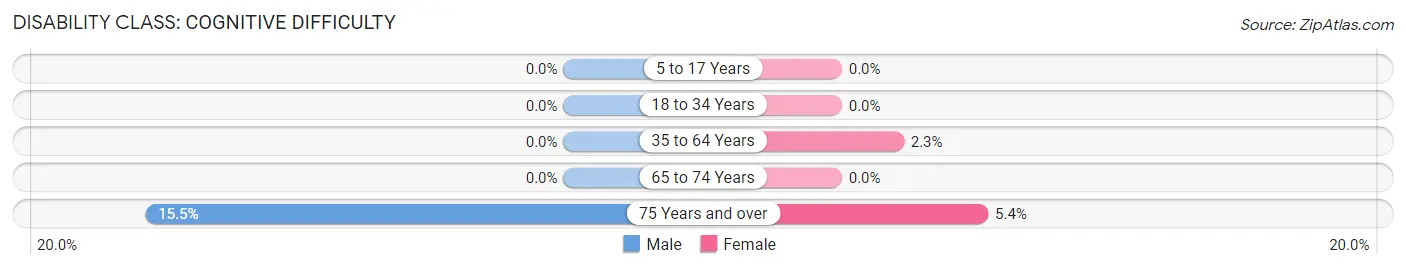
| Age Bracket | Male | Female |
| 5 to 17 Years | 0 (0.0%) | 0 (0.0%) |
| 18 to 34 Years | 0 (0.0%) | 0 (0.0%) |
| 35 to 64 Years | 0 (0.0%) | 7 (2.3%) |
| 65 to 74 Years | 0 (0.0%) | 0 (0.0%) |
| 75 Years and over | 18 (15.5%) | 5 (5.4%) |
Disability Class: Ambulatory Difficulty
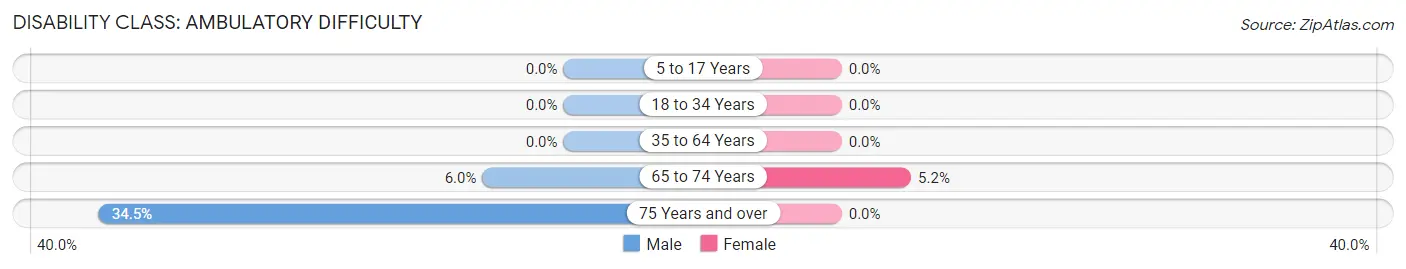
| Age Bracket | Male | Female |
| 5 to 17 Years | 0 (0.0%) | 0 (0.0%) |
| 18 to 34 Years | 0 (0.0%) | 0 (0.0%) |
| 35 to 64 Years | 0 (0.0%) | 0 (0.0%) |
| 65 to 74 Years | 5 (6.0%) | 7 (5.1%) |
| 75 Years and over | 40 (34.5%) | 0 (0.0%) |
Disability Class: Self-Care Difficulty
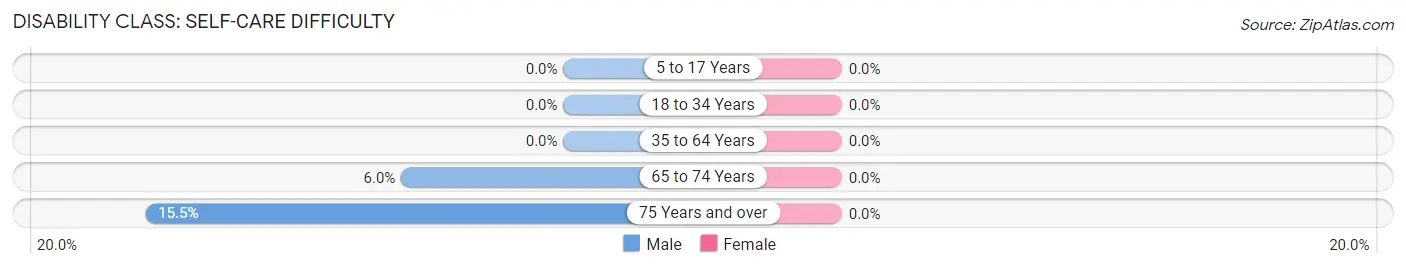
| Age Bracket | Male | Female |
| 5 to 17 Years | 0 (0.0%) | 0 (0.0%) |
| 18 to 34 Years | 0 (0.0%) | 0 (0.0%) |
| 35 to 64 Years | 0 (0.0%) | 0 (0.0%) |
| 65 to 74 Years | 5 (6.0%) | 0 (0.0%) |
| 75 Years and over | 18 (15.5%) | 0 (0.0%) |
Technology Access in Juno Ridge
Computing Device Access in Juno Ridge
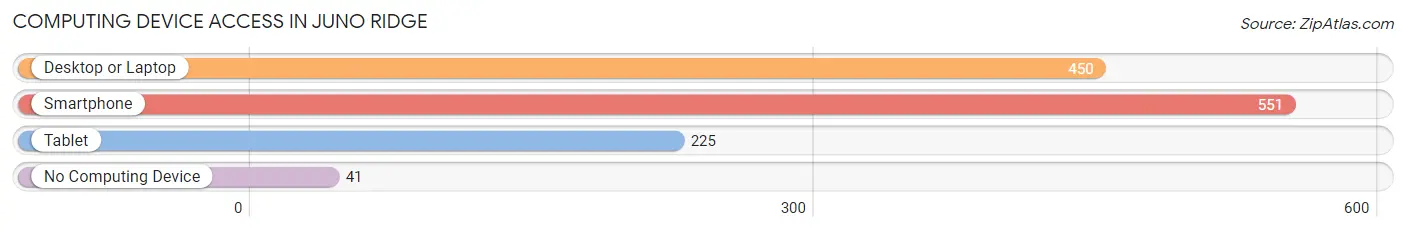
| Device Type | # Households | % Households |
| Desktop or Laptop | 450 | 71.4% |
| Smartphone | 551 | 87.5% |
| Tablet | 225 | 35.7% |
| No Computing Device | 41 | 6.5% |
| Total | 630 | 100.0% |
Internet Access in Juno Ridge
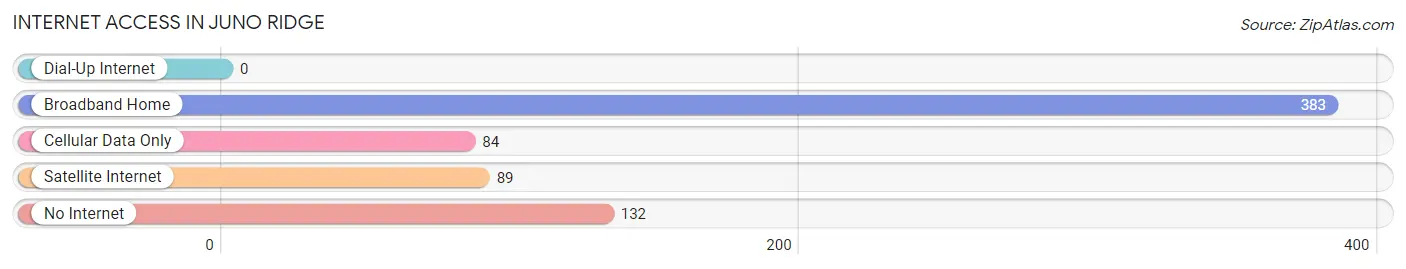
| Internet Type | # Households | % Households |
| Dial-Up Internet | 0 | 0.0% |
| Broadband Home | 383 | 60.8% |
| Cellular Data Only | 84 | 13.3% |
| Satellite Internet | 89 | 14.1% |
| No Internet | 132 | 20.9% |
| Total | 630 | 100.0% |
Juno Ridge Summary
Juno Ridge is a small town located in Palm Beach County, Florida. It is situated on the eastern coast of the state, just north of West Palm Beach. The town is home to a population of approximately 1,500 people, and is known for its small-town charm and laid-back atmosphere.
History
Juno Ridge was founded in the late 1800s by a group of settlers from the Midwest. The town was originally called “Juno” after the Roman goddess of marriage and childbirth. The settlers chose the name because they believed that the area was a good place to start a family.
The town grew slowly over the years, and by the early 1900s, it had become a popular destination for vacationers. The town was known for its beautiful beaches and its laid-back atmosphere.
In the 1950s, the town began to experience a population boom. This was due to the influx of people from the Midwest who were looking for a place to retire. The town’s population grew to over 1,500 people by the end of the decade.
Geography
Juno Ridge is located in Palm Beach County, Florida. It is situated on the eastern coast of the state, just north of West Palm Beach. The town is bordered by the Atlantic Ocean to the east and the Intracoastal Waterway to the west.
The town is located on a ridge, which is why it was given its name. The ridge is made up of sand and limestone, and is home to a variety of wildlife. The town is also home to a number of parks and nature preserves, which provide a great opportunity for outdoor recreation.
Economy
The economy of Juno Ridge is largely based on tourism. The town is home to a number of hotels, restaurants, and other businesses that cater to visitors. The town also has a number of marinas, which provide a great opportunity for fishing and boating.
In addition to tourism, the town is also home to a number of small businesses. These businesses include retail stores, auto repair shops, and other services.
Demographics
As of the 2010 census, the population of Juno Ridge was 1,521. The town is predominantly white, with a small percentage of African Americans and Hispanics. The median household income is $45,000, and the median age is 44.
Conclusion
Juno Ridge is a small town located in Palm Beach County, Florida. It is known for its small-town charm and laid-back atmosphere. The town is home to a population of approximately 1,500 people, and its economy is largely based on tourism. The town is predominantly white, with a small percentage of African Americans and Hispanics.
Common Questions
What is Per Capita Income in Juno Ridge?
Per Capita income in Juno Ridge is $60,893.
What is the Median Family Income in Juno Ridge?
Median Family Income in Juno Ridge is $135,214.
What is the Median Household income in Juno Ridge?
Median Household Income in Juno Ridge is $90,972.
What is Income or Wage Gap in Juno Ridge?
Income or Wage Gap in Juno Ridge is 24.8%.
Women in Juno Ridge earn 75.2 cents for every dollar earned by a man.
What is Inequality or Gini Index in Juno Ridge?
Inequality or Gini Index in Juno Ridge is 0.51.
What is the Total Population of Juno Ridge?
Total Population of Juno Ridge is 1,245.
What is the Total Male Population of Juno Ridge?
Total Male Population of Juno Ridge is 586.
What is the Total Female Population of Juno Ridge?
Total Female Population of Juno Ridge is 659.
What is the Ratio of Males per 100 Females in Juno Ridge?
There are 88.92 Males per 100 Females in Juno Ridge.
What is the Ratio of Females per 100 Males in Juno Ridge?
There are 112.46 Females per 100 Males in Juno Ridge.
What is the Median Population Age in Juno Ridge?
Median Population Age in Juno Ridge is 48.7 Years.
What is the Average Family Size in Juno Ridge
Average Family Size in Juno Ridge is 2.4 People.
What is the Average Household Size in Juno Ridge
Average Household Size in Juno Ridge is 2.0 People.
How Large is the Labor Force in Juno Ridge?
There are 671 People in the Labor Forcein in Juno Ridge.
What is the Percentage of People in the Labor Force in Juno Ridge?
64.6% of People are in the Labor Force in Juno Ridge.
What is the Unemployment Rate in Juno Ridge?
Unemployment Rate in Juno Ridge is 2.4%.