Palmona Park, FL Map & Demographics
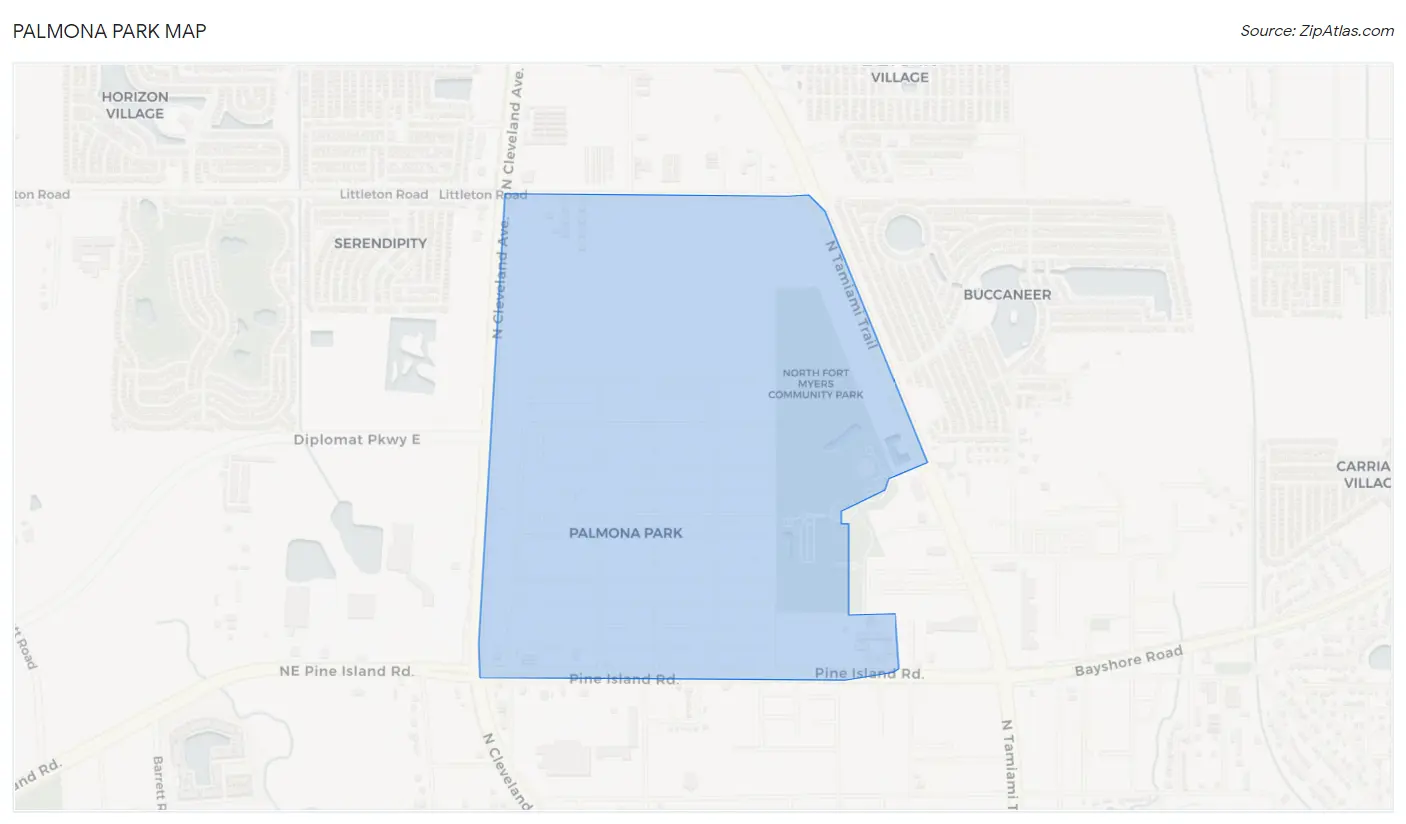
Palmona Park Map
Palmona Park Overview
$12,606
PER CAPITA INCOME
$27,406
AVG FAMILY INCOME
$26,979
AVG HOUSEHOLD INCOME
33.9%
WAGE / INCOME GAP [ % ]
66.1¢/ $1
WAGE / INCOME GAP [ $ ]
0.26
INEQUALITY / GINI INDEX
1,112
TOTAL POPULATION
603
MALE POPULATION
509
FEMALE POPULATION
118.47
MALES / 100 FEMALES
84.41
FEMALES / 100 MALES
31.2
MEDIAN AGE
4.2
AVG FAMILY SIZE
3.5
AVG HOUSEHOLD SIZE
389
LABOR FORCE [ PEOPLE ]
61.2%
PERCENT IN LABOR FORCE
5.9%
UNEMPLOYMENT RATE
Income in Palmona Park
Income Overview in Palmona Park
Per Capita Income in Palmona Park is $12,606, while median incomes of families and households are $27,406 and $26,979 respectively.
| Characteristic | Number | Measure |
| Per Capita Income | 1,112 | $12,606 |
| Median Family Income | 231 | $27,406 |
| Mean Family Income | 231 | $35,293 |
| Median Household Income | 322 | $26,979 |
| Mean Household Income | 322 | $37,269 |
| Income Deficit | 231 | $0 |
| Wage / Income Gap (%) | 1,112 | 33.87% |
| Wage / Income Gap ($) | 1,112 | 66.13¢ per $1 |
| Gini / Inequality Index | 1,112 | 0.26 |
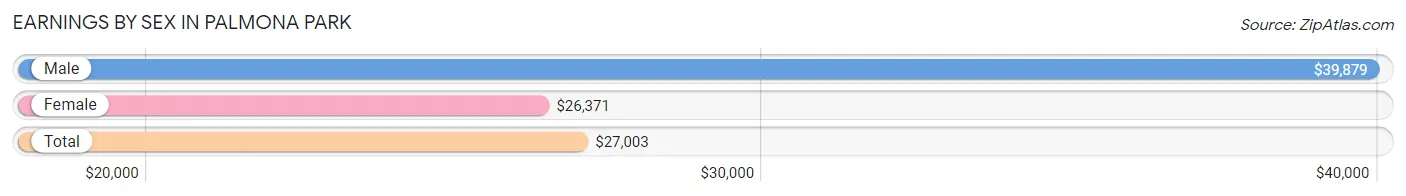
Earnings by Sex in Palmona Park
Average Earnings in Palmona Park are $27,003, $39,879 for men and $26,371 for women, a difference of 33.9%.
| Sex | Number | Average Earnings |
| Male | 125 (30.5%) | $39,879 |
| Female | 285 (69.5%) | $26,371 |
| Total | 410 (100.0%) | $27,003 |
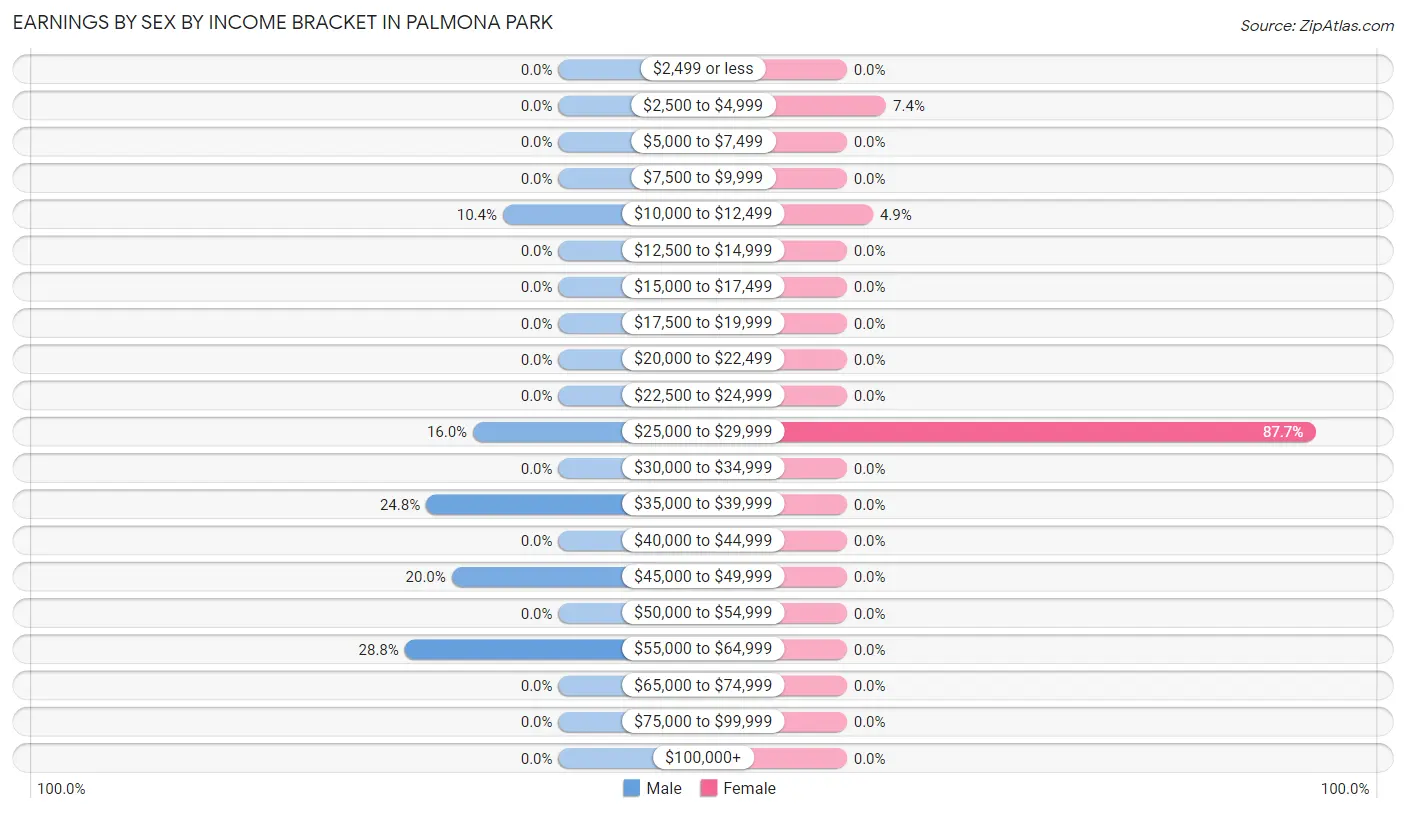
Earnings by Sex by Income Bracket in Palmona Park
The most common earnings brackets in Palmona Park are $55,000 to $64,999 for men (36 | 28.8%) and $25,000 to $29,999 for women (250 | 87.7%).
| Income | Male | Female |
| $2,499 or less | 0 (0.0%) | 0 (0.0%) |
| $2,500 to $4,999 | 0 (0.0%) | 21 (7.4%) |
| $5,000 to $7,499 | 0 (0.0%) | 0 (0.0%) |
| $7,500 to $9,999 | 0 (0.0%) | 0 (0.0%) |
| $10,000 to $12,499 | 13 (10.4%) | 14 (4.9%) |
| $12,500 to $14,999 | 0 (0.0%) | 0 (0.0%) |
| $15,000 to $17,499 | 0 (0.0%) | 0 (0.0%) |
| $17,500 to $19,999 | 0 (0.0%) | 0 (0.0%) |
| $20,000 to $22,499 | 0 (0.0%) | 0 (0.0%) |
| $22,500 to $24,999 | 0 (0.0%) | 0 (0.0%) |
| $25,000 to $29,999 | 20 (16.0%) | 250 (87.7%) |
| $30,000 to $34,999 | 0 (0.0%) | 0 (0.0%) |
| $35,000 to $39,999 | 31 (24.8%) | 0 (0.0%) |
| $40,000 to $44,999 | 0 (0.0%) | 0 (0.0%) |
| $45,000 to $49,999 | 25 (20.0%) | 0 (0.0%) |
| $50,000 to $54,999 | 0 (0.0%) | 0 (0.0%) |
| $55,000 to $64,999 | 36 (28.8%) | 0 (0.0%) |
| $65,000 to $74,999 | 0 (0.0%) | 0 (0.0%) |
| $75,000 to $99,999 | 0 (0.0%) | 0 (0.0%) |
| $100,000+ | 0 (0.0%) | 0 (0.0%) |
| Total | 125 (100.0%) | 285 (100.0%) |
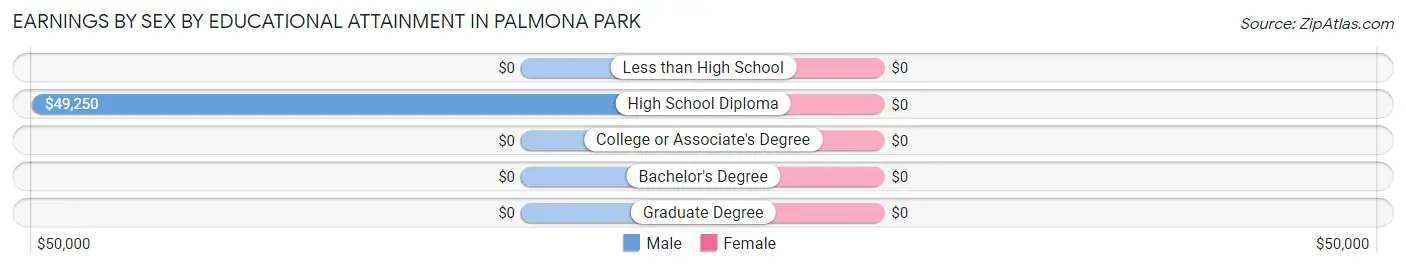
Earnings by Sex by Educational Attainment in Palmona Park
| Educational Attainment | Male Income | Female Income |
| Less than High School | - | - |
| High School Diploma | $49,250 | $0 |
| College or Associate's Degree | - | - |
| Bachelor's Degree | - | - |
| Graduate Degree | - | - |
| Total | $39,879 | $26,371 |
Family Income in Palmona Park
Family Income Brackets in Palmona Park
According to the Palmona Park family income data, there are 172 families falling into the $25,000 to $34,999 income range, which is the most common income bracket and makes up 74.5% of all families.
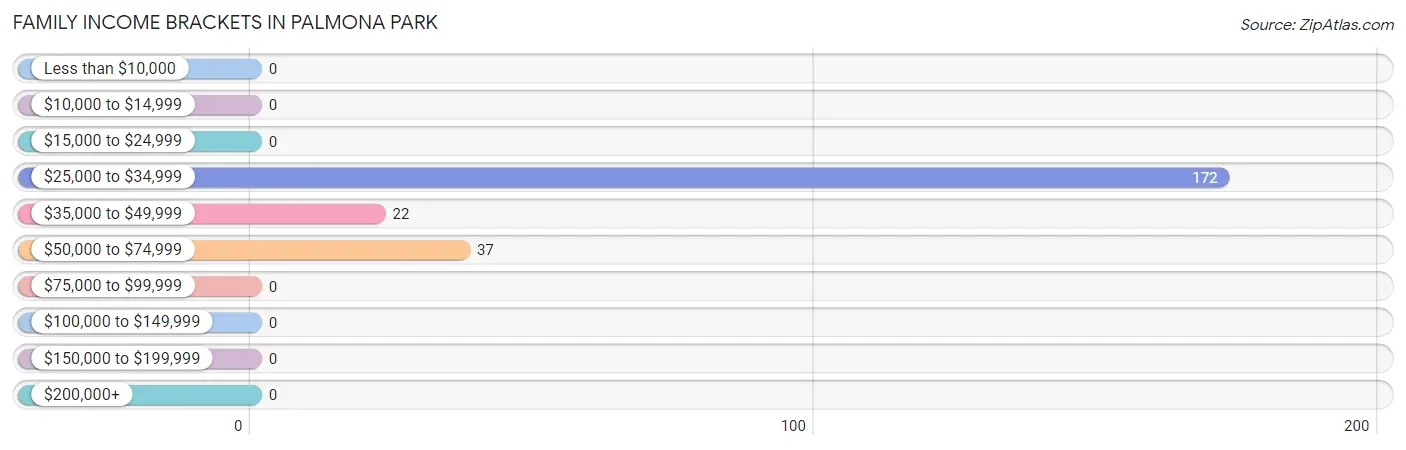
| Income Bracket | # Families | % Families |
| Less than $10,000 | 0 | 0.0% |
| $10,000 to $14,999 | 0 | 0.0% |
| $15,000 to $24,999 | 0 | 0.0% |
| $25,000 to $34,999 | 172 | 74.5% |
| $35,000 to $49,999 | 22 | 9.5% |
| $50,000 to $74,999 | 37 | 16.0% |
| $75,000 to $99,999 | 0 | 0.0% |
| $100,000 to $149,999 | 0 | 0.0% |
| $150,000 to $199,999 | 0 | 0.0% |
| $200,000+ | 0 | 0.0% |
Family Income by Famaliy Size in Palmona Park
3-person families (59 | 25.5%) account for the highest median family income in Palmona Park with $68,315 per family, while 3-person families (59 | 25.5%) have the highest median income of $22,772 per family member.
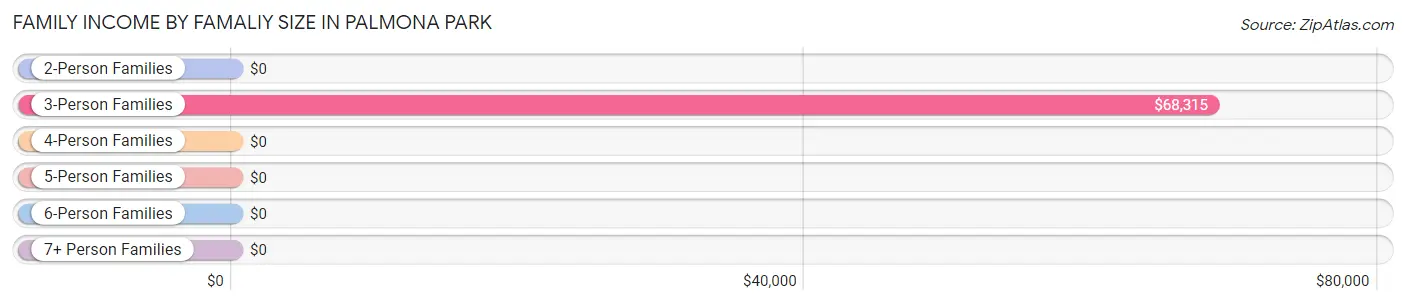
| Income Bracket | # Families | Median Income |
| 2-Person Families | 52 (22.5%) | $0 |
| 3-Person Families | 59 (25.5%) | $68,315 |
| 4-Person Families | 0 (0.0%) | $0 |
| 5-Person Families | 120 (51.9%) | $0 |
| 6-Person Families | 0 (0.0%) | $0 |
| 7+ Person Families | 0 (0.0%) | $0 |
| Total | 231 (100.0%) | $27,406 |
Family Income by Number of Earners in Palmona Park
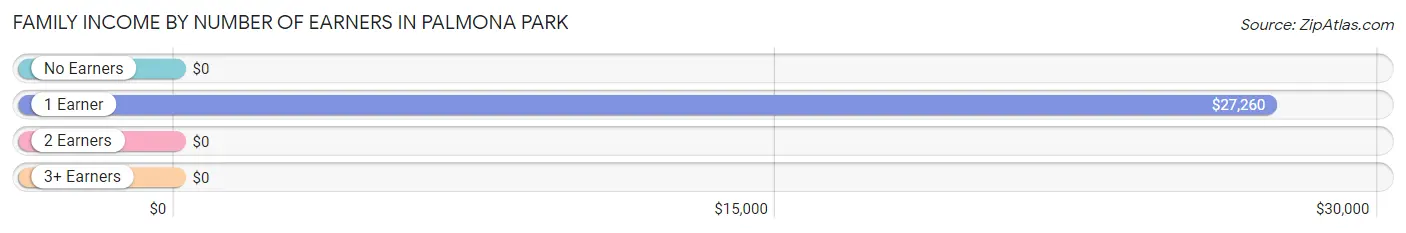
| Number of Earners | # Families | Median Income |
| No Earners | 0 (0.0%) | $0 |
| 1 Earner | 217 (93.9%) | $27,260 |
| 2 Earners | 14 (6.1%) | $0 |
| 3+ Earners | 0 (0.0%) | $0 |
| Total | 231 (100.0%) | $27,406 |
Household Income in Palmona Park
Household Income Brackets in Palmona Park
With 140 households falling in the category, the $25,000 to $34,999 income range is the most frequent in Palmona Park, accounting for 43.5% of all households.
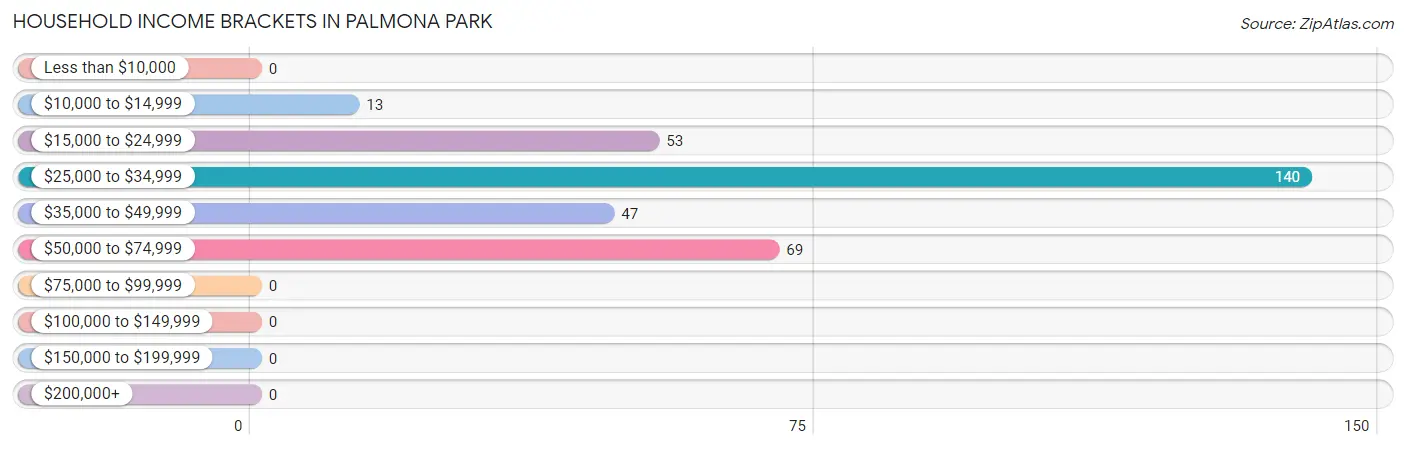
| Income Bracket | # Households | % Households |
| Less than $10,000 | 0 | 0.0% |
| $10,000 to $14,999 | 13 | 4.0% |
| $15,000 to $24,999 | 53 | 16.5% |
| $25,000 to $34,999 | 140 | 43.5% |
| $35,000 to $49,999 | 47 | 14.6% |
| $50,000 to $74,999 | 69 | 21.4% |
| $75,000 to $99,999 | 0 | 0.0% |
| $100,000 to $149,999 | 0 | 0.0% |
| $150,000 to $199,999 | 0 | 0.0% |
| $200,000+ | 0 | 0.0% |
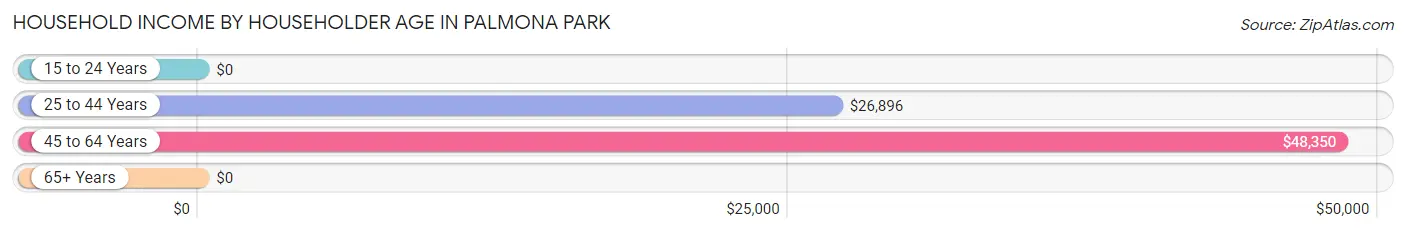
Household Income by Householder Age in Palmona Park
The median household income in Palmona Park is $26,979, with the highest median household income of $48,350 found in the 45 to 64 years age bracket for the primary householder. A total of 61 households (18.9%) fall into this category.
| Income Bracket | # Households | Median Income |
| 15 to 24 Years | 0 (0.0%) | $0 |
| 25 to 44 Years | 208 (64.6%) | $26,896 |
| 45 to 64 Years | 61 (18.9%) | $48,350 |
| 65+ Years | 53 (16.5%) | $0 |
| Total | 322 (100.0%) | $26,979 |
Poverty in Palmona Park
Income Below Poverty by Sex and Age in Palmona Park
With 60.5% poverty level for males and 65.8% for females among the residents of Palmona Park, 6 to 11 year old males and 35 to 44 year old females are the most vulnerable to poverty, with 116 males (100.0%) and 196 females (100.0%) in their respective age groups living below the poverty level.
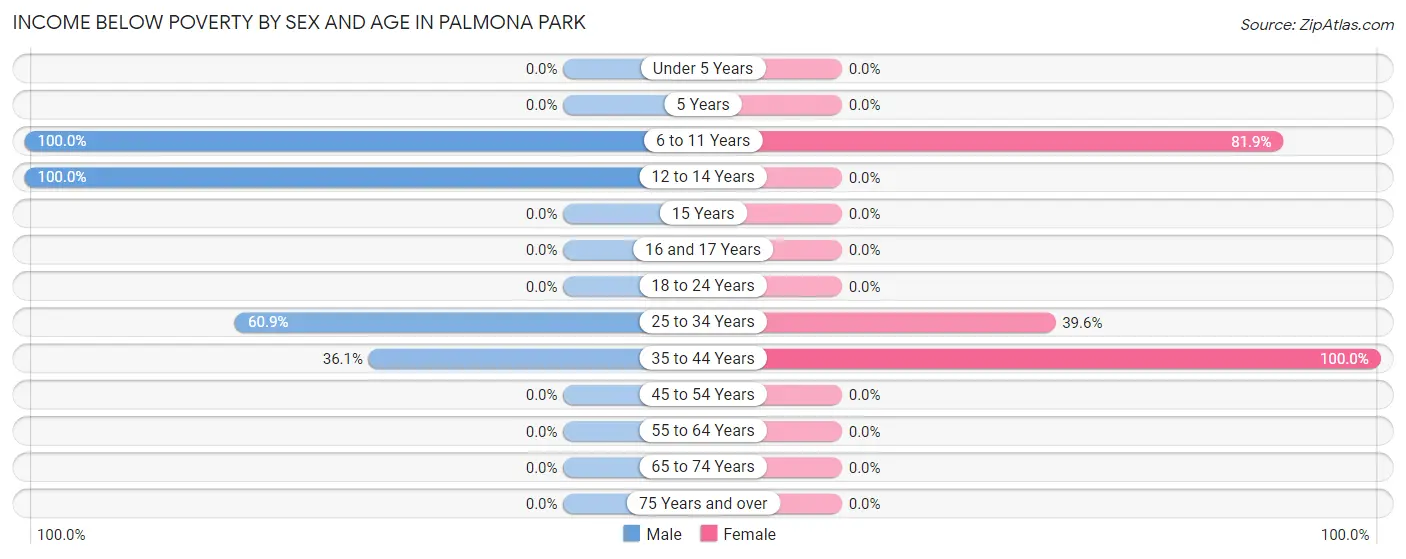
| Age Bracket | Male | Female |
| Under 5 Years | 0 (0.0%) | 0 (0.0%) |
| 5 Years | 0 (0.0%) | 0 (0.0%) |
| 6 to 11 Years | 116 (100.0%) | 118 (81.9%) |
| 12 to 14 Years | 116 (100.0%) | 0 (0.0%) |
| 15 Years | 0 (0.0%) | 0 (0.0%) |
| 16 and 17 Years | 0 (0.0%) | 0 (0.0%) |
| 18 to 24 Years | 0 (0.0%) | 0 (0.0%) |
| 25 to 34 Years | 120 (60.9%) | 21 (39.6%) |
| 35 to 44 Years | 13 (36.1%) | 196 (100.0%) |
| 45 to 54 Years | 0 (0.0%) | 0 (0.0%) |
| 55 to 64 Years | 0 (0.0%) | 0 (0.0%) |
| 65 to 74 Years | 0 (0.0%) | 0 (0.0%) |
| 75 Years and over | 0 (0.0%) | 0 (0.0%) |
| Total | 365 (60.5%) | 335 (65.8%) |
Income Above Poverty by Sex and Age in Palmona Park
According to the poverty statistics in Palmona Park, males aged under 5 years and females aged 15 years are the age groups that are most secure financially, with 100.0% of males and 100.0% of females in these age groups living above the poverty line.
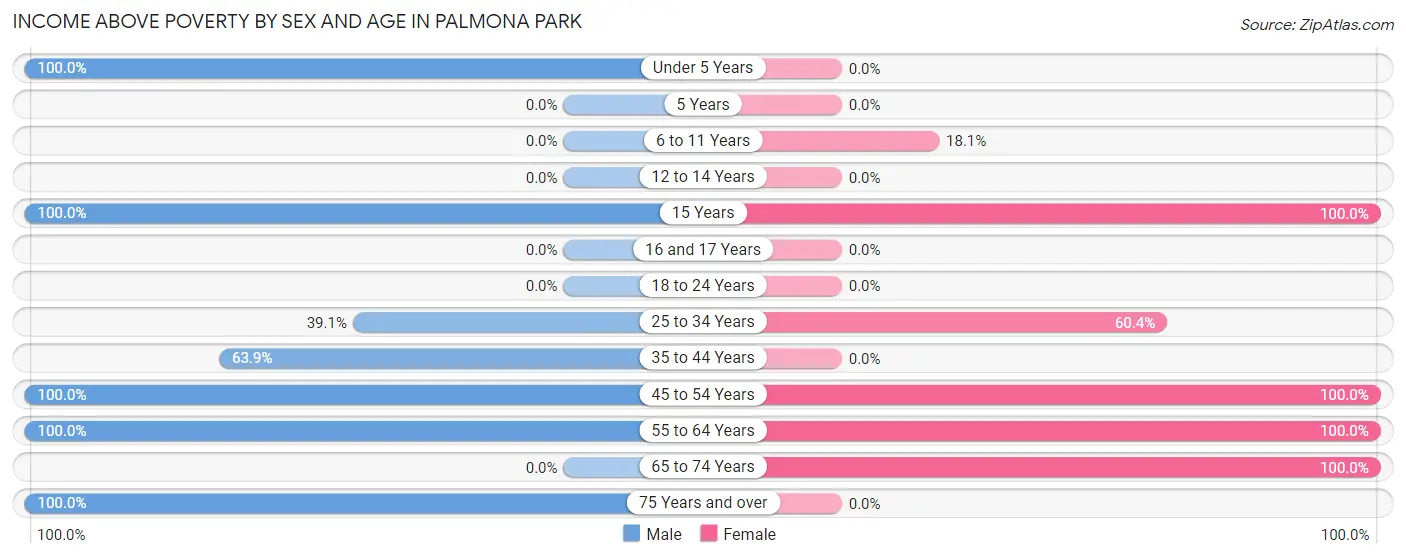
| Age Bracket | Male | Female |
| Under 5 Years | 52 (100.0%) | 0 (0.0%) |
| 5 Years | 0 (0.0%) | 0 (0.0%) |
| 6 to 11 Years | 0 (0.0%) | 26 (18.1%) |
| 12 to 14 Years | 0 (0.0%) | 0 (0.0%) |
| 15 Years | 21 (100.0%) | 27 (100.0%) |
| 16 and 17 Years | 0 (0.0%) | 0 (0.0%) |
| 18 to 24 Years | 0 (0.0%) | 0 (0.0%) |
| 25 to 34 Years | 77 (39.1%) | 32 (60.4%) |
| 35 to 44 Years | 23 (63.9%) | 0 (0.0%) |
| 45 to 54 Years | 13 (100.0%) | 14 (100.0%) |
| 55 to 64 Years | 25 (100.0%) | 22 (100.0%) |
| 65 to 74 Years | 0 (0.0%) | 53 (100.0%) |
| 75 Years and over | 27 (100.0%) | 0 (0.0%) |
| Total | 238 (39.5%) | 174 (34.2%) |
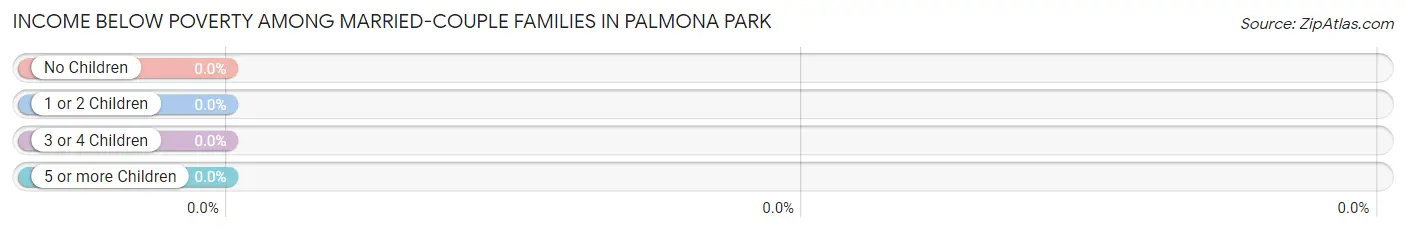
Income Below Poverty Among Married-Couple Families in Palmona Park
| Children | Above Poverty | Below Poverty |
| No Children | 14 (100.0%) | 0 (0.0%) |
| 1 or 2 Children | 22 (100.0%) | 0 (0.0%) |
| 3 or 4 Children | 0 (0.0%) | 0 (0.0%) |
| 5 or more Children | 0 (0.0%) | 0 (0.0%) |
| Total | 36 (100.0%) | 0 (0.0%) |
Income Below Poverty Among Single-Parent Households in Palmona Park
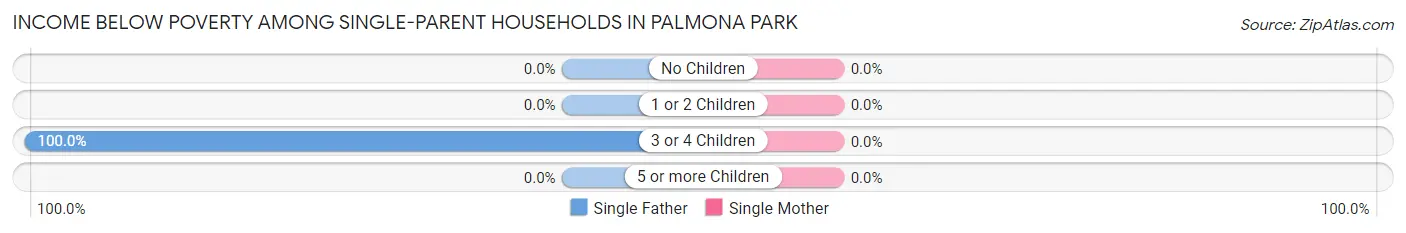
| Children | Single Father | Single Mother |
| No Children | 0 (0.0%) | 0 (0.0%) |
| 1 or 2 Children | 0 (0.0%) | 0 (0.0%) |
| 3 or 4 Children | 120 (100.0%) | 0 (0.0%) |
| 5 or more Children | 0 (0.0%) | 0 (0.0%) |
| Total | 120 (73.6%) | 0 (0.0%) |
Income Below Poverty Among Married-Couple vs Single-Parent Households in Palmona Park
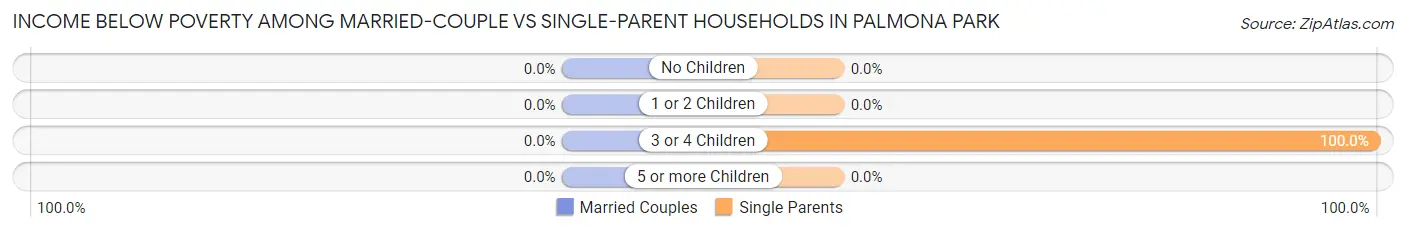
| Children | Married-Couple Families | Single-Parent Households |
| No Children | 0 (0.0%) | 0 (0.0%) |
| 1 or 2 Children | 0 (0.0%) | 0 (0.0%) |
| 3 or 4 Children | 0 (0.0%) | 120 (100.0%) |
| 5 or more Children | 0 (0.0%) | 0 (0.0%) |
| Total | 0 (0.0%) | 120 (61.5%) |
Race in Palmona Park
The most populous races in Palmona Park are Hispanic or Latino (666 | 59.9%), Some other Race (666 | 59.9%), and White / Caucasian (446 | 40.1%).
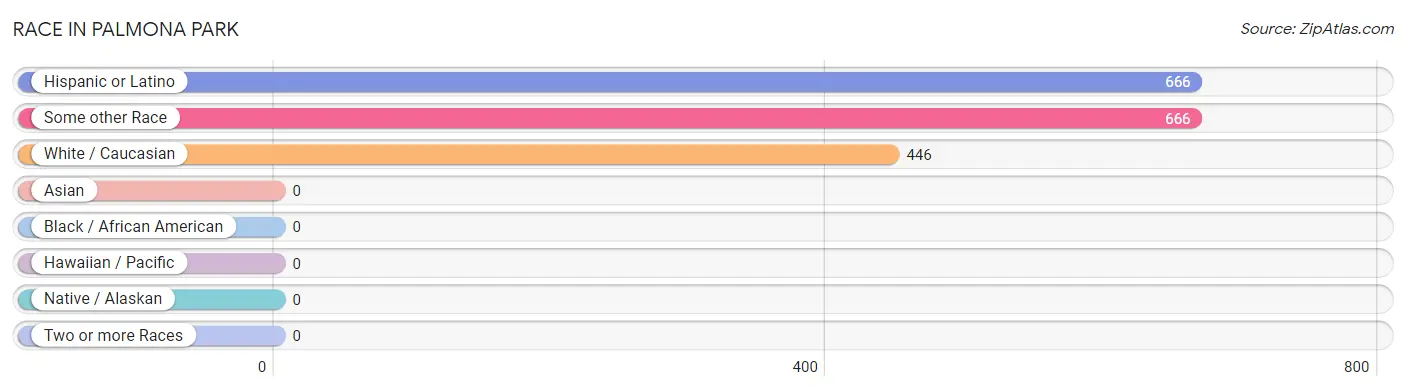
| Race | # Population | % Population |
| Asian | 0 | 0.0% |
| Black / African American | 0 | 0.0% |
| Hawaiian / Pacific | 0 | 0.0% |
| Hispanic or Latino | 666 | 59.9% |
| Native / Alaskan | 0 | 0.0% |
| White / Caucasian | 446 | 40.1% |
| Two or more Races | 0 | 0.0% |
| Some other Race | 666 | 59.9% |
| Total | 1,112 | 100.0% |
Ancestry in Palmona Park
The most populous ancestries reported in Palmona Park are Central American (666 | 59.9%), Guatemalan (666 | 59.9%), Irish (112 | 10.1%), English (94 | 8.5%), and American (76 | 6.8%), together accounting for 145.1% of all Palmona Park residents.
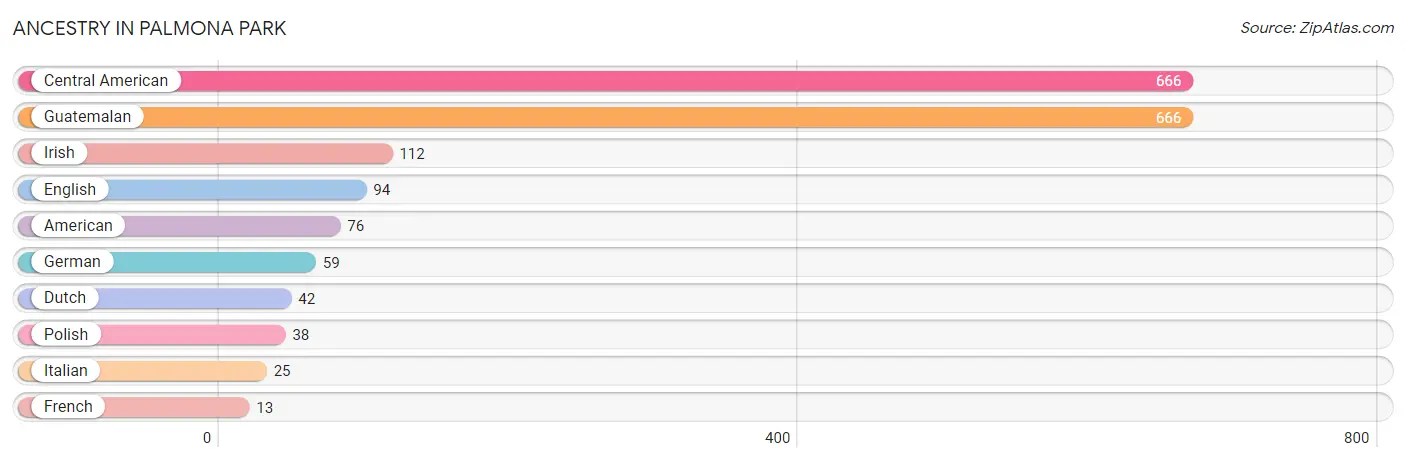
| Ancestry | # Population | % Population |
| American | 76 | 6.8% |
| Central American | 666 | 59.9% |
| Dutch | 42 | 3.8% |
| English | 94 | 8.5% |
| French | 13 | 1.2% |
| German | 59 | 5.3% |
| Guatemalan | 666 | 59.9% |
| Irish | 112 | 10.1% |
| Italian | 25 | 2.2% |
| Polish | 38 | 3.4% | View All 10 Rows |
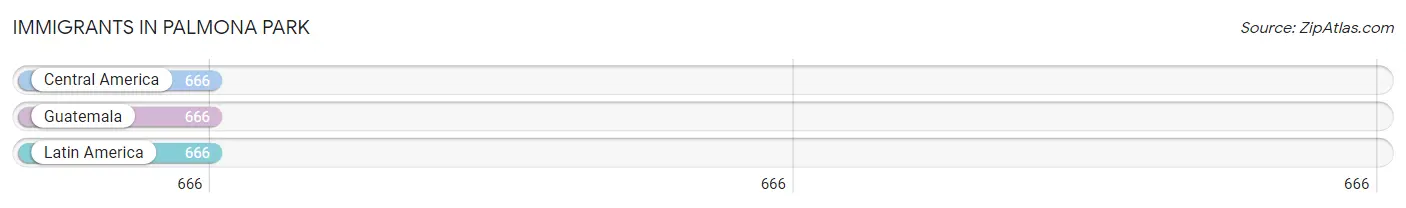
Immigrants in Palmona Park
The most numerous immigrant groups reported in Palmona Park came from Central America (666 | 59.9%), Guatemala (666 | 59.9%), and Latin America (666 | 59.9%), together accounting for 179.7% of all Palmona Park residents.
| Immigration Origin | # Population | % Population |
| Central America | 666 | 59.9% |
| Guatemala | 666 | 59.9% |
| Latin America | 666 | 59.9% | View All 3 Rows |
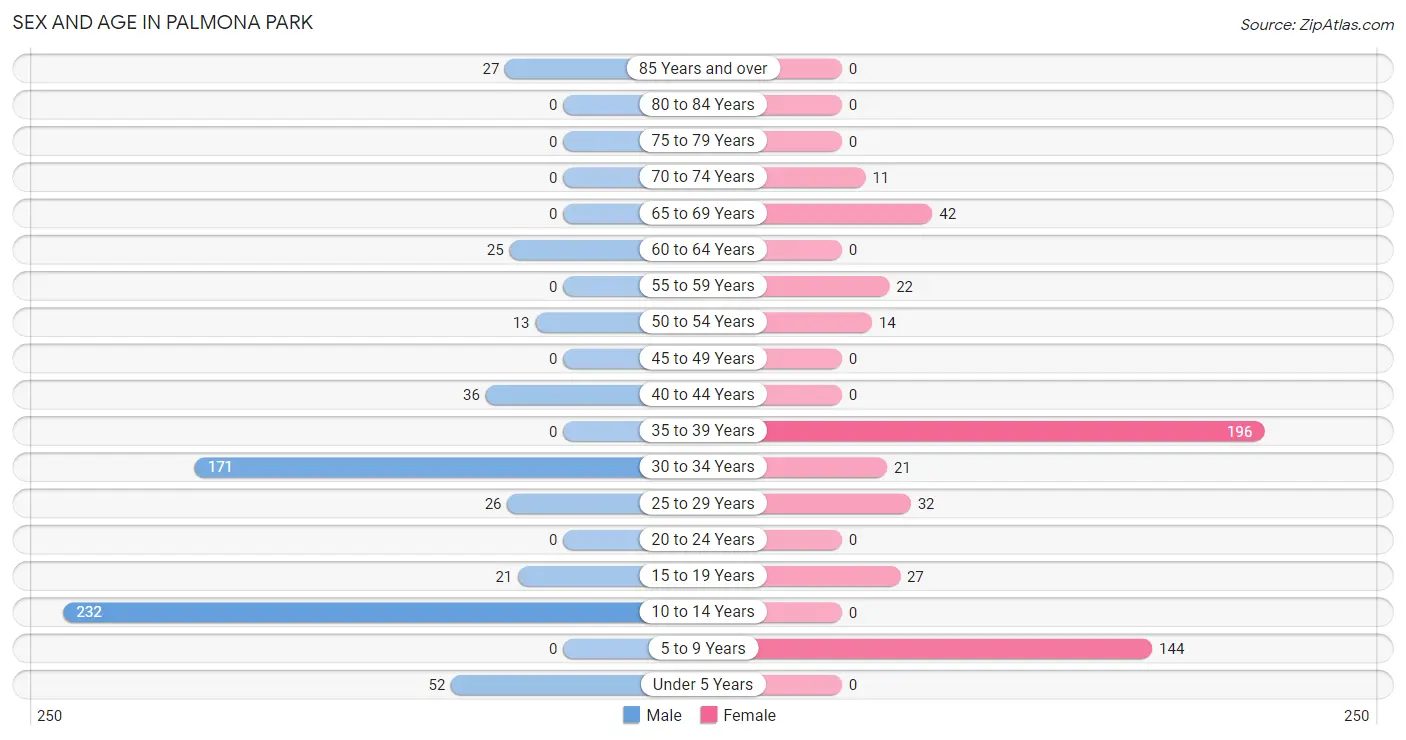
Sex and Age in Palmona Park
Sex and Age in Palmona Park
The most populous age groups in Palmona Park are 10 to 14 Years (232 | 38.5%) for men and 35 to 39 Years (196 | 38.5%) for women.
| Age Bracket | Male | Female |
| Under 5 Years | 52 (8.6%) | 0 (0.0%) |
| 5 to 9 Years | 0 (0.0%) | 144 (28.3%) |
| 10 to 14 Years | 232 (38.5%) | 0 (0.0%) |
| 15 to 19 Years | 21 (3.5%) | 27 (5.3%) |
| 20 to 24 Years | 0 (0.0%) | 0 (0.0%) |
| 25 to 29 Years | 26 (4.3%) | 32 (6.3%) |
| 30 to 34 Years | 171 (28.4%) | 21 (4.1%) |
| 35 to 39 Years | 0 (0.0%) | 196 (38.5%) |
| 40 to 44 Years | 36 (6.0%) | 0 (0.0%) |
| 45 to 49 Years | 0 (0.0%) | 0 (0.0%) |
| 50 to 54 Years | 13 (2.2%) | 14 (2.8%) |
| 55 to 59 Years | 0 (0.0%) | 22 (4.3%) |
| 60 to 64 Years | 25 (4.2%) | 0 (0.0%) |
| 65 to 69 Years | 0 (0.0%) | 42 (8.3%) |
| 70 to 74 Years | 0 (0.0%) | 11 (2.2%) |
| 75 to 79 Years | 0 (0.0%) | 0 (0.0%) |
| 80 to 84 Years | 0 (0.0%) | 0 (0.0%) |
| 85 Years and over | 27 (4.5%) | 0 (0.0%) |
| Total | 603 (100.0%) | 509 (100.0%) |
Families and Households in Palmona Park
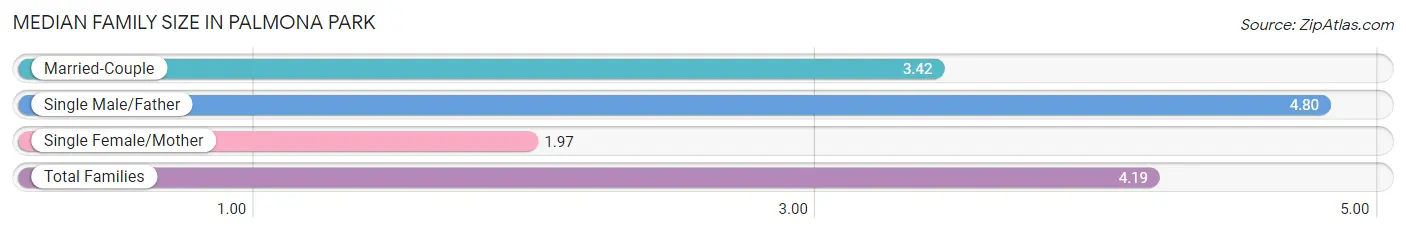
Median Family Size in Palmona Park
The median family size in Palmona Park is 4.19 persons per family, with single male/father families (163 | 70.6%) accounting for the largest median family size of 4.8 persons per family. On the other hand, single female/mother families (32 | 13.9%) represent the smallest median family size with 1.97 persons per family.
| Family Type | # Families | Family Size |
| Married-Couple | 36 (15.6%) | 3.42 |
| Single Male/Father | 163 (70.6%) | 4.80 |
| Single Female/Mother | 32 (13.9%) | 1.97 |
| Total Families | 231 (100.0%) | 4.19 |
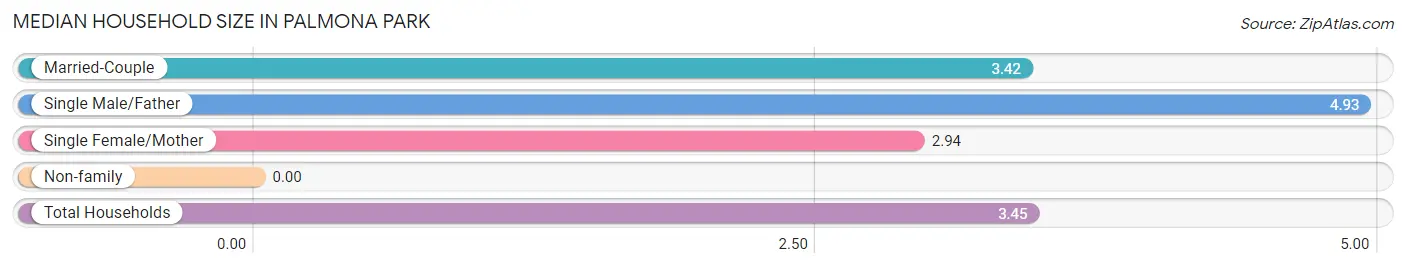
Median Household Size in Palmona Park
| Household Type | # Households | Household Size |
| Married-Couple | 36 (11.2%) | 3.42 |
| Single Male/Father | 163 (50.6%) | 4.93 |
| Single Female/Mother | 32 (9.9%) | 2.94 |
| Non-family | 91 (28.3%) | - |
| Total Households | 322 (100.0%) | 3.45 |
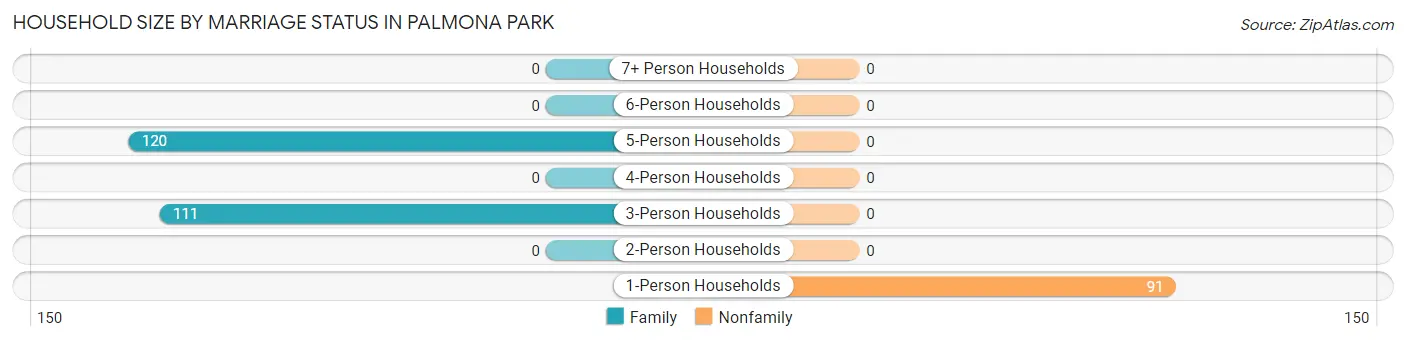
Household Size by Marriage Status in Palmona Park
Out of a total of 322 households in Palmona Park, 231 (71.7%) are family households, while 91 (28.3%) are nonfamily households. The most numerous type of family households are 5-person households, comprising 120, and the most common type of nonfamily households are 1-person households, comprising 91.
| Household Size | Family Households | Nonfamily Households |
| 1-Person Households | - | 91 (28.3%) |
| 2-Person Households | 0 (0.0%) | 0 (0.0%) |
| 3-Person Households | 111 (34.5%) | 0 (0.0%) |
| 4-Person Households | 0 (0.0%) | 0 (0.0%) |
| 5-Person Households | 120 (37.3%) | 0 (0.0%) |
| 6-Person Households | 0 (0.0%) | 0 (0.0%) |
| 7+ Person Households | 0 (0.0%) | 0 (0.0%) |
| Total | 231 (71.7%) | 91 (28.3%) |
Female Fertility in Palmona Park
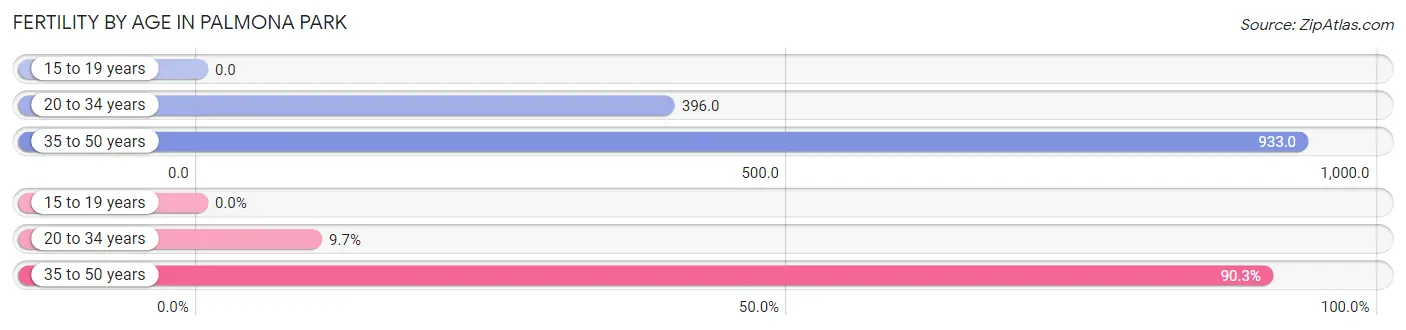
Fertility by Age in Palmona Park
Average fertility rate in Palmona Park is 748.0 births per 1,000 women. Women in the age bracket of 35 to 50 years have the highest fertility rate with 933.0 births per 1,000 women. Women in the age bracket of 35 to 50 years acount for 90.3% of all women with births.
| Age Bracket | Women with Births | Births / 1,000 Women |
| 15 to 19 years | 0 (0.0%) | 0.0 |
| 20 to 34 years | 21 (9.7%) | 396.0 |
| 35 to 50 years | 196 (90.3%) | 933.0 |
| Total | 217 (100.0%) | 748.0 |
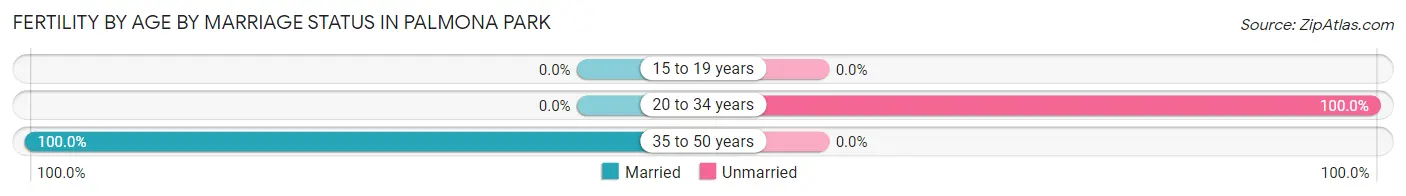
Fertility by Age by Marriage Status in Palmona Park
90.3% of women with births (217) in Palmona Park are married. The highest percentage of unmarried women with births falls into 20 to 34 years age bracket with 100.0% of them unmarried at the time of birth, while the lowest percentage of unmarried women with births belong to 35 to 50 years age bracket with 0.0% of them unmarried.
| Age Bracket | Married | Unmarried |
| 15 to 19 years | 0 (0.0%) | 0 (0.0%) |
| 20 to 34 years | 0 (0.0%) | 21 (100.0%) |
| 35 to 50 years | 196 (100.0%) | 0 (0.0%) |
| Total | 196 (90.3%) | 21 (9.7%) |
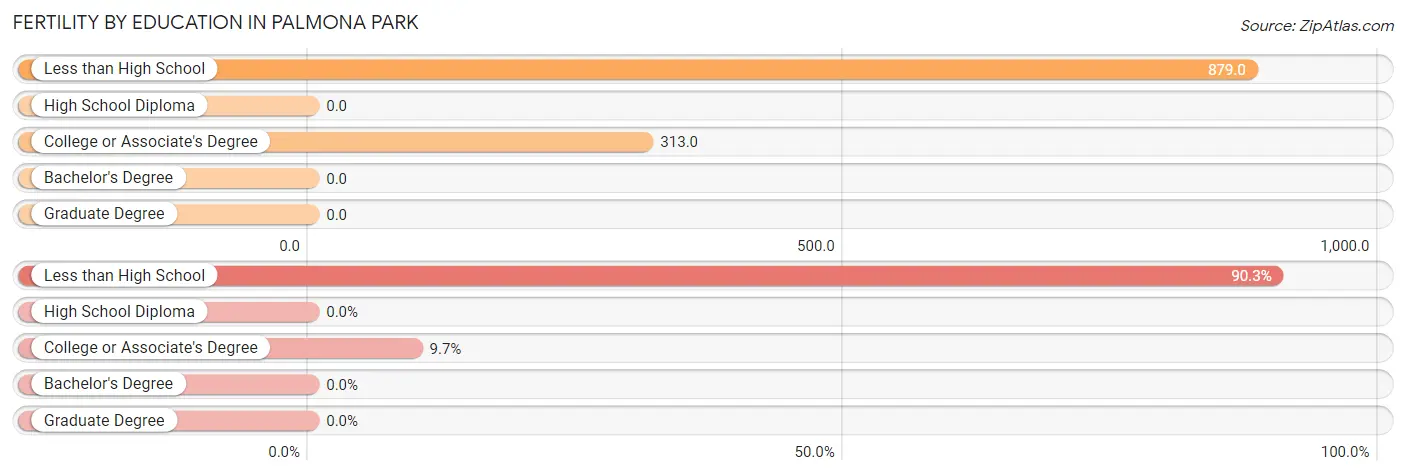
Fertility by Education in Palmona Park
| Educational Attainment | Women with Births | Births / 1,000 Women |
| Less than High School | 196 (90.3%) | 879.0 |
| High School Diploma | 0 (0.0%) | 0.0 |
| College or Associate's Degree | 21 (9.7%) | 313.0 |
| Bachelor's Degree | 0 (0.0%) | 0.0 |
| Graduate Degree | 0 (0.0%) | 0.0 |
| Total | 217 (100.0%) | 748.0 |
Fertility by Education by Marriage Status in Palmona Park
9.7% of women with births in Palmona Park are unmarried. Women with the educational attainment of less than high school are most likely to be married with 100.0% of them married at childbirth, while women with the educational attainment of college or associate's degree are least likely to be married with 100.0% of them unmarried at childbirth.
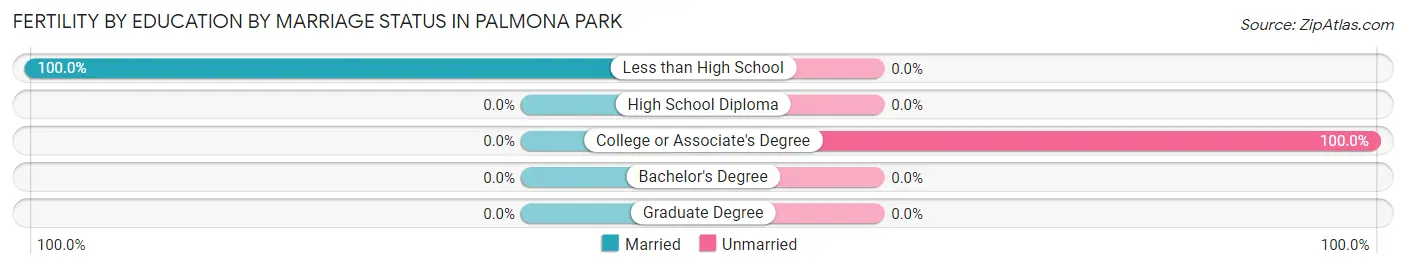
| Educational Attainment | Married | Unmarried |
| Less than High School | 196 (100.0%) | 0 (0.0%) |
| High School Diploma | 0 (0.0%) | 0 (0.0%) |
| College or Associate's Degree | 0 (0.0%) | 21 (100.0%) |
| Bachelor's Degree | 0 (0.0%) | 0 (0.0%) |
| Graduate Degree | 0 (0.0%) | 0 (0.0%) |
| Total | 196 (90.3%) | 21 (9.7%) |
Employment Characteristics in Palmona Park
Employment by Class of Employer in Palmona Park
Among the 352 employed individuals in Palmona Park, self-employed (not incorporated) (218 | 61.9%), private company employees (83 | 23.6%), and not-for-profit organizations (31 | 8.8%) make up the most common classes of employment.
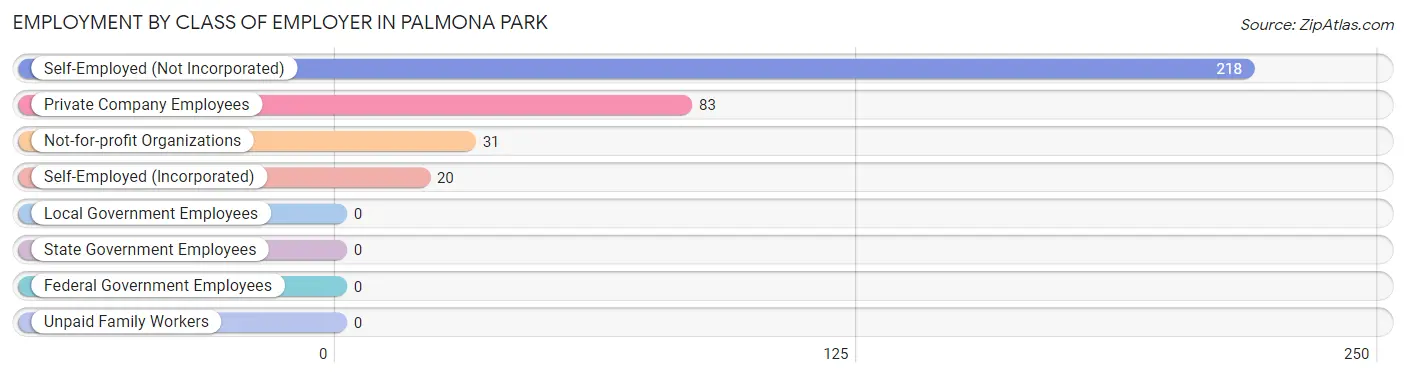
| Employer Class | # Employees | % Employees |
| Private Company Employees | 83 | 23.6% |
| Self-Employed (Incorporated) | 20 | 5.7% |
| Self-Employed (Not Incorporated) | 218 | 61.9% |
| Not-for-profit Organizations | 31 | 8.8% |
| Local Government Employees | 0 | 0.0% |
| State Government Employees | 0 | 0.0% |
| Federal Government Employees | 0 | 0.0% |
| Unpaid Family Workers | 0 | 0.0% |
| Total | 352 | 100.0% |
Employment Status by Age in Palmona Park
According to the labor force statistics for Palmona Park, out of the total population over 16 years of age (636), 61.2% or 389 individuals are in the labor force, with 5.9% or 23 of them unemployed. The age group with the highest labor force participation rate is 35 to 44 years, with 100.0% or 232 individuals in the labor force. Within the labor force, the 35 to 44 years age range has the highest percentage of unemployed individuals, with 9.9% or 23 of them being unemployed.
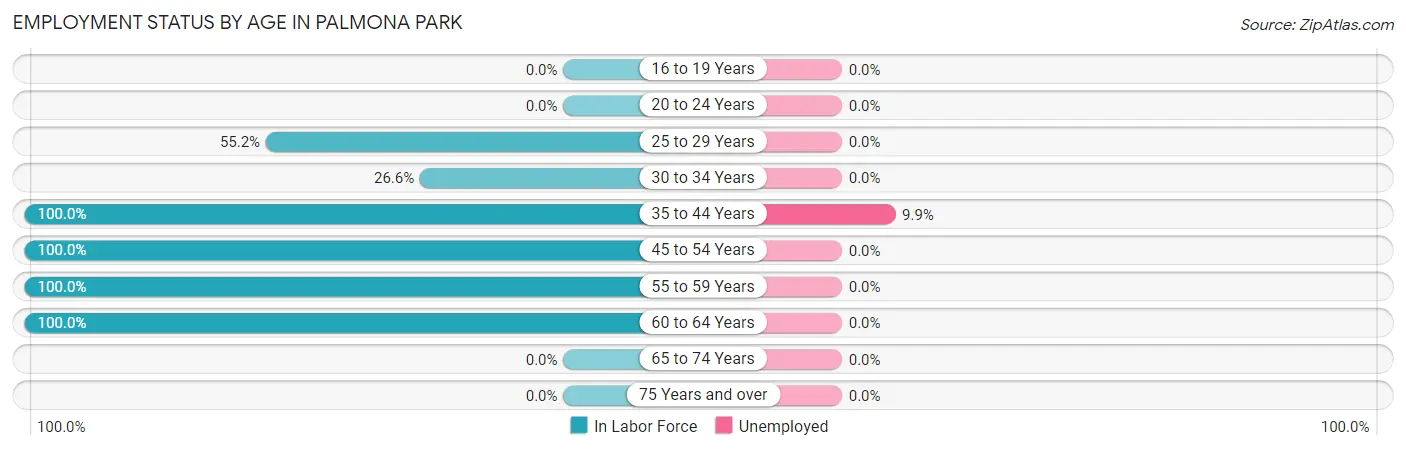
| Age Bracket | In Labor Force | Unemployed |
| 16 to 19 Years | 0 (0.0%) | 0 (0.0%) |
| 20 to 24 Years | 0 (0.0%) | 0 (0.0%) |
| 25 to 29 Years | 32 (55.2%) | 0 (0.0%) |
| 30 to 34 Years | 51 (26.6%) | 0 (0.0%) |
| 35 to 44 Years | 232 (100.0%) | 23 (9.9%) |
| 45 to 54 Years | 27 (100.0%) | 0 (0.0%) |
| 55 to 59 Years | 22 (100.0%) | 0 (0.0%) |
| 60 to 64 Years | 25 (100.0%) | 0 (0.0%) |
| 65 to 74 Years | 0 (0.0%) | 0 (0.0%) |
| 75 Years and over | 0 (0.0%) | 0 (0.0%) |
| Total | 389 (61.2%) | 23 (5.9%) |
Employment Status by Educational Attainment in Palmona Park
According to labor force statistics for Palmona Park, 70.0% of individuals (389) out of the total population between 25 and 64 years of age (556) are in the labor force, with 5.9% or 23 of them being unemployed. The group with the highest labor force participation rate are those with the educational attainment of high school diploma, with 100.0% or 83 individuals in the labor force. Within the labor force, individuals with high school diploma education have the highest percentage of unemployment, with 27.7% or 23 of them being unemployed.
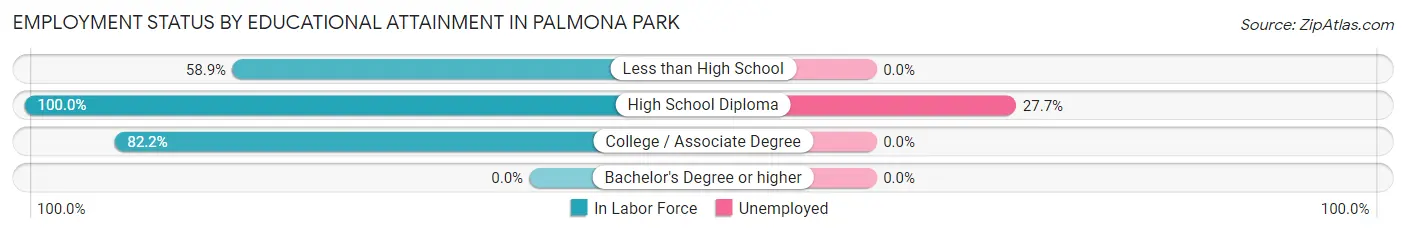
| Educational Attainment | In Labor Force | Unemployed |
| Less than High School | 209 (58.9%) | 0 (0.0%) |
| High School Diploma | 83 (100.0%) | 23 (27.7%) |
| College / Associate Degree | 97 (82.2%) | 0 (0.0%) |
| Bachelor's Degree or higher | 0 (0.0%) | 0 (0.0%) |
| Total | 389 (70.0%) | 33 (5.9%) |
Employment Occupations by Sex in Palmona Park
Management, Business, Science and Arts Occupations
The most common Management, Business, Science and Arts occupations in Palmona Park are Computers, Engineering & Science (31 | 8.5%), Computers & Mathematics (31 | 8.5%), Management (25 | 6.8%), and Health Diagnosing & Treating (14 | 3.8%).
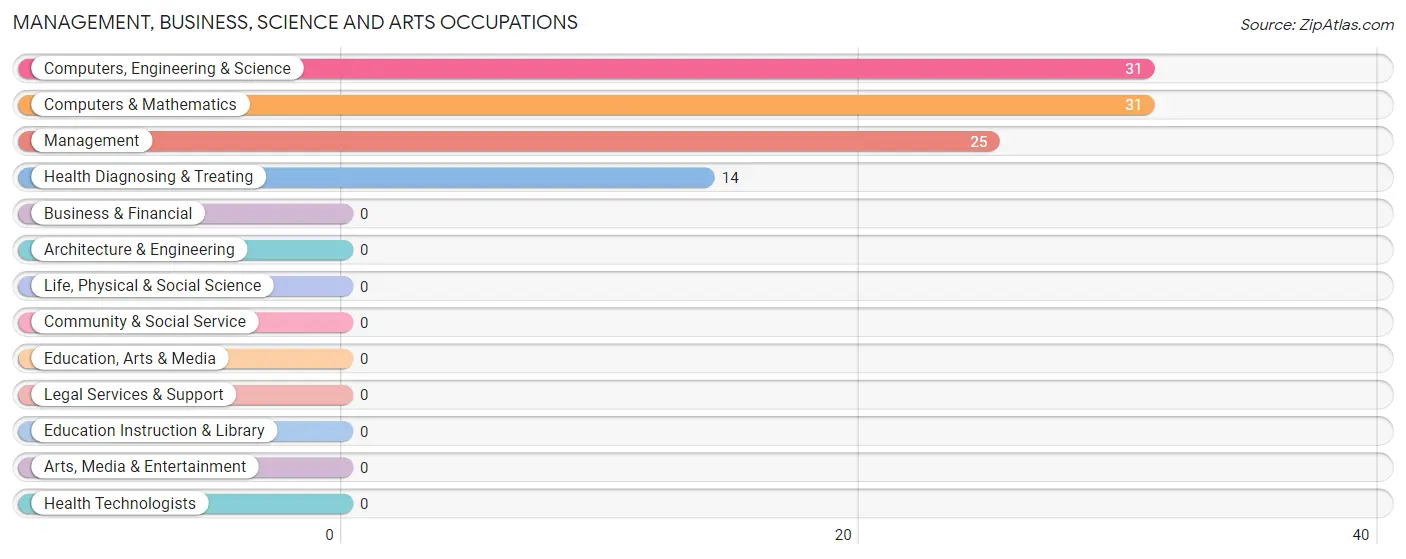
Management, Business, Science and Arts Occupations by Sex
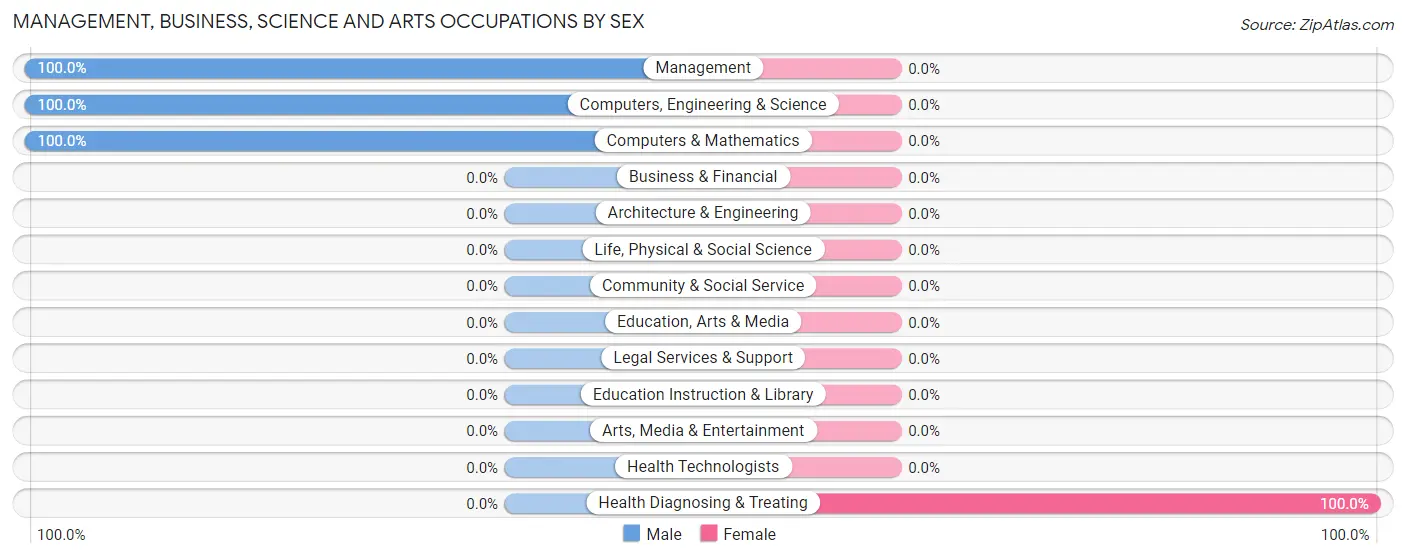
| Occupation | Male | Female |
| Management | 25 (100.0%) | 0 (0.0%) |
| Business & Financial | 0 (0.0%) | 0 (0.0%) |
| Computers, Engineering & Science | 31 (100.0%) | 0 (0.0%) |
| Computers & Mathematics | 31 (100.0%) | 0 (0.0%) |
| Architecture & Engineering | 0 (0.0%) | 0 (0.0%) |
| Life, Physical & Social Science | 0 (0.0%) | 0 (0.0%) |
| Community & Social Service | 0 (0.0%) | 0 (0.0%) |
| Education, Arts & Media | 0 (0.0%) | 0 (0.0%) |
| Legal Services & Support | 0 (0.0%) | 0 (0.0%) |
| Education Instruction & Library | 0 (0.0%) | 0 (0.0%) |
| Arts, Media & Entertainment | 0 (0.0%) | 0 (0.0%) |
| Health Diagnosing & Treating | 0 (0.0%) | 14 (100.0%) |
| Health Technologists | 0 (0.0%) | 0 (0.0%) |
| Total (Category) | 56 (80.0%) | 14 (20.0%) |
| Total (Overall) | 102 (27.9%) | 264 (72.1%) |
Services Occupations
The most common Services occupations in Palmona Park are Cleaning & Maintenance (22 | 6.0%), and Food Preparation & Serving (13 | 3.5%).
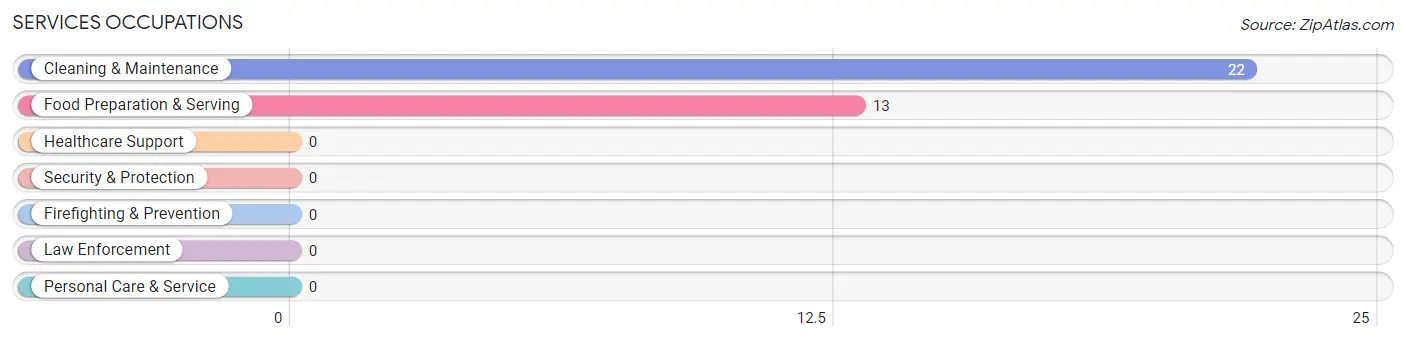
Services Occupations by Sex
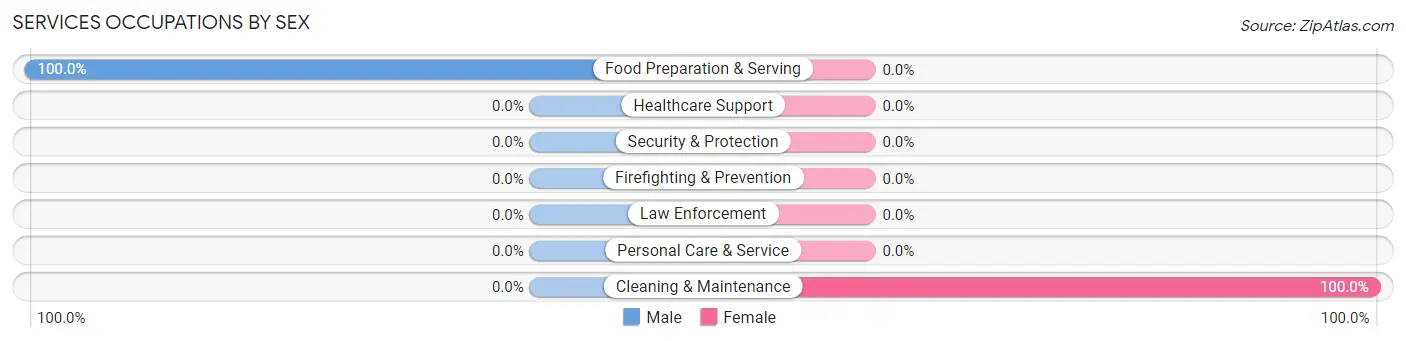
| Occupation | Male | Female |
| Healthcare Support | 0 (0.0%) | 0 (0.0%) |
| Security & Protection | 0 (0.0%) | 0 (0.0%) |
| Firefighting & Prevention | 0 (0.0%) | 0 (0.0%) |
| Law Enforcement | 0 (0.0%) | 0 (0.0%) |
| Food Preparation & Serving | 13 (100.0%) | 0 (0.0%) |
| Cleaning & Maintenance | 0 (0.0%) | 22 (100.0%) |
| Personal Care & Service | 0 (0.0%) | 0 (0.0%) |
| Total (Category) | 13 (37.1%) | 22 (62.9%) |
| Total (Overall) | 102 (27.9%) | 264 (72.1%) |
Sales and Office Occupations
The most common Sales and Office occupations in Palmona Park are Office & Administration (32 | 8.7%), and Sales & Related (13 | 3.5%).
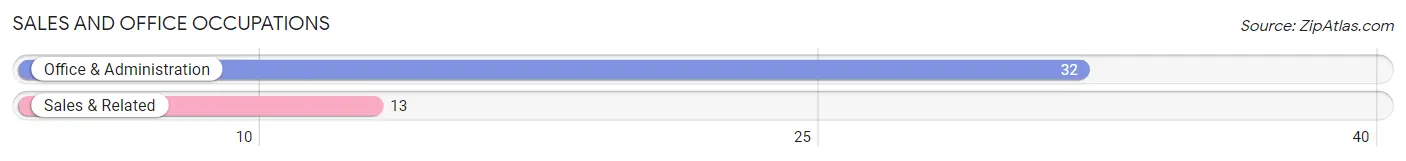
Sales and Office Occupations by Sex
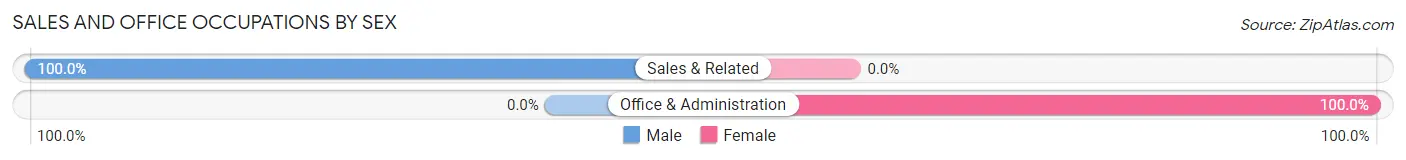
| Occupation | Male | Female |
| Sales & Related | 13 (100.0%) | 0 (0.0%) |
| Office & Administration | 0 (0.0%) | 32 (100.0%) |
| Total (Category) | 13 (28.9%) | 32 (71.1%) |
| Total (Overall) | 102 (27.9%) | 264 (72.1%) |
Natural Resources, Construction and Maintenance Occupations
The most common Natural Resources, Construction and Maintenance occupations in Palmona Park are , and Construction & Extraction (196 | 53.5%).
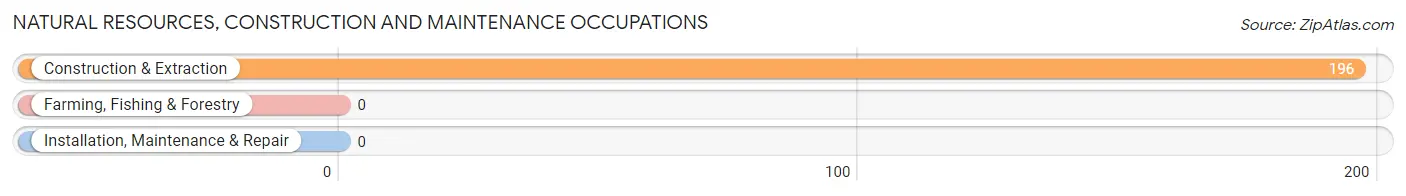
Natural Resources, Construction and Maintenance Occupations by Sex
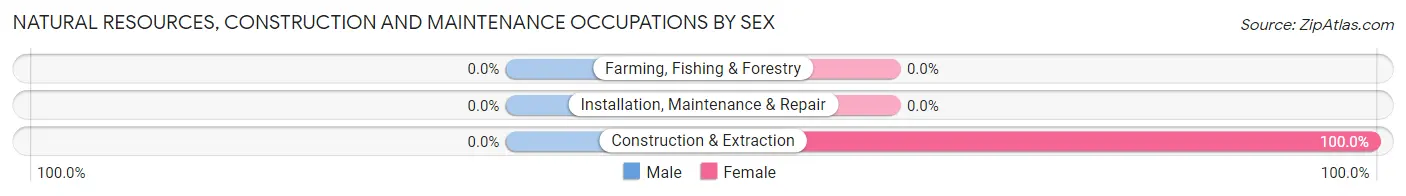
| Occupation | Male | Female |
| Farming, Fishing & Forestry | 0 (0.0%) | 0 (0.0%) |
| Construction & Extraction | 0 (0.0%) | 196 (100.0%) |
| Installation, Maintenance & Repair | 0 (0.0%) | 0 (0.0%) |
| Total (Category) | 0 (0.0%) | 196 (100.0%) |
| Total (Overall) | 102 (27.9%) | 264 (72.1%) |
Production, Transportation and Moving Occupations
The most common Production, Transportation and Moving occupations in Palmona Park are , and Material Moving (20 | 5.5%).
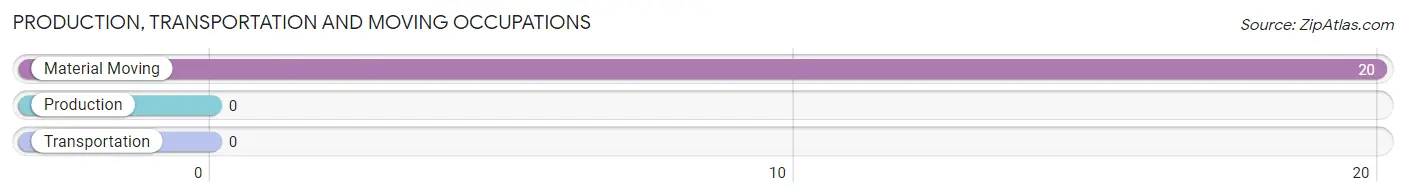
Production, Transportation and Moving Occupations by Sex
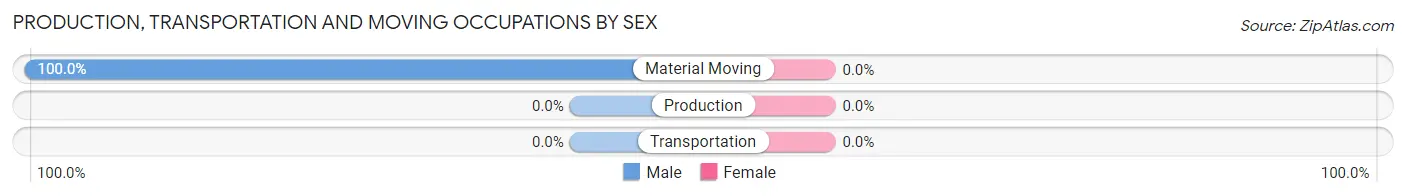
| Occupation | Male | Female |
| Production | 0 (0.0%) | 0 (0.0%) |
| Transportation | 0 (0.0%) | 0 (0.0%) |
| Material Moving | 20 (100.0%) | 0 (0.0%) |
| Total (Category) | 20 (100.0%) | 0 (0.0%) |
| Total (Overall) | 102 (27.9%) | 264 (72.1%) |
Employment Industries by Sex in Palmona Park
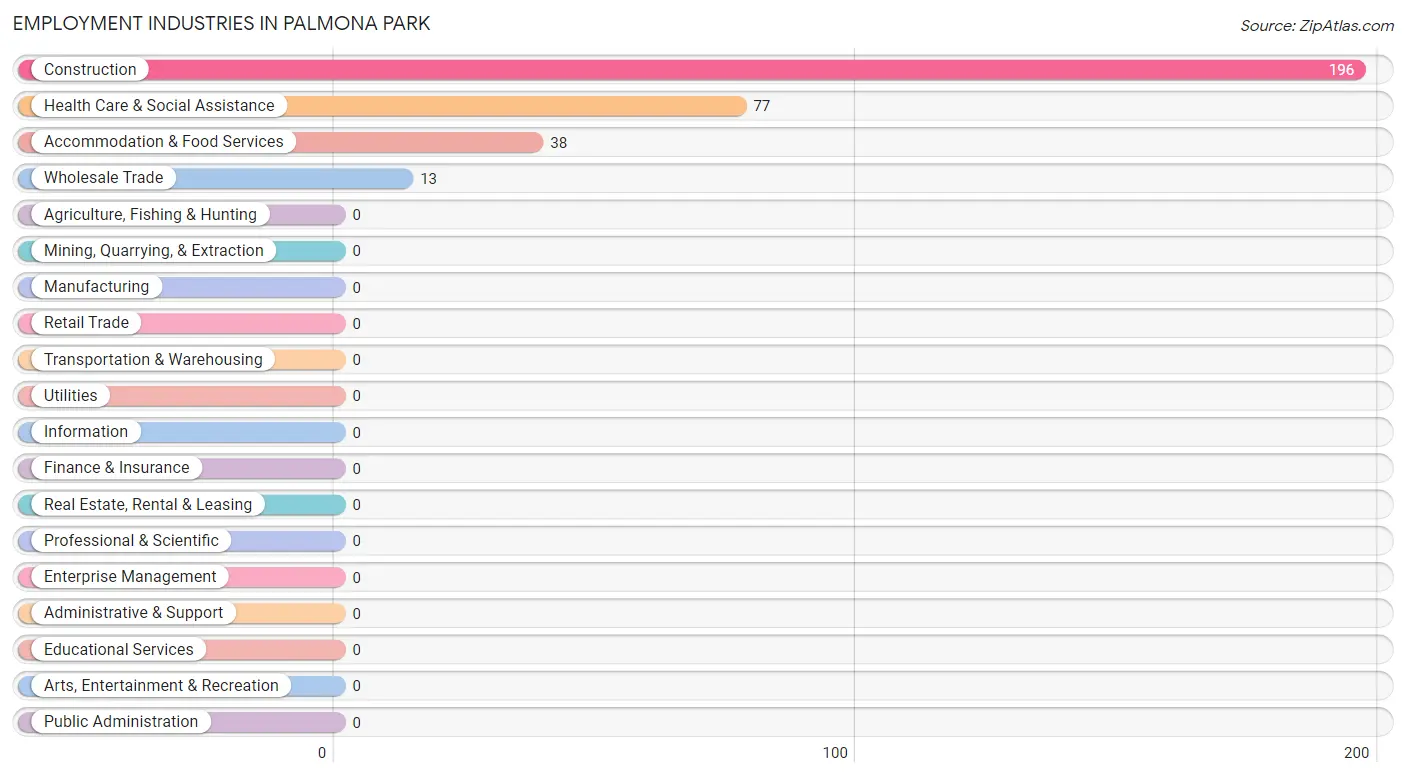
Employment Industries in Palmona Park
The major employment industries in Palmona Park include Construction (196 | 53.5%), Health Care & Social Assistance (77 | 21.0%), Accommodation & Food Services (38 | 10.4%), and Wholesale Trade (13 | 3.5%).
Employment Industries by Sex in Palmona Park
The Palmona Park industries that see more men than women are Wholesale Trade (100.0%), Accommodation & Food Services (100.0%), and Health Care & Social Assistance (40.3%), whereas the industries that tend to have a higher number of women are Construction (100.0%), and Health Care & Social Assistance (59.7%).
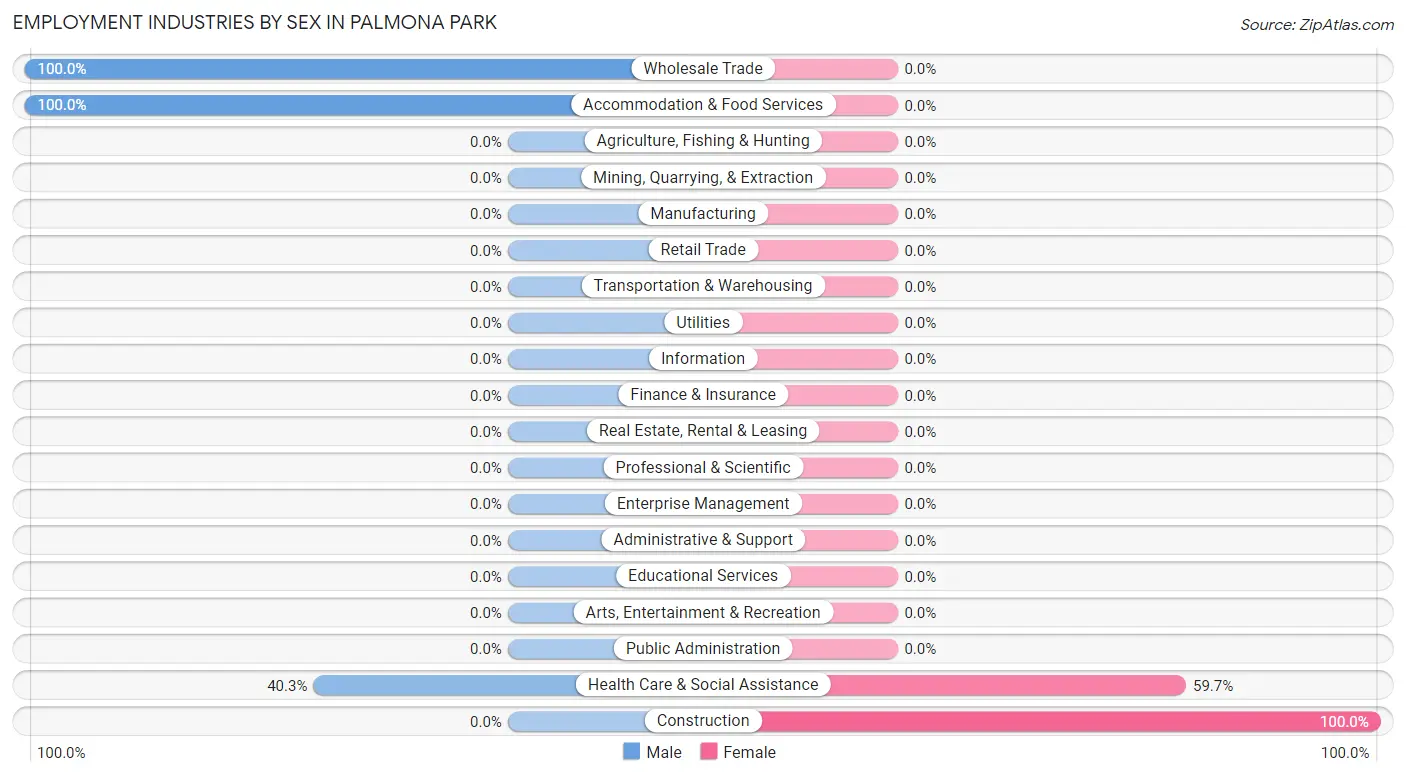
| Industry | Male | Female |
| Agriculture, Fishing & Hunting | 0 (0.0%) | 0 (0.0%) |
| Mining, Quarrying, & Extraction | 0 (0.0%) | 0 (0.0%) |
| Construction | 0 (0.0%) | 196 (100.0%) |
| Manufacturing | 0 (0.0%) | 0 (0.0%) |
| Wholesale Trade | 13 (100.0%) | 0 (0.0%) |
| Retail Trade | 0 (0.0%) | 0 (0.0%) |
| Transportation & Warehousing | 0 (0.0%) | 0 (0.0%) |
| Utilities | 0 (0.0%) | 0 (0.0%) |
| Information | 0 (0.0%) | 0 (0.0%) |
| Finance & Insurance | 0 (0.0%) | 0 (0.0%) |
| Real Estate, Rental & Leasing | 0 (0.0%) | 0 (0.0%) |
| Professional & Scientific | 0 (0.0%) | 0 (0.0%) |
| Enterprise Management | 0 (0.0%) | 0 (0.0%) |
| Administrative & Support | 0 (0.0%) | 0 (0.0%) |
| Educational Services | 0 (0.0%) | 0 (0.0%) |
| Health Care & Social Assistance | 31 (40.3%) | 46 (59.7%) |
| Arts, Entertainment & Recreation | 0 (0.0%) | 0 (0.0%) |
| Accommodation & Food Services | 38 (100.0%) | 0 (0.0%) |
| Public Administration | 0 (0.0%) | 0 (0.0%) |
| Total | 102 (27.9%) | 264 (72.1%) |
Education in Palmona Park
School Enrollment in Palmona Park
The most common levels of schooling among the 606 students in Palmona Park are elementary school (260 | 42.9%), middle school (257 | 42.4%), and nursery / preschool (31 | 5.1%).
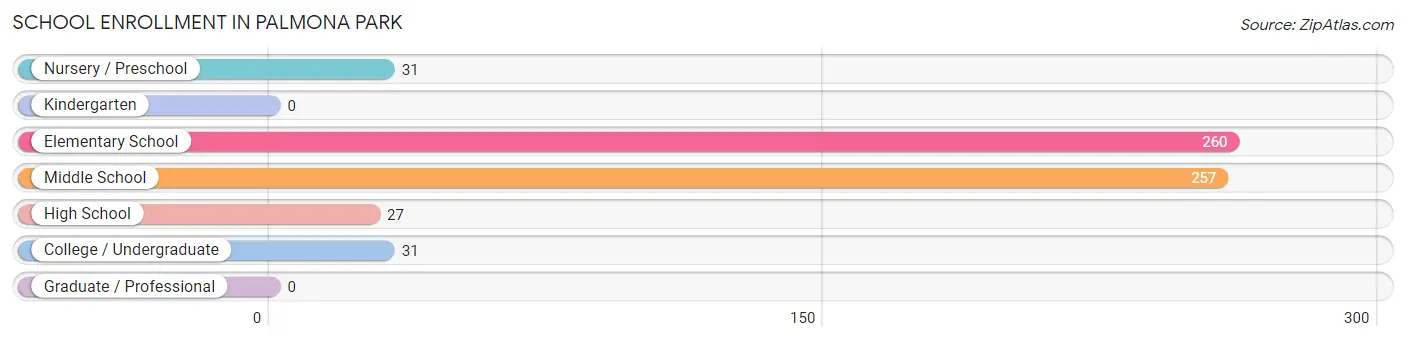
| School Level | # Students | % Students |
| Nursery / Preschool | 31 | 5.1% |
| Kindergarten | 0 | 0.0% |
| Elementary School | 260 | 42.9% |
| Middle School | 257 | 42.4% |
| High School | 27 | 4.5% |
| College / Undergraduate | 31 | 5.1% |
| Graduate / Professional | 0 | 0.0% |
| Total | 606 | 100.0% |
School Enrollment by Age by Funding Source in Palmona Park
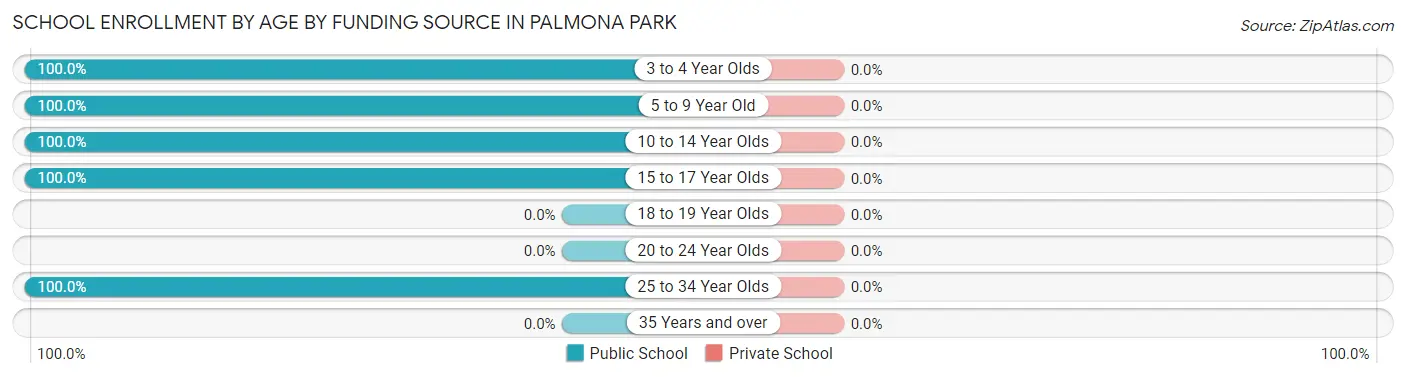
| Age Bracket | Public School | Private School |
| 3 to 4 Year Olds | 31 (100.0%) | 0 (0.0%) |
| 5 to 9 Year Old | 144 (100.0%) | 0 (0.0%) |
| 10 to 14 Year Olds | 232 (100.0%) | 0 (0.0%) |
| 15 to 17 Year Olds | 48 (100.0%) | 0 (0.0%) |
| 18 to 19 Year Olds | 0 (0.0%) | 0 (0.0%) |
| 20 to 24 Year Olds | 0 (0.0%) | 0 (0.0%) |
| 25 to 34 Year Olds | 151 (100.0%) | 0 (0.0%) |
| 35 Years and over | 0 (0.0%) | 0 (0.0%) |
| Total | 606 (100.0%) | 0 (0.0%) |
Educational Attainment by Field of Study in Palmona Park
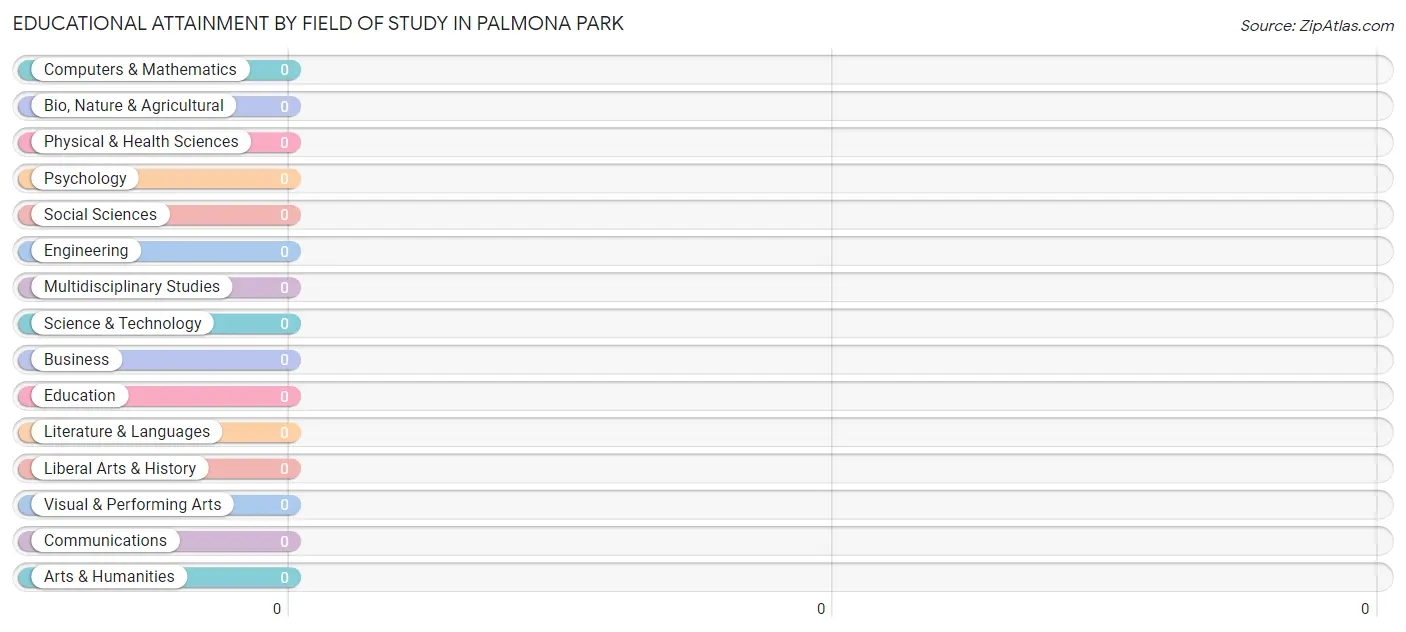
| Field of Study | # Graduates | % Graduates |
| Computers & Mathematics | 0 | 0.0% |
| Bio, Nature & Agricultural | 0 | 0.0% |
| Physical & Health Sciences | 0 | 0.0% |
| Psychology | 0 | 0.0% |
| Social Sciences | 0 | 0.0% |
| Engineering | 0 | 0.0% |
| Multidisciplinary Studies | 0 | 0.0% |
| Science & Technology | 0 | 0.0% |
| Business | 0 | 0.0% |
| Education | 0 | 0.0% |
| Literature & Languages | 0 | 0.0% |
| Liberal Arts & History | 0 | 0.0% |
| Visual & Performing Arts | 0 | 0.0% |
| Communications | 0 | 0.0% |
| Arts & Humanities | 0 | 0.0% |
| Total | 0 | 0.0% |
Transportation & Commute in Palmona Park
Vehicle Availability by Sex in Palmona Park
The most prevalent vehicle ownership categories in Palmona Park are males with 2 vehicles (64, accounting for 62.7%) and females with 2 vehicles (228, making up 25.6%).
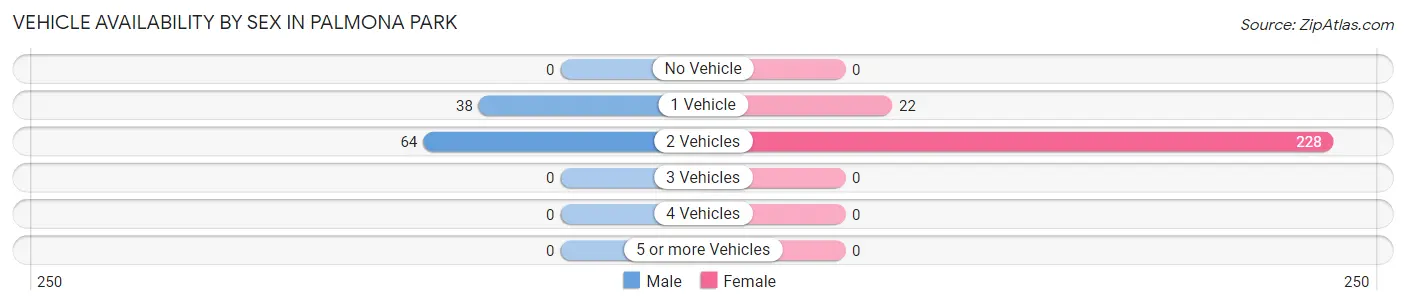
| Vehicles Available | Male | Female |
| No Vehicle | 0 (0.0%) | 0 (0.0%) |
| 1 Vehicle | 38 (37.2%) | 22 (8.8%) |
| 2 Vehicles | 64 (62.7%) | 228 (91.2%) |
| 3 Vehicles | 0 (0.0%) | 0 (0.0%) |
| 4 Vehicles | 0 (0.0%) | 0 (0.0%) |
| 5 or more Vehicles | 0 (0.0%) | 0 (0.0%) |
| Total | 102 (100.0%) | 250 (100.0%) |
Commute Time in Palmona Park
The most frequently occuring commute durations in Palmona Park are 5 to 9 minutes (196 commuters, 55.7%), 15 to 19 minutes (57 commuters, 16.2%), and 10 to 14 minutes (54 commuters, 15.3%).
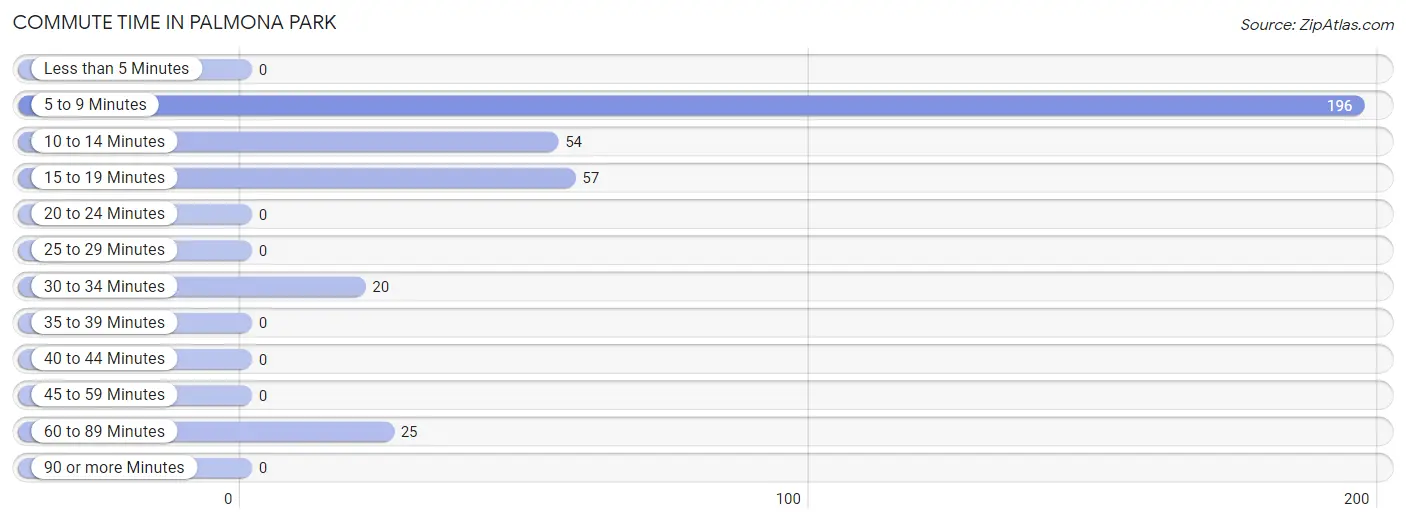
| Commute Time | # Commuters | % Commuters |
| Less than 5 Minutes | 0 | 0.0% |
| 5 to 9 Minutes | 196 | 55.7% |
| 10 to 14 Minutes | 54 | 15.3% |
| 15 to 19 Minutes | 57 | 16.2% |
| 20 to 24 Minutes | 0 | 0.0% |
| 25 to 29 Minutes | 0 | 0.0% |
| 30 to 34 Minutes | 20 | 5.7% |
| 35 to 39 Minutes | 0 | 0.0% |
| 40 to 44 Minutes | 0 | 0.0% |
| 45 to 59 Minutes | 0 | 0.0% |
| 60 to 89 Minutes | 25 | 7.1% |
| 90 or more Minutes | 0 | 0.0% |
Commute Time by Sex in Palmona Park
The most common commute times in Palmona Park are 15 to 19 minutes (57 commuters, 55.9%) for males and 5 to 9 minutes (196 commuters, 78.4%) for females.
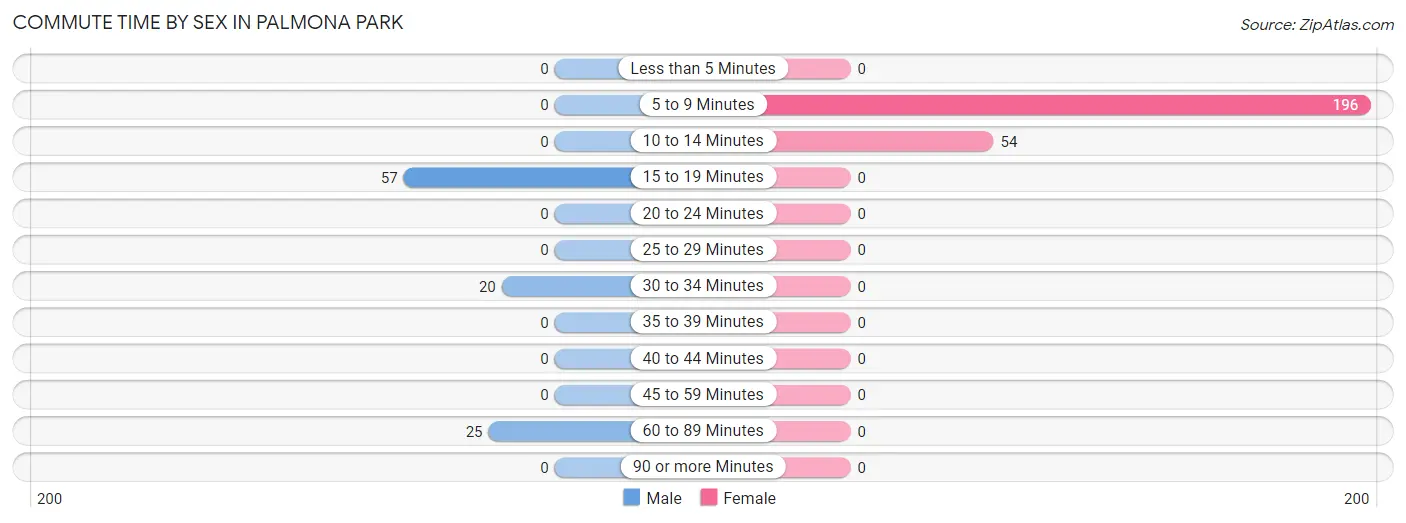
| Commute Time | Male | Female |
| Less than 5 Minutes | 0 (0.0%) | 0 (0.0%) |
| 5 to 9 Minutes | 0 (0.0%) | 196 (78.4%) |
| 10 to 14 Minutes | 0 (0.0%) | 54 (21.6%) |
| 15 to 19 Minutes | 57 (55.9%) | 0 (0.0%) |
| 20 to 24 Minutes | 0 (0.0%) | 0 (0.0%) |
| 25 to 29 Minutes | 0 (0.0%) | 0 (0.0%) |
| 30 to 34 Minutes | 20 (19.6%) | 0 (0.0%) |
| 35 to 39 Minutes | 0 (0.0%) | 0 (0.0%) |
| 40 to 44 Minutes | 0 (0.0%) | 0 (0.0%) |
| 45 to 59 Minutes | 0 (0.0%) | 0 (0.0%) |
| 60 to 89 Minutes | 25 (24.5%) | 0 (0.0%) |
| 90 or more Minutes | 0 (0.0%) | 0 (0.0%) |
Time of Departure to Work by Sex in Palmona Park
The most frequent times of departure to work in Palmona Park are 6:00 AM to 6:29 AM (38, 37.2%) for males and 7:00 AM to 7:29 AM (196, 78.4%) for females.
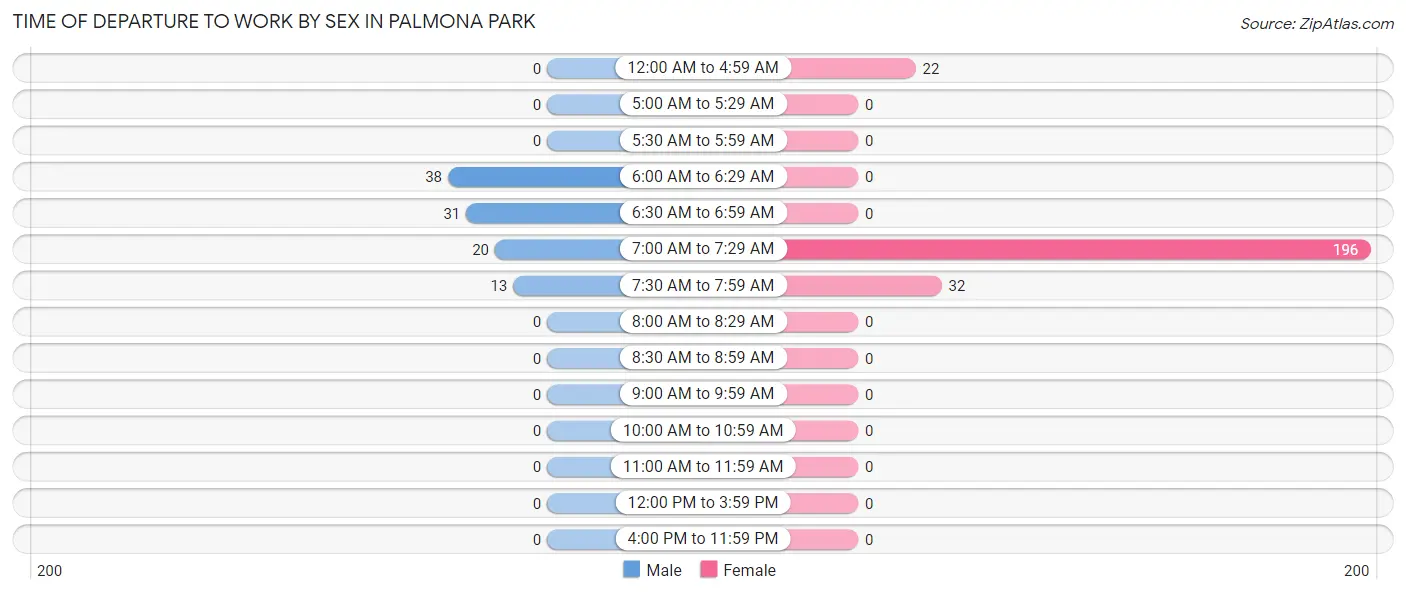
| Time of Departure | Male | Female |
| 12:00 AM to 4:59 AM | 0 (0.0%) | 22 (8.8%) |
| 5:00 AM to 5:29 AM | 0 (0.0%) | 0 (0.0%) |
| 5:30 AM to 5:59 AM | 0 (0.0%) | 0 (0.0%) |
| 6:00 AM to 6:29 AM | 38 (37.2%) | 0 (0.0%) |
| 6:30 AM to 6:59 AM | 31 (30.4%) | 0 (0.0%) |
| 7:00 AM to 7:29 AM | 20 (19.6%) | 196 (78.4%) |
| 7:30 AM to 7:59 AM | 13 (12.8%) | 32 (12.8%) |
| 8:00 AM to 8:29 AM | 0 (0.0%) | 0 (0.0%) |
| 8:30 AM to 8:59 AM | 0 (0.0%) | 0 (0.0%) |
| 9:00 AM to 9:59 AM | 0 (0.0%) | 0 (0.0%) |
| 10:00 AM to 10:59 AM | 0 (0.0%) | 0 (0.0%) |
| 11:00 AM to 11:59 AM | 0 (0.0%) | 0 (0.0%) |
| 12:00 PM to 3:59 PM | 0 (0.0%) | 0 (0.0%) |
| 4:00 PM to 11:59 PM | 0 (0.0%) | 0 (0.0%) |
| Total | 102 (100.0%) | 250 (100.0%) |
Housing Occupancy in Palmona Park
Occupancy by Ownership in Palmona Park
Of the total 322 dwellings in Palmona Park, owner-occupied units account for 72 (22.4%), while renter-occupied units make up 250 (77.6%).
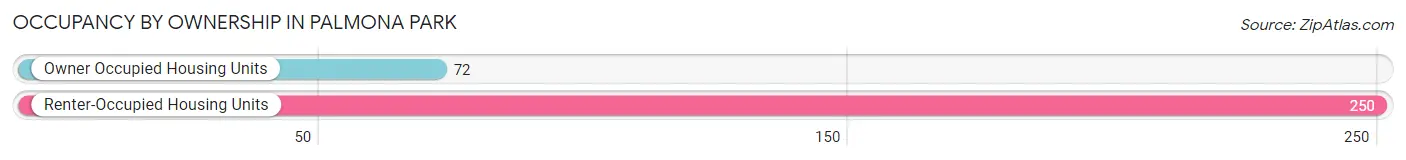
| Occupancy | # Housing Units | % Housing Units |
| Owner Occupied Housing Units | 72 | 22.4% |
| Renter-Occupied Housing Units | 250 | 77.6% |
| Total Occupied Housing Units | 322 | 100.0% |
Occupancy by Household Size in Palmona Park
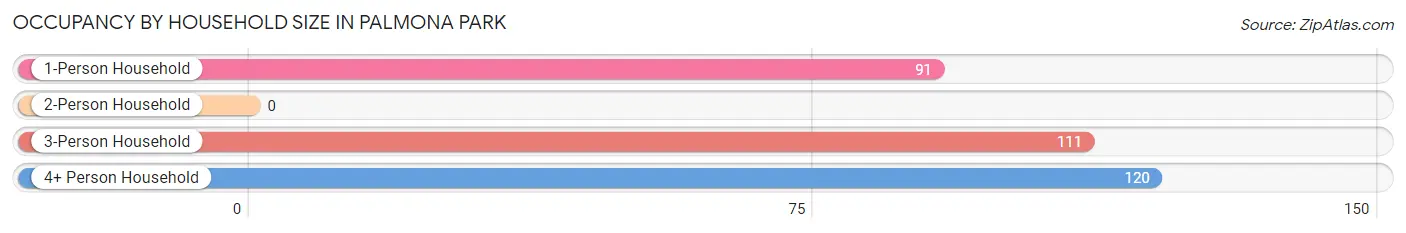
| Household Size | # Housing Units | % Housing Units |
| 1-Person Household | 91 | 28.3% |
| 2-Person Household | 0 | 0.0% |
| 3-Person Household | 111 | 34.5% |
| 4+ Person Household | 120 | 37.3% |
| Total Housing Units | 322 | 100.0% |
Occupancy by Ownership by Household Size in Palmona Park
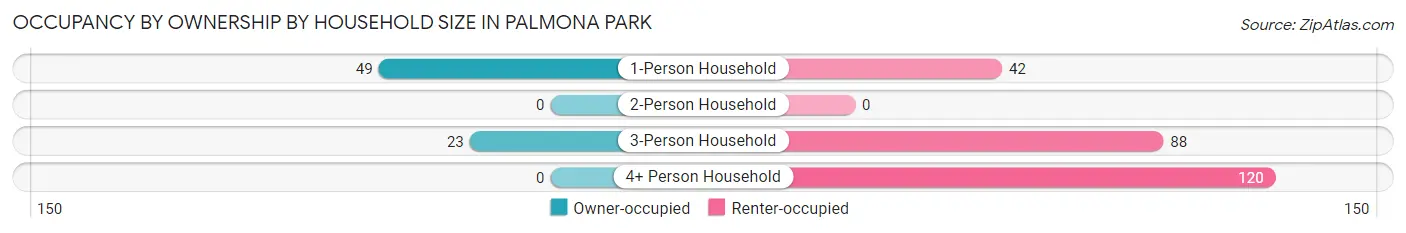
| Household Size | Owner-occupied | Renter-occupied |
| 1-Person Household | 49 (53.8%) | 42 (46.2%) |
| 2-Person Household | 0 (0.0%) | 0 (0.0%) |
| 3-Person Household | 23 (20.7%) | 88 (79.3%) |
| 4+ Person Household | 0 (0.0%) | 120 (100.0%) |
| Total Housing Units | 72 (22.4%) | 250 (77.6%) |
Occupancy by Educational Attainment in Palmona Park
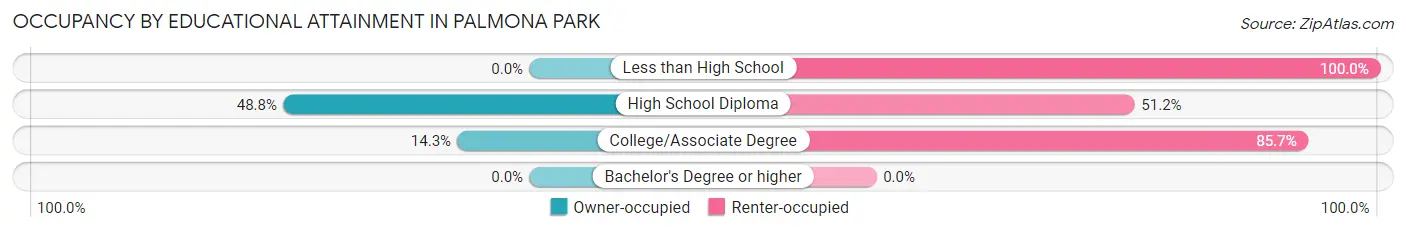
| Household Size | Owner-occupied | Renter-occupied |
| Less than High School | 0 (0.0%) | 120 (100.0%) |
| High School Diploma | 61 (48.8%) | 64 (51.2%) |
| College/Associate Degree | 11 (14.3%) | 66 (85.7%) |
| Bachelor's Degree or higher | 0 (0.0%) | 0 (0.0%) |
Occupancy by Age of Householder in Palmona Park
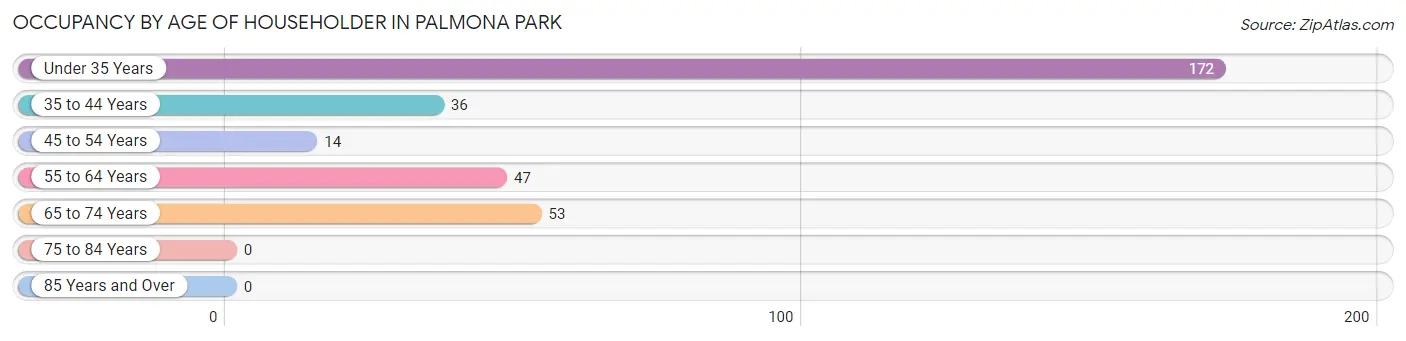
| Age Bracket | # Households | % Households |
| Under 35 Years | 172 | 53.4% |
| 35 to 44 Years | 36 | 11.2% |
| 45 to 54 Years | 14 | 4.3% |
| 55 to 64 Years | 47 | 14.6% |
| 65 to 74 Years | 53 | 16.5% |
| 75 to 84 Years | 0 | 0.0% |
| 85 Years and Over | 0 | 0.0% |
| Total | 322 | 100.0% |
Housing Finances in Palmona Park
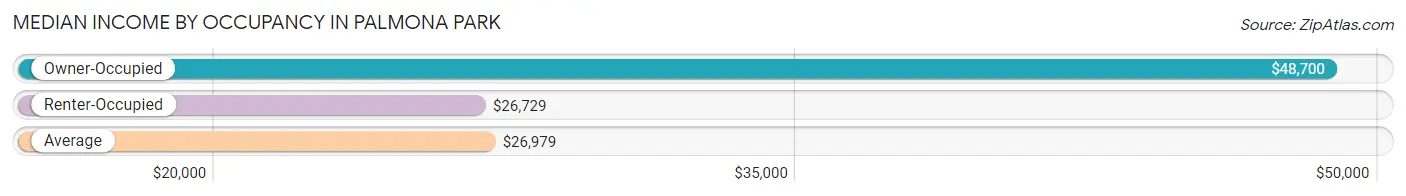
Median Income by Occupancy in Palmona Park
| Occupancy Type | # Households | Median Income |
| Owner-Occupied | 72 (22.4%) | $48,700 |
| Renter-Occupied | 250 (77.6%) | $26,729 |
| Average | 322 (100.0%) | $26,979 |
Occupancy by Householder Income Bracket in Palmona Park
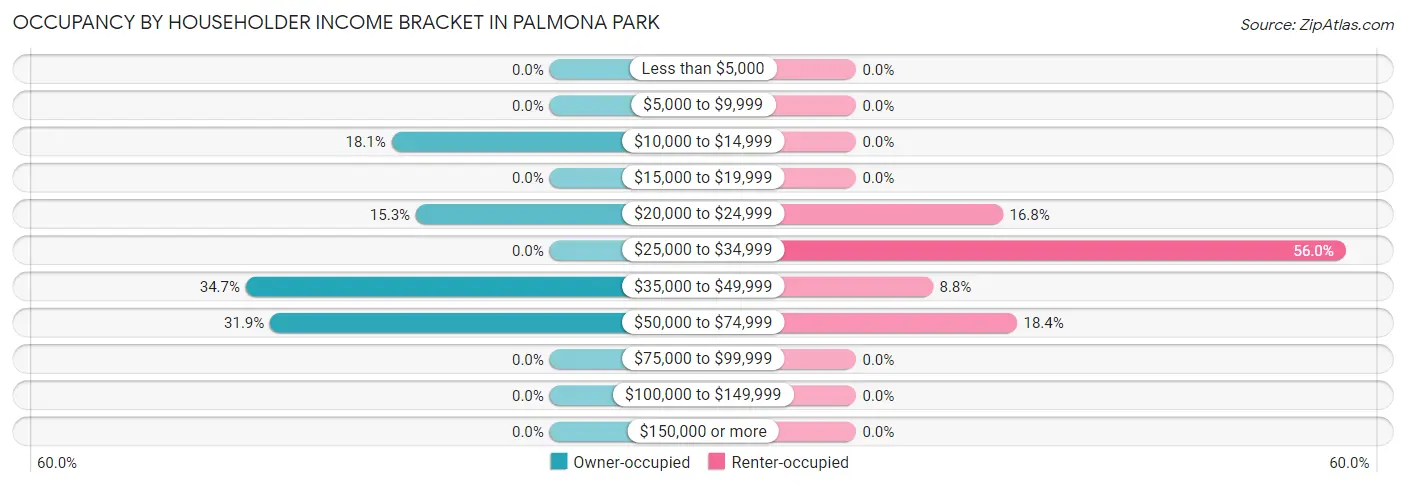
| Income Bracket | Owner-occupied | Renter-occupied |
| Less than $5,000 | 0 (0.0%) | 0 (0.0%) |
| $5,000 to $9,999 | 0 (0.0%) | 0 (0.0%) |
| $10,000 to $14,999 | 13 (18.1%) | 0 (0.0%) |
| $15,000 to $19,999 | 0 (0.0%) | 0 (0.0%) |
| $20,000 to $24,999 | 11 (15.3%) | 42 (16.8%) |
| $25,000 to $34,999 | 0 (0.0%) | 140 (56.0%) |
| $35,000 to $49,999 | 25 (34.7%) | 22 (8.8%) |
| $50,000 to $74,999 | 23 (31.9%) | 46 (18.4%) |
| $75,000 to $99,999 | 0 (0.0%) | 0 (0.0%) |
| $100,000 to $149,999 | 0 (0.0%) | 0 (0.0%) |
| $150,000 or more | 0 (0.0%) | 0 (0.0%) |
| Total | 72 (100.0%) | 250 (100.0%) |
Monthly Housing Cost Tiers in Palmona Park
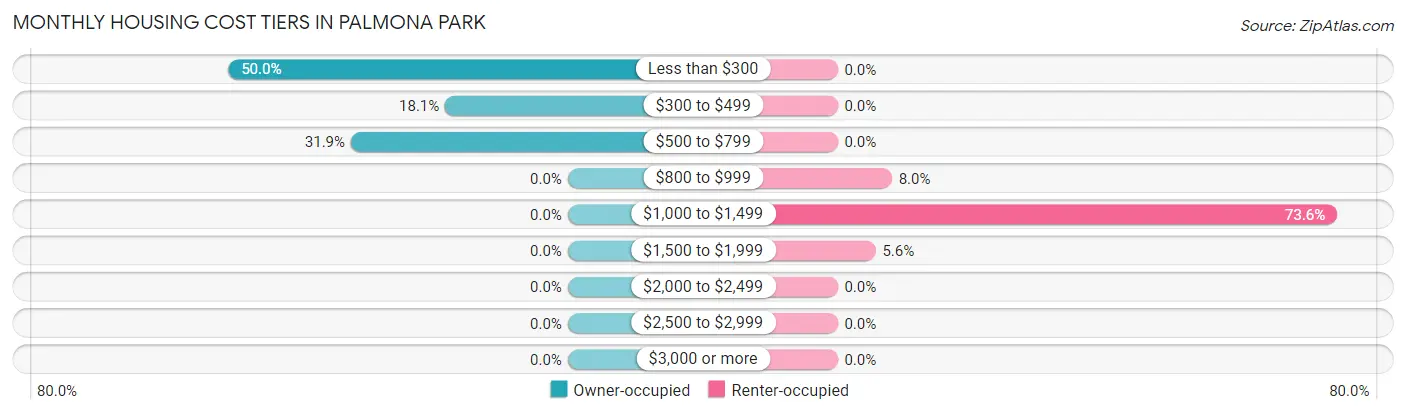
| Monthly Cost | Owner-occupied | Renter-occupied |
| Less than $300 | 36 (50.0%) | 0 (0.0%) |
| $300 to $499 | 13 (18.1%) | 0 (0.0%) |
| $500 to $799 | 23 (31.9%) | 0 (0.0%) |
| $800 to $999 | 0 (0.0%) | 20 (8.0%) |
| $1,000 to $1,499 | 0 (0.0%) | 184 (73.6%) |
| $1,500 to $1,999 | 0 (0.0%) | 14 (5.6%) |
| $2,000 to $2,499 | 0 (0.0%) | 0 (0.0%) |
| $2,500 to $2,999 | 0 (0.0%) | 0 (0.0%) |
| $3,000 or more | 0 (0.0%) | 0 (0.0%) |
| Total | 72 (100.0%) | 250 (100.0%) |
Physical Housing Characteristics in Palmona Park
Housing Structures in Palmona Park
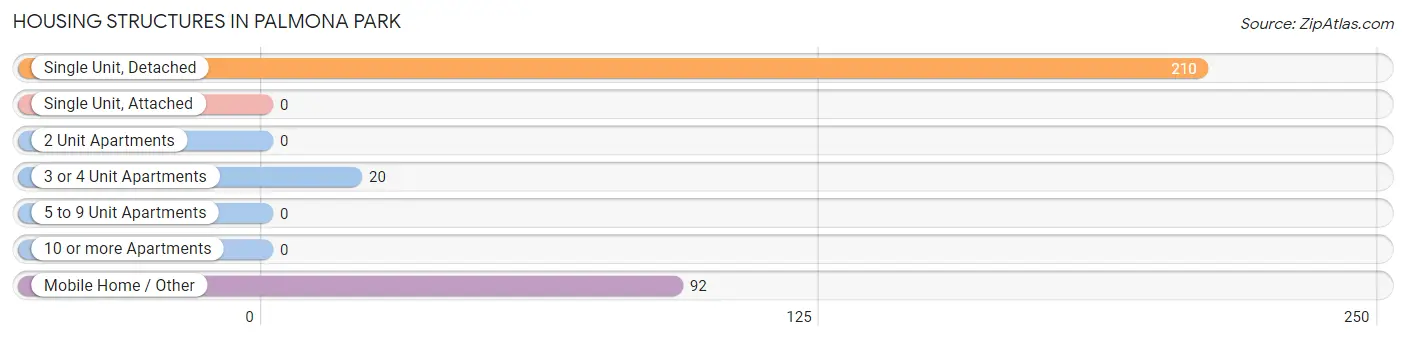
| Structure Type | # Housing Units | % Housing Units |
| Single Unit, Detached | 210 | 65.2% |
| Single Unit, Attached | 0 | 0.0% |
| 2 Unit Apartments | 0 | 0.0% |
| 3 or 4 Unit Apartments | 20 | 6.2% |
| 5 to 9 Unit Apartments | 0 | 0.0% |
| 10 or more Apartments | 0 | 0.0% |
| Mobile Home / Other | 92 | 28.6% |
| Total | 322 | 100.0% |
Housing Structures by Occupancy in Palmona Park
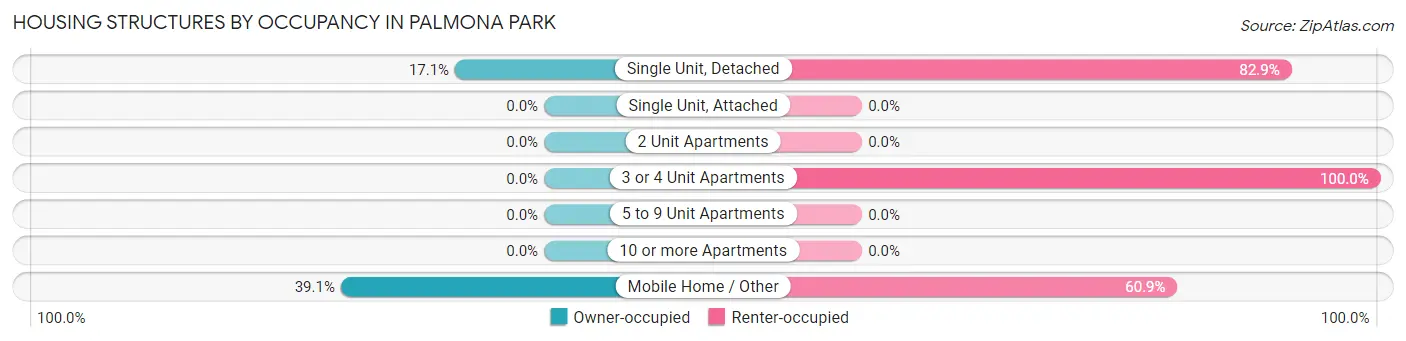
| Structure Type | Owner-occupied | Renter-occupied |
| Single Unit, Detached | 36 (17.1%) | 174 (82.9%) |
| Single Unit, Attached | 0 (0.0%) | 0 (0.0%) |
| 2 Unit Apartments | 0 (0.0%) | 0 (0.0%) |
| 3 or 4 Unit Apartments | 0 (0.0%) | 20 (100.0%) |
| 5 to 9 Unit Apartments | 0 (0.0%) | 0 (0.0%) |
| 10 or more Apartments | 0 (0.0%) | 0 (0.0%) |
| Mobile Home / Other | 36 (39.1%) | 56 (60.9%) |
| Total | 72 (22.4%) | 250 (77.6%) |
Housing Structures by Number of Rooms in Palmona Park
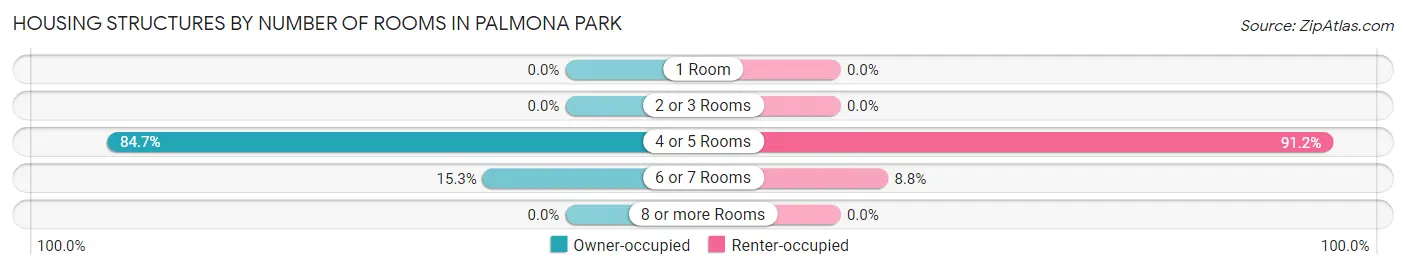
| Number of Rooms | Owner-occupied | Renter-occupied |
| 1 Room | 0 (0.0%) | 0 (0.0%) |
| 2 or 3 Rooms | 0 (0.0%) | 0 (0.0%) |
| 4 or 5 Rooms | 61 (84.7%) | 228 (91.2%) |
| 6 or 7 Rooms | 11 (15.3%) | 22 (8.8%) |
| 8 or more Rooms | 0 (0.0%) | 0 (0.0%) |
| Total | 72 (100.0%) | 250 (100.0%) |
Housing Structure by Heating Type in Palmona Park
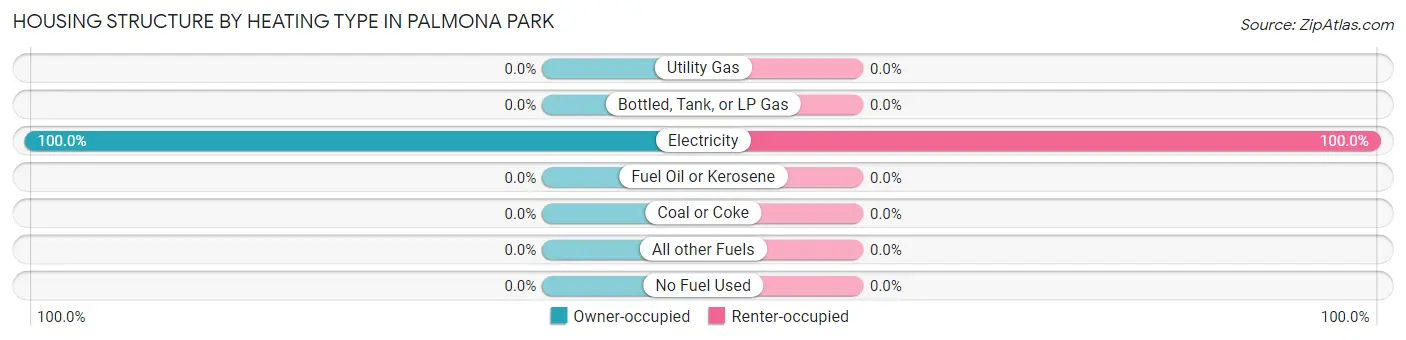
| Heating Type | Owner-occupied | Renter-occupied |
| Utility Gas | 0 (0.0%) | 0 (0.0%) |
| Bottled, Tank, or LP Gas | 0 (0.0%) | 0 (0.0%) |
| Electricity | 72 (100.0%) | 250 (100.0%) |
| Fuel Oil or Kerosene | 0 (0.0%) | 0 (0.0%) |
| Coal or Coke | 0 (0.0%) | 0 (0.0%) |
| All other Fuels | 0 (0.0%) | 0 (0.0%) |
| No Fuel Used | 0 (0.0%) | 0 (0.0%) |
| Total | 72 (100.0%) | 250 (100.0%) |
Household Vehicle Usage in Palmona Park
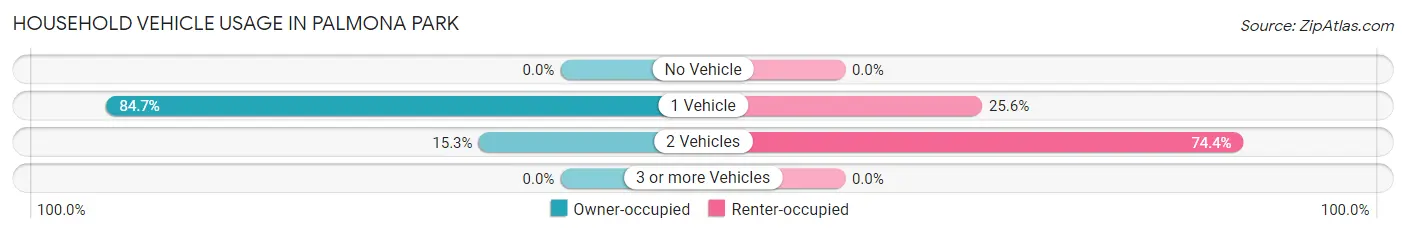
| Vehicles per Household | Owner-occupied | Renter-occupied |
| No Vehicle | 0 (0.0%) | 0 (0.0%) |
| 1 Vehicle | 61 (84.7%) | 64 (25.6%) |
| 2 Vehicles | 11 (15.3%) | 186 (74.4%) |
| 3 or more Vehicles | 0 (0.0%) | 0 (0.0%) |
| Total | 72 (100.0%) | 250 (100.0%) |
Real Estate & Mortgages in Palmona Park
Real Estate and Mortgage Overview in Palmona Park
| Characteristic | Without Mortgage | With Mortgage |
| Housing Units | 49 | 23 |
| Median Property Value | $56,400 | $0 |
| Median Household Income | - | - |
| Monthly Housing Costs | - | - |
| Real Estate Taxes | - | - |
Property Value by Mortgage Status in Palmona Park
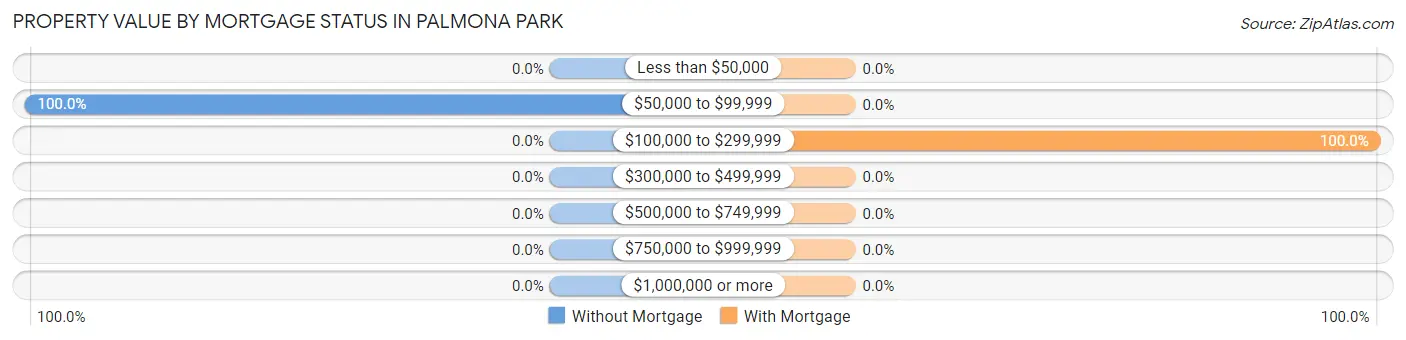
| Property Value | Without Mortgage | With Mortgage |
| Less than $50,000 | 0 (0.0%) | 0 (0.0%) |
| $50,000 to $99,999 | 49 (100.0%) | 0 (0.0%) |
| $100,000 to $299,999 | 0 (0.0%) | 23 (100.0%) |
| $300,000 to $499,999 | 0 (0.0%) | 0 (0.0%) |
| $500,000 to $749,999 | 0 (0.0%) | 0 (0.0%) |
| $750,000 to $999,999 | 0 (0.0%) | 0 (0.0%) |
| $1,000,000 or more | 0 (0.0%) | 0 (0.0%) |
| Total | 49 (100.0%) | 23 (100.0%) |
Household Income by Mortgage Status in Palmona Park
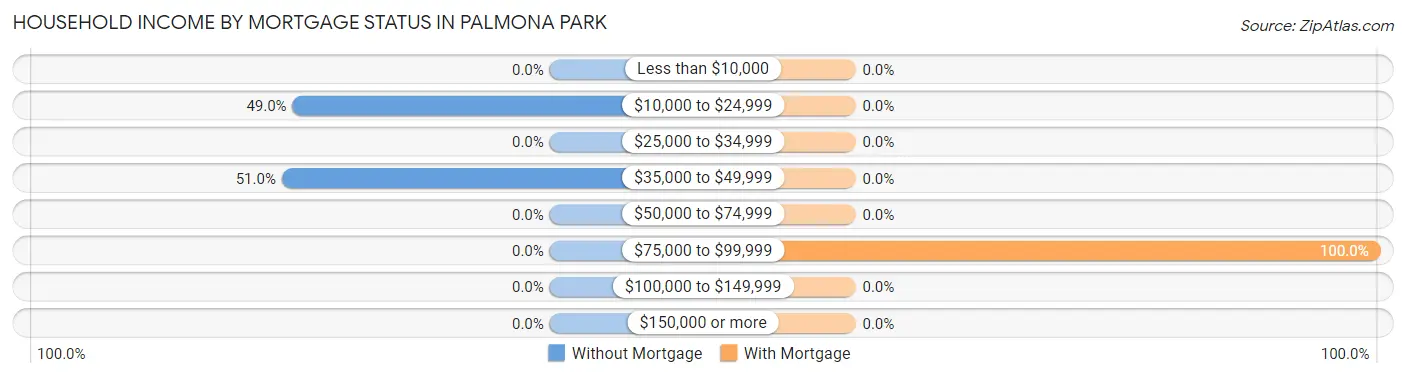
| Household Income | Without Mortgage | With Mortgage |
| Less than $10,000 | 0 (0.0%) | 0 (0.0%) |
| $10,000 to $24,999 | 24 (49.0%) | 0 (0.0%) |
| $25,000 to $34,999 | 0 (0.0%) | 0 (0.0%) |
| $35,000 to $49,999 | 25 (51.0%) | 0 (0.0%) |
| $50,000 to $74,999 | 0 (0.0%) | 0 (0.0%) |
| $75,000 to $99,999 | 0 (0.0%) | 23 (100.0%) |
| $100,000 to $149,999 | 0 (0.0%) | 0 (0.0%) |
| $150,000 or more | 0 (0.0%) | 0 (0.0%) |
| Total | 49 (100.0%) | 23 (100.0%) |
Property Value to Household Income Ratio in Palmona Park
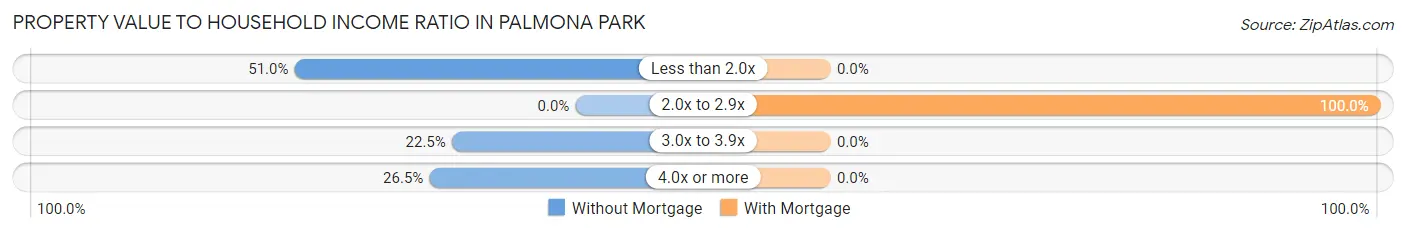
| Value-to-Income Ratio | Without Mortgage | With Mortgage |
| Less than 2.0x | 25 (51.0%) | 0 (0.0%) |
| 2.0x to 2.9x | 0 (0.0%) | 23 (100.0%) |
| 3.0x to 3.9x | 11 (22.5%) | 0 (0.0%) |
| 4.0x or more | 13 (26.5%) | 0 (0.0%) |
| Total | 49 (100.0%) | 23 (100.0%) |
Real Estate Taxes by Mortgage Status in Palmona Park
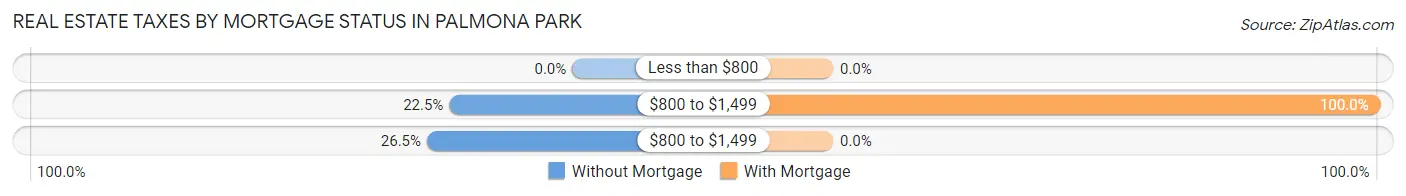
| Property Taxes | Without Mortgage | With Mortgage |
| Less than $800 | 0 (0.0%) | 0 (0.0%) |
| $800 to $1,499 | 11 (22.5%) | 23 (100.0%) |
| $800 to $1,499 | 13 (26.5%) | 0 (0.0%) |
| Total | 49 (100.0%) | 23 (100.0%) |
Health & Disability in Palmona Park
Health Insurance Coverage by Age in Palmona Park
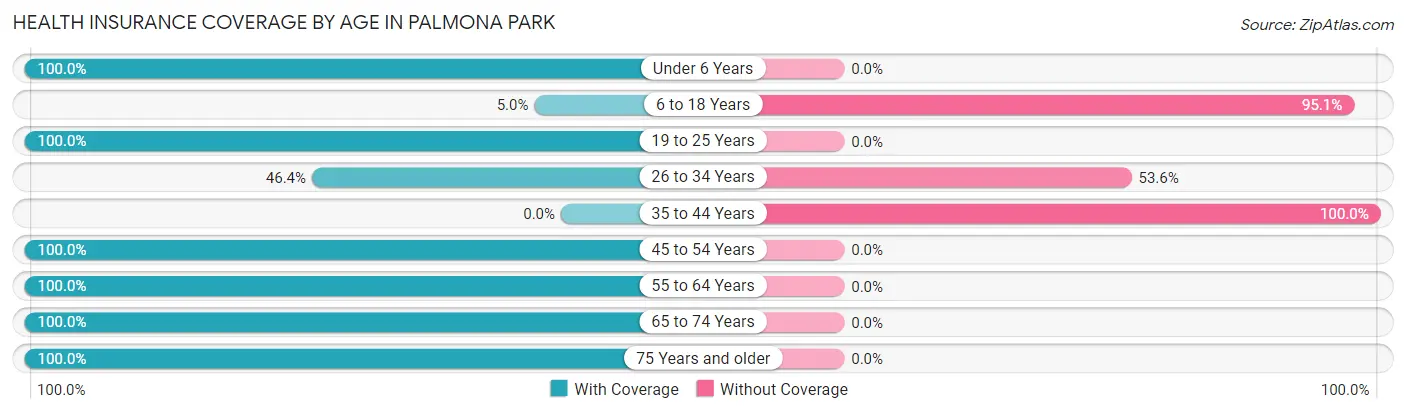
| Age Bracket | With Coverage | Without Coverage |
| Under 6 Years | 52 (100.0%) | 0 (0.0%) |
| 6 to 18 Years | 21 (5.0%) | 403 (95.1%) |
| 19 to 25 Years | 26 (100.0%) | 0 (0.0%) |
| 26 to 34 Years | 104 (46.4%) | 120 (53.6%) |
| 35 to 44 Years | 0 (0.0%) | 232 (100.0%) |
| 45 to 54 Years | 27 (100.0%) | 0 (0.0%) |
| 55 to 64 Years | 47 (100.0%) | 0 (0.0%) |
| 65 to 74 Years | 53 (100.0%) | 0 (0.0%) |
| 75 Years and older | 27 (100.0%) | 0 (0.0%) |
| Total | 357 (32.1%) | 755 (67.9%) |
Health Insurance Coverage by Citizenship Status in Palmona Park
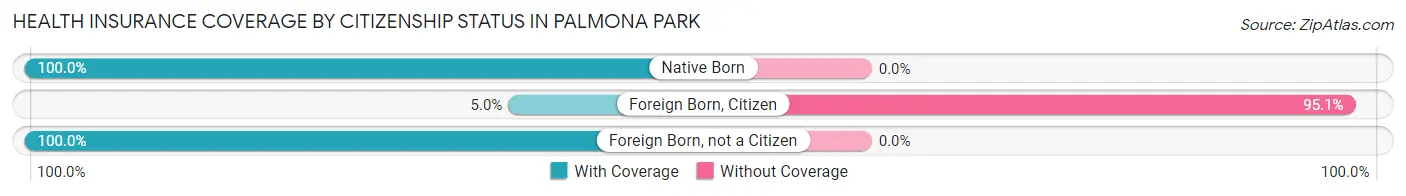
| Citizenship Status | With Coverage | Without Coverage |
| Native Born | 52 (100.0%) | 0 (0.0%) |
| Foreign Born, Citizen | 21 (5.0%) | 403 (95.1%) |
| Foreign Born, not a Citizen | 26 (100.0%) | 0 (0.0%) |
Health Insurance Coverage by Household Income in Palmona Park
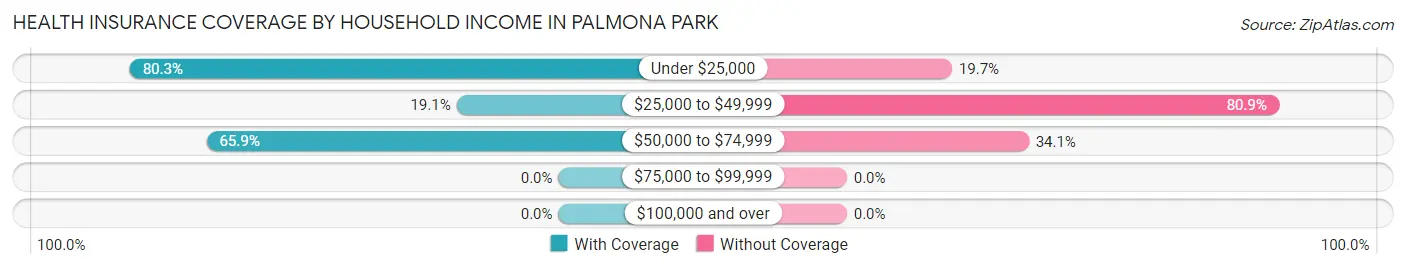
| Household Income | With Coverage | Without Coverage |
| Under $25,000 | 53 (80.3%) | 13 (19.7%) |
| $25,000 to $49,999 | 157 (19.1%) | 666 (80.9%) |
| $50,000 to $74,999 | 147 (65.9%) | 76 (34.1%) |
| $75,000 to $99,999 | 0 (0.0%) | 0 (0.0%) |
| $100,000 and over | 0 (0.0%) | 0 (0.0%) |
Public vs Private Health Insurance Coverage by Age in Palmona Park
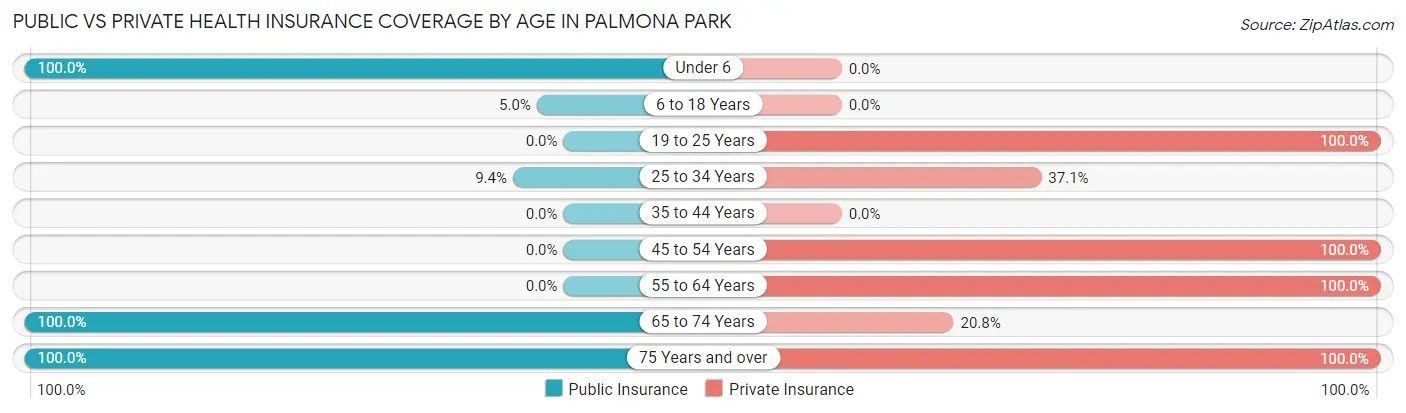
| Age Bracket | Public Insurance | Private Insurance |
| Under 6 | 52 (100.0%) | 0 (0.0%) |
| 6 to 18 Years | 21 (5.0%) | 0 (0.0%) |
| 19 to 25 Years | 0 (0.0%) | 26 (100.0%) |
| 25 to 34 Years | 21 (9.4%) | 83 (37.0%) |
| 35 to 44 Years | 0 (0.0%) | 0 (0.0%) |
| 45 to 54 Years | 0 (0.0%) | 27 (100.0%) |
| 55 to 64 Years | 0 (0.0%) | 47 (100.0%) |
| 65 to 74 Years | 53 (100.0%) | 11 (20.7%) |
| 75 Years and over | 27 (100.0%) | 27 (100.0%) |
| Total | 174 (15.7%) | 221 (19.9%) |
Disability Status by Sex by Age in Palmona Park
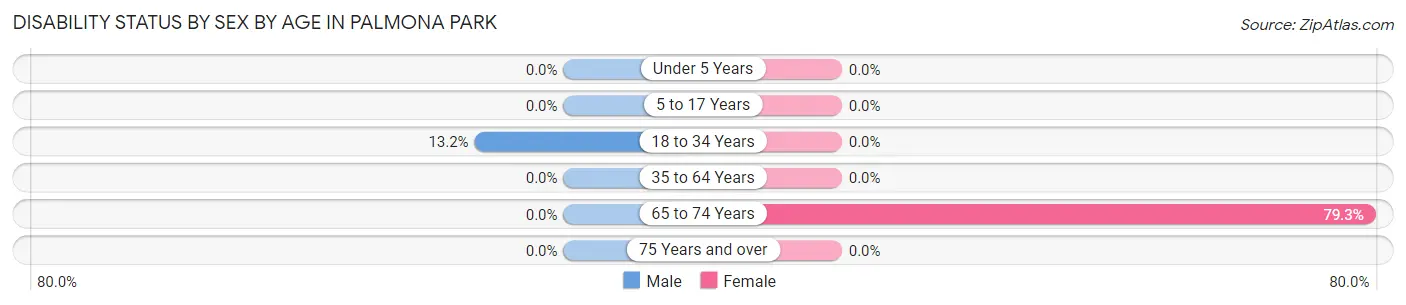
| Age Bracket | Male | Female |
| Under 5 Years | 0 (0.0%) | 0 (0.0%) |
| 5 to 17 Years | 0 (0.0%) | 0 (0.0%) |
| 18 to 34 Years | 26 (13.2%) | 0 (0.0%) |
| 35 to 64 Years | 0 (0.0%) | 0 (0.0%) |
| 65 to 74 Years | 0 (0.0%) | 42 (79.2%) |
| 75 Years and over | 0 (0.0%) | 0 (0.0%) |
Disability Class by Sex by Age in Palmona Park
Disability Class: Hearing Difficulty
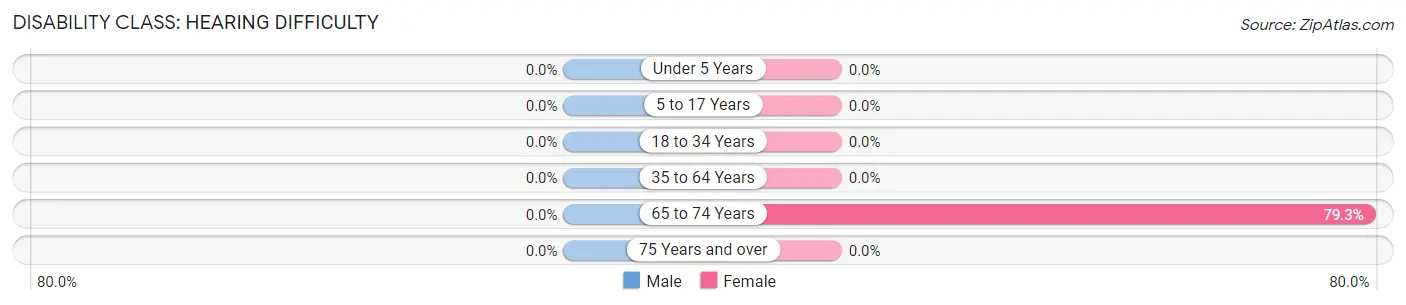
| Age Bracket | Male | Female |
| Under 5 Years | 0 (0.0%) | 0 (0.0%) |
| 5 to 17 Years | 0 (0.0%) | 0 (0.0%) |
| 18 to 34 Years | 0 (0.0%) | 0 (0.0%) |
| 35 to 64 Years | 0 (0.0%) | 0 (0.0%) |
| 65 to 74 Years | 0 (0.0%) | 42 (79.2%) |
| 75 Years and over | 0 (0.0%) | 0 (0.0%) |
Disability Class: Vision Difficulty

| Age Bracket | Male | Female |
| Under 5 Years | 0 (0.0%) | 0 (0.0%) |
| 5 to 17 Years | 0 (0.0%) | 0 (0.0%) |
| 18 to 34 Years | 0 (0.0%) | 0 (0.0%) |
| 35 to 64 Years | 0 (0.0%) | 0 (0.0%) |
| 65 to 74 Years | 0 (0.0%) | 42 (79.2%) |
| 75 Years and over | 0 (0.0%) | 0 (0.0%) |
Disability Class: Cognitive Difficulty
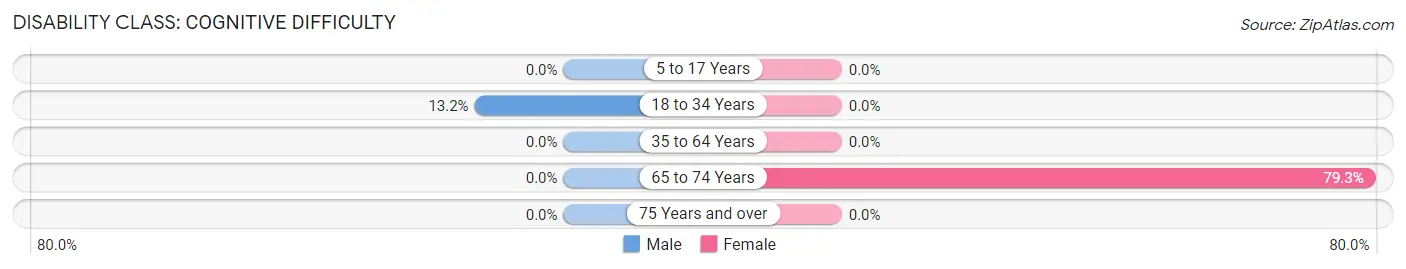
| Age Bracket | Male | Female |
| 5 to 17 Years | 0 (0.0%) | 0 (0.0%) |
| 18 to 34 Years | 26 (13.2%) | 0 (0.0%) |
| 35 to 64 Years | 0 (0.0%) | 0 (0.0%) |
| 65 to 74 Years | 0 (0.0%) | 42 (79.2%) |
| 75 Years and over | 0 (0.0%) | 0 (0.0%) |
Disability Class: Ambulatory Difficulty
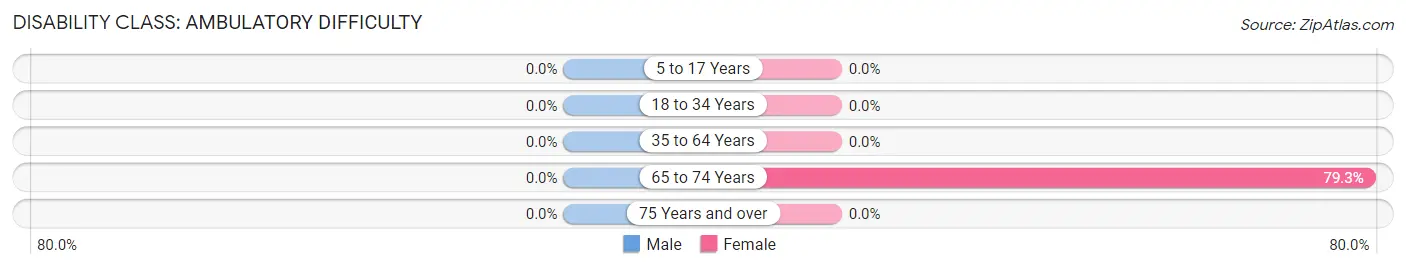
| Age Bracket | Male | Female |
| 5 to 17 Years | 0 (0.0%) | 0 (0.0%) |
| 18 to 34 Years | 0 (0.0%) | 0 (0.0%) |
| 35 to 64 Years | 0 (0.0%) | 0 (0.0%) |
| 65 to 74 Years | 0 (0.0%) | 42 (79.2%) |
| 75 Years and over | 0 (0.0%) | 0 (0.0%) |
Disability Class: Self-Care Difficulty
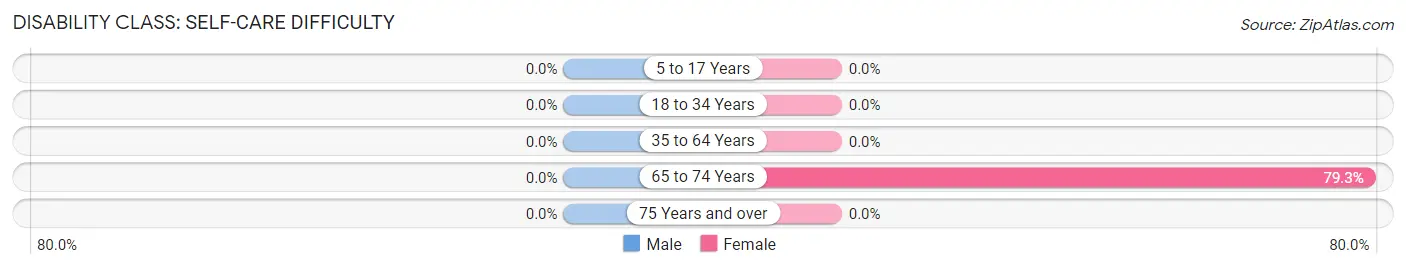
| Age Bracket | Male | Female |
| 5 to 17 Years | 0 (0.0%) | 0 (0.0%) |
| 18 to 34 Years | 0 (0.0%) | 0 (0.0%) |
| 35 to 64 Years | 0 (0.0%) | 0 (0.0%) |
| 65 to 74 Years | 0 (0.0%) | 42 (79.2%) |
| 75 Years and over | 0 (0.0%) | 0 (0.0%) |
Technology Access in Palmona Park
Computing Device Access in Palmona Park
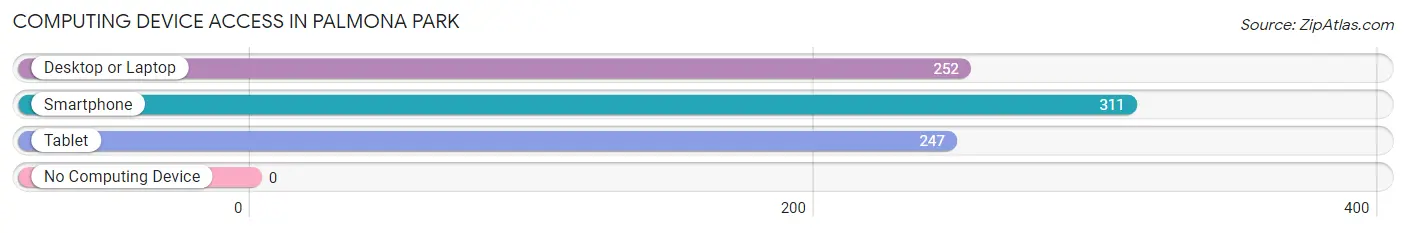
| Device Type | # Households | % Households |
| Desktop or Laptop | 252 | 78.3% |
| Smartphone | 311 | 96.6% |
| Tablet | 247 | 76.7% |
| No Computing Device | 0 | 0.0% |
| Total | 322 | 100.0% |
Internet Access in Palmona Park
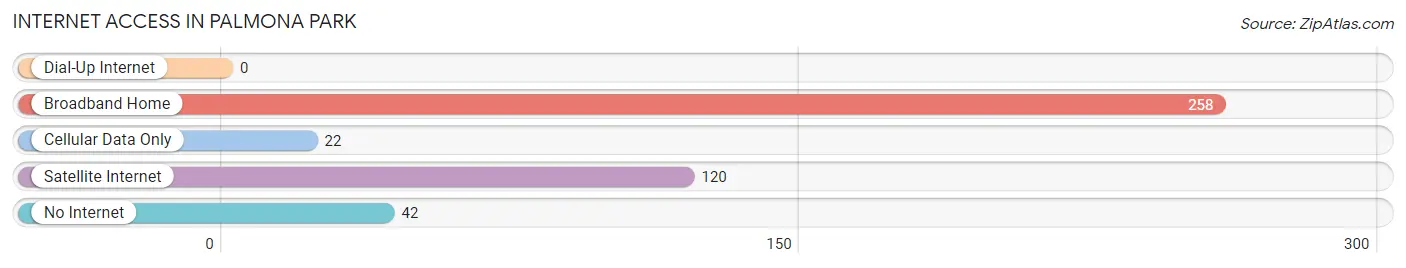
| Internet Type | # Households | % Households |
| Dial-Up Internet | 0 | 0.0% |
| Broadband Home | 258 | 80.1% |
| Cellular Data Only | 22 | 6.8% |
| Satellite Internet | 120 | 37.3% |
| No Internet | 42 | 13.0% |
| Total | 322 | 100.0% |
Palmona Park Summary
Palmona Park is a census-designated place (CDP) located in Lee County, Florida, United States. The population was 2,945 at the 2010 census. It is part of the Cape Coral-Fort Myers, Florida Metropolitan Statistical Area.
Geography
Palmona Park is located at 26 37 17 North 81 45 45 West 26 621445 81 762445
According to the United States Census Bureau, the CDP has a total area of 2.2 square miles (5.7 km2), of which 2.2 square miles (5.7 km2) is land and 0.04 square miles (0.1 km2) (1.36%) is water.
History
Palmona Park was originally part of the Seminole Indian Reservation. The area was first settled in the late 1800s by homesteaders. The area was named after the Palmona River, which runs through the area.
In the early 1900s, the area was developed as a citrus grove. The groves were destroyed by a hurricane in 1926, and the area was then used for cattle ranching.
In the 1950s, the area was developed as a residential community. The community was named Palmona Park after the Palmona River.
Economy
The economy of Palmona Park is largely based on tourism and agriculture. The area is home to several tourist attractions, including the Palmona Park Zoo, the Palmona Park Nature Center, and the Palmona Park Golf Course.
Agriculture is also an important part of the local economy. The area is home to several farms, including citrus, vegetable, and cattle farms.
Demographics
As of the census of 2000, there were 2,945 people, 1,093 households, and 817 families residing in the CDP. The population density was 1,323.3 people per square mile (510.7/km2). There were 1,179 housing units at an average density of 527.3/sq mi (203.3/km2). The racial makeup of the CDP was 97.45% White, 0.17% African American, 0.17% Native American, 0.48% Asian, 0.03% Pacific Islander, 0.94% from other races, and 0.75% from two or more races. Hispanic or Latino of any race were 3.45% of the population.
There were 1,093 households, out of which 33.2% had children under the age of 18 living with them, 59.2% were married couples living together, 9.7% had a female householder with no husband present, and 27.2% were non-families. 21.2% of all households were made up of individuals, and 8.2% had someone living alone who was 65 years of age or older. The average household size was 2.68 and the average family size was 3.12.
In the CDP, the population was spread out, with 25.2% under the age of 18, 7.2% from 18 to 24, 28.2% from 25 to 44, 24.2% from 45 to 64, and 15.2% who were 65 years of age or older. The median age was 38 years. For every 100 females, there were 97.2 males. For every 100 females age 18 and over, there were 94.2 males.
The median income for a household in the CDP was $41,944, and the median income for a family was $46,964. Males had a median income of $31,912 versus $25,000 for females. The per capita income for the CDP was $18,945. About 6.2% of families and 8.2% of the population were below the poverty line, including 10.2% of those under age 18 and 6.2% of those age 65 or over.
Common Questions
What is Per Capita Income in Palmona Park?
Per Capita income in Palmona Park is $12,606.
What is the Median Family Income in Palmona Park?
Median Family Income in Palmona Park is $27,406.
What is the Median Household income in Palmona Park?
Median Household Income in Palmona Park is $26,979.
What is Income or Wage Gap in Palmona Park?
Income or Wage Gap in Palmona Park is 33.9%.
Women in Palmona Park earn 66.1 cents for every dollar earned by a man.
What is Inequality or Gini Index in Palmona Park?
Inequality or Gini Index in Palmona Park is 0.26.
What is the Total Population of Palmona Park?
Total Population of Palmona Park is 1,112.
What is the Total Male Population of Palmona Park?
Total Male Population of Palmona Park is 603.
What is the Total Female Population of Palmona Park?
Total Female Population of Palmona Park is 509.
What is the Ratio of Males per 100 Females in Palmona Park?
There are 118.47 Males per 100 Females in Palmona Park.
What is the Ratio of Females per 100 Males in Palmona Park?
There are 84.41 Females per 100 Males in Palmona Park.
What is the Median Population Age in Palmona Park?
Median Population Age in Palmona Park is 31.2 Years.
What is the Average Family Size in Palmona Park
Average Family Size in Palmona Park is 4.2 People.
What is the Average Household Size in Palmona Park
Average Household Size in Palmona Park is 3.5 People.
How Large is the Labor Force in Palmona Park?
There are 389 People in the Labor Forcein in Palmona Park.
What is the Percentage of People in the Labor Force in Palmona Park?
61.2% of People are in the Labor Force in Palmona Park.
What is the Unemployment Rate in Palmona Park?
Unemployment Rate in Palmona Park is 5.9%.