Tice, FL Map & Demographics
Tice Map
Tice Overview
$24,154
PER CAPITA INCOME
$45,727
AVG FAMILY INCOME
$48,177
AVG HOUSEHOLD INCOME
26.4%
WAGE / INCOME GAP [ % ]
73.6¢/ $1
WAGE / INCOME GAP [ $ ]
0.45
INEQUALITY / GINI INDEX
5,468
TOTAL POPULATION
3,038
MALE POPULATION
2,430
FEMALE POPULATION
125.02
MALES / 100 FEMALES
79.99
FEMALES / 100 MALES
31.5
MEDIAN AGE
4.0
AVG FAMILY SIZE
3.4
AVG HOUSEHOLD SIZE
2,687
LABOR FORCE [ PEOPLE ]
66.4%
PERCENT IN LABOR FORCE
1.4%
UNEMPLOYMENT RATE
Tice Area Codes
Income in Tice
Income Overview in Tice
Per Capita Income in Tice is $24,154, while median incomes of families and households are $45,727 and $48,177 respectively.
| Characteristic | Number | Measure |
| Per Capita Income | 5,468 | $24,154 |
| Median Family Income | 1,001 | $45,727 |
| Mean Family Income | 1,001 | $70,239 |
| Median Household Income | 1,587 | $48,177 |
| Mean Household Income | 1,587 | $68,184 |
| Income Deficit | 1,001 | $0 |
| Wage / Income Gap (%) | 5,468 | 26.42% |
| Wage / Income Gap ($) | 5,468 | 73.58¢ per $1 |
| Gini / Inequality Index | 5,468 | 0.45 |
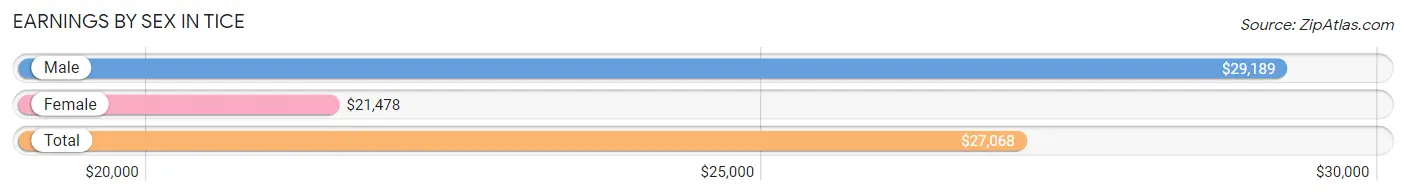
Earnings by Sex in Tice
Average Earnings in Tice are $27,068, $29,189 for men and $21,478 for women, a difference of 26.4%.
| Sex | Number | Average Earnings |
| Male | 1,686 (61.7%) | $29,189 |
| Female | 1,045 (38.3%) | $21,478 |
| Total | 2,731 (100.0%) | $27,068 |
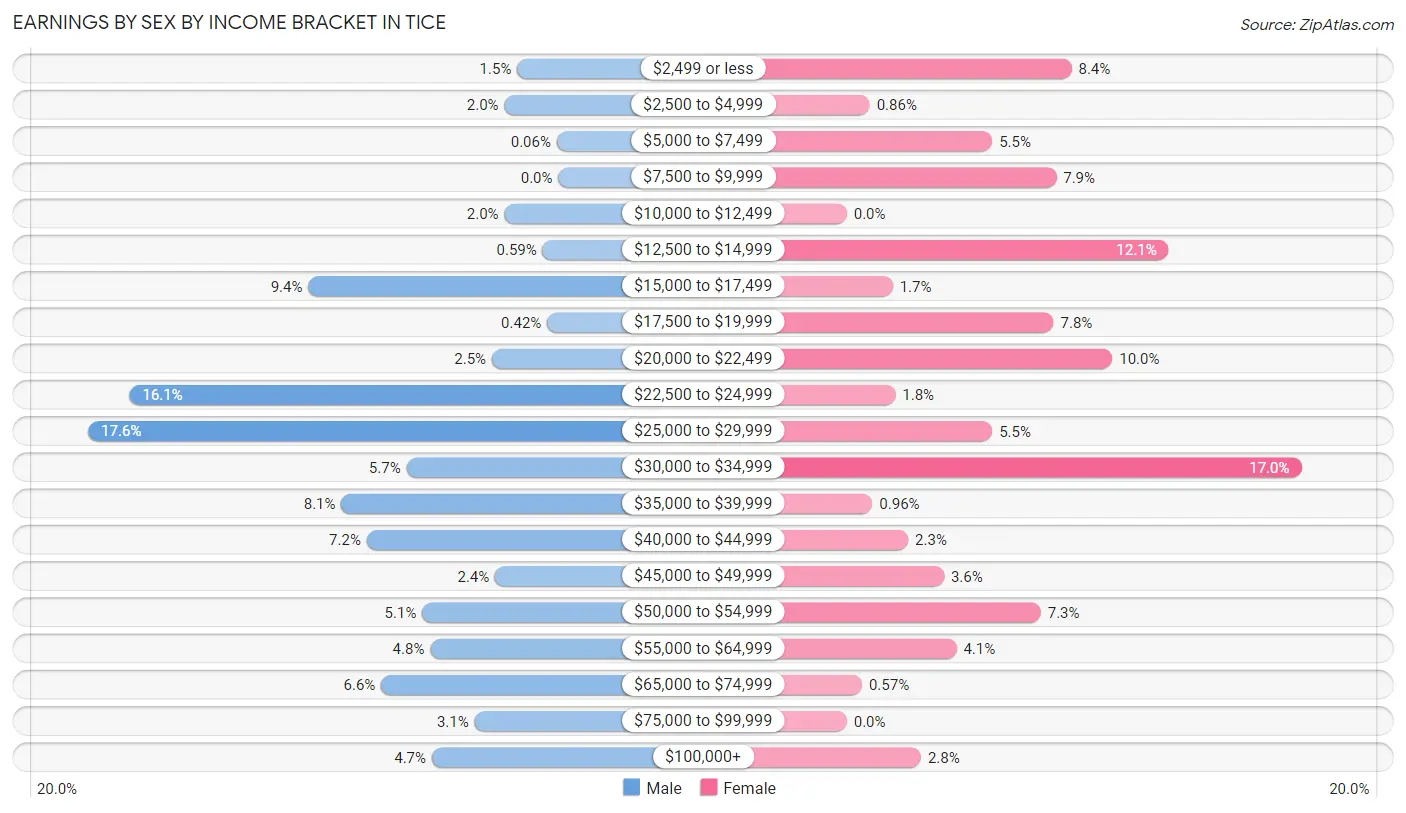
Earnings by Sex by Income Bracket in Tice
The most common earnings brackets in Tice are $25,000 to $29,999 for men (297 | 17.6%) and $30,000 to $34,999 for women (178 | 17.0%).
| Income | Male | Female |
| $2,499 or less | 26 (1.5%) | 88 (8.4%) |
| $2,500 to $4,999 | 34 (2.0%) | 9 (0.9%) |
| $5,000 to $7,499 | 1 (0.1%) | 57 (5.4%) |
| $7,500 to $9,999 | 0 (0.0%) | 82 (7.9%) |
| $10,000 to $12,499 | 34 (2.0%) | 0 (0.0%) |
| $12,500 to $14,999 | 10 (0.6%) | 126 (12.1%) |
| $15,000 to $17,499 | 158 (9.4%) | 18 (1.7%) |
| $17,500 to $19,999 | 7 (0.4%) | 81 (7.7%) |
| $20,000 to $22,499 | 42 (2.5%) | 104 (10.0%) |
| $22,500 to $24,999 | 271 (16.1%) | 19 (1.8%) |
| $25,000 to $29,999 | 297 (17.6%) | 57 (5.4%) |
| $30,000 to $34,999 | 96 (5.7%) | 178 (17.0%) |
| $35,000 to $39,999 | 137 (8.1%) | 10 (1.0%) |
| $40,000 to $44,999 | 121 (7.2%) | 24 (2.3%) |
| $45,000 to $49,999 | 40 (2.4%) | 38 (3.6%) |
| $50,000 to $54,999 | 86 (5.1%) | 76 (7.3%) |
| $55,000 to $64,999 | 81 (4.8%) | 43 (4.1%) |
| $65,000 to $74,999 | 112 (6.6%) | 6 (0.6%) |
| $75,000 to $99,999 | 53 (3.1%) | 0 (0.0%) |
| $100,000+ | 80 (4.7%) | 29 (2.8%) |
| Total | 1,686 (100.0%) | 1,045 (100.0%) |
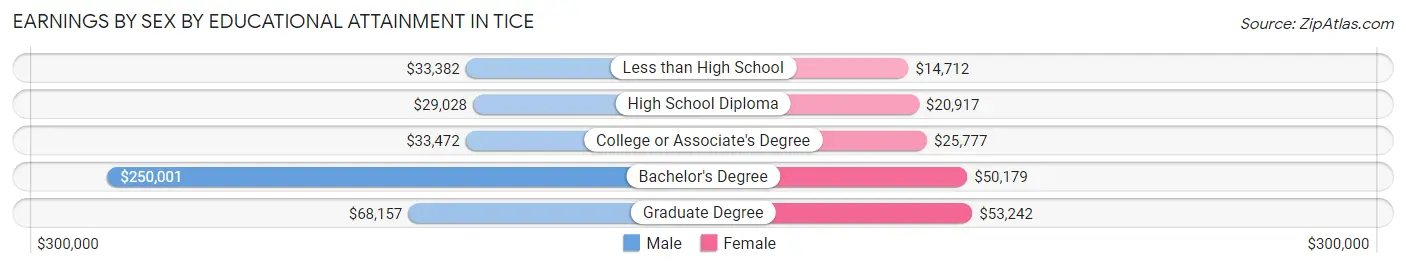
Earnings by Sex by Educational Attainment in Tice
Average earnings in Tice are $34,125 for men and $22,224 for women, a difference of 34.9%. Men with an educational attainment of bachelor's degree enjoy the highest average annual earnings of $250,001, while those with high school diploma education earn the least with $29,028. Women with an educational attainment of graduate degree earn the most with the average annual earnings of $53,242, while those with less than high school education have the smallest earnings of $14,712.
| Educational Attainment | Male Income | Female Income |
| Less than High School | $33,382 | $14,712 |
| High School Diploma | $29,028 | $20,917 |
| College or Associate's Degree | $33,472 | $25,777 |
| Bachelor's Degree | $250,001 | $50,179 |
| Graduate Degree | $68,157 | $53,242 |
| Total | $34,125 | $22,224 |
Family Income in Tice
Family Income Brackets in Tice
According to the Tice family income data, there are 274 families falling into the $35,000 to $49,999 income range, which is the most common income bracket and makes up 27.4% of all families. Conversely, the $10,000 to $14,999 income bracket is the least frequent group with only 6 families (0.6%) belonging to this category.
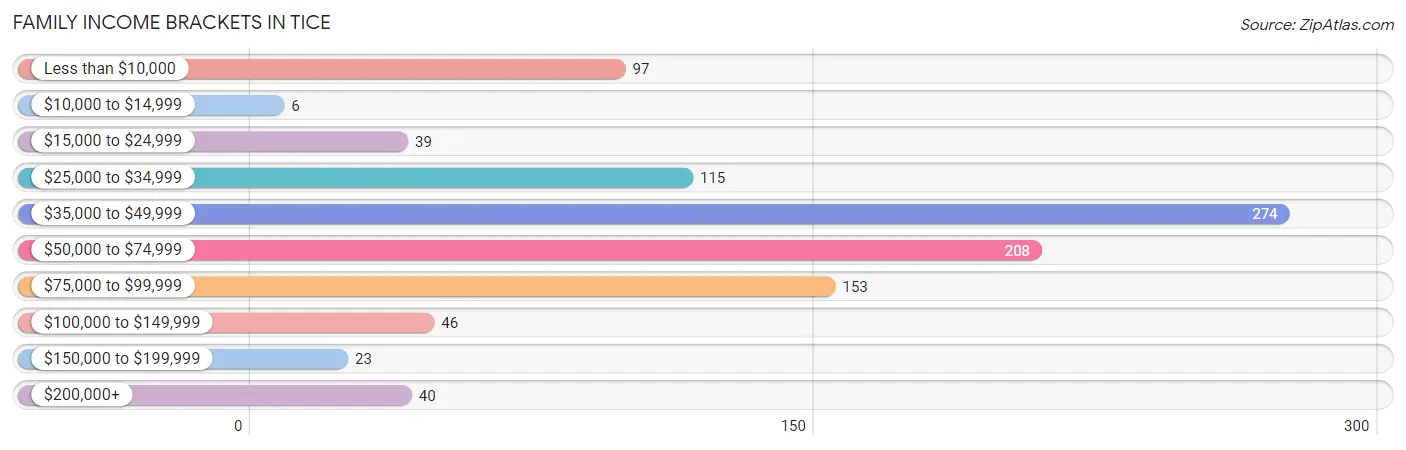
| Income Bracket | # Families | % Families |
| Less than $10,000 | 97 | 9.7% |
| $10,000 to $14,999 | 6 | 0.6% |
| $15,000 to $24,999 | 39 | 3.9% |
| $25,000 to $34,999 | 115 | 11.5% |
| $35,000 to $49,999 | 274 | 27.4% |
| $50,000 to $74,999 | 208 | 20.8% |
| $75,000 to $99,999 | 153 | 15.3% |
| $100,000 to $149,999 | 46 | 4.6% |
| $150,000 to $199,999 | 23 | 2.3% |
| $200,000+ | 40 | 4.0% |
Family Income by Famaliy Size in Tice
2-person families (349 | 34.9%) account for the highest median family income in Tice with $50,191 per family, while 2-person families (349 | 34.9%) have the highest median income of $25,096 per family member.
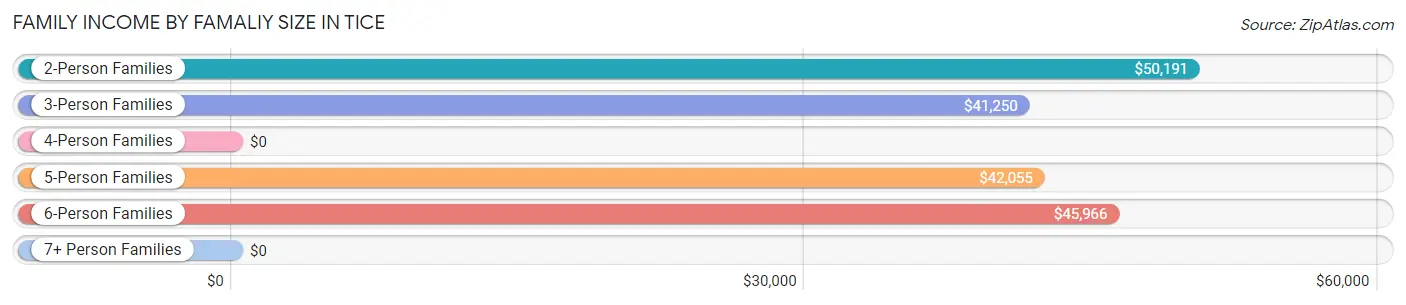
| Income Bracket | # Families | Median Income |
| 2-Person Families | 349 (34.9%) | $50,191 |
| 3-Person Families | 130 (13.0%) | $41,250 |
| 4-Person Families | 136 (13.6%) | $0 |
| 5-Person Families | 305 (30.5%) | $42,055 |
| 6-Person Families | 65 (6.5%) | $45,966 |
| 7+ Person Families | 16 (1.6%) | $0 |
| Total | 1,001 (100.0%) | $45,727 |
Family Income by Number of Earners in Tice
The median family income in Tice is $45,727, with families comprising 3+ earners (98) having the highest median family income of $80,789, while families with no earners (80) have the lowest median family income of $2,499, accounting for 9.8% and 8.0% of families, respectively.
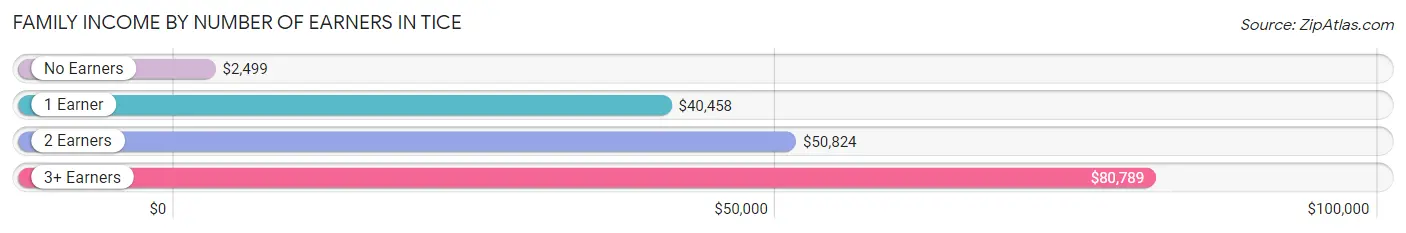
| Number of Earners | # Families | Median Income |
| No Earners | 80 (8.0%) | $2,499 |
| 1 Earner | 432 (43.2%) | $40,458 |
| 2 Earners | 391 (39.1%) | $50,824 |
| 3+ Earners | 98 (9.8%) | $80,789 |
| Total | 1,001 (100.0%) | $45,727 |
Household Income in Tice
Household Income Brackets in Tice
With 428 households falling in the category, the $35,000 to $49,999 income range is the most frequent in Tice, accounting for 27.0% of all households. In contrast, only 24 households (1.5%) fall into the $10,000 to $14,999 income bracket, making it the least populous group.
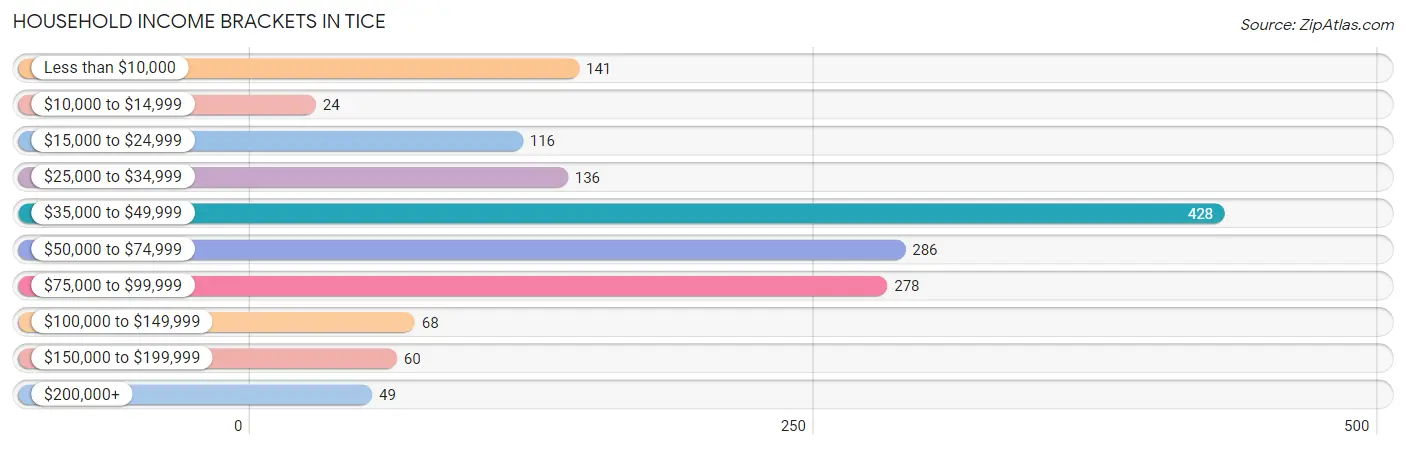
| Income Bracket | # Households | % Households |
| Less than $10,000 | 141 | 8.9% |
| $10,000 to $14,999 | 24 | 1.5% |
| $15,000 to $24,999 | 116 | 7.3% |
| $25,000 to $34,999 | 136 | 8.6% |
| $35,000 to $49,999 | 428 | 27.0% |
| $50,000 to $74,999 | 286 | 18.0% |
| $75,000 to $99,999 | 278 | 17.5% |
| $100,000 to $149,999 | 68 | 4.3% |
| $150,000 to $199,999 | 60 | 3.8% |
| $200,000+ | 49 | 3.1% |
Household Income by Householder Age in Tice
The median household income in Tice is $48,177, with the highest median household income of $75,417 found in the 15 to 24 years age bracket for the primary householder. A total of 107 households (6.7%) fall into this category. Meanwhile, the 65+ years age bracket for the primary householder has the lowest median household income of $33,672, with 213 households (13.4%) in this group.
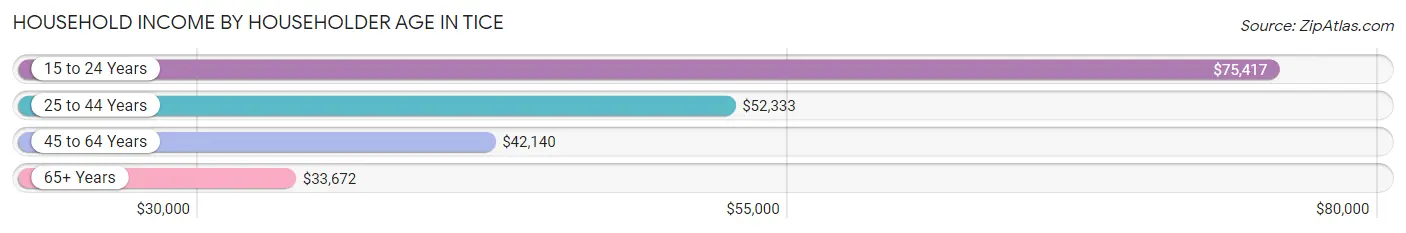
| Income Bracket | # Households | Median Income |
| 15 to 24 Years | 107 (6.7%) | $75,417 |
| 25 to 44 Years | 626 (39.5%) | $52,333 |
| 45 to 64 Years | 641 (40.4%) | $42,140 |
| 65+ Years | 213 (13.4%) | $33,672 |
| Total | 1,587 (100.0%) | $48,177 |
Poverty in Tice
Income Below Poverty by Sex and Age in Tice
With 20.7% poverty level for males and 18.9% for females among the residents of Tice, 5 year old males and 5 year old females are the most vulnerable to poverty, with 11 males (100.0%) and 52 females (56.5%) in their respective age groups living below the poverty level.
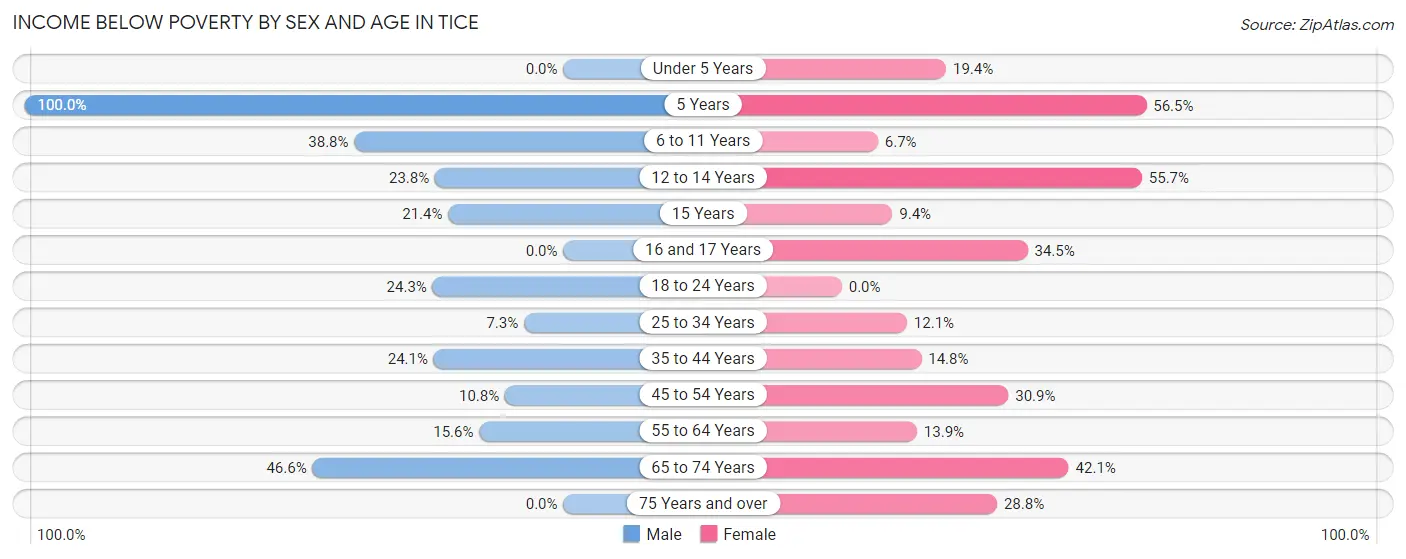
| Age Bracket | Male | Female |
| Under 5 Years | 0 (0.0%) | 36 (19.4%) |
| 5 Years | 11 (100.0%) | 52 (56.5%) |
| 6 to 11 Years | 135 (38.8%) | 16 (6.7%) |
| 12 to 14 Years | 30 (23.8%) | 44 (55.7%) |
| 15 Years | 19 (21.3%) | 12 (9.4%) |
| 16 and 17 Years | 0 (0.0%) | 10 (34.5%) |
| 18 to 24 Years | 107 (24.3%) | 0 (0.0%) |
| 25 to 34 Years | 28 (7.3%) | 44 (12.1%) |
| 35 to 44 Years | 159 (24.0%) | 50 (14.7%) |
| 45 to 54 Years | 42 (10.8%) | 93 (30.9%) |
| 55 to 64 Years | 34 (15.6%) | 29 (13.9%) |
| 65 to 74 Years | 61 (46.6%) | 40 (42.1%) |
| 75 Years and over | 0 (0.0%) | 34 (28.8%) |
| Total | 626 (20.7%) | 460 (18.9%) |
Income Above Poverty by Sex and Age in Tice
According to the poverty statistics in Tice, males aged under 5 years and females aged 18 to 24 years are the age groups that are most secure financially, with 100.0% of males and 100.0% of females in these age groups living above the poverty line.
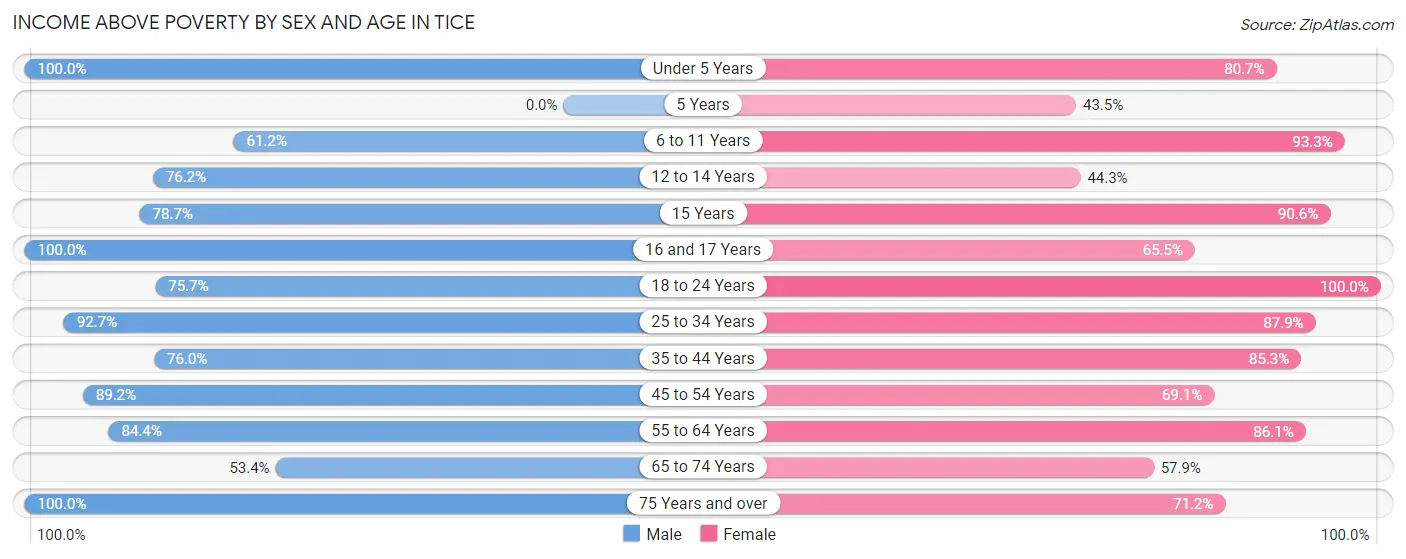
| Age Bracket | Male | Female |
| Under 5 Years | 115 (100.0%) | 150 (80.6%) |
| 5 Years | 0 (0.0%) | 40 (43.5%) |
| 6 to 11 Years | 213 (61.2%) | 223 (93.3%) |
| 12 to 14 Years | 96 (76.2%) | 35 (44.3%) |
| 15 Years | 70 (78.6%) | 116 (90.6%) |
| 16 and 17 Years | 64 (100.0%) | 19 (65.5%) |
| 18 to 24 Years | 334 (75.7%) | 252 (100.0%) |
| 25 to 34 Years | 356 (92.7%) | 320 (87.9%) |
| 35 to 44 Years | 502 (75.9%) | 289 (85.3%) |
| 45 to 54 Years | 346 (89.2%) | 208 (69.1%) |
| 55 to 64 Years | 184 (84.4%) | 179 (86.1%) |
| 65 to 74 Years | 70 (53.4%) | 55 (57.9%) |
| 75 Years and over | 54 (100.0%) | 84 (71.2%) |
| Total | 2,404 (79.3%) | 1,970 (81.1%) |
Income Below Poverty Among Married-Couple Families in Tice
The poverty statistics for married-couple families in Tice show that 18.5% or 125 of the total 675 families live below the poverty line. Families with 3 or 4 children have the highest poverty rate of 32.0%, comprising of 78 families. On the other hand, families with no children have the lowest poverty rate of 9.4%, which includes 25 families.
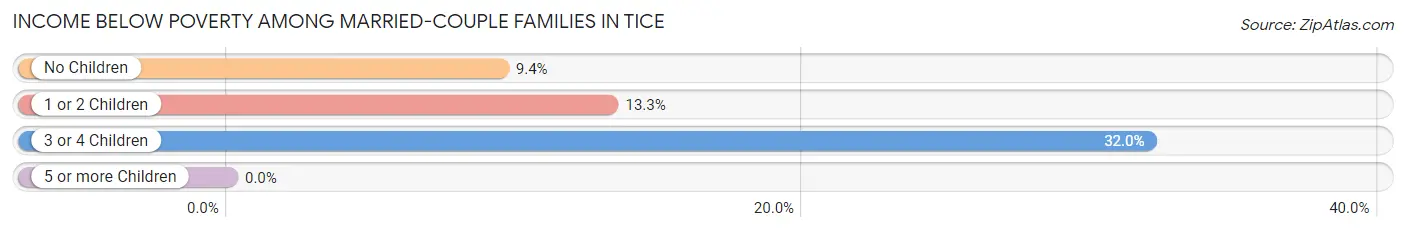
| Children | Above Poverty | Below Poverty |
| No Children | 240 (90.6%) | 25 (9.4%) |
| 1 or 2 Children | 144 (86.8%) | 22 (13.3%) |
| 3 or 4 Children | 166 (68.0%) | 78 (32.0%) |
| 5 or more Children | 0 (0.0%) | 0 (0.0%) |
| Total | 550 (81.5%) | 125 (18.5%) |
Income Below Poverty Among Single-Parent Households in Tice
According to the poverty data in Tice, 10.9% or 10 single-father households and 12.4% or 29 single-mother households are living below the poverty line. Among single-father households, those with no children have the highest poverty rate, with 10 households (10.9%) experiencing poverty. Likewise, among single-mother households, those with 3 or 4 children have the highest poverty rate, with 14 households (23.3%) falling below the poverty line.
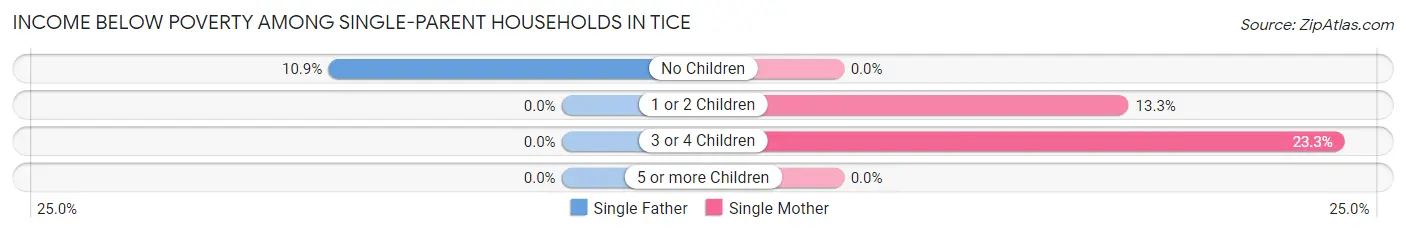
| Children | Single Father | Single Mother |
| No Children | 10 (10.9%) | 0 (0.0%) |
| 1 or 2 Children | 0 (0.0%) | 15 (13.3%) |
| 3 or 4 Children | 0 (0.0%) | 14 (23.3%) |
| 5 or more Children | 0 (0.0%) | 0 (0.0%) |
| Total | 10 (10.9%) | 29 (12.4%) |
Income Below Poverty Among Married-Couple vs Single-Parent Households in Tice
The poverty data for Tice shows that 125 of the married-couple family households (18.5%) and 39 of the single-parent households (12.0%) are living below the poverty level. Within the married-couple family households, those with 3 or 4 children have the highest poverty rate, with 78 households (32.0%) falling below the poverty line. Among the single-parent households, those with 3 or 4 children have the highest poverty rate, with 14 household (23.3%) living below poverty.
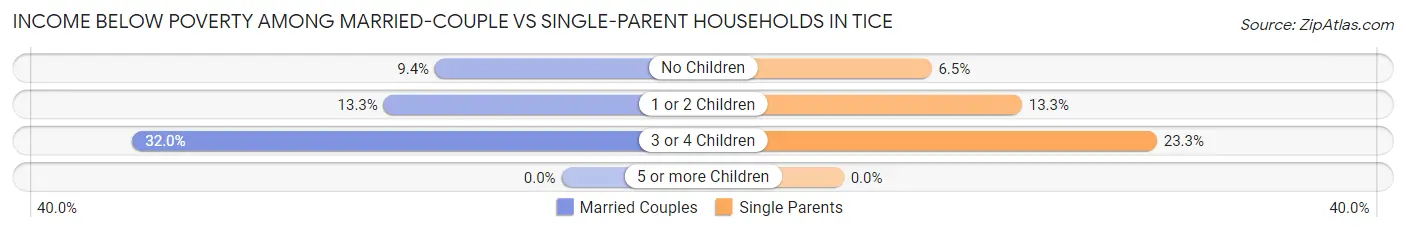
| Children | Married-Couple Families | Single-Parent Households |
| No Children | 25 (9.4%) | 10 (6.5%) |
| 1 or 2 Children | 22 (13.3%) | 15 (13.3%) |
| 3 or 4 Children | 78 (32.0%) | 14 (23.3%) |
| 5 or more Children | 0 (0.0%) | 0 (0.0%) |
| Total | 125 (18.5%) | 39 (12.0%) |
Race in Tice
The most populous races in Tice are Hispanic or Latino (3,452 | 63.1%), White / Caucasian (3,192 | 58.4%), and Two or more Races (1,474 | 27.0%).
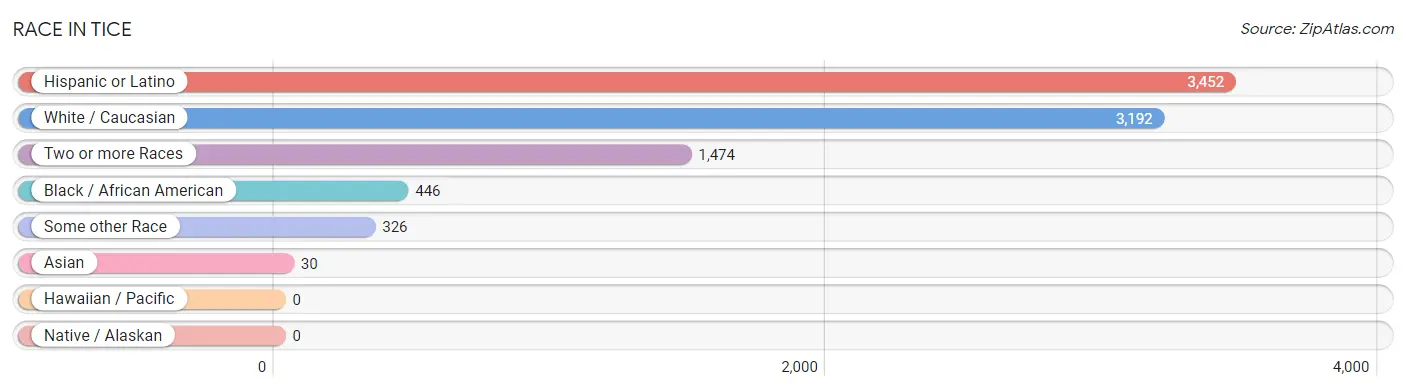
| Race | # Population | % Population |
| Asian | 30 | 0.5% |
| Black / African American | 446 | 8.2% |
| Hawaiian / Pacific | 0 | 0.0% |
| Hispanic or Latino | 3,452 | 63.1% |
| Native / Alaskan | 0 | 0.0% |
| White / Caucasian | 3,192 | 58.4% |
| Two or more Races | 1,474 | 27.0% |
| Some other Race | 326 | 6.0% |
| Total | 5,468 | 100.0% |
Ancestry in Tice
The most populous ancestries reported in Tice are Central American (1,661 | 30.4%), Mexican (1,447 | 26.5%), Guatemalan (1,442 | 26.4%), Irish (346 | 6.3%), and Puerto Rican (311 | 5.7%), together accounting for 95.2% of all Tice residents.
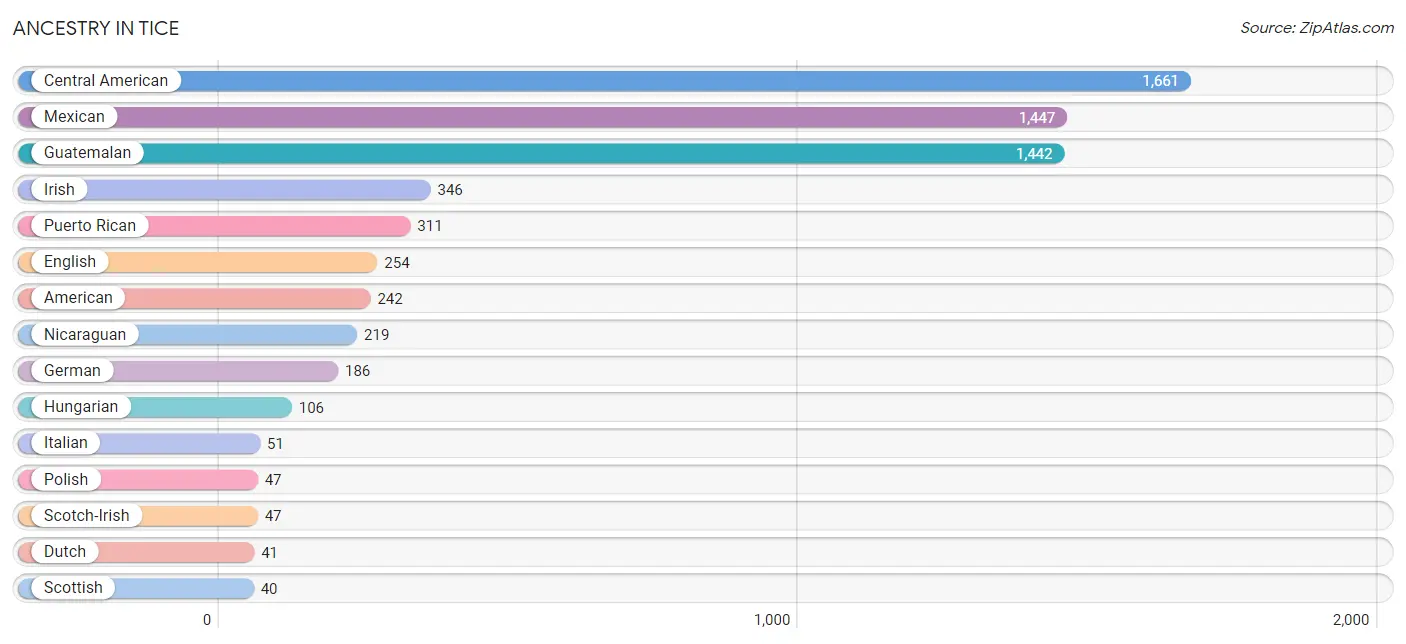
| Ancestry | # Population | % Population |
| American | 242 | 4.4% |
| British | 8 | 0.2% |
| Central American | 1,661 | 30.4% |
| Colombian | 23 | 0.4% |
| Croatian | 23 | 0.4% |
| Cuban | 10 | 0.2% |
| Dutch | 41 | 0.7% |
| English | 254 | 4.6% |
| European | 33 | 0.6% |
| French | 32 | 0.6% |
| German | 186 | 3.4% |
| Guatemalan | 1,442 | 26.4% |
| Hungarian | 106 | 1.9% |
| Irish | 346 | 6.3% |
| Italian | 51 | 0.9% |
| Mexican | 1,447 | 26.5% |
| Nicaraguan | 219 | 4.0% |
| Norwegian | 16 | 0.3% |
| Pennsylvania German | 9 | 0.2% |
| Polish | 47 | 0.9% |
| Puerto Rican | 311 | 5.7% |
| Romanian | 5 | 0.1% |
| Scotch-Irish | 47 | 0.9% |
| Scottish | 40 | 0.7% |
| South American | 23 | 0.4% |
| Swedish | 27 | 0.5% |
| Vietnamese | 30 | 0.5% | View All 27 Rows |
Immigrants in Tice
The most numerous immigrant groups reported in Tice came from Latin America (1,803 | 33.0%), Central America (1,786 | 32.7%), Guatemala (821 | 15.0%), Mexico (777 | 14.2%), and Nicaragua (169 | 3.1%), together accounting for 97.9% of all Tice residents.
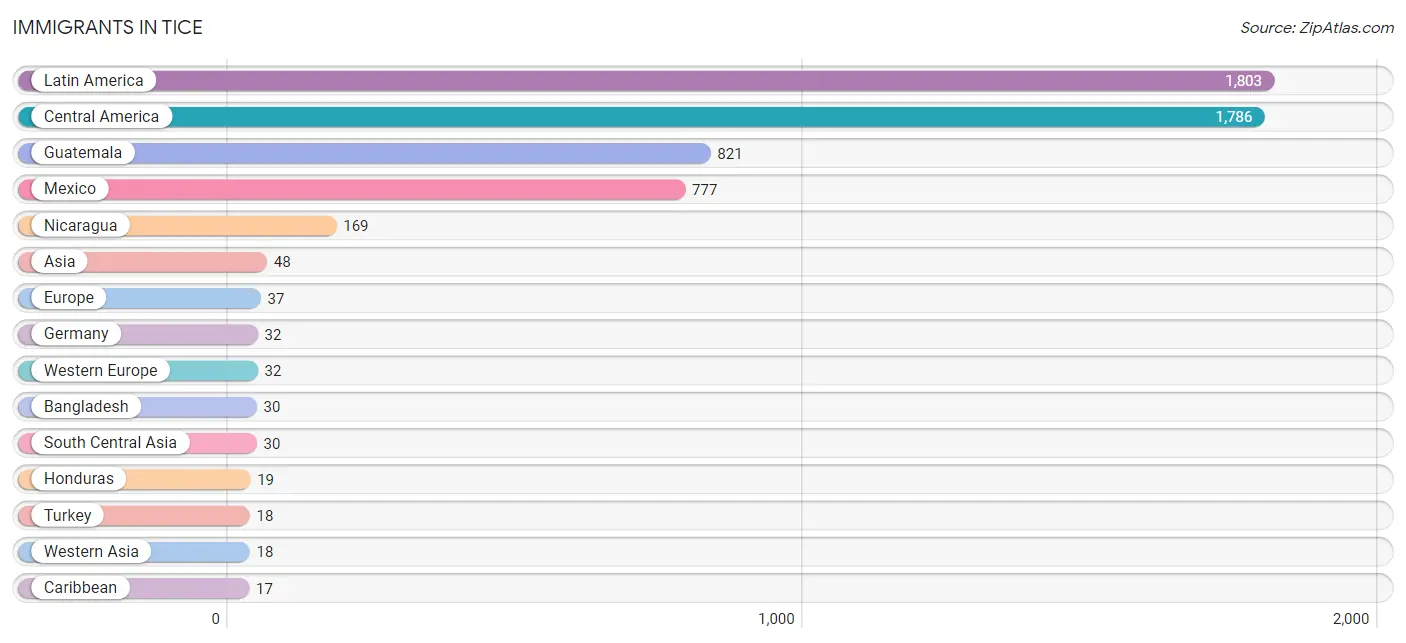
| Immigration Origin | # Population | % Population |
| Africa | 5 | 0.1% |
| Asia | 48 | 0.9% |
| Bangladesh | 30 | 0.5% |
| Caribbean | 17 | 0.3% |
| Central America | 1,786 | 32.7% |
| Cuba | 10 | 0.2% |
| Eastern Europe | 5 | 0.1% |
| Egypt | 5 | 0.1% |
| Europe | 37 | 0.7% |
| Germany | 32 | 0.6% |
| Guatemala | 821 | 15.0% |
| Honduras | 19 | 0.4% |
| Latin America | 1,803 | 33.0% |
| Mexico | 777 | 14.2% |
| Nicaragua | 169 | 3.1% |
| Northern Africa | 5 | 0.1% |
| Romania | 5 | 0.1% |
| South Central Asia | 30 | 0.5% |
| Turkey | 18 | 0.3% |
| Western Asia | 18 | 0.3% |
| Western Europe | 32 | 0.6% | View All 21 Rows |
Sex and Age in Tice
Sex and Age in Tice
The most populous age groups in Tice are 35 to 39 Years (366 | 12.0%) for men and 15 to 19 Years (295 | 12.1%) for women.
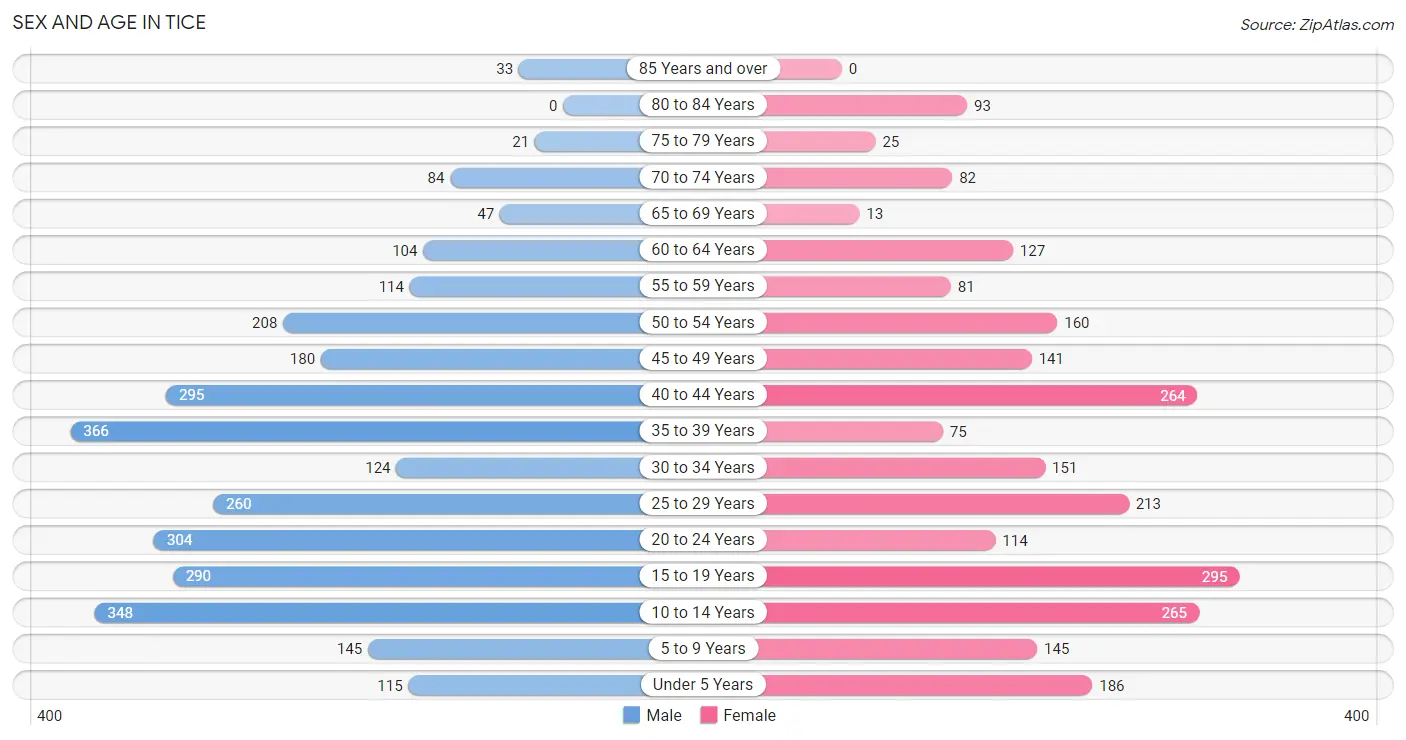
| Age Bracket | Male | Female |
| Under 5 Years | 115 (3.8%) | 186 (7.6%) |
| 5 to 9 Years | 145 (4.8%) | 145 (6.0%) |
| 10 to 14 Years | 348 (11.5%) | 265 (10.9%) |
| 15 to 19 Years | 290 (9.6%) | 295 (12.1%) |
| 20 to 24 Years | 304 (10.0%) | 114 (4.7%) |
| 25 to 29 Years | 260 (8.6%) | 213 (8.8%) |
| 30 to 34 Years | 124 (4.1%) | 151 (6.2%) |
| 35 to 39 Years | 366 (12.0%) | 75 (3.1%) |
| 40 to 44 Years | 295 (9.7%) | 264 (10.9%) |
| 45 to 49 Years | 180 (5.9%) | 141 (5.8%) |
| 50 to 54 Years | 208 (6.9%) | 160 (6.6%) |
| 55 to 59 Years | 114 (3.7%) | 81 (3.3%) |
| 60 to 64 Years | 104 (3.4%) | 127 (5.2%) |
| 65 to 69 Years | 47 (1.5%) | 13 (0.5%) |
| 70 to 74 Years | 84 (2.8%) | 82 (3.4%) |
| 75 to 79 Years | 21 (0.7%) | 25 (1.0%) |
| 80 to 84 Years | 0 (0.0%) | 93 (3.8%) |
| 85 Years and over | 33 (1.1%) | 0 (0.0%) |
| Total | 3,038 (100.0%) | 2,430 (100.0%) |
Families and Households in Tice
Median Family Size in Tice
The median family size in Tice is 4.03 persons per family, with single female/mother families (234 | 23.4%) accounting for the largest median family size of 4.08 persons per family. On the other hand, single male/father families (92 | 9.2%) represent the smallest median family size with 3.62 persons per family.
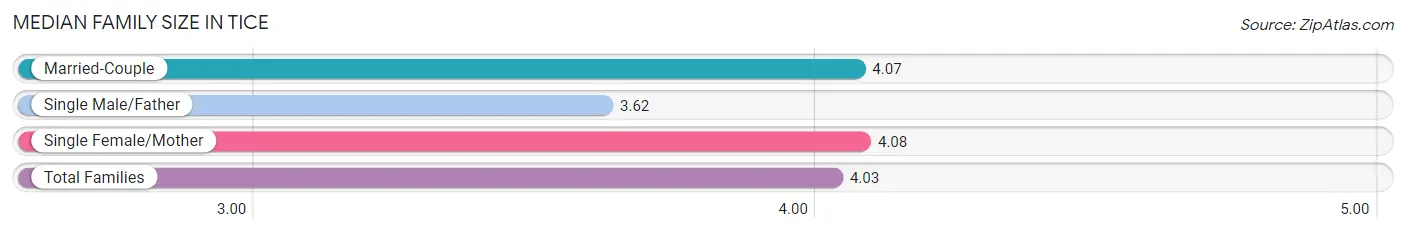
| Family Type | # Families | Family Size |
| Married-Couple | 675 (67.4%) | 4.07 |
| Single Male/Father | 92 (9.2%) | 3.62 |
| Single Female/Mother | 234 (23.4%) | 4.08 |
| Total Families | 1,001 (100.0%) | 4.03 |
Median Household Size in Tice
The median household size in Tice is 3.42 persons per household, with single female/mother households (234 | 14.7%) accounting for the largest median household size of 5.01 persons per household. non-family households (586 | 36.9%) represent the smallest median household size with 1.55 persons per household.
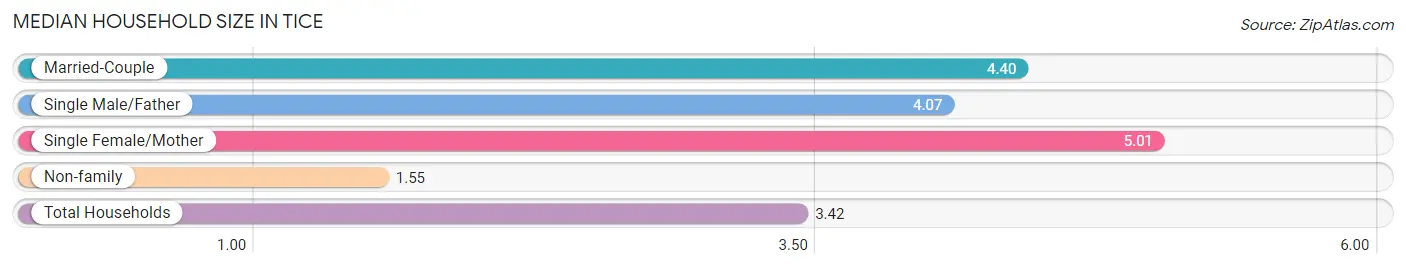
| Household Type | # Households | Household Size |
| Married-Couple | 675 (42.5%) | 4.40 |
| Single Male/Father | 92 (5.8%) | 4.07 |
| Single Female/Mother | 234 (14.7%) | 5.01 |
| Non-family | 586 (36.9%) | 1.55 |
| Total Households | 1,587 (100.0%) | 3.42 |
Household Size by Marriage Status in Tice
Out of a total of 1,587 households in Tice, 1,001 (63.1%) are family households, while 586 (36.9%) are nonfamily households. The most numerous type of family households are 5-person households, comprising 294, and the most common type of nonfamily households are 1-person households, comprising 421.
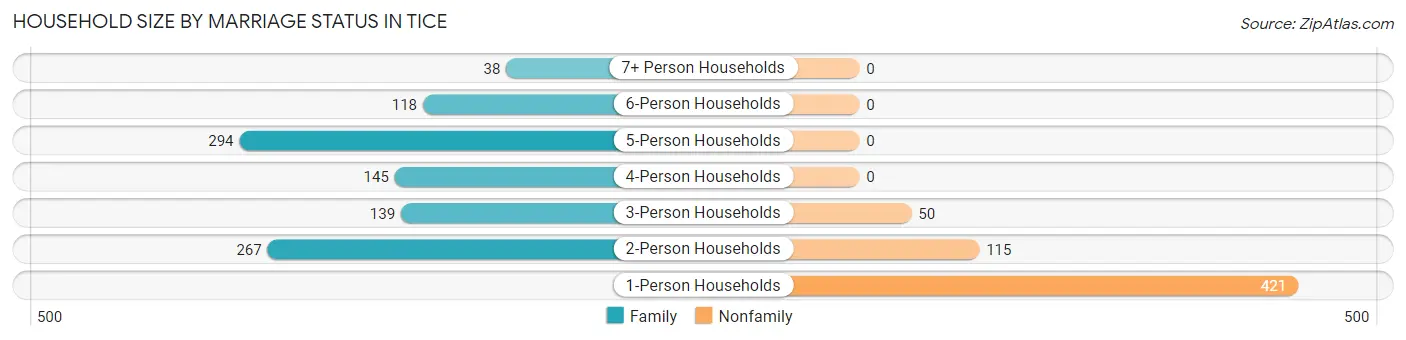
| Household Size | Family Households | Nonfamily Households |
| 1-Person Households | - | 421 (26.5%) |
| 2-Person Households | 267 (16.8%) | 115 (7.2%) |
| 3-Person Households | 139 (8.8%) | 50 (3.2%) |
| 4-Person Households | 145 (9.1%) | 0 (0.0%) |
| 5-Person Households | 294 (18.5%) | 0 (0.0%) |
| 6-Person Households | 118 (7.4%) | 0 (0.0%) |
| 7+ Person Households | 38 (2.4%) | 0 (0.0%) |
| Total | 1,001 (63.1%) | 586 (36.9%) |
Female Fertility in Tice
Fertility by Age in Tice
Average fertility rate in Tice is 79.0 births per 1,000 women. Women in the age bracket of 20 to 34 years have the highest fertility rate with 207.0 births per 1,000 women. Women in the age bracket of 20 to 34 years acount for 100.0% of all women with births.
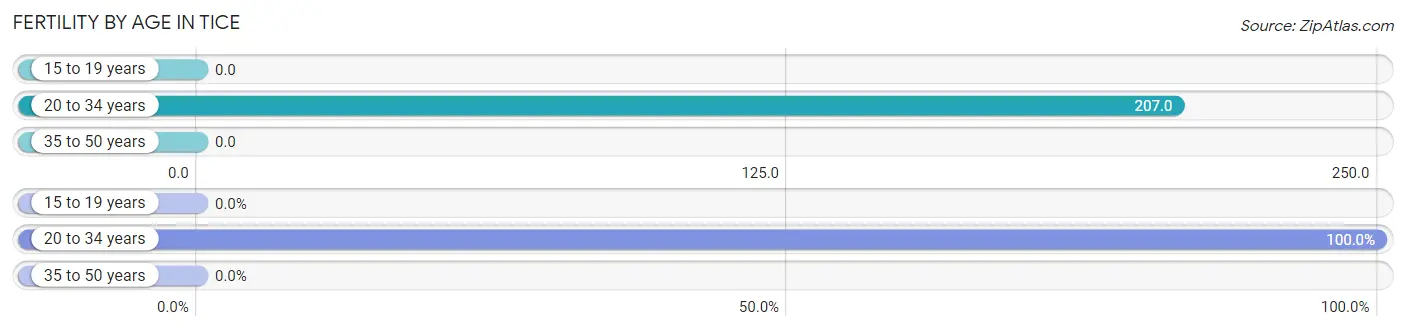
| Age Bracket | Women with Births | Births / 1,000 Women |
| 15 to 19 years | 0 (0.0%) | 0.0 |
| 20 to 34 years | 99 (100.0%) | 207.0 |
| 35 to 50 years | 0 (0.0%) | 0.0 |
| Total | 99 (100.0%) | 79.0 |
Fertility by Age by Marriage Status in Tice
43.4% of women with births (99) in Tice are married. The highest percentage of unmarried women with births falls into 20 to 34 years age bracket with 56.6% of them unmarried at the time of birth, while the lowest percentage of unmarried women with births belong to 20 to 34 years age bracket with 56.6% of them unmarried.
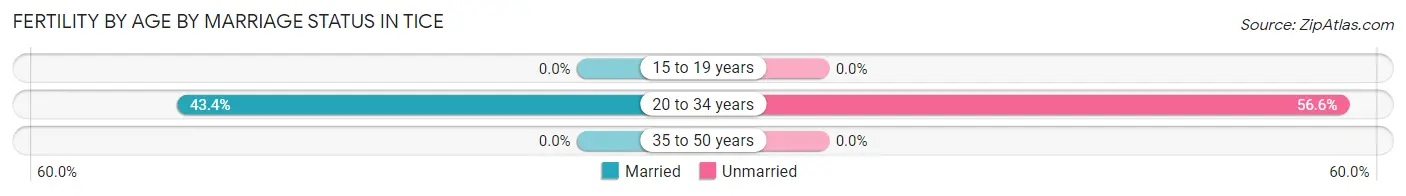
| Age Bracket | Married | Unmarried |
| 15 to 19 years | 0 (0.0%) | 0 (0.0%) |
| 20 to 34 years | 43 (43.4%) | 56 (56.6%) |
| 35 to 50 years | 0 (0.0%) | 0 (0.0%) |
| Total | 43 (43.4%) | 56 (56.6%) |
Fertility by Education in Tice
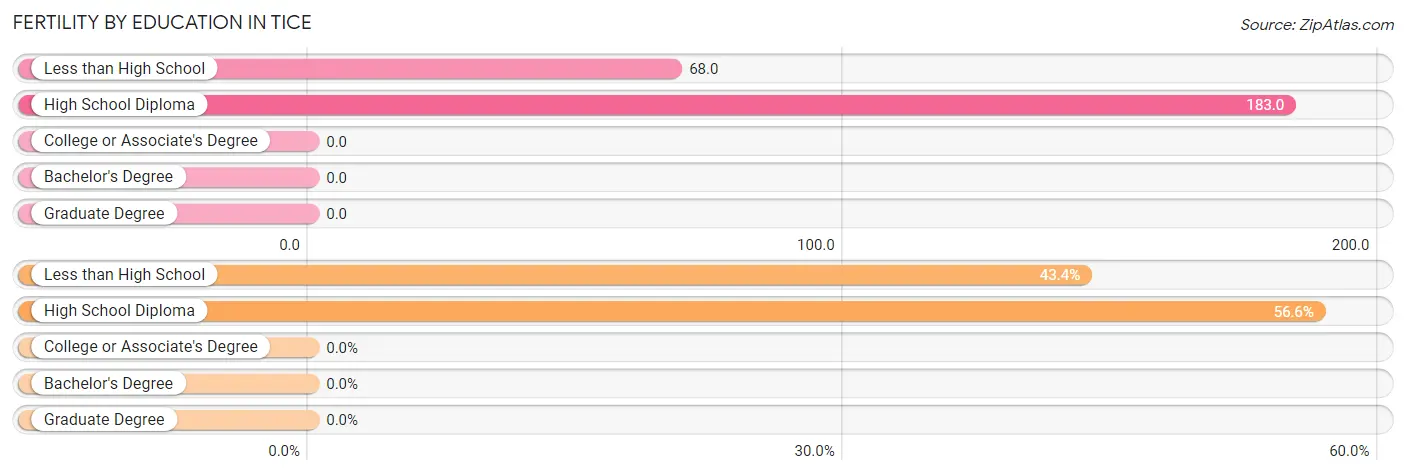
| Educational Attainment | Women with Births | Births / 1,000 Women |
| Less than High School | 43 (43.4%) | 68.0 |
| High School Diploma | 56 (56.6%) | 183.0 |
| College or Associate's Degree | 0 (0.0%) | 0.0 |
| Bachelor's Degree | 0 (0.0%) | 0.0 |
| Graduate Degree | 0 (0.0%) | 0.0 |
| Total | 99 (100.0%) | 79.0 |
Fertility by Education by Marriage Status in Tice
56.6% of women with births in Tice are unmarried. Women with the educational attainment of less than high school are most likely to be married with 100.0% of them married at childbirth, while women with the educational attainment of high school diploma are least likely to be married with 100.0% of them unmarried at childbirth.
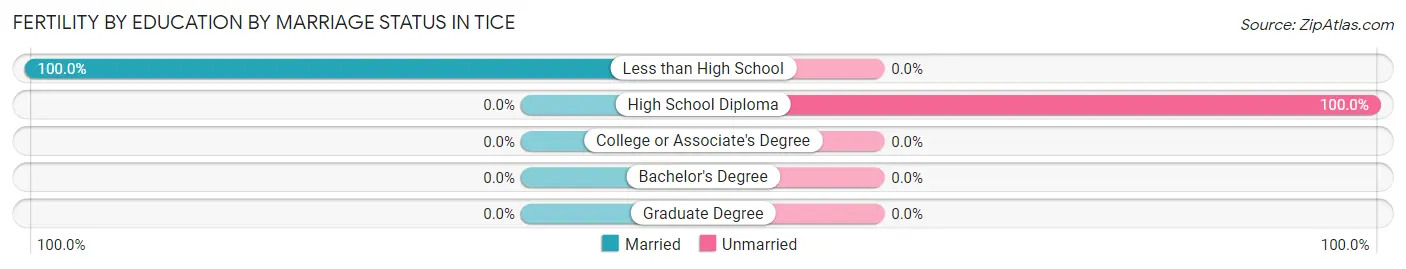
| Educational Attainment | Married | Unmarried |
| Less than High School | 43 (100.0%) | 0 (0.0%) |
| High School Diploma | 0 (0.0%) | 56 (100.0%) |
| College or Associate's Degree | 0 (0.0%) | 0 (0.0%) |
| Bachelor's Degree | 0 (0.0%) | 0 (0.0%) |
| Graduate Degree | 0 (0.0%) | 0 (0.0%) |
| Total | 43 (43.4%) | 56 (56.6%) |
Employment Characteristics in Tice
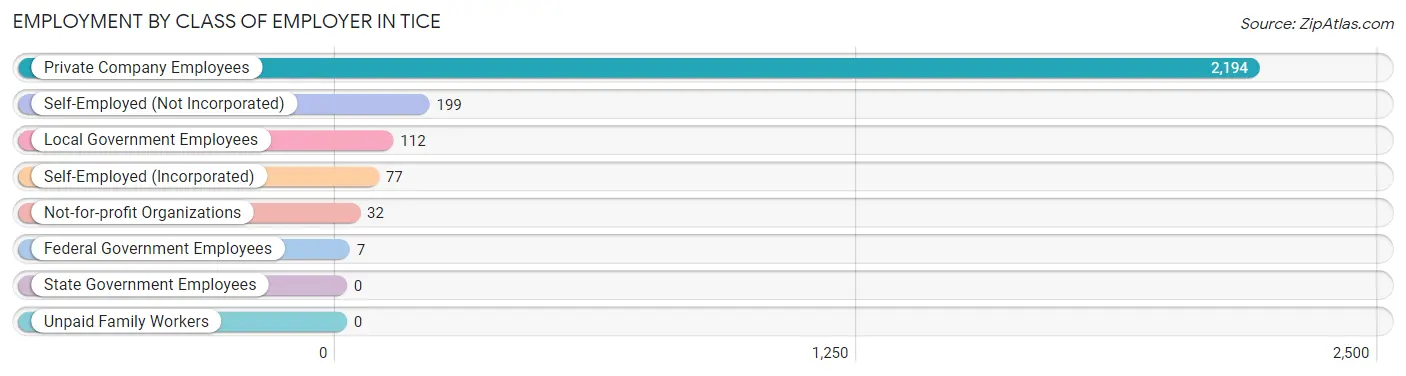
Employment by Class of Employer in Tice
Among the 2,621 employed individuals in Tice, private company employees (2,194 | 83.7%), self-employed (not incorporated) (199 | 7.6%), and local government employees (112 | 4.3%) make up the most common classes of employment.
| Employer Class | # Employees | % Employees |
| Private Company Employees | 2,194 | 83.7% |
| Self-Employed (Incorporated) | 77 | 2.9% |
| Self-Employed (Not Incorporated) | 199 | 7.6% |
| Not-for-profit Organizations | 32 | 1.2% |
| Local Government Employees | 112 | 4.3% |
| State Government Employees | 0 | 0.0% |
| Federal Government Employees | 7 | 0.3% |
| Unpaid Family Workers | 0 | 0.0% |
| Total | 2,621 | 100.0% |
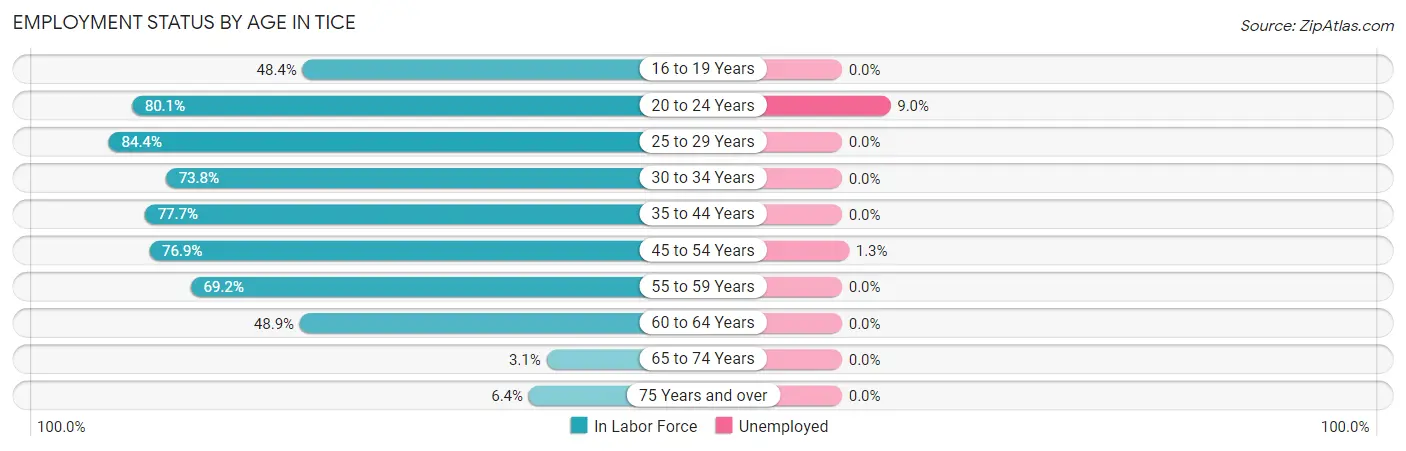
Employment Status by Age in Tice
According to the labor force statistics for Tice, out of the total population over 16 years of age (4,047), 66.4% or 2,687 individuals are in the labor force, with 1.4% or 38 of them unemployed. The age group with the highest labor force participation rate is 25 to 29 years, with 84.4% or 399 individuals in the labor force. Within the labor force, the 20 to 24 years age range has the highest percentage of unemployed individuals, with 9.0% or 30 of them being unemployed.
| Age Bracket | In Labor Force | Unemployed |
| 16 to 19 Years | 178 (48.4%) | 0 (0.0%) |
| 20 to 24 Years | 335 (80.1%) | 30 (9.0%) |
| 25 to 29 Years | 399 (84.4%) | 0 (0.0%) |
| 30 to 34 Years | 203 (73.8%) | 0 (0.0%) |
| 35 to 44 Years | 777 (77.7%) | 0 (0.0%) |
| 45 to 54 Years | 530 (76.9%) | 7 (1.3%) |
| 55 to 59 Years | 135 (69.2%) | 0 (0.0%) |
| 60 to 64 Years | 113 (48.9%) | 0 (0.0%) |
| 65 to 74 Years | 7 (3.1%) | 0 (0.0%) |
| 75 Years and over | 11 (6.4%) | 0 (0.0%) |
| Total | 2,687 (66.4%) | 38 (1.4%) |
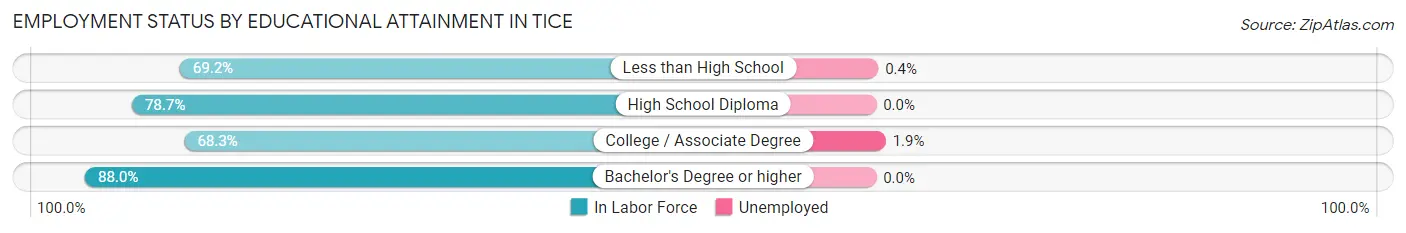
Employment Status by Educational Attainment in Tice
According to labor force statistics for Tice, 75.3% of individuals (2,156) out of the total population between 25 and 64 years of age (2,863) are in the labor force, with 0.3% or 6 of them being unemployed. The group with the highest labor force participation rate are those with the educational attainment of bachelor's degree or higher, with 88.0% or 323 individuals in the labor force. Within the labor force, individuals with college / associate degree education have the highest percentage of unemployment, with 1.9% or 4 of them being unemployed.
| Educational Attainment | In Labor Force | Unemployed |
| Less than High School | 711 (69.2%) | 4 (0.4%) |
| High School Diploma | 911 (78.7%) | 0 (0.0%) |
| College / Associate Degree | 213 (68.3%) | 6 (1.9%) |
| Bachelor's Degree or higher | 323 (88.0%) | 0 (0.0%) |
| Total | 2,156 (75.3%) | 9 (0.3%) |
Employment Occupations by Sex in Tice
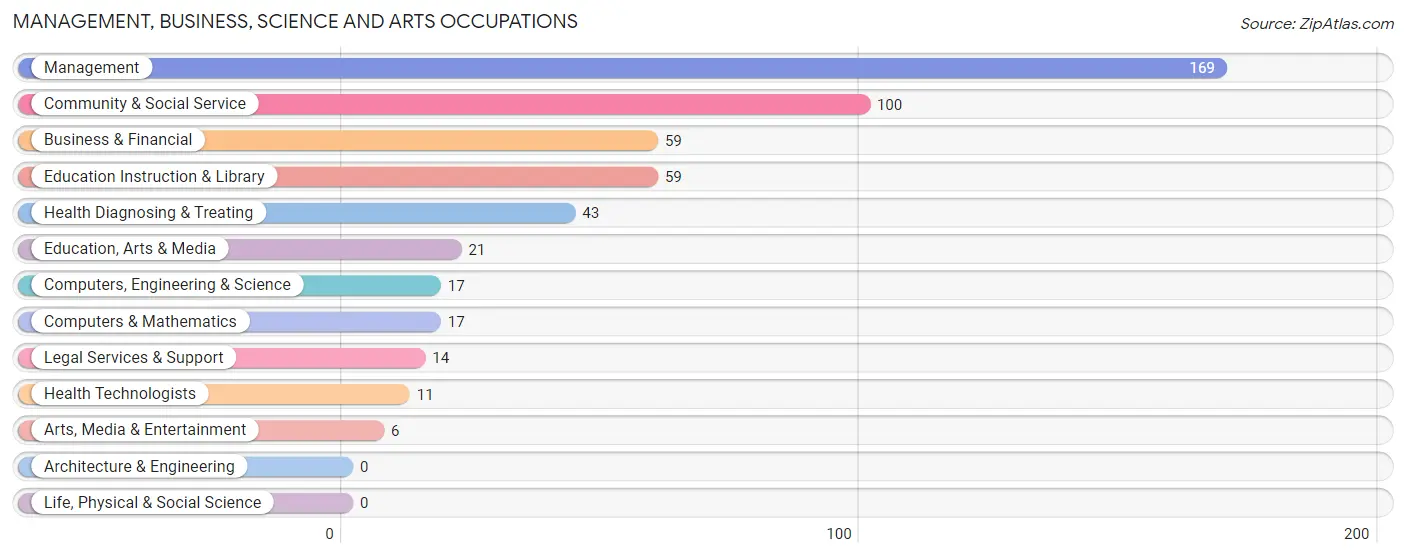
Management, Business, Science and Arts Occupations
The most common Management, Business, Science and Arts occupations in Tice are Management (169 | 6.4%), Community & Social Service (100 | 3.8%), Business & Financial (59 | 2.2%), Education Instruction & Library (59 | 2.2%), and Health Diagnosing & Treating (43 | 1.6%).
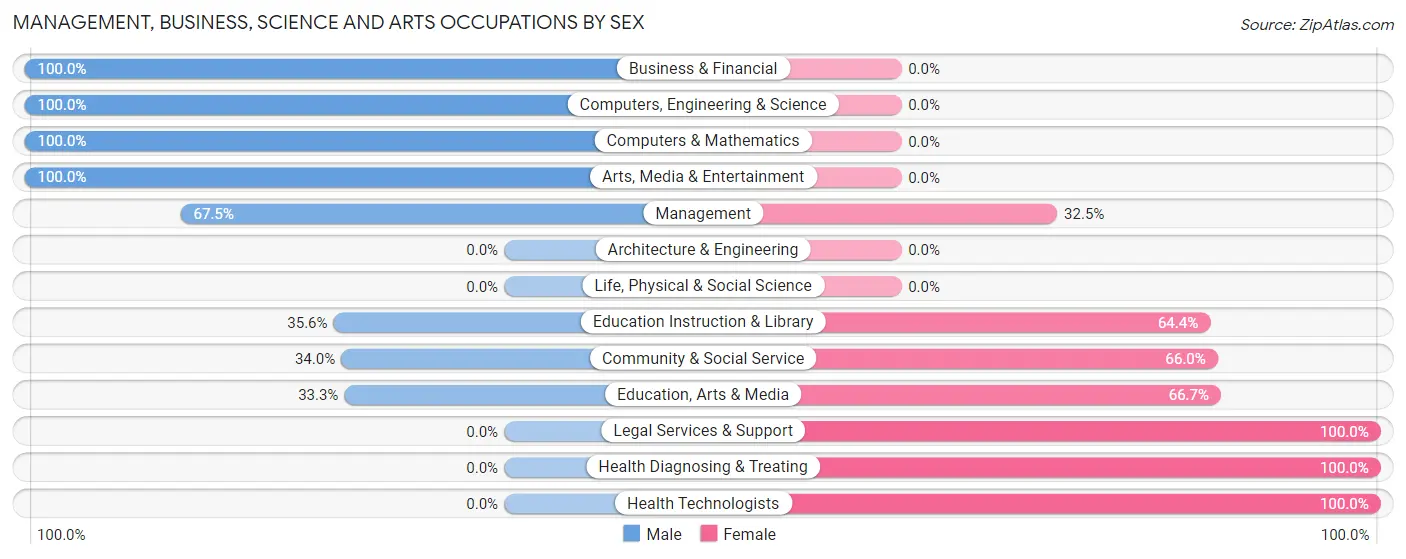
Management, Business, Science and Arts Occupations by Sex
Within the Management, Business, Science and Arts occupations in Tice, the most male-oriented occupations are Business & Financial (100.0%), Computers, Engineering & Science (100.0%), and Computers & Mathematics (100.0%), while the most female-oriented occupations are Legal Services & Support (100.0%), Health Diagnosing & Treating (100.0%), and Health Technologists (100.0%).
| Occupation | Male | Female |
| Management | 114 (67.5%) | 55 (32.5%) |
| Business & Financial | 59 (100.0%) | 0 (0.0%) |
| Computers, Engineering & Science | 17 (100.0%) | 0 (0.0%) |
| Computers & Mathematics | 17 (100.0%) | 0 (0.0%) |
| Architecture & Engineering | 0 (0.0%) | 0 (0.0%) |
| Life, Physical & Social Science | 0 (0.0%) | 0 (0.0%) |
| Community & Social Service | 34 (34.0%) | 66 (66.0%) |
| Education, Arts & Media | 7 (33.3%) | 14 (66.7%) |
| Legal Services & Support | 0 (0.0%) | 14 (100.0%) |
| Education Instruction & Library | 21 (35.6%) | 38 (64.4%) |
| Arts, Media & Entertainment | 6 (100.0%) | 0 (0.0%) |
| Health Diagnosing & Treating | 0 (0.0%) | 43 (100.0%) |
| Health Technologists | 0 (0.0%) | 11 (100.0%) |
| Total (Category) | 224 (57.7%) | 164 (42.3%) |
| Total (Overall) | 1,664 (62.8%) | 987 (37.2%) |
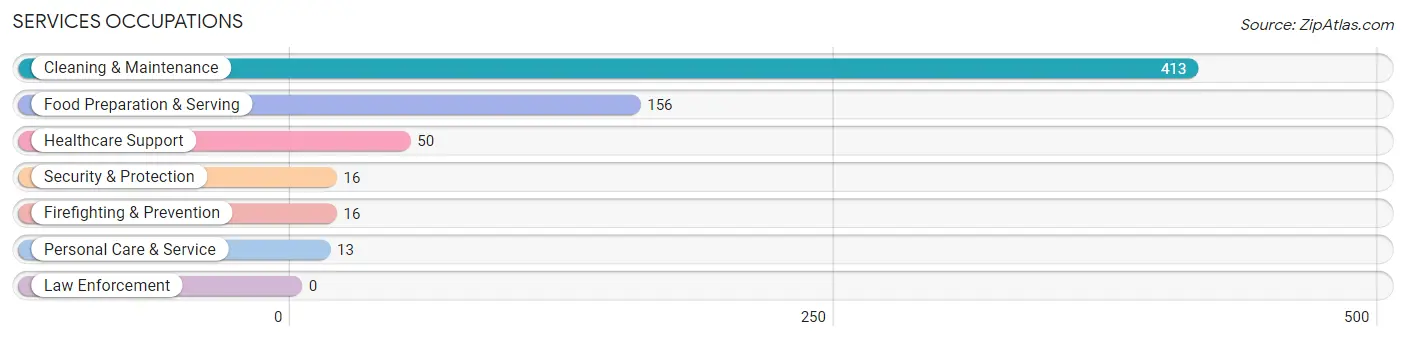
Services Occupations
The most common Services occupations in Tice are Cleaning & Maintenance (413 | 15.6%), Food Preparation & Serving (156 | 5.9%), Healthcare Support (50 | 1.9%), Security & Protection (16 | 0.6%), and Firefighting & Prevention (16 | 0.6%).
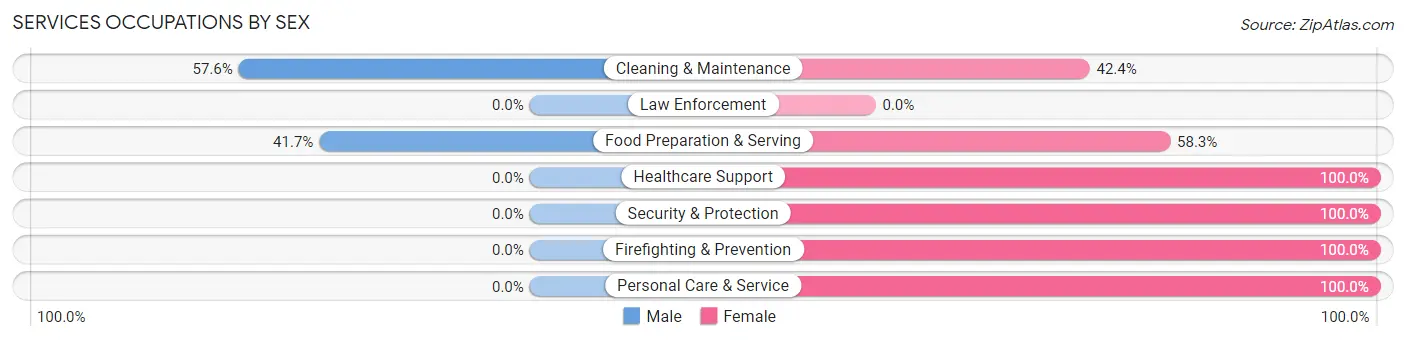
Services Occupations by Sex
Within the Services occupations in Tice, the most male-oriented occupations are Cleaning & Maintenance (57.6%), and Food Preparation & Serving (41.7%), while the most female-oriented occupations are Healthcare Support (100.0%), Security & Protection (100.0%), and Firefighting & Prevention (100.0%).
| Occupation | Male | Female |
| Healthcare Support | 0 (0.0%) | 50 (100.0%) |
| Security & Protection | 0 (0.0%) | 16 (100.0%) |
| Firefighting & Prevention | 0 (0.0%) | 16 (100.0%) |
| Law Enforcement | 0 (0.0%) | 0 (0.0%) |
| Food Preparation & Serving | 65 (41.7%) | 91 (58.3%) |
| Cleaning & Maintenance | 238 (57.6%) | 175 (42.4%) |
| Personal Care & Service | 0 (0.0%) | 13 (100.0%) |
| Total (Category) | 303 (46.8%) | 345 (53.2%) |
| Total (Overall) | 1,664 (62.8%) | 987 (37.2%) |
Sales and Office Occupations
The most common Sales and Office occupations in Tice are Sales & Related (250 | 9.4%), and Office & Administration (201 | 7.6%).
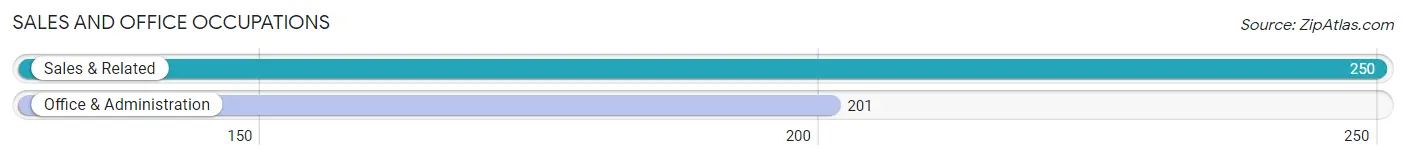
Sales and Office Occupations by Sex

| Occupation | Male | Female |
| Sales & Related | 119 (47.6%) | 131 (52.4%) |
| Office & Administration | 21 (10.4%) | 180 (89.5%) |
| Total (Category) | 140 (31.0%) | 311 (69.0%) |
| Total (Overall) | 1,664 (62.8%) | 987 (37.2%) |
Natural Resources, Construction and Maintenance Occupations
The most common Natural Resources, Construction and Maintenance occupations in Tice are Construction & Extraction (676 | 25.5%), and Installation, Maintenance & Repair (87 | 3.3%).
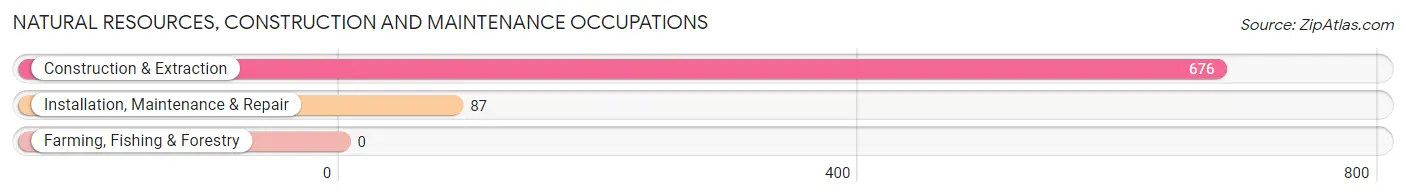
Natural Resources, Construction and Maintenance Occupations by Sex
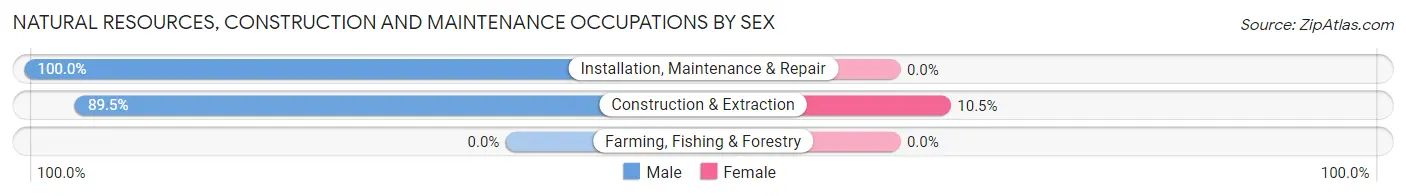
| Occupation | Male | Female |
| Farming, Fishing & Forestry | 0 (0.0%) | 0 (0.0%) |
| Construction & Extraction | 605 (89.5%) | 71 (10.5%) |
| Installation, Maintenance & Repair | 87 (100.0%) | 0 (0.0%) |
| Total (Category) | 692 (90.7%) | 71 (9.3%) |
| Total (Overall) | 1,664 (62.8%) | 987 (37.2%) |
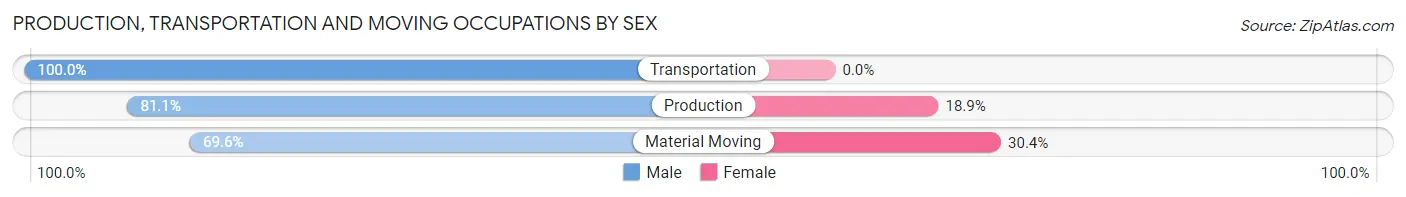
Production, Transportation and Moving Occupations
The most common Production, Transportation and Moving occupations in Tice are Material Moving (237 | 8.9%), Production (127 | 4.8%), and Transportation (37 | 1.4%).
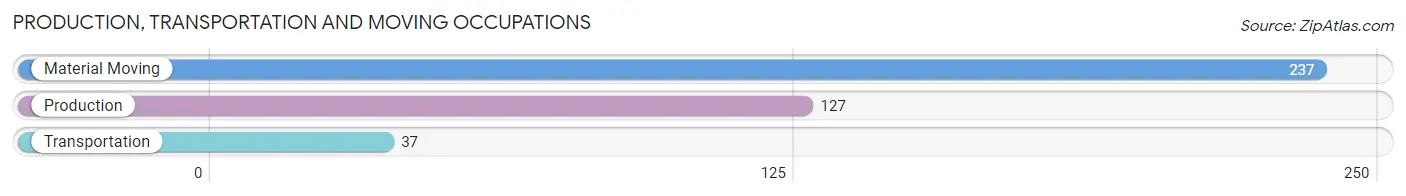
Production, Transportation and Moving Occupations by Sex
| Occupation | Male | Female |
| Production | 103 (81.1%) | 24 (18.9%) |
| Transportation | 37 (100.0%) | 0 (0.0%) |
| Material Moving | 165 (69.6%) | 72 (30.4%) |
| Total (Category) | 305 (76.1%) | 96 (23.9%) |
| Total (Overall) | 1,664 (62.8%) | 987 (37.2%) |
Employment Industries by Sex in Tice
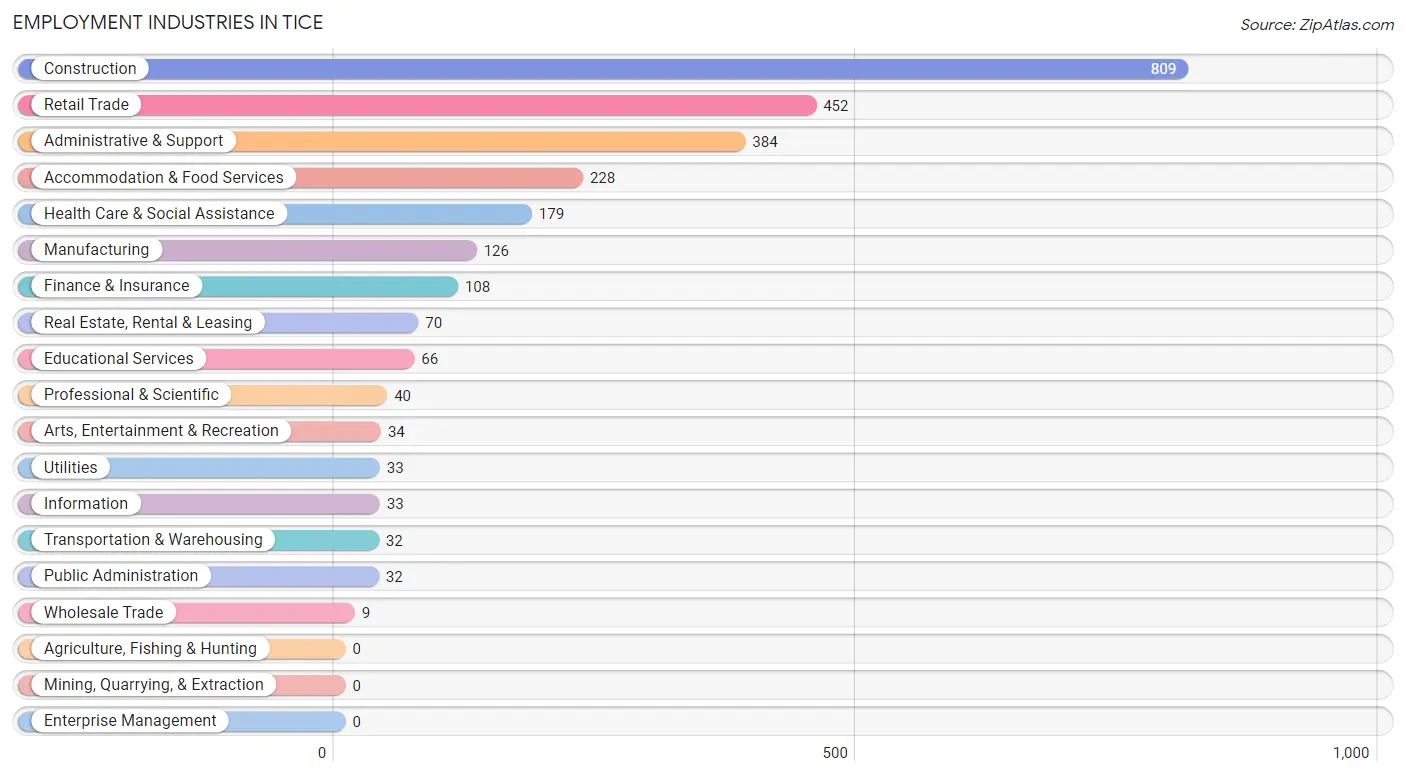
Employment Industries in Tice
The major employment industries in Tice include Construction (809 | 30.5%), Retail Trade (452 | 17.1%), Administrative & Support (384 | 14.5%), Accommodation & Food Services (228 | 8.6%), and Health Care & Social Assistance (179 | 6.8%).
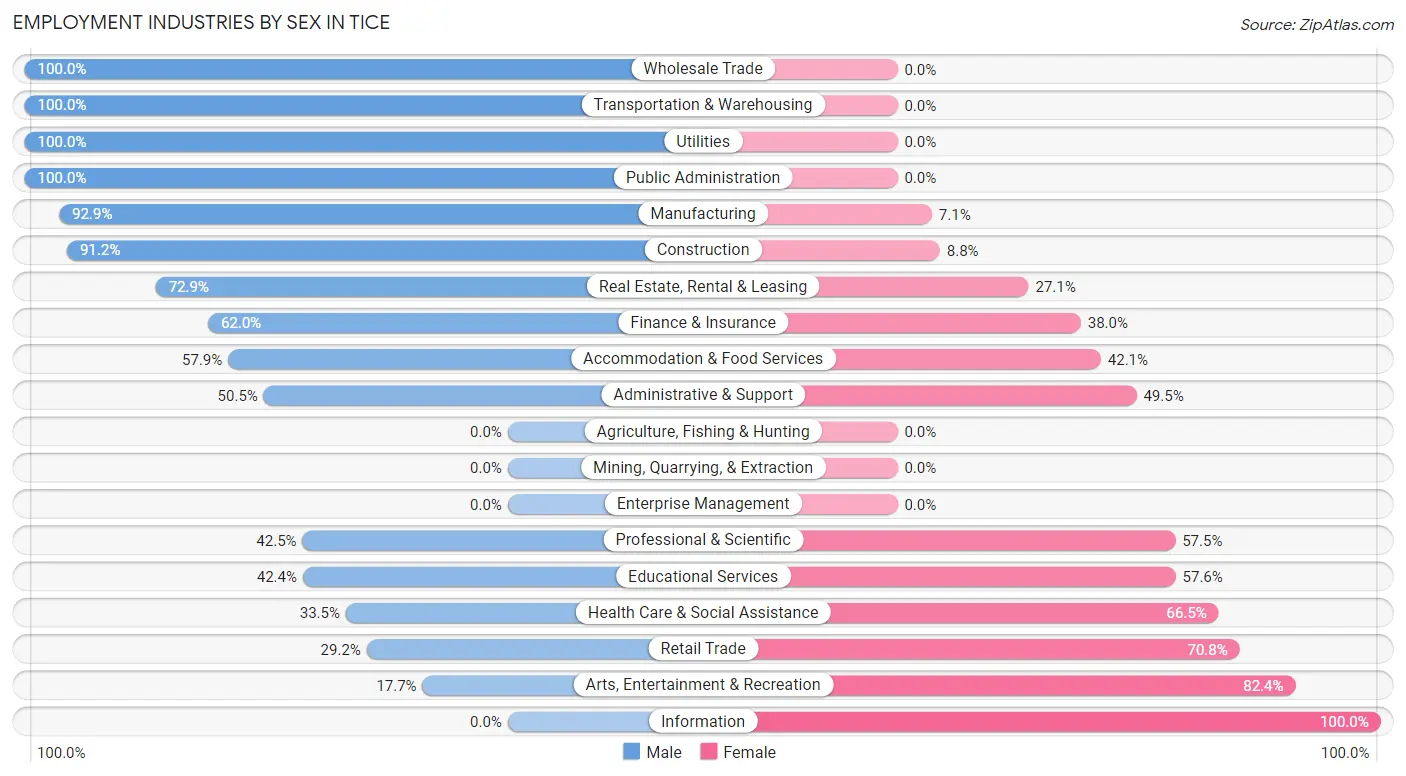
Employment Industries by Sex in Tice
The Tice industries that see more men than women are Wholesale Trade (100.0%), Transportation & Warehousing (100.0%), and Utilities (100.0%), whereas the industries that tend to have a higher number of women are Information (100.0%), Arts, Entertainment & Recreation (82.4%), and Retail Trade (70.8%).
| Industry | Male | Female |
| Agriculture, Fishing & Hunting | 0 (0.0%) | 0 (0.0%) |
| Mining, Quarrying, & Extraction | 0 (0.0%) | 0 (0.0%) |
| Construction | 738 (91.2%) | 71 (8.8%) |
| Manufacturing | 117 (92.9%) | 9 (7.1%) |
| Wholesale Trade | 9 (100.0%) | 0 (0.0%) |
| Retail Trade | 132 (29.2%) | 320 (70.8%) |
| Transportation & Warehousing | 32 (100.0%) | 0 (0.0%) |
| Utilities | 33 (100.0%) | 0 (0.0%) |
| Information | 0 (0.0%) | 33 (100.0%) |
| Finance & Insurance | 67 (62.0%) | 41 (38.0%) |
| Real Estate, Rental & Leasing | 51 (72.9%) | 19 (27.1%) |
| Professional & Scientific | 17 (42.5%) | 23 (57.5%) |
| Enterprise Management | 0 (0.0%) | 0 (0.0%) |
| Administrative & Support | 194 (50.5%) | 190 (49.5%) |
| Educational Services | 28 (42.4%) | 38 (57.6%) |
| Health Care & Social Assistance | 60 (33.5%) | 119 (66.5%) |
| Arts, Entertainment & Recreation | 6 (17.6%) | 28 (82.4%) |
| Accommodation & Food Services | 132 (57.9%) | 96 (42.1%) |
| Public Administration | 32 (100.0%) | 0 (0.0%) |
| Total | 1,664 (62.8%) | 987 (37.2%) |
Education in Tice
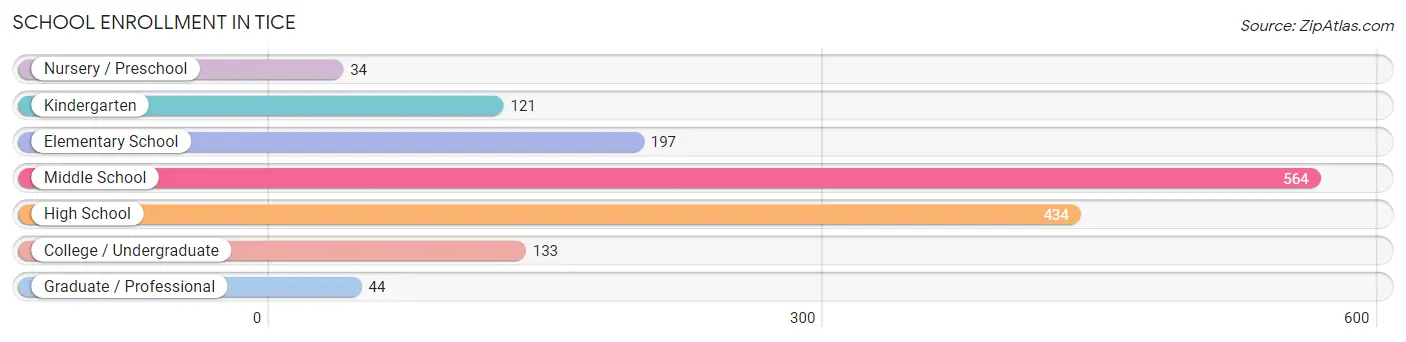
School Enrollment in Tice
The most common levels of schooling among the 1,527 students in Tice are middle school (564 | 36.9%), high school (434 | 28.4%), and elementary school (197 | 12.9%).
| School Level | # Students | % Students |
| Nursery / Preschool | 34 | 2.2% |
| Kindergarten | 121 | 7.9% |
| Elementary School | 197 | 12.9% |
| Middle School | 564 | 36.9% |
| High School | 434 | 28.4% |
| College / Undergraduate | 133 | 8.7% |
| Graduate / Professional | 44 | 2.9% |
| Total | 1,527 | 100.0% |
School Enrollment by Age by Funding Source in Tice
Out of a total of 1,527 students who are enrolled in schools in Tice, 66 (4.3%) attend a private institution, while the remaining 1,461 (95.7%) are enrolled in public schools. The age group of 25 to 34 year olds has the highest likelihood of being enrolled in private schools, with 6 (100.0% in the age bracket) enrolled. Conversely, the age group of 3 to 4 year olds has the lowest likelihood of being enrolled in a private school, with 57 (100.0% in the age bracket) attending a public institution.
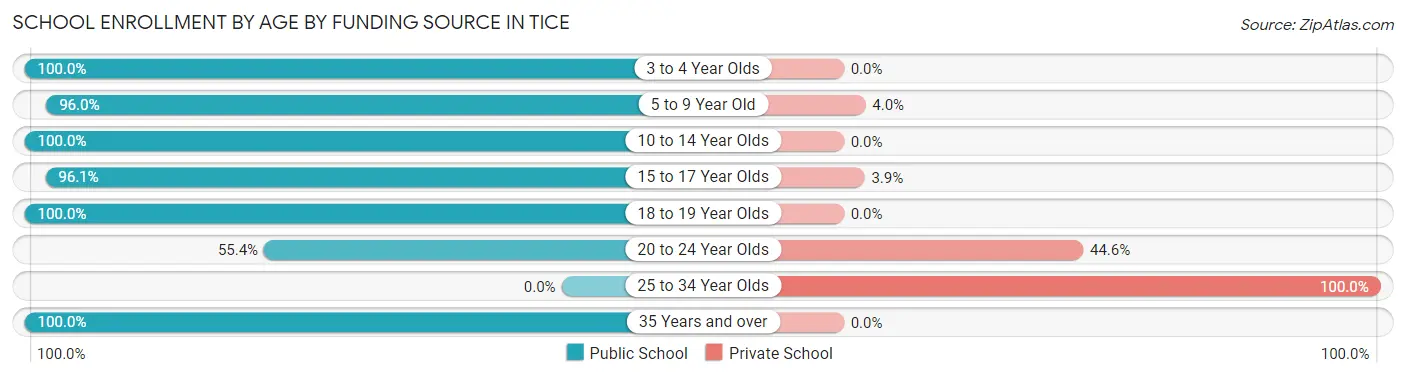
| Age Bracket | Public School | Private School |
| 3 to 4 Year Olds | 57 (100.0%) | 0 (0.0%) |
| 5 to 9 Year Old | 261 (96.0%) | 11 (4.0%) |
| 10 to 14 Year Olds | 587 (100.0%) | 0 (0.0%) |
| 15 to 17 Year Olds | 298 (96.1%) | 12 (3.9%) |
| 18 to 19 Year Olds | 168 (100.0%) | 0 (0.0%) |
| 20 to 24 Year Olds | 46 (55.4%) | 37 (44.6%) |
| 25 to 34 Year Olds | 0 (0.0%) | 6 (100.0%) |
| 35 Years and over | 44 (100.0%) | 0 (0.0%) |
| Total | 1,461 (95.7%) | 66 (4.3%) |
Educational Attainment by Field of Study in Tice
Business (152 | 33.9%), arts & humanities (58 | 13.0%), psychology (56 | 12.5%), social sciences (43 | 9.6%), and science & technology (35 | 7.8%) are the most common fields of study among 448 individuals in Tice who have obtained a bachelor's degree or higher.
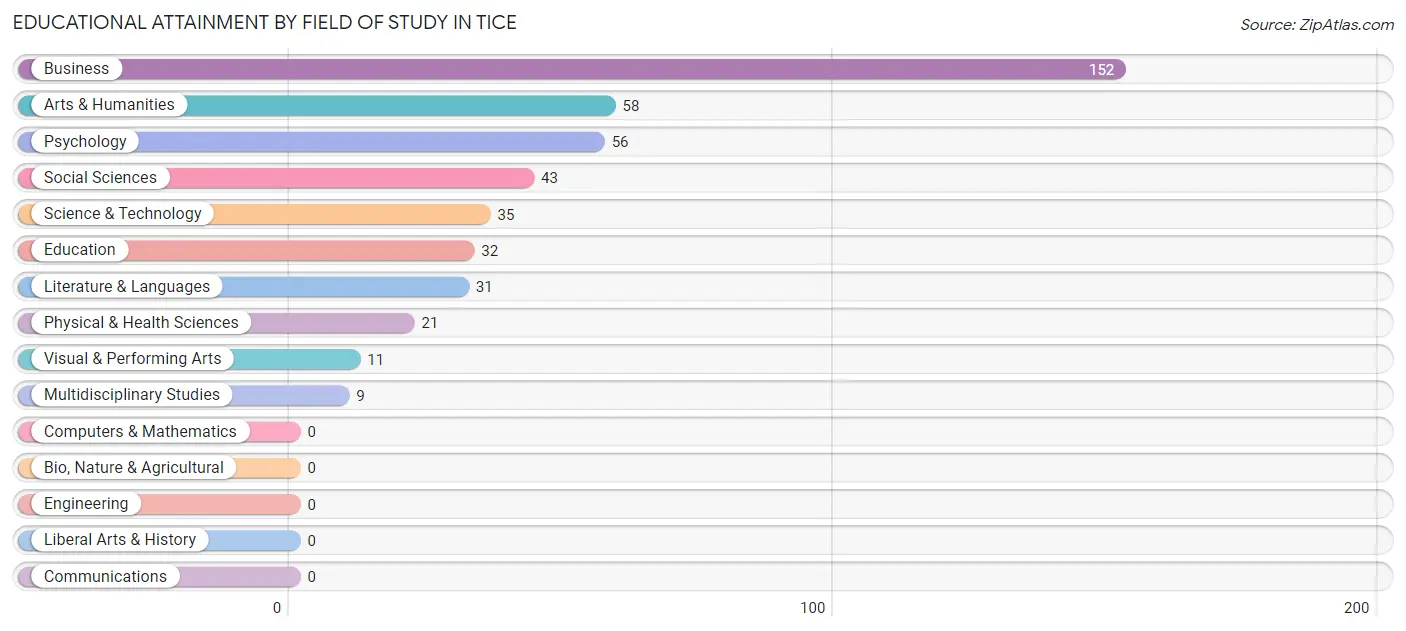
| Field of Study | # Graduates | % Graduates |
| Computers & Mathematics | 0 | 0.0% |
| Bio, Nature & Agricultural | 0 | 0.0% |
| Physical & Health Sciences | 21 | 4.7% |
| Psychology | 56 | 12.5% |
| Social Sciences | 43 | 9.6% |
| Engineering | 0 | 0.0% |
| Multidisciplinary Studies | 9 | 2.0% |
| Science & Technology | 35 | 7.8% |
| Business | 152 | 33.9% |
| Education | 32 | 7.1% |
| Literature & Languages | 31 | 6.9% |
| Liberal Arts & History | 0 | 0.0% |
| Visual & Performing Arts | 11 | 2.5% |
| Communications | 0 | 0.0% |
| Arts & Humanities | 58 | 13.0% |
| Total | 448 | 100.0% |
Transportation & Commute in Tice
Vehicle Availability by Sex in Tice
The most prevalent vehicle ownership categories in Tice are males with no vehicle (493, accounting for 29.6%) and females with no vehicle (188, making up 51.5%).

| Vehicles Available | Male | Female |
| No Vehicle | 493 (29.6%) | 188 (19.6%) |
| 1 Vehicle | 336 (20.2%) | 147 (15.4%) |
| 2 Vehicles | 444 (26.7%) | 353 (36.9%) |
| 3 Vehicles | 277 (16.7%) | 260 (27.2%) |
| 4 Vehicles | 32 (1.9%) | 3 (0.3%) |
| 5 or more Vehicles | 81 (4.9%) | 6 (0.6%) |
| Total | 1,663 (100.0%) | 957 (100.0%) |
Commute Time in Tice
The most frequently occuring commute durations in Tice are 30 to 34 minutes (452 commuters, 18.8%), 60 to 89 minutes (431 commuters, 17.9%), and 20 to 24 minutes (420 commuters, 17.5%).
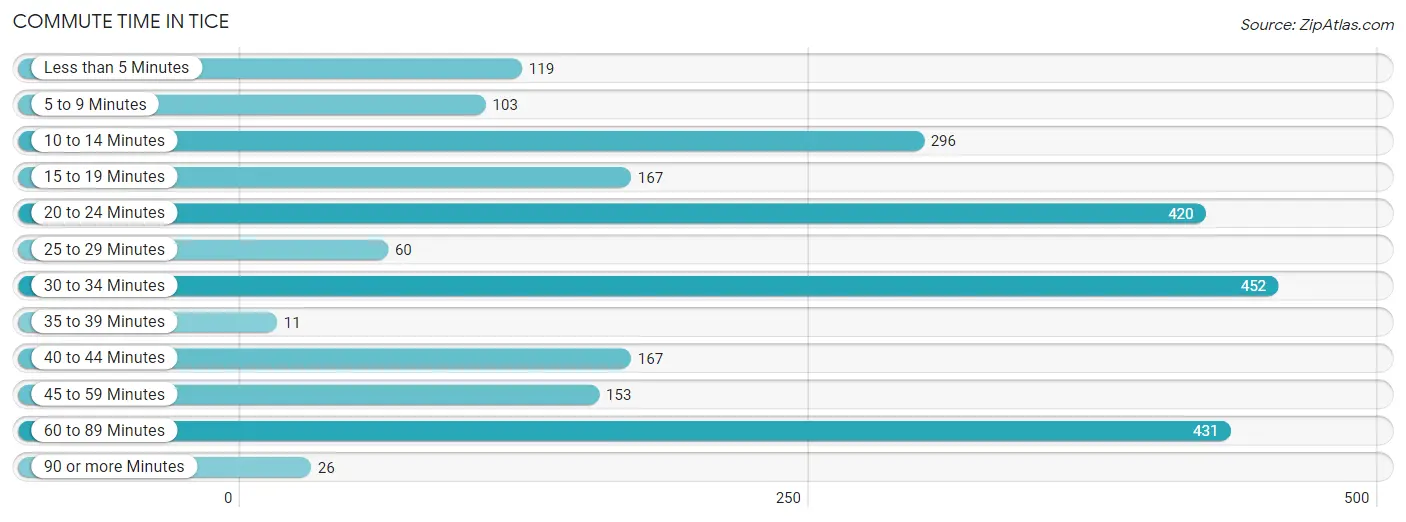
| Commute Time | # Commuters | % Commuters |
| Less than 5 Minutes | 119 | 5.0% |
| 5 to 9 Minutes | 103 | 4.3% |
| 10 to 14 Minutes | 296 | 12.3% |
| 15 to 19 Minutes | 167 | 6.9% |
| 20 to 24 Minutes | 420 | 17.5% |
| 25 to 29 Minutes | 60 | 2.5% |
| 30 to 34 Minutes | 452 | 18.8% |
| 35 to 39 Minutes | 11 | 0.5% |
| 40 to 44 Minutes | 167 | 6.9% |
| 45 to 59 Minutes | 153 | 6.4% |
| 60 to 89 Minutes | 431 | 17.9% |
| 90 or more Minutes | 26 | 1.1% |
Commute Time by Sex in Tice
The most common commute times in Tice are 60 to 89 minutes (382 commuters, 24.9%) for males and 30 to 34 minutes (295 commuters, 33.8%) for females.
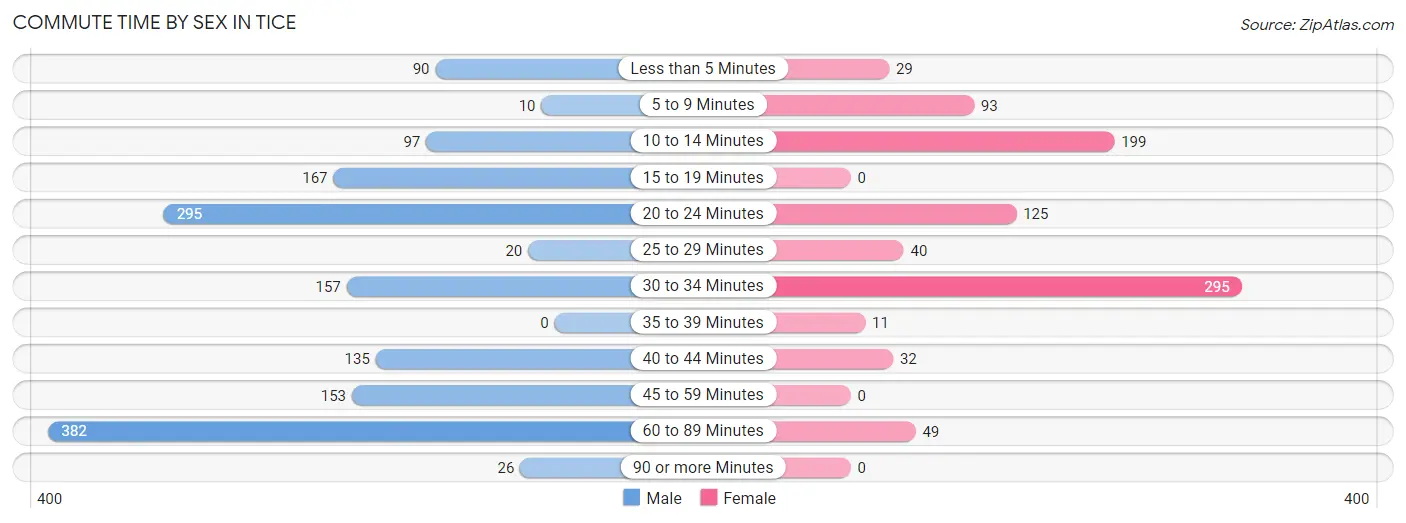
| Commute Time | Male | Female |
| Less than 5 Minutes | 90 (5.9%) | 29 (3.3%) |
| 5 to 9 Minutes | 10 (0.6%) | 93 (10.6%) |
| 10 to 14 Minutes | 97 (6.3%) | 199 (22.8%) |
| 15 to 19 Minutes | 167 (10.9%) | 0 (0.0%) |
| 20 to 24 Minutes | 295 (19.3%) | 125 (14.3%) |
| 25 to 29 Minutes | 20 (1.3%) | 40 (4.6%) |
| 30 to 34 Minutes | 157 (10.2%) | 295 (33.8%) |
| 35 to 39 Minutes | 0 (0.0%) | 11 (1.3%) |
| 40 to 44 Minutes | 135 (8.8%) | 32 (3.7%) |
| 45 to 59 Minutes | 153 (10.0%) | 0 (0.0%) |
| 60 to 89 Minutes | 382 (24.9%) | 49 (5.6%) |
| 90 or more Minutes | 26 (1.7%) | 0 (0.0%) |
Time of Departure to Work by Sex in Tice
The most frequent times of departure to work in Tice are 6:00 AM to 6:29 AM (392, 25.6%) for males and 6:00 AM to 6:29 AM (182, 20.8%) for females.
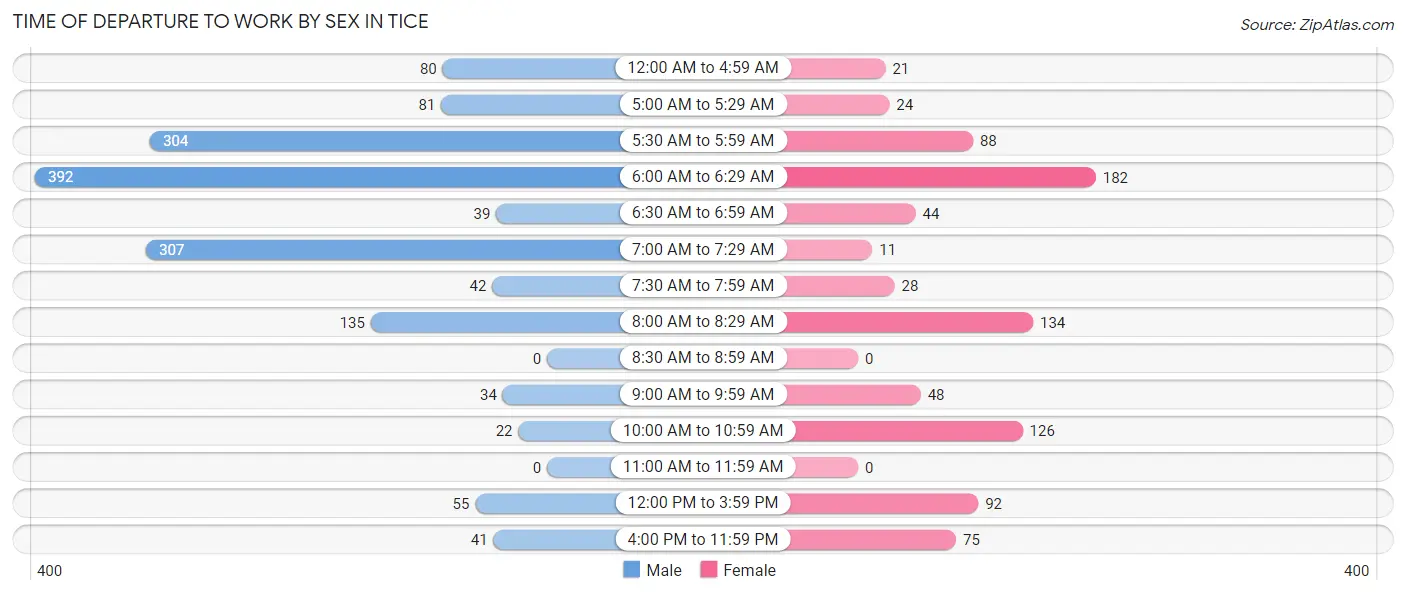
| Time of Departure | Male | Female |
| 12:00 AM to 4:59 AM | 80 (5.2%) | 21 (2.4%) |
| 5:00 AM to 5:29 AM | 81 (5.3%) | 24 (2.8%) |
| 5:30 AM to 5:59 AM | 304 (19.8%) | 88 (10.1%) |
| 6:00 AM to 6:29 AM | 392 (25.6%) | 182 (20.8%) |
| 6:30 AM to 6:59 AM | 39 (2.5%) | 44 (5.0%) |
| 7:00 AM to 7:29 AM | 307 (20.0%) | 11 (1.3%) |
| 7:30 AM to 7:59 AM | 42 (2.7%) | 28 (3.2%) |
| 8:00 AM to 8:29 AM | 135 (8.8%) | 134 (15.3%) |
| 8:30 AM to 8:59 AM | 0 (0.0%) | 0 (0.0%) |
| 9:00 AM to 9:59 AM | 34 (2.2%) | 48 (5.5%) |
| 10:00 AM to 10:59 AM | 22 (1.4%) | 126 (14.4%) |
| 11:00 AM to 11:59 AM | 0 (0.0%) | 0 (0.0%) |
| 12:00 PM to 3:59 PM | 55 (3.6%) | 92 (10.5%) |
| 4:00 PM to 11:59 PM | 41 (2.7%) | 75 (8.6%) |
| Total | 1,532 (100.0%) | 873 (100.0%) |
Housing Occupancy in Tice
Occupancy by Ownership in Tice
Of the total 1,587 dwellings in Tice, owner-occupied units account for 718 (45.2%), while renter-occupied units make up 869 (54.8%).
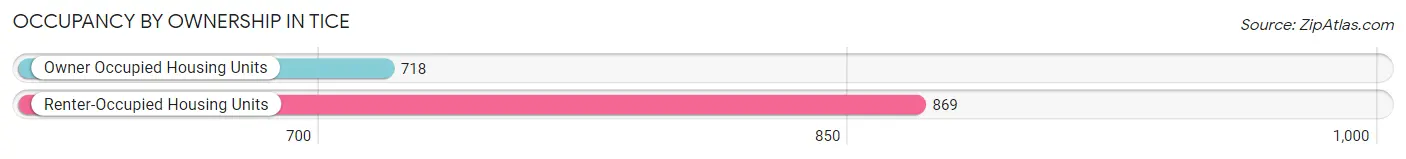
| Occupancy | # Housing Units | % Housing Units |
| Owner Occupied Housing Units | 718 | 45.2% |
| Renter-Occupied Housing Units | 869 | 54.8% |
| Total Occupied Housing Units | 1,587 | 100.0% |
Occupancy by Household Size in Tice
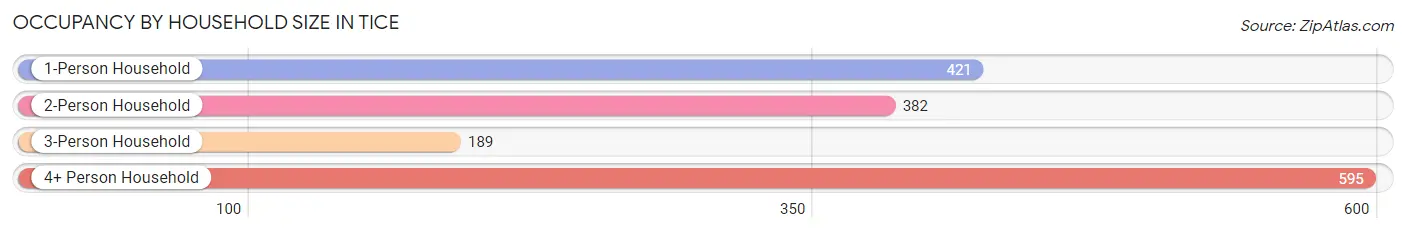
| Household Size | # Housing Units | % Housing Units |
| 1-Person Household | 421 | 26.5% |
| 2-Person Household | 382 | 24.1% |
| 3-Person Household | 189 | 11.9% |
| 4+ Person Household | 595 | 37.5% |
| Total Housing Units | 1,587 | 100.0% |
Occupancy by Ownership by Household Size in Tice
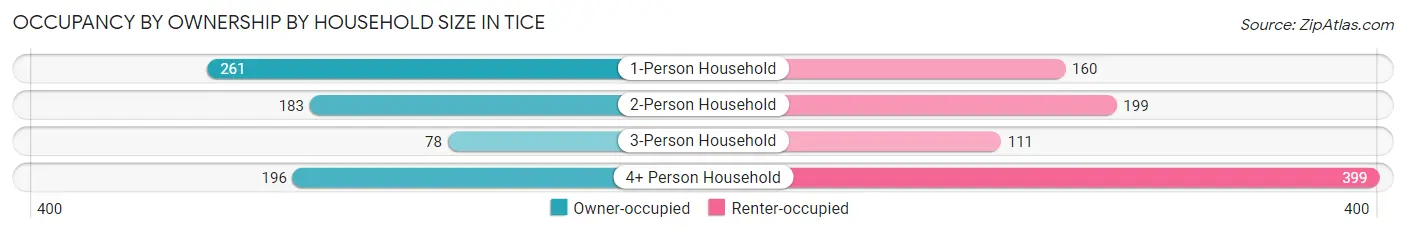
| Household Size | Owner-occupied | Renter-occupied |
| 1-Person Household | 261 (62.0%) | 160 (38.0%) |
| 2-Person Household | 183 (47.9%) | 199 (52.1%) |
| 3-Person Household | 78 (41.3%) | 111 (58.7%) |
| 4+ Person Household | 196 (32.9%) | 399 (67.1%) |
| Total Housing Units | 718 (45.2%) | 869 (54.8%) |
Occupancy by Educational Attainment in Tice
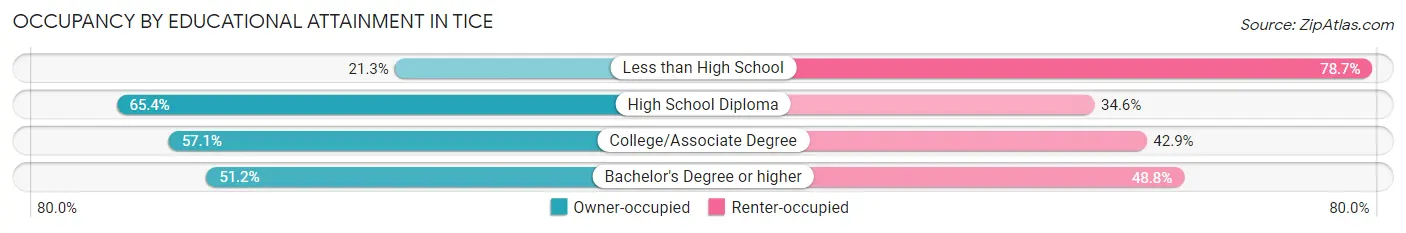
| Household Size | Owner-occupied | Renter-occupied |
| Less than High School | 137 (21.3%) | 506 (78.7%) |
| High School Diploma | 388 (65.4%) | 205 (34.6%) |
| College/Associate Degree | 128 (57.1%) | 96 (42.9%) |
| Bachelor's Degree or higher | 65 (51.2%) | 62 (48.8%) |
Occupancy by Age of Householder in Tice
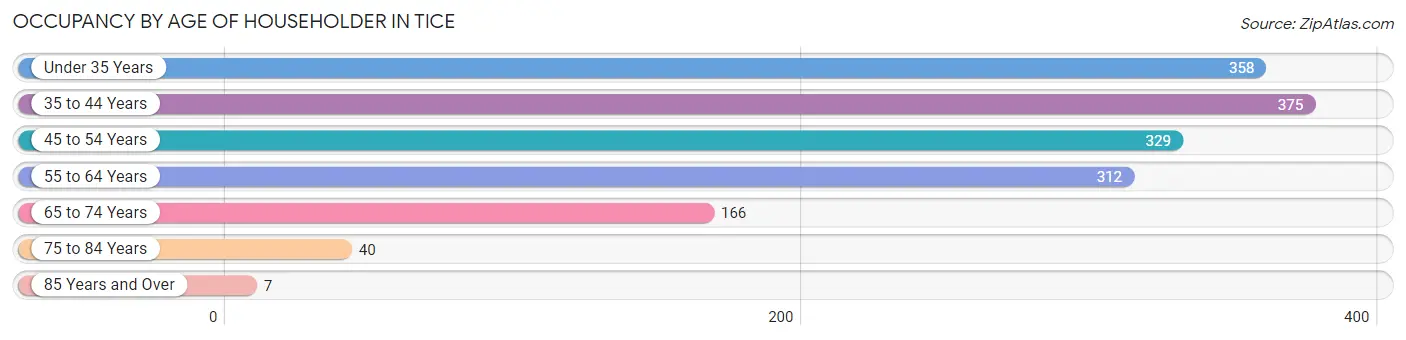
| Age Bracket | # Households | % Households |
| Under 35 Years | 358 | 22.6% |
| 35 to 44 Years | 375 | 23.6% |
| 45 to 54 Years | 329 | 20.7% |
| 55 to 64 Years | 312 | 19.7% |
| 65 to 74 Years | 166 | 10.5% |
| 75 to 84 Years | 40 | 2.5% |
| 85 Years and Over | 7 | 0.4% |
| Total | 1,587 | 100.0% |
Housing Finances in Tice
Median Income by Occupancy in Tice
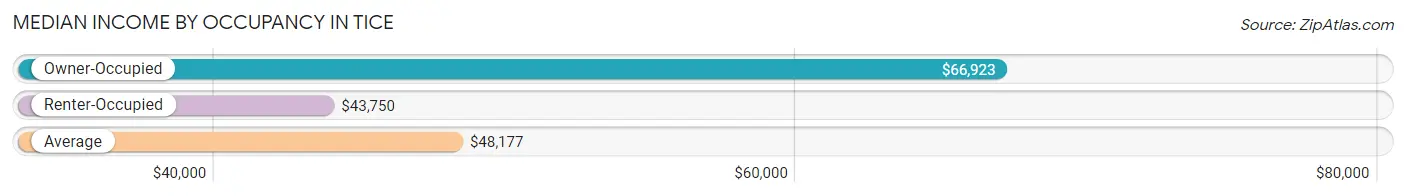
| Occupancy Type | # Households | Median Income |
| Owner-Occupied | 718 (45.2%) | $66,923 |
| Renter-Occupied | 869 (54.8%) | $43,750 |
| Average | 1,587 (100.0%) | $48,177 |
Occupancy by Householder Income Bracket in Tice
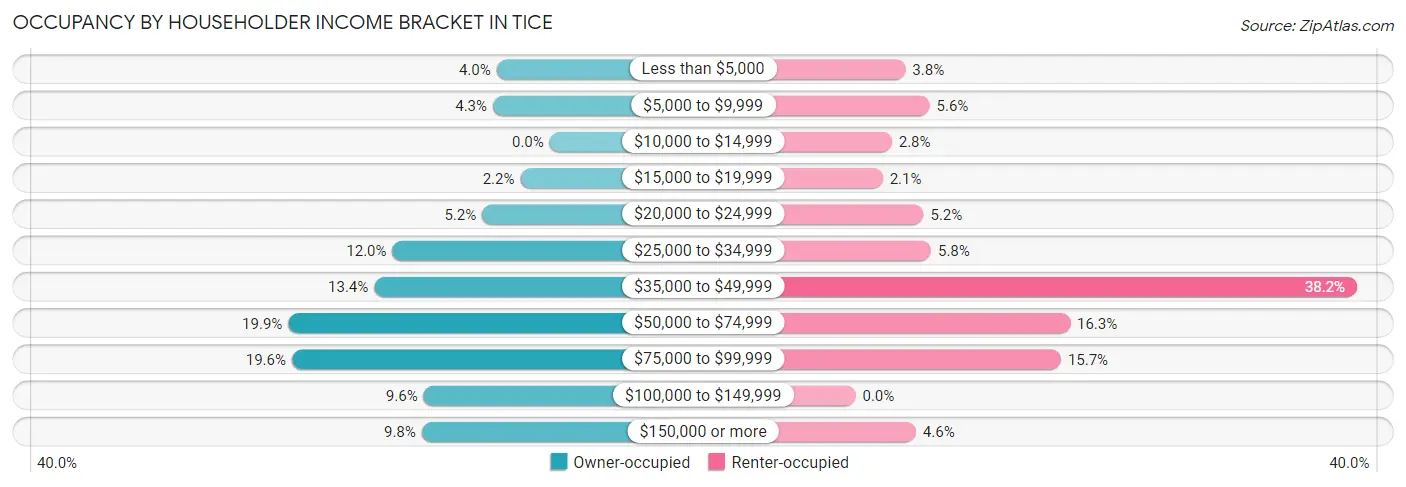
| Income Bracket | Owner-occupied | Renter-occupied |
| Less than $5,000 | 29 (4.0%) | 33 (3.8%) |
| $5,000 to $9,999 | 31 (4.3%) | 49 (5.6%) |
| $10,000 to $14,999 | 0 (0.0%) | 24 (2.8%) |
| $15,000 to $19,999 | 16 (2.2%) | 18 (2.1%) |
| $20,000 to $24,999 | 37 (5.1%) | 45 (5.2%) |
| $25,000 to $34,999 | 86 (12.0%) | 50 (5.8%) |
| $35,000 to $49,999 | 96 (13.4%) | 332 (38.2%) |
| $50,000 to $74,999 | 143 (19.9%) | 142 (16.3%) |
| $75,000 to $99,999 | 141 (19.6%) | 136 (15.7%) |
| $100,000 to $149,999 | 69 (9.6%) | 0 (0.0%) |
| $150,000 or more | 70 (9.8%) | 40 (4.6%) |
| Total | 718 (100.0%) | 869 (100.0%) |
Monthly Housing Cost Tiers in Tice
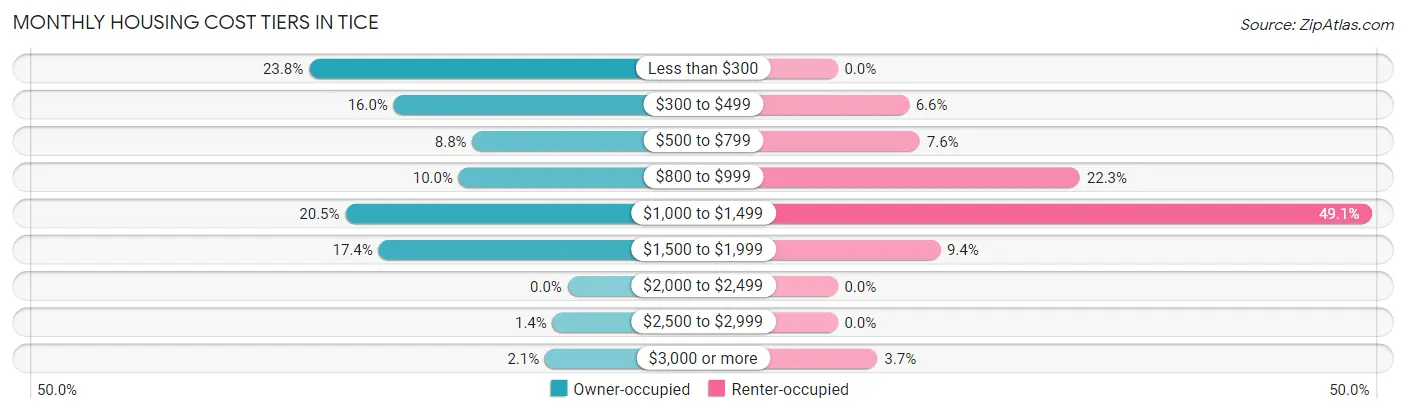
| Monthly Cost | Owner-occupied | Renter-occupied |
| Less than $300 | 171 (23.8%) | 0 (0.0%) |
| $300 to $499 | 115 (16.0%) | 57 (6.6%) |
| $500 to $799 | 63 (8.8%) | 66 (7.6%) |
| $800 to $999 | 72 (10.0%) | 194 (22.3%) |
| $1,000 to $1,499 | 147 (20.5%) | 427 (49.1%) |
| $1,500 to $1,999 | 125 (17.4%) | 82 (9.4%) |
| $2,000 to $2,499 | 0 (0.0%) | 0 (0.0%) |
| $2,500 to $2,999 | 10 (1.4%) | 0 (0.0%) |
| $3,000 or more | 15 (2.1%) | 32 (3.7%) |
| Total | 718 (100.0%) | 869 (100.0%) |
Physical Housing Characteristics in Tice
Housing Structures in Tice
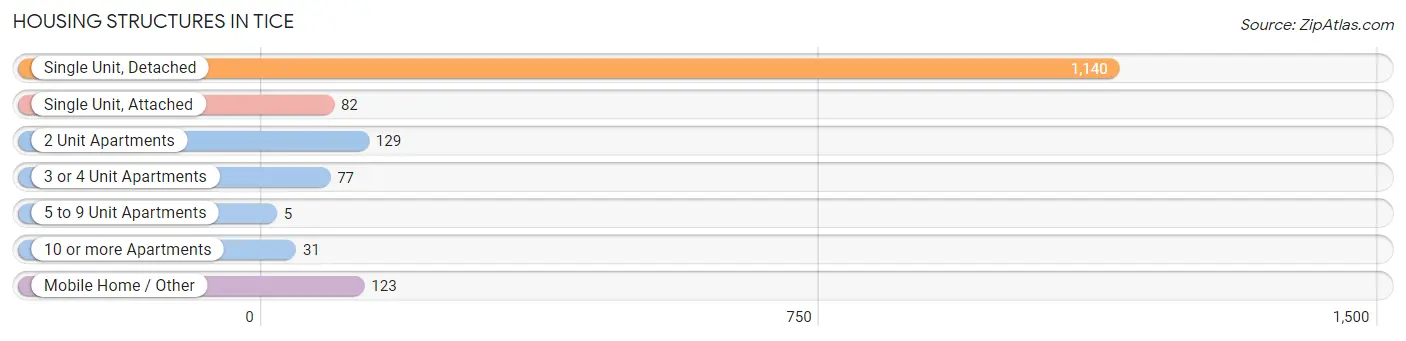
| Structure Type | # Housing Units | % Housing Units |
| Single Unit, Detached | 1,140 | 71.8% |
| Single Unit, Attached | 82 | 5.2% |
| 2 Unit Apartments | 129 | 8.1% |
| 3 or 4 Unit Apartments | 77 | 4.9% |
| 5 to 9 Unit Apartments | 5 | 0.3% |
| 10 or more Apartments | 31 | 1.9% |
| Mobile Home / Other | 123 | 7.7% |
| Total | 1,587 | 100.0% |
Housing Structures by Occupancy in Tice
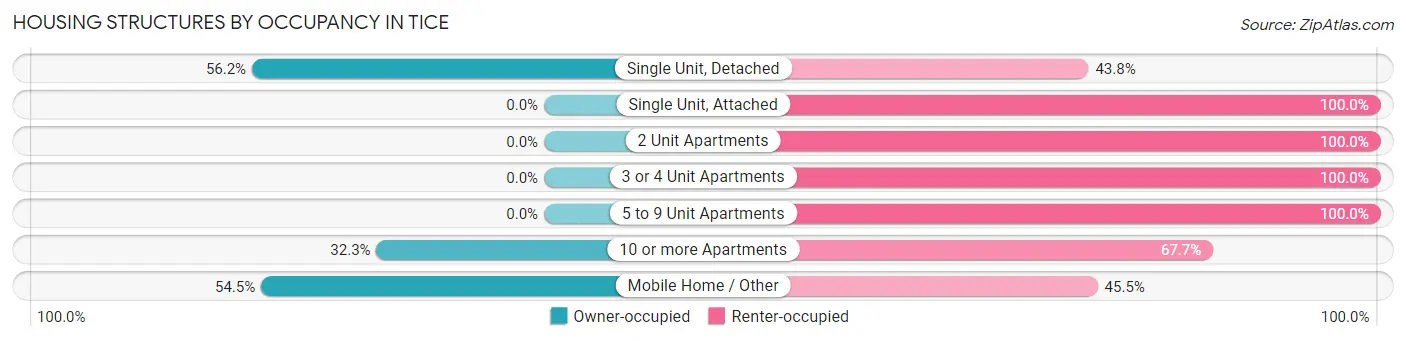
| Structure Type | Owner-occupied | Renter-occupied |
| Single Unit, Detached | 641 (56.2%) | 499 (43.8%) |
| Single Unit, Attached | 0 (0.0%) | 82 (100.0%) |
| 2 Unit Apartments | 0 (0.0%) | 129 (100.0%) |
| 3 or 4 Unit Apartments | 0 (0.0%) | 77 (100.0%) |
| 5 to 9 Unit Apartments | 0 (0.0%) | 5 (100.0%) |
| 10 or more Apartments | 10 (32.3%) | 21 (67.7%) |
| Mobile Home / Other | 67 (54.5%) | 56 (45.5%) |
| Total | 718 (45.2%) | 869 (54.8%) |
Housing Structures by Number of Rooms in Tice
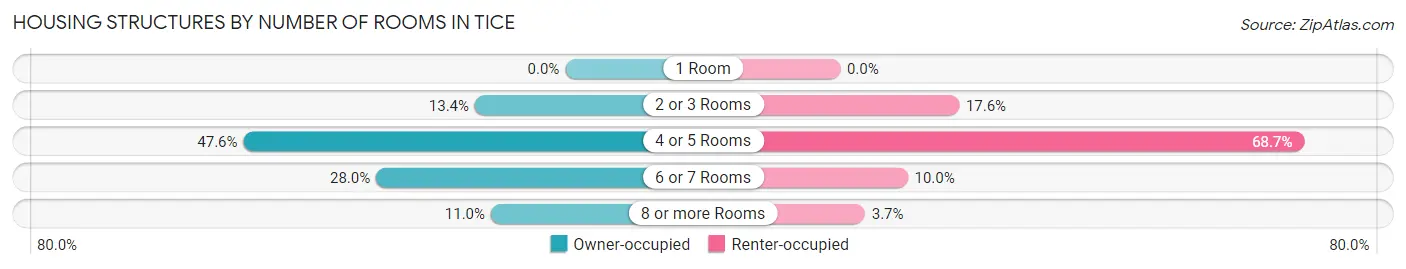
| Number of Rooms | Owner-occupied | Renter-occupied |
| 1 Room | 0 (0.0%) | 0 (0.0%) |
| 2 or 3 Rooms | 96 (13.4%) | 153 (17.6%) |
| 4 or 5 Rooms | 342 (47.6%) | 597 (68.7%) |
| 6 or 7 Rooms | 201 (28.0%) | 87 (10.0%) |
| 8 or more Rooms | 79 (11.0%) | 32 (3.7%) |
| Total | 718 (100.0%) | 869 (100.0%) |
Housing Structure by Heating Type in Tice
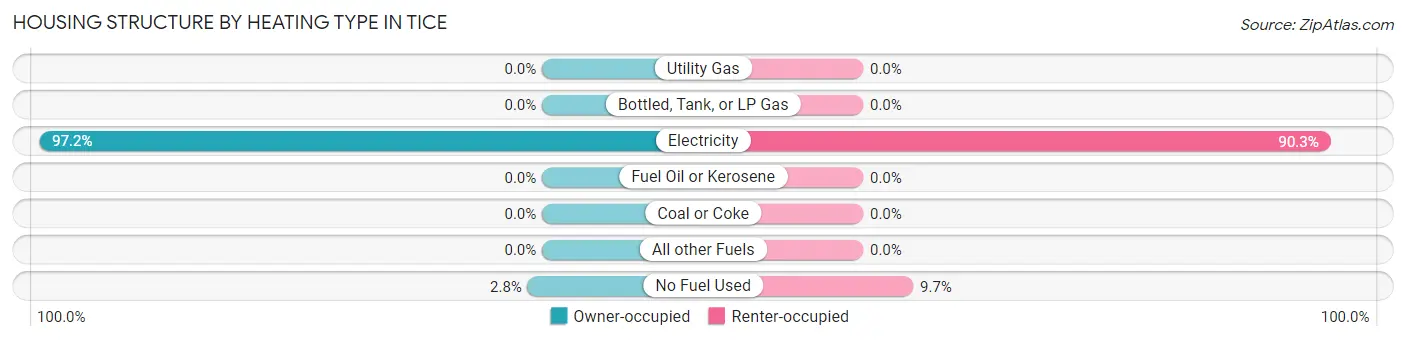
| Heating Type | Owner-occupied | Renter-occupied |
| Utility Gas | 0 (0.0%) | 0 (0.0%) |
| Bottled, Tank, or LP Gas | 0 (0.0%) | 0 (0.0%) |
| Electricity | 698 (97.2%) | 785 (90.3%) |
| Fuel Oil or Kerosene | 0 (0.0%) | 0 (0.0%) |
| Coal or Coke | 0 (0.0%) | 0 (0.0%) |
| All other Fuels | 0 (0.0%) | 0 (0.0%) |
| No Fuel Used | 20 (2.8%) | 84 (9.7%) |
| Total | 718 (100.0%) | 869 (100.0%) |
Household Vehicle Usage in Tice
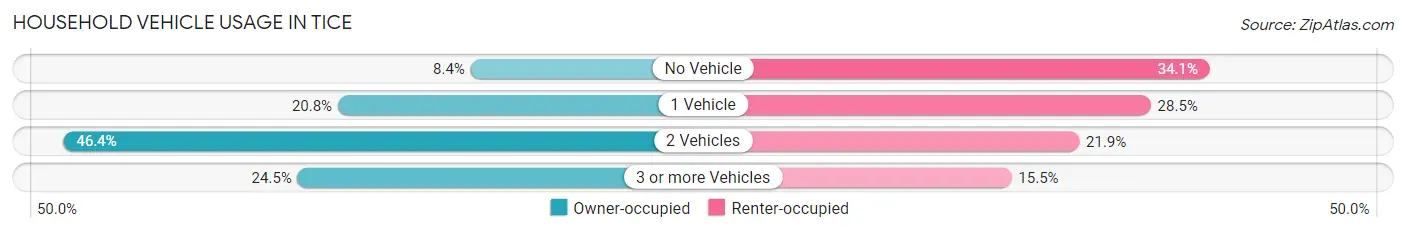
| Vehicles per Household | Owner-occupied | Renter-occupied |
| No Vehicle | 60 (8.4%) | 296 (34.1%) |
| 1 Vehicle | 149 (20.7%) | 248 (28.5%) |
| 2 Vehicles | 333 (46.4%) | 190 (21.9%) |
| 3 or more Vehicles | 176 (24.5%) | 135 (15.5%) |
| Total | 718 (100.0%) | 869 (100.0%) |
Real Estate & Mortgages in Tice
Real Estate and Mortgage Overview in Tice
| Characteristic | Without Mortgage | With Mortgage |
| Housing Units | 341 | 377 |
| Median Property Value | $131,900 | $193,700 |
| Median Household Income | - | - |
| Monthly Housing Costs | $300 | $15 |
| Real Estate Taxes | $999 | $7 |
Property Value by Mortgage Status in Tice
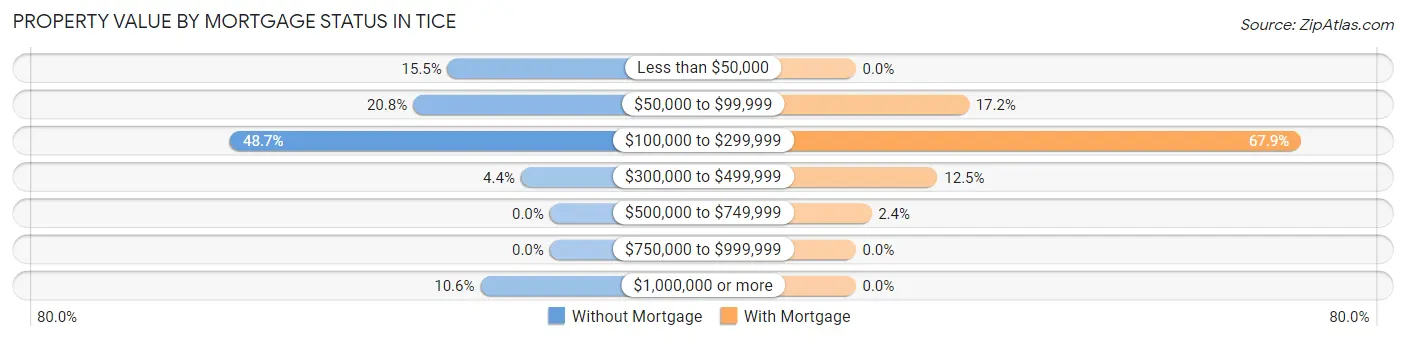
| Property Value | Without Mortgage | With Mortgage |
| Less than $50,000 | 53 (15.5%) | 0 (0.0%) |
| $50,000 to $99,999 | 71 (20.8%) | 65 (17.2%) |
| $100,000 to $299,999 | 166 (48.7%) | 256 (67.9%) |
| $300,000 to $499,999 | 15 (4.4%) | 47 (12.5%) |
| $500,000 to $749,999 | 0 (0.0%) | 9 (2.4%) |
| $750,000 to $999,999 | 0 (0.0%) | 0 (0.0%) |
| $1,000,000 or more | 36 (10.6%) | 0 (0.0%) |
| Total | 341 (100.0%) | 377 (100.0%) |
Household Income by Mortgage Status in Tice
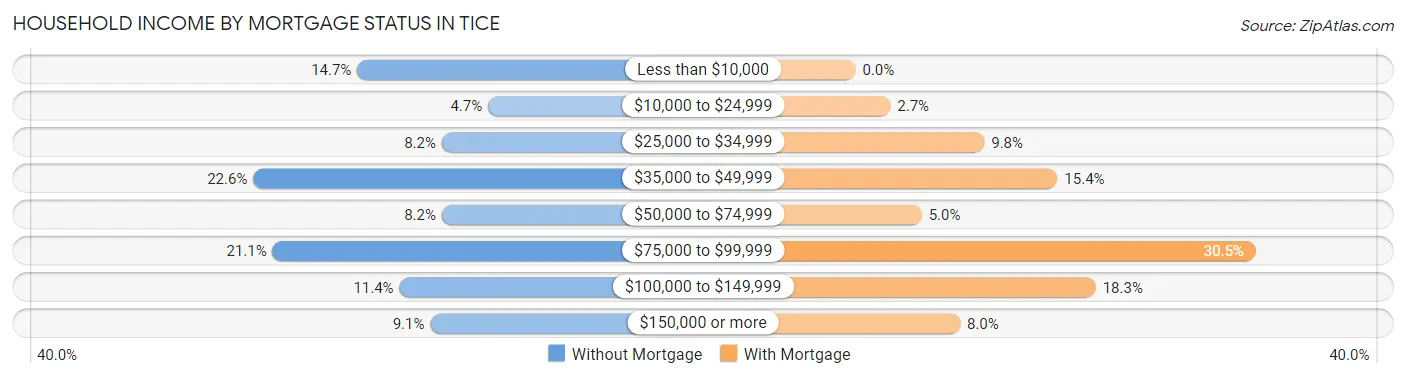
| Household Income | Without Mortgage | With Mortgage |
| Less than $10,000 | 50 (14.7%) | 0 (0.0%) |
| $10,000 to $24,999 | 16 (4.7%) | 10 (2.6%) |
| $25,000 to $34,999 | 28 (8.2%) | 37 (9.8%) |
| $35,000 to $49,999 | 77 (22.6%) | 58 (15.4%) |
| $50,000 to $74,999 | 28 (8.2%) | 19 (5.0%) |
| $75,000 to $99,999 | 72 (21.1%) | 115 (30.5%) |
| $100,000 to $149,999 | 39 (11.4%) | 69 (18.3%) |
| $150,000 or more | 31 (9.1%) | 30 (8.0%) |
| Total | 341 (100.0%) | 377 (100.0%) |
Property Value to Household Income Ratio in Tice
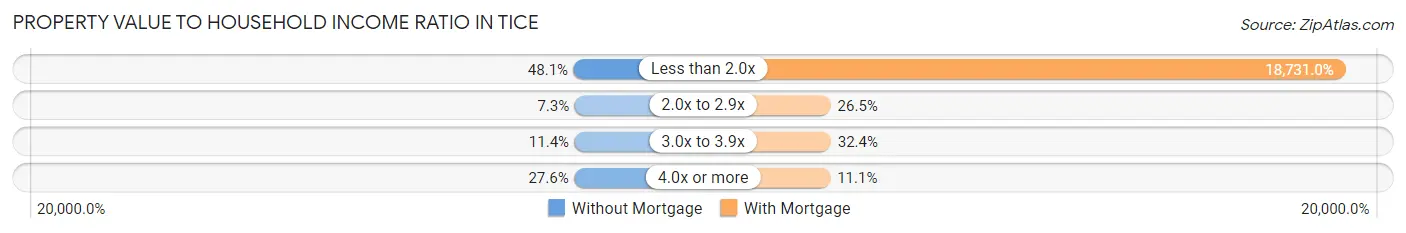
| Value-to-Income Ratio | Without Mortgage | With Mortgage |
| Less than 2.0x | 164 (48.1%) | 70,616 (18,731.0%) |
| 2.0x to 2.9x | 25 (7.3%) | 100 (26.5%) |
| 3.0x to 3.9x | 39 (11.4%) | 122 (32.4%) |
| 4.0x or more | 94 (27.6%) | 42 (11.1%) |
| Total | 341 (100.0%) | 377 (100.0%) |
Real Estate Taxes by Mortgage Status in Tice
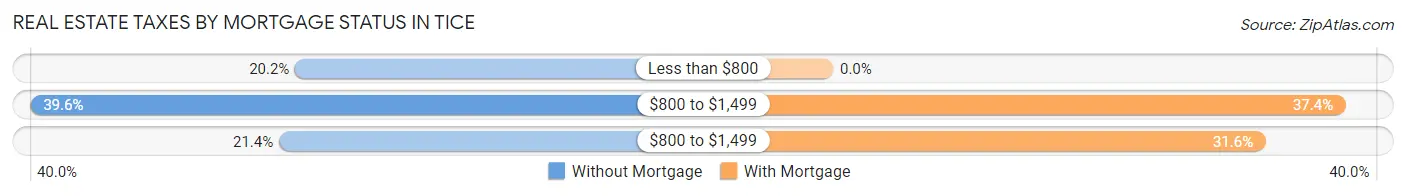
| Property Taxes | Without Mortgage | With Mortgage |
| Less than $800 | 69 (20.2%) | 0 (0.0%) |
| $800 to $1,499 | 135 (39.6%) | 141 (37.4%) |
| $800 to $1,499 | 73 (21.4%) | 119 (31.6%) |
| Total | 341 (100.0%) | 377 (100.0%) |
Health & Disability in Tice
Health Insurance Coverage by Age in Tice
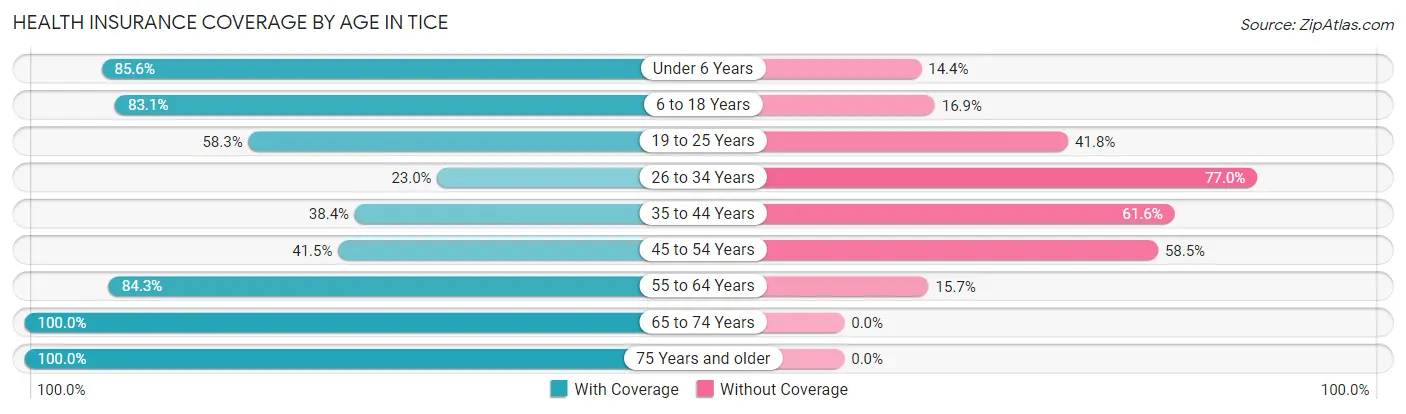
| Age Bracket | With Coverage | Without Coverage |
| Under 6 Years | 346 (85.6%) | 58 (14.4%) |
| 6 to 18 Years | 1,054 (83.1%) | 214 (16.9%) |
| 19 to 25 Years | 360 (58.3%) | 258 (41.7%) |
| 26 to 34 Years | 153 (23.0%) | 512 (77.0%) |
| 35 to 44 Years | 384 (38.4%) | 616 (61.6%) |
| 45 to 54 Years | 286 (41.5%) | 403 (58.5%) |
| 55 to 64 Years | 359 (84.3%) | 67 (15.7%) |
| 65 to 74 Years | 226 (100.0%) | 0 (0.0%) |
| 75 Years and older | 172 (100.0%) | 0 (0.0%) |
| Total | 3,340 (61.1%) | 2,128 (38.9%) |
Health Insurance Coverage by Citizenship Status in Tice
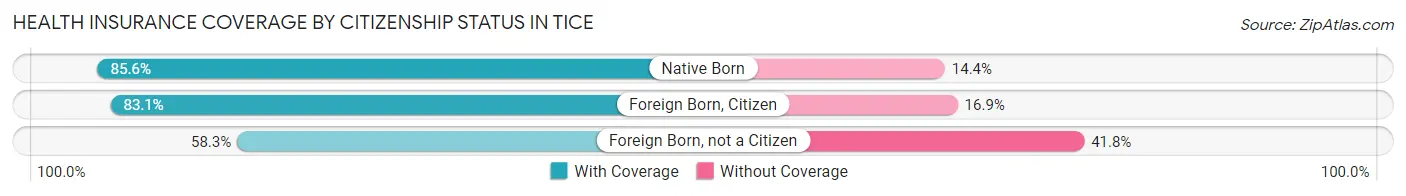
| Citizenship Status | With Coverage | Without Coverage |
| Native Born | 346 (85.6%) | 58 (14.4%) |
| Foreign Born, Citizen | 1,054 (83.1%) | 214 (16.9%) |
| Foreign Born, not a Citizen | 360 (58.3%) | 258 (41.7%) |
Health Insurance Coverage by Household Income in Tice
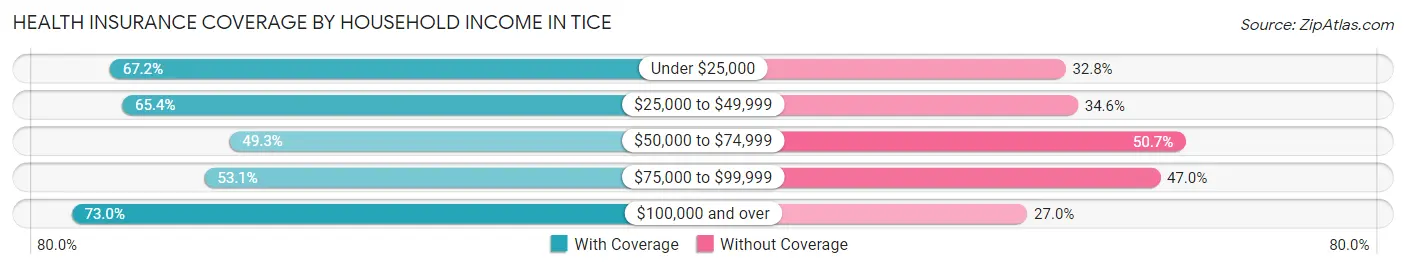
| Household Income | With Coverage | Without Coverage |
| Under $25,000 | 476 (67.2%) | 232 (32.8%) |
| $25,000 to $49,999 | 1,050 (65.4%) | 556 (34.6%) |
| $50,000 to $74,999 | 494 (49.3%) | 508 (50.7%) |
| $75,000 to $99,999 | 696 (53.0%) | 616 (46.9%) |
| $100,000 and over | 583 (73.0%) | 216 (27.0%) |
Public vs Private Health Insurance Coverage by Age in Tice
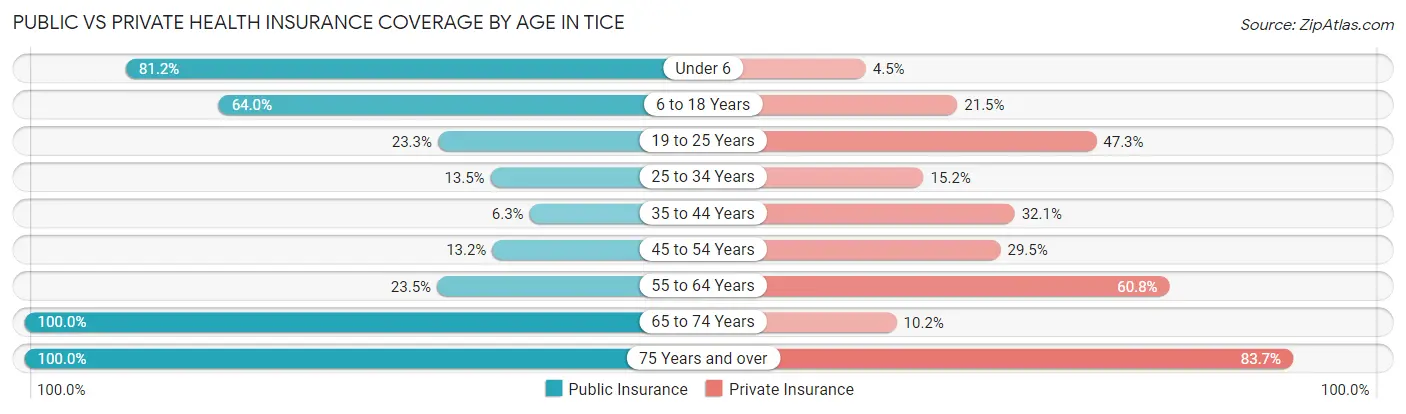
| Age Bracket | Public Insurance | Private Insurance |
| Under 6 | 328 (81.2%) | 18 (4.5%) |
| 6 to 18 Years | 811 (64.0%) | 272 (21.4%) |
| 19 to 25 Years | 144 (23.3%) | 292 (47.2%) |
| 25 to 34 Years | 90 (13.5%) | 101 (15.2%) |
| 35 to 44 Years | 63 (6.3%) | 321 (32.1%) |
| 45 to 54 Years | 91 (13.2%) | 203 (29.5%) |
| 55 to 64 Years | 100 (23.5%) | 259 (60.8%) |
| 65 to 74 Years | 226 (100.0%) | 23 (10.2%) |
| 75 Years and over | 172 (100.0%) | 144 (83.7%) |
| Total | 2,025 (37.0%) | 1,633 (29.9%) |
Disability Status by Sex by Age in Tice
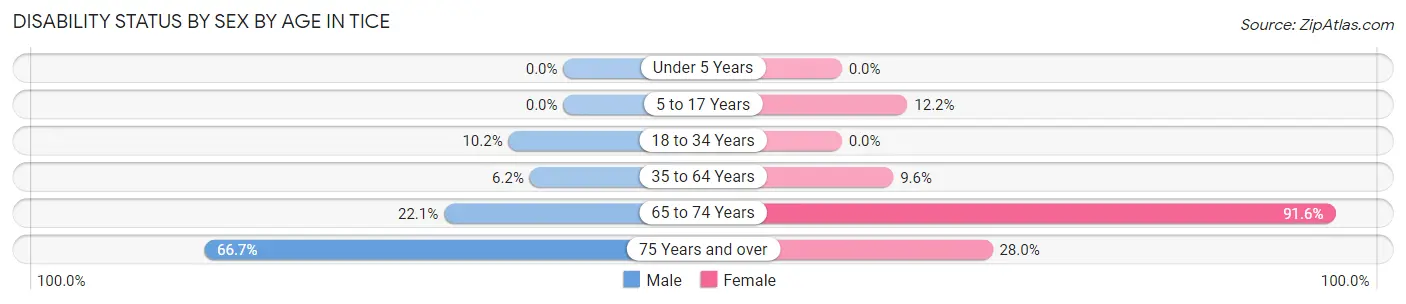
| Age Bracket | Male | Female |
| Under 5 Years | 0 (0.0%) | 0 (0.0%) |
| 5 to 17 Years | 0 (0.0%) | 69 (12.2%) |
| 18 to 34 Years | 84 (10.2%) | 0 (0.0%) |
| 35 to 64 Years | 79 (6.2%) | 81 (9.6%) |
| 65 to 74 Years | 29 (22.1%) | 87 (91.6%) |
| 75 Years and over | 36 (66.7%) | 33 (28.0%) |
Disability Class by Sex by Age in Tice
Disability Class: Hearing Difficulty
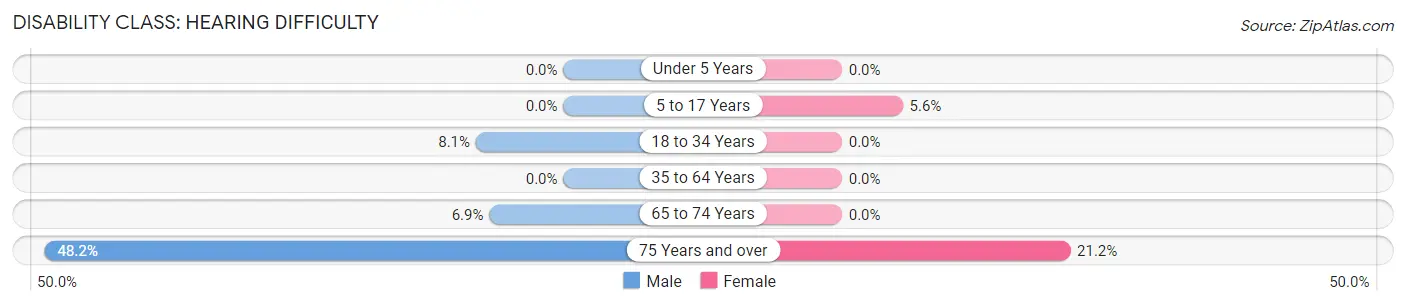
| Age Bracket | Male | Female |
| Under 5 Years | 0 (0.0%) | 0 (0.0%) |
| 5 to 17 Years | 0 (0.0%) | 32 (5.6%) |
| 18 to 34 Years | 67 (8.1%) | 0 (0.0%) |
| 35 to 64 Years | 0 (0.0%) | 0 (0.0%) |
| 65 to 74 Years | 9 (6.9%) | 0 (0.0%) |
| 75 Years and over | 26 (48.1%) | 25 (21.2%) |
Disability Class: Vision Difficulty
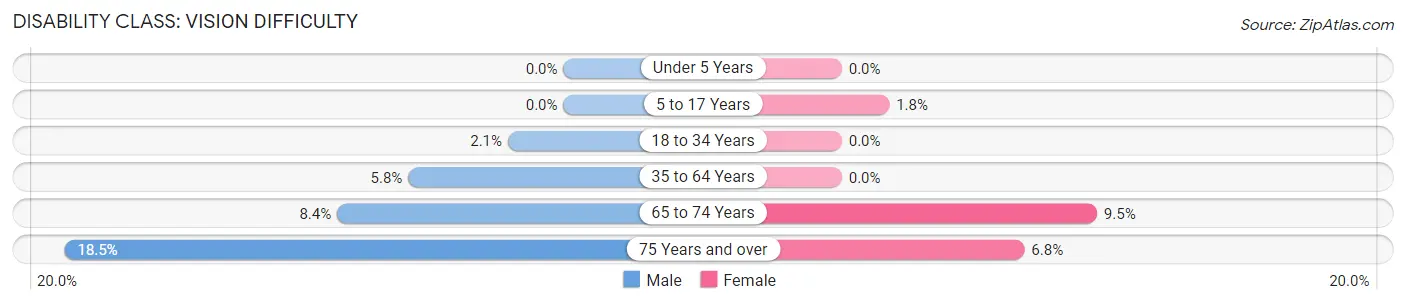
| Age Bracket | Male | Female |
| Under 5 Years | 0 (0.0%) | 0 (0.0%) |
| 5 to 17 Years | 0 (0.0%) | 10 (1.8%) |
| 18 to 34 Years | 17 (2.1%) | 0 (0.0%) |
| 35 to 64 Years | 73 (5.8%) | 0 (0.0%) |
| 65 to 74 Years | 11 (8.4%) | 9 (9.5%) |
| 75 Years and over | 10 (18.5%) | 8 (6.8%) |
Disability Class: Cognitive Difficulty
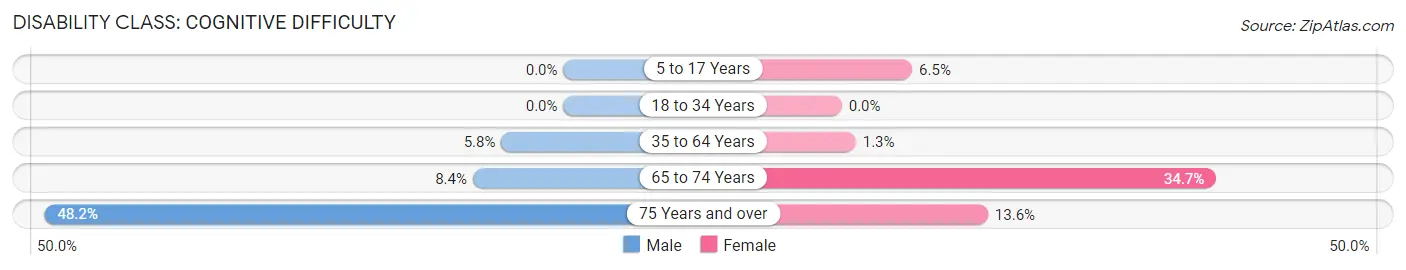
| Age Bracket | Male | Female |
| 5 to 17 Years | 0 (0.0%) | 37 (6.5%) |
| 18 to 34 Years | 0 (0.0%) | 0 (0.0%) |
| 35 to 64 Years | 73 (5.8%) | 11 (1.3%) |
| 65 to 74 Years | 11 (8.4%) | 33 (34.7%) |
| 75 Years and over | 26 (48.1%) | 16 (13.6%) |
Disability Class: Ambulatory Difficulty
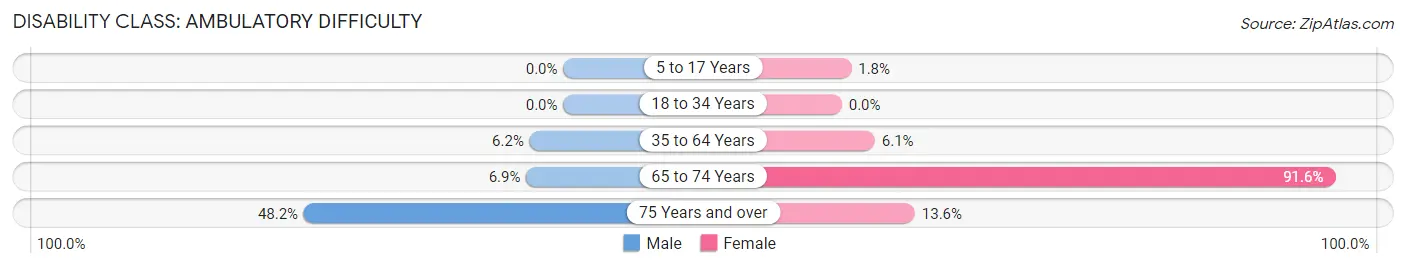
| Age Bracket | Male | Female |
| 5 to 17 Years | 0 (0.0%) | 10 (1.8%) |
| 18 to 34 Years | 0 (0.0%) | 0 (0.0%) |
| 35 to 64 Years | 79 (6.2%) | 52 (6.1%) |
| 65 to 74 Years | 9 (6.9%) | 87 (91.6%) |
| 75 Years and over | 26 (48.1%) | 16 (13.6%) |
Disability Class: Self-Care Difficulty

| Age Bracket | Male | Female |
| 5 to 17 Years | 0 (0.0%) | 10 (1.8%) |
| 18 to 34 Years | 0 (0.0%) | 0 (0.0%) |
| 35 to 64 Years | 73 (5.8%) | 53 (6.2%) |
| 65 to 74 Years | 11 (8.4%) | 33 (34.7%) |
| 75 Years and over | 26 (48.1%) | 16 (13.6%) |
Technology Access in Tice
Computing Device Access in Tice
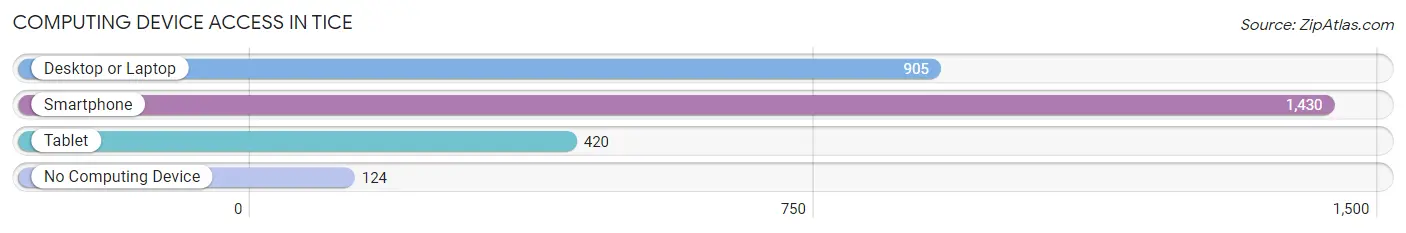
| Device Type | # Households | % Households |
| Desktop or Laptop | 905 | 57.0% |
| Smartphone | 1,430 | 90.1% |
| Tablet | 420 | 26.5% |
| No Computing Device | 124 | 7.8% |
| Total | 1,587 | 100.0% |
Internet Access in Tice
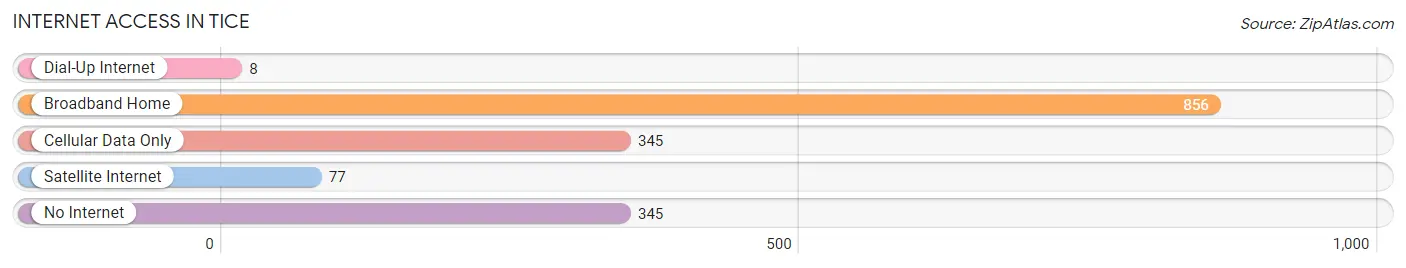
| Internet Type | # Households | % Households |
| Dial-Up Internet | 8 | 0.5% |
| Broadband Home | 856 | 53.9% |
| Cellular Data Only | 345 | 21.7% |
| Satellite Internet | 77 | 4.9% |
| No Internet | 345 | 21.7% |
| Total | 1,587 | 100.0% |
Tice Summary
Tice is an unincorporated community located in Lee County, Florida, United States. It is situated on the northern edge of the Caloosahatchee River, approximately 10 miles east of Fort Myers. The community is part of the Cape Coral-Fort Myers Metropolitan Statistical Area.
Geography
Tice is located at 26°37'45" North, 81°45'45" West (26.629167, -81.762500). The elevation is 8 feet (2.4 m).
Tice is located in the northern part of Lee County, Florida, approximately 10 miles east of Fort Myers. It is situated on the northern edge of the Caloosahatchee River, which forms the border between Lee and Hendry counties. The community is part of the Cape Coral-Fort Myers Metropolitan Statistical Area.
The area is mostly flat, with some low hills and ridges. The soil is sandy and well-drained. The climate is subtropical, with hot, humid summers and mild winters.
Economy
Tice is a rural community with a small population. The economy is largely based on agriculture, with citrus and vegetables being the main crops. There are also some small businesses in the area, including a few restaurants, a gas station, and a few convenience stores.
Demographics
As of the 2010 census, the population of Tice was 1,845. The racial makeup of the community was 94.3% White, 2.2% African American, 0.3% Native American, 0.7% Asian, 0.1% Pacific Islander, 1.2% from other races, and 1.3% from two or more races. Hispanic or Latino of any race were 4.2% of the population.
The median household income in Tice was $41,944, and the median family income was $45,938. The per capita income was $19,945. About 11.3% of families and 13.2% of the population were below the poverty line, including 17.2% of those under age 18 and 8.2% of those age 65 or over.
Conclusion
Tice is a small, rural community located in Lee County, Florida. It is situated on the northern edge of the Caloosahatchee River, approximately 10 miles east of Fort Myers. The economy is largely based on agriculture, with citrus and vegetables being the main crops. The population of Tice was 1,845 as of the 2010 census, with a median household income of $41,944. The area is mostly flat, with some low hills and ridges, and the climate is subtropical.
Common Questions
What is Per Capita Income in Tice?
Per Capita income in Tice is $24,154.
What is the Median Family Income in Tice?
Median Family Income in Tice is $45,727.
What is the Median Household income in Tice?
Median Household Income in Tice is $48,177.
What is Income or Wage Gap in Tice?
Income or Wage Gap in Tice is 26.4%.
Women in Tice earn 73.6 cents for every dollar earned by a man.
What is Inequality or Gini Index in Tice?
Inequality or Gini Index in Tice is 0.45.
What is the Total Population of Tice?
Total Population of Tice is 5,468.
What is the Total Male Population of Tice?
Total Male Population of Tice is 3,038.
What is the Total Female Population of Tice?
Total Female Population of Tice is 2,430.
What is the Ratio of Males per 100 Females in Tice?
There are 125.02 Males per 100 Females in Tice.
What is the Ratio of Females per 100 Males in Tice?
There are 79.99 Females per 100 Males in Tice.
What is the Median Population Age in Tice?
Median Population Age in Tice is 31.5 Years.
What is the Average Family Size in Tice
Average Family Size in Tice is 4.0 People.
What is the Average Household Size in Tice
Average Household Size in Tice is 3.4 People.
How Large is the Labor Force in Tice?
There are 2,687 People in the Labor Forcein in Tice.
What is the Percentage of People in the Labor Force in Tice?
66.4% of People are in the Labor Force in Tice.
What is the Unemployment Rate in Tice?
Unemployment Rate in Tice is 1.4%.