Frankford, DE Map & Demographics
Frankford Map
Frankford Overview
$29,879
PER CAPITA INCOME
$85,481
AVG FAMILY INCOME
$72,841
AVG HOUSEHOLD INCOME
0.43
INEQUALITY / GINI INDEX
842
TOTAL POPULATION
408
MALE POPULATION
434
FEMALE POPULATION
94.01
MALES / 100 FEMALES
106.37
FEMALES / 100 MALES
35.1
MEDIAN AGE
3.8
AVG FAMILY SIZE
3.4
AVG HOUSEHOLD SIZE
477
LABOR FORCE [ PEOPLE ]
78.3%
PERCENT IN LABOR FORCE
0.8%
UNEMPLOYMENT RATE
Frankford Zip Codes
Frankford Area Codes
Income in Frankford
Income Overview in Frankford
Per Capita Income in Frankford is $29,879, while median incomes of families and households are $85,481 and $72,841 respectively.
| Characteristic | Number | Measure |
| Per Capita Income | 842 | $29,879 |
| Median Family Income | 193 | $85,481 |
| Mean Family Income | 193 | $97,807 |
| Median Household Income | 245 | $72,841 |
| Mean Household Income | 245 | $90,470 |
| Income Deficit | 193 | $0 |
| Wage / Income Gap (%) | 842 | 0.00% |
| Wage / Income Gap ($) | 842 | 100.00¢ per $1 |
| Gini / Inequality Index | 842 | 0.43 |
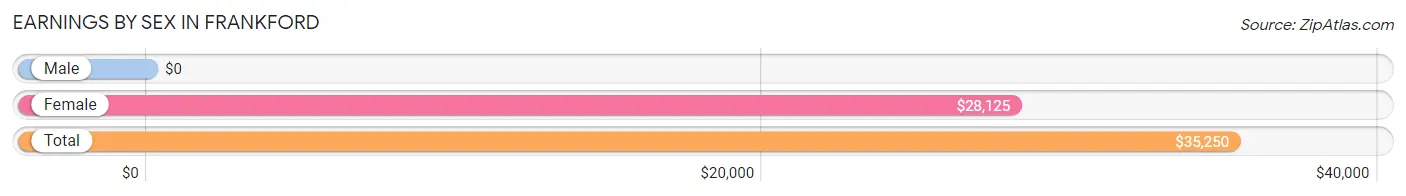
Earnings by Sex in Frankford
| Sex | Number | Average Earnings |
| Male | 274 (56.7%) | $0 |
| Female | 209 (43.3%) | $28,125 |
| Total | 483 (100.0%) | $35,250 |
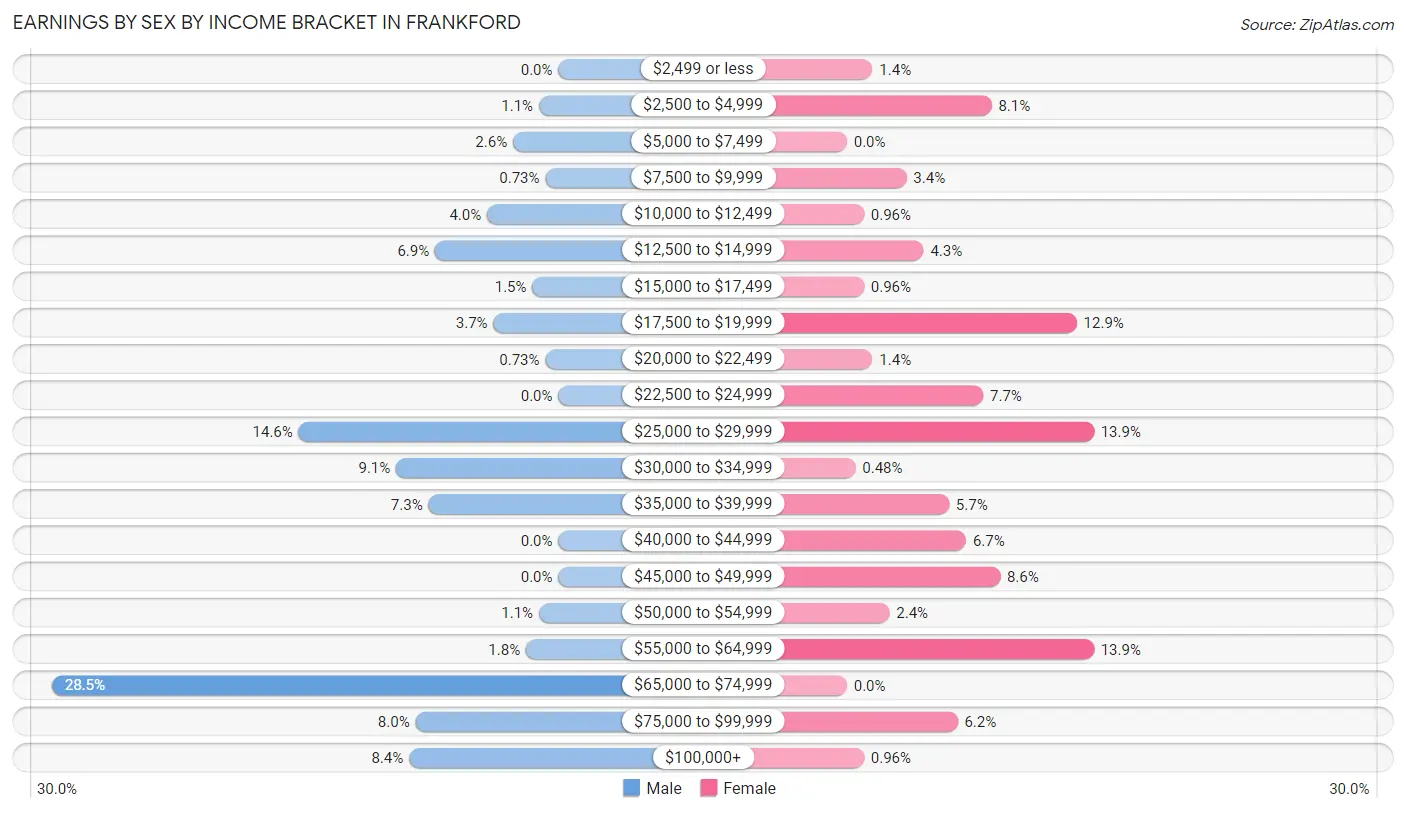
Earnings by Sex by Income Bracket in Frankford
The most common earnings brackets in Frankford are $65,000 to $74,999 for men (78 | 28.5%) and $25,000 to $29,999 for women (29 | 13.9%).
| Income | Male | Female |
| $2,499 or less | 0 (0.0%) | 3 (1.4%) |
| $2,500 to $4,999 | 3 (1.1%) | 17 (8.1%) |
| $5,000 to $7,499 | 7 (2.5%) | 0 (0.0%) |
| $7,500 to $9,999 | 2 (0.7%) | 7 (3.4%) |
| $10,000 to $12,499 | 11 (4.0%) | 2 (1.0%) |
| $12,500 to $14,999 | 19 (6.9%) | 9 (4.3%) |
| $15,000 to $17,499 | 4 (1.5%) | 2 (1.0%) |
| $17,500 to $19,999 | 10 (3.6%) | 27 (12.9%) |
| $20,000 to $22,499 | 2 (0.7%) | 3 (1.4%) |
| $22,500 to $24,999 | 0 (0.0%) | 16 (7.7%) |
| $25,000 to $29,999 | 40 (14.6%) | 29 (13.9%) |
| $30,000 to $34,999 | 25 (9.1%) | 1 (0.5%) |
| $35,000 to $39,999 | 20 (7.3%) | 12 (5.7%) |
| $40,000 to $44,999 | 0 (0.0%) | 14 (6.7%) |
| $45,000 to $49,999 | 0 (0.0%) | 18 (8.6%) |
| $50,000 to $54,999 | 3 (1.1%) | 5 (2.4%) |
| $55,000 to $64,999 | 5 (1.8%) | 29 (13.9%) |
| $65,000 to $74,999 | 78 (28.5%) | 0 (0.0%) |
| $75,000 to $99,999 | 22 (8.0%) | 13 (6.2%) |
| $100,000+ | 23 (8.4%) | 2 (1.0%) |
| Total | 274 (100.0%) | 209 (100.0%) |
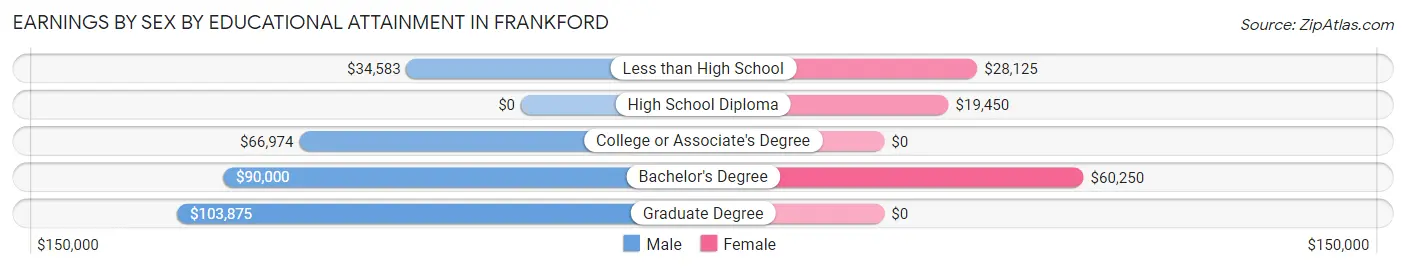
Earnings by Sex by Educational Attainment in Frankford
Average earnings in Frankford are $58,750 for men and $29,732 for women, a difference of 49.4%. Men with an educational attainment of graduate degree enjoy the highest average annual earnings of $103,875, while those with less than high school education earn the least with $34,583. Women with an educational attainment of bachelor's degree earn the most with the average annual earnings of $60,250, while those with high school diploma education have the smallest earnings of $19,450.
| Educational Attainment | Male Income | Female Income |
| Less than High School | $34,583 | $28,125 |
| High School Diploma | - | - |
| College or Associate's Degree | $66,974 | $0 |
| Bachelor's Degree | $90,000 | $60,250 |
| Graduate Degree | $103,875 | $0 |
| Total | $58,750 | $29,732 |
Family Income in Frankford
Family Income Brackets in Frankford
According to the Frankford family income data, there are 45 families falling into the $50,000 to $74,999 income range, which is the most common income bracket and makes up 23.3% of all families.
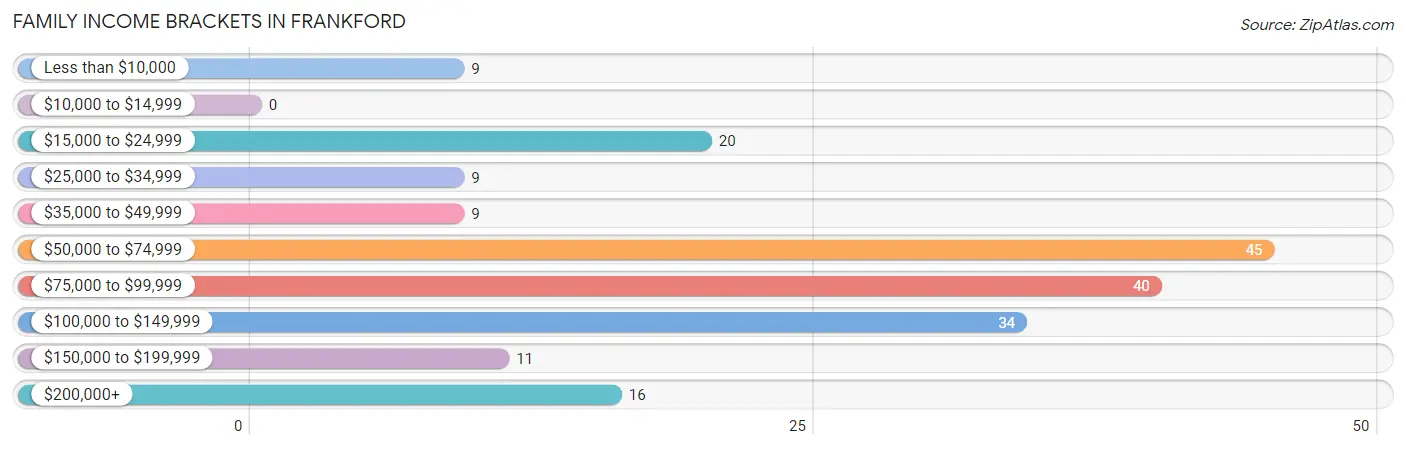
| Income Bracket | # Families | % Families |
| Less than $10,000 | 9 | 4.7% |
| $10,000 to $14,999 | 0 | 0.0% |
| $15,000 to $24,999 | 20 | 10.4% |
| $25,000 to $34,999 | 9 | 4.7% |
| $35,000 to $49,999 | 9 | 4.7% |
| $50,000 to $74,999 | 45 | 23.3% |
| $75,000 to $99,999 | 40 | 20.7% |
| $100,000 to $149,999 | 34 | 17.6% |
| $150,000 to $199,999 | 11 | 5.7% |
| $200,000+ | 16 | 8.3% |
Family Income by Famaliy Size in Frankford
5-person families (11 | 5.7%) account for the highest median family income in Frankford with $126,250 per family, while 3-person families (71 | 36.8%) have the highest median income of $41,771 per family member.
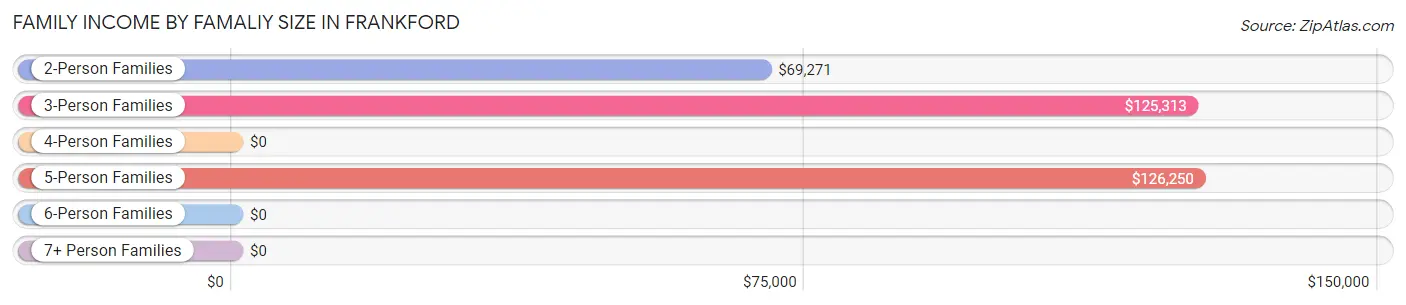
| Income Bracket | # Families | Median Income |
| 2-Person Families | 69 (35.7%) | $69,271 |
| 3-Person Families | 71 (36.8%) | $125,313 |
| 4-Person Families | 22 (11.4%) | $0 |
| 5-Person Families | 11 (5.7%) | $126,250 |
| 6-Person Families | 11 (5.7%) | $0 |
| 7+ Person Families | 9 (4.7%) | $0 |
| Total | 193 (100.0%) | $85,481 |
Family Income by Number of Earners in Frankford
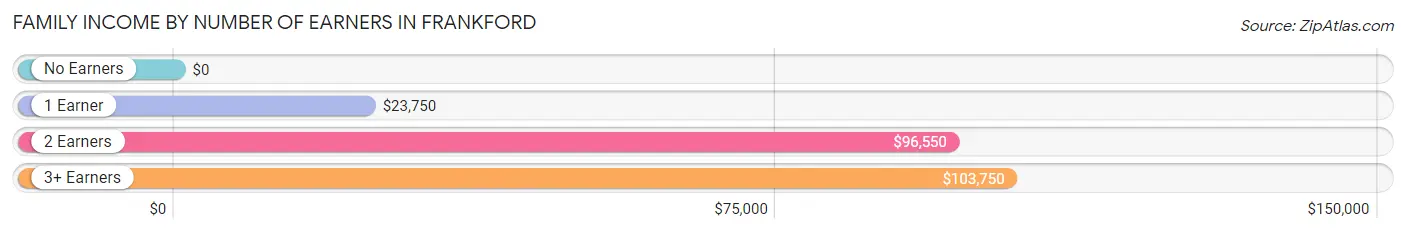
| Number of Earners | # Families | Median Income |
| No Earners | 33 (17.1%) | $0 |
| 1 Earner | 19 (9.8%) | $23,750 |
| 2 Earners | 97 (50.3%) | $96,550 |
| 3+ Earners | 44 (22.8%) | $103,750 |
| Total | 193 (100.0%) | $85,481 |
Household Income in Frankford
Household Income Brackets in Frankford
With 46 households falling in the category, the $50,000 to $74,999 income range is the most frequent in Frankford, accounting for 18.8% of all households.
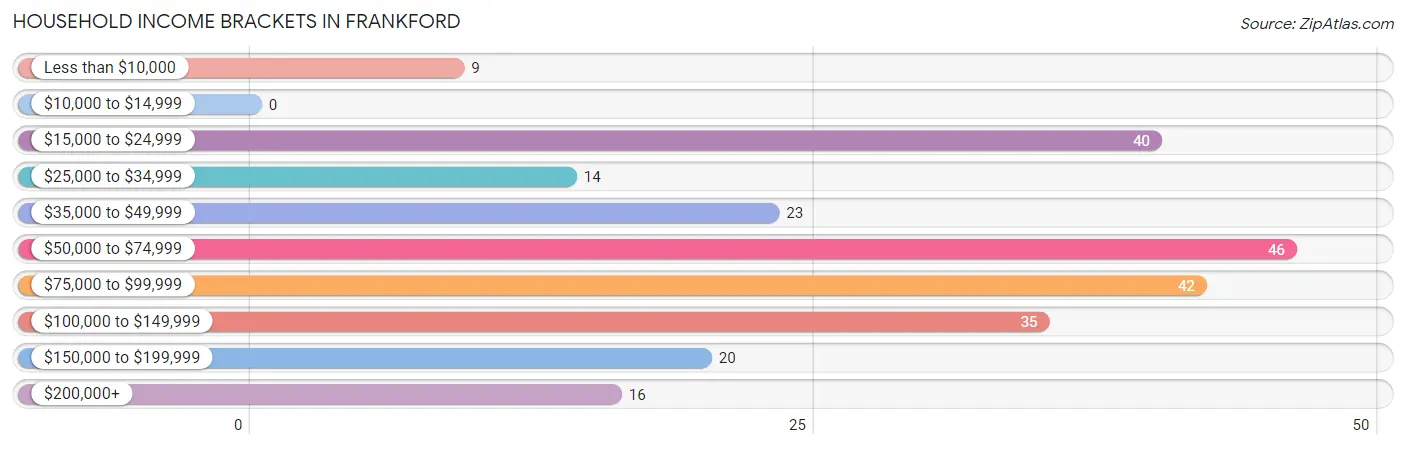
| Income Bracket | # Households | % Households |
| Less than $10,000 | 9 | 3.7% |
| $10,000 to $14,999 | 0 | 0.0% |
| $15,000 to $24,999 | 40 | 16.3% |
| $25,000 to $34,999 | 14 | 5.7% |
| $35,000 to $49,999 | 23 | 9.4% |
| $50,000 to $74,999 | 46 | 18.8% |
| $75,000 to $99,999 | 42 | 17.1% |
| $100,000 to $149,999 | 35 | 14.3% |
| $150,000 to $199,999 | 20 | 8.2% |
| $200,000+ | 16 | 6.5% |
Household Income by Householder Age in Frankford
The median household income in Frankford is $72,841, with the highest median household income of $94,063 found in the 45 to 64 years age bracket for the primary householder. A total of 70 households (28.6%) fall into this category.
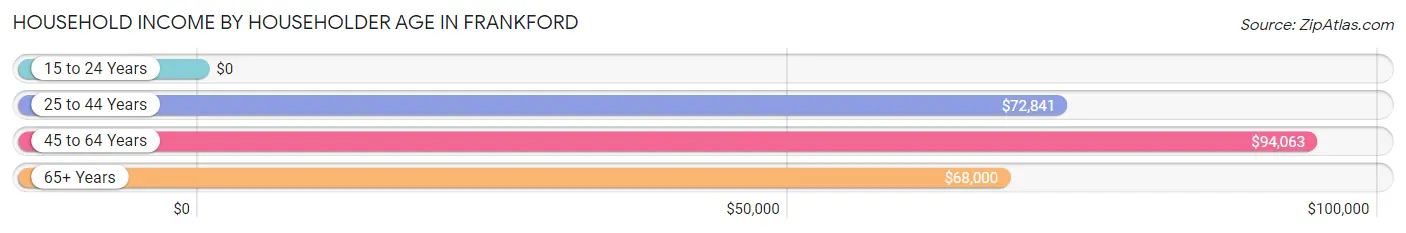
| Income Bracket | # Households | Median Income |
| 15 to 24 Years | 0 (0.0%) | $0 |
| 25 to 44 Years | 101 (41.2%) | $72,841 |
| 45 to 64 Years | 70 (28.6%) | $94,063 |
| 65+ Years | 74 (30.2%) | $68,000 |
| Total | 245 (100.0%) | $72,841 |
Poverty in Frankford
Income Below Poverty by Sex and Age in Frankford
With 5.4% poverty level for males and 6.0% for females among the residents of Frankford, 35 to 44 year old males and 5 year old females are the most vulnerable to poverty, with 11 males (16.9%) and 3 females (100.0%) in their respective age groups living below the poverty level.
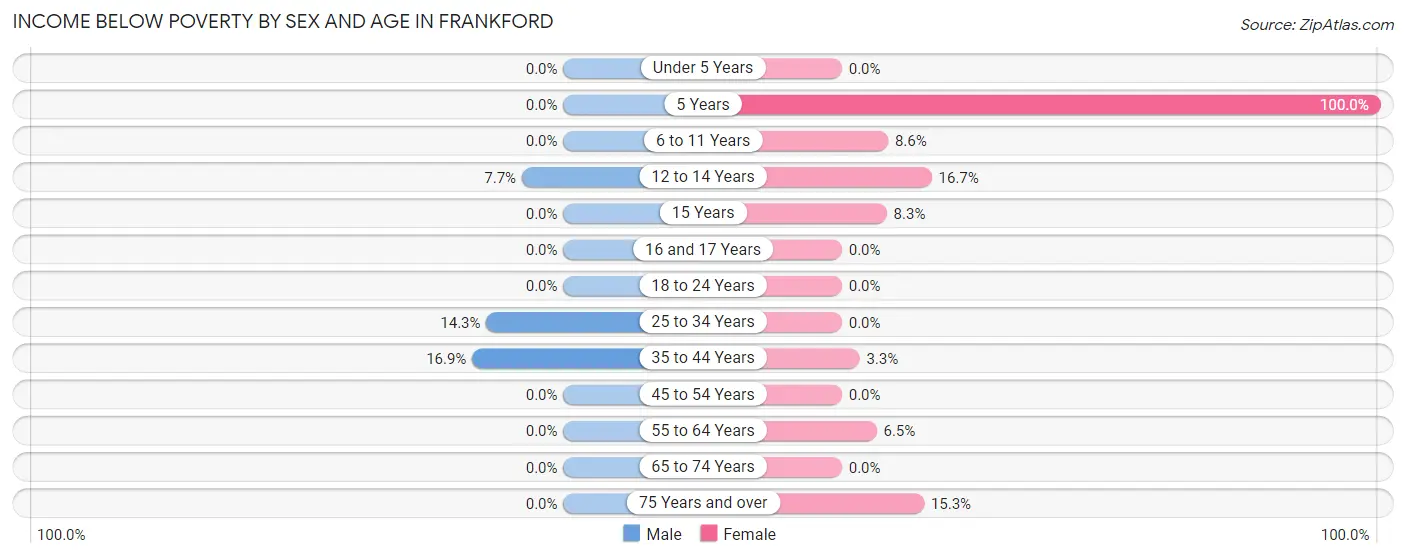
| Age Bracket | Male | Female |
| Under 5 Years | 0 (0.0%) | 0 (0.0%) |
| 5 Years | 0 (0.0%) | 3 (100.0%) |
| 6 to 11 Years | 0 (0.0%) | 6 (8.6%) |
| 12 to 14 Years | 2 (7.7%) | 3 (16.7%) |
| 15 Years | 0 (0.0%) | 1 (8.3%) |
| 16 and 17 Years | 0 (0.0%) | 0 (0.0%) |
| 18 to 24 Years | 0 (0.0%) | 0 (0.0%) |
| 25 to 34 Years | 9 (14.3%) | 0 (0.0%) |
| 35 to 44 Years | 11 (16.9%) | 2 (3.3%) |
| 45 to 54 Years | 0 (0.0%) | 0 (0.0%) |
| 55 to 64 Years | 0 (0.0%) | 2 (6.5%) |
| 65 to 74 Years | 0 (0.0%) | 0 (0.0%) |
| 75 Years and over | 0 (0.0%) | 9 (15.2%) |
| Total | 22 (5.4%) | 26 (6.0%) |
Income Above Poverty by Sex and Age in Frankford
According to the poverty statistics in Frankford, males aged under 5 years and females aged under 5 years are the age groups that are most secure financially, with 100.0% of males and 100.0% of females in these age groups living above the poverty line.
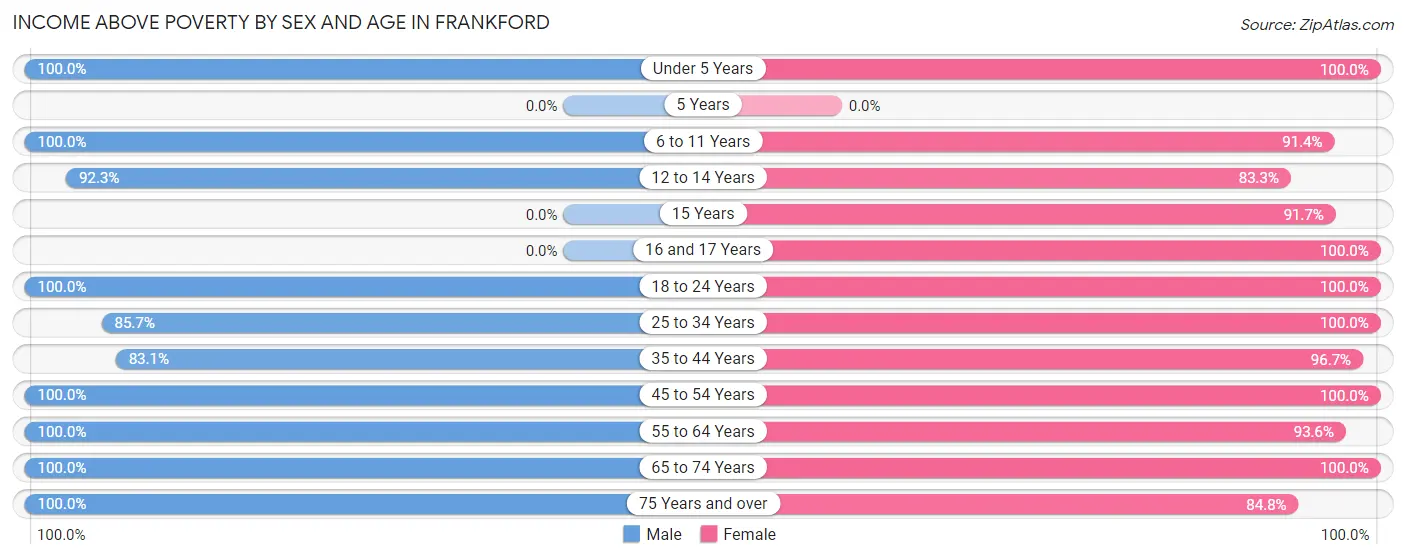
| Age Bracket | Male | Female |
| Under 5 Years | 18 (100.0%) | 44 (100.0%) |
| 5 Years | 0 (0.0%) | 0 (0.0%) |
| 6 to 11 Years | 42 (100.0%) | 64 (91.4%) |
| 12 to 14 Years | 24 (92.3%) | 15 (83.3%) |
| 15 Years | 0 (0.0%) | 11 (91.7%) |
| 16 and 17 Years | 0 (0.0%) | 16 (100.0%) |
| 18 to 24 Years | 24 (100.0%) | 18 (100.0%) |
| 25 to 34 Years | 54 (85.7%) | 66 (100.0%) |
| 35 to 44 Years | 54 (83.1%) | 59 (96.7%) |
| 45 to 54 Years | 95 (100.0%) | 20 (100.0%) |
| 55 to 64 Years | 38 (100.0%) | 29 (93.5%) |
| 65 to 74 Years | 20 (100.0%) | 16 (100.0%) |
| 75 Years and over | 17 (100.0%) | 50 (84.8%) |
| Total | 386 (94.6%) | 408 (94.0%) |
Income Below Poverty Among Married-Couple Families in Frankford
The poverty statistics for married-couple families in Frankford show that 1.5% or 2 of the total 131 families live below the poverty line. Families with 1 or 2 children have the highest poverty rate of 3.5%, comprising of 2 families. On the other hand, families with no children have the lowest poverty rate of 0.0%, which includes 0 families.
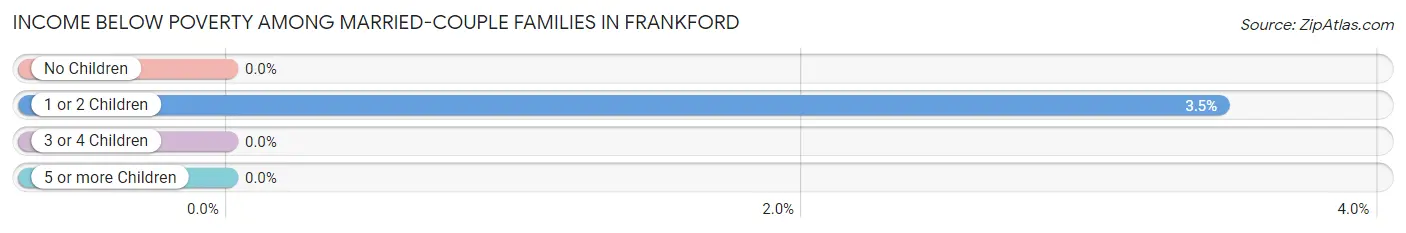
| Children | Above Poverty | Below Poverty |
| No Children | 53 (100.0%) | 0 (0.0%) |
| 1 or 2 Children | 56 (96.6%) | 2 (3.5%) |
| 3 or 4 Children | 20 (100.0%) | 0 (0.0%) |
| 5 or more Children | 0 (0.0%) | 0 (0.0%) |
| Total | 129 (98.5%) | 2 (1.5%) |
Income Below Poverty Among Single-Parent Households in Frankford
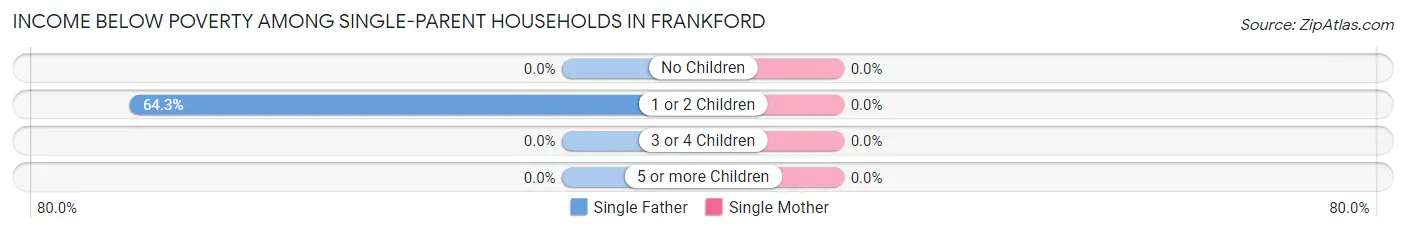
| Children | Single Father | Single Mother |
| No Children | 0 (0.0%) | 0 (0.0%) |
| 1 or 2 Children | 9 (64.3%) | 0 (0.0%) |
| 3 or 4 Children | 0 (0.0%) | 0 (0.0%) |
| 5 or more Children | 0 (0.0%) | 0 (0.0%) |
| Total | 9 (64.3%) | 0 (0.0%) |
Income Below Poverty Among Married-Couple vs Single-Parent Households in Frankford
The poverty data for Frankford shows that 2 of the married-couple family households (1.5%) and 9 of the single-parent households (14.5%) are living below the poverty level. Within the married-couple family households, those with 1 or 2 children have the highest poverty rate, with 2 households (3.5%) falling below the poverty line. Among the single-parent households, those with 1 or 2 children have the highest poverty rate, with 9 household (25.7%) living below poverty.
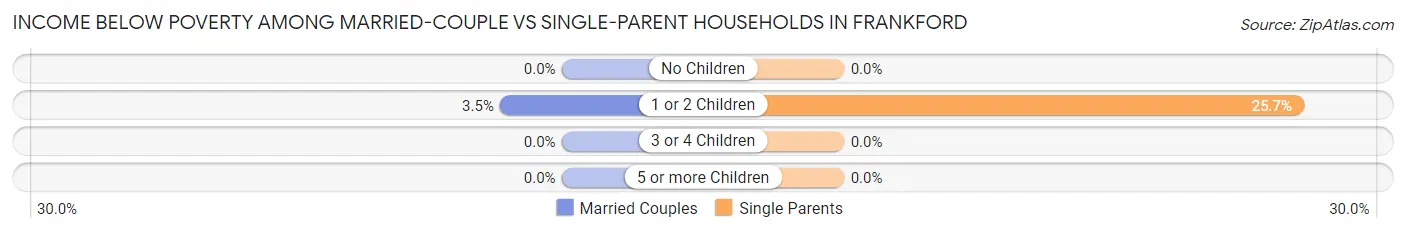
| Children | Married-Couple Families | Single-Parent Households |
| No Children | 0 (0.0%) | 0 (0.0%) |
| 1 or 2 Children | 2 (3.5%) | 9 (25.7%) |
| 3 or 4 Children | 0 (0.0%) | 0 (0.0%) |
| 5 or more Children | 0 (0.0%) | 0 (0.0%) |
| Total | 2 (1.5%) | 9 (14.5%) |
Race in Frankford
The most populous races in Frankford are Black / African American (330 | 39.2%), Hispanic or Latino (312 | 37.0%), and Some other Race (237 | 28.1%).
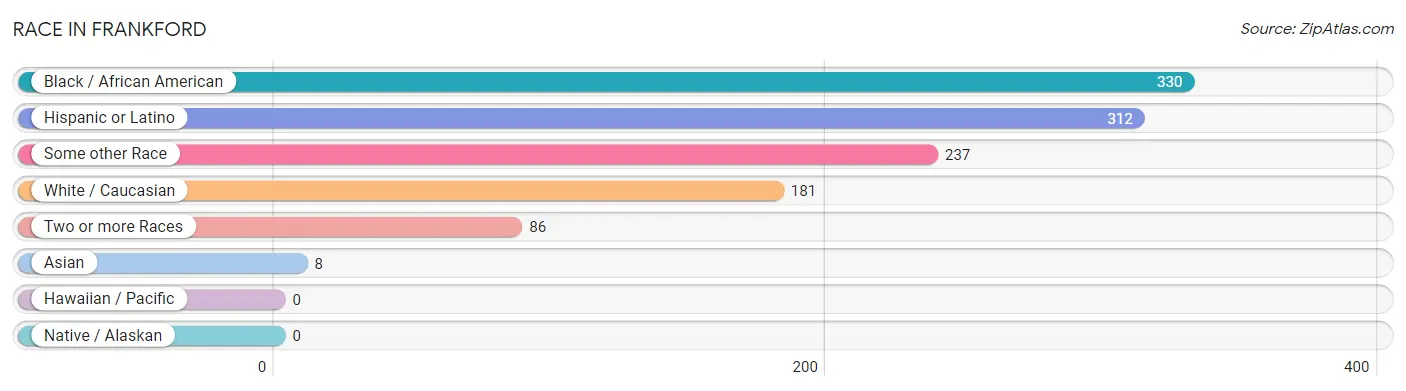
| Race | # Population | % Population |
| Asian | 8 | 0.9% |
| Black / African American | 330 | 39.2% |
| Hawaiian / Pacific | 0 | 0.0% |
| Hispanic or Latino | 312 | 37.0% |
| Native / Alaskan | 0 | 0.0% |
| White / Caucasian | 181 | 21.5% |
| Two or more Races | 86 | 10.2% |
| Some other Race | 237 | 28.1% |
| Total | 842 | 100.0% |
Ancestry in Frankford
The most populous ancestries reported in Frankford are Central American (231 | 27.4%), Honduran (101 | 12.0%), Guatemalan (98 | 11.6%), Mexican (78 | 9.3%), and Irish (44 | 5.2%), together accounting for 65.6% of all Frankford residents.
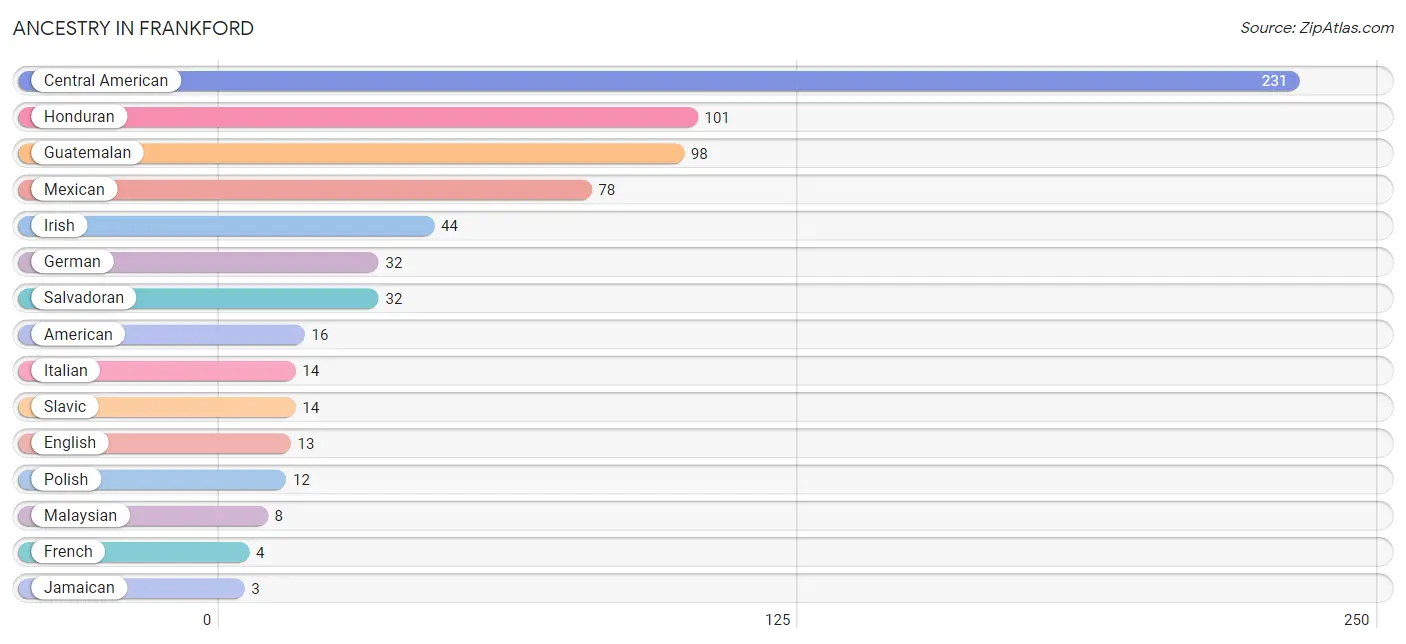
| Ancestry | # Population | % Population |
| American | 16 | 1.9% |
| Central American | 231 | 27.4% |
| English | 13 | 1.5% |
| French | 4 | 0.5% |
| German | 32 | 3.8% |
| Guatemalan | 98 | 11.6% |
| Honduran | 101 | 12.0% |
| Irish | 44 | 5.2% |
| Italian | 14 | 1.7% |
| Jamaican | 3 | 0.4% |
| Malaysian | 8 | 0.9% |
| Mexican | 78 | 9.3% |
| Norwegian | 2 | 0.2% |
| Polish | 12 | 1.4% |
| Salvadoran | 32 | 3.8% |
| Slavic | 14 | 1.7% |
| Swiss | 1 | 0.1% | View All 17 Rows |
Immigrants in Frankford
The most numerous immigrant groups reported in Frankford came from Latin America (136 | 16.2%), Central America (133 | 15.8%), Honduras (48 | 5.7%), Mexico (42 | 5.0%), and Guatemala (30 | 3.6%), together accounting for 46.2% of all Frankford residents.
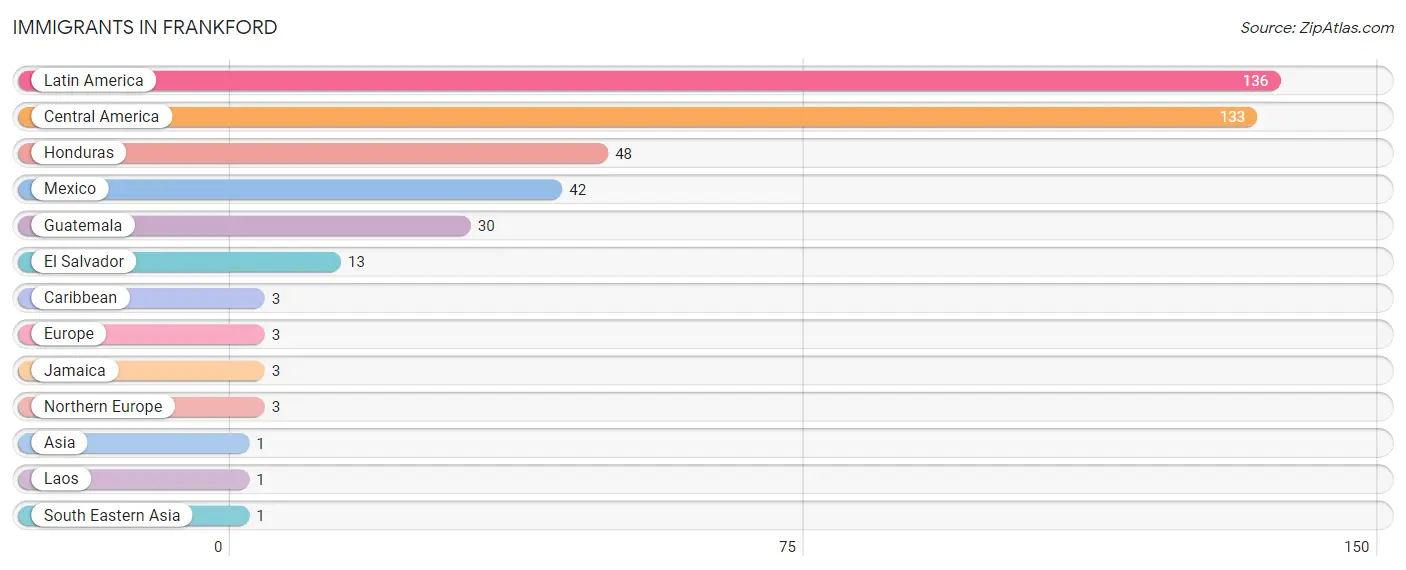
| Immigration Origin | # Population | % Population |
| Asia | 1 | 0.1% |
| Caribbean | 3 | 0.4% |
| Central America | 133 | 15.8% |
| El Salvador | 13 | 1.5% |
| Europe | 3 | 0.4% |
| Guatemala | 30 | 3.6% |
| Honduras | 48 | 5.7% |
| Jamaica | 3 | 0.4% |
| Laos | 1 | 0.1% |
| Latin America | 136 | 16.2% |
| Mexico | 42 | 5.0% |
| Northern Europe | 3 | 0.4% |
| South Eastern Asia | 1 | 0.1% | View All 13 Rows |
Sex and Age in Frankford
Sex and Age in Frankford
The most populous age groups in Frankford are 50 to 54 Years (58 | 14.2%) for men and 10 to 14 Years (54 | 12.4%) for women.
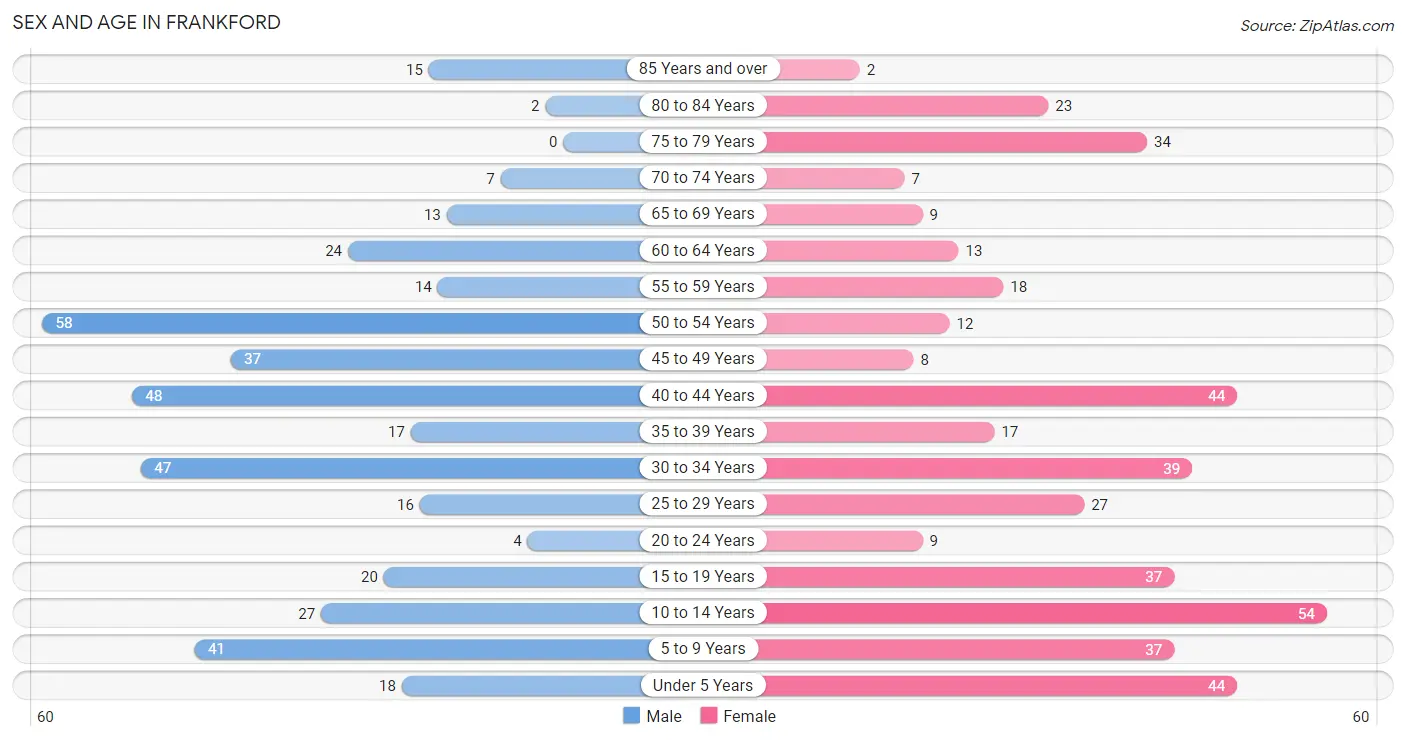
| Age Bracket | Male | Female |
| Under 5 Years | 18 (4.4%) | 44 (10.1%) |
| 5 to 9 Years | 41 (10.1%) | 37 (8.5%) |
| 10 to 14 Years | 27 (6.6%) | 54 (12.4%) |
| 15 to 19 Years | 20 (4.9%) | 37 (8.5%) |
| 20 to 24 Years | 4 (1.0%) | 9 (2.1%) |
| 25 to 29 Years | 16 (3.9%) | 27 (6.2%) |
| 30 to 34 Years | 47 (11.5%) | 39 (9.0%) |
| 35 to 39 Years | 17 (4.2%) | 17 (3.9%) |
| 40 to 44 Years | 48 (11.8%) | 44 (10.1%) |
| 45 to 49 Years | 37 (9.1%) | 8 (1.8%) |
| 50 to 54 Years | 58 (14.2%) | 12 (2.8%) |
| 55 to 59 Years | 14 (3.4%) | 18 (4.2%) |
| 60 to 64 Years | 24 (5.9%) | 13 (3.0%) |
| 65 to 69 Years | 13 (3.2%) | 9 (2.1%) |
| 70 to 74 Years | 7 (1.7%) | 7 (1.6%) |
| 75 to 79 Years | 0 (0.0%) | 34 (7.8%) |
| 80 to 84 Years | 2 (0.5%) | 23 (5.3%) |
| 85 Years and over | 15 (3.7%) | 2 (0.5%) |
| Total | 408 (100.0%) | 434 (100.0%) |
Families and Households in Frankford
Median Family Size in Frankford
The median family size in Frankford is 3.81 persons per family, with married-couple families (131 | 67.9%) accounting for the largest median family size of 4.13 persons per family. On the other hand, single female/mother families (48 | 24.9%) represent the smallest median family size with 2.98 persons per family.
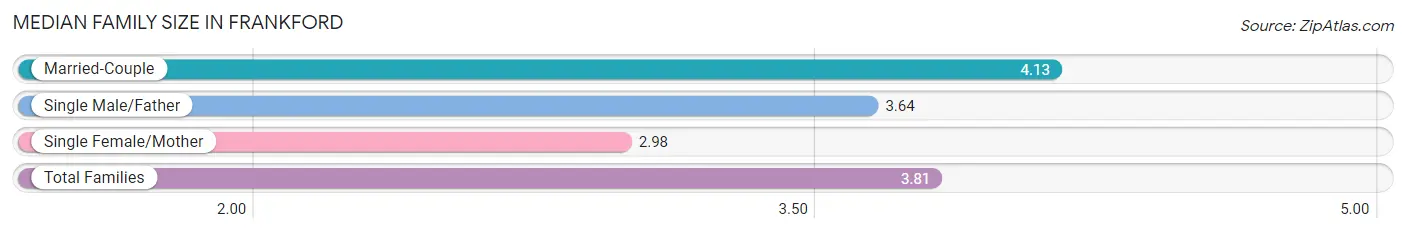
| Family Type | # Families | Family Size |
| Married-Couple | 131 (67.9%) | 4.13 |
| Single Male/Father | 14 (7.2%) | 3.64 |
| Single Female/Mother | 48 (24.9%) | 2.98 |
| Total Families | 193 (100.0%) | 3.81 |
Median Household Size in Frankford
The median household size in Frankford is 3.43 persons per household, with married-couple households (131 | 53.5%) accounting for the largest median household size of 4.27 persons per household. non-family households (52 | 21.2%) represent the smallest median household size with 1.60 persons per household.
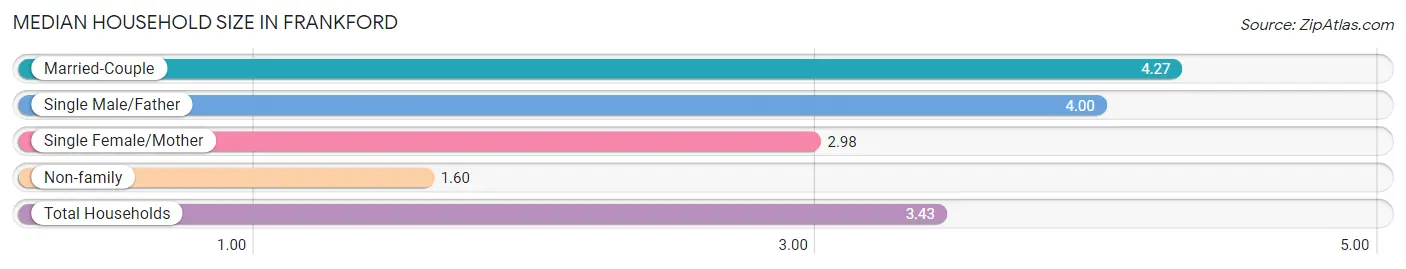
| Household Type | # Households | Household Size |
| Married-Couple | 131 (53.5%) | 4.27 |
| Single Male/Father | 14 (5.7%) | 4.00 |
| Single Female/Mother | 48 (19.6%) | 2.98 |
| Non-family | 52 (21.2%) | 1.60 |
| Total Households | 245 (100.0%) | 3.43 |
Household Size by Marriage Status in Frankford
Out of a total of 245 households in Frankford, 193 (78.8%) are family households, while 52 (21.2%) are nonfamily households. The most numerous type of family households are 2-person households, comprising 69, and the most common type of nonfamily households are 1-person households, comprising 29.
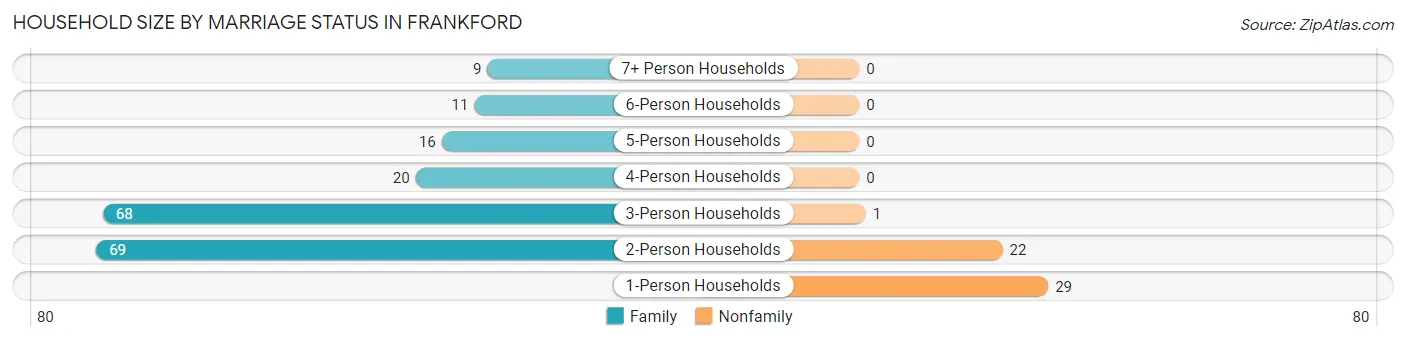
| Household Size | Family Households | Nonfamily Households |
| 1-Person Households | - | 29 (11.8%) |
| 2-Person Households | 69 (28.2%) | 22 (9.0%) |
| 3-Person Households | 68 (27.8%) | 1 (0.4%) |
| 4-Person Households | 20 (8.2%) | 0 (0.0%) |
| 5-Person Households | 16 (6.5%) | 0 (0.0%) |
| 6-Person Households | 11 (4.5%) | 0 (0.0%) |
| 7+ Person Households | 9 (3.7%) | 0 (0.0%) |
| Total | 193 (78.8%) | 52 (21.2%) |
Female Fertility in Frankford
Fertility by Age in Frankford
Average fertility rate in Frankford is 17.0 births per 1,000 women. Women in the age bracket of 20 to 34 years have the highest fertility rate with 40.0 births per 1,000 women. Women in the age bracket of 20 to 34 years acount for 100.0% of all women with births.
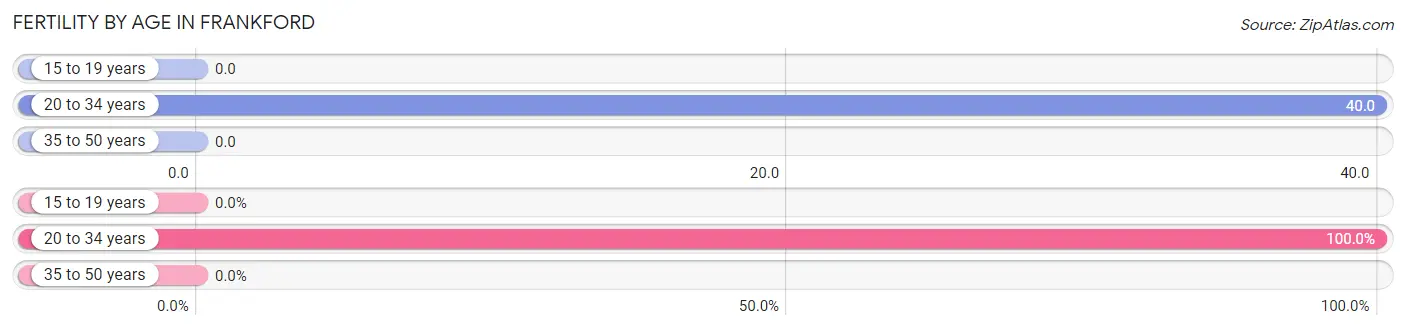
| Age Bracket | Women with Births | Births / 1,000 Women |
| 15 to 19 years | 0 (0.0%) | 0.0 |
| 20 to 34 years | 3 (100.0%) | 40.0 |
| 35 to 50 years | 0 (0.0%) | 0.0 |
| Total | 3 (100.0%) | 17.0 |
Fertility by Age by Marriage Status in Frankford
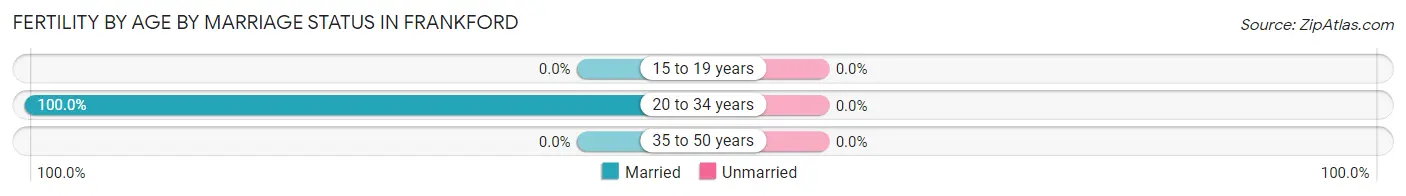
| Age Bracket | Married | Unmarried |
| 15 to 19 years | 0 (0.0%) | 0 (0.0%) |
| 20 to 34 years | 3 (100.0%) | 0 (0.0%) |
| 35 to 50 years | 0 (0.0%) | 0 (0.0%) |
| Total | 3 (100.0%) | 0 (0.0%) |
Fertility by Education in Frankford
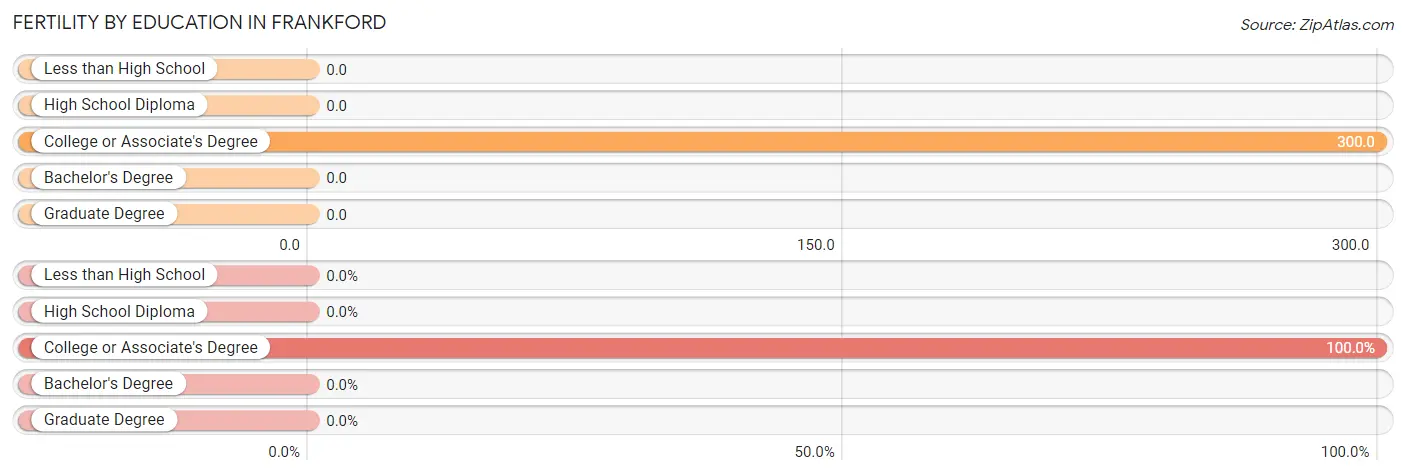
| Educational Attainment | Women with Births | Births / 1,000 Women |
| Less than High School | 0 (0.0%) | 0.0 |
| High School Diploma | 0 (0.0%) | 0.0 |
| College or Associate's Degree | 3 (100.0%) | 300.0 |
| Bachelor's Degree | 0 (0.0%) | 0.0 |
| Graduate Degree | 0 (0.0%) | 0.0 |
| Total | 3 (100.0%) | 17.0 |
Fertility by Education by Marriage Status in Frankford
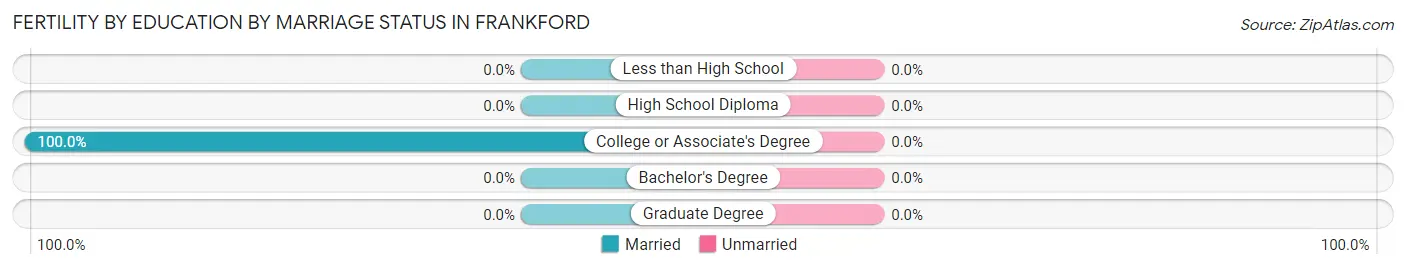
| Educational Attainment | Married | Unmarried |
| Less than High School | 0 (0.0%) | 0 (0.0%) |
| High School Diploma | 0 (0.0%) | 0 (0.0%) |
| College or Associate's Degree | 3 (100.0%) | 0 (0.0%) |
| Bachelor's Degree | 0 (0.0%) | 0 (0.0%) |
| Graduate Degree | 0 (0.0%) | 0 (0.0%) |
| Total | 3 (100.0%) | 0 (0.0%) |
Employment Characteristics in Frankford
Employment by Class of Employer in Frankford
Among the 462 employed individuals in Frankford, private company employees (337 | 72.9%), state government employees (61 | 13.2%), and self-employed (not incorporated) (25 | 5.4%) make up the most common classes of employment.
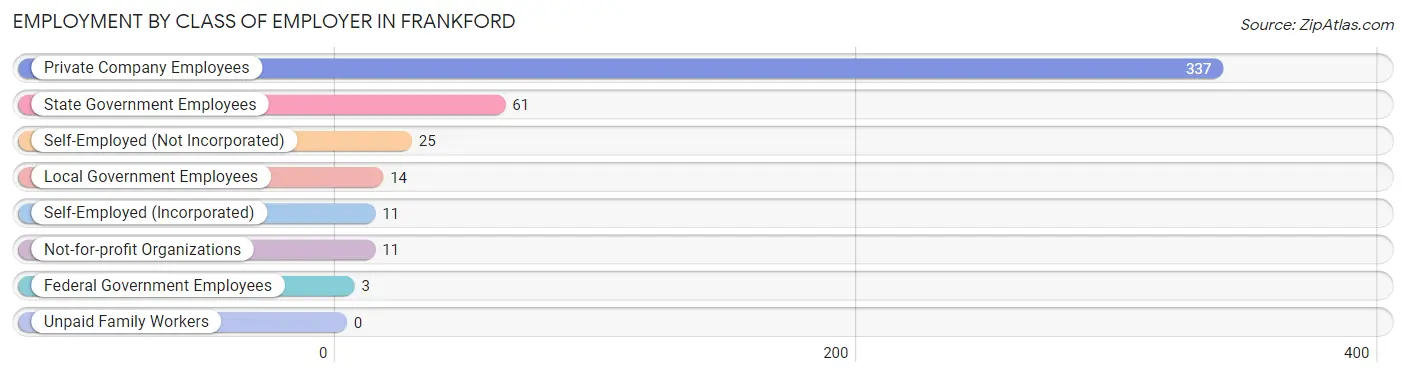
| Employer Class | # Employees | % Employees |
| Private Company Employees | 337 | 72.9% |
| Self-Employed (Incorporated) | 11 | 2.4% |
| Self-Employed (Not Incorporated) | 25 | 5.4% |
| Not-for-profit Organizations | 11 | 2.4% |
| Local Government Employees | 14 | 3.0% |
| State Government Employees | 61 | 13.2% |
| Federal Government Employees | 3 | 0.6% |
| Unpaid Family Workers | 0 | 0.0% |
| Total | 462 | 100.0% |
Employment Status by Age in Frankford
According to the labor force statistics for Frankford, out of the total population over 16 years of age (609), 78.3% or 477 individuals are in the labor force, with 0.8% or 4 of them unemployed. The age group with the highest labor force participation rate is 20 to 24 years, with 100.0% or 13 individuals in the labor force. Within the labor force, the 25 to 29 years age range has the highest percentage of unemployed individuals, with 9.3% or 4 of them being unemployed.
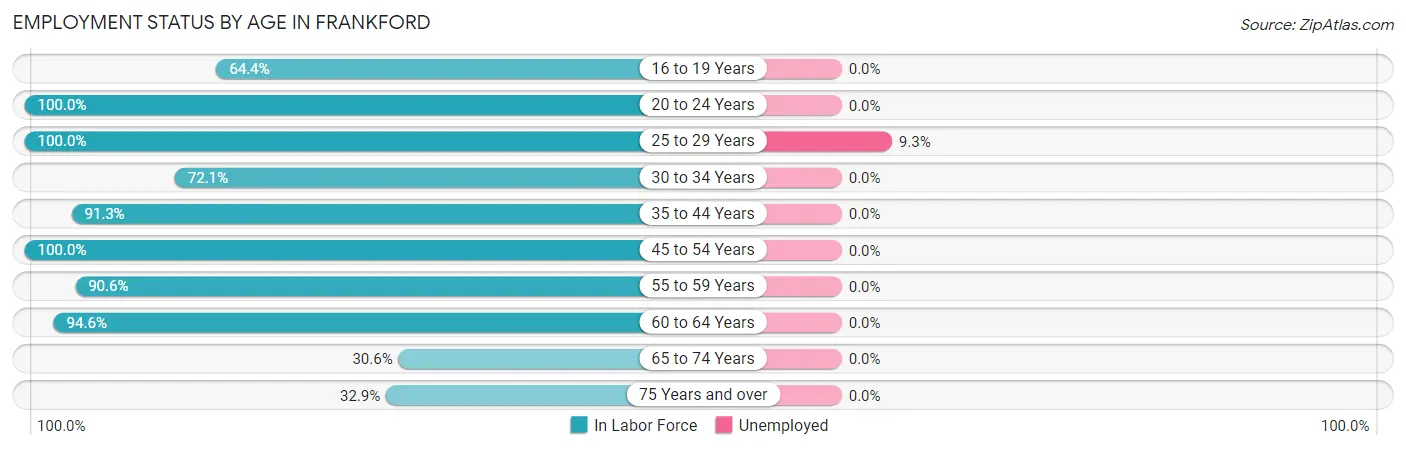
| Age Bracket | In Labor Force | Unemployed |
| 16 to 19 Years | 29 (64.4%) | 0 (0.0%) |
| 20 to 24 Years | 13 (100.0%) | 0 (0.0%) |
| 25 to 29 Years | 43 (100.0%) | 4 (9.3%) |
| 30 to 34 Years | 62 (72.1%) | 0 (0.0%) |
| 35 to 44 Years | 115 (91.3%) | 0 (0.0%) |
| 45 to 54 Years | 115 (100.0%) | 0 (0.0%) |
| 55 to 59 Years | 29 (90.6%) | 0 (0.0%) |
| 60 to 64 Years | 35 (94.6%) | 0 (0.0%) |
| 65 to 74 Years | 11 (30.6%) | 0 (0.0%) |
| 75 Years and over | 25 (32.9%) | 0 (0.0%) |
| Total | 477 (78.3%) | 4 (0.8%) |
Employment Status by Educational Attainment in Frankford
According to labor force statistics for Frankford, 90.9% of individuals (399) out of the total population between 25 and 64 years of age (439) are in the labor force, with 1.0% or 4 of them being unemployed. The group with the highest labor force participation rate are those with the educational attainment of bachelor's degree or higher, with 100.0% or 82 individuals in the labor force. Within the labor force, individuals with high school diploma education have the highest percentage of unemployment, with 2.1% or 4 of them being unemployed.
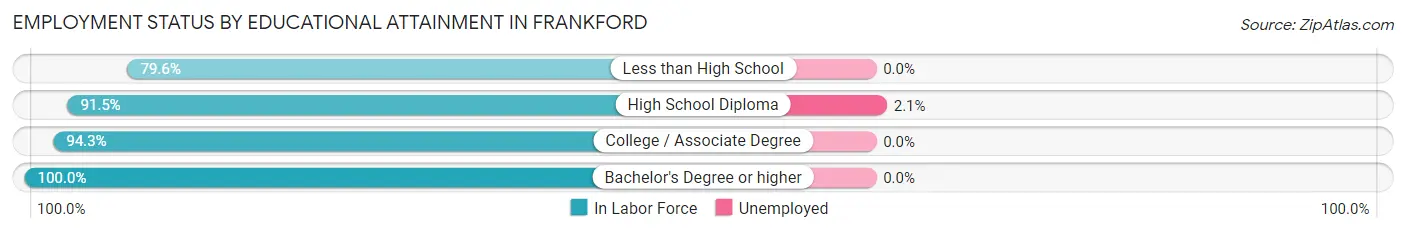
| Educational Attainment | In Labor Force | Unemployed |
| Less than High School | 74 (79.6%) | 0 (0.0%) |
| High School Diploma | 193 (91.5%) | 4 (2.1%) |
| College / Associate Degree | 50 (94.3%) | 0 (0.0%) |
| Bachelor's Degree or higher | 82 (100.0%) | 0 (0.0%) |
| Total | 399 (90.9%) | 4 (1.0%) |
Employment Occupations by Sex in Frankford
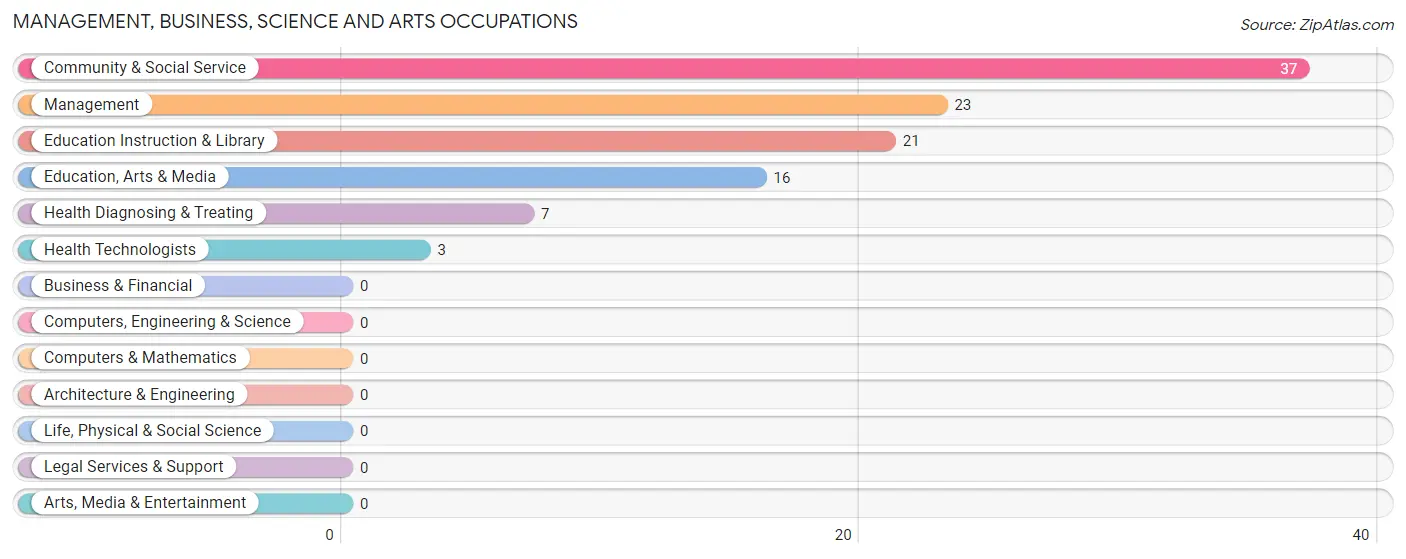
Management, Business, Science and Arts Occupations
The most common Management, Business, Science and Arts occupations in Frankford are Community & Social Service (37 | 7.8%), Management (23 | 4.9%), Education Instruction & Library (21 | 4.4%), Education, Arts & Media (16 | 3.4%), and Health Diagnosing & Treating (7 | 1.5%).
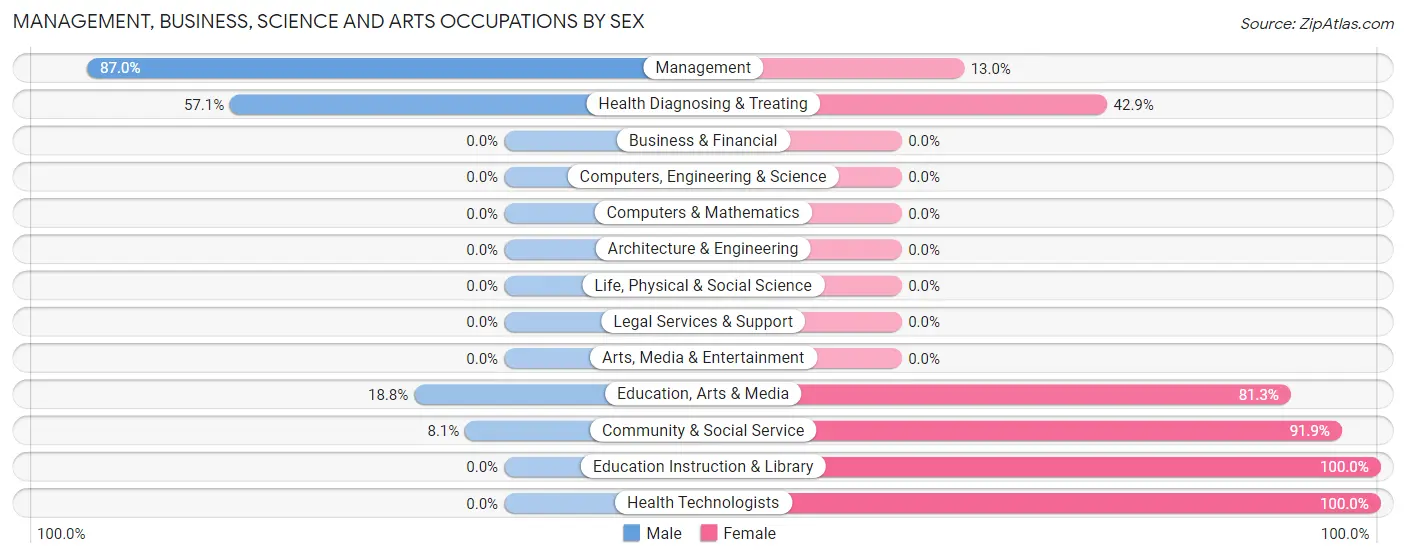
Management, Business, Science and Arts Occupations by Sex
Within the Management, Business, Science and Arts occupations in Frankford, the most male-oriented occupations are Management (87.0%), Health Diagnosing & Treating (57.1%), and Education, Arts & Media (18.8%), while the most female-oriented occupations are Education Instruction & Library (100.0%), Health Technologists (100.0%), and Community & Social Service (91.9%).
| Occupation | Male | Female |
| Management | 20 (87.0%) | 3 (13.0%) |
| Business & Financial | 0 (0.0%) | 0 (0.0%) |
| Computers, Engineering & Science | 0 (0.0%) | 0 (0.0%) |
| Computers & Mathematics | 0 (0.0%) | 0 (0.0%) |
| Architecture & Engineering | 0 (0.0%) | 0 (0.0%) |
| Life, Physical & Social Science | 0 (0.0%) | 0 (0.0%) |
| Community & Social Service | 3 (8.1%) | 34 (91.9%) |
| Education, Arts & Media | 3 (18.8%) | 13 (81.2%) |
| Legal Services & Support | 0 (0.0%) | 0 (0.0%) |
| Education Instruction & Library | 0 (0.0%) | 21 (100.0%) |
| Arts, Media & Entertainment | 0 (0.0%) | 0 (0.0%) |
| Health Diagnosing & Treating | 4 (57.1%) | 3 (42.9%) |
| Health Technologists | 0 (0.0%) | 3 (100.0%) |
| Total (Category) | 27 (40.3%) | 40 (59.7%) |
| Total (Overall) | 268 (56.7%) | 205 (43.3%) |
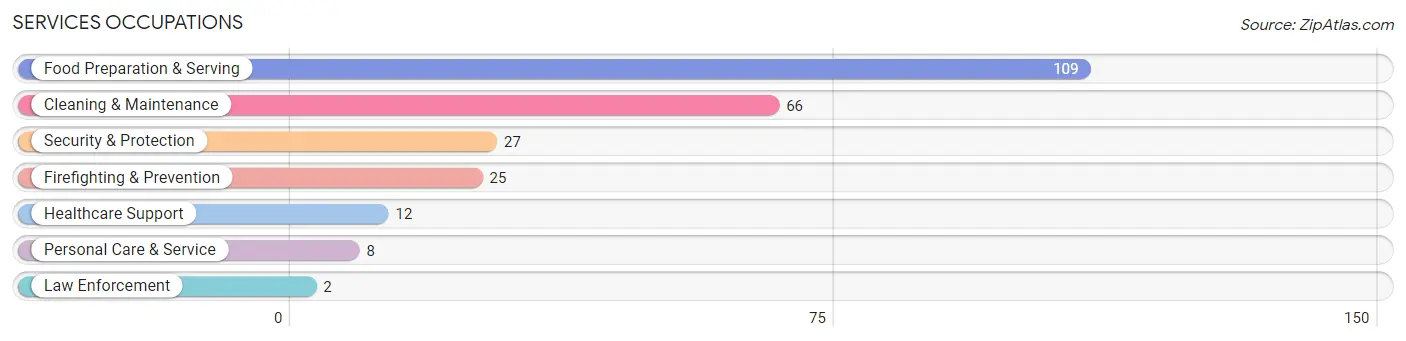
Services Occupations
The most common Services occupations in Frankford are Food Preparation & Serving (109 | 23.0%), Cleaning & Maintenance (66 | 14.0%), Security & Protection (27 | 5.7%), Firefighting & Prevention (25 | 5.3%), and Healthcare Support (12 | 2.5%).
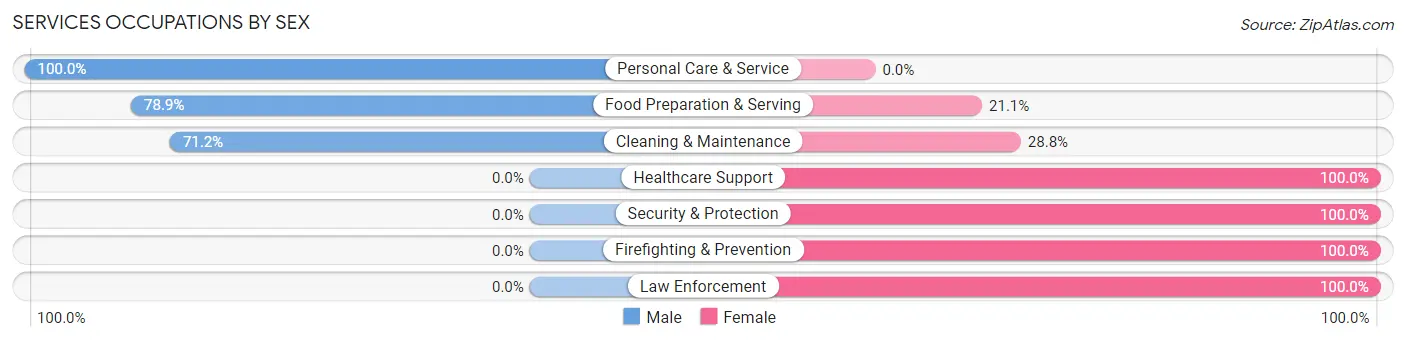
Services Occupations by Sex
Within the Services occupations in Frankford, the most male-oriented occupations are Personal Care & Service (100.0%), Food Preparation & Serving (78.9%), and Cleaning & Maintenance (71.2%), while the most female-oriented occupations are Healthcare Support (100.0%), Security & Protection (100.0%), and Firefighting & Prevention (100.0%).
| Occupation | Male | Female |
| Healthcare Support | 0 (0.0%) | 12 (100.0%) |
| Security & Protection | 0 (0.0%) | 27 (100.0%) |
| Firefighting & Prevention | 0 (0.0%) | 25 (100.0%) |
| Law Enforcement | 0 (0.0%) | 2 (100.0%) |
| Food Preparation & Serving | 86 (78.9%) | 23 (21.1%) |
| Cleaning & Maintenance | 47 (71.2%) | 19 (28.8%) |
| Personal Care & Service | 8 (100.0%) | 0 (0.0%) |
| Total (Category) | 141 (63.5%) | 81 (36.5%) |
| Total (Overall) | 268 (56.7%) | 205 (43.3%) |
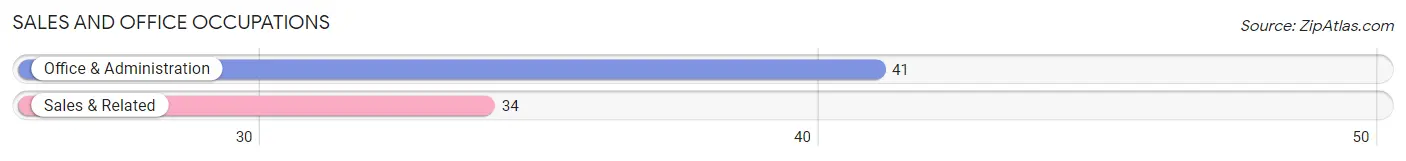
Sales and Office Occupations
The most common Sales and Office occupations in Frankford are Office & Administration (41 | 8.7%), and Sales & Related (34 | 7.2%).
Sales and Office Occupations by Sex
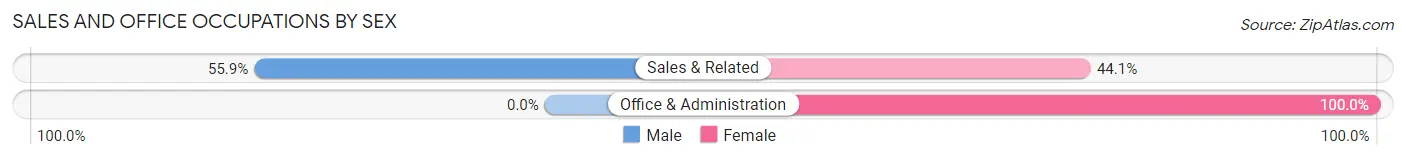
| Occupation | Male | Female |
| Sales & Related | 19 (55.9%) | 15 (44.1%) |
| Office & Administration | 0 (0.0%) | 41 (100.0%) |
| Total (Category) | 19 (25.3%) | 56 (74.7%) |
| Total (Overall) | 268 (56.7%) | 205 (43.3%) |
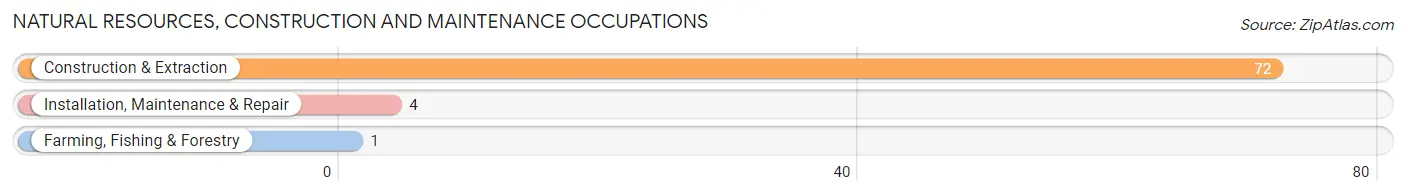
Natural Resources, Construction and Maintenance Occupations
The most common Natural Resources, Construction and Maintenance occupations in Frankford are Construction & Extraction (72 | 15.2%), Installation, Maintenance & Repair (4 | 0.9%), and Farming, Fishing & Forestry (1 | 0.2%).
Natural Resources, Construction and Maintenance Occupations by Sex
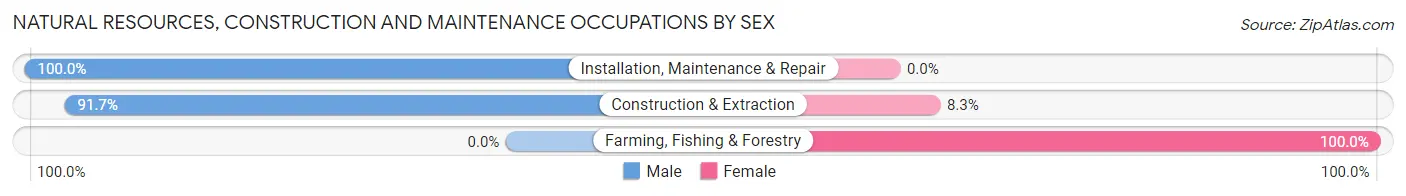
| Occupation | Male | Female |
| Farming, Fishing & Forestry | 0 (0.0%) | 1 (100.0%) |
| Construction & Extraction | 66 (91.7%) | 6 (8.3%) |
| Installation, Maintenance & Repair | 4 (100.0%) | 0 (0.0%) |
| Total (Category) | 70 (90.9%) | 7 (9.1%) |
| Total (Overall) | 268 (56.7%) | 205 (43.3%) |
Production, Transportation and Moving Occupations
The most common Production, Transportation and Moving occupations in Frankford are Production (31 | 6.6%), and Material Moving (1 | 0.2%).
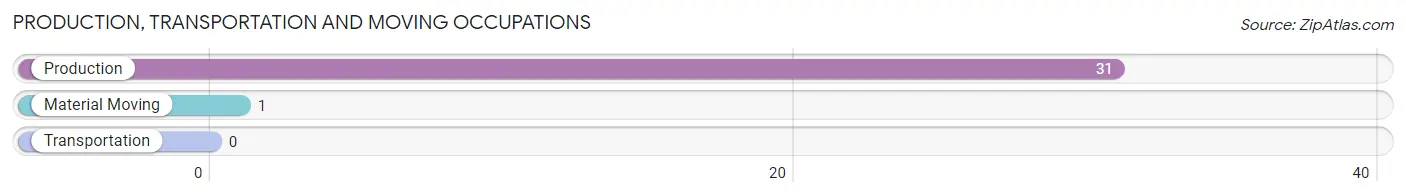
Production, Transportation and Moving Occupations by Sex

| Occupation | Male | Female |
| Production | 10 (32.3%) | 21 (67.7%) |
| Transportation | 0 (0.0%) | 0 (0.0%) |
| Material Moving | 1 (100.0%) | 0 (0.0%) |
| Total (Category) | 11 (34.4%) | 21 (65.6%) |
| Total (Overall) | 268 (56.7%) | 205 (43.3%) |
Employment Industries by Sex in Frankford
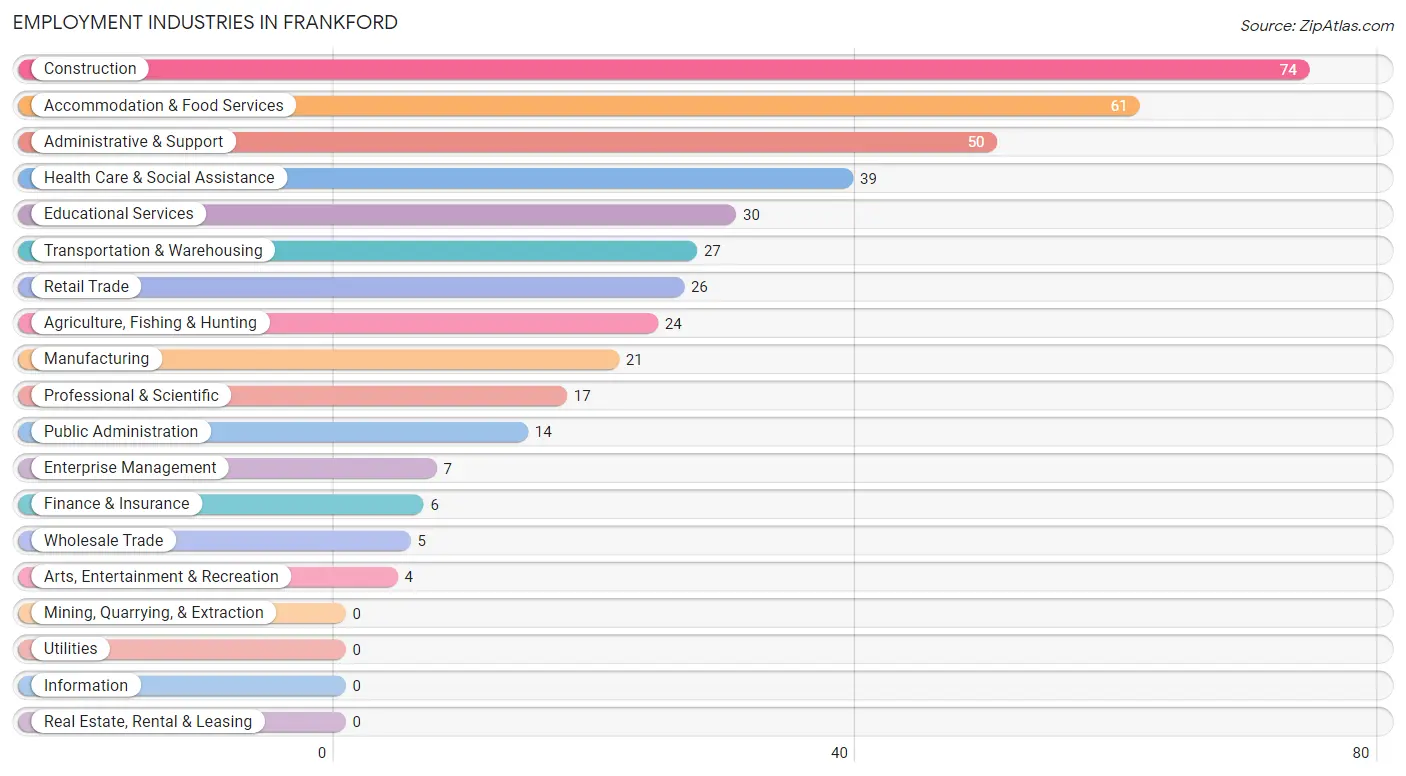
Employment Industries in Frankford
The major employment industries in Frankford include Construction (74 | 15.6%), Accommodation & Food Services (61 | 12.9%), Administrative & Support (50 | 10.6%), Health Care & Social Assistance (39 | 8.3%), and Educational Services (30 | 6.3%).
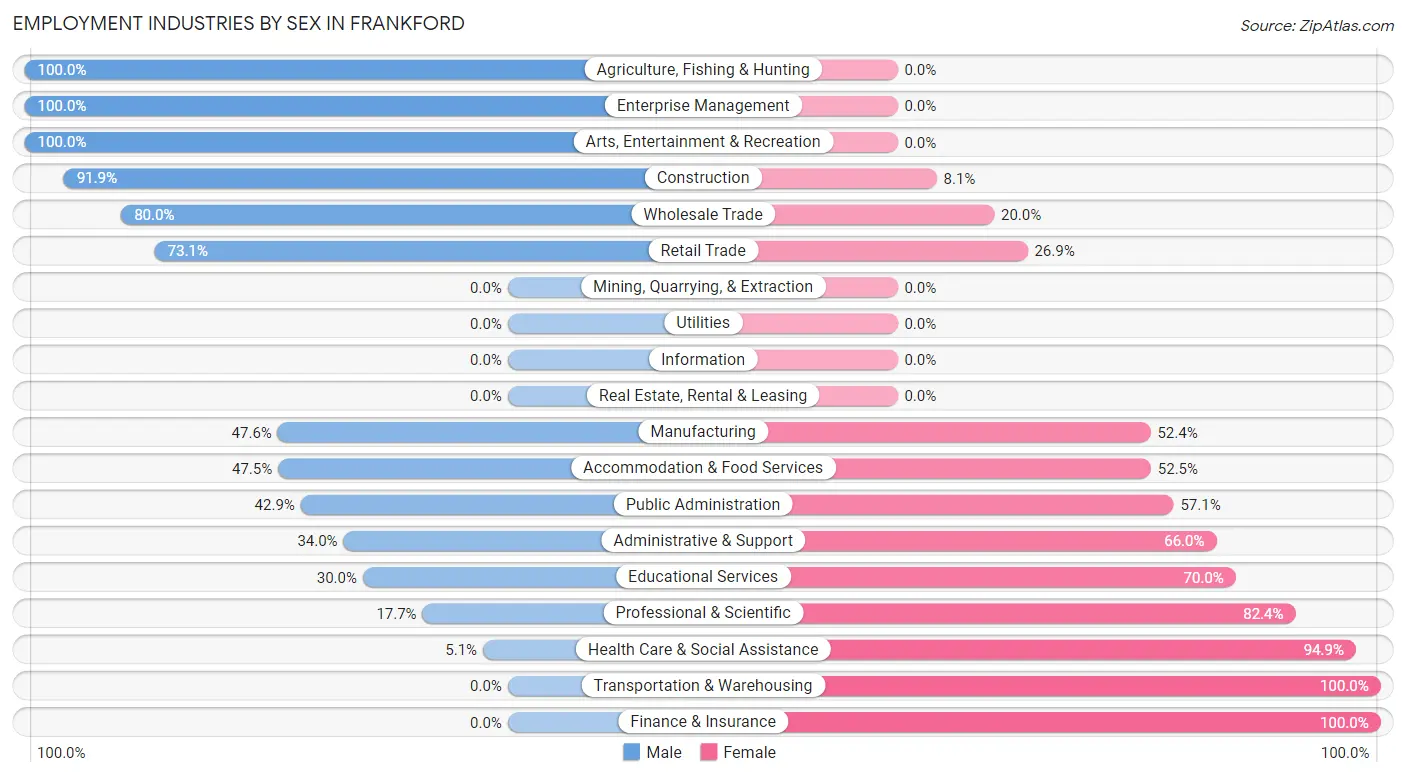
Employment Industries by Sex in Frankford
The Frankford industries that see more men than women are Agriculture, Fishing & Hunting (100.0%), Enterprise Management (100.0%), and Arts, Entertainment & Recreation (100.0%), whereas the industries that tend to have a higher number of women are Transportation & Warehousing (100.0%), Finance & Insurance (100.0%), and Health Care & Social Assistance (94.9%).
| Industry | Male | Female |
| Agriculture, Fishing & Hunting | 24 (100.0%) | 0 (0.0%) |
| Mining, Quarrying, & Extraction | 0 (0.0%) | 0 (0.0%) |
| Construction | 68 (91.9%) | 6 (8.1%) |
| Manufacturing | 10 (47.6%) | 11 (52.4%) |
| Wholesale Trade | 4 (80.0%) | 1 (20.0%) |
| Retail Trade | 19 (73.1%) | 7 (26.9%) |
| Transportation & Warehousing | 0 (0.0%) | 27 (100.0%) |
| Utilities | 0 (0.0%) | 0 (0.0%) |
| Information | 0 (0.0%) | 0 (0.0%) |
| Finance & Insurance | 0 (0.0%) | 6 (100.0%) |
| Real Estate, Rental & Leasing | 0 (0.0%) | 0 (0.0%) |
| Professional & Scientific | 3 (17.6%) | 14 (82.4%) |
| Enterprise Management | 7 (100.0%) | 0 (0.0%) |
| Administrative & Support | 17 (34.0%) | 33 (66.0%) |
| Educational Services | 9 (30.0%) | 21 (70.0%) |
| Health Care & Social Assistance | 2 (5.1%) | 37 (94.9%) |
| Arts, Entertainment & Recreation | 4 (100.0%) | 0 (0.0%) |
| Accommodation & Food Services | 29 (47.5%) | 32 (52.5%) |
| Public Administration | 6 (42.9%) | 8 (57.1%) |
| Total | 268 (56.7%) | 205 (43.3%) |
Education in Frankford
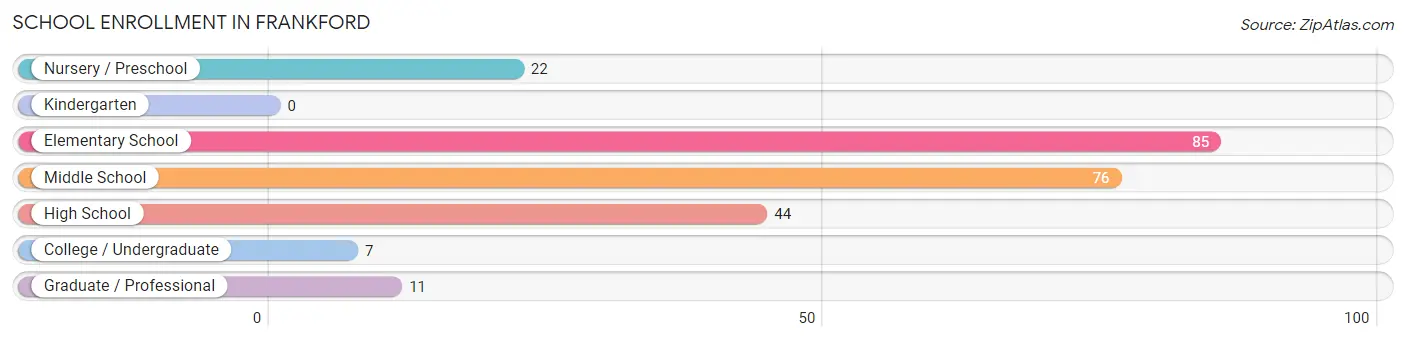
School Enrollment in Frankford
The most common levels of schooling among the 245 students in Frankford are elementary school (85 | 34.7%), middle school (76 | 31.0%), and high school (44 | 18.0%).
| School Level | # Students | % Students |
| Nursery / Preschool | 22 | 9.0% |
| Kindergarten | 0 | 0.0% |
| Elementary School | 85 | 34.7% |
| Middle School | 76 | 31.0% |
| High School | 44 | 18.0% |
| College / Undergraduate | 7 | 2.9% |
| Graduate / Professional | 11 | 4.5% |
| Total | 245 | 100.0% |
School Enrollment by Age by Funding Source in Frankford
Out of a total of 245 students who are enrolled in schools in Frankford, 9 (3.7%) attend a private institution, while the remaining 236 (96.3%) are enrolled in public schools. The age group of 35 years and over has the highest likelihood of being enrolled in private schools, with 9 (81.8% in the age bracket) enrolled. Conversely, the age group of 3 to 4 year olds has the lowest likelihood of being enrolled in a private school, with 22 (100.0% in the age bracket) attending a public institution.
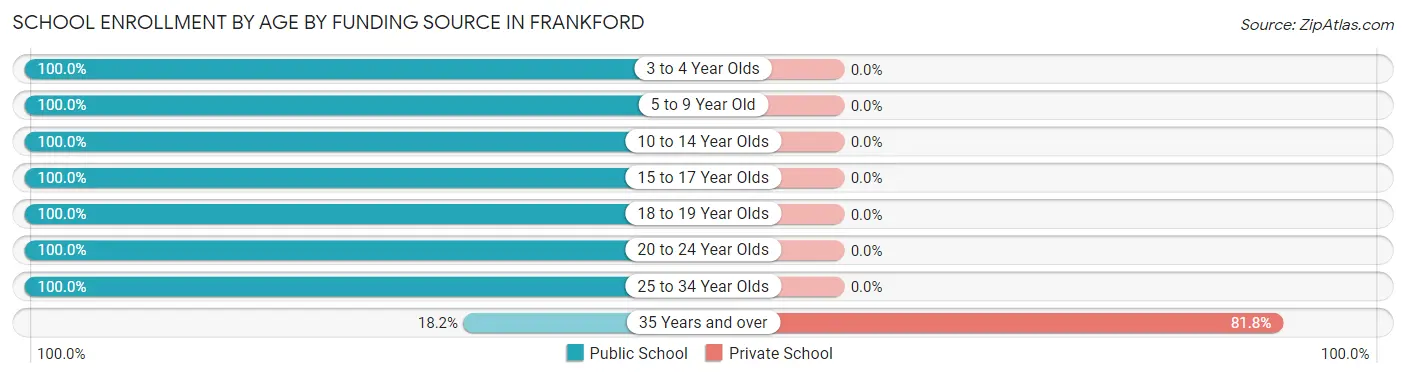
| Age Bracket | Public School | Private School |
| 3 to 4 Year Olds | 22 (100.0%) | 0 (0.0%) |
| 5 to 9 Year Old | 69 (100.0%) | 0 (0.0%) |
| 10 to 14 Year Olds | 81 (100.0%) | 0 (0.0%) |
| 15 to 17 Year Olds | 28 (100.0%) | 0 (0.0%) |
| 18 to 19 Year Olds | 27 (100.0%) | 0 (0.0%) |
| 20 to 24 Year Olds | 4 (100.0%) | 0 (0.0%) |
| 25 to 34 Year Olds | 3 (100.0%) | 0 (0.0%) |
| 35 Years and over | 2 (18.2%) | 9 (81.8%) |
| Total | 236 (96.3%) | 9 (3.7%) |
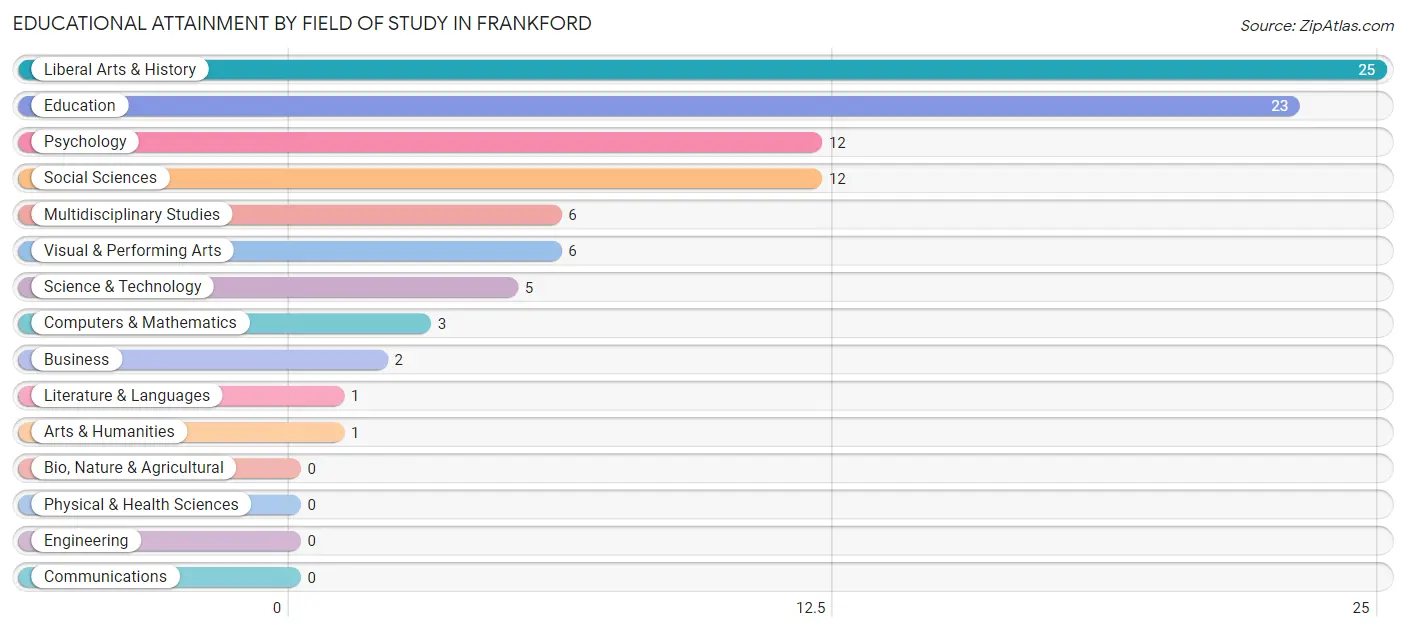
Educational Attainment by Field of Study in Frankford
Liberal arts & history (25 | 26.0%), education (23 | 24.0%), psychology (12 | 12.5%), social sciences (12 | 12.5%), and multidisciplinary studies (6 | 6.2%) are the most common fields of study among 96 individuals in Frankford who have obtained a bachelor's degree or higher.
| Field of Study | # Graduates | % Graduates |
| Computers & Mathematics | 3 | 3.1% |
| Bio, Nature & Agricultural | 0 | 0.0% |
| Physical & Health Sciences | 0 | 0.0% |
| Psychology | 12 | 12.5% |
| Social Sciences | 12 | 12.5% |
| Engineering | 0 | 0.0% |
| Multidisciplinary Studies | 6 | 6.2% |
| Science & Technology | 5 | 5.2% |
| Business | 2 | 2.1% |
| Education | 23 | 24.0% |
| Literature & Languages | 1 | 1.0% |
| Liberal Arts & History | 25 | 26.0% |
| Visual & Performing Arts | 6 | 6.2% |
| Communications | 0 | 0.0% |
| Arts & Humanities | 1 | 1.0% |
| Total | 96 | 100.0% |
Transportation & Commute in Frankford
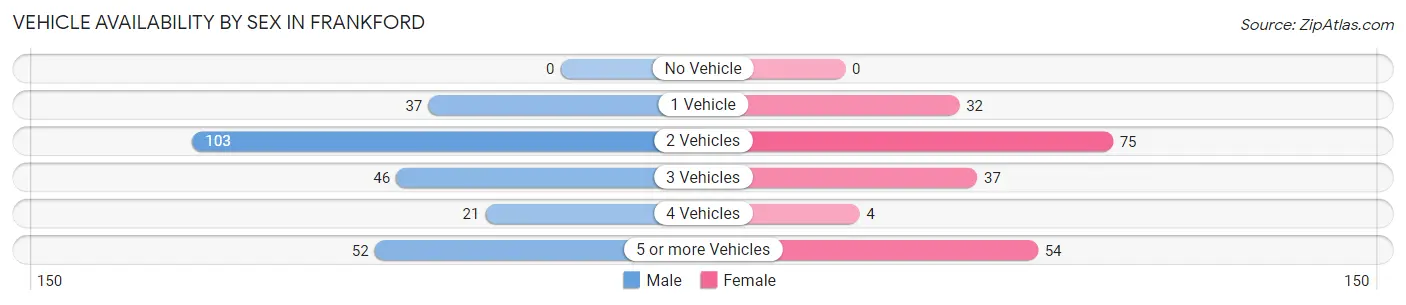
Vehicle Availability by Sex in Frankford
The most prevalent vehicle ownership categories in Frankford are males with 2 vehicles (103, accounting for 39.8%) and females with 2 vehicles (75, making up 51.0%).
| Vehicles Available | Male | Female |
| No Vehicle | 0 (0.0%) | 0 (0.0%) |
| 1 Vehicle | 37 (14.3%) | 32 (15.8%) |
| 2 Vehicles | 103 (39.8%) | 75 (37.1%) |
| 3 Vehicles | 46 (17.8%) | 37 (18.3%) |
| 4 Vehicles | 21 (8.1%) | 4 (2.0%) |
| 5 or more Vehicles | 52 (20.1%) | 54 (26.7%) |
| Total | 259 (100.0%) | 202 (100.0%) |
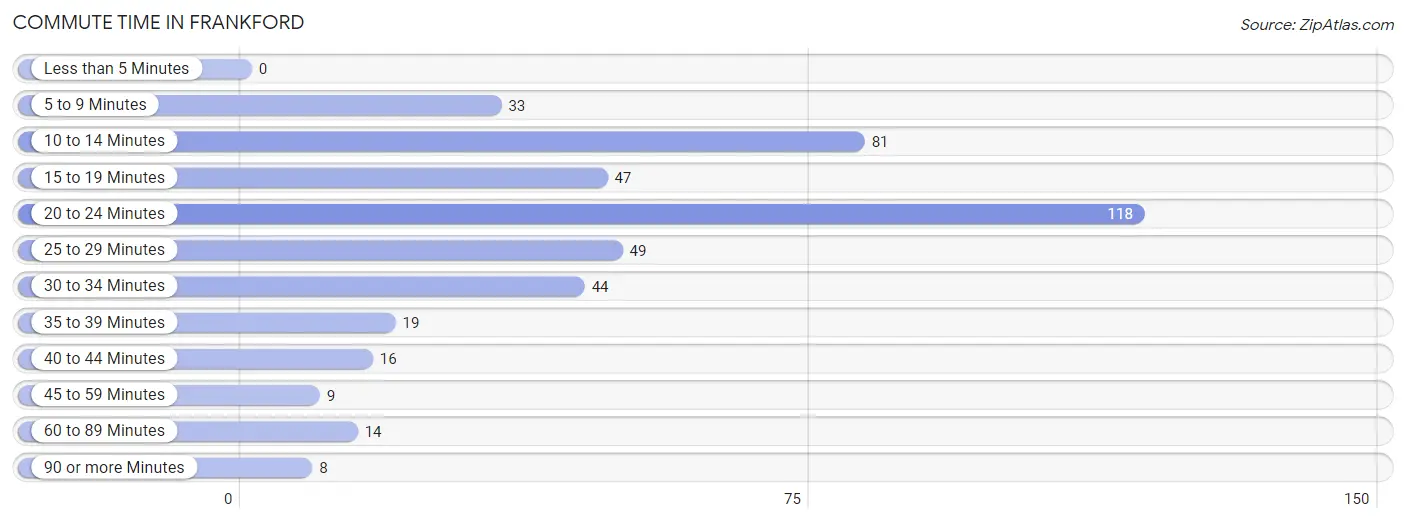
Commute Time in Frankford
The most frequently occuring commute durations in Frankford are 20 to 24 minutes (118 commuters, 26.9%), 10 to 14 minutes (81 commuters, 18.5%), and 25 to 29 minutes (49 commuters, 11.2%).
| Commute Time | # Commuters | % Commuters |
| Less than 5 Minutes | 0 | 0.0% |
| 5 to 9 Minutes | 33 | 7.5% |
| 10 to 14 Minutes | 81 | 18.5% |
| 15 to 19 Minutes | 47 | 10.7% |
| 20 to 24 Minutes | 118 | 26.9% |
| 25 to 29 Minutes | 49 | 11.2% |
| 30 to 34 Minutes | 44 | 10.1% |
| 35 to 39 Minutes | 19 | 4.3% |
| 40 to 44 Minutes | 16 | 3.6% |
| 45 to 59 Minutes | 9 | 2.1% |
| 60 to 89 Minutes | 14 | 3.2% |
| 90 or more Minutes | 8 | 1.8% |
Commute Time by Sex in Frankford
The most common commute times in Frankford are 20 to 24 minutes (93 commuters, 37.2%) for males and 5 to 9 minutes (33 commuters, 17.5%) for females.
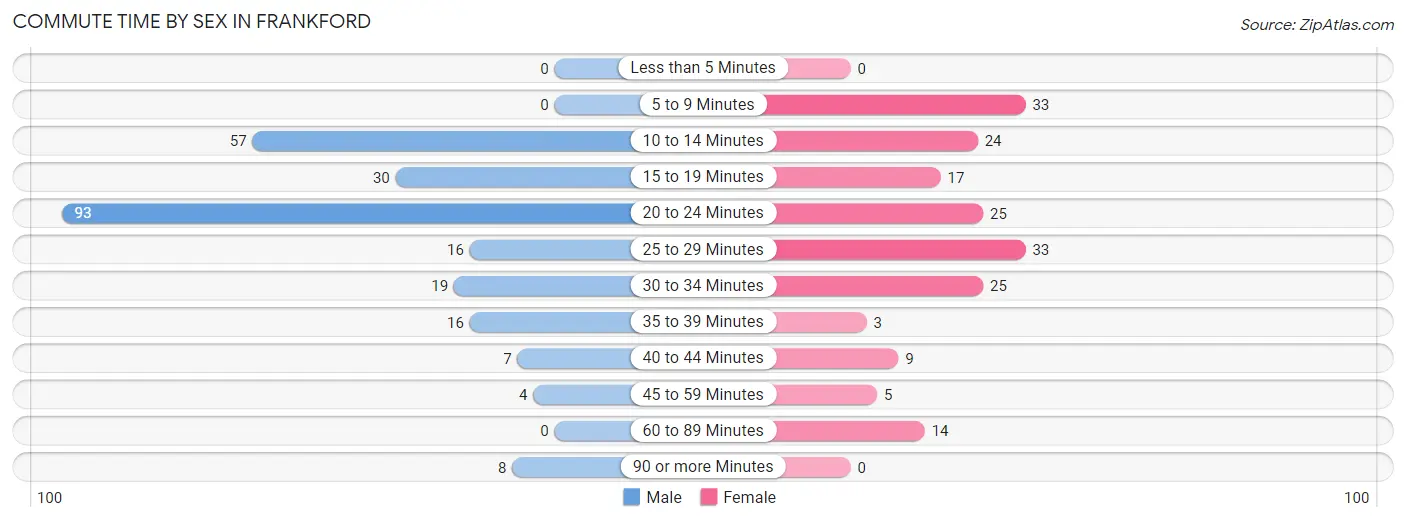
| Commute Time | Male | Female |
| Less than 5 Minutes | 0 (0.0%) | 0 (0.0%) |
| 5 to 9 Minutes | 0 (0.0%) | 33 (17.5%) |
| 10 to 14 Minutes | 57 (22.8%) | 24 (12.8%) |
| 15 to 19 Minutes | 30 (12.0%) | 17 (9.0%) |
| 20 to 24 Minutes | 93 (37.2%) | 25 (13.3%) |
| 25 to 29 Minutes | 16 (6.4%) | 33 (17.5%) |
| 30 to 34 Minutes | 19 (7.6%) | 25 (13.3%) |
| 35 to 39 Minutes | 16 (6.4%) | 3 (1.6%) |
| 40 to 44 Minutes | 7 (2.8%) | 9 (4.8%) |
| 45 to 59 Minutes | 4 (1.6%) | 5 (2.7%) |
| 60 to 89 Minutes | 0 (0.0%) | 14 (7.4%) |
| 90 or more Minutes | 8 (3.2%) | 0 (0.0%) |
Time of Departure to Work by Sex in Frankford
The most frequent times of departure to work in Frankford are 12:00 PM to 3:59 PM (90, 36.0%) for males and 7:00 AM to 7:29 AM (61, 32.5%) for females.
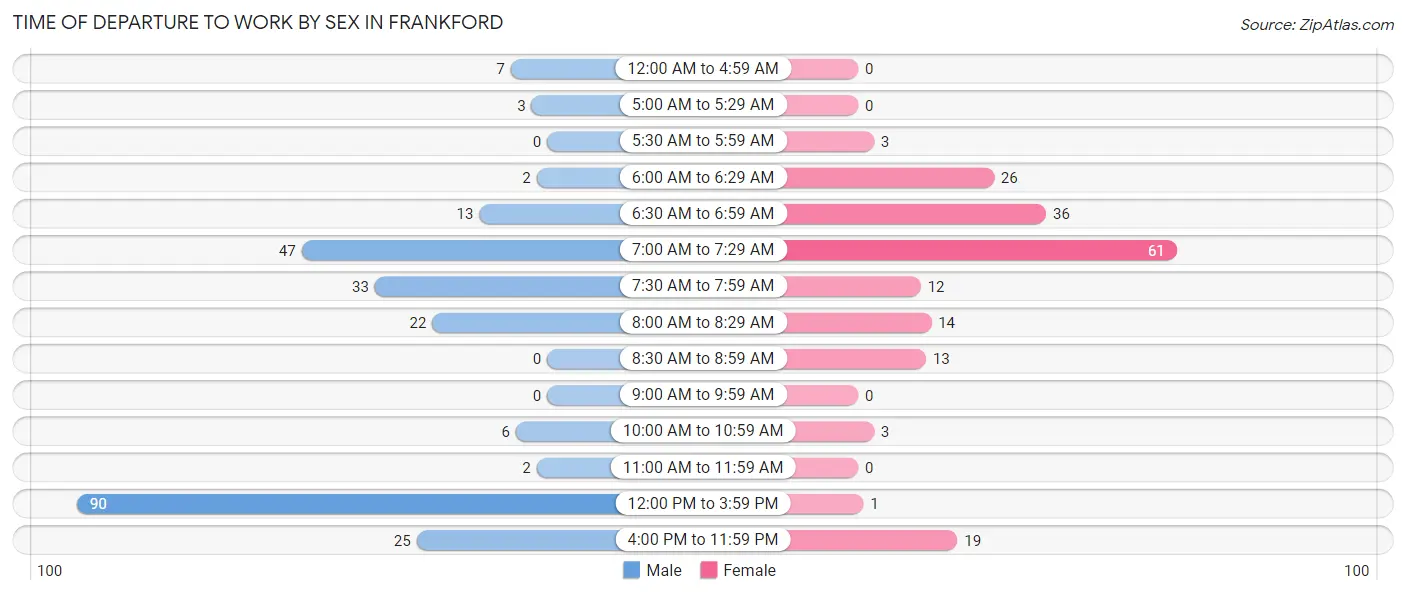
| Time of Departure | Male | Female |
| 12:00 AM to 4:59 AM | 7 (2.8%) | 0 (0.0%) |
| 5:00 AM to 5:29 AM | 3 (1.2%) | 0 (0.0%) |
| 5:30 AM to 5:59 AM | 0 (0.0%) | 3 (1.6%) |
| 6:00 AM to 6:29 AM | 2 (0.8%) | 26 (13.8%) |
| 6:30 AM to 6:59 AM | 13 (5.2%) | 36 (19.2%) |
| 7:00 AM to 7:29 AM | 47 (18.8%) | 61 (32.5%) |
| 7:30 AM to 7:59 AM | 33 (13.2%) | 12 (6.4%) |
| 8:00 AM to 8:29 AM | 22 (8.8%) | 14 (7.4%) |
| 8:30 AM to 8:59 AM | 0 (0.0%) | 13 (6.9%) |
| 9:00 AM to 9:59 AM | 0 (0.0%) | 0 (0.0%) |
| 10:00 AM to 10:59 AM | 6 (2.4%) | 3 (1.6%) |
| 11:00 AM to 11:59 AM | 2 (0.8%) | 0 (0.0%) |
| 12:00 PM to 3:59 PM | 90 (36.0%) | 1 (0.5%) |
| 4:00 PM to 11:59 PM | 25 (10.0%) | 19 (10.1%) |
| Total | 250 (100.0%) | 188 (100.0%) |
Housing Occupancy in Frankford
Occupancy by Ownership in Frankford
Of the total 245 dwellings in Frankford, owner-occupied units account for 147 (60.0%), while renter-occupied units make up 98 (40.0%).
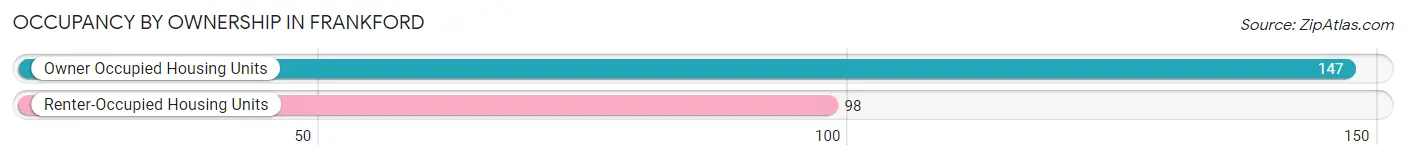
| Occupancy | # Housing Units | % Housing Units |
| Owner Occupied Housing Units | 147 | 60.0% |
| Renter-Occupied Housing Units | 98 | 40.0% |
| Total Occupied Housing Units | 245 | 100.0% |
Occupancy by Household Size in Frankford
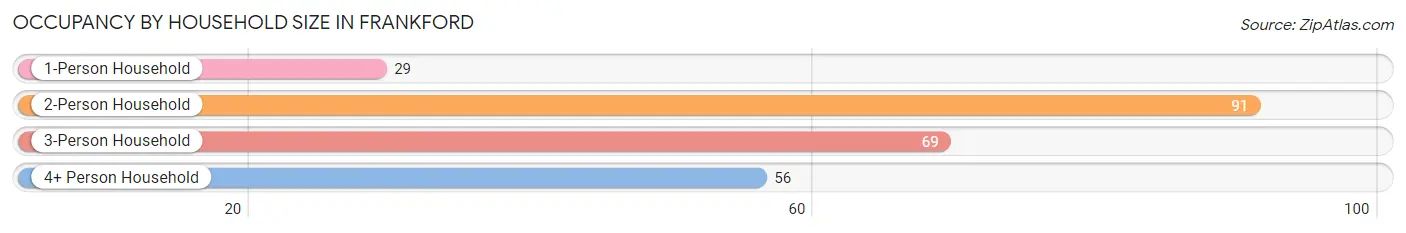
| Household Size | # Housing Units | % Housing Units |
| 1-Person Household | 29 | 11.8% |
| 2-Person Household | 91 | 37.1% |
| 3-Person Household | 69 | 28.2% |
| 4+ Person Household | 56 | 22.9% |
| Total Housing Units | 245 | 100.0% |
Occupancy by Ownership by Household Size in Frankford
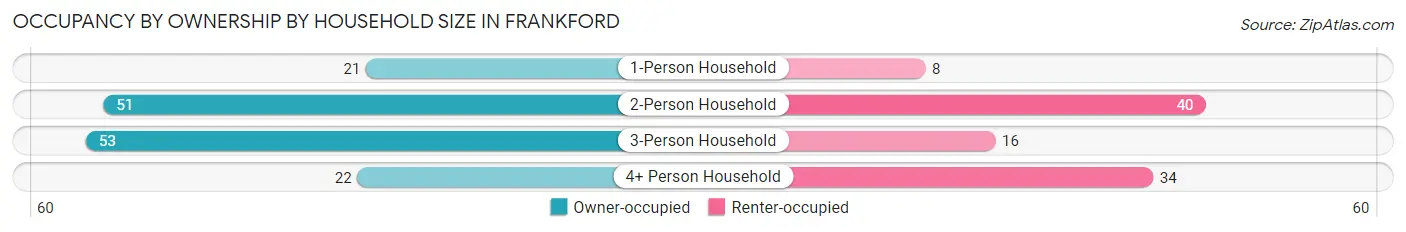
| Household Size | Owner-occupied | Renter-occupied |
| 1-Person Household | 21 (72.4%) | 8 (27.6%) |
| 2-Person Household | 51 (56.0%) | 40 (44.0%) |
| 3-Person Household | 53 (76.8%) | 16 (23.2%) |
| 4+ Person Household | 22 (39.3%) | 34 (60.7%) |
| Total Housing Units | 147 (60.0%) | 98 (40.0%) |
Occupancy by Educational Attainment in Frankford
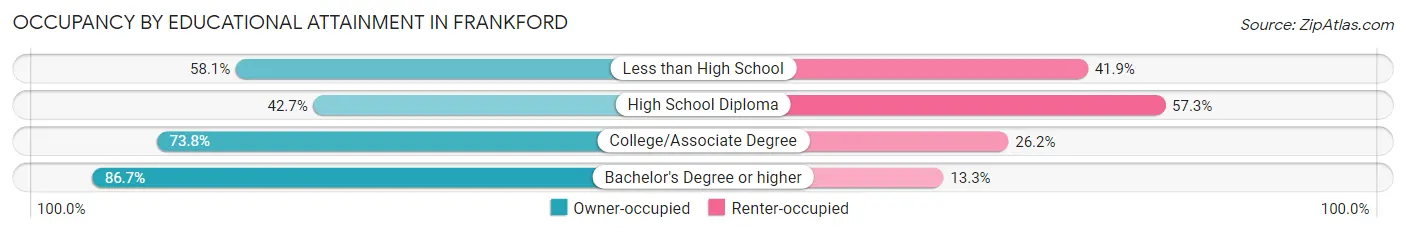
| Household Size | Owner-occupied | Renter-occupied |
| Less than High School | 36 (58.1%) | 26 (41.9%) |
| High School Diploma | 41 (42.7%) | 55 (57.3%) |
| College/Associate Degree | 31 (73.8%) | 11 (26.2%) |
| Bachelor's Degree or higher | 39 (86.7%) | 6 (13.3%) |
Occupancy by Age of Householder in Frankford
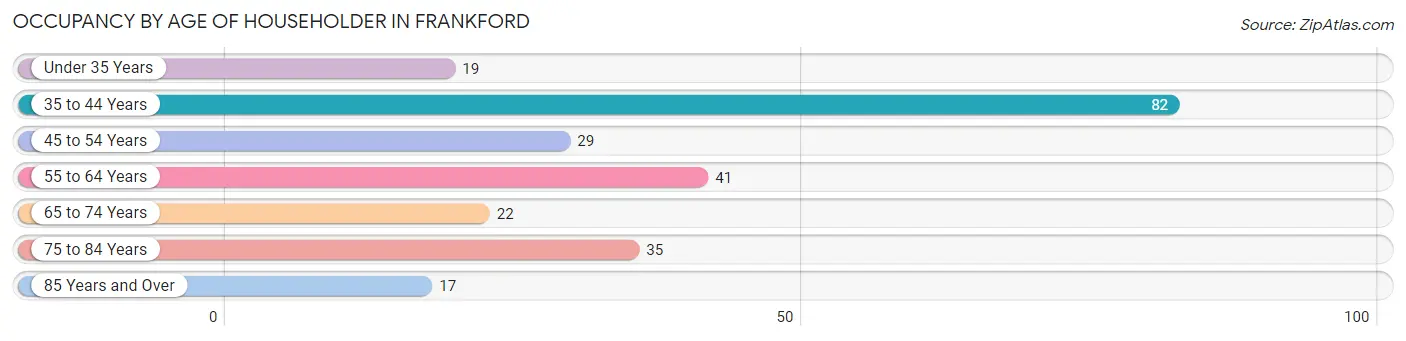
| Age Bracket | # Households | % Households |
| Under 35 Years | 19 | 7.8% |
| 35 to 44 Years | 82 | 33.5% |
| 45 to 54 Years | 29 | 11.8% |
| 55 to 64 Years | 41 | 16.7% |
| 65 to 74 Years | 22 | 9.0% |
| 75 to 84 Years | 35 | 14.3% |
| 85 Years and Over | 17 | 6.9% |
| Total | 245 | 100.0% |
Housing Finances in Frankford
Median Income by Occupancy in Frankford
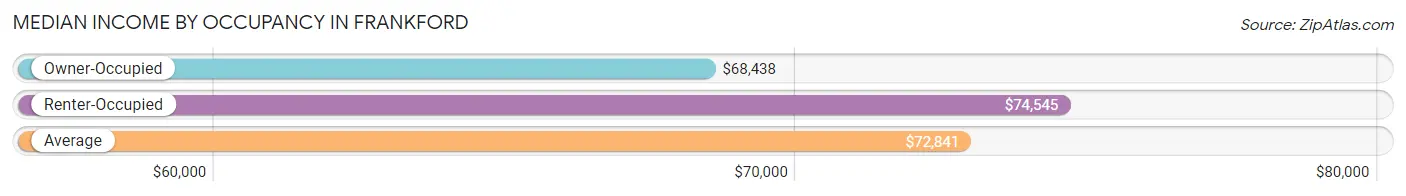
| Occupancy Type | # Households | Median Income |
| Owner-Occupied | 147 (60.0%) | $68,438 |
| Renter-Occupied | 98 (40.0%) | $74,545 |
| Average | 245 (100.0%) | $72,841 |
Occupancy by Householder Income Bracket in Frankford
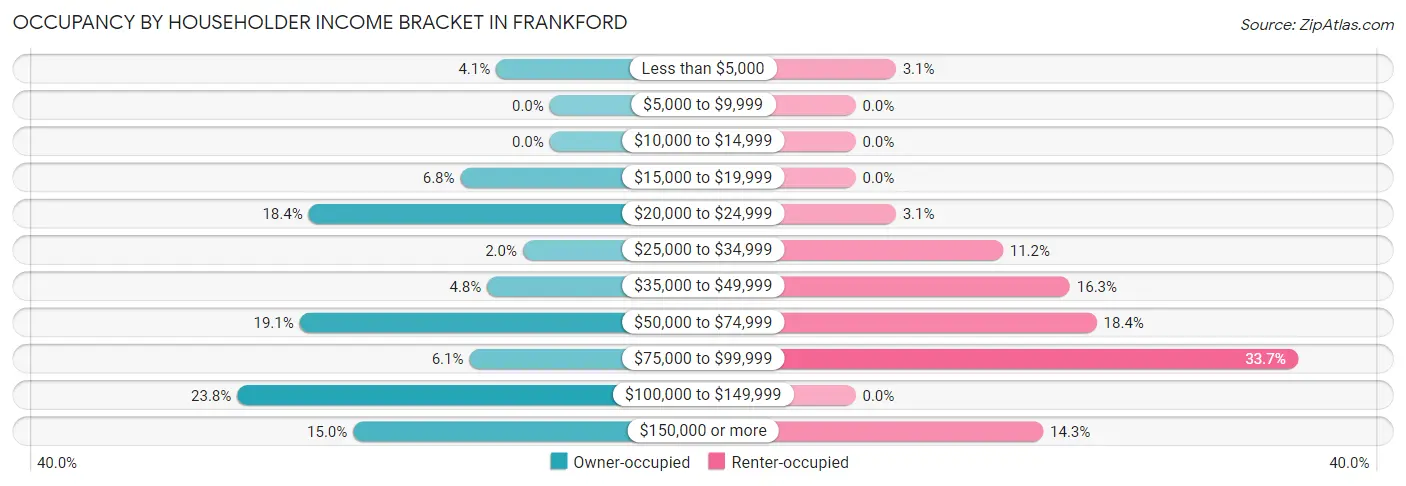
| Income Bracket | Owner-occupied | Renter-occupied |
| Less than $5,000 | 6 (4.1%) | 3 (3.1%) |
| $5,000 to $9,999 | 0 (0.0%) | 0 (0.0%) |
| $10,000 to $14,999 | 0 (0.0%) | 0 (0.0%) |
| $15,000 to $19,999 | 10 (6.8%) | 0 (0.0%) |
| $20,000 to $24,999 | 27 (18.4%) | 3 (3.1%) |
| $25,000 to $34,999 | 3 (2.0%) | 11 (11.2%) |
| $35,000 to $49,999 | 7 (4.8%) | 16 (16.3%) |
| $50,000 to $74,999 | 28 (19.1%) | 18 (18.4%) |
| $75,000 to $99,999 | 9 (6.1%) | 33 (33.7%) |
| $100,000 to $149,999 | 35 (23.8%) | 0 (0.0%) |
| $150,000 or more | 22 (15.0%) | 14 (14.3%) |
| Total | 147 (100.0%) | 98 (100.0%) |
Monthly Housing Cost Tiers in Frankford
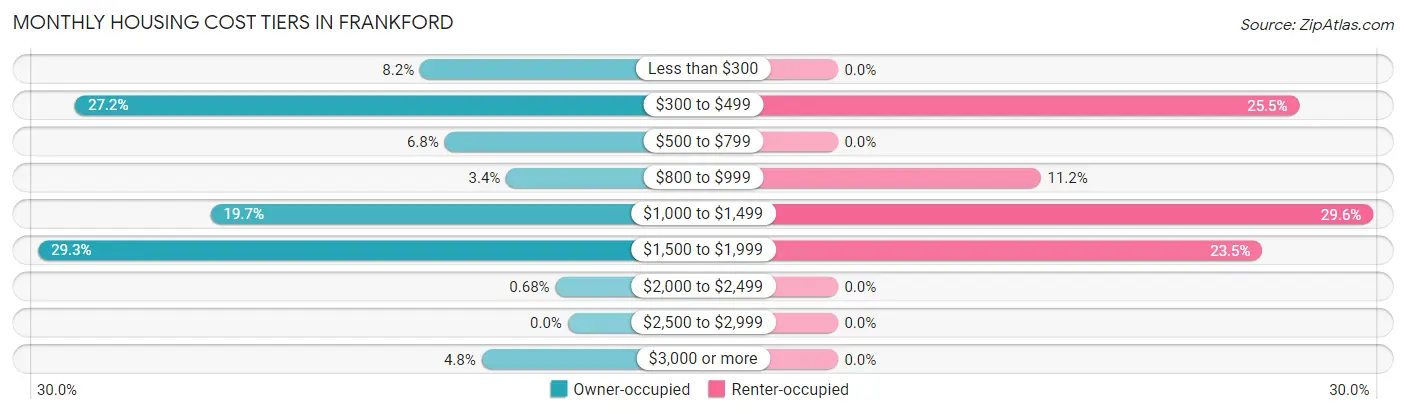
| Monthly Cost | Owner-occupied | Renter-occupied |
| Less than $300 | 12 (8.2%) | 0 (0.0%) |
| $300 to $499 | 40 (27.2%) | 25 (25.5%) |
| $500 to $799 | 10 (6.8%) | 0 (0.0%) |
| $800 to $999 | 5 (3.4%) | 11 (11.2%) |
| $1,000 to $1,499 | 29 (19.7%) | 29 (29.6%) |
| $1,500 to $1,999 | 43 (29.2%) | 23 (23.5%) |
| $2,000 to $2,499 | 1 (0.7%) | 0 (0.0%) |
| $2,500 to $2,999 | 0 (0.0%) | 0 (0.0%) |
| $3,000 or more | 7 (4.8%) | 0 (0.0%) |
| Total | 147 (100.0%) | 98 (100.0%) |
Physical Housing Characteristics in Frankford
Housing Structures in Frankford
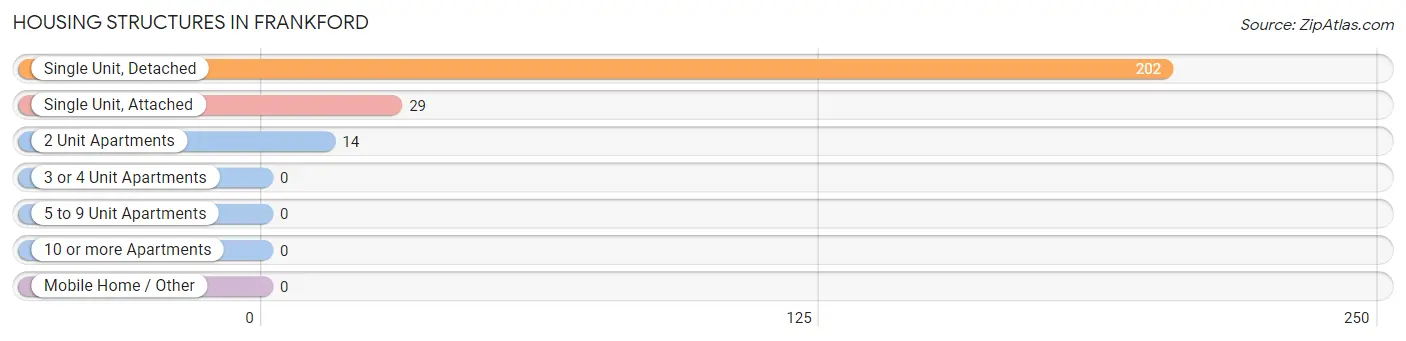
| Structure Type | # Housing Units | % Housing Units |
| Single Unit, Detached | 202 | 82.5% |
| Single Unit, Attached | 29 | 11.8% |
| 2 Unit Apartments | 14 | 5.7% |
| 3 or 4 Unit Apartments | 0 | 0.0% |
| 5 to 9 Unit Apartments | 0 | 0.0% |
| 10 or more Apartments | 0 | 0.0% |
| Mobile Home / Other | 0 | 0.0% |
| Total | 245 | 100.0% |
Housing Structures by Occupancy in Frankford
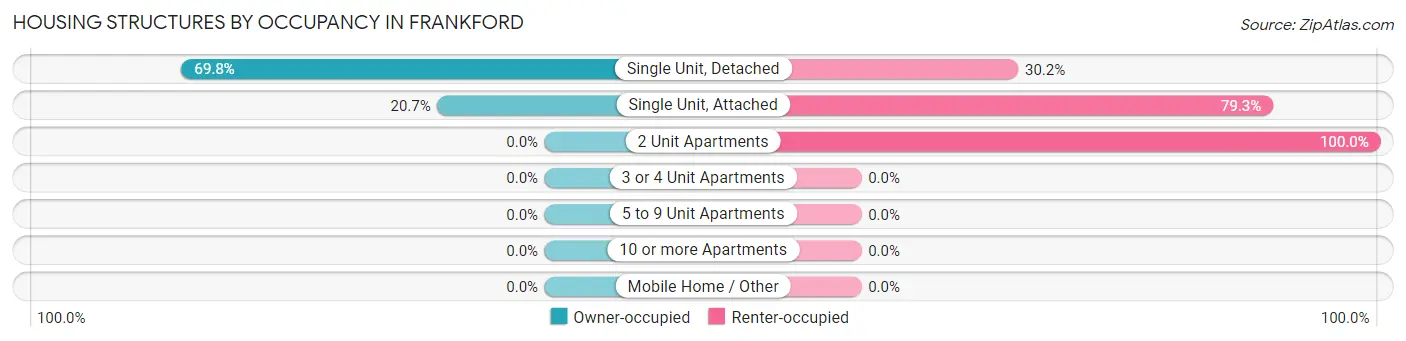
| Structure Type | Owner-occupied | Renter-occupied |
| Single Unit, Detached | 141 (69.8%) | 61 (30.2%) |
| Single Unit, Attached | 6 (20.7%) | 23 (79.3%) |
| 2 Unit Apartments | 0 (0.0%) | 14 (100.0%) |
| 3 or 4 Unit Apartments | 0 (0.0%) | 0 (0.0%) |
| 5 to 9 Unit Apartments | 0 (0.0%) | 0 (0.0%) |
| 10 or more Apartments | 0 (0.0%) | 0 (0.0%) |
| Mobile Home / Other | 0 (0.0%) | 0 (0.0%) |
| Total | 147 (60.0%) | 98 (40.0%) |
Housing Structures by Number of Rooms in Frankford
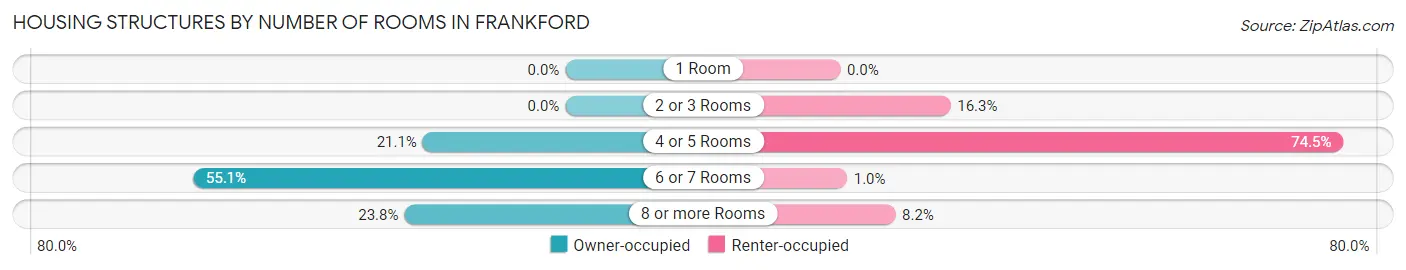
| Number of Rooms | Owner-occupied | Renter-occupied |
| 1 Room | 0 (0.0%) | 0 (0.0%) |
| 2 or 3 Rooms | 0 (0.0%) | 16 (16.3%) |
| 4 or 5 Rooms | 31 (21.1%) | 73 (74.5%) |
| 6 or 7 Rooms | 81 (55.1%) | 1 (1.0%) |
| 8 or more Rooms | 35 (23.8%) | 8 (8.2%) |
| Total | 147 (100.0%) | 98 (100.0%) |
Housing Structure by Heating Type in Frankford
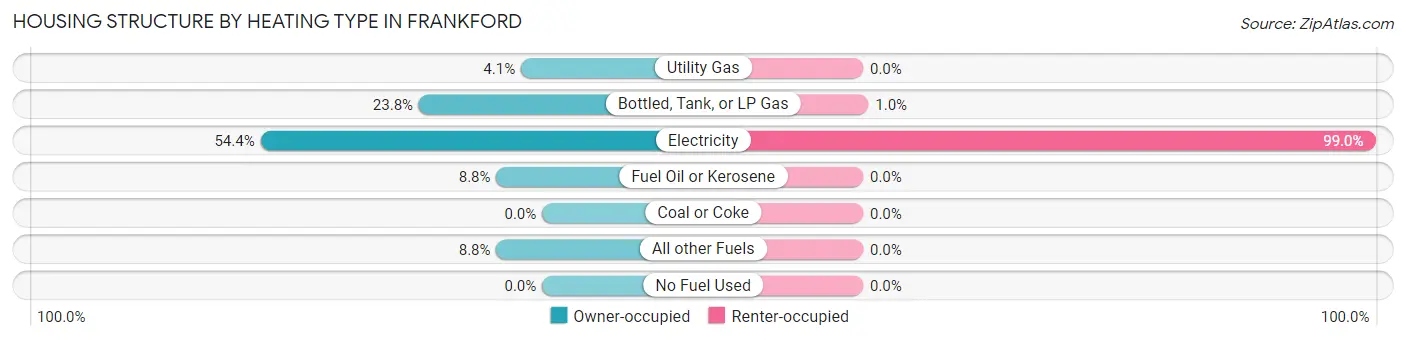
| Heating Type | Owner-occupied | Renter-occupied |
| Utility Gas | 6 (4.1%) | 0 (0.0%) |
| Bottled, Tank, or LP Gas | 35 (23.8%) | 1 (1.0%) |
| Electricity | 80 (54.4%) | 97 (99.0%) |
| Fuel Oil or Kerosene | 13 (8.8%) | 0 (0.0%) |
| Coal or Coke | 0 (0.0%) | 0 (0.0%) |
| All other Fuels | 13 (8.8%) | 0 (0.0%) |
| No Fuel Used | 0 (0.0%) | 0 (0.0%) |
| Total | 147 (100.0%) | 98 (100.0%) |
Household Vehicle Usage in Frankford
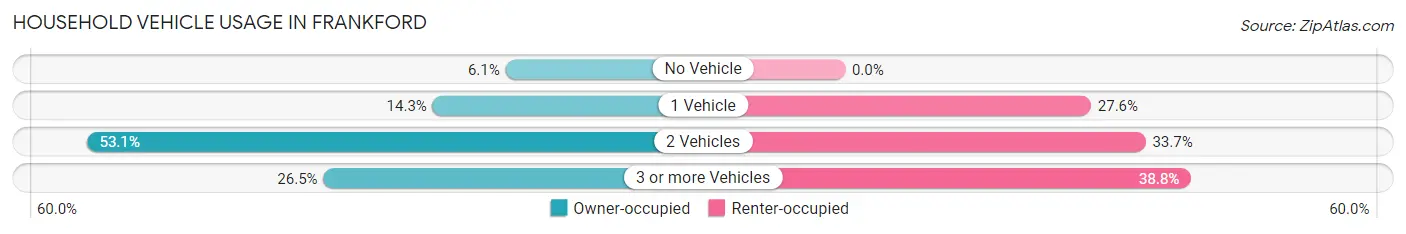
| Vehicles per Household | Owner-occupied | Renter-occupied |
| No Vehicle | 9 (6.1%) | 0 (0.0%) |
| 1 Vehicle | 21 (14.3%) | 27 (27.6%) |
| 2 Vehicles | 78 (53.1%) | 33 (33.7%) |
| 3 or more Vehicles | 39 (26.5%) | 38 (38.8%) |
| Total | 147 (100.0%) | 98 (100.0%) |
Real Estate & Mortgages in Frankford
Real Estate and Mortgage Overview in Frankford
| Characteristic | Without Mortgage | With Mortgage |
| Housing Units | 64 | 83 |
| Median Property Value | $164,300 | $289,600 |
| Median Household Income | $21,818 | $20 |
| Monthly Housing Costs | $409 | $7 |
| Real Estate Taxes | $437 | $1 |
Property Value by Mortgage Status in Frankford
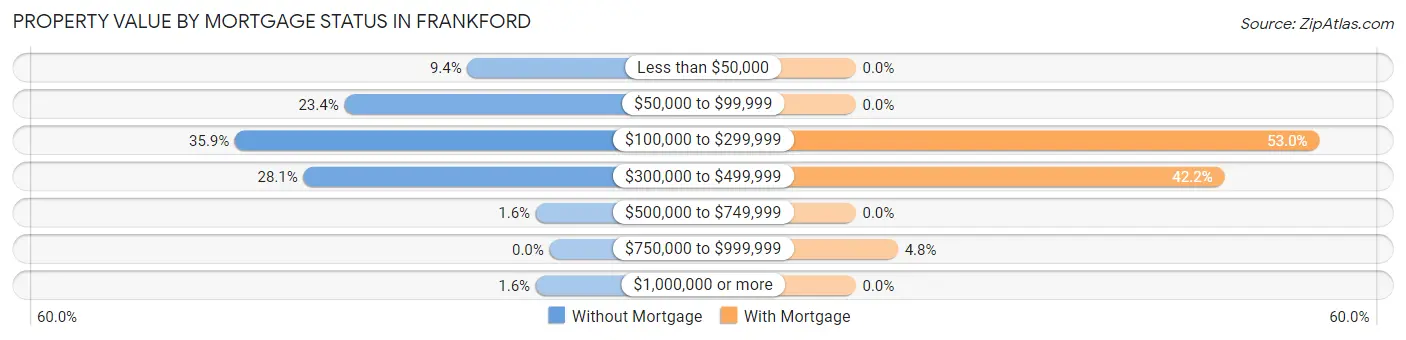
| Property Value | Without Mortgage | With Mortgage |
| Less than $50,000 | 6 (9.4%) | 0 (0.0%) |
| $50,000 to $99,999 | 15 (23.4%) | 0 (0.0%) |
| $100,000 to $299,999 | 23 (35.9%) | 44 (53.0%) |
| $300,000 to $499,999 | 18 (28.1%) | 35 (42.2%) |
| $500,000 to $749,999 | 1 (1.6%) | 0 (0.0%) |
| $750,000 to $999,999 | 0 (0.0%) | 4 (4.8%) |
| $1,000,000 or more | 1 (1.6%) | 0 (0.0%) |
| Total | 64 (100.0%) | 83 (100.0%) |
Household Income by Mortgage Status in Frankford
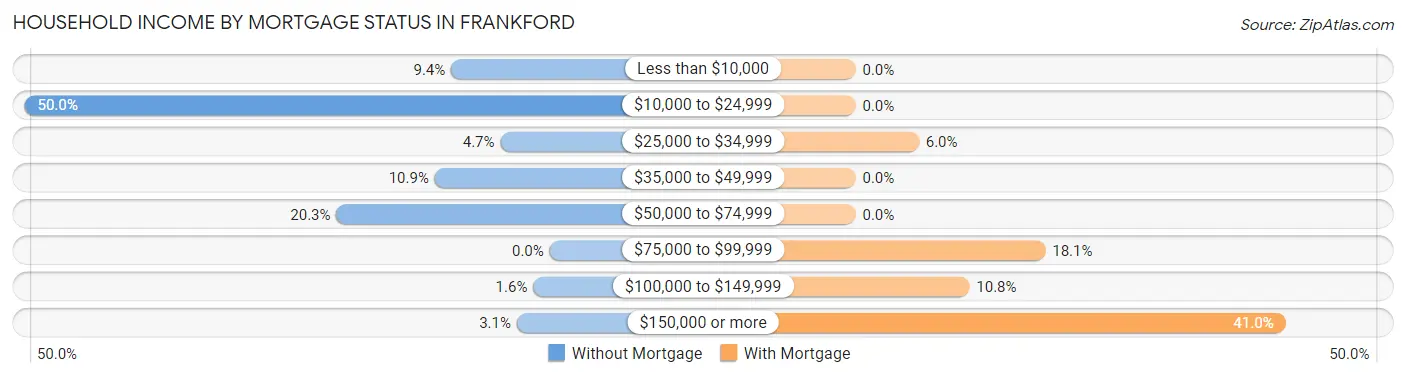
| Household Income | Without Mortgage | With Mortgage |
| Less than $10,000 | 6 (9.4%) | 0 (0.0%) |
| $10,000 to $24,999 | 32 (50.0%) | 0 (0.0%) |
| $25,000 to $34,999 | 3 (4.7%) | 5 (6.0%) |
| $35,000 to $49,999 | 7 (10.9%) | 0 (0.0%) |
| $50,000 to $74,999 | 13 (20.3%) | 0 (0.0%) |
| $75,000 to $99,999 | 0 (0.0%) | 15 (18.1%) |
| $100,000 to $149,999 | 1 (1.6%) | 9 (10.8%) |
| $150,000 or more | 2 (3.1%) | 34 (41.0%) |
| Total | 64 (100.0%) | 83 (100.0%) |
Property Value to Household Income Ratio in Frankford
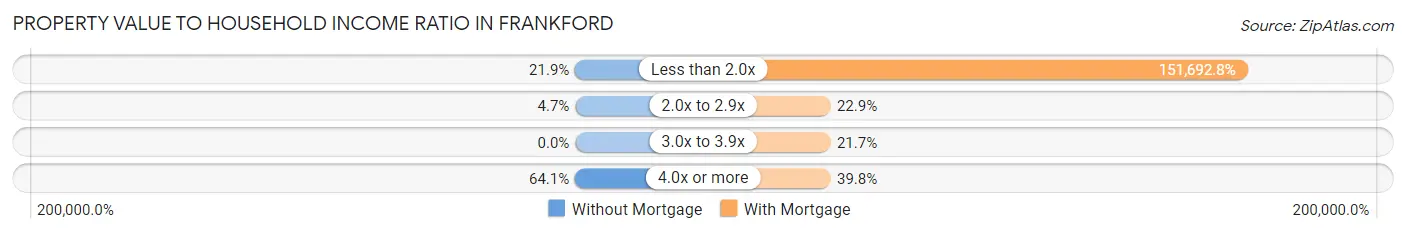
| Value-to-Income Ratio | Without Mortgage | With Mortgage |
| Less than 2.0x | 14 (21.9%) | 125,905 (151,692.8%) |
| 2.0x to 2.9x | 3 (4.7%) | 19 (22.9%) |
| 3.0x to 3.9x | 0 (0.0%) | 18 (21.7%) |
| 4.0x or more | 41 (64.1%) | 33 (39.8%) |
| Total | 64 (100.0%) | 83 (100.0%) |
Real Estate Taxes by Mortgage Status in Frankford
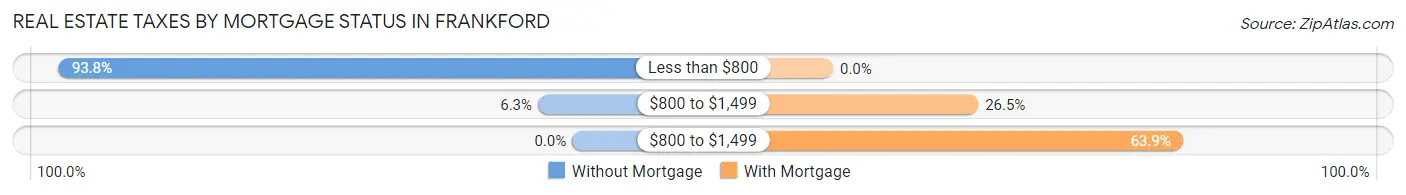
| Property Taxes | Without Mortgage | With Mortgage |
| Less than $800 | 60 (93.8%) | 0 (0.0%) |
| $800 to $1,499 | 4 (6.2%) | 22 (26.5%) |
| $800 to $1,499 | 0 (0.0%) | 53 (63.9%) |
| Total | 64 (100.0%) | 83 (100.0%) |
Health & Disability in Frankford
Health Insurance Coverage by Age in Frankford
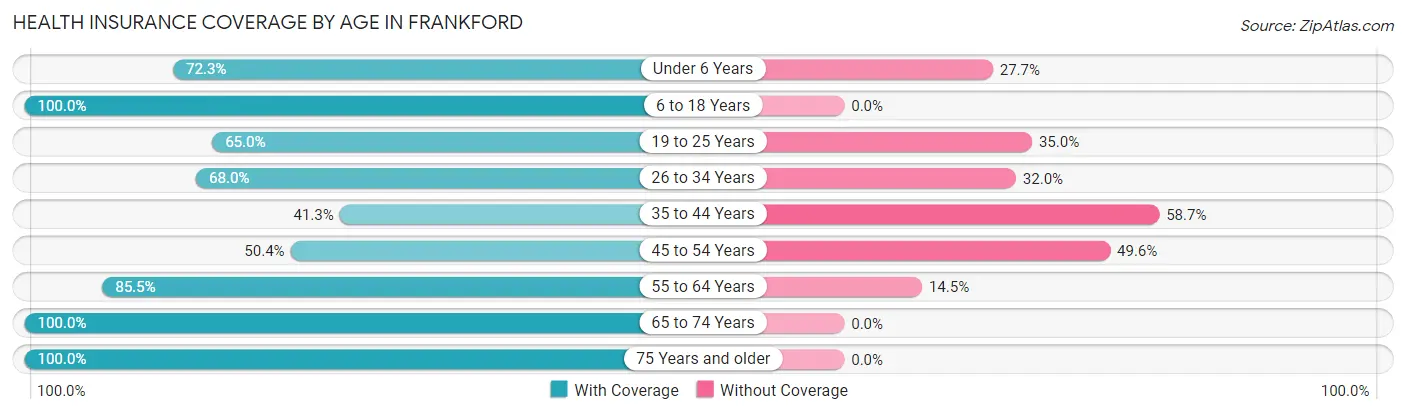
| Age Bracket | With Coverage | Without Coverage |
| Under 6 Years | 47 (72.3%) | 18 (27.7%) |
| 6 to 18 Years | 210 (100.0%) | 0 (0.0%) |
| 19 to 25 Years | 13 (65.0%) | 7 (35.0%) |
| 26 to 34 Years | 85 (68.0%) | 40 (32.0%) |
| 35 to 44 Years | 52 (41.3%) | 74 (58.7%) |
| 45 to 54 Years | 58 (50.4%) | 57 (49.6%) |
| 55 to 64 Years | 59 (85.5%) | 10 (14.5%) |
| 65 to 74 Years | 36 (100.0%) | 0 (0.0%) |
| 75 Years and older | 76 (100.0%) | 0 (0.0%) |
| Total | 636 (75.5%) | 206 (24.5%) |
Health Insurance Coverage by Citizenship Status in Frankford
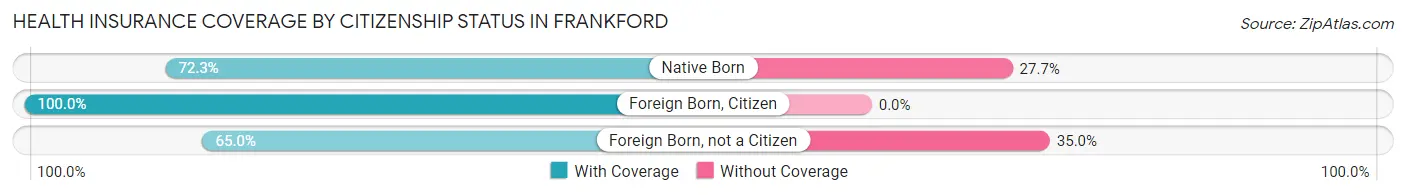
| Citizenship Status | With Coverage | Without Coverage |
| Native Born | 47 (72.3%) | 18 (27.7%) |
| Foreign Born, Citizen | 210 (100.0%) | 0 (0.0%) |
| Foreign Born, not a Citizen | 13 (65.0%) | 7 (35.0%) |
Health Insurance Coverage by Household Income in Frankford
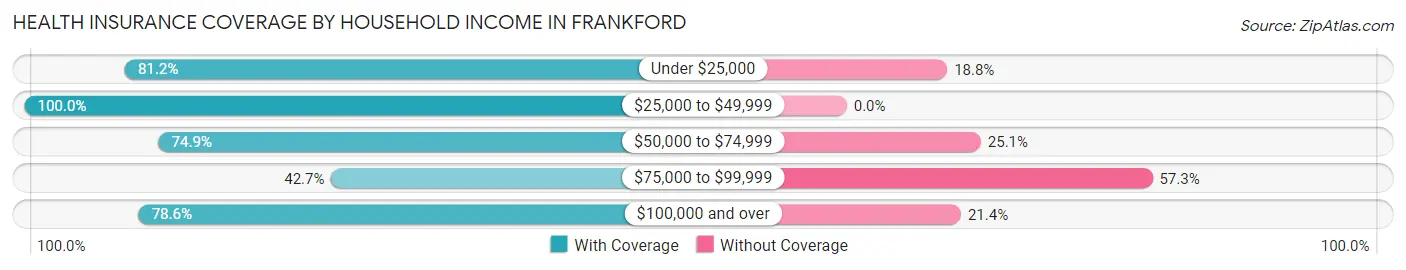
| Household Income | With Coverage | Without Coverage |
| Under $25,000 | 82 (81.2%) | 19 (18.8%) |
| $25,000 to $49,999 | 87 (100.0%) | 0 (0.0%) |
| $50,000 to $74,999 | 158 (74.9%) | 53 (25.1%) |
| $75,000 to $99,999 | 47 (42.7%) | 63 (57.3%) |
| $100,000 and over | 261 (78.6%) | 71 (21.4%) |
Public vs Private Health Insurance Coverage by Age in Frankford
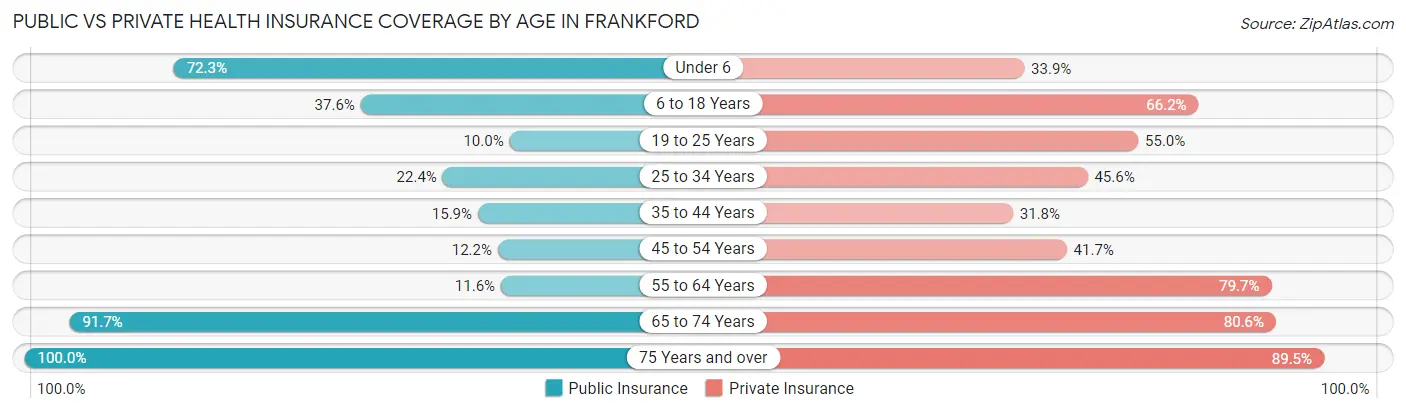
| Age Bracket | Public Insurance | Private Insurance |
| Under 6 | 47 (72.3%) | 22 (33.9%) |
| 6 to 18 Years | 79 (37.6%) | 139 (66.2%) |
| 19 to 25 Years | 2 (10.0%) | 11 (55.0%) |
| 25 to 34 Years | 28 (22.4%) | 57 (45.6%) |
| 35 to 44 Years | 20 (15.9%) | 40 (31.8%) |
| 45 to 54 Years | 14 (12.2%) | 48 (41.7%) |
| 55 to 64 Years | 8 (11.6%) | 55 (79.7%) |
| 65 to 74 Years | 33 (91.7%) | 29 (80.6%) |
| 75 Years and over | 76 (100.0%) | 68 (89.5%) |
| Total | 307 (36.5%) | 469 (55.7%) |
Disability Status by Sex by Age in Frankford
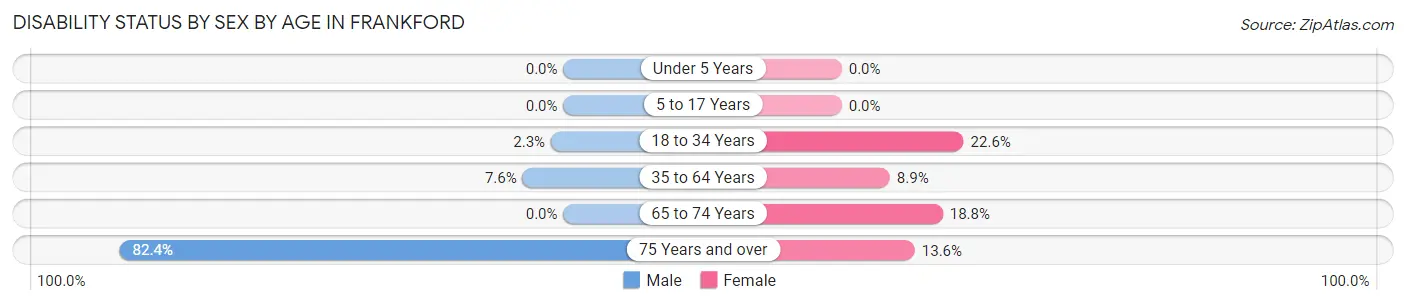
| Age Bracket | Male | Female |
| Under 5 Years | 0 (0.0%) | 0 (0.0%) |
| 5 to 17 Years | 0 (0.0%) | 0 (0.0%) |
| 18 to 34 Years | 2 (2.3%) | 19 (22.6%) |
| 35 to 64 Years | 15 (7.6%) | 10 (8.9%) |
| 65 to 74 Years | 0 (0.0%) | 3 (18.8%) |
| 75 Years and over | 14 (82.4%) | 8 (13.6%) |
Disability Class by Sex by Age in Frankford
Disability Class: Hearing Difficulty
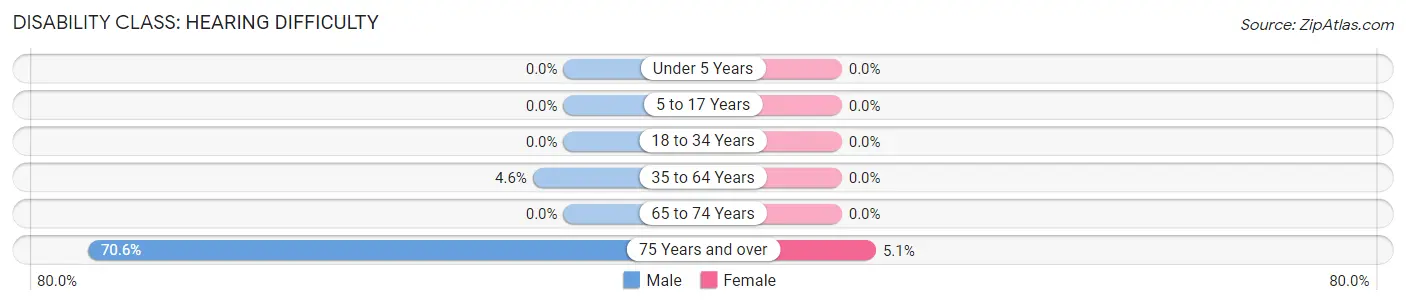
| Age Bracket | Male | Female |
| Under 5 Years | 0 (0.0%) | 0 (0.0%) |
| 5 to 17 Years | 0 (0.0%) | 0 (0.0%) |
| 18 to 34 Years | 0 (0.0%) | 0 (0.0%) |
| 35 to 64 Years | 9 (4.5%) | 0 (0.0%) |
| 65 to 74 Years | 0 (0.0%) | 0 (0.0%) |
| 75 Years and over | 12 (70.6%) | 3 (5.1%) |
Disability Class: Vision Difficulty
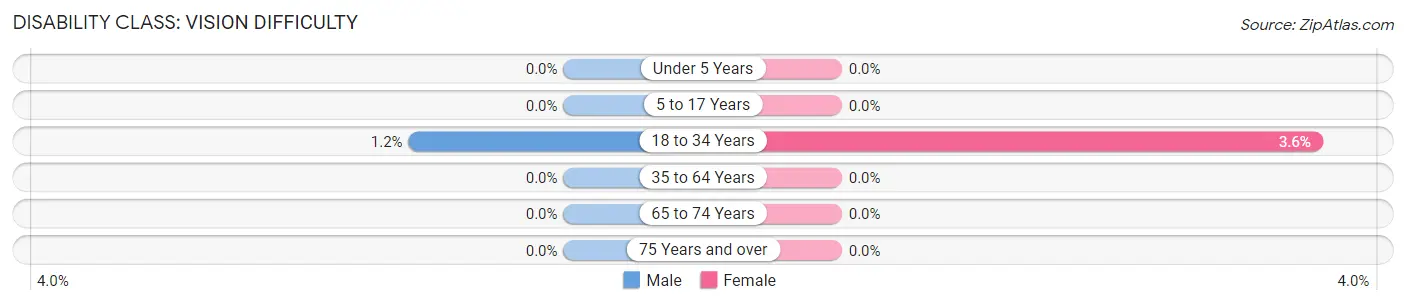
| Age Bracket | Male | Female |
| Under 5 Years | 0 (0.0%) | 0 (0.0%) |
| 5 to 17 Years | 0 (0.0%) | 0 (0.0%) |
| 18 to 34 Years | 1 (1.1%) | 3 (3.6%) |
| 35 to 64 Years | 0 (0.0%) | 0 (0.0%) |
| 65 to 74 Years | 0 (0.0%) | 0 (0.0%) |
| 75 Years and over | 0 (0.0%) | 0 (0.0%) |
Disability Class: Cognitive Difficulty
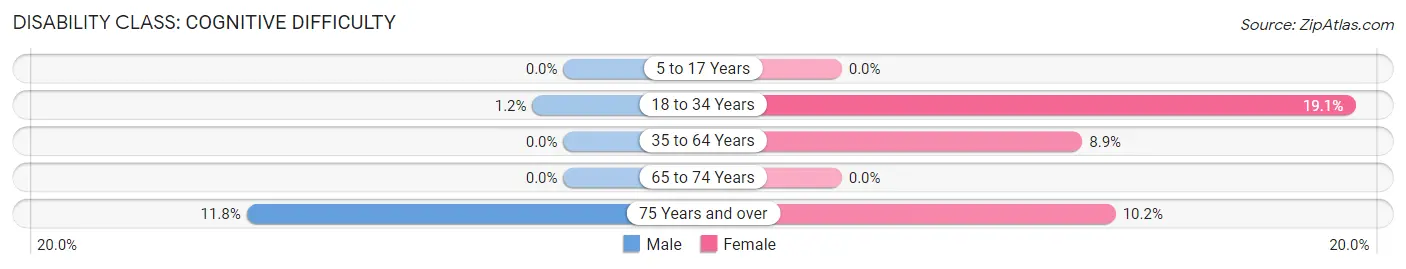
| Age Bracket | Male | Female |
| 5 to 17 Years | 0 (0.0%) | 0 (0.0%) |
| 18 to 34 Years | 1 (1.1%) | 16 (19.1%) |
| 35 to 64 Years | 0 (0.0%) | 10 (8.9%) |
| 65 to 74 Years | 0 (0.0%) | 0 (0.0%) |
| 75 Years and over | 2 (11.8%) | 6 (10.2%) |
Disability Class: Ambulatory Difficulty
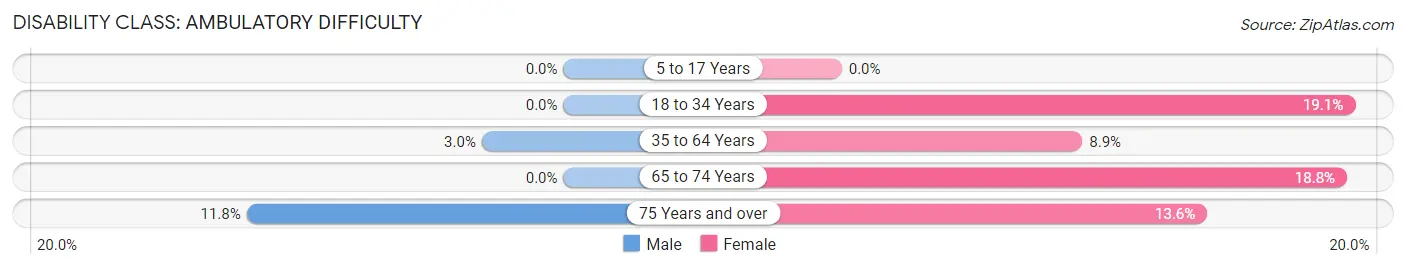
| Age Bracket | Male | Female |
| 5 to 17 Years | 0 (0.0%) | 0 (0.0%) |
| 18 to 34 Years | 0 (0.0%) | 16 (19.1%) |
| 35 to 64 Years | 6 (3.0%) | 10 (8.9%) |
| 65 to 74 Years | 0 (0.0%) | 3 (18.8%) |
| 75 Years and over | 2 (11.8%) | 8 (13.6%) |
Disability Class: Self-Care Difficulty
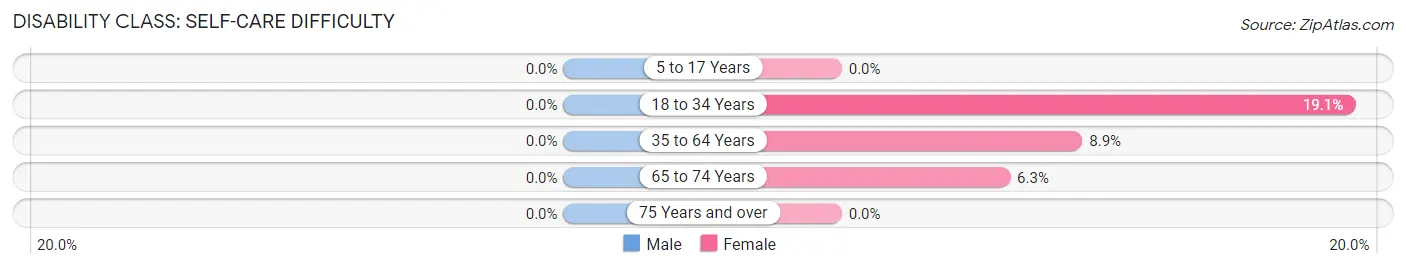
| Age Bracket | Male | Female |
| 5 to 17 Years | 0 (0.0%) | 0 (0.0%) |
| 18 to 34 Years | 0 (0.0%) | 16 (19.1%) |
| 35 to 64 Years | 0 (0.0%) | 10 (8.9%) |
| 65 to 74 Years | 0 (0.0%) | 1 (6.2%) |
| 75 Years and over | 0 (0.0%) | 0 (0.0%) |
Technology Access in Frankford
Computing Device Access in Frankford
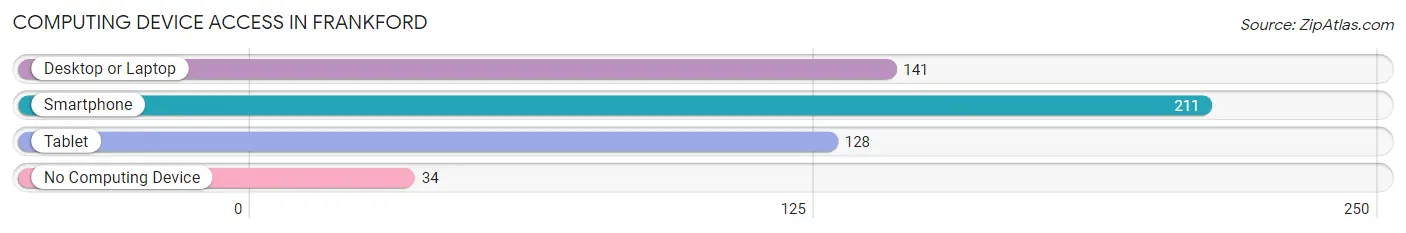
| Device Type | # Households | % Households |
| Desktop or Laptop | 141 | 57.6% |
| Smartphone | 211 | 86.1% |
| Tablet | 128 | 52.2% |
| No Computing Device | 34 | 13.9% |
| Total | 245 | 100.0% |
Internet Access in Frankford
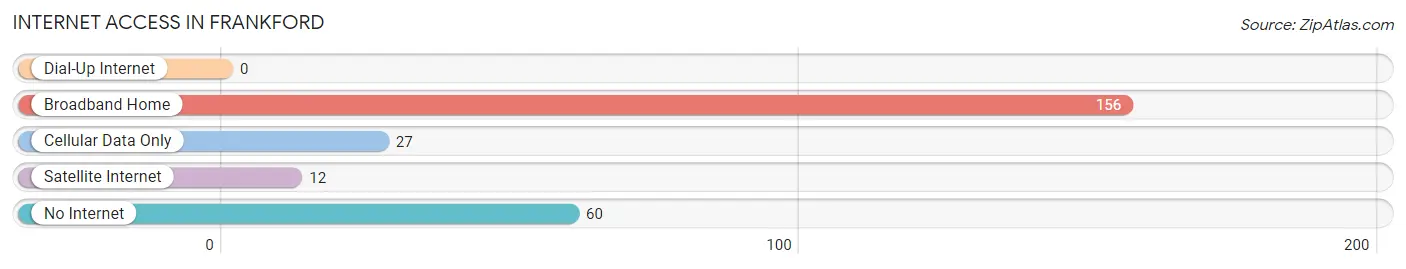
| Internet Type | # Households | % Households |
| Dial-Up Internet | 0 | 0.0% |
| Broadband Home | 156 | 63.7% |
| Cellular Data Only | 27 | 11.0% |
| Satellite Internet | 12 | 4.9% |
| No Internet | 60 | 24.5% |
| Total | 245 | 100.0% |
Frankford Summary
Frankford, Delaware is a small town located in Sussex County, Delaware. It is located on the Indian River, which is a tributary of the Nanticoke River. The town was founded in 1790 and is the oldest town in Sussex County. The population of Frankford was 1,717 at the 2010 census.
History
Frankford was founded in 1790 by a group of Quakers from Pennsylvania. The town was named after Francis Frank, a prominent Quaker leader. The town was originally a farming community, but it soon became a center for the lumber industry. The town was also known for its shipbuilding industry, which produced ships for the US Navy during the War of 1812.
In the late 19th century, Frankford became a popular summer resort for wealthy Philadelphians. The town was home to several large hotels, including the Hotel Frankford and the Hotel Sussex. The town also had a large amusement park, which was popular with visitors.
Geography
Frankford is located in southeastern Sussex County, Delaware. It is situated on the Indian River, which is a tributary of the Nanticoke River. The town is bordered by the towns of Dagsboro to the north, Millsboro to the east, and Selbyville to the south. The town is located approximately 30 miles south of Dover, the state capital.
The town has a total area of 2.2 square miles, all of which is land. The town is located in a flat, coastal plain region. The climate is humid subtropical, with hot, humid summers and mild winters.
Economy
The economy of Frankford is largely based on agriculture and tourism. The town is home to several large farms, which produce corn, soybeans, and other crops. The town is also home to several seafood processing plants, which process fish and shellfish for local restaurants and markets.
Tourism is also an important part of the local economy. The town is home to several popular attractions, including the Indian River Marina, the Frankford Historical Society Museum, and the Frankford Amusement Park. The town also hosts several annual festivals, including the Frankford Seafood Festival and the Frankford Arts Festival.
Demographics
As of the 2010 census, the population of Frankford was 1,717. The racial makeup of the town was 87.3% White, 8.2% African American, 0.7% Native American, 0.7% Asian, 0.1% Pacific Islander, and 2.1% from other races. Hispanic or Latino of any race were 2.7% of the population.
The median income for a household in the town was $45,938, and the median income for a family was $51,250. The per capita income for the town was $20,945. About 8.2% of families and 10.2% of the population were below the poverty line, including 14.2% of those under age 18 and 8.3% of those age 65 or over.
Common Questions
What is Per Capita Income in Frankford?
Per Capita income in Frankford is $29,879.
What is the Median Family Income in Frankford?
Median Family Income in Frankford is $85,481.
What is the Median Household income in Frankford?
Median Household Income in Frankford is $72,841.
What is Inequality or Gini Index in Frankford?
Inequality or Gini Index in Frankford is 0.43.
What is the Total Population of Frankford?
Total Population of Frankford is 842.
What is the Total Male Population of Frankford?
Total Male Population of Frankford is 408.
What is the Total Female Population of Frankford?
Total Female Population of Frankford is 434.
What is the Ratio of Males per 100 Females in Frankford?
There are 94.01 Males per 100 Females in Frankford.
What is the Ratio of Females per 100 Males in Frankford?
There are 106.37 Females per 100 Males in Frankford.
What is the Median Population Age in Frankford?
Median Population Age in Frankford is 35.1 Years.
What is the Average Family Size in Frankford
Average Family Size in Frankford is 3.8 People.
What is the Average Household Size in Frankford
Average Household Size in Frankford is 3.4 People.
How Large is the Labor Force in Frankford?
There are 477 People in the Labor Forcein in Frankford.
What is the Percentage of People in the Labor Force in Frankford?
78.3% of People are in the Labor Force in Frankford.
What is the Unemployment Rate in Frankford?
Unemployment Rate in Frankford is 0.8%.