Cats Bridge, VA Map & Demographics
Cats Bridge Map
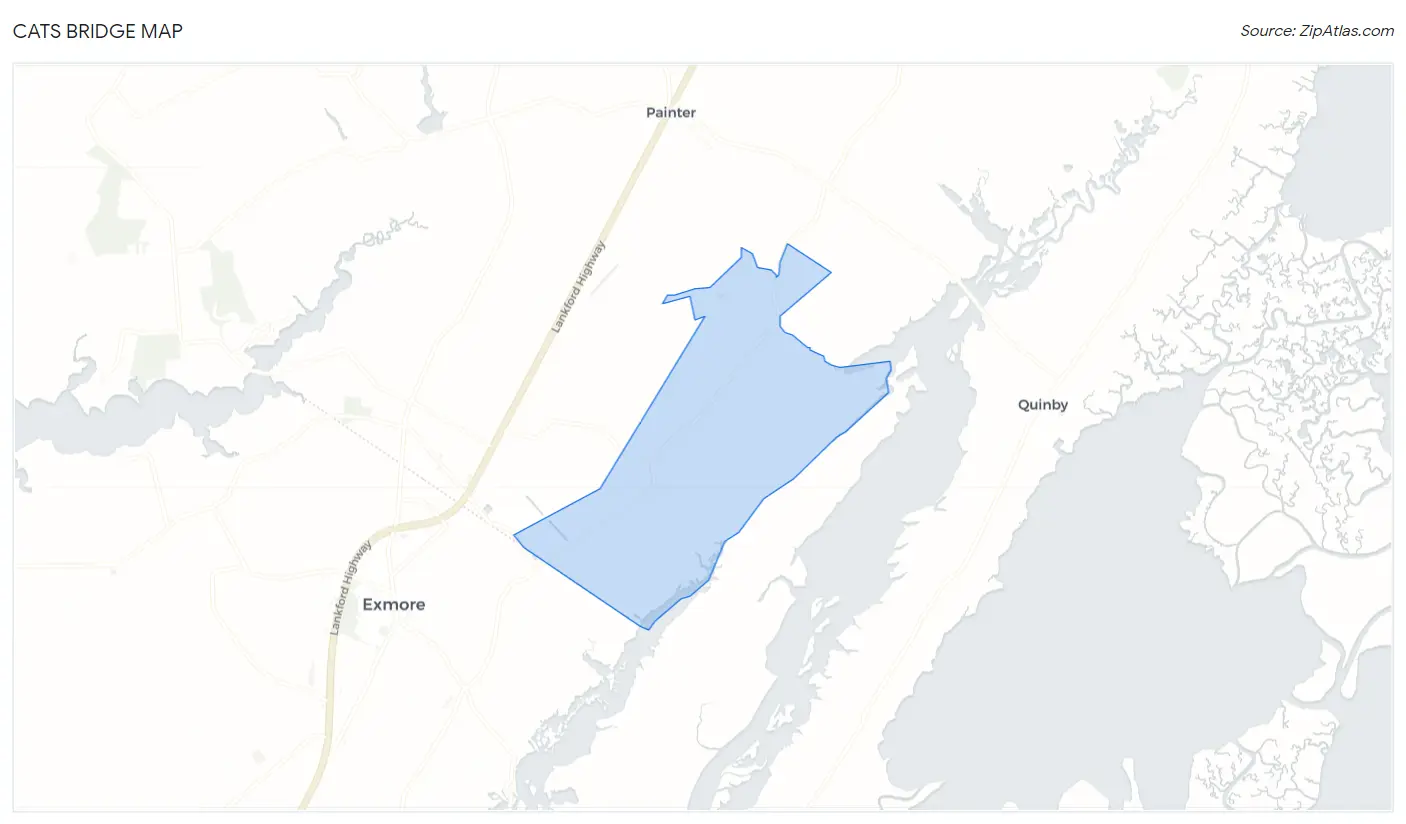
Cats Bridge Overview
$21,650
PER CAPITA INCOME
0.48
INEQUALITY / GINI INDEX
168
TOTAL POPULATION
96
MALE POPULATION
72
FEMALE POPULATION
133.33
MALES / 100 FEMALES
75.00
FEMALES / 100 MALES
47.8
MEDIAN AGE
7.3
AVG FAMILY SIZE
3.0
AVG HOUSEHOLD SIZE
59
LABOR FORCE [ PEOPLE ]
35.1%
PERCENT IN LABOR FORCE
Income in Cats Bridge
Income Overview in Cats Bridge
| Characteristic | Number | Measure |
| Per Capita Income | 168 | $21,650 |
| Median Family Income | 17 | $0 |
| Mean Family Income | 17 | $0 |
| Median Household Income | 56 | $0 |
| Mean Household Income | 56 | $46,536 |
| Income Deficit | 17 | $0 |
| Wage / Income Gap (%) | 168 | 0.00% |
| Wage / Income Gap ($) | 168 | 100.00¢ per $1 |
| Gini / Inequality Index | 168 | 0.48 |
Earnings by Sex in Cats Bridge
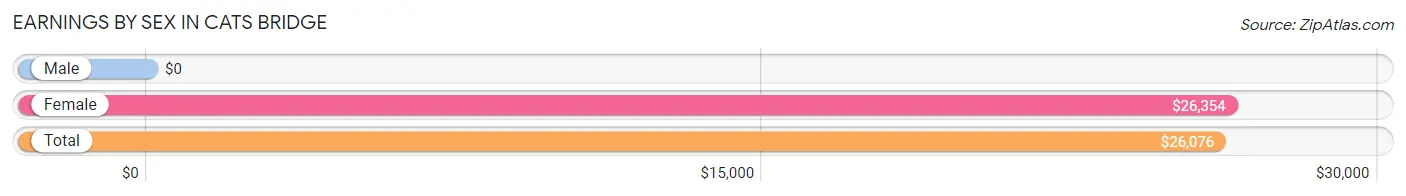
| Sex | Number | Average Earnings |
| Male | 8 (13.6%) | $0 |
| Female | 51 (86.4%) | $26,354 |
| Total | 59 (100.0%) | $26,076 |
Earnings by Sex by Income Bracket in Cats Bridge
The most common earnings brackets in Cats Bridge are $22,500 to $24,999 for men (8 | 100.0%) and $25,000 to $29,999 for women (36 | 70.6%).
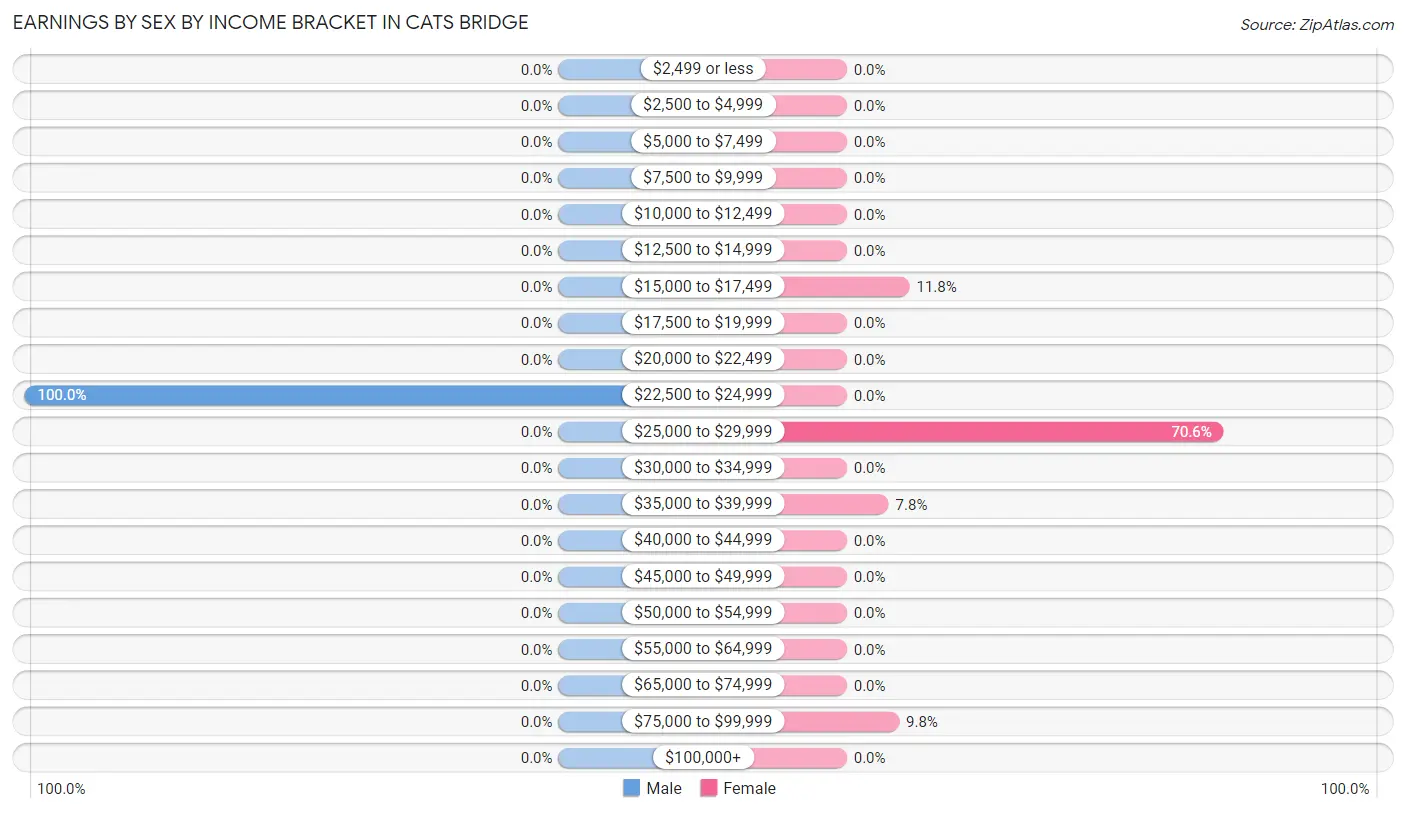
| Income | Male | Female |
| $2,499 or less | 0 (0.0%) | 0 (0.0%) |
| $2,500 to $4,999 | 0 (0.0%) | 0 (0.0%) |
| $5,000 to $7,499 | 0 (0.0%) | 0 (0.0%) |
| $7,500 to $9,999 | 0 (0.0%) | 0 (0.0%) |
| $10,000 to $12,499 | 0 (0.0%) | 0 (0.0%) |
| $12,500 to $14,999 | 0 (0.0%) | 0 (0.0%) |
| $15,000 to $17,499 | 0 (0.0%) | 6 (11.8%) |
| $17,500 to $19,999 | 0 (0.0%) | 0 (0.0%) |
| $20,000 to $22,499 | 0 (0.0%) | 0 (0.0%) |
| $22,500 to $24,999 | 8 (100.0%) | 0 (0.0%) |
| $25,000 to $29,999 | 0 (0.0%) | 36 (70.6%) |
| $30,000 to $34,999 | 0 (0.0%) | 0 (0.0%) |
| $35,000 to $39,999 | 0 (0.0%) | 4 (7.8%) |
| $40,000 to $44,999 | 0 (0.0%) | 0 (0.0%) |
| $45,000 to $49,999 | 0 (0.0%) | 0 (0.0%) |
| $50,000 to $54,999 | 0 (0.0%) | 0 (0.0%) |
| $55,000 to $64,999 | 0 (0.0%) | 0 (0.0%) |
| $65,000 to $74,999 | 0 (0.0%) | 0 (0.0%) |
| $75,000 to $99,999 | 0 (0.0%) | 5 (9.8%) |
| $100,000+ | 0 (0.0%) | 0 (0.0%) |
| Total | 8 (100.0%) | 51 (100.0%) |
Earnings by Sex by Educational Attainment in Cats Bridge
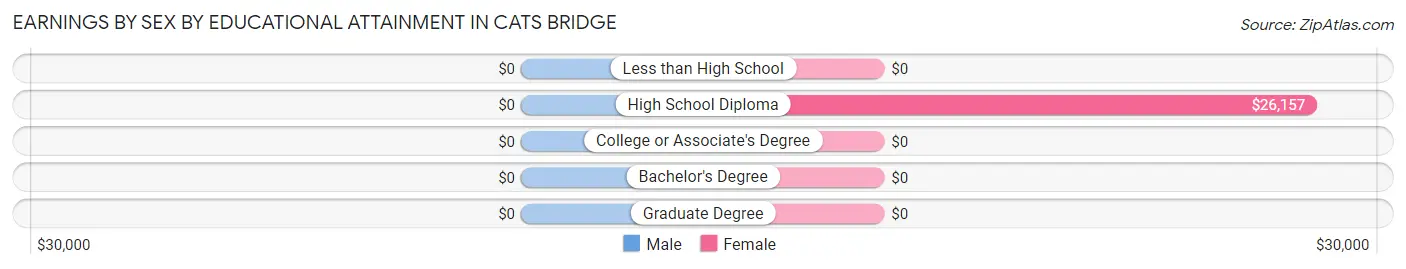
| Educational Attainment | Male Income | Female Income |
| Less than High School | - | - |
| High School Diploma | - | - |
| College or Associate's Degree | - | - |
| Bachelor's Degree | - | - |
| Graduate Degree | - | - |
| Total | - | - |
Family Income in Cats Bridge
Family Income Brackets in Cats Bridge
According to the Cats Bridge family income data, there are 9 families falling into the $50,000 to $74,999 income range, which is the most common income bracket and makes up 52.9% of all families.
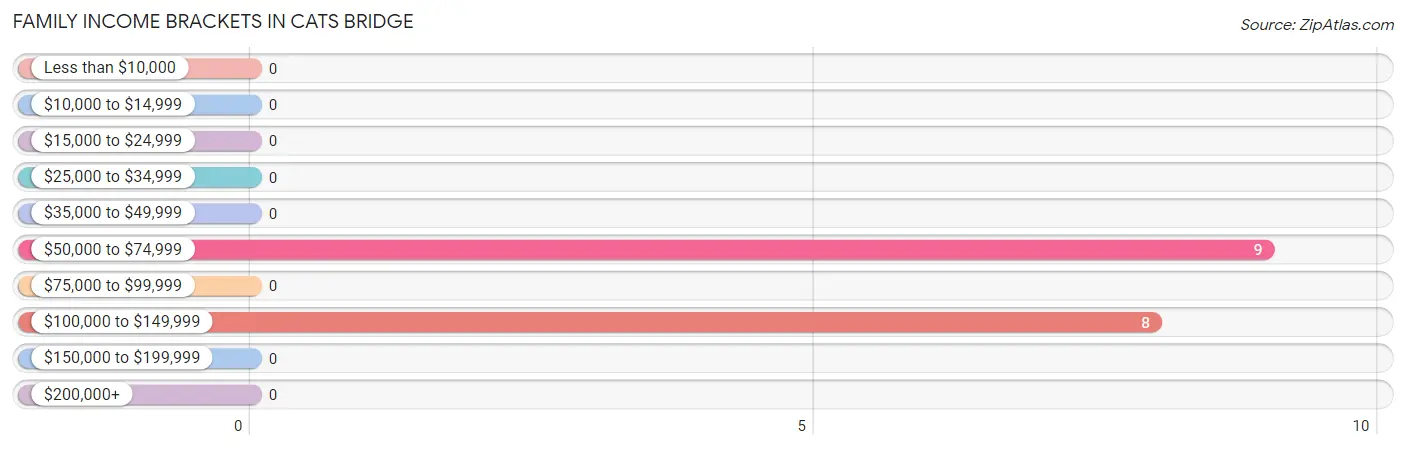
| Income Bracket | # Families | % Families |
| Less than $10,000 | 0 | 0.0% |
| $10,000 to $14,999 | 0 | 0.0% |
| $15,000 to $24,999 | 0 | 0.0% |
| $25,000 to $34,999 | 0 | 0.0% |
| $35,000 to $49,999 | 0 | 0.0% |
| $50,000 to $74,999 | 9 | 52.9% |
| $75,000 to $99,999 | 0 | 0.0% |
| $100,000 to $149,999 | 8 | 47.1% |
| $150,000 to $199,999 | 0 | 0.0% |
| $200,000+ | 0 | 0.0% |
Family Income by Famaliy Size in Cats Bridge
| Income Bracket | # Families | Median Income |
| 2-Person Families | 0 (0.0%) | $0 |
| 3-Person Families | 9 (52.9%) | $0 |
| 4-Person Families | 8 (47.1%) | $0 |
| 5-Person Families | 0 (0.0%) | $0 |
| 6-Person Families | 0 (0.0%) | $0 |
| 7+ Person Families | 0 (0.0%) | $0 |
| Total | 17 (100.0%) | $0 |
Family Income by Number of Earners in Cats Bridge
| Number of Earners | # Families | Median Income |
| No Earners | 0 (0.0%) | $0 |
| 1 Earner | 9 (52.9%) | $0 |
| 2 Earners | 0 (0.0%) | $0 |
| 3+ Earners | 8 (47.1%) | $0 |
| Total | 17 (100.0%) | $0 |
Household Income in Cats Bridge
Household Income Brackets in Cats Bridge
With 21 households falling in the category, the $15,000 to $24,999 income range is the most frequent in Cats Bridge, accounting for 37.5% of all households.
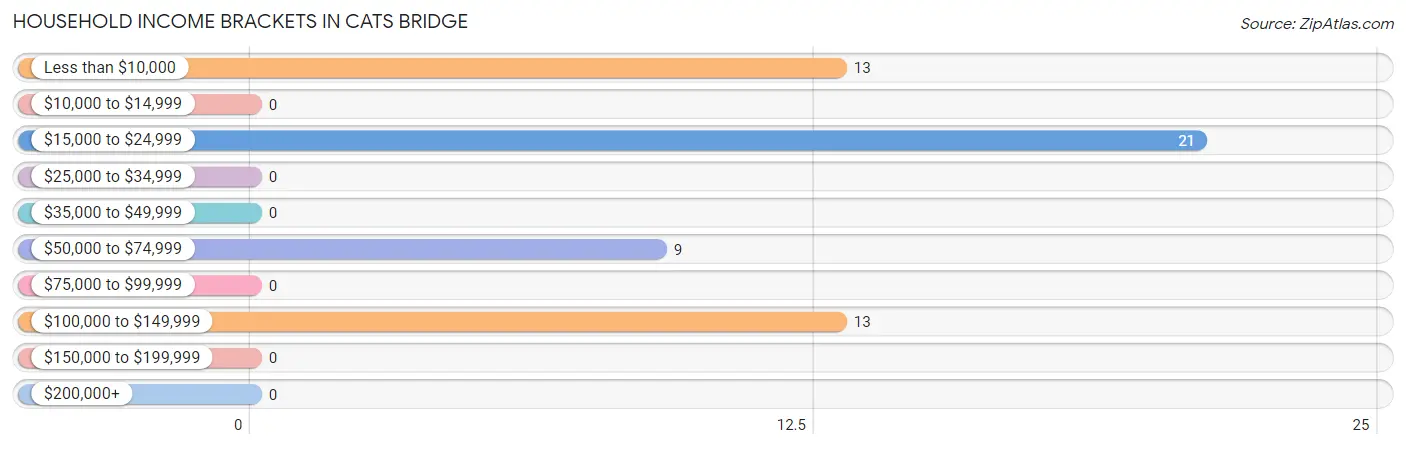
| Income Bracket | # Households | % Households |
| Less than $10,000 | 13 | 23.2% |
| $10,000 to $14,999 | 0 | 0.0% |
| $15,000 to $24,999 | 21 | 37.5% |
| $25,000 to $34,999 | 0 | 0.0% |
| $35,000 to $49,999 | 0 | 0.0% |
| $50,000 to $74,999 | 9 | 16.1% |
| $75,000 to $99,999 | 0 | 0.0% |
| $100,000 to $149,999 | 13 | 23.2% |
| $150,000 to $199,999 | 0 | 0.0% |
| $200,000+ | 0 | 0.0% |
Household Income by Householder Age in Cats Bridge
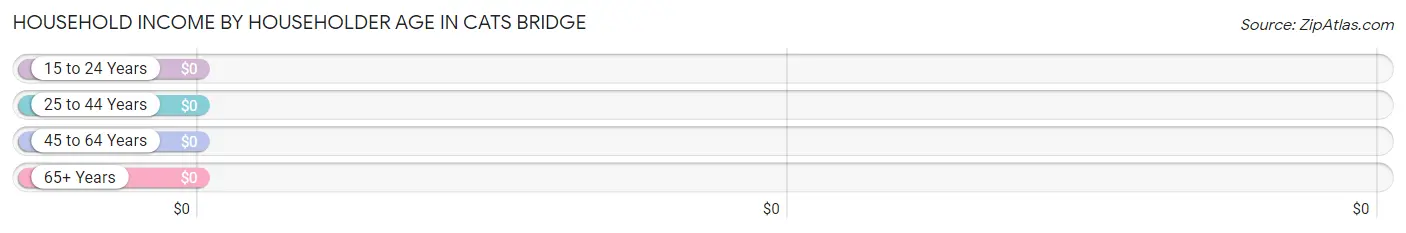
| Income Bracket | # Households | Median Income |
| 15 to 24 Years | 0 (0.0%) | $0 |
| 25 to 44 Years | 0 (0.0%) | $0 |
| 45 to 64 Years | 39 (69.6%) | $0 |
| 65+ Years | 17 (30.4%) | $0 |
| Total | 56 (100.0%) | $0 |
Poverty in Cats Bridge
Income Below Poverty by Sex and Age in Cats Bridge
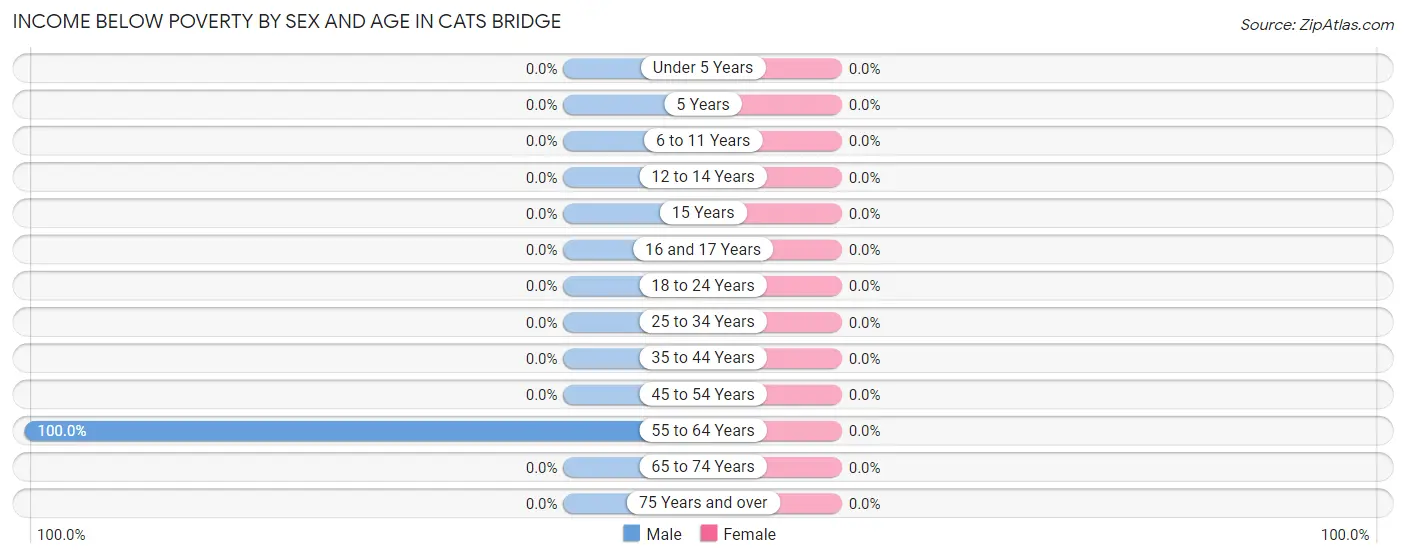
| Age Bracket | Male | Female |
| Under 5 Years | 0 (0.0%) | 0 (0.0%) |
| 5 Years | 0 (0.0%) | 0 (0.0%) |
| 6 to 11 Years | 0 (0.0%) | 0 (0.0%) |
| 12 to 14 Years | 0 (0.0%) | 0 (0.0%) |
| 15 Years | 0 (0.0%) | 0 (0.0%) |
| 16 and 17 Years | 0 (0.0%) | 0 (0.0%) |
| 18 to 24 Years | 0 (0.0%) | 0 (0.0%) |
| 25 to 34 Years | 0 (0.0%) | 0 (0.0%) |
| 35 to 44 Years | 0 (0.0%) | 0 (0.0%) |
| 45 to 54 Years | 0 (0.0%) | 0 (0.0%) |
| 55 to 64 Years | 13 (100.0%) | 0 (0.0%) |
| 65 to 74 Years | 0 (0.0%) | 0 (0.0%) |
| 75 Years and over | 0 (0.0%) | 0 (0.0%) |
| Total | 13 (13.5%) | 0 (0.0%) |
Income Above Poverty by Sex and Age in Cats Bridge
According to the poverty statistics in Cats Bridge, males aged 35 to 44 years and females aged 35 to 44 years are the age groups that are most secure financially, with 100.0% of males and 100.0% of females in these age groups living above the poverty line.
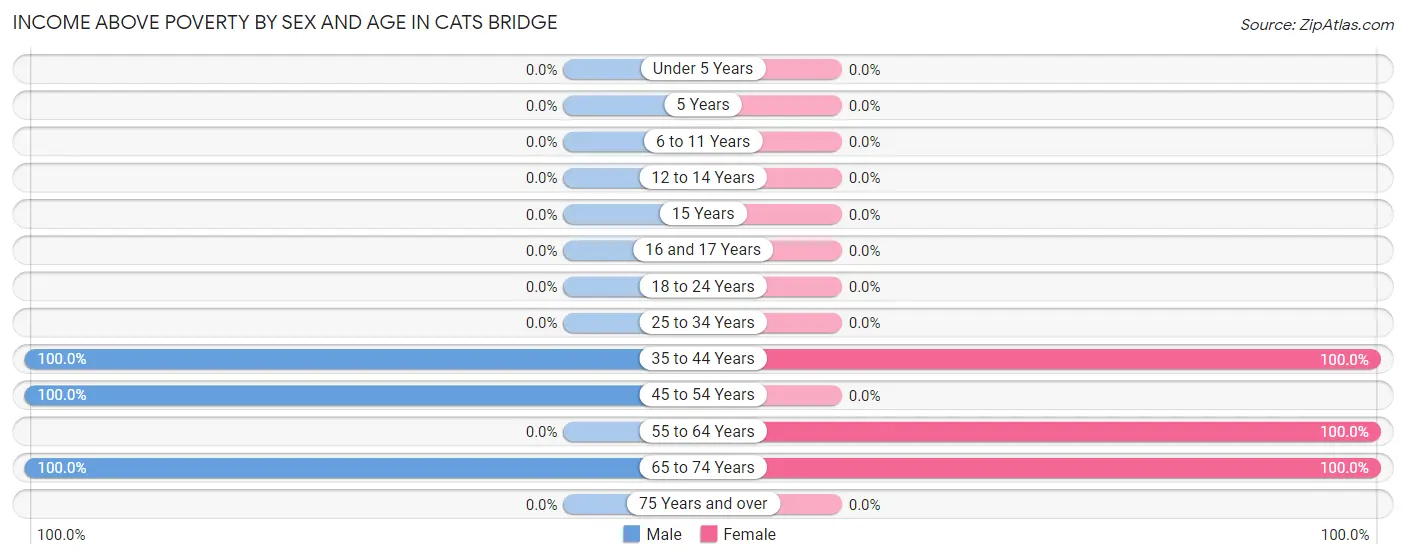
| Age Bracket | Male | Female |
| Under 5 Years | 0 (0.0%) | 0 (0.0%) |
| 5 Years | 0 (0.0%) | 0 (0.0%) |
| 6 to 11 Years | 0 (0.0%) | 0 (0.0%) |
| 12 to 14 Years | 0 (0.0%) | 0 (0.0%) |
| 15 Years | 0 (0.0%) | 0 (0.0%) |
| 16 and 17 Years | 0 (0.0%) | 0 (0.0%) |
| 18 to 24 Years | 0 (0.0%) | 0 (0.0%) |
| 25 to 34 Years | 0 (0.0%) | 0 (0.0%) |
| 35 to 44 Years | 6 (100.0%) | 27 (100.0%) |
| 45 to 54 Years | 62 (100.0%) | 0 (0.0%) |
| 55 to 64 Years | 0 (0.0%) | 30 (100.0%) |
| 65 to 74 Years | 15 (100.0%) | 15 (100.0%) |
| 75 Years and over | 0 (0.0%) | 0 (0.0%) |
| Total | 83 (86.5%) | 72 (100.0%) |
Income Below Poverty Among Married-Couple Families in Cats Bridge
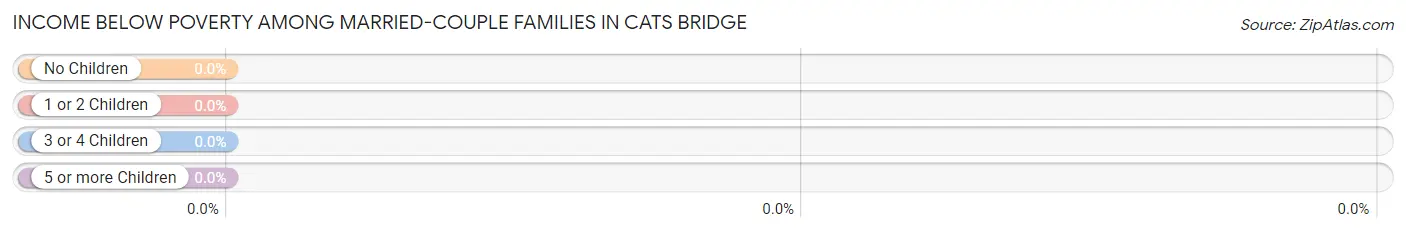
| Children | Above Poverty | Below Poverty |
| No Children | 17 (100.0%) | 0 (0.0%) |
| 1 or 2 Children | 0 (0.0%) | 0 (0.0%) |
| 3 or 4 Children | 0 (0.0%) | 0 (0.0%) |
| 5 or more Children | 0 (0.0%) | 0 (0.0%) |
| Total | 17 (100.0%) | 0 (0.0%) |
Income Below Poverty Among Single-Parent Households in Cats Bridge
| Children | Single Father | Single Mother |
| No Children | 0 (0.0%) | 0 (0.0%) |
| 1 or 2 Children | 0 (0.0%) | 0 (0.0%) |
| 3 or 4 Children | 0 (0.0%) | 0 (0.0%) |
| 5 or more Children | 0 (0.0%) | 0 (0.0%) |
| Total | 0 (0.0%) | 0 (0.0%) |
Income Below Poverty Among Married-Couple vs Single-Parent Households in Cats Bridge
| Children | Married-Couple Families | Single-Parent Households |
| No Children | 0 (0.0%) | 0 (0.0%) |
| 1 or 2 Children | 0 (0.0%) | 0 (0.0%) |
| 3 or 4 Children | 0 (0.0%) | 0 (0.0%) |
| 5 or more Children | 0 (0.0%) | 0 (0.0%) |
| Total | 0 (0.0%) | 0 (0.0%) |
Race in Cats Bridge
The most populous races in Cats Bridge are Black / African American (159 | 94.6%), and White / Caucasian (9 | 5.4%).
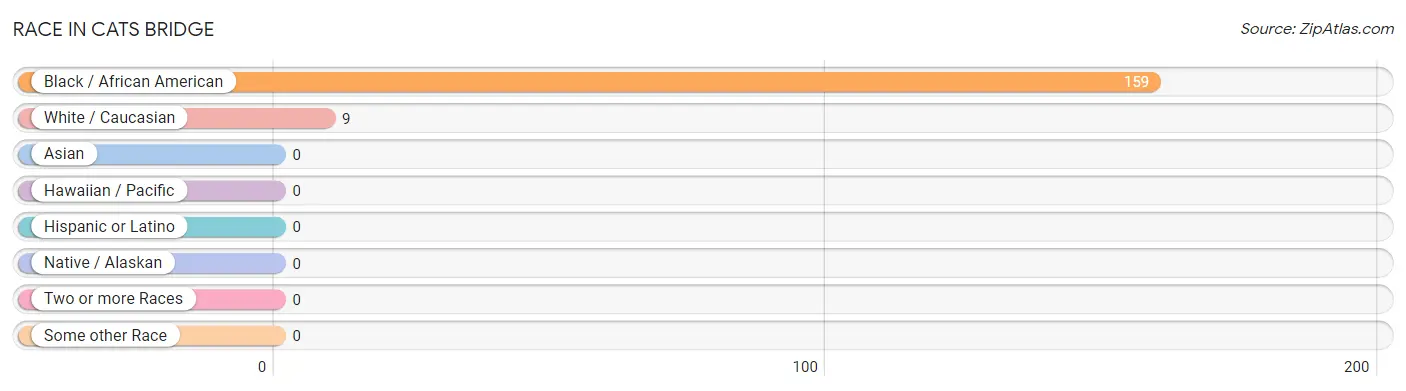
| Race | # Population | % Population |
| Asian | 0 | 0.0% |
| Black / African American | 159 | 94.6% |
| Hawaiian / Pacific | 0 | 0.0% |
| Hispanic or Latino | 0 | 0.0% |
| Native / Alaskan | 0 | 0.0% |
| White / Caucasian | 9 | 5.4% |
| Two or more Races | 0 | 0.0% |
| Some other Race | 0 | 0.0% |
| Total | 168 | 100.0% |
Ancestry in Cats Bridge
The most populous ancestries reported in Cats Bridge are American (137 | 81.6%), Irish (5 | 3.0%), and English (4 | 2.4%), together accounting for 86.9% of all Cats Bridge residents.
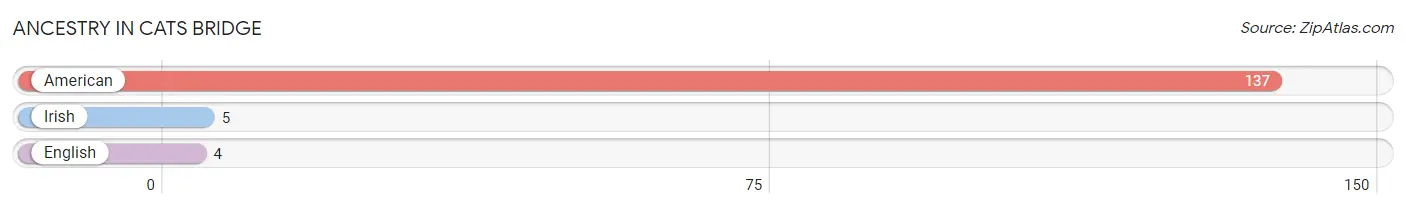
| Ancestry | # Population | % Population |
| American | 137 | 81.6% |
| English | 4 | 2.4% |
| Irish | 5 | 3.0% | View All 3 Rows |
Immigrants in Cats Bridge

| Immigration Origin | # Population | % Population | View All 0 Rows |
Sex and Age in Cats Bridge
Sex and Age in Cats Bridge
The most populous age groups in Cats Bridge are 45 to 49 Years (62 | 64.6%) for men and 35 to 39 Years (27 | 37.5%) for women.
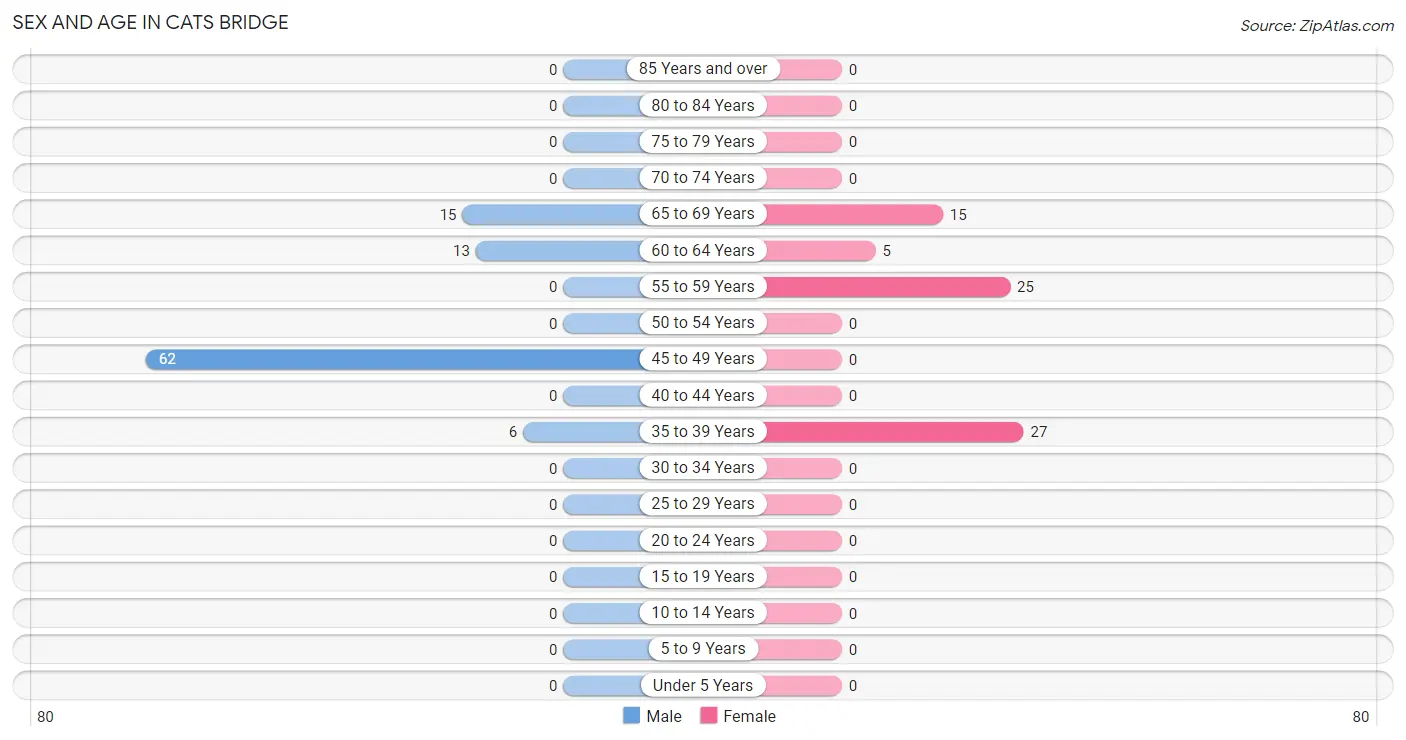
| Age Bracket | Male | Female |
| Under 5 Years | 0 (0.0%) | 0 (0.0%) |
| 5 to 9 Years | 0 (0.0%) | 0 (0.0%) |
| 10 to 14 Years | 0 (0.0%) | 0 (0.0%) |
| 15 to 19 Years | 0 (0.0%) | 0 (0.0%) |
| 20 to 24 Years | 0 (0.0%) | 0 (0.0%) |
| 25 to 29 Years | 0 (0.0%) | 0 (0.0%) |
| 30 to 34 Years | 0 (0.0%) | 0 (0.0%) |
| 35 to 39 Years | 6 (6.2%) | 27 (37.5%) |
| 40 to 44 Years | 0 (0.0%) | 0 (0.0%) |
| 45 to 49 Years | 62 (64.6%) | 0 (0.0%) |
| 50 to 54 Years | 0 (0.0%) | 0 (0.0%) |
| 55 to 59 Years | 0 (0.0%) | 25 (34.7%) |
| 60 to 64 Years | 13 (13.5%) | 5 (6.9%) |
| 65 to 69 Years | 15 (15.6%) | 15 (20.8%) |
| 70 to 74 Years | 0 (0.0%) | 0 (0.0%) |
| 75 to 79 Years | 0 (0.0%) | 0 (0.0%) |
| 80 to 84 Years | 0 (0.0%) | 0 (0.0%) |
| 85 Years and over | 0 (0.0%) | 0 (0.0%) |
| Total | 96 (100.0%) | 72 (100.0%) |
Families and Households in Cats Bridge
Median Family Size in Cats Bridge
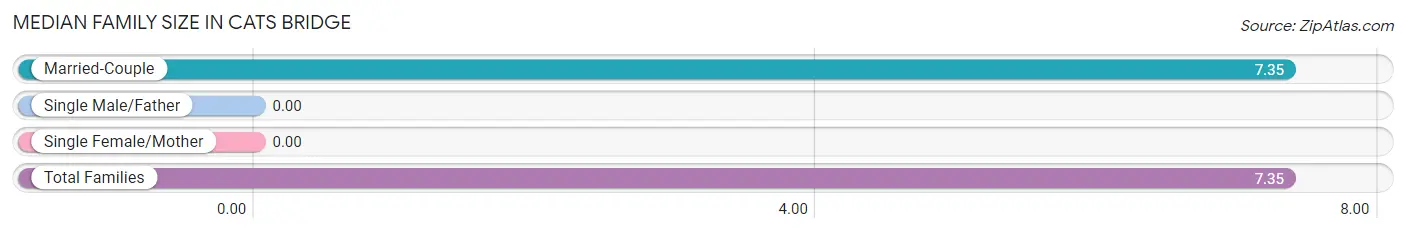
| Family Type | # Families | Family Size |
| Married-Couple | 17 (100.0%) | 7.35 |
| Single Male/Father | 0 (0.0%) | - |
| Single Female/Mother | 0 (0.0%) | - |
| Total Families | 17 (100.0%) | 7.35 |
Median Household Size in Cats Bridge
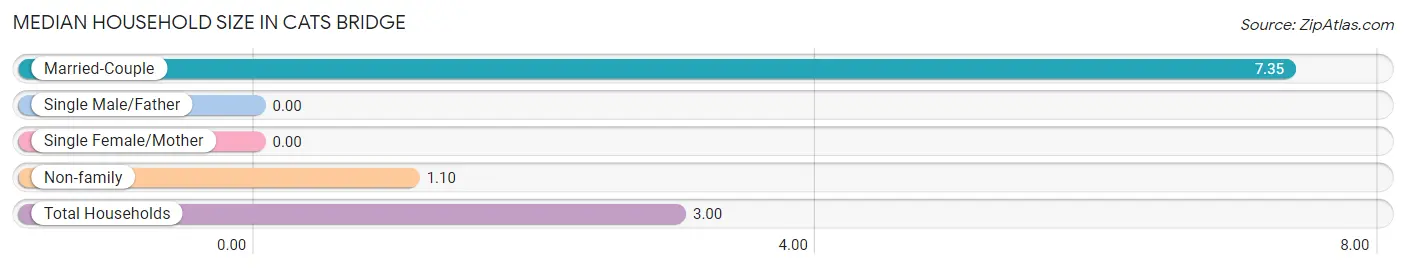
| Household Type | # Households | Household Size |
| Married-Couple | 17 (30.4%) | 7.35 |
| Single Male/Father | 0 (0.0%) | - |
| Single Female/Mother | 0 (0.0%) | - |
| Non-family | 39 (69.6%) | 1.10 |
| Total Households | 56 (100.0%) | 3.00 |
Household Size by Marriage Status in Cats Bridge
Out of a total of 56 households in Cats Bridge, 17 (30.4%) are family households, while 39 (69.6%) are nonfamily households. The most numerous type of family households are 3-person households, comprising 9, and the most common type of nonfamily households are 1-person households, comprising 34.
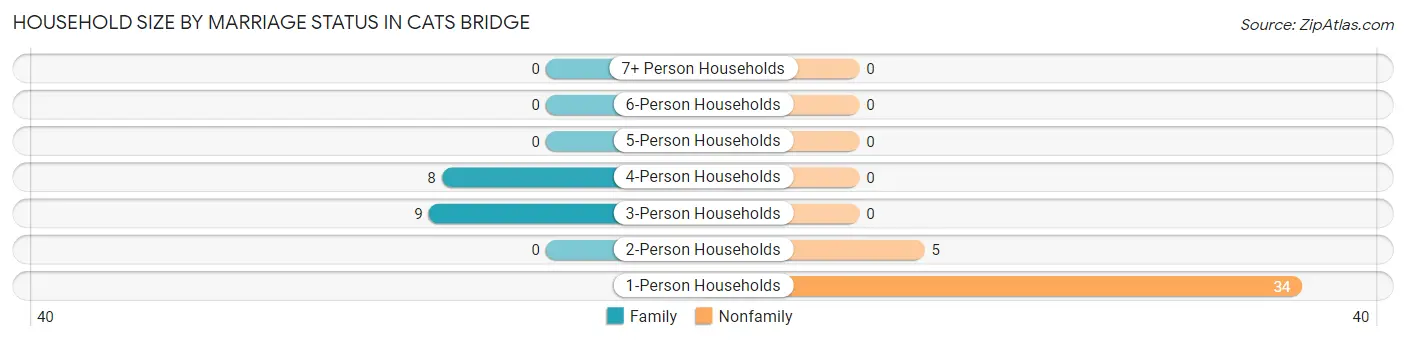
| Household Size | Family Households | Nonfamily Households |
| 1-Person Households | - | 34 (60.7%) |
| 2-Person Households | 0 (0.0%) | 5 (8.9%) |
| 3-Person Households | 9 (16.1%) | 0 (0.0%) |
| 4-Person Households | 8 (14.3%) | 0 (0.0%) |
| 5-Person Households | 0 (0.0%) | 0 (0.0%) |
| 6-Person Households | 0 (0.0%) | 0 (0.0%) |
| 7+ Person Households | 0 (0.0%) | 0 (0.0%) |
| Total | 17 (30.4%) | 39 (69.6%) |
Female Fertility in Cats Bridge
Fertility by Age in Cats Bridge
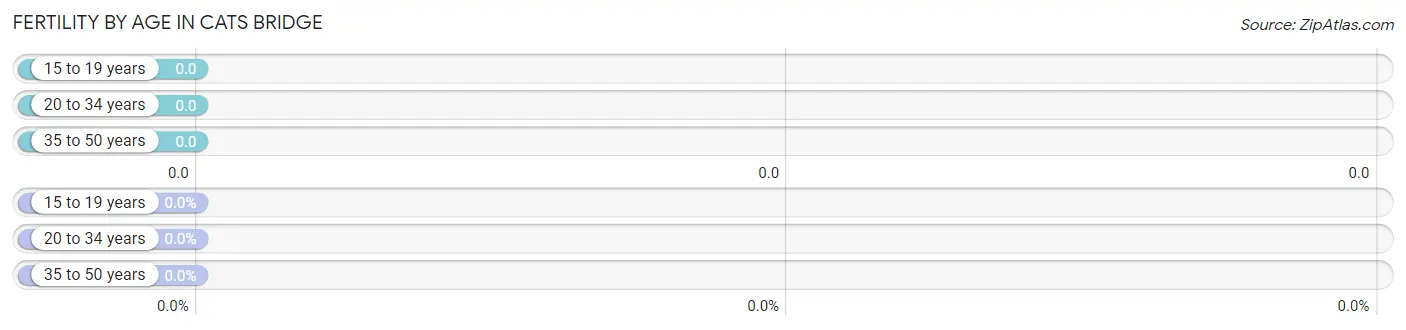
| Age Bracket | Women with Births | Births / 1,000 Women |
| 15 to 19 years | 0 (0.0%) | 0.0 |
| 20 to 34 years | 0 (0.0%) | 0.0 |
| 35 to 50 years | 0 (0.0%) | 0.0 |
| Total | 0 (0.0%) | 0.0 |
Fertility by Age by Marriage Status in Cats Bridge
| Age Bracket | Married | Unmarried |
| 15 to 19 years | 0 (0.0%) | 0 (0.0%) |
| 20 to 34 years | 0 (0.0%) | 0 (0.0%) |
| 35 to 50 years | 0 (0.0%) | 0 (0.0%) |
| Total | 0 (0.0%) | 0 (0.0%) |
Fertility by Education in Cats Bridge
| Educational Attainment | Women with Births | Births / 1,000 Women |
| Less than High School | 0 (0.0%) | 0.0 |
| High School Diploma | 0 (0.0%) | 0.0 |
| College or Associate's Degree | 0 (0.0%) | 0.0 |
| Bachelor's Degree | 0 (0.0%) | 0.0 |
| Graduate Degree | 0 (0.0%) | 0.0 |
| Total | 0 (0.0%) | 0.0 |
Fertility by Education by Marriage Status in Cats Bridge
| Educational Attainment | Married | Unmarried |
| Less than High School | 0 (0.0%) | 0 (0.0%) |
| High School Diploma | 0 (0.0%) | 0 (0.0%) |
| College or Associate's Degree | 0 (0.0%) | 0 (0.0%) |
| Bachelor's Degree | 0 (0.0%) | 0 (0.0%) |
| Graduate Degree | 0 (0.0%) | 0 (0.0%) |
| Total | 0 (0.0%) | 0 (0.0%) |
Employment Characteristics in Cats Bridge
Employment by Class of Employer in Cats Bridge
Among the 59 employed individuals in Cats Bridge, not-for-profit organizations (44 | 74.6%), state government employees (9 | 15.2%), and private company employees (6 | 10.2%) make up the most common classes of employment.
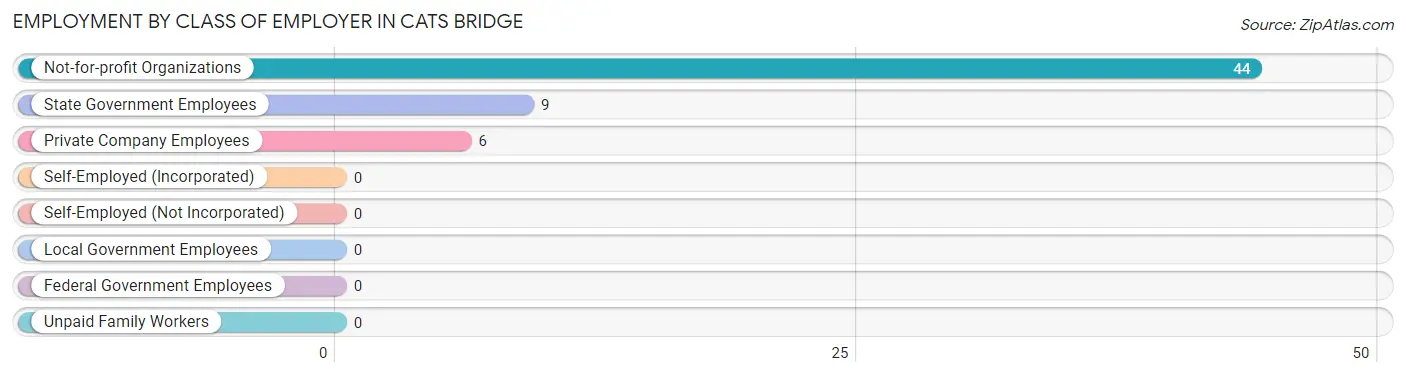
| Employer Class | # Employees | % Employees |
| Private Company Employees | 6 | 10.2% |
| Self-Employed (Incorporated) | 0 | 0.0% |
| Self-Employed (Not Incorporated) | 0 | 0.0% |
| Not-for-profit Organizations | 44 | 74.6% |
| Local Government Employees | 0 | 0.0% |
| State Government Employees | 9 | 15.2% |
| Federal Government Employees | 0 | 0.0% |
| Unpaid Family Workers | 0 | 0.0% |
| Total | 59 | 100.0% |
Employment Status by Age in Cats Bridge
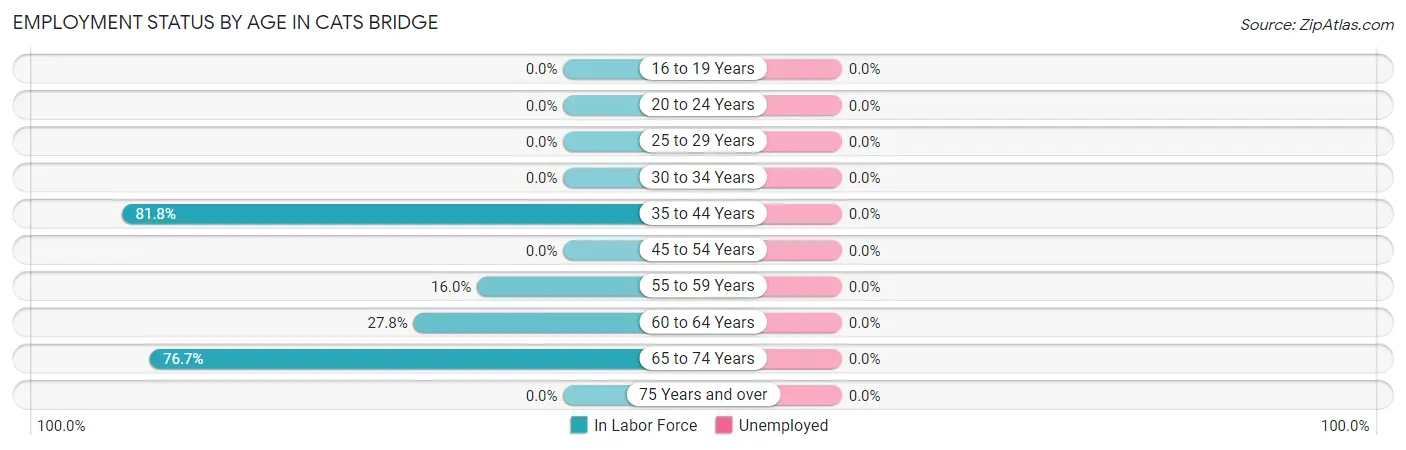
| Age Bracket | In Labor Force | Unemployed |
| 16 to 19 Years | 0 (0.0%) | 0 (0.0%) |
| 20 to 24 Years | 0 (0.0%) | 0 (0.0%) |
| 25 to 29 Years | 0 (0.0%) | 0 (0.0%) |
| 30 to 34 Years | 0 (0.0%) | 0 (0.0%) |
| 35 to 44 Years | 27 (81.8%) | 0 (0.0%) |
| 45 to 54 Years | 0 (0.0%) | 0 (0.0%) |
| 55 to 59 Years | 4 (16.0%) | 0 (0.0%) |
| 60 to 64 Years | 5 (27.8%) | 0 (0.0%) |
| 65 to 74 Years | 23 (76.7%) | 0 (0.0%) |
| 75 Years and over | 0 (0.0%) | 0 (0.0%) |
| Total | 59 (35.1%) | 0 (0.0%) |
Employment Status by Educational Attainment in Cats Bridge
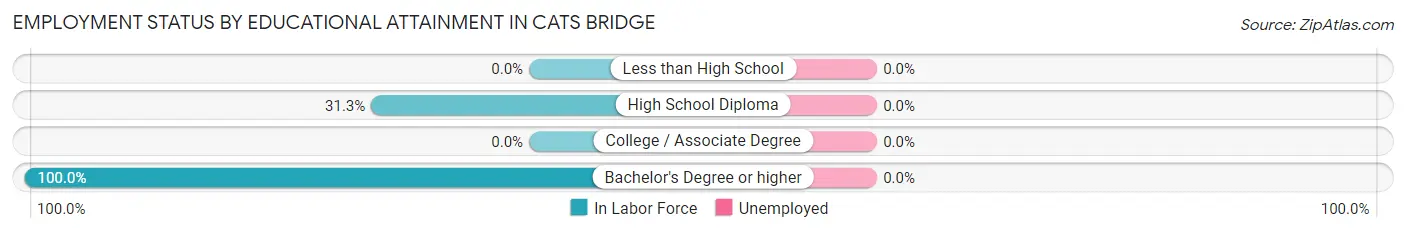
| Educational Attainment | In Labor Force | Unemployed |
| Less than High School | 0 (0.0%) | 0 (0.0%) |
| High School Diploma | 31 (31.3%) | 0 (0.0%) |
| College / Associate Degree | 0 (0.0%) | 0 (0.0%) |
| Bachelor's Degree or higher | 5 (100.0%) | 0 (0.0%) |
| Total | 36 (26.1%) | 0 (0.0%) |
Employment Occupations by Sex in Cats Bridge
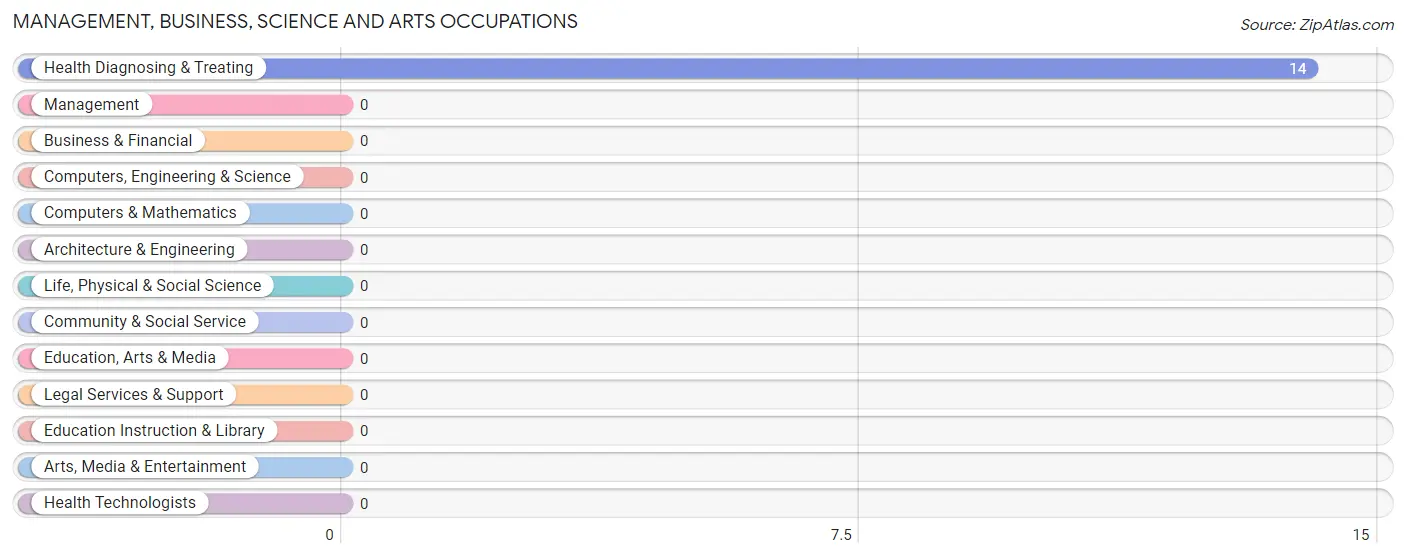
Management, Business, Science and Arts Occupations
The most common Management, Business, Science and Arts occupations in Cats Bridge are , and Health Diagnosing & Treating (14 | 23.7%).
Management, Business, Science and Arts Occupations by Sex
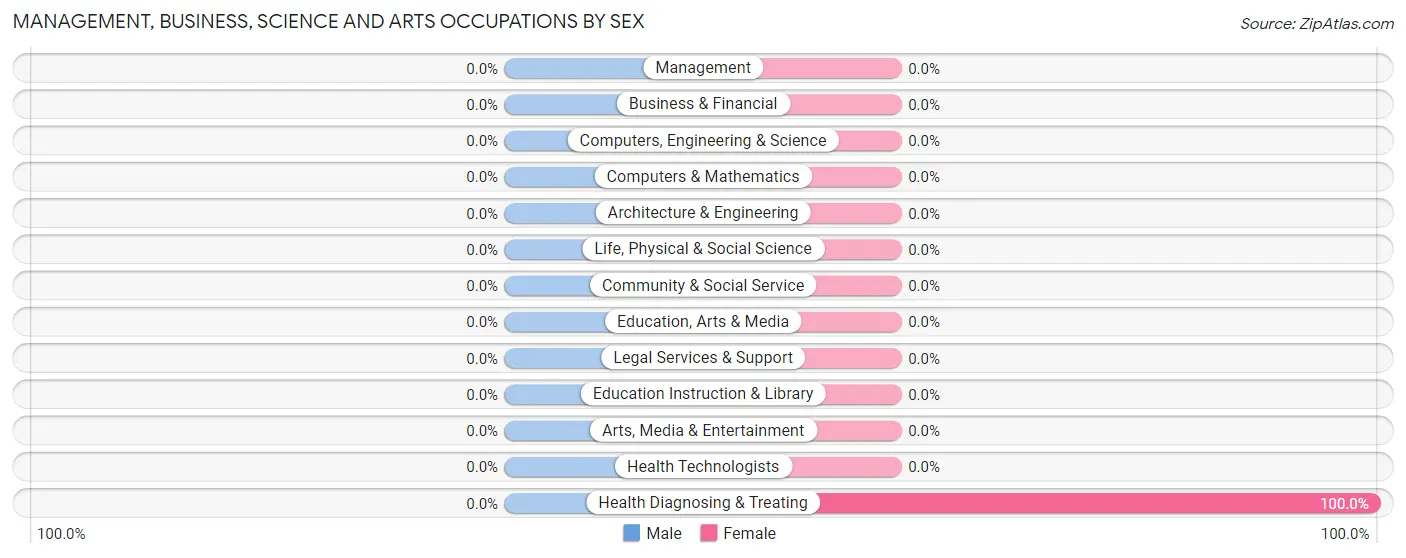
| Occupation | Male | Female |
| Management | 0 (0.0%) | 0 (0.0%) |
| Business & Financial | 0 (0.0%) | 0 (0.0%) |
| Computers, Engineering & Science | 0 (0.0%) | 0 (0.0%) |
| Computers & Mathematics | 0 (0.0%) | 0 (0.0%) |
| Architecture & Engineering | 0 (0.0%) | 0 (0.0%) |
| Life, Physical & Social Science | 0 (0.0%) | 0 (0.0%) |
| Community & Social Service | 0 (0.0%) | 0 (0.0%) |
| Education, Arts & Media | 0 (0.0%) | 0 (0.0%) |
| Legal Services & Support | 0 (0.0%) | 0 (0.0%) |
| Education Instruction & Library | 0 (0.0%) | 0 (0.0%) |
| Arts, Media & Entertainment | 0 (0.0%) | 0 (0.0%) |
| Health Diagnosing & Treating | 0 (0.0%) | 14 (100.0%) |
| Health Technologists | 0 (0.0%) | 0 (0.0%) |
| Total (Category) | 0 (0.0%) | 14 (100.0%) |
| Total (Overall) | 8 (13.6%) | 51 (86.4%) |
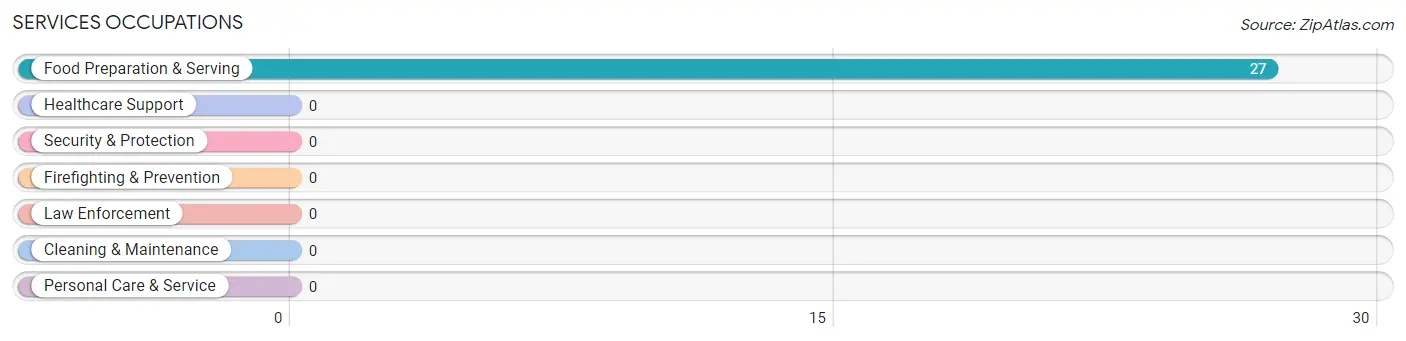
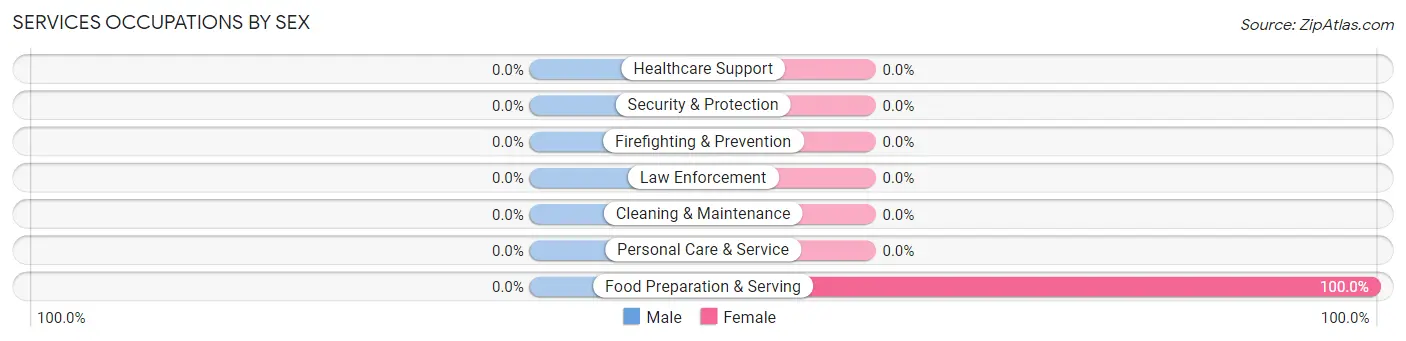
Services Occupations
The most common Services occupations in Cats Bridge are , and Food Preparation & Serving (27 | 45.8%).
Services Occupations by Sex
| Occupation | Male | Female |
| Healthcare Support | 0 (0.0%) | 0 (0.0%) |
| Security & Protection | 0 (0.0%) | 0 (0.0%) |
| Firefighting & Prevention | 0 (0.0%) | 0 (0.0%) |
| Law Enforcement | 0 (0.0%) | 0 (0.0%) |
| Food Preparation & Serving | 0 (0.0%) | 27 (100.0%) |
| Cleaning & Maintenance | 0 (0.0%) | 0 (0.0%) |
| Personal Care & Service | 0 (0.0%) | 0 (0.0%) |
| Total (Category) | 0 (0.0%) | 27 (100.0%) |
| Total (Overall) | 8 (13.6%) | 51 (86.4%) |
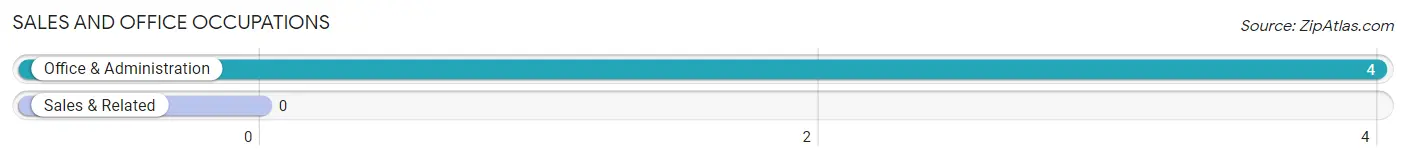
Sales and Office Occupations
The most common Sales and Office occupations in Cats Bridge are , and Office & Administration (4 | 6.8%).
Sales and Office Occupations by Sex

| Occupation | Male | Female |
| Sales & Related | 0 (0.0%) | 0 (0.0%) |
| Office & Administration | 0 (0.0%) | 4 (100.0%) |
| Total (Category) | 0 (0.0%) | 4 (100.0%) |
| Total (Overall) | 8 (13.6%) | 51 (86.4%) |
Natural Resources, Construction and Maintenance Occupations
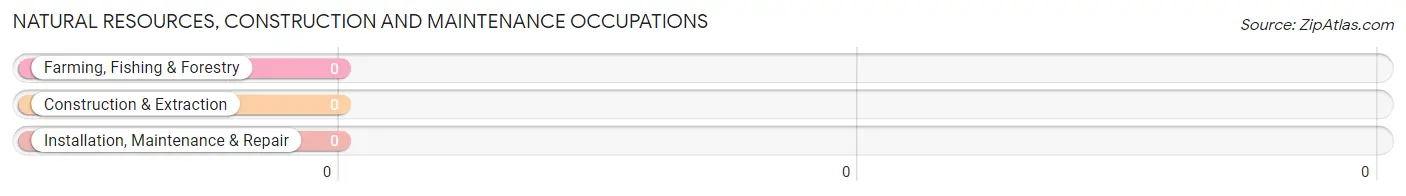
Natural Resources, Construction and Maintenance Occupations by Sex
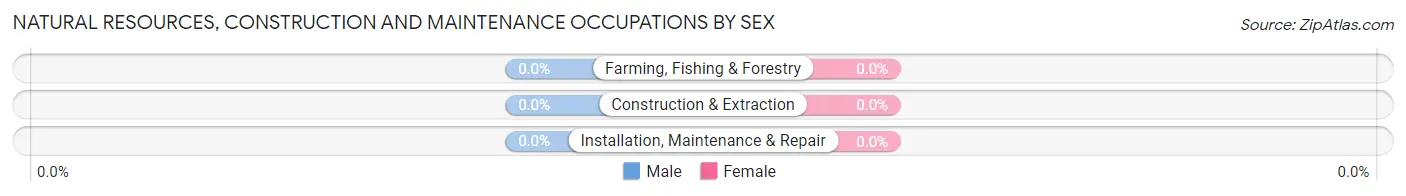
| Occupation | Male | Female |
| Farming, Fishing & Forestry | 0 (0.0%) | 0 (0.0%) |
| Construction & Extraction | 0 (0.0%) | 0 (0.0%) |
| Installation, Maintenance & Repair | 0 (0.0%) | 0 (0.0%) |
| Total (Category) | 0 (0.0%) | 0 (0.0%) |
| Total (Overall) | 8 (13.6%) | 51 (86.4%) |
Production, Transportation and Moving Occupations
The most common Production, Transportation and Moving occupations in Cats Bridge are Transportation (8 | 13.6%), and Production (6 | 10.2%).
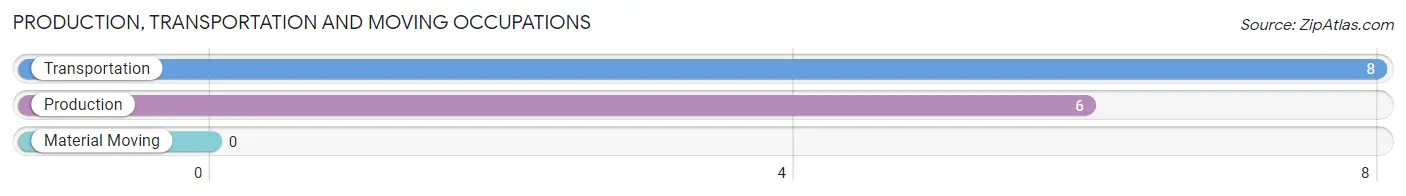
Production, Transportation and Moving Occupations by Sex
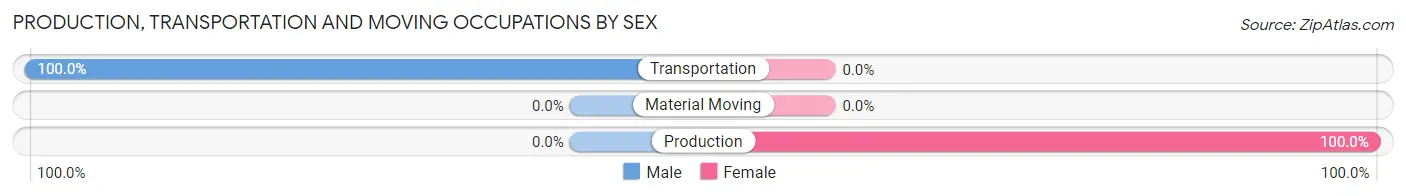
| Occupation | Male | Female |
| Production | 0 (0.0%) | 6 (100.0%) |
| Transportation | 8 (100.0%) | 0 (0.0%) |
| Material Moving | 0 (0.0%) | 0 (0.0%) |
| Total (Category) | 8 (57.1%) | 6 (42.9%) |
| Total (Overall) | 8 (13.6%) | 51 (86.4%) |
Employment Industries by Sex in Cats Bridge
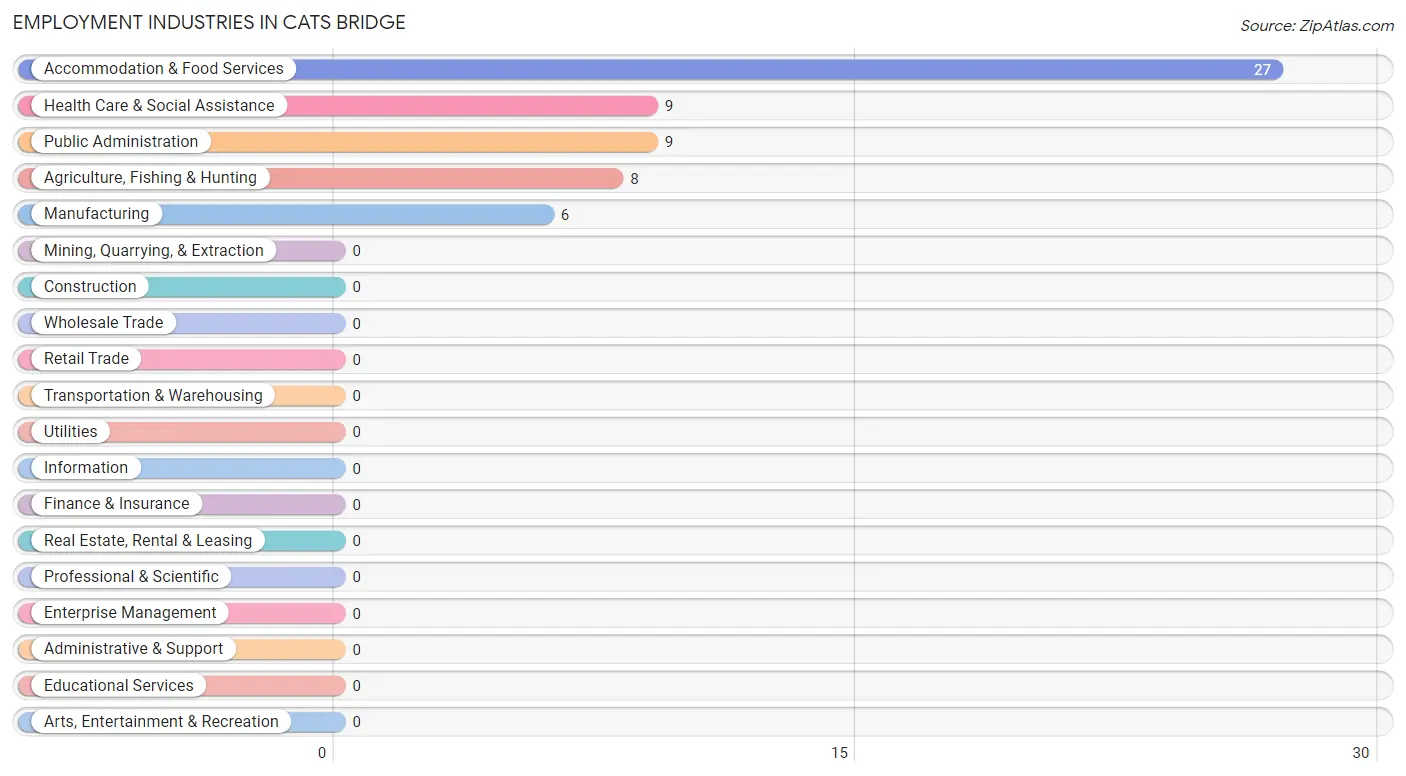
Employment Industries in Cats Bridge
The major employment industries in Cats Bridge include Accommodation & Food Services (27 | 45.8%), Health Care & Social Assistance (9 | 15.2%), Public Administration (9 | 15.2%), Agriculture, Fishing & Hunting (8 | 13.6%), and Manufacturing (6 | 10.2%).
Employment Industries by Sex in Cats Bridge
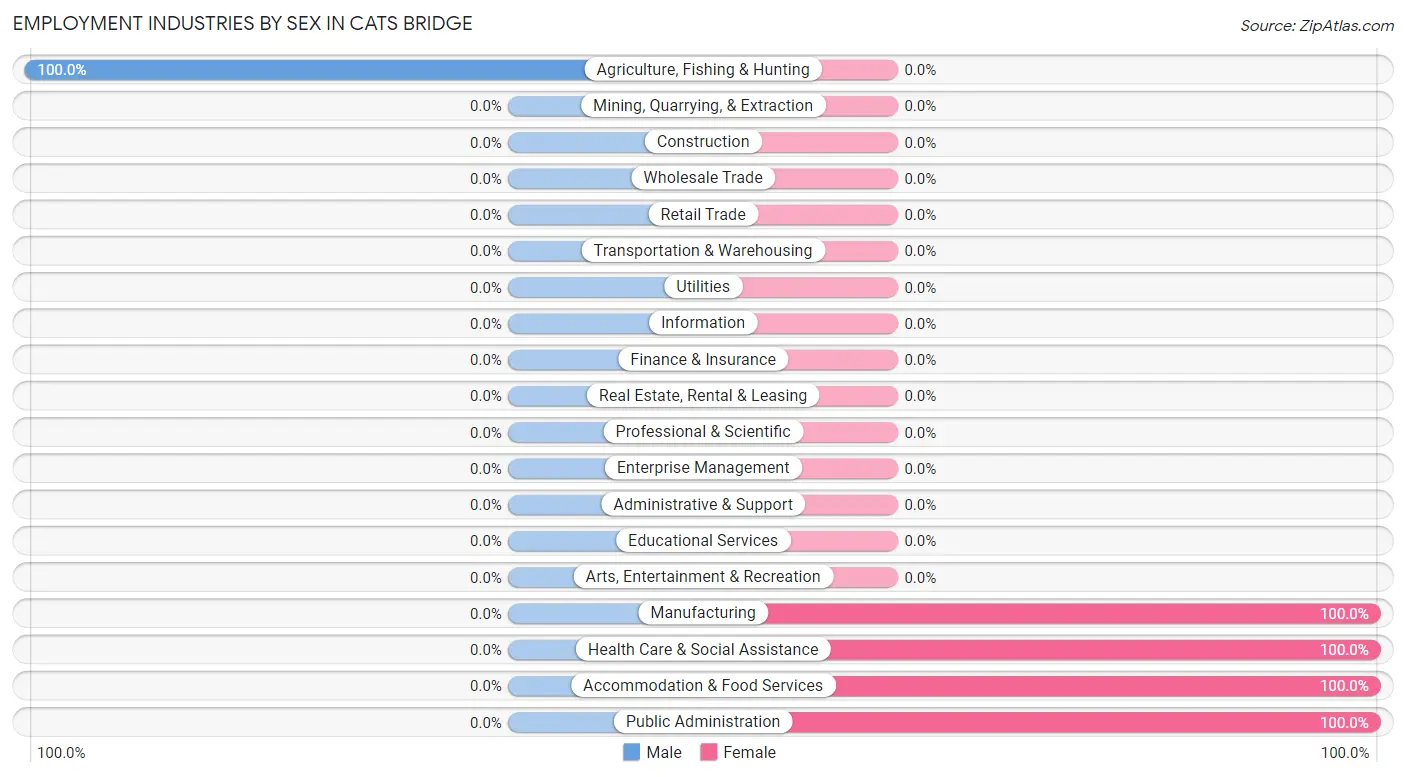
| Industry | Male | Female |
| Agriculture, Fishing & Hunting | 8 (100.0%) | 0 (0.0%) |
| Mining, Quarrying, & Extraction | 0 (0.0%) | 0 (0.0%) |
| Construction | 0 (0.0%) | 0 (0.0%) |
| Manufacturing | 0 (0.0%) | 6 (100.0%) |
| Wholesale Trade | 0 (0.0%) | 0 (0.0%) |
| Retail Trade | 0 (0.0%) | 0 (0.0%) |
| Transportation & Warehousing | 0 (0.0%) | 0 (0.0%) |
| Utilities | 0 (0.0%) | 0 (0.0%) |
| Information | 0 (0.0%) | 0 (0.0%) |
| Finance & Insurance | 0 (0.0%) | 0 (0.0%) |
| Real Estate, Rental & Leasing | 0 (0.0%) | 0 (0.0%) |
| Professional & Scientific | 0 (0.0%) | 0 (0.0%) |
| Enterprise Management | 0 (0.0%) | 0 (0.0%) |
| Administrative & Support | 0 (0.0%) | 0 (0.0%) |
| Educational Services | 0 (0.0%) | 0 (0.0%) |
| Health Care & Social Assistance | 0 (0.0%) | 9 (100.0%) |
| Arts, Entertainment & Recreation | 0 (0.0%) | 0 (0.0%) |
| Accommodation & Food Services | 0 (0.0%) | 27 (100.0%) |
| Public Administration | 0 (0.0%) | 9 (100.0%) |
| Total | 8 (13.6%) | 51 (86.4%) |
Education in Cats Bridge
School Enrollment in Cats Bridge
| School Level | # Students | % Students |
| Nursery / Preschool | 0 | 0.0% |
| Kindergarten | 0 | 0.0% |
| Elementary School | 0 | 0.0% |
| Middle School | 0 | 0.0% |
| High School | 0 | 0.0% |
| College / Undergraduate | 0 | 0.0% |
| Graduate / Professional | 0 | 0.0% |
| Total | 0 | 0.0% |
School Enrollment by Age by Funding Source in Cats Bridge
| Age Bracket | Public School | Private School |
| 3 to 4 Year Olds | 0 (0.0%) | 0 (0.0%) |
| 5 to 9 Year Old | 0 (0.0%) | 0 (0.0%) |
| 10 to 14 Year Olds | 0 (0.0%) | 0 (0.0%) |
| 15 to 17 Year Olds | 0 (0.0%) | 0 (0.0%) |
| 18 to 19 Year Olds | 0 (0.0%) | 0 (0.0%) |
| 20 to 24 Year Olds | 0 (0.0%) | 0 (0.0%) |
| 25 to 34 Year Olds | 0 (0.0%) | 0 (0.0%) |
| 35 Years and over | 0 (0.0%) | 0 (0.0%) |
| Total | 0 (0.0%) | 0 (0.0%) |
Educational Attainment by Field of Study in Cats Bridge
, and bio, nature & agricultural (5 | 100.0%) are the most common fields of study among 5 individuals in Cats Bridge who have obtained a bachelor's degree or higher.
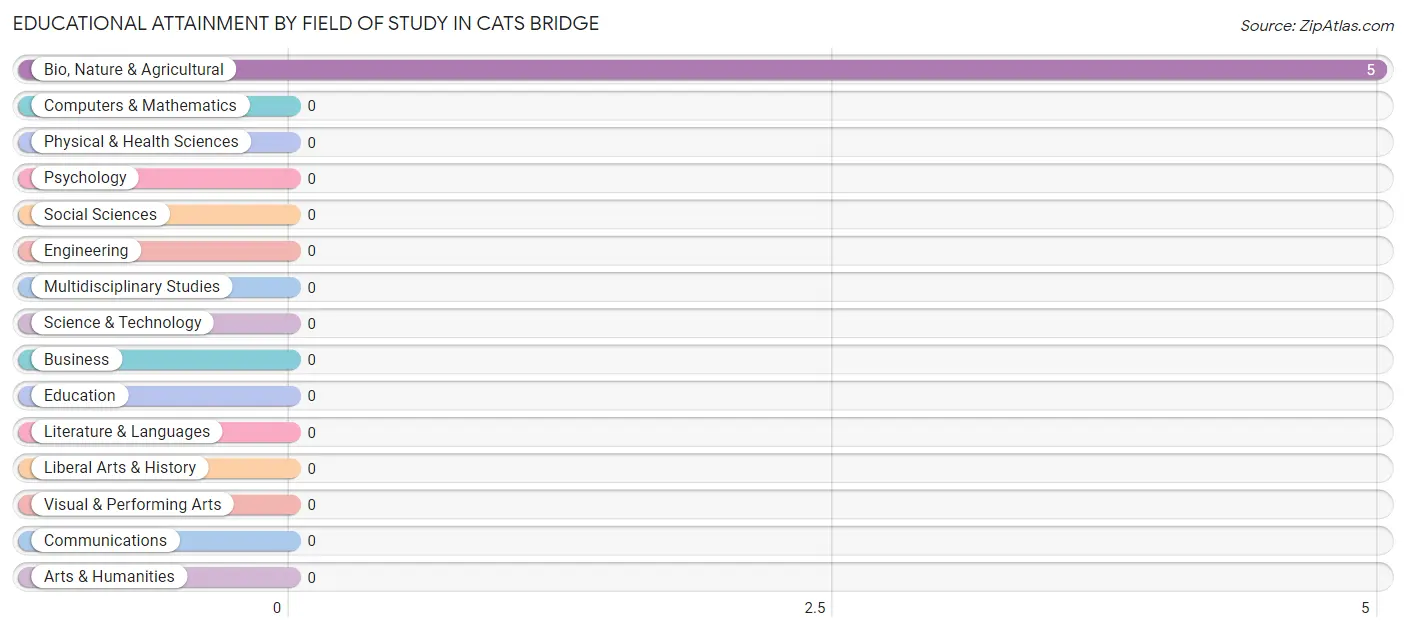
| Field of Study | # Graduates | % Graduates |
| Computers & Mathematics | 0 | 0.0% |
| Bio, Nature & Agricultural | 5 | 100.0% |
| Physical & Health Sciences | 0 | 0.0% |
| Psychology | 0 | 0.0% |
| Social Sciences | 0 | 0.0% |
| Engineering | 0 | 0.0% |
| Multidisciplinary Studies | 0 | 0.0% |
| Science & Technology | 0 | 0.0% |
| Business | 0 | 0.0% |
| Education | 0 | 0.0% |
| Literature & Languages | 0 | 0.0% |
| Liberal Arts & History | 0 | 0.0% |
| Visual & Performing Arts | 0 | 0.0% |
| Communications | 0 | 0.0% |
| Arts & Humanities | 0 | 0.0% |
| Total | 5 | 100.0% |
Transportation & Commute in Cats Bridge
Vehicle Availability by Sex in Cats Bridge
The most prevalent vehicle ownership categories in Cats Bridge are males with 3 vehicles (8, accounting for 100.0%) and females with 3 vehicles (33, making up 15.7%).
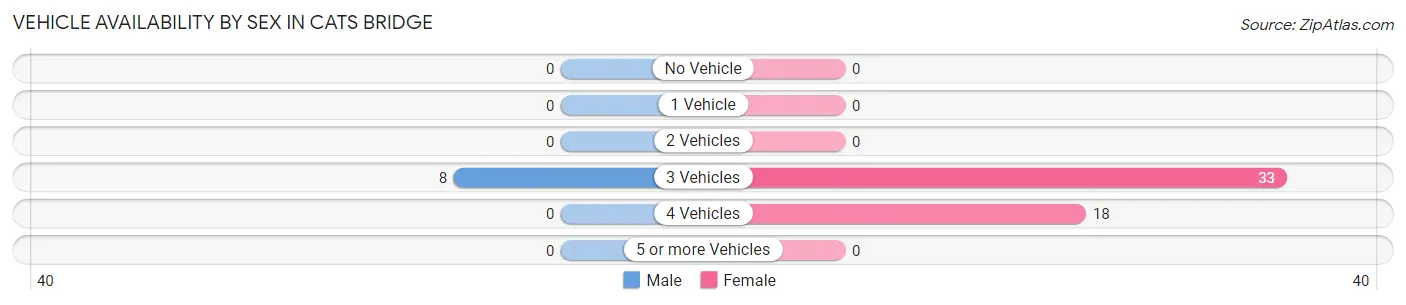
| Vehicles Available | Male | Female |
| No Vehicle | 0 (0.0%) | 0 (0.0%) |
| 1 Vehicle | 0 (0.0%) | 0 (0.0%) |
| 2 Vehicles | 0 (0.0%) | 0 (0.0%) |
| 3 Vehicles | 8 (100.0%) | 33 (64.7%) |
| 4 Vehicles | 0 (0.0%) | 18 (35.3%) |
| 5 or more Vehicles | 0 (0.0%) | 0 (0.0%) |
| Total | 8 (100.0%) | 51 (100.0%) |
Commute Time in Cats Bridge
The most frequently occuring commute durations in Cats Bridge are 10 to 14 minutes (36 commuters, 66.7%), 25 to 29 minutes (10 commuters, 18.5%), and 5 to 9 minutes (8 commuters, 14.8%).
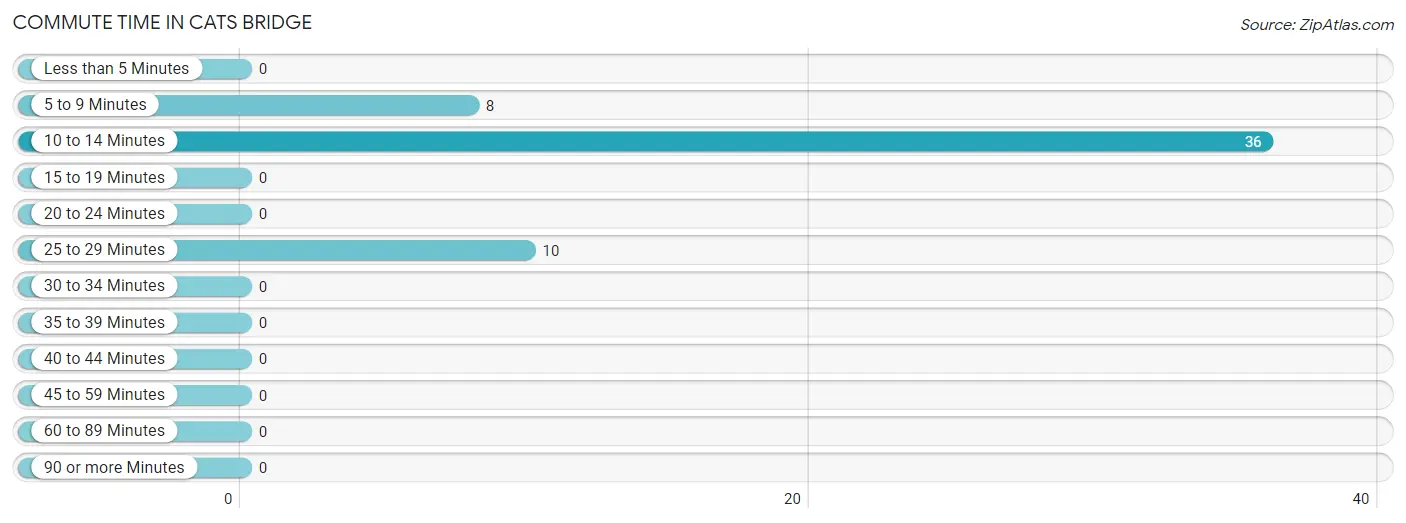
| Commute Time | # Commuters | % Commuters |
| Less than 5 Minutes | 0 | 0.0% |
| 5 to 9 Minutes | 8 | 14.8% |
| 10 to 14 Minutes | 36 | 66.7% |
| 15 to 19 Minutes | 0 | 0.0% |
| 20 to 24 Minutes | 0 | 0.0% |
| 25 to 29 Minutes | 10 | 18.5% |
| 30 to 34 Minutes | 0 | 0.0% |
| 35 to 39 Minutes | 0 | 0.0% |
| 40 to 44 Minutes | 0 | 0.0% |
| 45 to 59 Minutes | 0 | 0.0% |
| 60 to 89 Minutes | 0 | 0.0% |
| 90 or more Minutes | 0 | 0.0% |
Commute Time by Sex in Cats Bridge
The most common commute times in Cats Bridge are 5 to 9 minutes (8 commuters, 100.0%) for males and 10 to 14 minutes (36 commuters, 78.3%) for females.
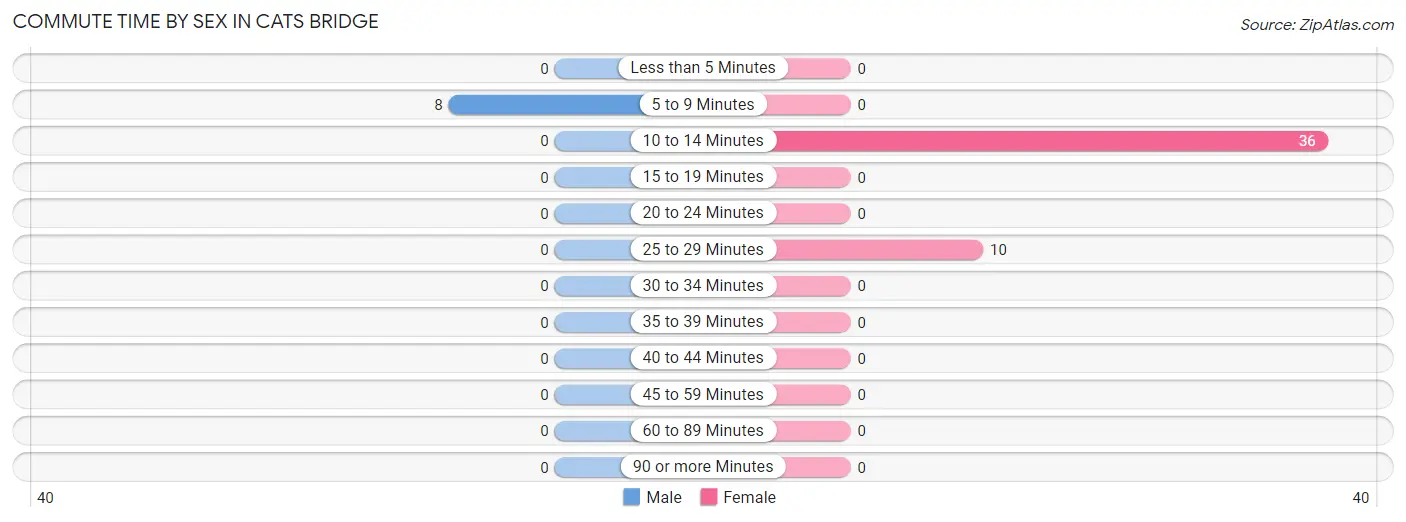
| Commute Time | Male | Female |
| Less than 5 Minutes | 0 (0.0%) | 0 (0.0%) |
| 5 to 9 Minutes | 8 (100.0%) | 0 (0.0%) |
| 10 to 14 Minutes | 0 (0.0%) | 36 (78.3%) |
| 15 to 19 Minutes | 0 (0.0%) | 0 (0.0%) |
| 20 to 24 Minutes | 0 (0.0%) | 0 (0.0%) |
| 25 to 29 Minutes | 0 (0.0%) | 10 (21.7%) |
| 30 to 34 Minutes | 0 (0.0%) | 0 (0.0%) |
| 35 to 39 Minutes | 0 (0.0%) | 0 (0.0%) |
| 40 to 44 Minutes | 0 (0.0%) | 0 (0.0%) |
| 45 to 59 Minutes | 0 (0.0%) | 0 (0.0%) |
| 60 to 89 Minutes | 0 (0.0%) | 0 (0.0%) |
| 90 or more Minutes | 0 (0.0%) | 0 (0.0%) |
Time of Departure to Work by Sex in Cats Bridge
The most frequent times of departure to work in Cats Bridge are 7:00 AM to 7:29 AM (8, 100.0%) for males and 5:00 AM to 5:29 AM (27, 58.7%) for females.
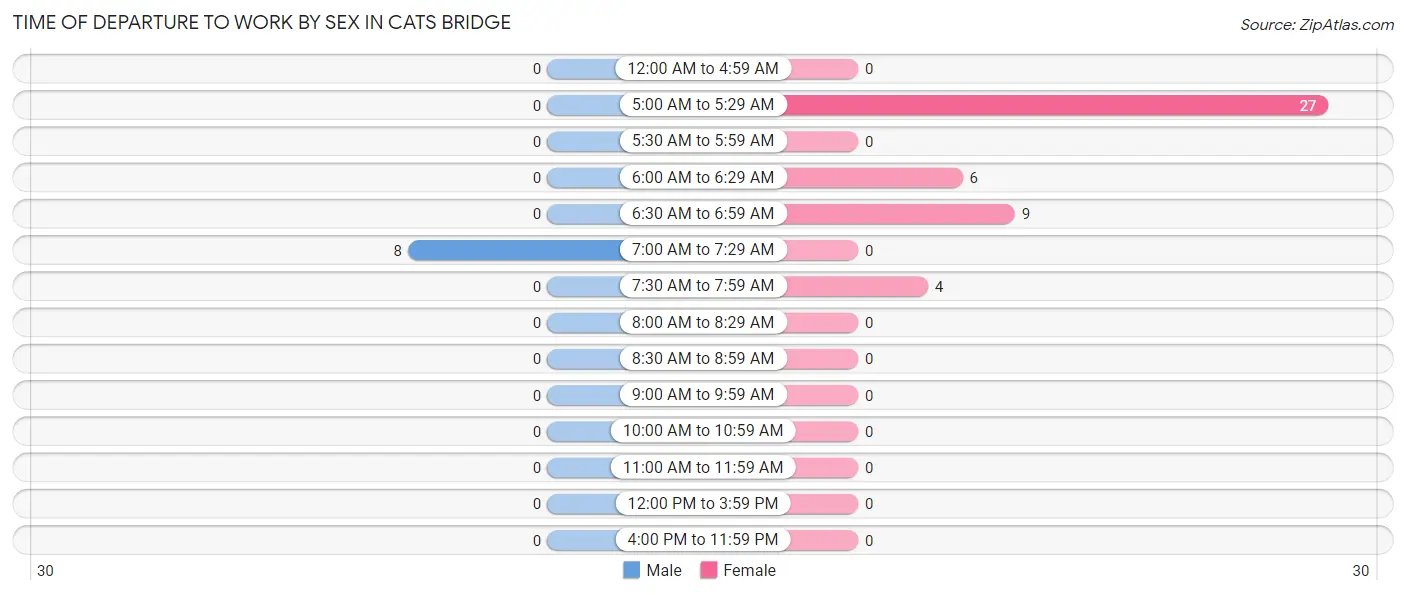
| Time of Departure | Male | Female |
| 12:00 AM to 4:59 AM | 0 (0.0%) | 0 (0.0%) |
| 5:00 AM to 5:29 AM | 0 (0.0%) | 27 (58.7%) |
| 5:30 AM to 5:59 AM | 0 (0.0%) | 0 (0.0%) |
| 6:00 AM to 6:29 AM | 0 (0.0%) | 6 (13.0%) |
| 6:30 AM to 6:59 AM | 0 (0.0%) | 9 (19.6%) |
| 7:00 AM to 7:29 AM | 8 (100.0%) | 0 (0.0%) |
| 7:30 AM to 7:59 AM | 0 (0.0%) | 4 (8.7%) |
| 8:00 AM to 8:29 AM | 0 (0.0%) | 0 (0.0%) |
| 8:30 AM to 8:59 AM | 0 (0.0%) | 0 (0.0%) |
| 9:00 AM to 9:59 AM | 0 (0.0%) | 0 (0.0%) |
| 10:00 AM to 10:59 AM | 0 (0.0%) | 0 (0.0%) |
| 11:00 AM to 11:59 AM | 0 (0.0%) | 0 (0.0%) |
| 12:00 PM to 3:59 PM | 0 (0.0%) | 0 (0.0%) |
| 4:00 PM to 11:59 PM | 0 (0.0%) | 0 (0.0%) |
| Total | 8 (100.0%) | 46 (100.0%) |
Housing Occupancy in Cats Bridge
Occupancy by Ownership in Cats Bridge
Of the total 56 dwellings in Cats Bridge, owner-occupied units account for 22 (39.3%), while renter-occupied units make up 34 (60.7%).
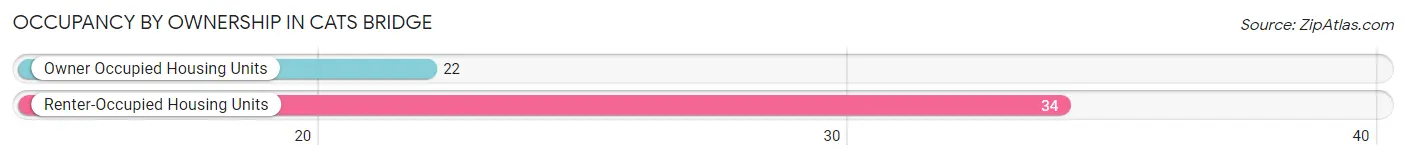
| Occupancy | # Housing Units | % Housing Units |
| Owner Occupied Housing Units | 22 | 39.3% |
| Renter-Occupied Housing Units | 34 | 60.7% |
| Total Occupied Housing Units | 56 | 100.0% |
Occupancy by Household Size in Cats Bridge
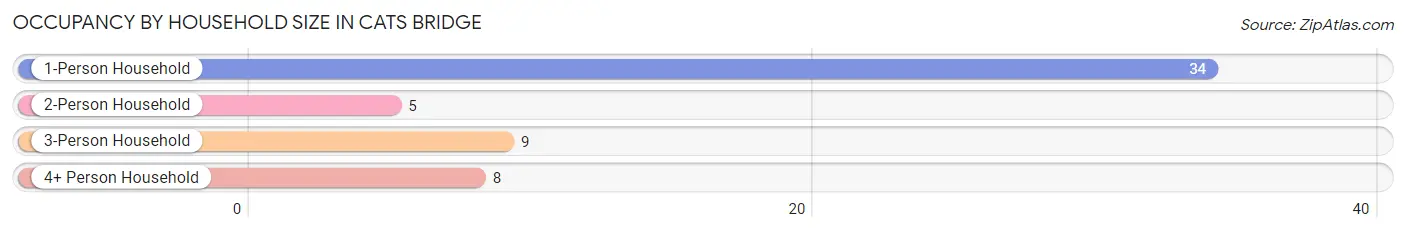
| Household Size | # Housing Units | % Housing Units |
| 1-Person Household | 34 | 60.7% |
| 2-Person Household | 5 | 8.9% |
| 3-Person Household | 9 | 16.1% |
| 4+ Person Household | 8 | 14.3% |
| Total Housing Units | 56 | 100.0% |
Occupancy by Ownership by Household Size in Cats Bridge
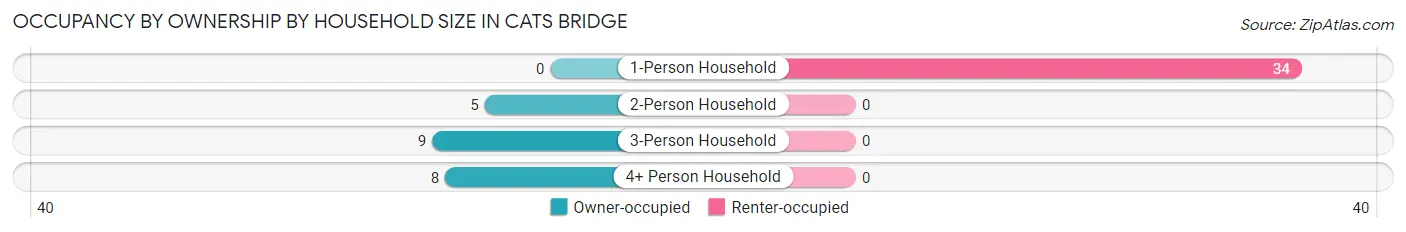
| Household Size | Owner-occupied | Renter-occupied |
| 1-Person Household | 0 (0.0%) | 34 (100.0%) |
| 2-Person Household | 5 (100.0%) | 0 (0.0%) |
| 3-Person Household | 9 (100.0%) | 0 (0.0%) |
| 4+ Person Household | 8 (100.0%) | 0 (0.0%) |
| Total Housing Units | 22 (39.3%) | 34 (60.7%) |
Occupancy by Educational Attainment in Cats Bridge

| Household Size | Owner-occupied | Renter-occupied |
| Less than High School | 8 (38.1%) | 13 (61.9%) |
| High School Diploma | 0 (0.0%) | 0 (0.0%) |
| College/Associate Degree | 9 (30.0%) | 21 (70.0%) |
| Bachelor's Degree or higher | 5 (100.0%) | 0 (0.0%) |
Occupancy by Age of Householder in Cats Bridge
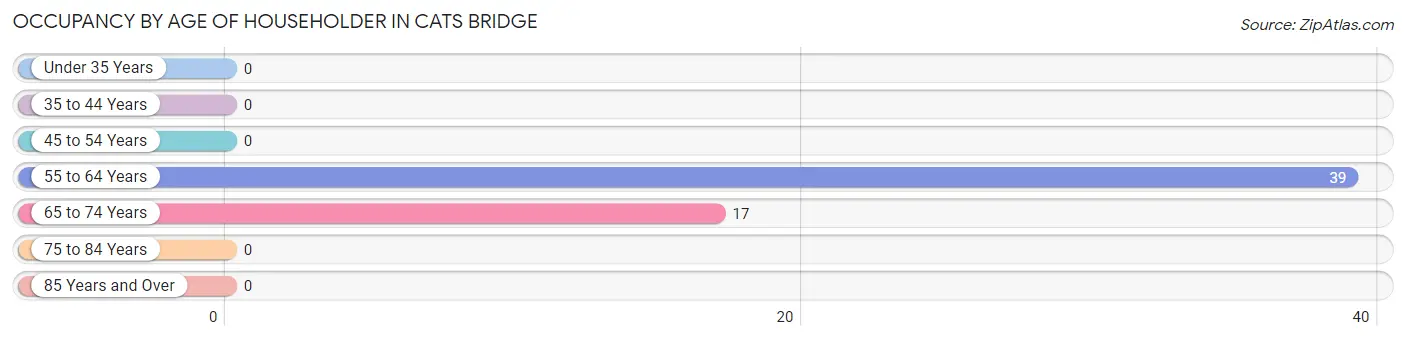
| Age Bracket | # Households | % Households |
| Under 35 Years | 0 | 0.0% |
| 35 to 44 Years | 0 | 0.0% |
| 45 to 54 Years | 0 | 0.0% |
| 55 to 64 Years | 39 | 69.6% |
| 65 to 74 Years | 17 | 30.4% |
| 75 to 84 Years | 0 | 0.0% |
| 85 Years and Over | 0 | 0.0% |
| Total | 56 | 100.0% |
Housing Finances in Cats Bridge
Median Income by Occupancy in Cats Bridge
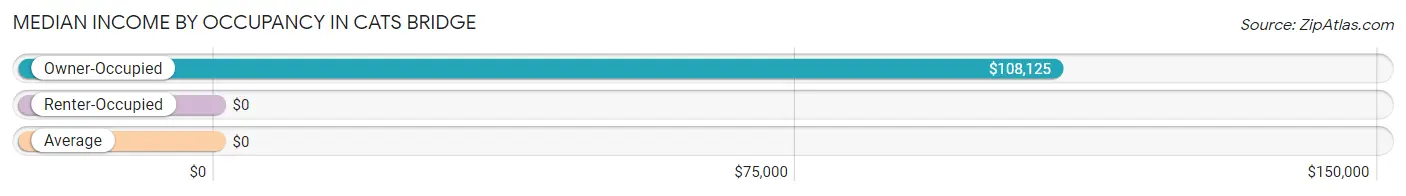
| Occupancy Type | # Households | Median Income |
| Owner-Occupied | 22 (39.3%) | $108,125 |
| Renter-Occupied | 34 (60.7%) | $0 |
| Average | 56 (100.0%) | $0 |
Occupancy by Householder Income Bracket in Cats Bridge
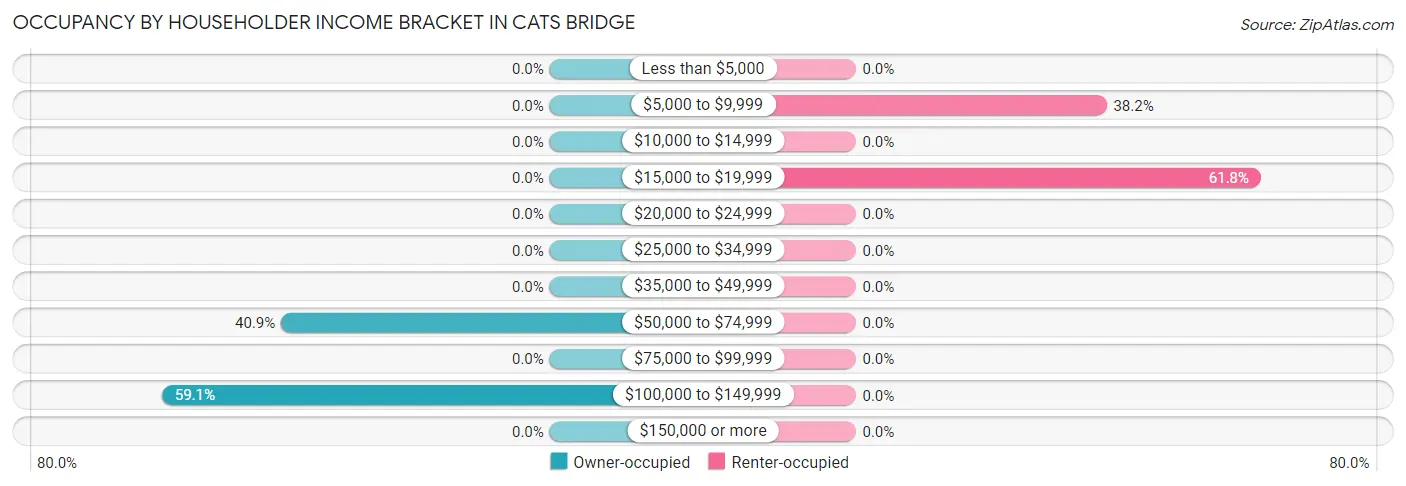
| Income Bracket | Owner-occupied | Renter-occupied |
| Less than $5,000 | 0 (0.0%) | 0 (0.0%) |
| $5,000 to $9,999 | 0 (0.0%) | 13 (38.2%) |
| $10,000 to $14,999 | 0 (0.0%) | 0 (0.0%) |
| $15,000 to $19,999 | 0 (0.0%) | 21 (61.8%) |
| $20,000 to $24,999 | 0 (0.0%) | 0 (0.0%) |
| $25,000 to $34,999 | 0 (0.0%) | 0 (0.0%) |
| $35,000 to $49,999 | 0 (0.0%) | 0 (0.0%) |
| $50,000 to $74,999 | 9 (40.9%) | 0 (0.0%) |
| $75,000 to $99,999 | 0 (0.0%) | 0 (0.0%) |
| $100,000 to $149,999 | 13 (59.1%) | 0 (0.0%) |
| $150,000 or more | 0 (0.0%) | 0 (0.0%) |
| Total | 22 (100.0%) | 34 (100.0%) |
Monthly Housing Cost Tiers in Cats Bridge
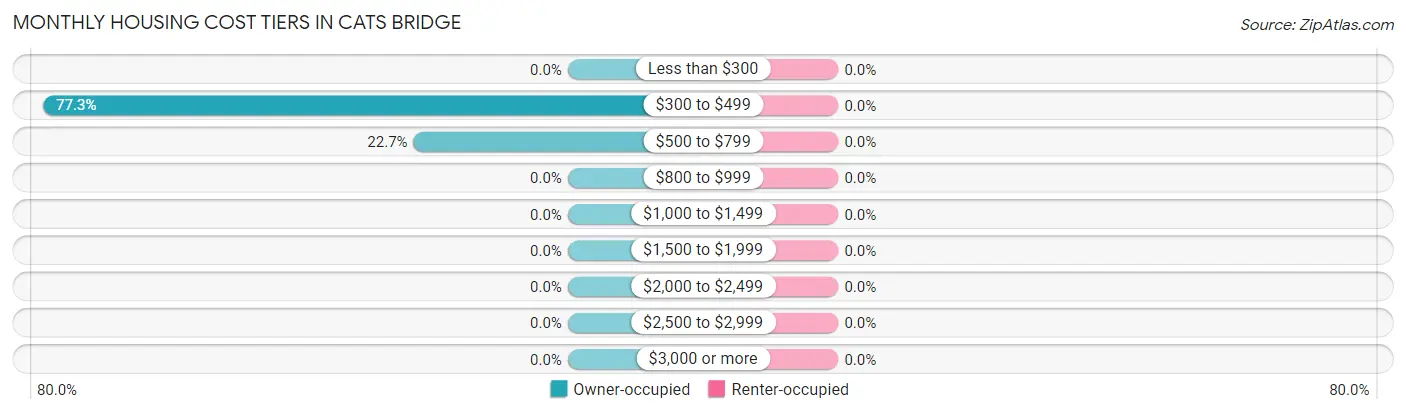
| Monthly Cost | Owner-occupied | Renter-occupied |
| Less than $300 | 0 (0.0%) | 0 (0.0%) |
| $300 to $499 | 17 (77.3%) | 0 (0.0%) |
| $500 to $799 | 5 (22.7%) | 0 (0.0%) |
| $800 to $999 | 0 (0.0%) | 0 (0.0%) |
| $1,000 to $1,499 | 0 (0.0%) | 0 (0.0%) |
| $1,500 to $1,999 | 0 (0.0%) | 0 (0.0%) |
| $2,000 to $2,499 | 0 (0.0%) | 0 (0.0%) |
| $2,500 to $2,999 | 0 (0.0%) | 0 (0.0%) |
| $3,000 or more | 0 (0.0%) | 0 (0.0%) |
| Total | 22 (100.0%) | 34 (100.0%) |
Physical Housing Characteristics in Cats Bridge
Housing Structures in Cats Bridge
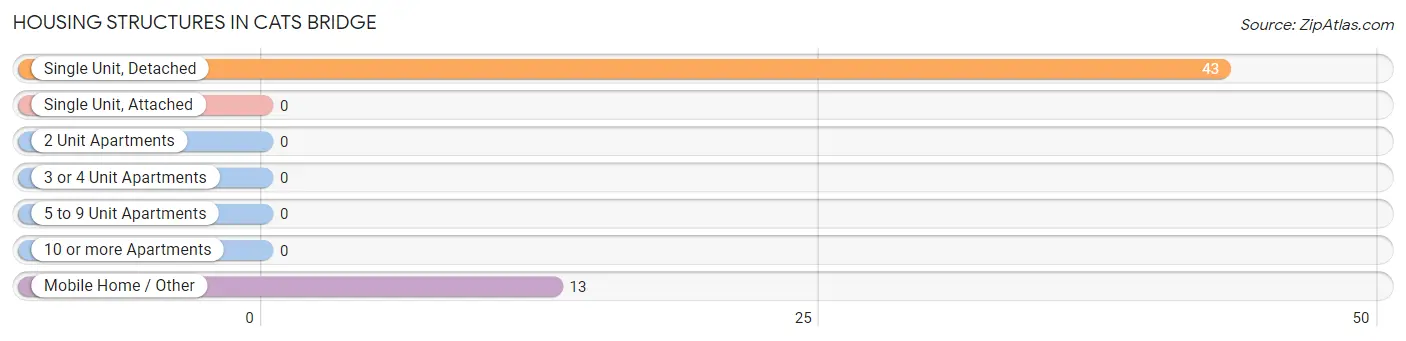
| Structure Type | # Housing Units | % Housing Units |
| Single Unit, Detached | 43 | 76.8% |
| Single Unit, Attached | 0 | 0.0% |
| 2 Unit Apartments | 0 | 0.0% |
| 3 or 4 Unit Apartments | 0 | 0.0% |
| 5 to 9 Unit Apartments | 0 | 0.0% |
| 10 or more Apartments | 0 | 0.0% |
| Mobile Home / Other | 13 | 23.2% |
| Total | 56 | 100.0% |
Housing Structures by Occupancy in Cats Bridge
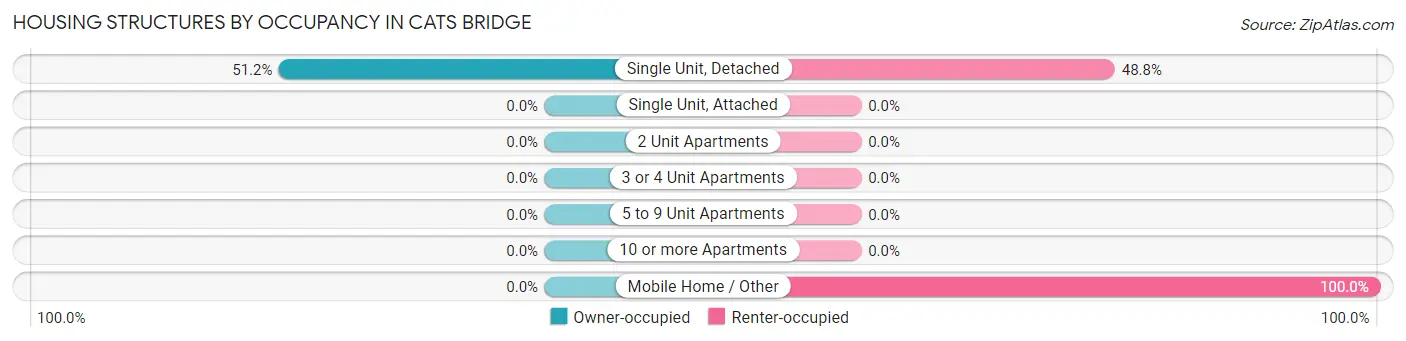
| Structure Type | Owner-occupied | Renter-occupied |
| Single Unit, Detached | 22 (51.2%) | 21 (48.8%) |
| Single Unit, Attached | 0 (0.0%) | 0 (0.0%) |
| 2 Unit Apartments | 0 (0.0%) | 0 (0.0%) |
| 3 or 4 Unit Apartments | 0 (0.0%) | 0 (0.0%) |
| 5 to 9 Unit Apartments | 0 (0.0%) | 0 (0.0%) |
| 10 or more Apartments | 0 (0.0%) | 0 (0.0%) |
| Mobile Home / Other | 0 (0.0%) | 13 (100.0%) |
| Total | 22 (39.3%) | 34 (60.7%) |
Housing Structures by Number of Rooms in Cats Bridge
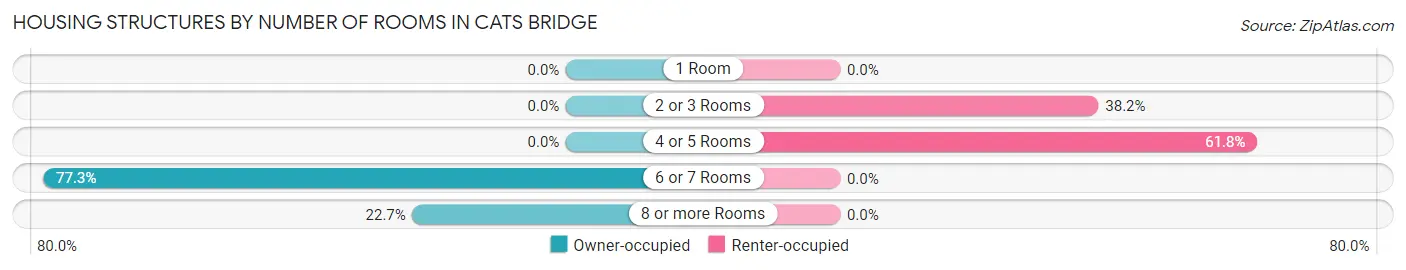
| Number of Rooms | Owner-occupied | Renter-occupied |
| 1 Room | 0 (0.0%) | 0 (0.0%) |
| 2 or 3 Rooms | 0 (0.0%) | 13 (38.2%) |
| 4 or 5 Rooms | 0 (0.0%) | 21 (61.8%) |
| 6 or 7 Rooms | 17 (77.3%) | 0 (0.0%) |
| 8 or more Rooms | 5 (22.7%) | 0 (0.0%) |
| Total | 22 (100.0%) | 34 (100.0%) |
Housing Structure by Heating Type in Cats Bridge
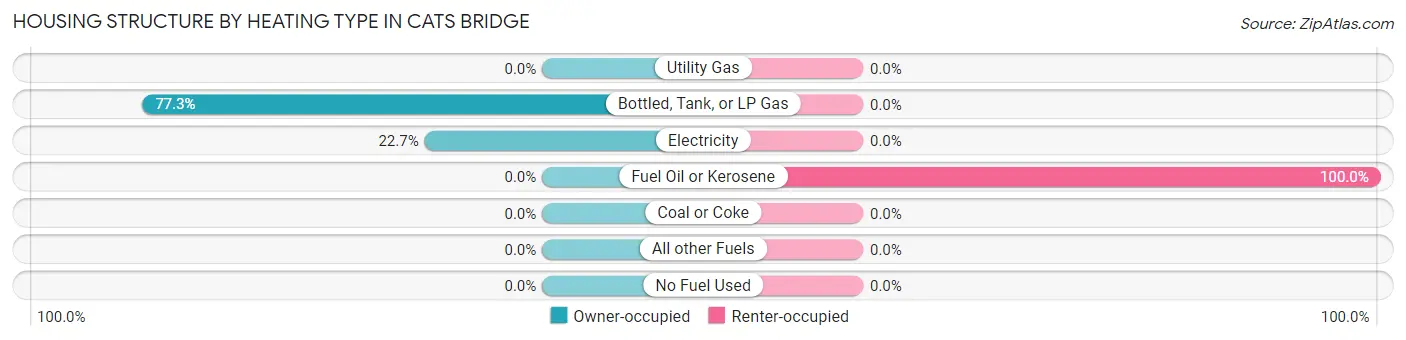
| Heating Type | Owner-occupied | Renter-occupied |
| Utility Gas | 0 (0.0%) | 0 (0.0%) |
| Bottled, Tank, or LP Gas | 17 (77.3%) | 0 (0.0%) |
| Electricity | 5 (22.7%) | 0 (0.0%) |
| Fuel Oil or Kerosene | 0 (0.0%) | 34 (100.0%) |
| Coal or Coke | 0 (0.0%) | 0 (0.0%) |
| All other Fuels | 0 (0.0%) | 0 (0.0%) |
| No Fuel Used | 0 (0.0%) | 0 (0.0%) |
| Total | 22 (100.0%) | 34 (100.0%) |
Household Vehicle Usage in Cats Bridge
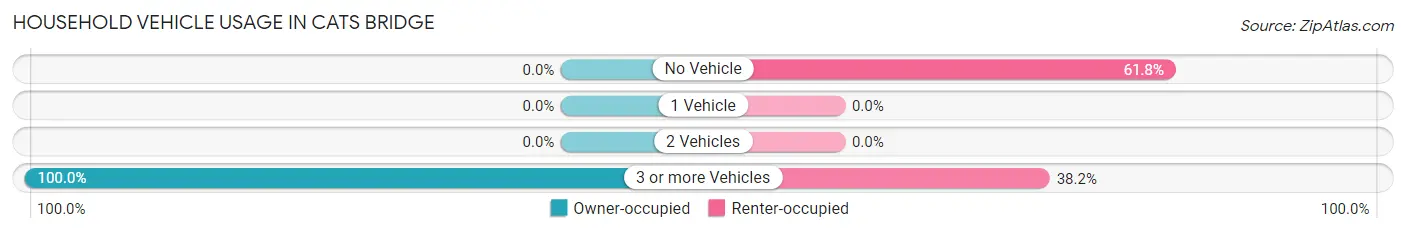
| Vehicles per Household | Owner-occupied | Renter-occupied |
| No Vehicle | 0 (0.0%) | 21 (61.8%) |
| 1 Vehicle | 0 (0.0%) | 0 (0.0%) |
| 2 Vehicles | 0 (0.0%) | 0 (0.0%) |
| 3 or more Vehicles | 22 (100.0%) | 13 (38.2%) |
| Total | 22 (100.0%) | 34 (100.0%) |
Real Estate & Mortgages in Cats Bridge
Real Estate and Mortgage Overview in Cats Bridge
| Characteristic | Without Mortgage | With Mortgage |
| Housing Units | 22 | 0 |
| Median Property Value | $108,300 | $0 |
| Median Household Income | $108,125 | $0 |
| Monthly Housing Costs | $465 | $0 |
| Real Estate Taxes | - | - |
Property Value by Mortgage Status in Cats Bridge
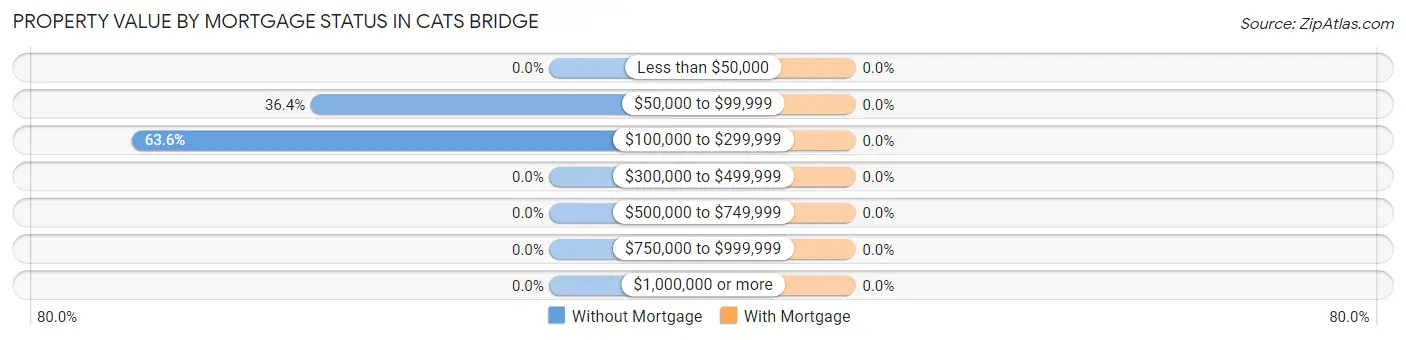
| Property Value | Without Mortgage | With Mortgage |
| Less than $50,000 | 0 (0.0%) | 0 (0.0%) |
| $50,000 to $99,999 | 8 (36.4%) | 0 (0.0%) |
| $100,000 to $299,999 | 14 (63.6%) | 0 (0.0%) |
| $300,000 to $499,999 | 0 (0.0%) | 0 (0.0%) |
| $500,000 to $749,999 | 0 (0.0%) | 0 (0.0%) |
| $750,000 to $999,999 | 0 (0.0%) | 0 (0.0%) |
| $1,000,000 or more | 0 (0.0%) | 0 (0.0%) |
| Total | 22 (100.0%) | 0 (0.0%) |
Household Income by Mortgage Status in Cats Bridge
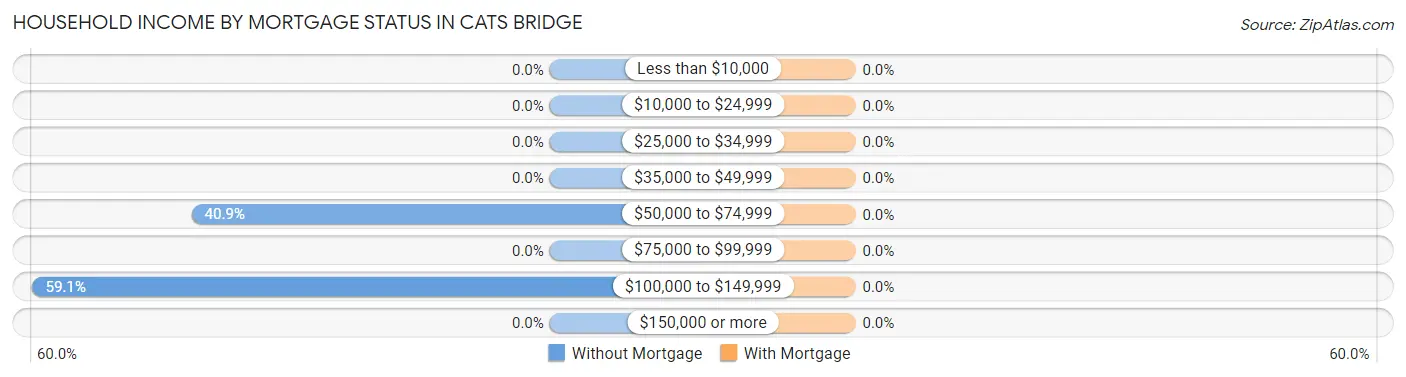
| Household Income | Without Mortgage | With Mortgage |
| Less than $10,000 | 0 (0.0%) | 0 (0.0%) |
| $10,000 to $24,999 | 0 (0.0%) | 0 (0.0%) |
| $25,000 to $34,999 | 0 (0.0%) | 0 (0.0%) |
| $35,000 to $49,999 | 0 (0.0%) | 0 (0.0%) |
| $50,000 to $74,999 | 9 (40.9%) | 0 (0.0%) |
| $75,000 to $99,999 | 0 (0.0%) | 0 (0.0%) |
| $100,000 to $149,999 | 13 (59.1%) | 0 (0.0%) |
| $150,000 or more | 0 (0.0%) | 0 (0.0%) |
| Total | 22 (100.0%) | 0 (0.0%) |
Property Value to Household Income Ratio in Cats Bridge
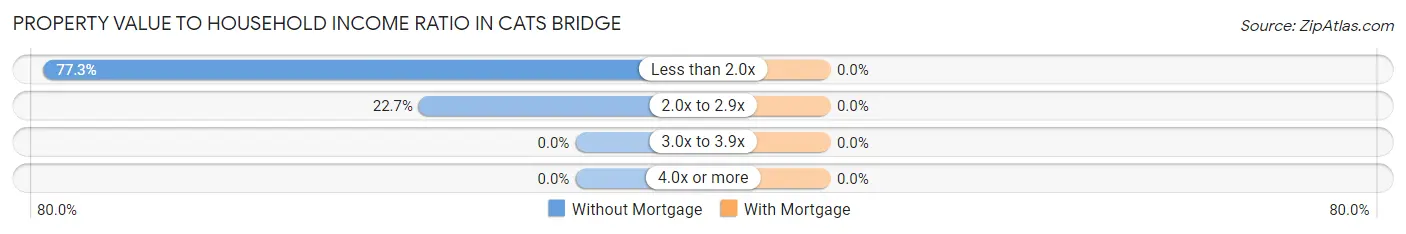
| Value-to-Income Ratio | Without Mortgage | With Mortgage |
| Less than 2.0x | 17 (77.3%) | 0 (0.0%) |
| 2.0x to 2.9x | 5 (22.7%) | 0 (0.0%) |
| 3.0x to 3.9x | 0 (0.0%) | 0 (0.0%) |
| 4.0x or more | 0 (0.0%) | 0 (0.0%) |
| Total | 22 (100.0%) | 0 (0.0%) |
Real Estate Taxes by Mortgage Status in Cats Bridge
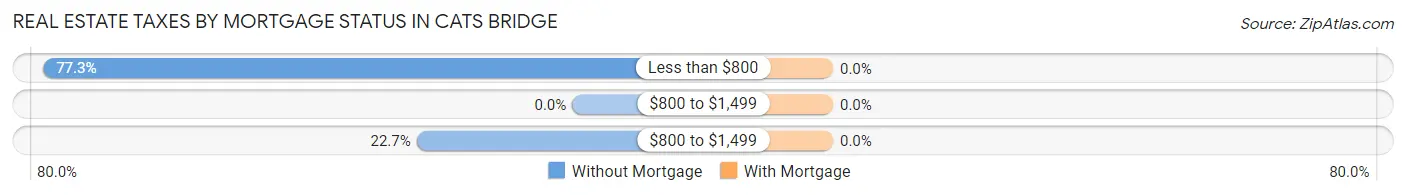
| Property Taxes | Without Mortgage | With Mortgage |
| Less than $800 | 17 (77.3%) | 0 (0.0%) |
| $800 to $1,499 | 0 (0.0%) | 0 (0.0%) |
| $800 to $1,499 | 5 (22.7%) | 0 (0.0%) |
| Total | 22 (100.0%) | 0 (0.0%) |
Health & Disability in Cats Bridge
Health Insurance Coverage by Age in Cats Bridge
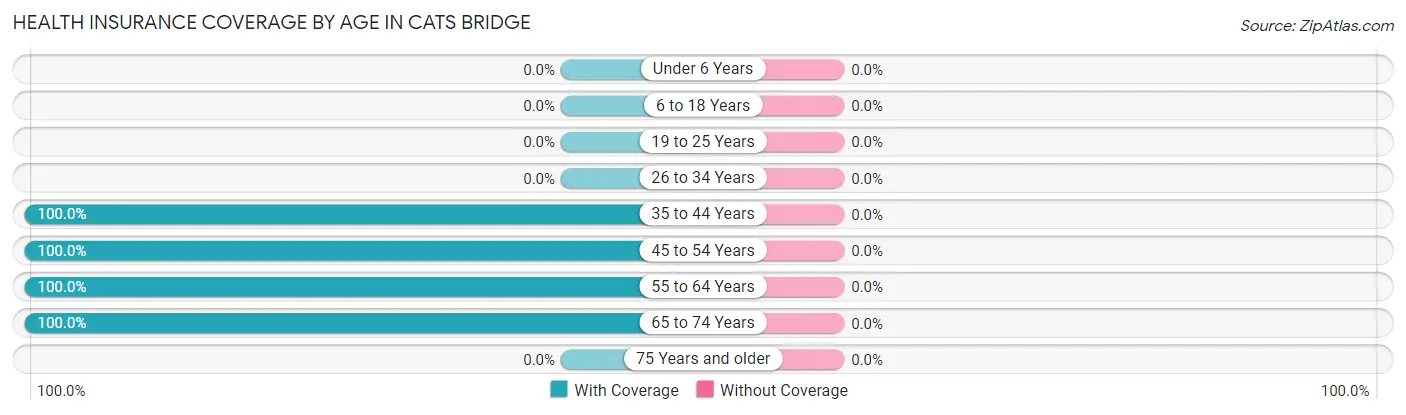
| Age Bracket | With Coverage | Without Coverage |
| Under 6 Years | 0 (0.0%) | 0 (0.0%) |
| 6 to 18 Years | 0 (0.0%) | 0 (0.0%) |
| 19 to 25 Years | 0 (0.0%) | 0 (0.0%) |
| 26 to 34 Years | 0 (0.0%) | 0 (0.0%) |
| 35 to 44 Years | 33 (100.0%) | 0 (0.0%) |
| 45 to 54 Years | 62 (100.0%) | 0 (0.0%) |
| 55 to 64 Years | 43 (100.0%) | 0 (0.0%) |
| 65 to 74 Years | 30 (100.0%) | 0 (0.0%) |
| 75 Years and older | 0 (0.0%) | 0 (0.0%) |
| Total | 168 (100.0%) | 0 (0.0%) |
Health Insurance Coverage by Citizenship Status in Cats Bridge
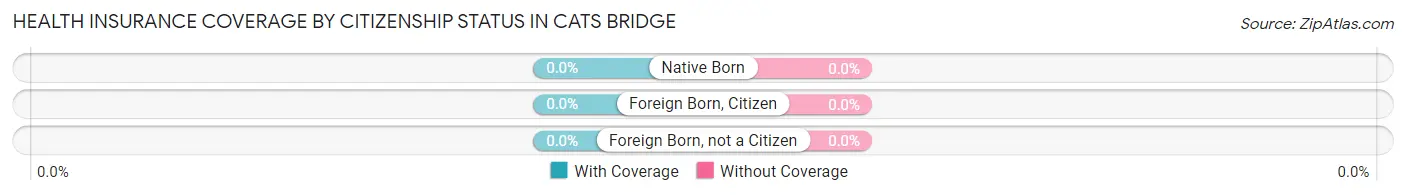
| Citizenship Status | With Coverage | Without Coverage |
| Native Born | 0 (0.0%) | 0 (0.0%) |
| Foreign Born, Citizen | 0 (0.0%) | 0 (0.0%) |
| Foreign Born, not a Citizen | 0 (0.0%) | 0 (0.0%) |
Health Insurance Coverage by Household Income in Cats Bridge
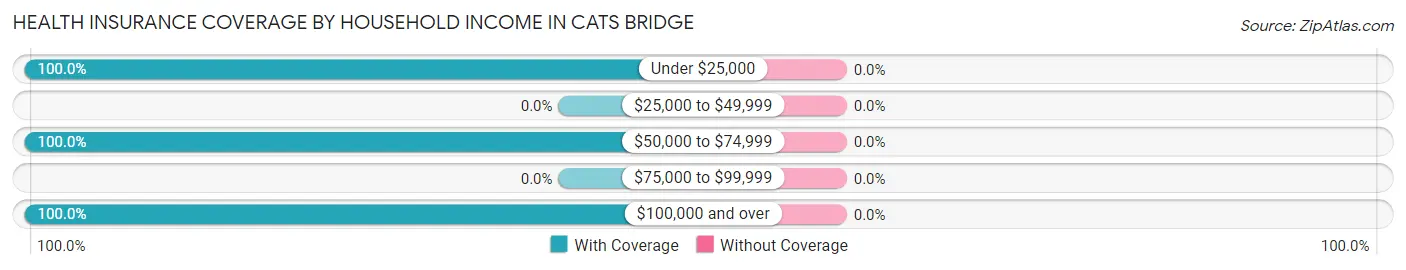
| Household Income | With Coverage | Without Coverage |
| Under $25,000 | 34 (100.0%) | 0 (0.0%) |
| $25,000 to $49,999 | 0 (0.0%) | 0 (0.0%) |
| $50,000 to $74,999 | 22 (100.0%) | 0 (0.0%) |
| $75,000 to $99,999 | 0 (0.0%) | 0 (0.0%) |
| $100,000 and over | 112 (100.0%) | 0 (0.0%) |
Public vs Private Health Insurance Coverage by Age in Cats Bridge
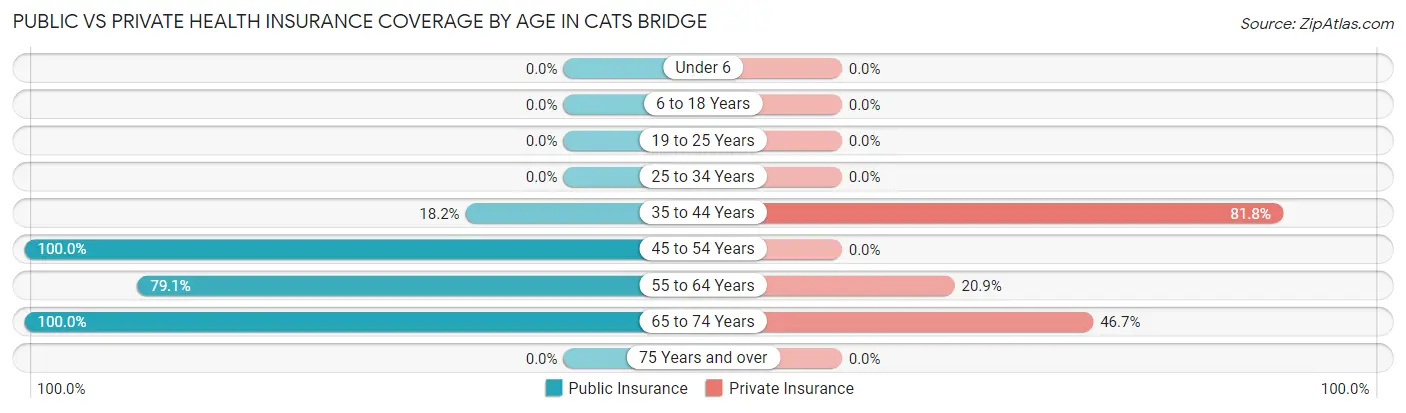
| Age Bracket | Public Insurance | Private Insurance |
| Under 6 | 0 (0.0%) | 0 (0.0%) |
| 6 to 18 Years | 0 (0.0%) | 0 (0.0%) |
| 19 to 25 Years | 0 (0.0%) | 0 (0.0%) |
| 25 to 34 Years | 0 (0.0%) | 0 (0.0%) |
| 35 to 44 Years | 6 (18.2%) | 27 (81.8%) |
| 45 to 54 Years | 62 (100.0%) | 0 (0.0%) |
| 55 to 64 Years | 34 (79.1%) | 9 (20.9%) |
| 65 to 74 Years | 30 (100.0%) | 14 (46.7%) |
| 75 Years and over | 0 (0.0%) | 0 (0.0%) |
| Total | 132 (78.6%) | 50 (29.8%) |
Disability Status by Sex by Age in Cats Bridge
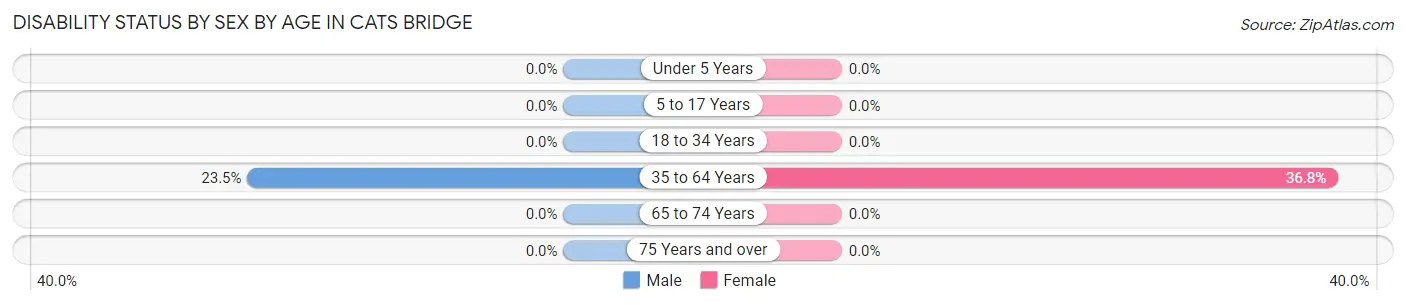
| Age Bracket | Male | Female |
| Under 5 Years | 0 (0.0%) | 0 (0.0%) |
| 5 to 17 Years | 0 (0.0%) | 0 (0.0%) |
| 18 to 34 Years | 0 (0.0%) | 0 (0.0%) |
| 35 to 64 Years | 19 (23.5%) | 21 (36.8%) |
| 65 to 74 Years | 0 (0.0%) | 0 (0.0%) |
| 75 Years and over | 0 (0.0%) | 0 (0.0%) |
Disability Class by Sex by Age in Cats Bridge
Disability Class: Hearing Difficulty
| Age Bracket | Male | Female |
| Under 5 Years | 0 (0.0%) | 0 (0.0%) |
| 5 to 17 Years | 0 (0.0%) | 0 (0.0%) |
| 18 to 34 Years | 0 (0.0%) | 0 (0.0%) |
| 35 to 64 Years | 0 (0.0%) | 0 (0.0%) |
| 65 to 74 Years | 0 (0.0%) | 0 (0.0%) |
| 75 Years and over | 0 (0.0%) | 0 (0.0%) |
Disability Class: Vision Difficulty
| Age Bracket | Male | Female |
| Under 5 Years | 0 (0.0%) | 0 (0.0%) |
| 5 to 17 Years | 0 (0.0%) | 0 (0.0%) |
| 18 to 34 Years | 0 (0.0%) | 0 (0.0%) |
| 35 to 64 Years | 0 (0.0%) | 0 (0.0%) |
| 65 to 74 Years | 0 (0.0%) | 0 (0.0%) |
| 75 Years and over | 0 (0.0%) | 0 (0.0%) |
Disability Class: Cognitive Difficulty
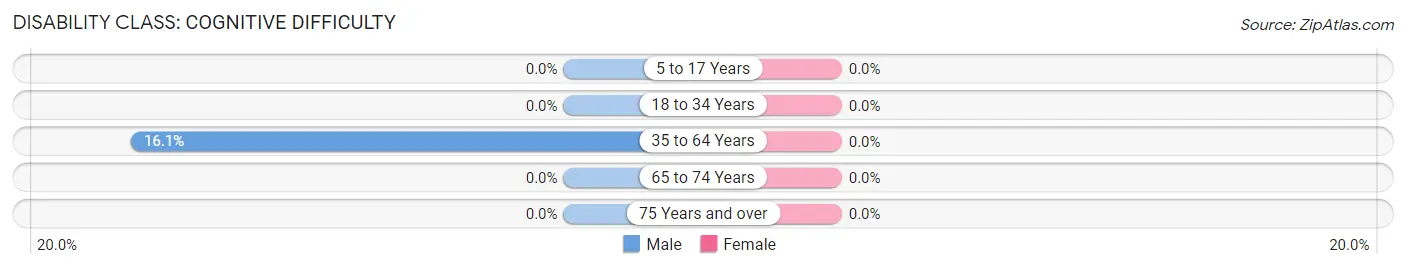
| Age Bracket | Male | Female |
| 5 to 17 Years | 0 (0.0%) | 0 (0.0%) |
| 18 to 34 Years | 0 (0.0%) | 0 (0.0%) |
| 35 to 64 Years | 13 (16.1%) | 0 (0.0%) |
| 65 to 74 Years | 0 (0.0%) | 0 (0.0%) |
| 75 Years and over | 0 (0.0%) | 0 (0.0%) |
Disability Class: Ambulatory Difficulty
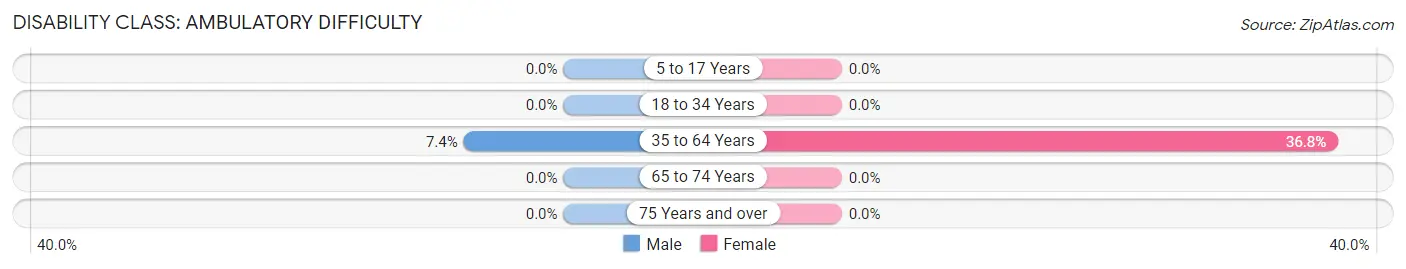
| Age Bracket | Male | Female |
| 5 to 17 Years | 0 (0.0%) | 0 (0.0%) |
| 18 to 34 Years | 0 (0.0%) | 0 (0.0%) |
| 35 to 64 Years | 6 (7.4%) | 21 (36.8%) |
| 65 to 74 Years | 0 (0.0%) | 0 (0.0%) |
| 75 Years and over | 0 (0.0%) | 0 (0.0%) |
Disability Class: Self-Care Difficulty
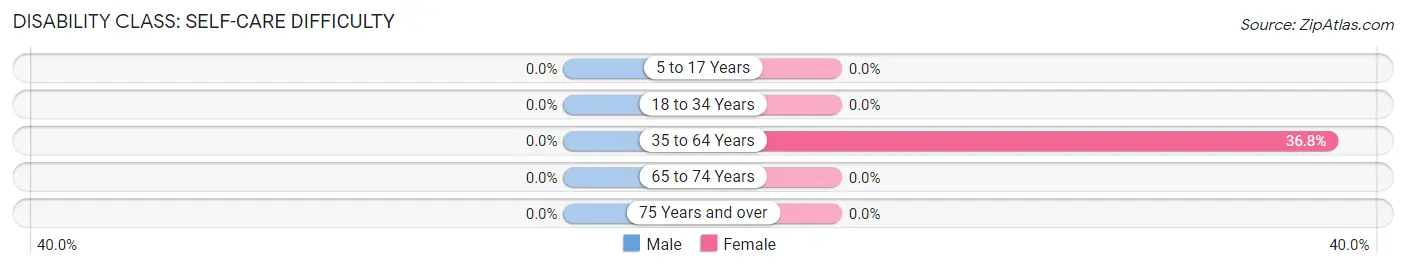
| Age Bracket | Male | Female |
| 5 to 17 Years | 0 (0.0%) | 0 (0.0%) |
| 18 to 34 Years | 0 (0.0%) | 0 (0.0%) |
| 35 to 64 Years | 0 (0.0%) | 21 (36.8%) |
| 65 to 74 Years | 0 (0.0%) | 0 (0.0%) |
| 75 Years and over | 0 (0.0%) | 0 (0.0%) |
Technology Access in Cats Bridge
Computing Device Access in Cats Bridge
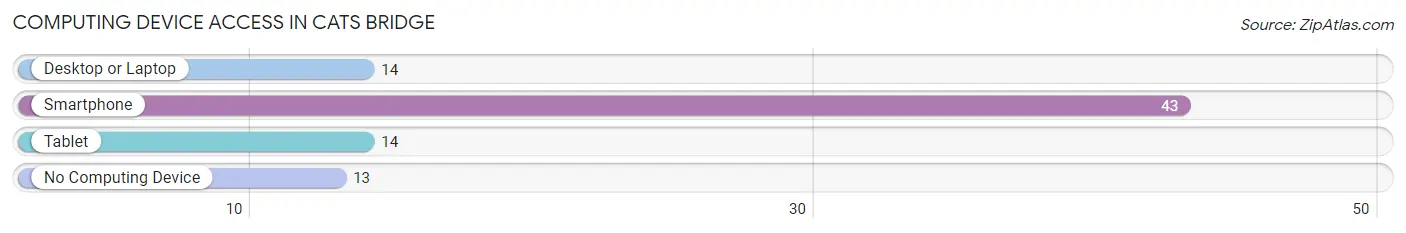
| Device Type | # Households | % Households |
| Desktop or Laptop | 14 | 25.0% |
| Smartphone | 43 | 76.8% |
| Tablet | 14 | 25.0% |
| No Computing Device | 13 | 23.2% |
| Total | 56 | 100.0% |
Internet Access in Cats Bridge
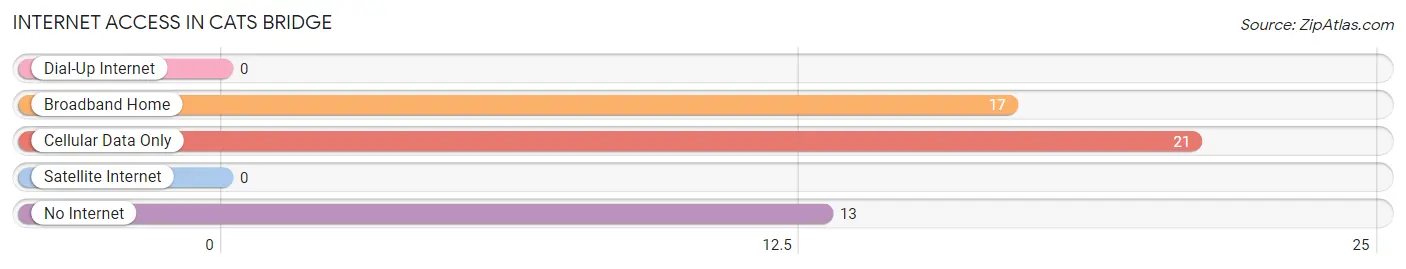
| Internet Type | # Households | % Households |
| Dial-Up Internet | 0 | 0.0% |
| Broadband Home | 17 | 30.4% |
| Cellular Data Only | 21 | 37.5% |
| Satellite Internet | 0 | 0.0% |
| No Internet | 13 | 23.2% |
| Total | 56 | 100.0% |
Cats Bridge Summary
Cats Bridge, Virginia is a small town located in the Shenandoah Valley of Virginia. It is situated in the northern part of the state, near the border of West Virginia. The town is home to a population of approximately 1,000 people, and is known for its rural charm and small-town atmosphere.
History
Cats Bridge was first settled in the late 1700s by a group of German immigrants. The town was named after a nearby bridge that was built over the Catawba River. The bridge was used by the settlers to cross the river and access the surrounding area.
In the early 1800s, the town began to grow and develop. A post office was established in 1820, and the town was officially incorporated in 1836. During this time, the town was a major stop on the Valley Turnpike, a major transportation route that connected the Shenandoah Valley to the rest of Virginia.
In the late 1800s, the town experienced a period of growth and prosperity. Several businesses were established, including a flour mill, a sawmill, and a tannery. The town also became a popular tourist destination, as it was located near the Blue Ridge Mountains and the Shenandoah National Park.
Geography
Cats Bridge is located in the northern part of Virginia, near the border of West Virginia. The town is situated in the Shenandoah Valley, which is a large valley that stretches from the Blue Ridge Mountains to the Allegheny Mountains. The town is located on the banks of the Catawba River, which is a tributary of the Potomac River.
The town is surrounded by rolling hills and lush forests. The climate in the area is temperate, with hot summers and cold winters. The average annual temperature is around 55 degrees Fahrenheit.
Economy
The economy of Cats Bridge is largely based on agriculture and tourism. The town is home to several farms, which produce a variety of crops, including corn, soybeans, and hay. The town is also home to several wineries, which produce a variety of wines.
Tourism is also an important part of the local economy. The town is located near the Blue Ridge Mountains and the Shenandoah National Park, which attract visitors from all over the country. The town also hosts several festivals and events throughout the year, which draw in visitors from the surrounding area.
Demographics
As of the 2010 census, the population of Cats Bridge was 1,000 people. The racial makeup of the town was 95.2% White, 1.2% African American, 0.7% Native American, 0.3% Asian, and 2.6% from other races. The median household income was $41,250, and the median age was 41.
Cats Bridge is a small, rural town with a strong sense of community. The town is known for its friendly atmosphere and its commitment to preserving its rural charm. The town is also home to several churches, which provide a sense of spiritual support to the community.
Common Questions
What is Per Capita Income in Cats Bridge?
Per Capita income in Cats Bridge is $21,650.
What is Inequality or Gini Index in Cats Bridge?
Inequality or Gini Index in Cats Bridge is 0.48.
What is the Total Population of Cats Bridge?
Total Population of Cats Bridge is 168.
What is the Total Male Population of Cats Bridge?
Total Male Population of Cats Bridge is 96.
What is the Total Female Population of Cats Bridge?
Total Female Population of Cats Bridge is 72.
What is the Ratio of Males per 100 Females in Cats Bridge?
There are 133.33 Males per 100 Females in Cats Bridge.
What is the Ratio of Females per 100 Males in Cats Bridge?
There are 75.00 Females per 100 Males in Cats Bridge.
What is the Median Population Age in Cats Bridge?
Median Population Age in Cats Bridge is 47.8 Years.
What is the Average Family Size in Cats Bridge
Average Family Size in Cats Bridge is 7.3 People.
What is the Average Household Size in Cats Bridge
Average Household Size in Cats Bridge is 3.0 People.
How Large is the Labor Force in Cats Bridge?
There are 59 People in the Labor Forcein in Cats Bridge.
What is the Percentage of People in the Labor Force in Cats Bridge?
35.1% of People are in the Labor Force in Cats Bridge.