Sherando, VA Map & Demographics
Sherando Map
Sherando Overview
$40,569
PER CAPITA INCOME
52.2%
WAGE / INCOME GAP [ % ]
47.8¢/ $1
WAGE / INCOME GAP [ $ ]
0.50
INEQUALITY / GINI INDEX
246
TOTAL POPULATION
135
MALE POPULATION
111
FEMALE POPULATION
121.62
MALES / 100 FEMALES
82.22
FEMALES / 100 MALES
60.9
MEDIAN AGE
2.2
AVG FAMILY SIZE
1.9
AVG HOUSEHOLD SIZE
126
LABOR FORCE [ PEOPLE ]
51.2%
PERCENT IN LABOR FORCE
Sherando Area Codes
Income in Sherando
Income Overview in Sherando
| Characteristic | Number | Measure |
| Per Capita Income | 246 | $40,569 |
| Median Family Income | 66 | $0 |
| Mean Family Income | 66 | $107,029 |
| Median Household Income | 130 | $0 |
| Mean Household Income | 130 | $70,348 |
| Income Deficit | 66 | $0 |
| Wage / Income Gap (%) | 246 | 52.22% |
| Wage / Income Gap ($) | 246 | 47.78¢ per $1 |
| Gini / Inequality Index | 246 | 0.50 |
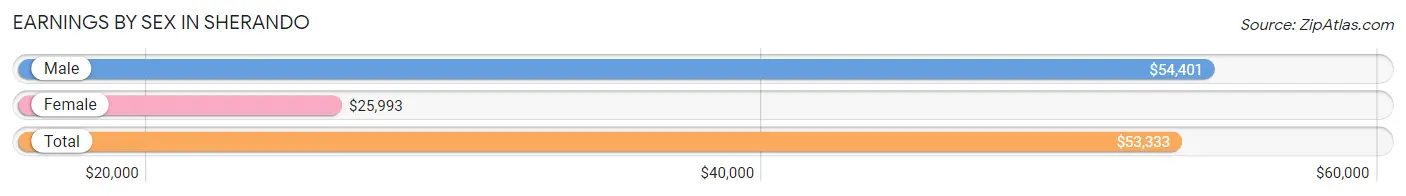
Earnings by Sex in Sherando
Average Earnings in Sherando are $53,333, $54,401 for men and $25,993 for women, a difference of 52.2%.
| Sex | Number | Average Earnings |
| Male | 85 (67.5%) | $54,401 |
| Female | 41 (32.5%) | $25,993 |
| Total | 126 (100.0%) | $53,333 |
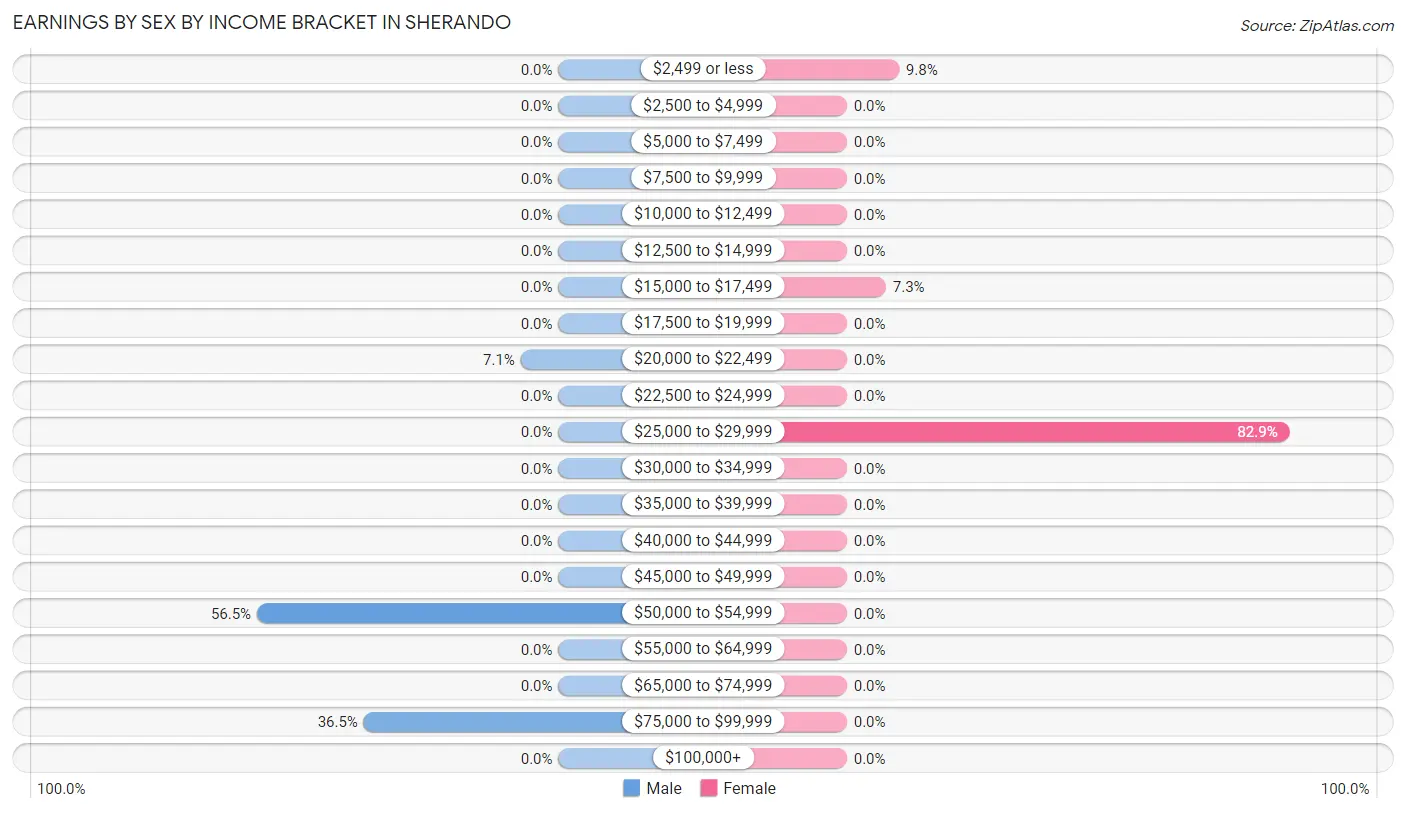
Earnings by Sex by Income Bracket in Sherando
The most common earnings brackets in Sherando are $50,000 to $54,999 for men (48 | 56.5%) and $25,000 to $29,999 for women (34 | 82.9%).
| Income | Male | Female |
| $2,499 or less | 0 (0.0%) | 4 (9.8%) |
| $2,500 to $4,999 | 0 (0.0%) | 0 (0.0%) |
| $5,000 to $7,499 | 0 (0.0%) | 0 (0.0%) |
| $7,500 to $9,999 | 0 (0.0%) | 0 (0.0%) |
| $10,000 to $12,499 | 0 (0.0%) | 0 (0.0%) |
| $12,500 to $14,999 | 0 (0.0%) | 0 (0.0%) |
| $15,000 to $17,499 | 0 (0.0%) | 3 (7.3%) |
| $17,500 to $19,999 | 0 (0.0%) | 0 (0.0%) |
| $20,000 to $22,499 | 6 (7.1%) | 0 (0.0%) |
| $22,500 to $24,999 | 0 (0.0%) | 0 (0.0%) |
| $25,000 to $29,999 | 0 (0.0%) | 34 (82.9%) |
| $30,000 to $34,999 | 0 (0.0%) | 0 (0.0%) |
| $35,000 to $39,999 | 0 (0.0%) | 0 (0.0%) |
| $40,000 to $44,999 | 0 (0.0%) | 0 (0.0%) |
| $45,000 to $49,999 | 0 (0.0%) | 0 (0.0%) |
| $50,000 to $54,999 | 48 (56.5%) | 0 (0.0%) |
| $55,000 to $64,999 | 0 (0.0%) | 0 (0.0%) |
| $65,000 to $74,999 | 0 (0.0%) | 0 (0.0%) |
| $75,000 to $99,999 | 31 (36.5%) | 0 (0.0%) |
| $100,000+ | 0 (0.0%) | 0 (0.0%) |
| Total | 85 (100.0%) | 41 (100.0%) |
Earnings by Sex by Educational Attainment in Sherando
| Educational Attainment | Male Income | Female Income |
| Less than High School | - | - |
| High School Diploma | - | - |
| College or Associate's Degree | - | - |
| Bachelor's Degree | - | - |
| Graduate Degree | - | - |
| Total | - | - |
Family Income in Sherando
Family Income Brackets in Sherando
According to the Sherando family income data, there are 31 families falling into the $150,000 to $199,999 income range, which is the most common income bracket and makes up 47.0% of all families.
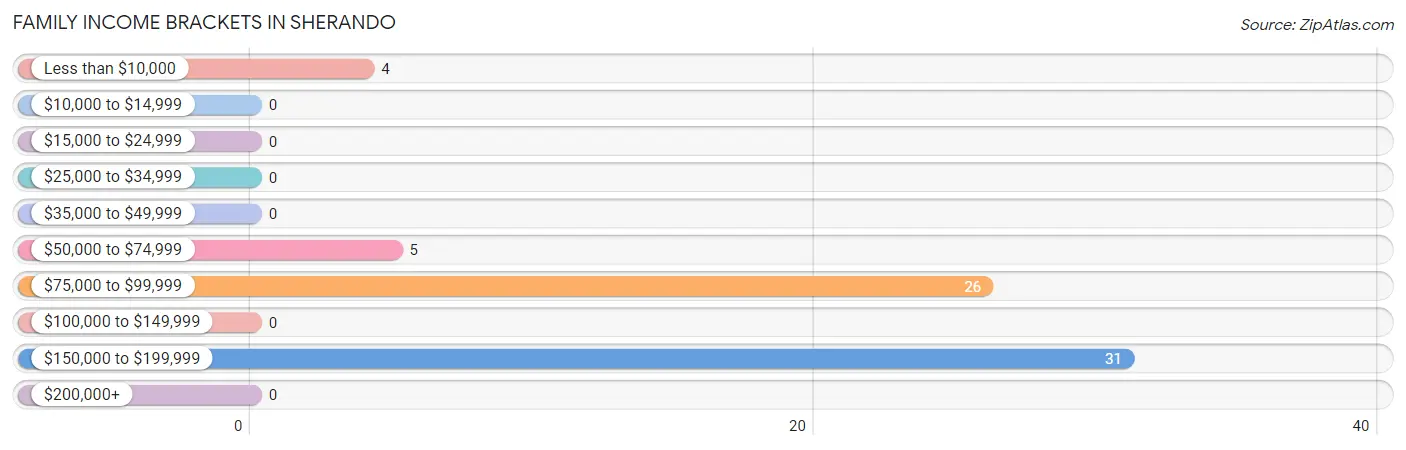
| Income Bracket | # Families | % Families |
| Less than $10,000 | 4 | 6.1% |
| $10,000 to $14,999 | 0 | 0.0% |
| $15,000 to $24,999 | 0 | 0.0% |
| $25,000 to $34,999 | 0 | 0.0% |
| $35,000 to $49,999 | 0 | 0.0% |
| $50,000 to $74,999 | 5 | 7.6% |
| $75,000 to $99,999 | 26 | 39.4% |
| $100,000 to $149,999 | 0 | 0.0% |
| $150,000 to $199,999 | 31 | 47.0% |
| $200,000+ | 0 | 0.0% |
Family Income by Famaliy Size in Sherando
| Income Bracket | # Families | Median Income |
| 2-Person Families | 66 (100.0%) | $0 |
| 3-Person Families | 0 (0.0%) | $0 |
| 4-Person Families | 0 (0.0%) | $0 |
| 5-Person Families | 0 (0.0%) | $0 |
| 6-Person Families | 0 (0.0%) | $0 |
| 7+ Person Families | 0 (0.0%) | $0 |
| Total | 66 (100.0%) | $0 |
Family Income by Number of Earners in Sherando
| Number of Earners | # Families | Median Income |
| No Earners | 30 (45.5%) | $0 |
| 1 Earner | 5 (7.6%) | $0 |
| 2 Earners | 31 (47.0%) | $0 |
| 3+ Earners | 0 (0.0%) | $0 |
| Total | 66 (100.0%) | $0 |
Household Income in Sherando
Household Income Brackets in Sherando
With 35 households falling in the category, the less than $10,000 income range is the most frequent in Sherando, accounting for 26.9% of all households.
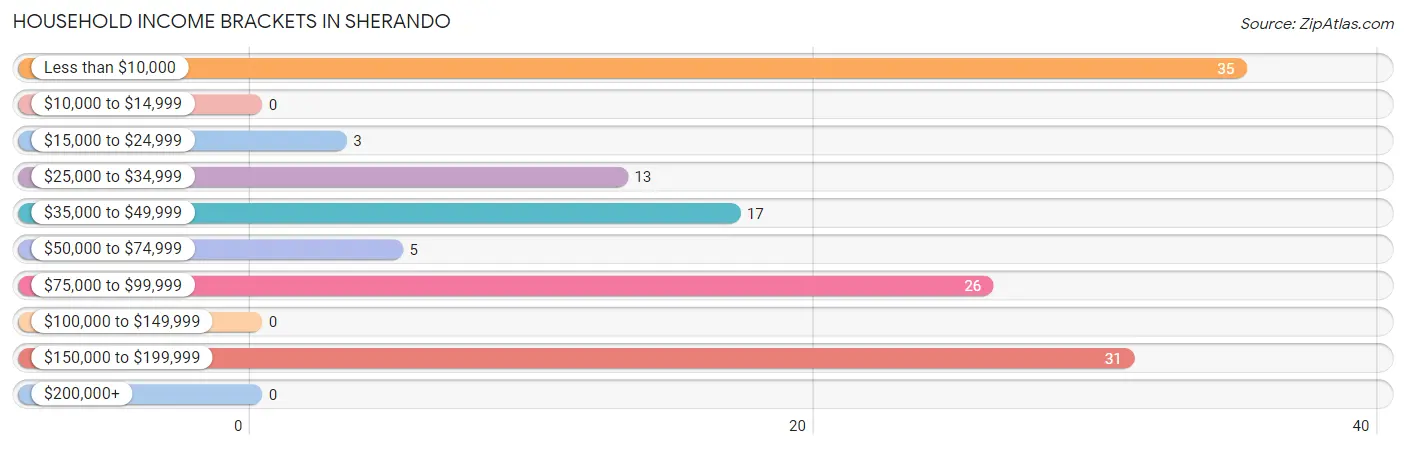
| Income Bracket | # Households | % Households |
| Less than $10,000 | 35 | 26.9% |
| $10,000 to $14,999 | 0 | 0.0% |
| $15,000 to $24,999 | 3 | 2.3% |
| $25,000 to $34,999 | 13 | 10.0% |
| $35,000 to $49,999 | 17 | 13.1% |
| $50,000 to $74,999 | 5 | 3.8% |
| $75,000 to $99,999 | 26 | 20.0% |
| $100,000 to $149,999 | 0 | 0.0% |
| $150,000 to $199,999 | 31 | 23.8% |
| $200,000+ | 0 | 0.0% |
Household Income by Householder Age in Sherando
The median household income in Sherando is $0, with the highest median household income of $178,306 found in the 45 to 64 years age bracket for the primary householder. A total of 42 households (32.3%) fall into this category.
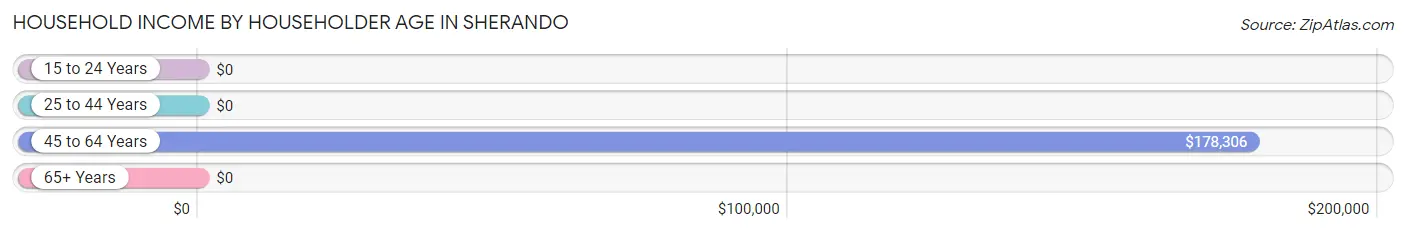
| Income Bracket | # Households | Median Income |
| 15 to 24 Years | 0 (0.0%) | $0 |
| 25 to 44 Years | 0 (0.0%) | $0 |
| 45 to 64 Years | 42 (32.3%) | $178,306 |
| 65+ Years | 88 (67.7%) | $0 |
| Total | 130 (100.0%) | $0 |
Poverty in Sherando
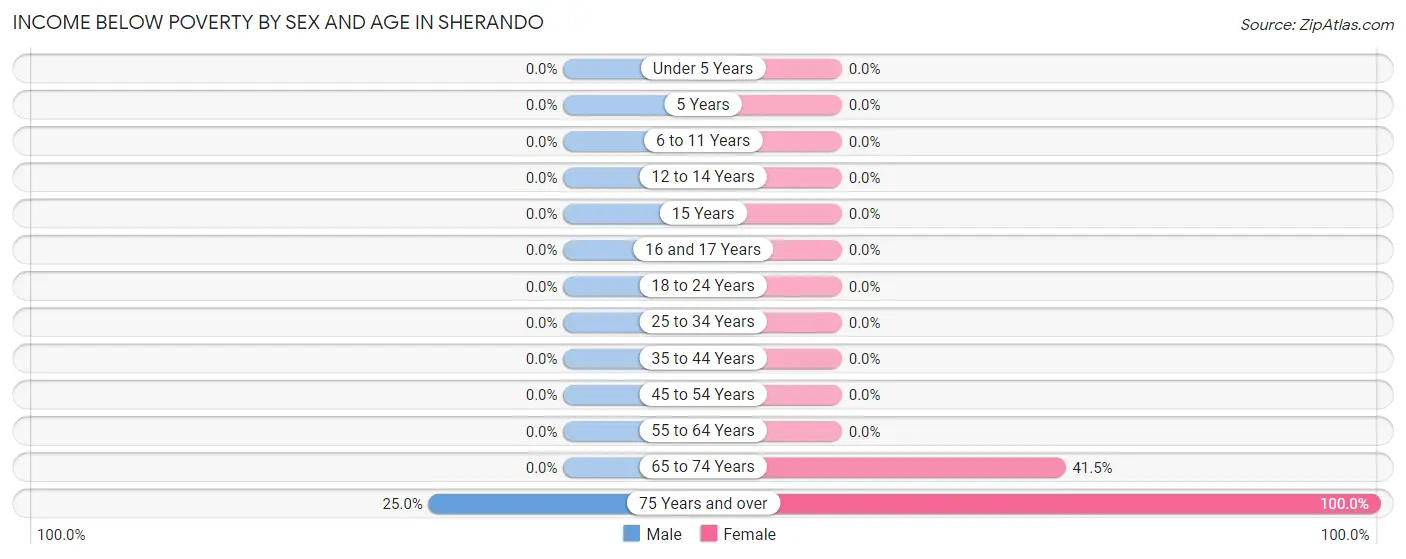
Income Below Poverty by Sex and Age in Sherando
With 4.4% poverty level for males and 31.5% for females among the residents of Sherando, 75 year old and over males and 75 year old and over females are the most vulnerable to poverty, with 6 males (25.0%) and 13 females (100.0%) in their respective age groups living below the poverty level.
| Age Bracket | Male | Female |
| Under 5 Years | 0 (0.0%) | 0 (0.0%) |
| 5 Years | 0 (0.0%) | 0 (0.0%) |
| 6 to 11 Years | 0 (0.0%) | 0 (0.0%) |
| 12 to 14 Years | 0 (0.0%) | 0 (0.0%) |
| 15 Years | 0 (0.0%) | 0 (0.0%) |
| 16 and 17 Years | 0 (0.0%) | 0 (0.0%) |
| 18 to 24 Years | 0 (0.0%) | 0 (0.0%) |
| 25 to 34 Years | 0 (0.0%) | 0 (0.0%) |
| 35 to 44 Years | 0 (0.0%) | 0 (0.0%) |
| 45 to 54 Years | 0 (0.0%) | 0 (0.0%) |
| 55 to 64 Years | 0 (0.0%) | 0 (0.0%) |
| 65 to 74 Years | 0 (0.0%) | 22 (41.5%) |
| 75 Years and over | 6 (25.0%) | 13 (100.0%) |
| Total | 6 (4.4%) | 35 (31.5%) |
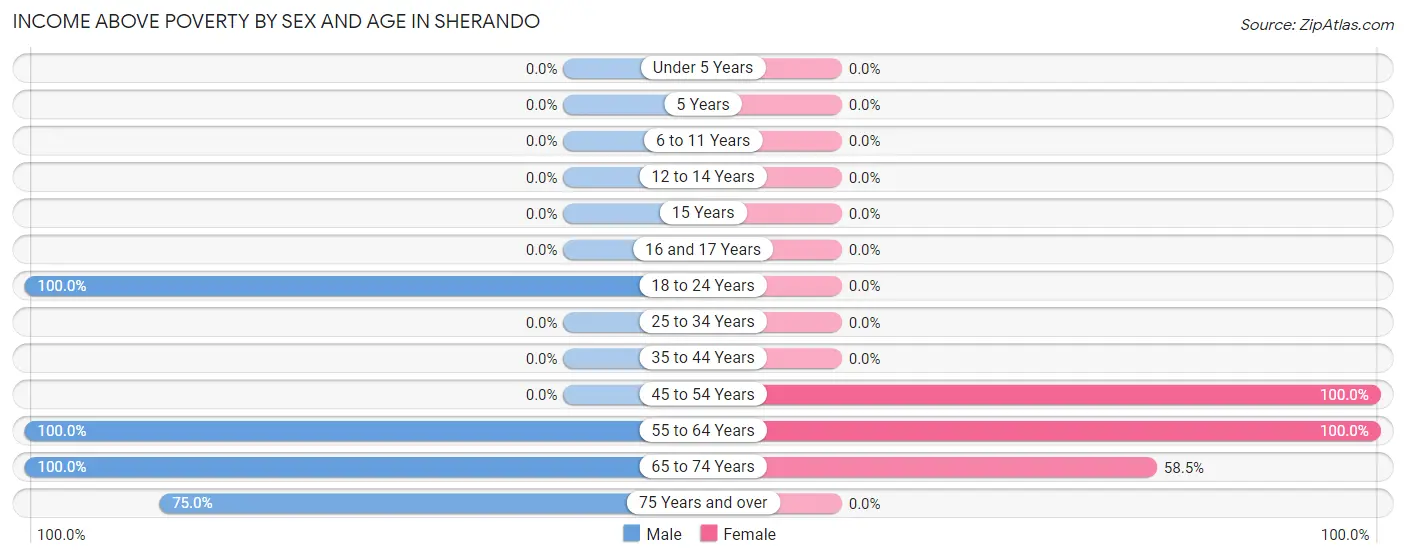
Income Above Poverty by Sex and Age in Sherando
According to the poverty statistics in Sherando, males aged 18 to 24 years and females aged 45 to 54 years are the age groups that are most secure financially, with 100.0% of males and 100.0% of females in these age groups living above the poverty line.
| Age Bracket | Male | Female |
| Under 5 Years | 0 (0.0%) | 0 (0.0%) |
| 5 Years | 0 (0.0%) | 0 (0.0%) |
| 6 to 11 Years | 0 (0.0%) | 0 (0.0%) |
| 12 to 14 Years | 0 (0.0%) | 0 (0.0%) |
| 15 Years | 0 (0.0%) | 0 (0.0%) |
| 16 and 17 Years | 0 (0.0%) | 0 (0.0%) |
| 18 to 24 Years | 48 (100.0%) | 0 (0.0%) |
| 25 to 34 Years | 0 (0.0%) | 0 (0.0%) |
| 35 to 44 Years | 0 (0.0%) | 0 (0.0%) |
| 45 to 54 Years | 0 (0.0%) | 34 (100.0%) |
| 55 to 64 Years | 31 (100.0%) | 11 (100.0%) |
| 65 to 74 Years | 32 (100.0%) | 31 (58.5%) |
| 75 Years and over | 18 (75.0%) | 0 (0.0%) |
| Total | 129 (95.6%) | 76 (68.5%) |
Income Below Poverty Among Married-Couple Families in Sherando
The poverty statistics for married-couple families in Sherando show that 13.3% or 4 of the total 30 families live below the poverty line. Families with no children have the highest poverty rate of 13.3%, comprising of 4 families. On the other hand, families with no children have the lowest poverty rate of 13.3%, which includes 4 families.
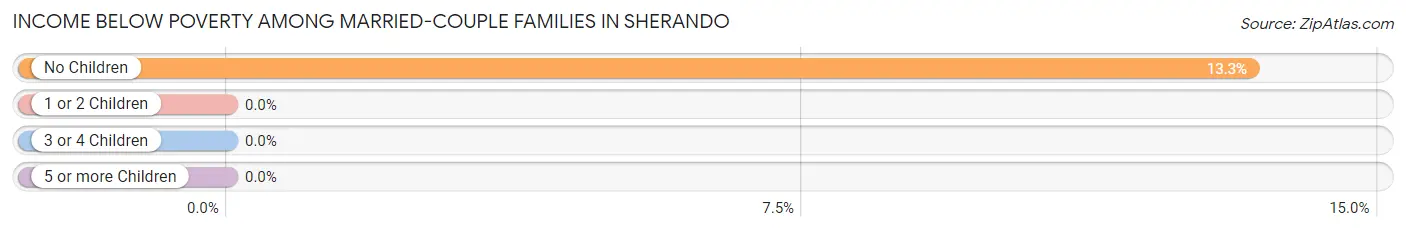
| Children | Above Poverty | Below Poverty |
| No Children | 26 (86.7%) | 4 (13.3%) |
| 1 or 2 Children | 0 (0.0%) | 0 (0.0%) |
| 3 or 4 Children | 0 (0.0%) | 0 (0.0%) |
| 5 or more Children | 0 (0.0%) | 0 (0.0%) |
| Total | 26 (86.7%) | 4 (13.3%) |
Income Below Poverty Among Single-Parent Households in Sherando
| Children | Single Father | Single Mother |
| No Children | 0 (0.0%) | 0 (0.0%) |
| 1 or 2 Children | 0 (0.0%) | 0 (0.0%) |
| 3 or 4 Children | 0 (0.0%) | 0 (0.0%) |
| 5 or more Children | 0 (0.0%) | 0 (0.0%) |
| Total | 0 (0.0%) | 0 (0.0%) |
Income Below Poverty Among Married-Couple vs Single-Parent Households in Sherando
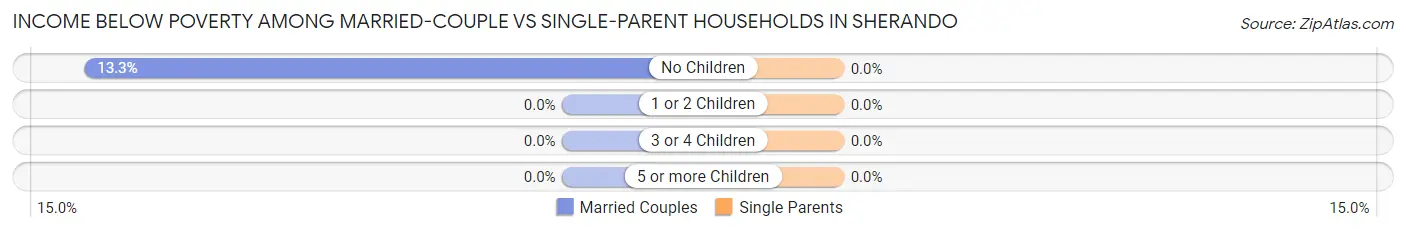
| Children | Married-Couple Families | Single-Parent Households |
| No Children | 4 (13.3%) | 0 (0.0%) |
| 1 or 2 Children | 0 (0.0%) | 0 (0.0%) |
| 3 or 4 Children | 0 (0.0%) | 0 (0.0%) |
| 5 or more Children | 0 (0.0%) | 0 (0.0%) |
| Total | 4 (13.3%) | 0 (0.0%) |
Race in Sherando
The most populous races in Sherando are , and White / Caucasian (246 | 100.0%).
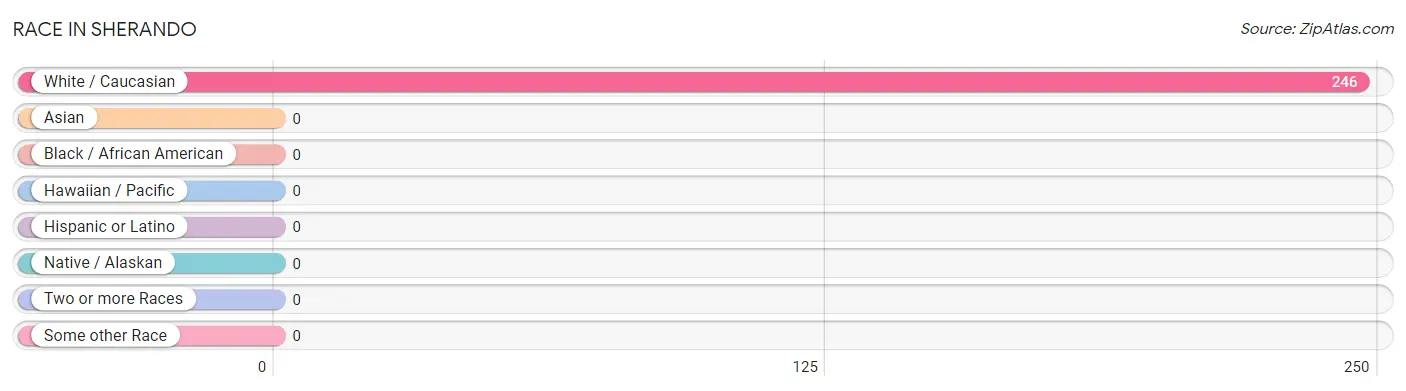
| Race | # Population | % Population |
| Asian | 0 | 0.0% |
| Black / African American | 0 | 0.0% |
| Hawaiian / Pacific | 0 | 0.0% |
| Hispanic or Latino | 0 | 0.0% |
| Native / Alaskan | 0 | 0.0% |
| White / Caucasian | 246 | 100.0% |
| Two or more Races | 0 | 0.0% |
| Some other Race | 0 | 0.0% |
| Total | 246 | 100.0% |
Ancestry in Sherando
The most populous ancestries reported in Sherando are German (31 | 12.6%), Irish (27 | 11.0%), American (26 | 10.6%), and French Canadian (4 | 1.6%), together accounting for 35.8% of all Sherando residents.
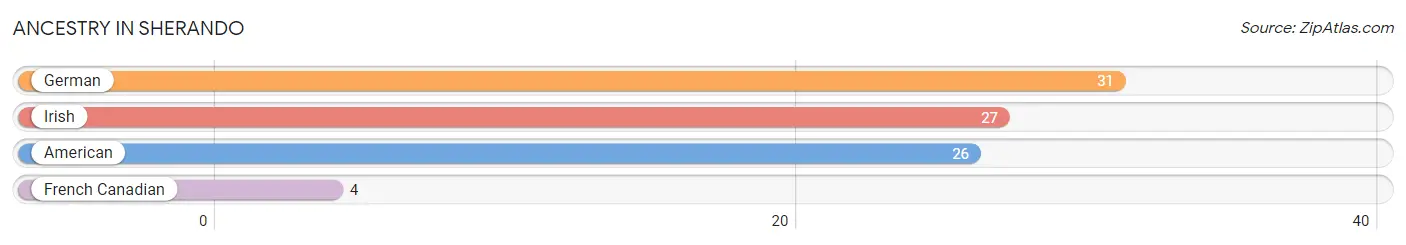
| Ancestry | # Population | % Population |
| American | 26 | 10.6% |
| French Canadian | 4 | 1.6% |
| German | 31 | 12.6% |
| Irish | 27 | 11.0% | View All 4 Rows |
Immigrants in Sherando

| Immigration Origin | # Population | % Population | View All 0 Rows |
Sex and Age in Sherando
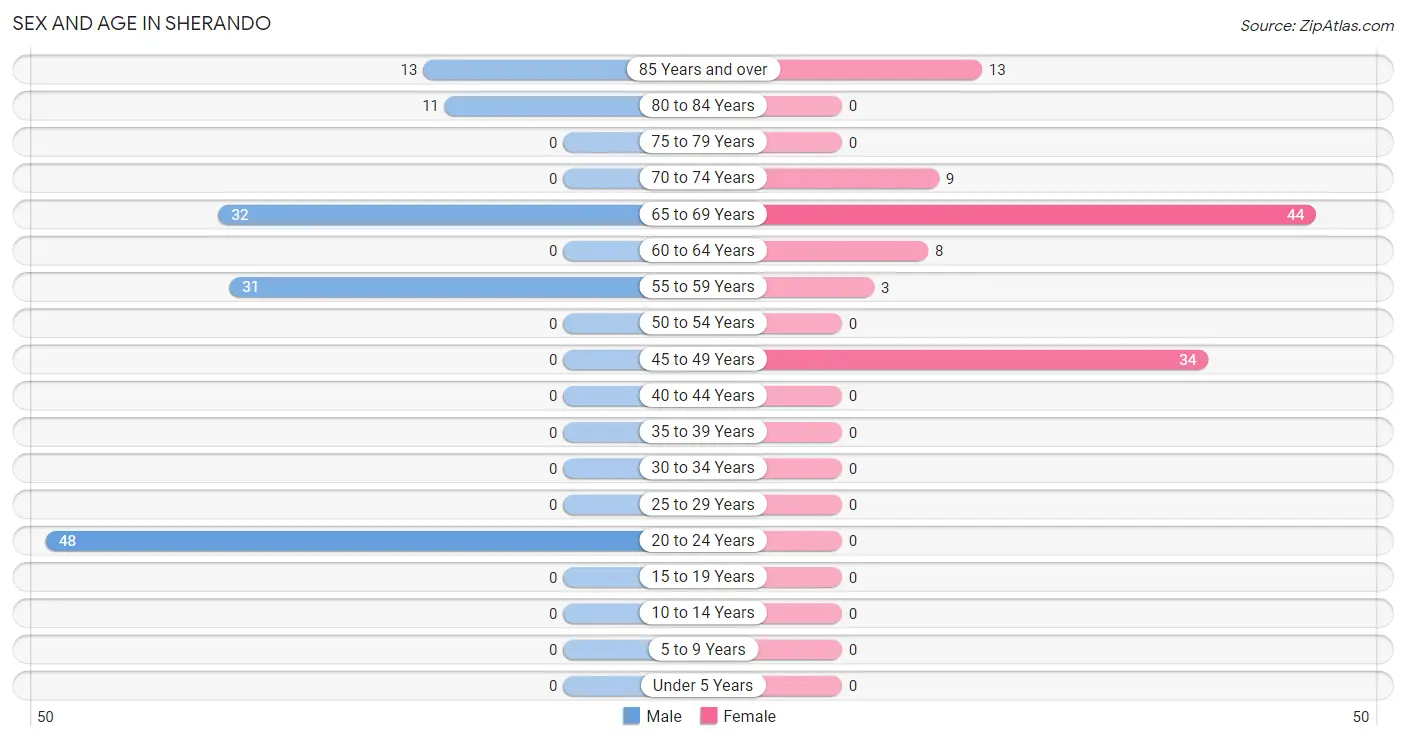
Sex and Age in Sherando
The most populous age groups in Sherando are 20 to 24 Years (48 | 35.6%) for men and 65 to 69 Years (44 | 39.6%) for women.
| Age Bracket | Male | Female |
| Under 5 Years | 0 (0.0%) | 0 (0.0%) |
| 5 to 9 Years | 0 (0.0%) | 0 (0.0%) |
| 10 to 14 Years | 0 (0.0%) | 0 (0.0%) |
| 15 to 19 Years | 0 (0.0%) | 0 (0.0%) |
| 20 to 24 Years | 48 (35.6%) | 0 (0.0%) |
| 25 to 29 Years | 0 (0.0%) | 0 (0.0%) |
| 30 to 34 Years | 0 (0.0%) | 0 (0.0%) |
| 35 to 39 Years | 0 (0.0%) | 0 (0.0%) |
| 40 to 44 Years | 0 (0.0%) | 0 (0.0%) |
| 45 to 49 Years | 0 (0.0%) | 34 (30.6%) |
| 50 to 54 Years | 0 (0.0%) | 0 (0.0%) |
| 55 to 59 Years | 31 (23.0%) | 3 (2.7%) |
| 60 to 64 Years | 0 (0.0%) | 8 (7.2%) |
| 65 to 69 Years | 32 (23.7%) | 44 (39.6%) |
| 70 to 74 Years | 0 (0.0%) | 9 (8.1%) |
| 75 to 79 Years | 0 (0.0%) | 0 (0.0%) |
| 80 to 84 Years | 11 (8.2%) | 0 (0.0%) |
| 85 Years and over | 13 (9.6%) | 13 (11.7%) |
| Total | 135 (100.0%) | 111 (100.0%) |
Families and Households in Sherando
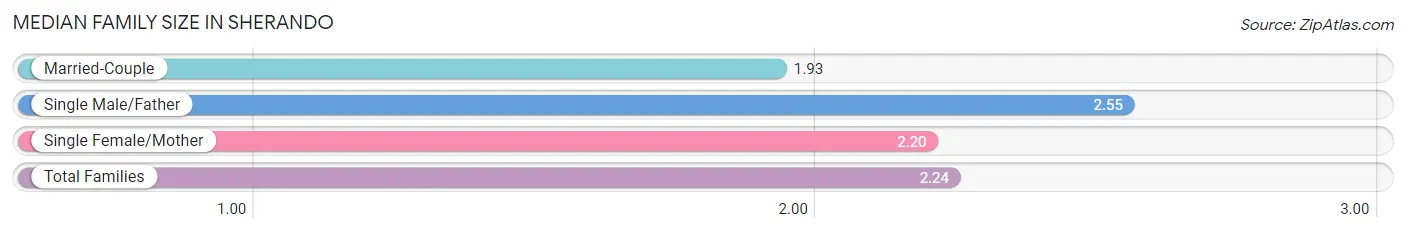
Median Family Size in Sherando
The median family size in Sherando is 2.24 persons per family, with single male/father families (31 | 47.0%) accounting for the largest median family size of 2.55 persons per family. On the other hand, married-couple families (30 | 45.5%) represent the smallest median family size with 1.93 persons per family.
| Family Type | # Families | Family Size |
| Married-Couple | 30 (45.5%) | 1.93 |
| Single Male/Father | 31 (47.0%) | 2.55 |
| Single Female/Mother | 5 (7.6%) | 2.20 |
| Total Families | 66 (100.0%) | 2.24 |
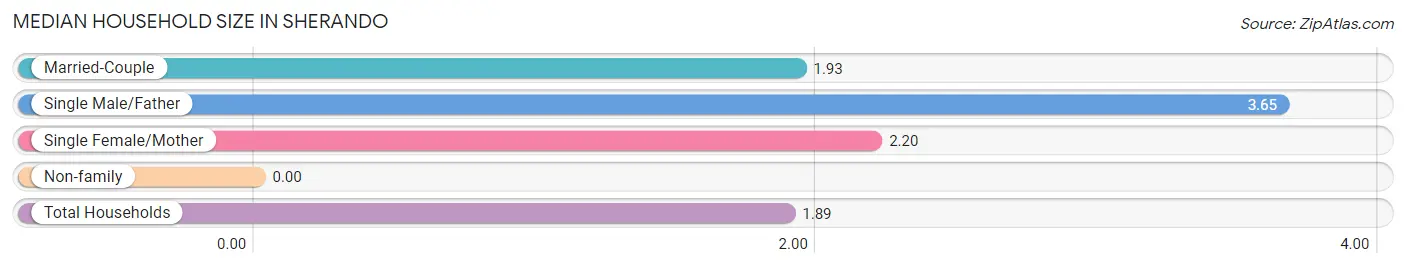
Median Household Size in Sherando
| Household Type | # Households | Household Size |
| Married-Couple | 30 (23.1%) | 1.93 |
| Single Male/Father | 31 (23.8%) | 3.65 |
| Single Female/Mother | 5 (3.8%) | 2.20 |
| Non-family | 64 (49.2%) | - |
| Total Households | 130 (100.0%) | 1.89 |
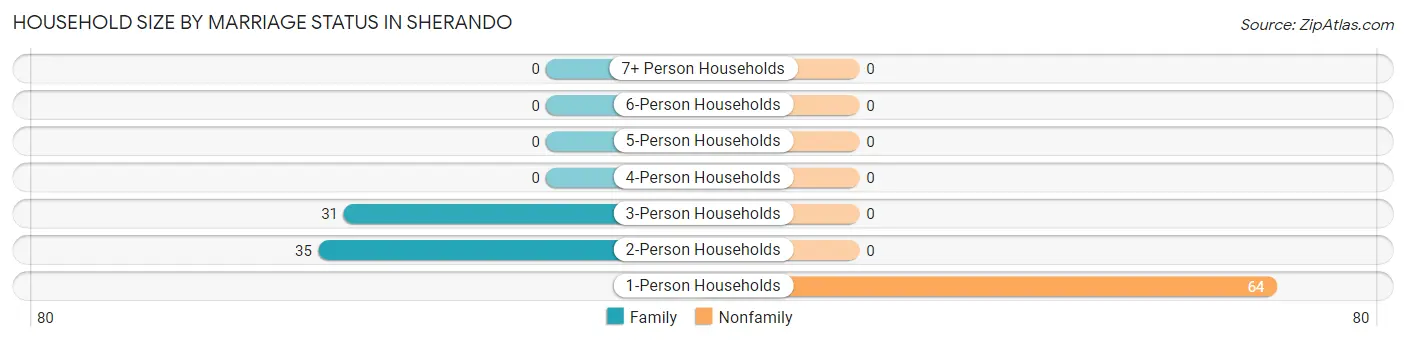
Household Size by Marriage Status in Sherando
Out of a total of 130 households in Sherando, 66 (50.8%) are family households, while 64 (49.2%) are nonfamily households. The most numerous type of family households are 2-person households, comprising 35, and the most common type of nonfamily households are 1-person households, comprising 64.
| Household Size | Family Households | Nonfamily Households |
| 1-Person Households | - | 64 (49.2%) |
| 2-Person Households | 35 (26.9%) | 0 (0.0%) |
| 3-Person Households | 31 (23.8%) | 0 (0.0%) |
| 4-Person Households | 0 (0.0%) | 0 (0.0%) |
| 5-Person Households | 0 (0.0%) | 0 (0.0%) |
| 6-Person Households | 0 (0.0%) | 0 (0.0%) |
| 7+ Person Households | 0 (0.0%) | 0 (0.0%) |
| Total | 66 (50.8%) | 64 (49.2%) |
Female Fertility in Sherando
Fertility by Age in Sherando
| Age Bracket | Women with Births | Births / 1,000 Women |
| 15 to 19 years | 0 (0.0%) | 0.0 |
| 20 to 34 years | 0 (0.0%) | 0.0 |
| 35 to 50 years | 0 (0.0%) | 0.0 |
| Total | 0 (0.0%) | 0.0 |
Fertility by Age by Marriage Status in Sherando
| Age Bracket | Married | Unmarried |
| 15 to 19 years | 0 (0.0%) | 0 (0.0%) |
| 20 to 34 years | 0 (0.0%) | 0 (0.0%) |
| 35 to 50 years | 0 (0.0%) | 0 (0.0%) |
| Total | 0 (0.0%) | 0 (0.0%) |
Fertility by Education in Sherando
| Educational Attainment | Women with Births | Births / 1,000 Women |
| Less than High School | 0 (0.0%) | 0.0 |
| High School Diploma | 0 (0.0%) | 0.0 |
| College or Associate's Degree | 0 (0.0%) | 0.0 |
| Bachelor's Degree | 0 (0.0%) | 0.0 |
| Graduate Degree | 0 (0.0%) | 0.0 |
| Total | 0 (0.0%) | 0.0 |
Fertility by Education by Marriage Status in Sherando
| Educational Attainment | Married | Unmarried |
| Less than High School | 0 (0.0%) | 0 (0.0%) |
| High School Diploma | 0 (0.0%) | 0 (0.0%) |
| College or Associate's Degree | 0 (0.0%) | 0 (0.0%) |
| Bachelor's Degree | 0 (0.0%) | 0 (0.0%) |
| Graduate Degree | 0 (0.0%) | 0 (0.0%) |
| Total | 0 (0.0%) | 0 (0.0%) |
Employment Characteristics in Sherando
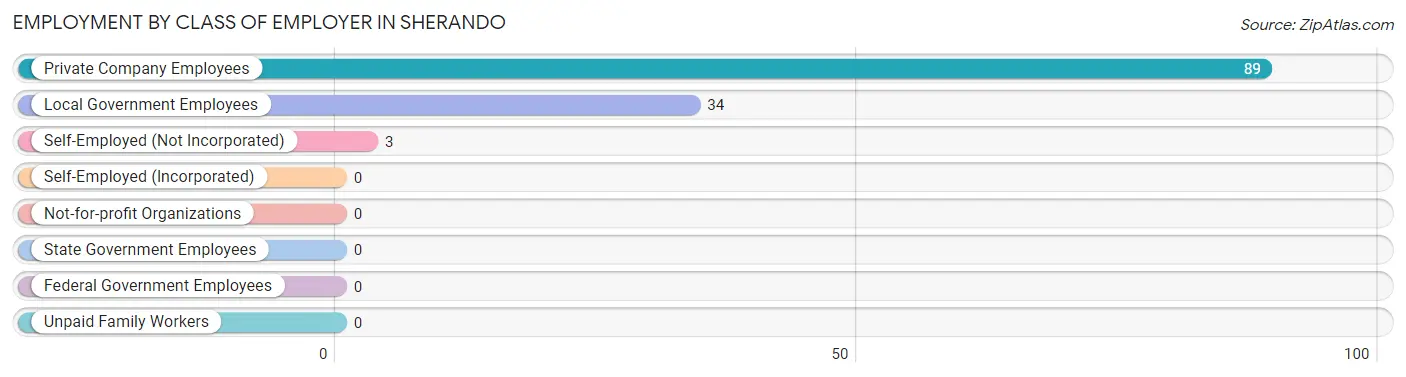
Employment by Class of Employer in Sherando
Among the 126 employed individuals in Sherando, private company employees (89 | 70.6%), local government employees (34 | 27.0%), and self-employed (not incorporated) (3 | 2.4%) make up the most common classes of employment.
| Employer Class | # Employees | % Employees |
| Private Company Employees | 89 | 70.6% |
| Self-Employed (Incorporated) | 0 | 0.0% |
| Self-Employed (Not Incorporated) | 3 | 2.4% |
| Not-for-profit Organizations | 0 | 0.0% |
| Local Government Employees | 34 | 27.0% |
| State Government Employees | 0 | 0.0% |
| Federal Government Employees | 0 | 0.0% |
| Unpaid Family Workers | 0 | 0.0% |
| Total | 126 | 100.0% |
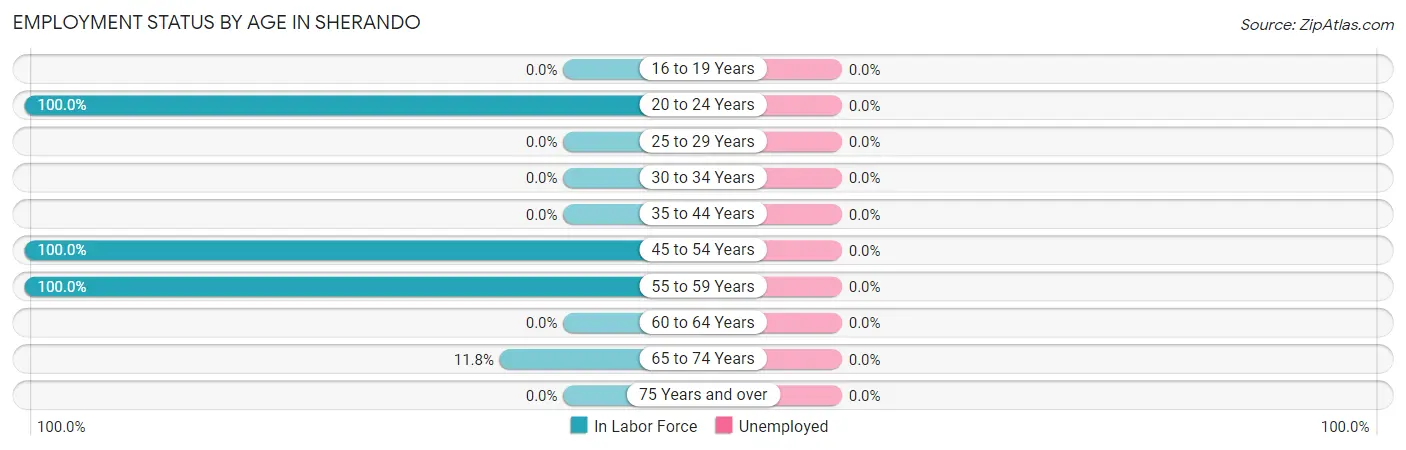
Employment Status by Age in Sherando
| Age Bracket | In Labor Force | Unemployed |
| 16 to 19 Years | 0 (0.0%) | 0 (0.0%) |
| 20 to 24 Years | 48 (100.0%) | 0 (0.0%) |
| 25 to 29 Years | 0 (0.0%) | 0 (0.0%) |
| 30 to 34 Years | 0 (0.0%) | 0 (0.0%) |
| 35 to 44 Years | 0 (0.0%) | 0 (0.0%) |
| 45 to 54 Years | 34 (100.0%) | 0 (0.0%) |
| 55 to 59 Years | 34 (100.0%) | 0 (0.0%) |
| 60 to 64 Years | 0 (0.0%) | 0 (0.0%) |
| 65 to 74 Years | 10 (11.8%) | 0 (0.0%) |
| 75 Years and over | 0 (0.0%) | 0 (0.0%) |
| Total | 126 (51.2%) | 0 (0.0%) |
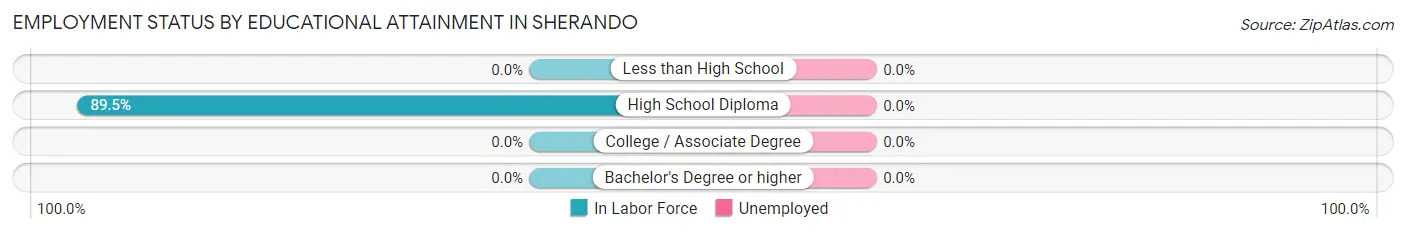
Employment Status by Educational Attainment in Sherando
| Educational Attainment | In Labor Force | Unemployed |
| Less than High School | 0 (0.0%) | 0 (0.0%) |
| High School Diploma | 68 (89.5%) | 0 (0.0%) |
| College / Associate Degree | 0 (0.0%) | 0 (0.0%) |
| Bachelor's Degree or higher | 0 (0.0%) | 0 (0.0%) |
| Total | 68 (89.5%) | 0 (0.0%) |
Employment Occupations by Sex in Sherando
Management, Business, Science and Arts Occupations
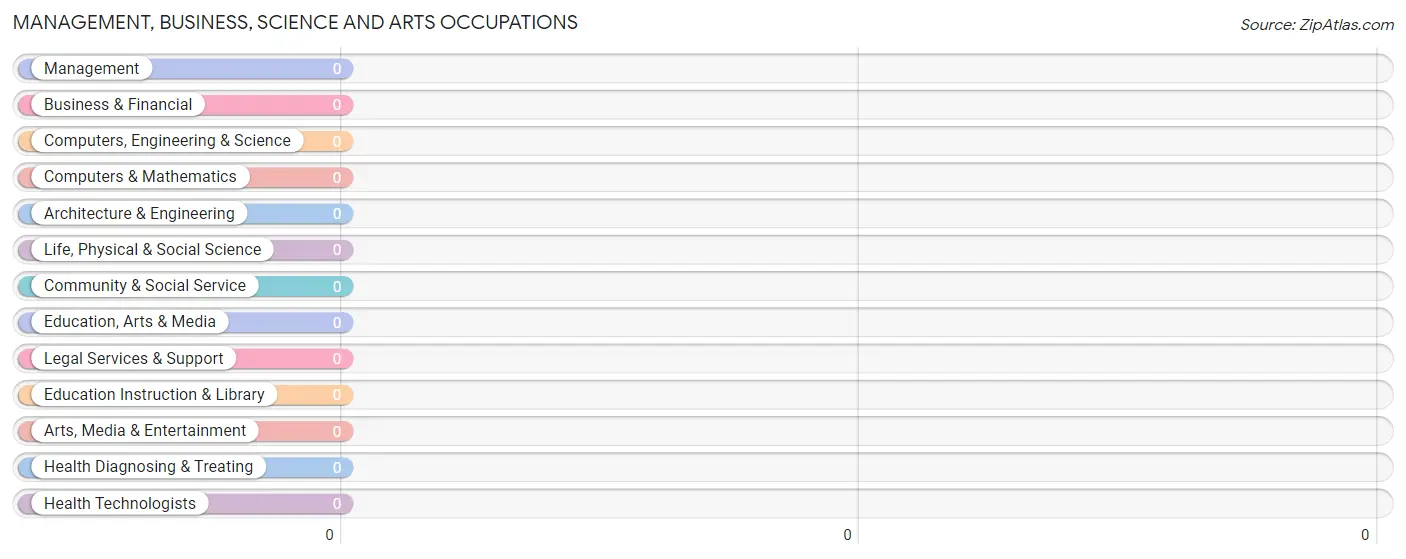
Management, Business, Science and Arts Occupations by Sex
| Occupation | Male | Female |
| Management | 0 (0.0%) | 0 (0.0%) |
| Business & Financial | 0 (0.0%) | 0 (0.0%) |
| Computers, Engineering & Science | 0 (0.0%) | 0 (0.0%) |
| Computers & Mathematics | 0 (0.0%) | 0 (0.0%) |
| Architecture & Engineering | 0 (0.0%) | 0 (0.0%) |
| Life, Physical & Social Science | 0 (0.0%) | 0 (0.0%) |
| Community & Social Service | 0 (0.0%) | 0 (0.0%) |
| Education, Arts & Media | 0 (0.0%) | 0 (0.0%) |
| Legal Services & Support | 0 (0.0%) | 0 (0.0%) |
| Education Instruction & Library | 0 (0.0%) | 0 (0.0%) |
| Arts, Media & Entertainment | 0 (0.0%) | 0 (0.0%) |
| Health Diagnosing & Treating | 0 (0.0%) | 0 (0.0%) |
| Health Technologists | 0 (0.0%) | 0 (0.0%) |
| Total (Category) | 0 (0.0%) | 0 (0.0%) |
| Total (Overall) | 85 (67.5%) | 41 (32.5%) |
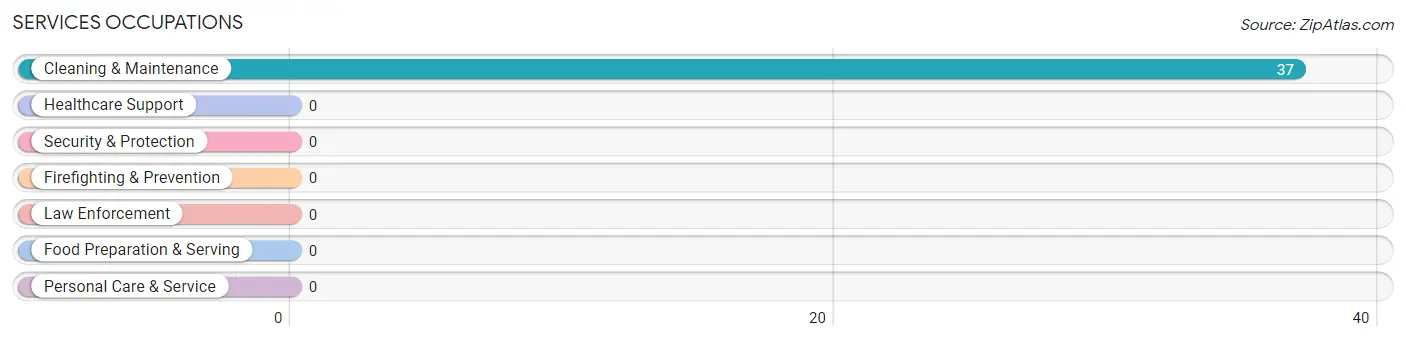
Services Occupations
The most common Services occupations in Sherando are , and Cleaning & Maintenance (37 | 29.4%).
Services Occupations by Sex
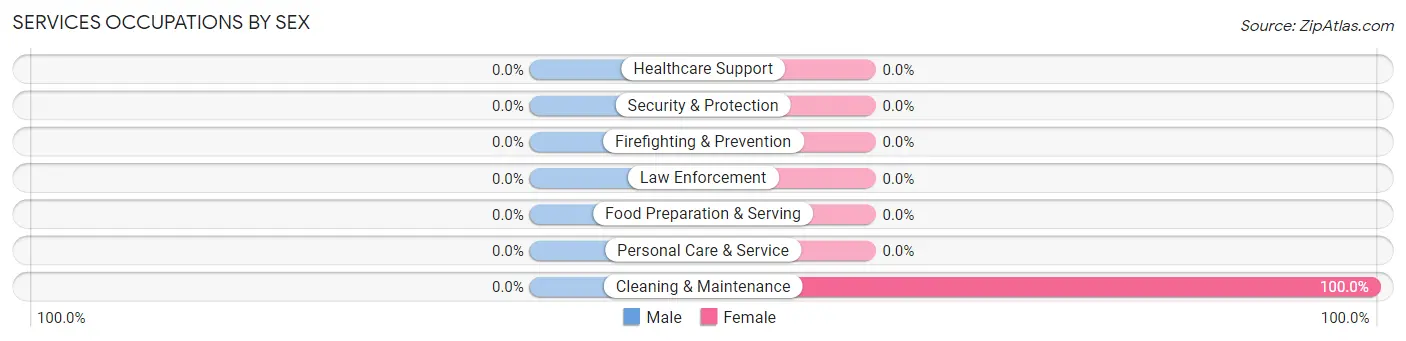
| Occupation | Male | Female |
| Healthcare Support | 0 (0.0%) | 0 (0.0%) |
| Security & Protection | 0 (0.0%) | 0 (0.0%) |
| Firefighting & Prevention | 0 (0.0%) | 0 (0.0%) |
| Law Enforcement | 0 (0.0%) | 0 (0.0%) |
| Food Preparation & Serving | 0 (0.0%) | 0 (0.0%) |
| Cleaning & Maintenance | 0 (0.0%) | 37 (100.0%) |
| Personal Care & Service | 0 (0.0%) | 0 (0.0%) |
| Total (Category) | 0 (0.0%) | 37 (100.0%) |
| Total (Overall) | 85 (67.5%) | 41 (32.5%) |
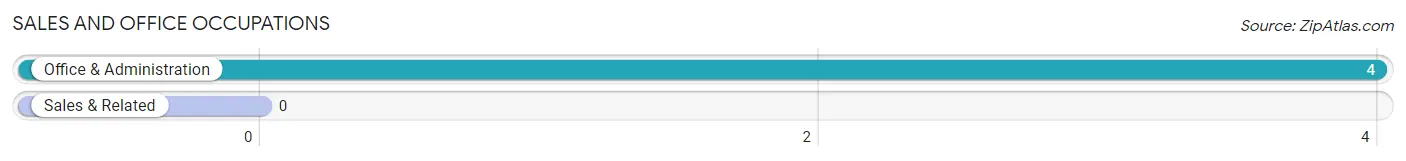
Sales and Office Occupations
The most common Sales and Office occupations in Sherando are , and Office & Administration (4 | 3.2%).
Sales and Office Occupations by Sex
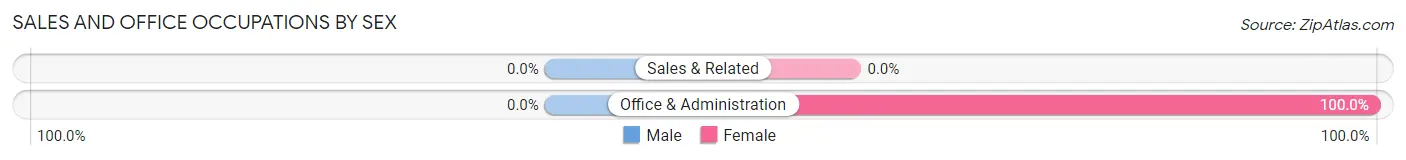
| Occupation | Male | Female |
| Sales & Related | 0 (0.0%) | 0 (0.0%) |
| Office & Administration | 0 (0.0%) | 4 (100.0%) |
| Total (Category) | 0 (0.0%) | 4 (100.0%) |
| Total (Overall) | 85 (67.5%) | 41 (32.5%) |
Natural Resources, Construction and Maintenance Occupations
The most common Natural Resources, Construction and Maintenance occupations in Sherando are , and Installation, Maintenance & Repair (48 | 38.1%).
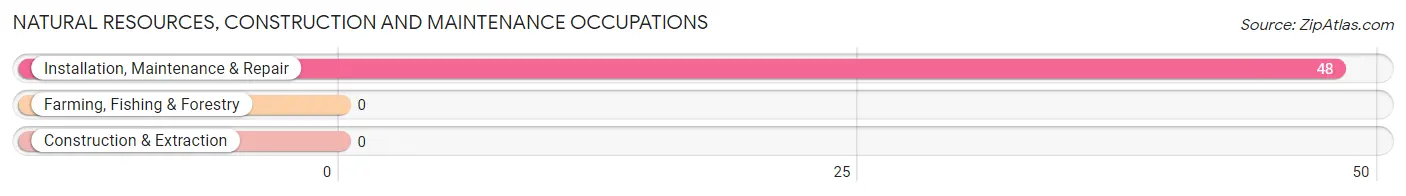
Natural Resources, Construction and Maintenance Occupations by Sex
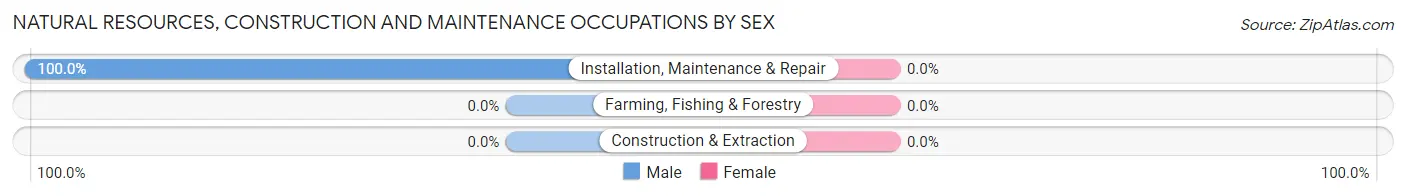
| Occupation | Male | Female |
| Farming, Fishing & Forestry | 0 (0.0%) | 0 (0.0%) |
| Construction & Extraction | 0 (0.0%) | 0 (0.0%) |
| Installation, Maintenance & Repair | 48 (100.0%) | 0 (0.0%) |
| Total (Category) | 48 (100.0%) | 0 (0.0%) |
| Total (Overall) | 85 (67.5%) | 41 (32.5%) |
Production, Transportation and Moving Occupations
The most common Production, Transportation and Moving occupations in Sherando are , and Production (37 | 29.4%).
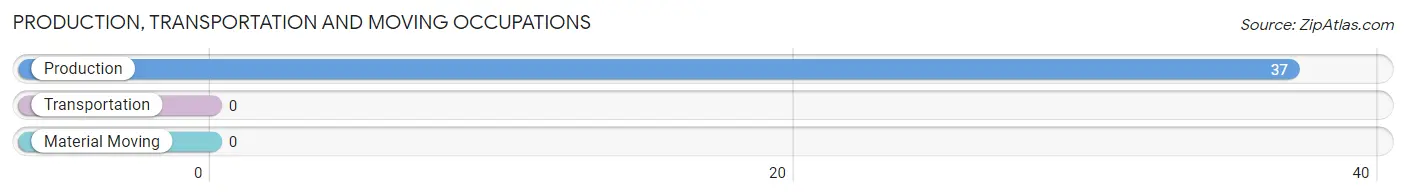
Production, Transportation and Moving Occupations by Sex
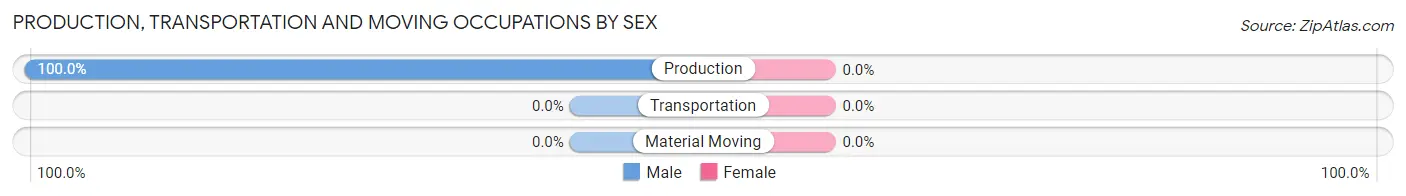
| Occupation | Male | Female |
| Production | 37 (100.0%) | 0 (0.0%) |
| Transportation | 0 (0.0%) | 0 (0.0%) |
| Material Moving | 0 (0.0%) | 0 (0.0%) |
| Total (Category) | 37 (100.0%) | 0 (0.0%) |
| Total (Overall) | 85 (67.5%) | 41 (32.5%) |
Employment Industries by Sex in Sherando
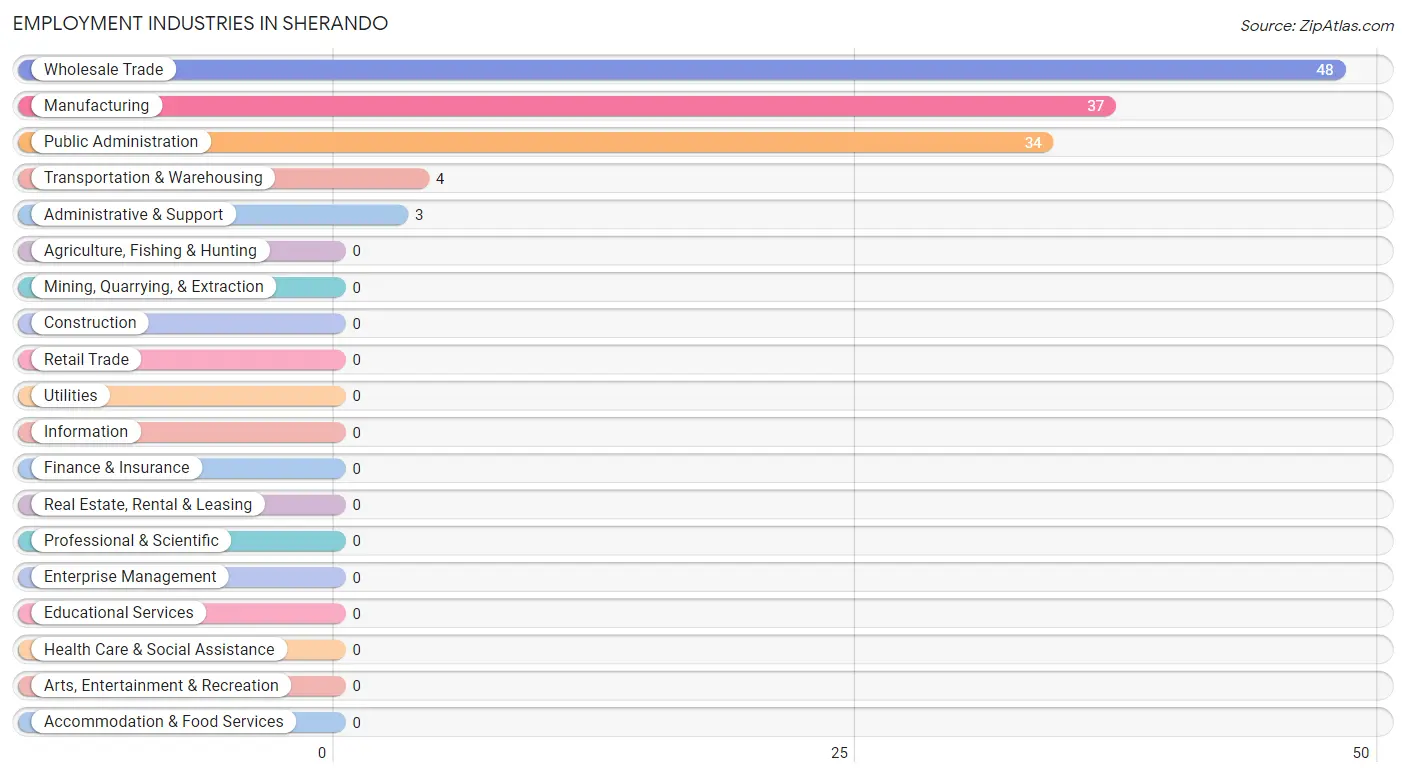
Employment Industries in Sherando
The major employment industries in Sherando include Wholesale Trade (48 | 38.1%), Manufacturing (37 | 29.4%), Public Administration (34 | 27.0%), Transportation & Warehousing (4 | 3.2%), and Administrative & Support (3 | 2.4%).
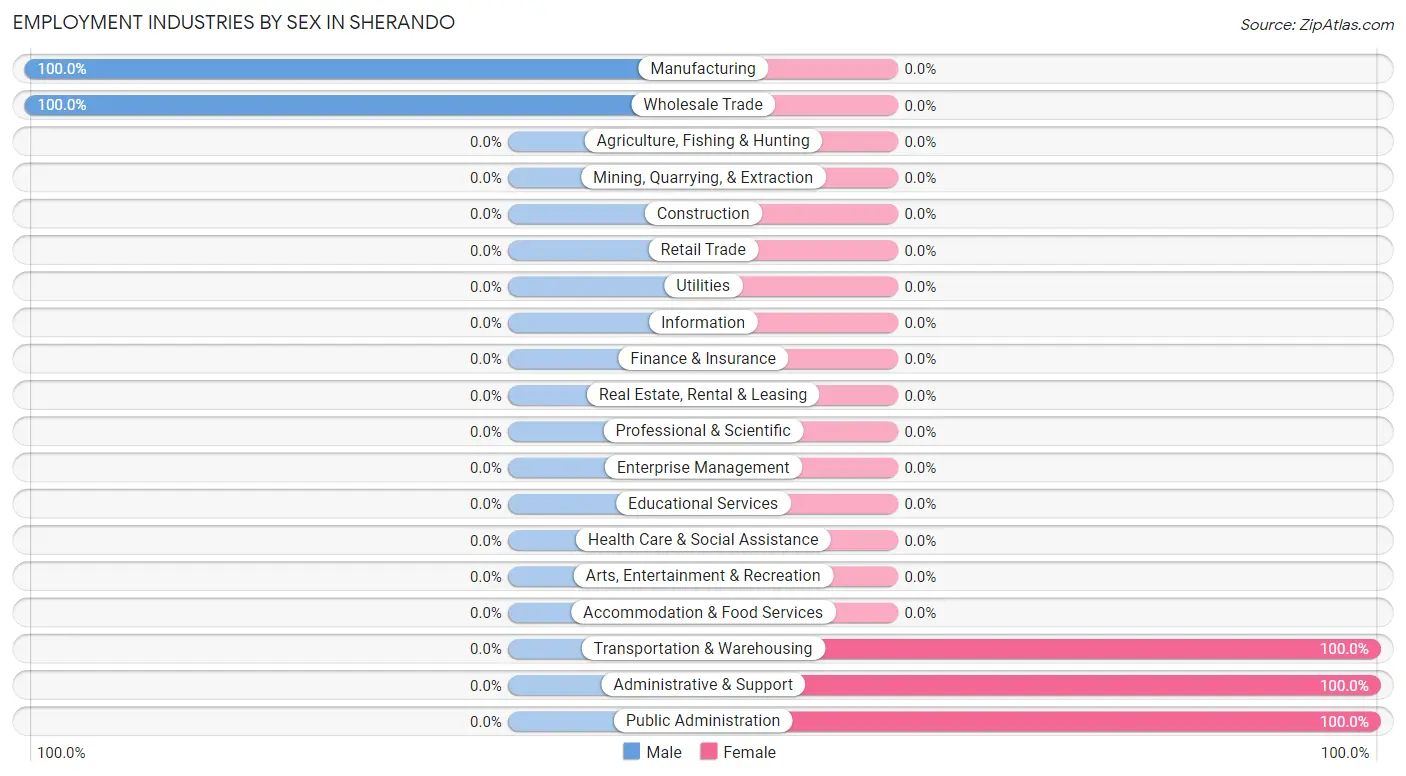
Employment Industries by Sex in Sherando
The Sherando industries that see more men than women are Manufacturing (100.0%), and Wholesale Trade (100.0%), whereas the industries that tend to have a higher number of women are Transportation & Warehousing (100.0%), Administrative & Support (100.0%), and Public Administration (100.0%).
| Industry | Male | Female |
| Agriculture, Fishing & Hunting | 0 (0.0%) | 0 (0.0%) |
| Mining, Quarrying, & Extraction | 0 (0.0%) | 0 (0.0%) |
| Construction | 0 (0.0%) | 0 (0.0%) |
| Manufacturing | 37 (100.0%) | 0 (0.0%) |
| Wholesale Trade | 48 (100.0%) | 0 (0.0%) |
| Retail Trade | 0 (0.0%) | 0 (0.0%) |
| Transportation & Warehousing | 0 (0.0%) | 4 (100.0%) |
| Utilities | 0 (0.0%) | 0 (0.0%) |
| Information | 0 (0.0%) | 0 (0.0%) |
| Finance & Insurance | 0 (0.0%) | 0 (0.0%) |
| Real Estate, Rental & Leasing | 0 (0.0%) | 0 (0.0%) |
| Professional & Scientific | 0 (0.0%) | 0 (0.0%) |
| Enterprise Management | 0 (0.0%) | 0 (0.0%) |
| Administrative & Support | 0 (0.0%) | 3 (100.0%) |
| Educational Services | 0 (0.0%) | 0 (0.0%) |
| Health Care & Social Assistance | 0 (0.0%) | 0 (0.0%) |
| Arts, Entertainment & Recreation | 0 (0.0%) | 0 (0.0%) |
| Accommodation & Food Services | 0 (0.0%) | 0 (0.0%) |
| Public Administration | 0 (0.0%) | 34 (100.0%) |
| Total | 85 (67.5%) | 41 (32.5%) |
Education in Sherando
School Enrollment in Sherando
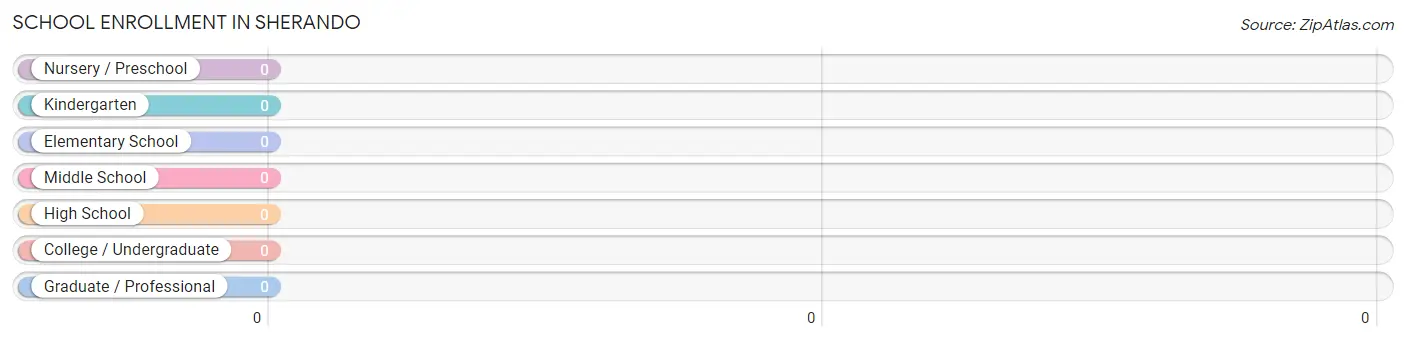
| School Level | # Students | % Students |
| Nursery / Preschool | 0 | 0.0% |
| Kindergarten | 0 | 0.0% |
| Elementary School | 0 | 0.0% |
| Middle School | 0 | 0.0% |
| High School | 0 | 0.0% |
| College / Undergraduate | 0 | 0.0% |
| Graduate / Professional | 0 | 0.0% |
| Total | 0 | 0.0% |
School Enrollment by Age by Funding Source in Sherando
| Age Bracket | Public School | Private School |
| 3 to 4 Year Olds | 0 (0.0%) | 0 (0.0%) |
| 5 to 9 Year Old | 0 (0.0%) | 0 (0.0%) |
| 10 to 14 Year Olds | 0 (0.0%) | 0 (0.0%) |
| 15 to 17 Year Olds | 0 (0.0%) | 0 (0.0%) |
| 18 to 19 Year Olds | 0 (0.0%) | 0 (0.0%) |
| 20 to 24 Year Olds | 0 (0.0%) | 0 (0.0%) |
| 25 to 34 Year Olds | 0 (0.0%) | 0 (0.0%) |
| 35 Years and over | 0 (0.0%) | 0 (0.0%) |
| Total | 0 (0.0%) | 0 (0.0%) |
Educational Attainment by Field of Study in Sherando
, and business (6 | 100.0%) are the most common fields of study among 6 individuals in Sherando who have obtained a bachelor's degree or higher.
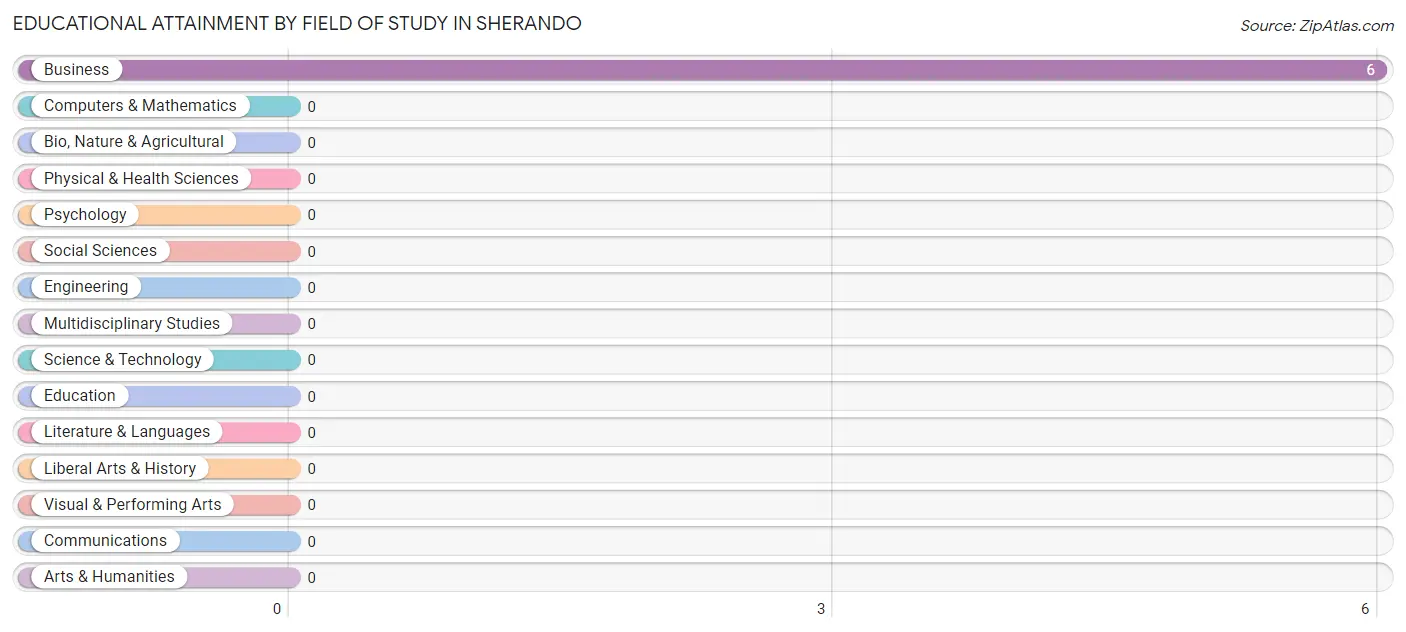
| Field of Study | # Graduates | % Graduates |
| Computers & Mathematics | 0 | 0.0% |
| Bio, Nature & Agricultural | 0 | 0.0% |
| Physical & Health Sciences | 0 | 0.0% |
| Psychology | 0 | 0.0% |
| Social Sciences | 0 | 0.0% |
| Engineering | 0 | 0.0% |
| Multidisciplinary Studies | 0 | 0.0% |
| Science & Technology | 0 | 0.0% |
| Business | 6 | 100.0% |
| Education | 0 | 0.0% |
| Literature & Languages | 0 | 0.0% |
| Liberal Arts & History | 0 | 0.0% |
| Visual & Performing Arts | 0 | 0.0% |
| Communications | 0 | 0.0% |
| Arts & Humanities | 0 | 0.0% |
| Total | 6 | 100.0% |
Transportation & Commute in Sherando
Vehicle Availability by Sex in Sherando
The most prevalent vehicle ownership categories in Sherando are males with 3 vehicles (79, accounting for 92.9%) and females with 3 vehicles (34, making up 192.7%).
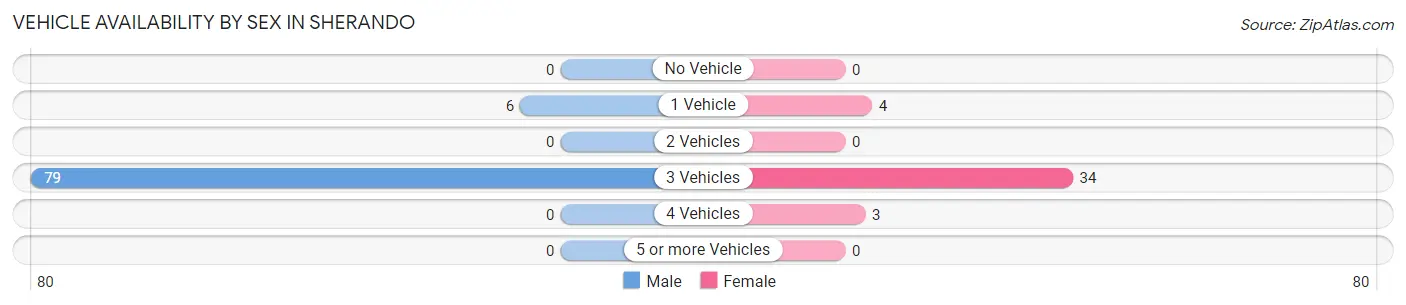
| Vehicles Available | Male | Female |
| No Vehicle | 0 (0.0%) | 0 (0.0%) |
| 1 Vehicle | 6 (7.1%) | 4 (9.8%) |
| 2 Vehicles | 0 (0.0%) | 0 (0.0%) |
| 3 Vehicles | 79 (92.9%) | 34 (82.9%) |
| 4 Vehicles | 0 (0.0%) | 3 (7.3%) |
| 5 or more Vehicles | 0 (0.0%) | 0 (0.0%) |
| Total | 85 (100.0%) | 41 (100.0%) |
Commute Time in Sherando
The most frequently occuring commute durations in Sherando are 10 to 14 minutes (85 commuters, 69.7%), 30 to 34 minutes (34 commuters, 27.9%), and 20 to 24 minutes (3 commuters, 2.5%).
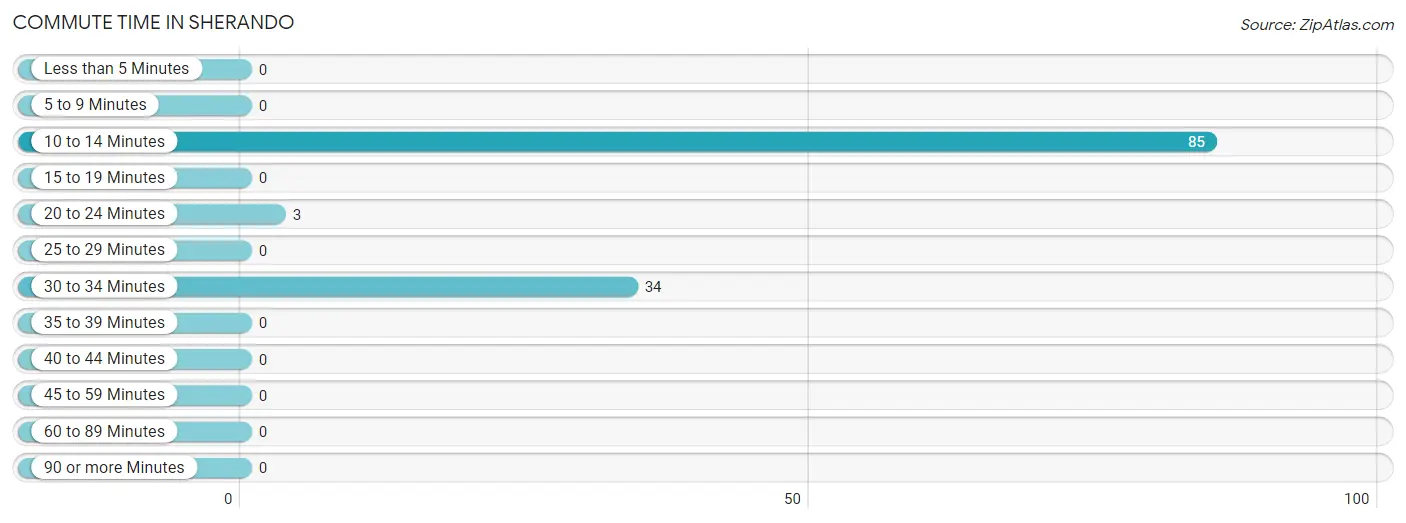
| Commute Time | # Commuters | % Commuters |
| Less than 5 Minutes | 0 | 0.0% |
| 5 to 9 Minutes | 0 | 0.0% |
| 10 to 14 Minutes | 85 | 69.7% |
| 15 to 19 Minutes | 0 | 0.0% |
| 20 to 24 Minutes | 3 | 2.5% |
| 25 to 29 Minutes | 0 | 0.0% |
| 30 to 34 Minutes | 34 | 27.9% |
| 35 to 39 Minutes | 0 | 0.0% |
| 40 to 44 Minutes | 0 | 0.0% |
| 45 to 59 Minutes | 0 | 0.0% |
| 60 to 89 Minutes | 0 | 0.0% |
| 90 or more Minutes | 0 | 0.0% |
Commute Time by Sex in Sherando
The most common commute times in Sherando are 10 to 14 minutes (85 commuters, 100.0%) for males and 30 to 34 minutes (34 commuters, 91.9%) for females.
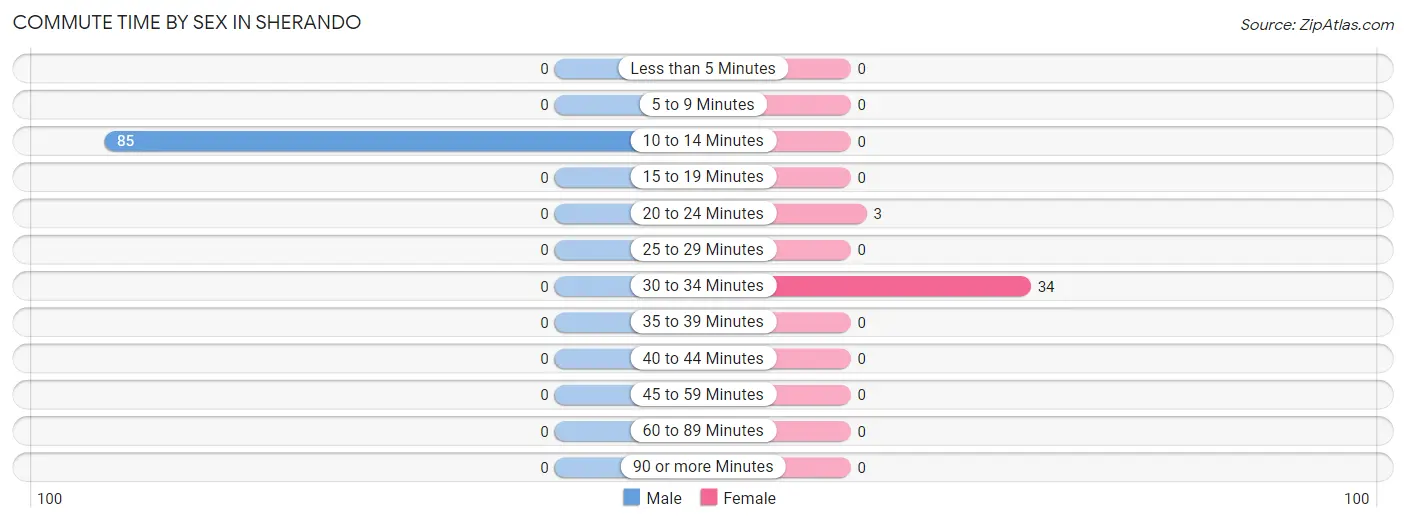
| Commute Time | Male | Female |
| Less than 5 Minutes | 0 (0.0%) | 0 (0.0%) |
| 5 to 9 Minutes | 0 (0.0%) | 0 (0.0%) |
| 10 to 14 Minutes | 85 (100.0%) | 0 (0.0%) |
| 15 to 19 Minutes | 0 (0.0%) | 0 (0.0%) |
| 20 to 24 Minutes | 0 (0.0%) | 3 (8.1%) |
| 25 to 29 Minutes | 0 (0.0%) | 0 (0.0%) |
| 30 to 34 Minutes | 0 (0.0%) | 34 (91.9%) |
| 35 to 39 Minutes | 0 (0.0%) | 0 (0.0%) |
| 40 to 44 Minutes | 0 (0.0%) | 0 (0.0%) |
| 45 to 59 Minutes | 0 (0.0%) | 0 (0.0%) |
| 60 to 89 Minutes | 0 (0.0%) | 0 (0.0%) |
| 90 or more Minutes | 0 (0.0%) | 0 (0.0%) |
Time of Departure to Work by Sex in Sherando
The most frequent times of departure to work in Sherando are 8:30 AM to 8:59 AM (79, 92.9%) for males and 6:30 AM to 6:59 AM (34, 91.9%) for females.
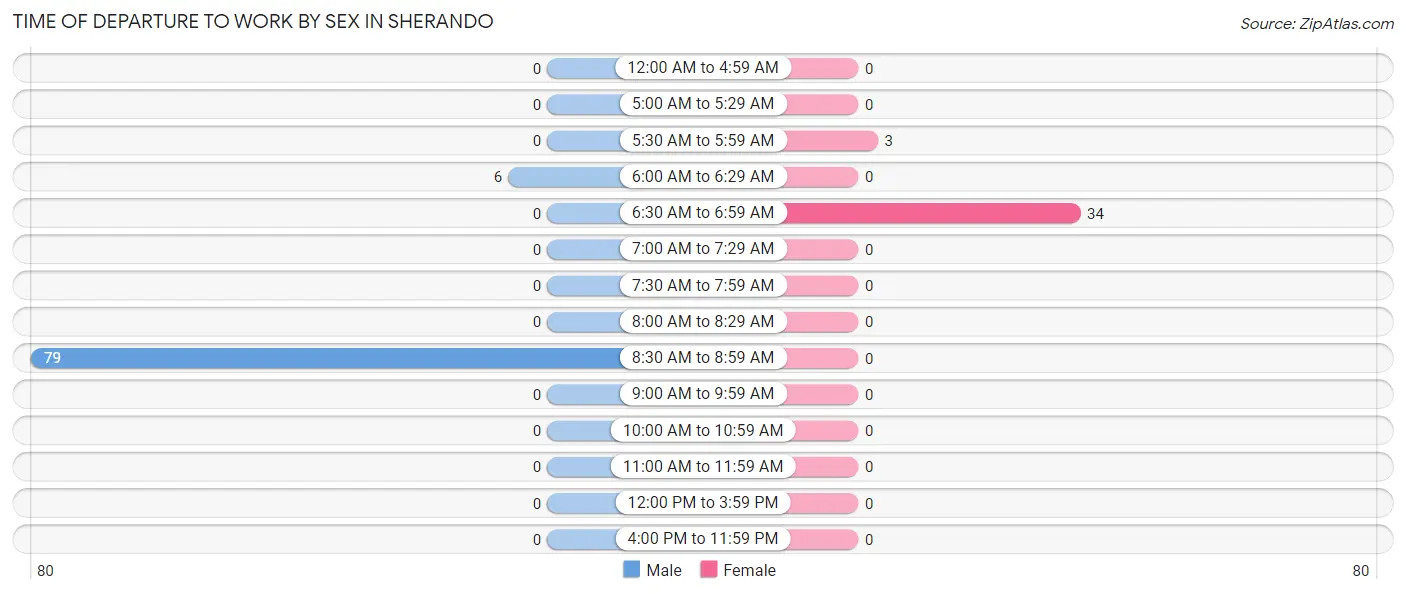
| Time of Departure | Male | Female |
| 12:00 AM to 4:59 AM | 0 (0.0%) | 0 (0.0%) |
| 5:00 AM to 5:29 AM | 0 (0.0%) | 0 (0.0%) |
| 5:30 AM to 5:59 AM | 0 (0.0%) | 3 (8.1%) |
| 6:00 AM to 6:29 AM | 6 (7.1%) | 0 (0.0%) |
| 6:30 AM to 6:59 AM | 0 (0.0%) | 34 (91.9%) |
| 7:00 AM to 7:29 AM | 0 (0.0%) | 0 (0.0%) |
| 7:30 AM to 7:59 AM | 0 (0.0%) | 0 (0.0%) |
| 8:00 AM to 8:29 AM | 0 (0.0%) | 0 (0.0%) |
| 8:30 AM to 8:59 AM | 79 (92.9%) | 0 (0.0%) |
| 9:00 AM to 9:59 AM | 0 (0.0%) | 0 (0.0%) |
| 10:00 AM to 10:59 AM | 0 (0.0%) | 0 (0.0%) |
| 11:00 AM to 11:59 AM | 0 (0.0%) | 0 (0.0%) |
| 12:00 PM to 3:59 PM | 0 (0.0%) | 0 (0.0%) |
| 4:00 PM to 11:59 PM | 0 (0.0%) | 0 (0.0%) |
| Total | 85 (100.0%) | 37 (100.0%) |
Housing Occupancy in Sherando
Occupancy by Ownership in Sherando
Of the total 130 dwellings in Sherando, owner-occupied units account for 99 (76.1%), while renter-occupied units make up 31 (23.8%).
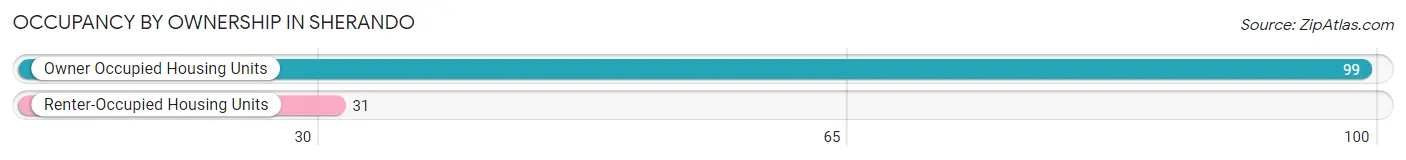
| Occupancy | # Housing Units | % Housing Units |
| Owner Occupied Housing Units | 99 | 76.1% |
| Renter-Occupied Housing Units | 31 | 23.8% |
| Total Occupied Housing Units | 130 | 100.0% |
Occupancy by Household Size in Sherando
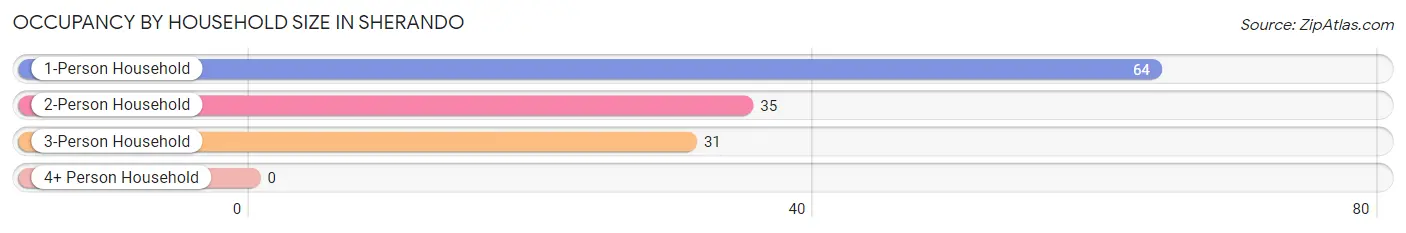
| Household Size | # Housing Units | % Housing Units |
| 1-Person Household | 64 | 49.2% |
| 2-Person Household | 35 | 26.9% |
| 3-Person Household | 31 | 23.8% |
| 4+ Person Household | 0 | 0.0% |
| Total Housing Units | 130 | 100.0% |
Occupancy by Ownership by Household Size in Sherando
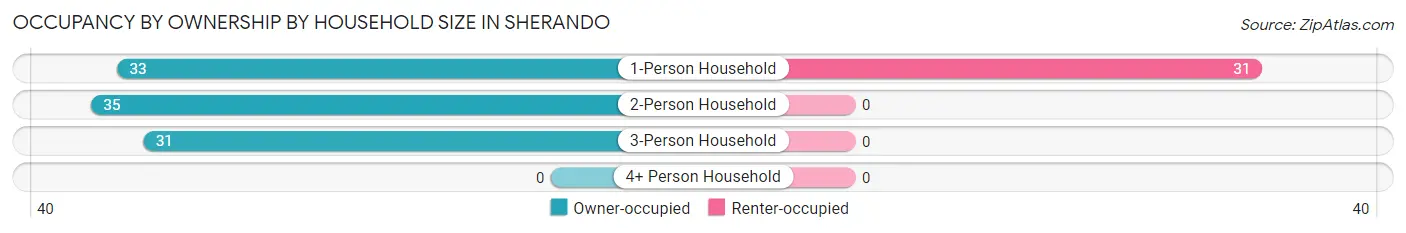
| Household Size | Owner-occupied | Renter-occupied |
| 1-Person Household | 33 (51.6%) | 31 (48.4%) |
| 2-Person Household | 35 (100.0%) | 0 (0.0%) |
| 3-Person Household | 31 (100.0%) | 0 (0.0%) |
| 4+ Person Household | 0 (0.0%) | 0 (0.0%) |
| Total Housing Units | 99 (76.1%) | 31 (23.8%) |
Occupancy by Educational Attainment in Sherando
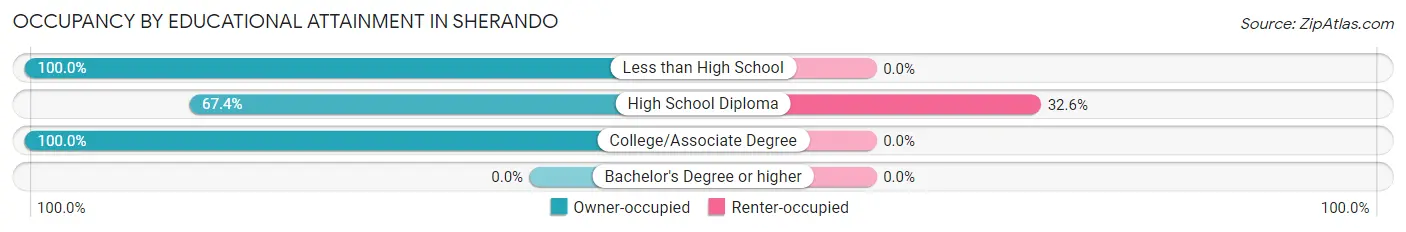
| Household Size | Owner-occupied | Renter-occupied |
| Less than High School | 5 (100.0%) | 0 (0.0%) |
| High School Diploma | 64 (67.4%) | 31 (32.6%) |
| College/Associate Degree | 30 (100.0%) | 0 (0.0%) |
| Bachelor's Degree or higher | 0 (0.0%) | 0 (0.0%) |
Occupancy by Age of Householder in Sherando
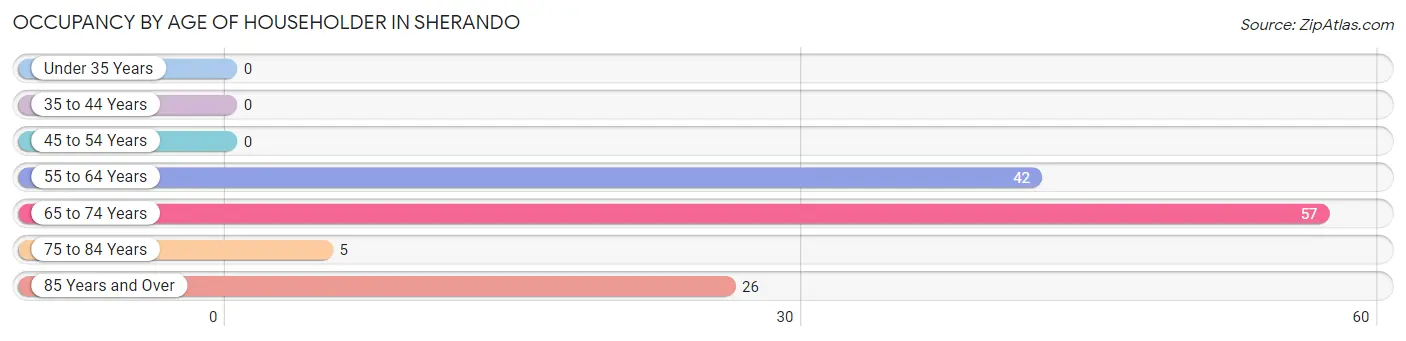
| Age Bracket | # Households | % Households |
| Under 35 Years | 0 | 0.0% |
| 35 to 44 Years | 0 | 0.0% |
| 45 to 54 Years | 0 | 0.0% |
| 55 to 64 Years | 42 | 32.3% |
| 65 to 74 Years | 57 | 43.9% |
| 75 to 84 Years | 5 | 3.8% |
| 85 Years and Over | 26 | 20.0% |
| Total | 130 | 100.0% |
Housing Finances in Sherando
Median Income by Occupancy in Sherando
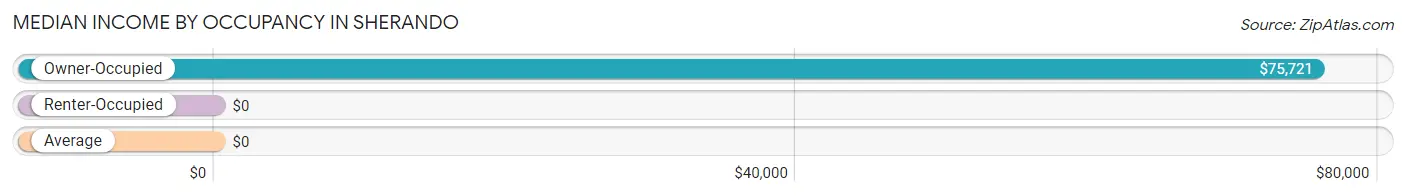
| Occupancy Type | # Households | Median Income |
| Owner-Occupied | 99 (76.1%) | $75,721 |
| Renter-Occupied | 31 (23.8%) | $0 |
| Average | 130 (100.0%) | $0 |
Occupancy by Householder Income Bracket in Sherando
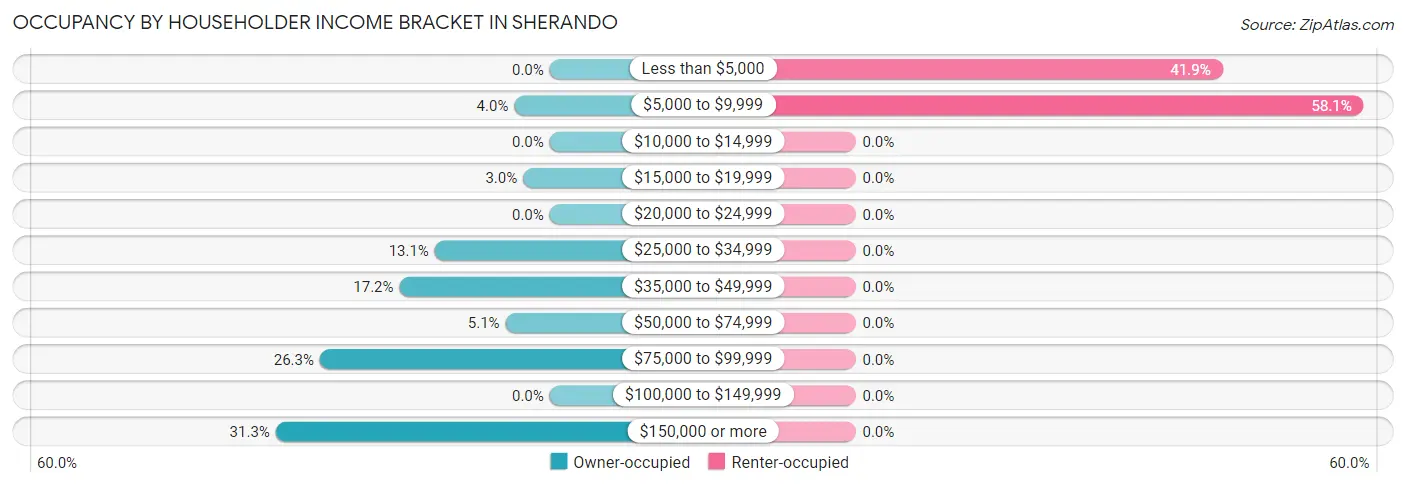
| Income Bracket | Owner-occupied | Renter-occupied |
| Less than $5,000 | 0 (0.0%) | 13 (41.9%) |
| $5,000 to $9,999 | 4 (4.0%) | 18 (58.1%) |
| $10,000 to $14,999 | 0 (0.0%) | 0 (0.0%) |
| $15,000 to $19,999 | 3 (3.0%) | 0 (0.0%) |
| $20,000 to $24,999 | 0 (0.0%) | 0 (0.0%) |
| $25,000 to $34,999 | 13 (13.1%) | 0 (0.0%) |
| $35,000 to $49,999 | 17 (17.2%) | 0 (0.0%) |
| $50,000 to $74,999 | 5 (5.1%) | 0 (0.0%) |
| $75,000 to $99,999 | 26 (26.3%) | 0 (0.0%) |
| $100,000 to $149,999 | 0 (0.0%) | 0 (0.0%) |
| $150,000 or more | 31 (31.3%) | 0 (0.0%) |
| Total | 99 (100.0%) | 31 (100.0%) |
Monthly Housing Cost Tiers in Sherando
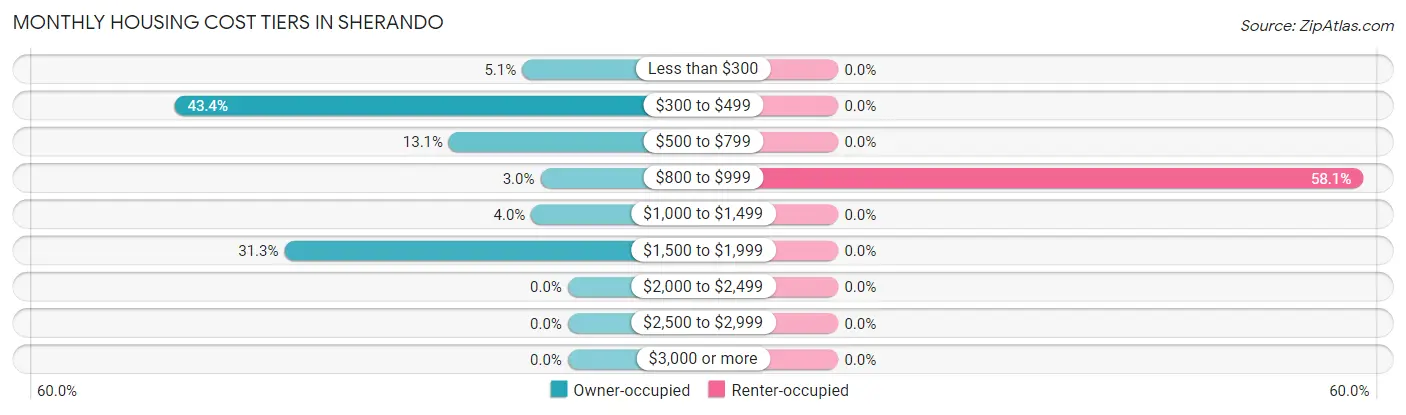
| Monthly Cost | Owner-occupied | Renter-occupied |
| Less than $300 | 5 (5.1%) | 0 (0.0%) |
| $300 to $499 | 43 (43.4%) | 0 (0.0%) |
| $500 to $799 | 13 (13.1%) | 0 (0.0%) |
| $800 to $999 | 3 (3.0%) | 18 (58.1%) |
| $1,000 to $1,499 | 4 (4.0%) | 0 (0.0%) |
| $1,500 to $1,999 | 31 (31.3%) | 0 (0.0%) |
| $2,000 to $2,499 | 0 (0.0%) | 0 (0.0%) |
| $2,500 to $2,999 | 0 (0.0%) | 0 (0.0%) |
| $3,000 or more | 0 (0.0%) | 0 (0.0%) |
| Total | 99 (100.0%) | 31 (100.0%) |
Physical Housing Characteristics in Sherando
Housing Structures in Sherando
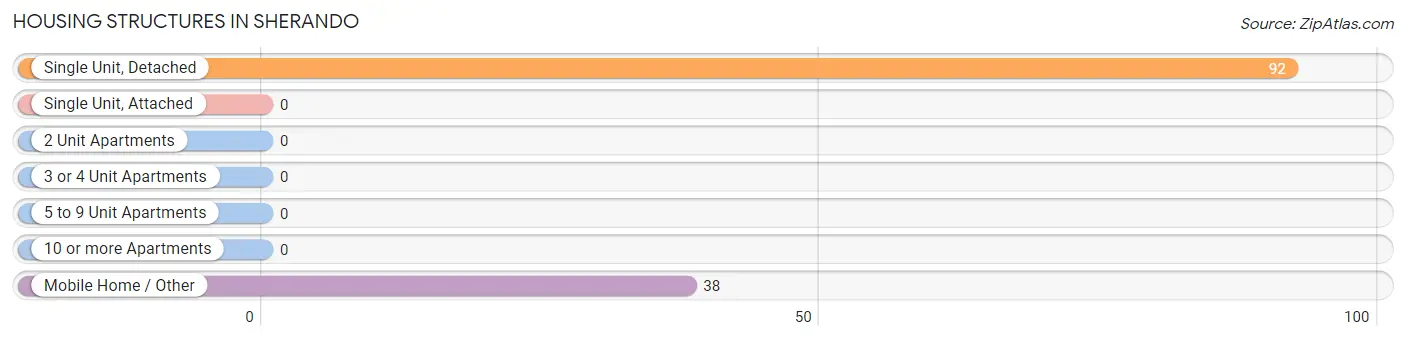
| Structure Type | # Housing Units | % Housing Units |
| Single Unit, Detached | 92 | 70.8% |
| Single Unit, Attached | 0 | 0.0% |
| 2 Unit Apartments | 0 | 0.0% |
| 3 or 4 Unit Apartments | 0 | 0.0% |
| 5 to 9 Unit Apartments | 0 | 0.0% |
| 10 or more Apartments | 0 | 0.0% |
| Mobile Home / Other | 38 | 29.2% |
| Total | 130 | 100.0% |
Housing Structures by Occupancy in Sherando
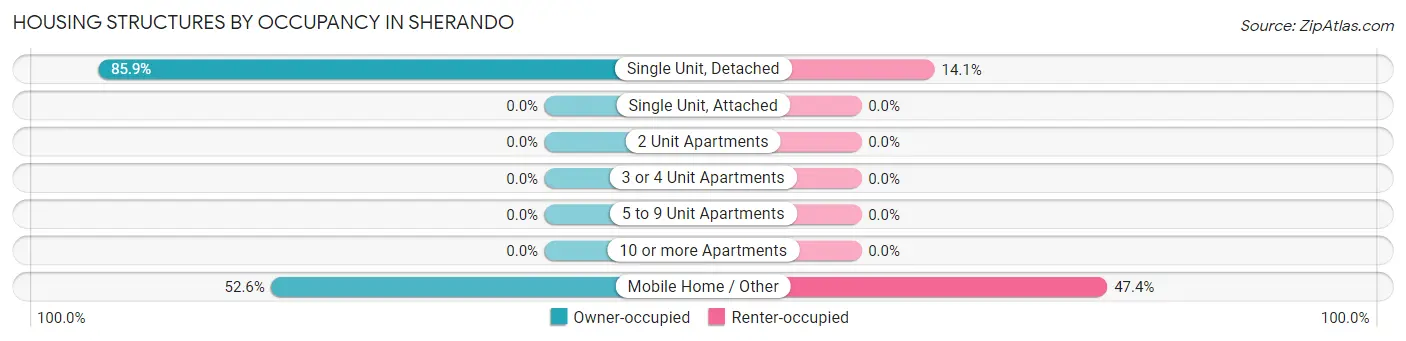
| Structure Type | Owner-occupied | Renter-occupied |
| Single Unit, Detached | 79 (85.9%) | 13 (14.1%) |
| Single Unit, Attached | 0 (0.0%) | 0 (0.0%) |
| 2 Unit Apartments | 0 (0.0%) | 0 (0.0%) |
| 3 or 4 Unit Apartments | 0 (0.0%) | 0 (0.0%) |
| 5 to 9 Unit Apartments | 0 (0.0%) | 0 (0.0%) |
| 10 or more Apartments | 0 (0.0%) | 0 (0.0%) |
| Mobile Home / Other | 20 (52.6%) | 18 (47.4%) |
| Total | 99 (76.1%) | 31 (23.8%) |
Housing Structures by Number of Rooms in Sherando
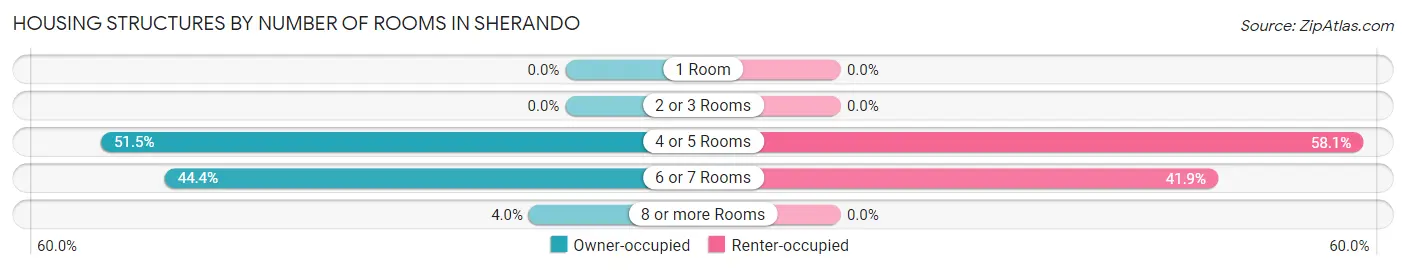
| Number of Rooms | Owner-occupied | Renter-occupied |
| 1 Room | 0 (0.0%) | 0 (0.0%) |
| 2 or 3 Rooms | 0 (0.0%) | 0 (0.0%) |
| 4 or 5 Rooms | 51 (51.5%) | 18 (58.1%) |
| 6 or 7 Rooms | 44 (44.4%) | 13 (41.9%) |
| 8 or more Rooms | 4 (4.0%) | 0 (0.0%) |
| Total | 99 (100.0%) | 31 (100.0%) |
Housing Structure by Heating Type in Sherando
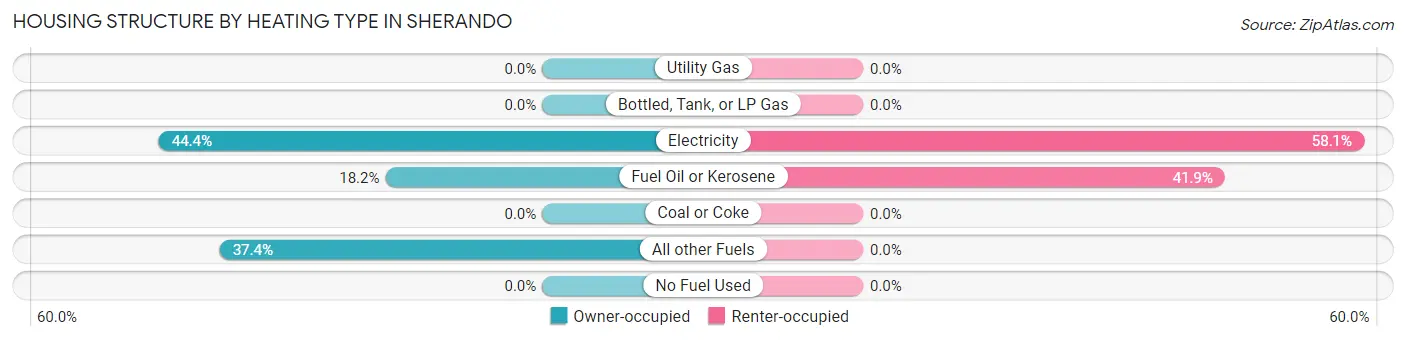
| Heating Type | Owner-occupied | Renter-occupied |
| Utility Gas | 0 (0.0%) | 0 (0.0%) |
| Bottled, Tank, or LP Gas | 0 (0.0%) | 0 (0.0%) |
| Electricity | 44 (44.4%) | 18 (58.1%) |
| Fuel Oil or Kerosene | 18 (18.2%) | 13 (41.9%) |
| Coal or Coke | 0 (0.0%) | 0 (0.0%) |
| All other Fuels | 37 (37.4%) | 0 (0.0%) |
| No Fuel Used | 0 (0.0%) | 0 (0.0%) |
| Total | 99 (100.0%) | 31 (100.0%) |
Household Vehicle Usage in Sherando
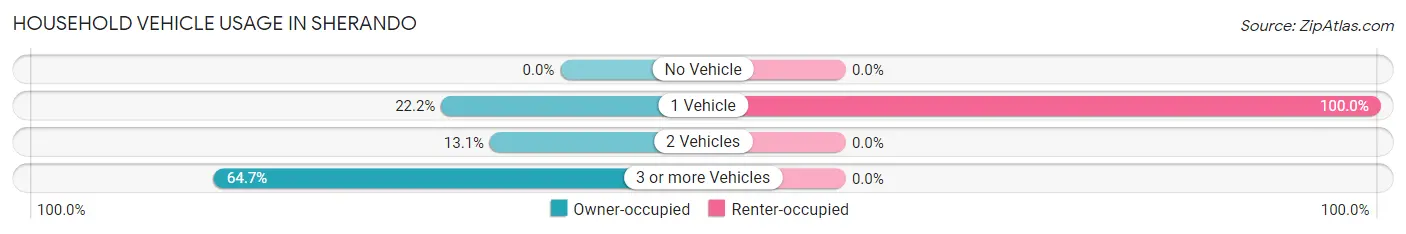
| Vehicles per Household | Owner-occupied | Renter-occupied |
| No Vehicle | 0 (0.0%) | 0 (0.0%) |
| 1 Vehicle | 22 (22.2%) | 31 (100.0%) |
| 2 Vehicles | 13 (13.1%) | 0 (0.0%) |
| 3 or more Vehicles | 64 (64.6%) | 0 (0.0%) |
| Total | 99 (100.0%) | 31 (100.0%) |
Real Estate & Mortgages in Sherando
Real Estate and Mortgage Overview in Sherando
| Characteristic | Without Mortgage | With Mortgage |
| Housing Units | 57 | 42 |
| Median Property Value | $164,900 | $188,700 |
| Median Household Income | $66,250 | $31 |
| Monthly Housing Costs | $338 | $0 |
| Real Estate Taxes | $969 | $0 |
Property Value by Mortgage Status in Sherando
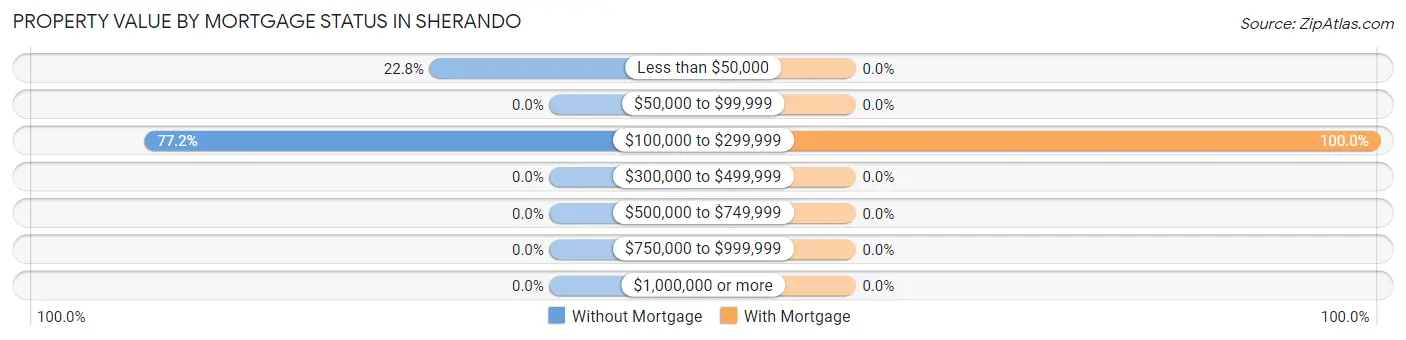
| Property Value | Without Mortgage | With Mortgage |
| Less than $50,000 | 13 (22.8%) | 0 (0.0%) |
| $50,000 to $99,999 | 0 (0.0%) | 0 (0.0%) |
| $100,000 to $299,999 | 44 (77.2%) | 42 (100.0%) |
| $300,000 to $499,999 | 0 (0.0%) | 0 (0.0%) |
| $500,000 to $749,999 | 0 (0.0%) | 0 (0.0%) |
| $750,000 to $999,999 | 0 (0.0%) | 0 (0.0%) |
| $1,000,000 or more | 0 (0.0%) | 0 (0.0%) |
| Total | 57 (100.0%) | 42 (100.0%) |
Household Income by Mortgage Status in Sherando
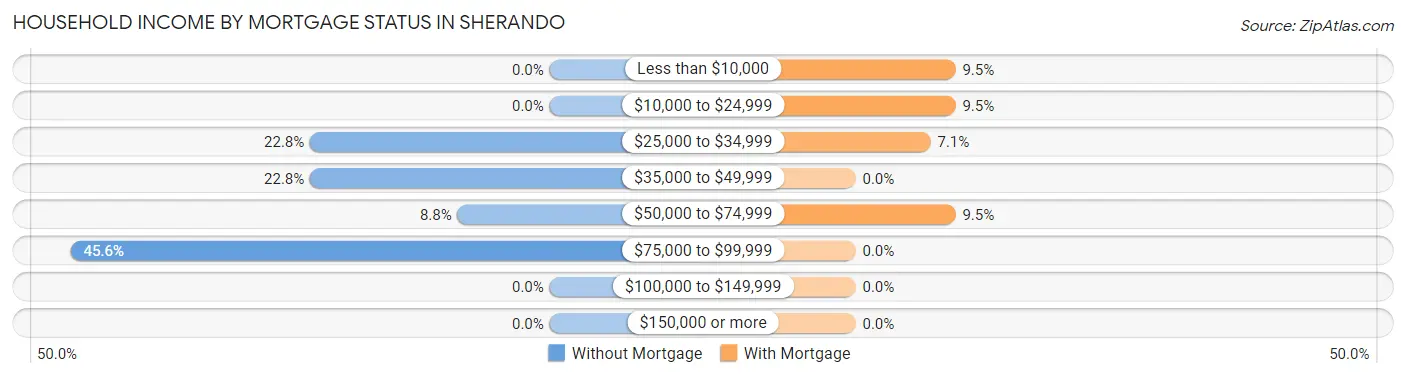
| Household Income | Without Mortgage | With Mortgage |
| Less than $10,000 | 0 (0.0%) | 4 (9.5%) |
| $10,000 to $24,999 | 0 (0.0%) | 4 (9.5%) |
| $25,000 to $34,999 | 13 (22.8%) | 3 (7.1%) |
| $35,000 to $49,999 | 13 (22.8%) | 0 (0.0%) |
| $50,000 to $74,999 | 5 (8.8%) | 4 (9.5%) |
| $75,000 to $99,999 | 26 (45.6%) | 0 (0.0%) |
| $100,000 to $149,999 | 0 (0.0%) | 0 (0.0%) |
| $150,000 or more | 0 (0.0%) | 0 (0.0%) |
| Total | 57 (100.0%) | 42 (100.0%) |
Property Value to Household Income Ratio in Sherando
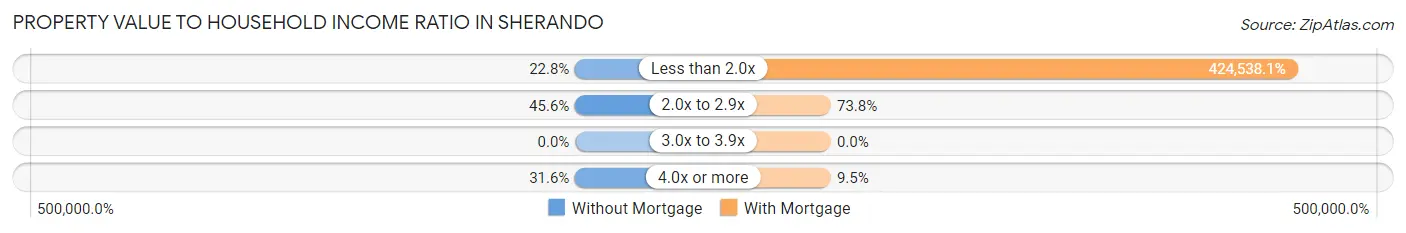
| Value-to-Income Ratio | Without Mortgage | With Mortgage |
| Less than 2.0x | 13 (22.8%) | 178,306 (424,538.1%) |
| 2.0x to 2.9x | 26 (45.6%) | 31 (73.8%) |
| 3.0x to 3.9x | 0 (0.0%) | 0 (0.0%) |
| 4.0x or more | 18 (31.6%) | 4 (9.5%) |
| Total | 57 (100.0%) | 42 (100.0%) |
Real Estate Taxes by Mortgage Status in Sherando
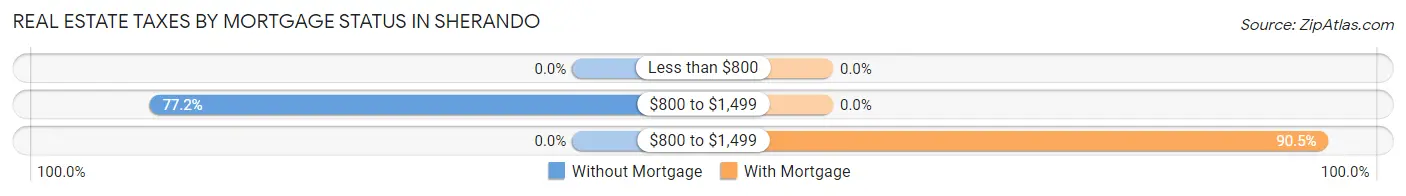
| Property Taxes | Without Mortgage | With Mortgage |
| Less than $800 | 0 (0.0%) | 0 (0.0%) |
| $800 to $1,499 | 44 (77.2%) | 0 (0.0%) |
| $800 to $1,499 | 0 (0.0%) | 38 (90.5%) |
| Total | 57 (100.0%) | 42 (100.0%) |
Health & Disability in Sherando
Health Insurance Coverage by Age in Sherando
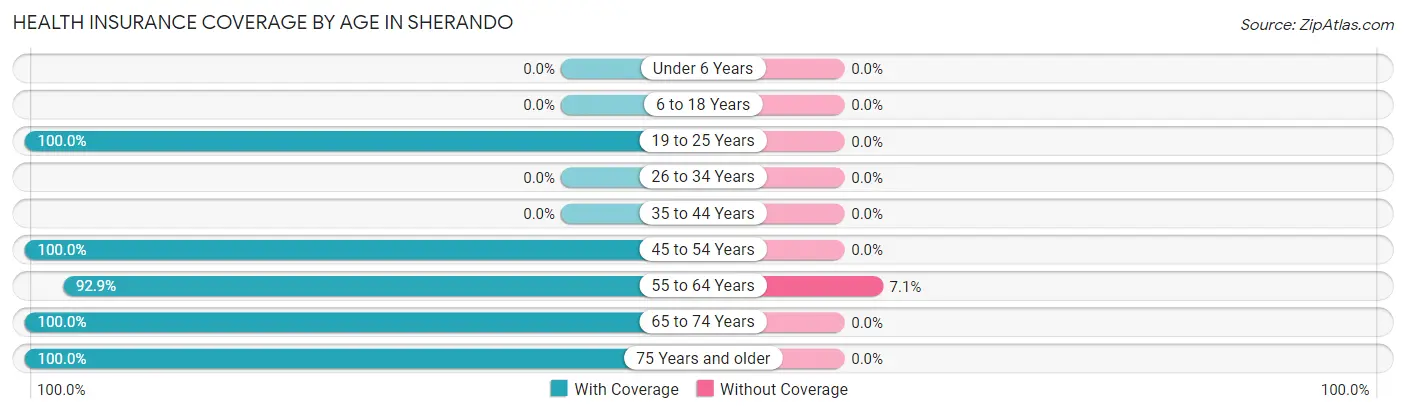
| Age Bracket | With Coverage | Without Coverage |
| Under 6 Years | 0 (0.0%) | 0 (0.0%) |
| 6 to 18 Years | 0 (0.0%) | 0 (0.0%) |
| 19 to 25 Years | 48 (100.0%) | 0 (0.0%) |
| 26 to 34 Years | 0 (0.0%) | 0 (0.0%) |
| 35 to 44 Years | 0 (0.0%) | 0 (0.0%) |
| 45 to 54 Years | 34 (100.0%) | 0 (0.0%) |
| 55 to 64 Years | 39 (92.9%) | 3 (7.1%) |
| 65 to 74 Years | 85 (100.0%) | 0 (0.0%) |
| 75 Years and older | 37 (100.0%) | 0 (0.0%) |
| Total | 243 (98.8%) | 3 (1.2%) |
Health Insurance Coverage by Citizenship Status in Sherando
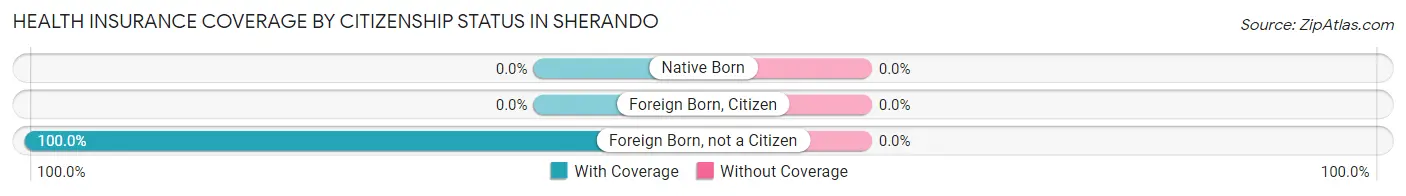
| Citizenship Status | With Coverage | Without Coverage |
| Native Born | 0 (0.0%) | 0 (0.0%) |
| Foreign Born, Citizen | 0 (0.0%) | 0 (0.0%) |
| Foreign Born, not a Citizen | 48 (100.0%) | 0 (0.0%) |
Health Insurance Coverage by Household Income in Sherando
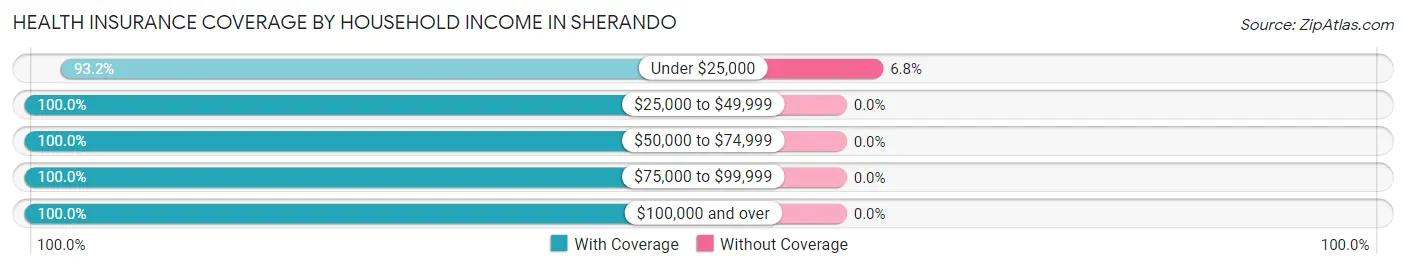
| Household Income | With Coverage | Without Coverage |
| Under $25,000 | 41 (93.2%) | 3 (6.8%) |
| $25,000 to $49,999 | 30 (100.0%) | 0 (0.0%) |
| $50,000 to $74,999 | 11 (100.0%) | 0 (0.0%) |
| $75,000 to $99,999 | 48 (100.0%) | 0 (0.0%) |
| $100,000 and over | 113 (100.0%) | 0 (0.0%) |
Public vs Private Health Insurance Coverage by Age in Sherando
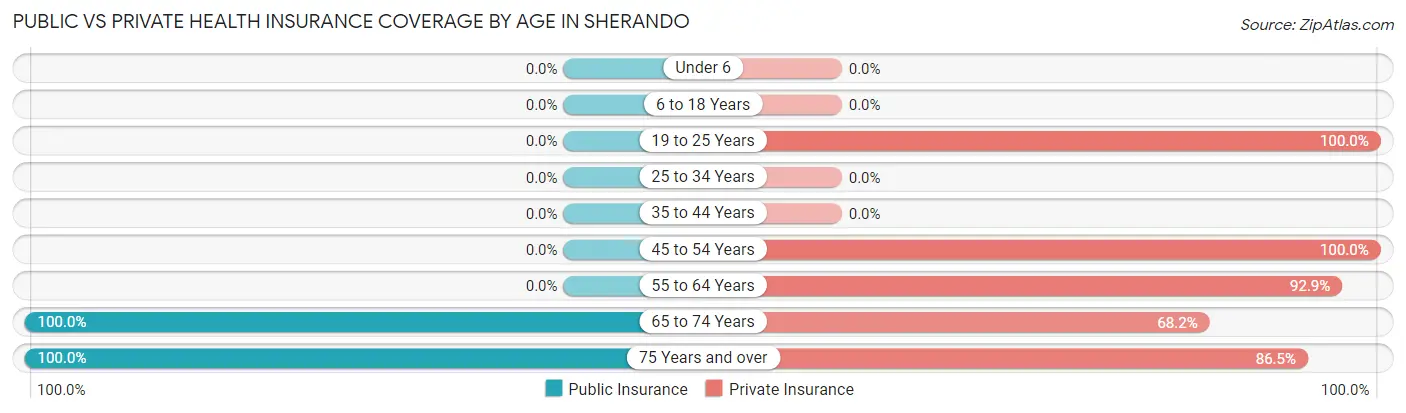
| Age Bracket | Public Insurance | Private Insurance |
| Under 6 | 0 (0.0%) | 0 (0.0%) |
| 6 to 18 Years | 0 (0.0%) | 0 (0.0%) |
| 19 to 25 Years | 0 (0.0%) | 48 (100.0%) |
| 25 to 34 Years | 0 (0.0%) | 0 (0.0%) |
| 35 to 44 Years | 0 (0.0%) | 0 (0.0%) |
| 45 to 54 Years | 0 (0.0%) | 34 (100.0%) |
| 55 to 64 Years | 0 (0.0%) | 39 (92.9%) |
| 65 to 74 Years | 85 (100.0%) | 58 (68.2%) |
| 75 Years and over | 37 (100.0%) | 32 (86.5%) |
| Total | 122 (49.6%) | 211 (85.8%) |
Disability Status by Sex by Age in Sherando
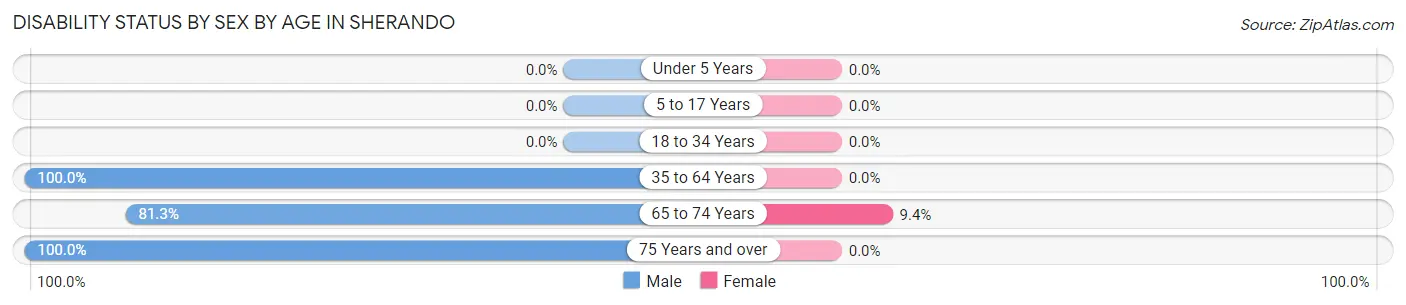
| Age Bracket | Male | Female |
| Under 5 Years | 0 (0.0%) | 0 (0.0%) |
| 5 to 17 Years | 0 (0.0%) | 0 (0.0%) |
| 18 to 34 Years | 0 (0.0%) | 0 (0.0%) |
| 35 to 64 Years | 31 (100.0%) | 0 (0.0%) |
| 65 to 74 Years | 26 (81.2%) | 5 (9.4%) |
| 75 Years and over | 24 (100.0%) | 0 (0.0%) |
Disability Class by Sex by Age in Sherando
Disability Class: Hearing Difficulty
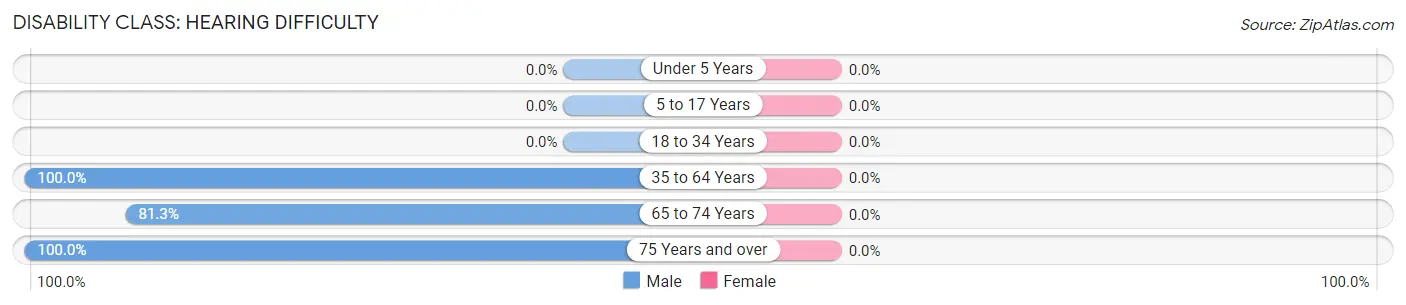
| Age Bracket | Male | Female |
| Under 5 Years | 0 (0.0%) | 0 (0.0%) |
| 5 to 17 Years | 0 (0.0%) | 0 (0.0%) |
| 18 to 34 Years | 0 (0.0%) | 0 (0.0%) |
| 35 to 64 Years | 31 (100.0%) | 0 (0.0%) |
| 65 to 74 Years | 26 (81.2%) | 0 (0.0%) |
| 75 Years and over | 24 (100.0%) | 0 (0.0%) |
Disability Class: Vision Difficulty
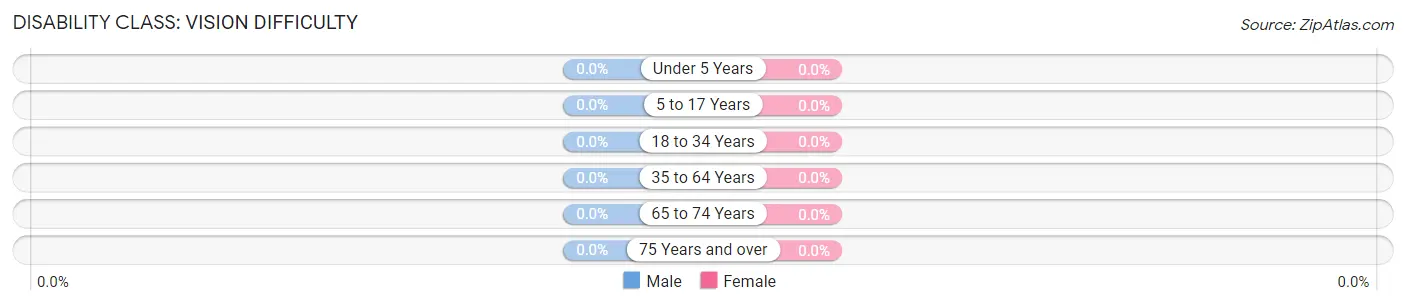
| Age Bracket | Male | Female |
| Under 5 Years | 0 (0.0%) | 0 (0.0%) |
| 5 to 17 Years | 0 (0.0%) | 0 (0.0%) |
| 18 to 34 Years | 0 (0.0%) | 0 (0.0%) |
| 35 to 64 Years | 0 (0.0%) | 0 (0.0%) |
| 65 to 74 Years | 0 (0.0%) | 0 (0.0%) |
| 75 Years and over | 0 (0.0%) | 0 (0.0%) |
Disability Class: Cognitive Difficulty
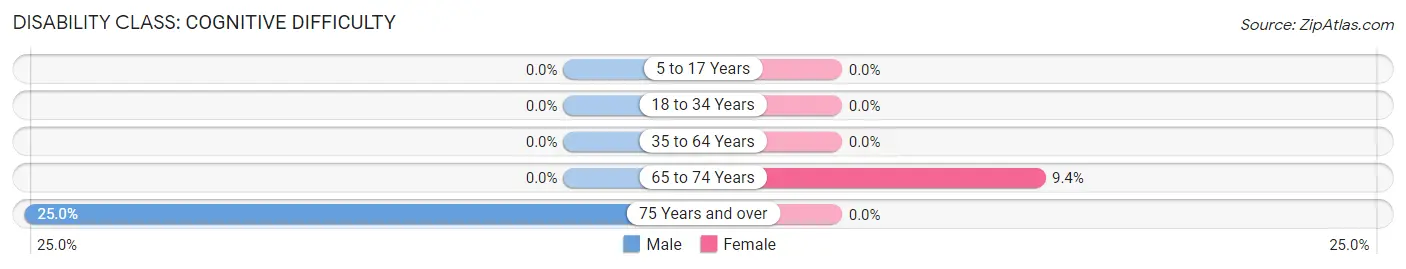
| Age Bracket | Male | Female |
| 5 to 17 Years | 0 (0.0%) | 0 (0.0%) |
| 18 to 34 Years | 0 (0.0%) | 0 (0.0%) |
| 35 to 64 Years | 0 (0.0%) | 0 (0.0%) |
| 65 to 74 Years | 0 (0.0%) | 5 (9.4%) |
| 75 Years and over | 6 (25.0%) | 0 (0.0%) |
Disability Class: Ambulatory Difficulty
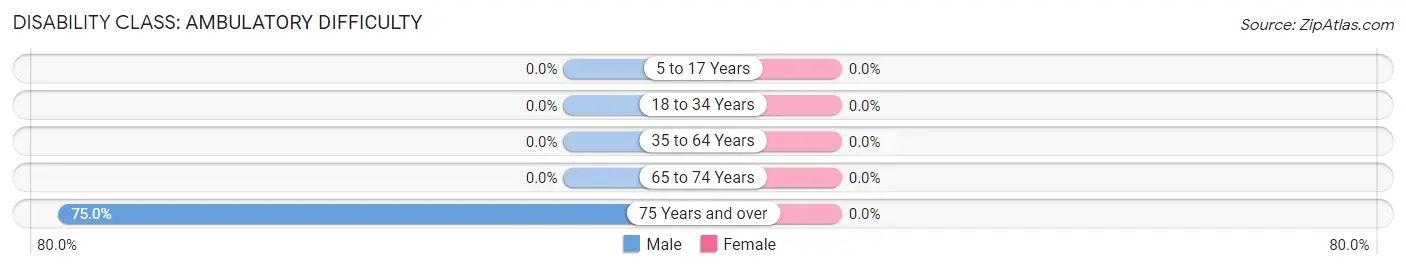
| Age Bracket | Male | Female |
| 5 to 17 Years | 0 (0.0%) | 0 (0.0%) |
| 18 to 34 Years | 0 (0.0%) | 0 (0.0%) |
| 35 to 64 Years | 0 (0.0%) | 0 (0.0%) |
| 65 to 74 Years | 0 (0.0%) | 0 (0.0%) |
| 75 Years and over | 18 (75.0%) | 0 (0.0%) |
Disability Class: Self-Care Difficulty

| Age Bracket | Male | Female |
| 5 to 17 Years | 0 (0.0%) | 0 (0.0%) |
| 18 to 34 Years | 0 (0.0%) | 0 (0.0%) |
| 35 to 64 Years | 0 (0.0%) | 0 (0.0%) |
| 65 to 74 Years | 0 (0.0%) | 0 (0.0%) |
| 75 Years and over | 18 (75.0%) | 0 (0.0%) |
Technology Access in Sherando
Computing Device Access in Sherando
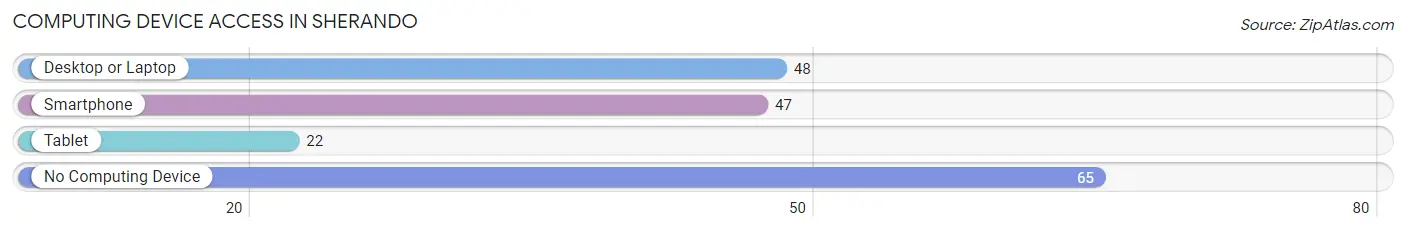
| Device Type | # Households | % Households |
| Desktop or Laptop | 48 | 36.9% |
| Smartphone | 47 | 36.1% |
| Tablet | 22 | 16.9% |
| No Computing Device | 65 | 50.0% |
| Total | 130 | 100.0% |
Internet Access in Sherando
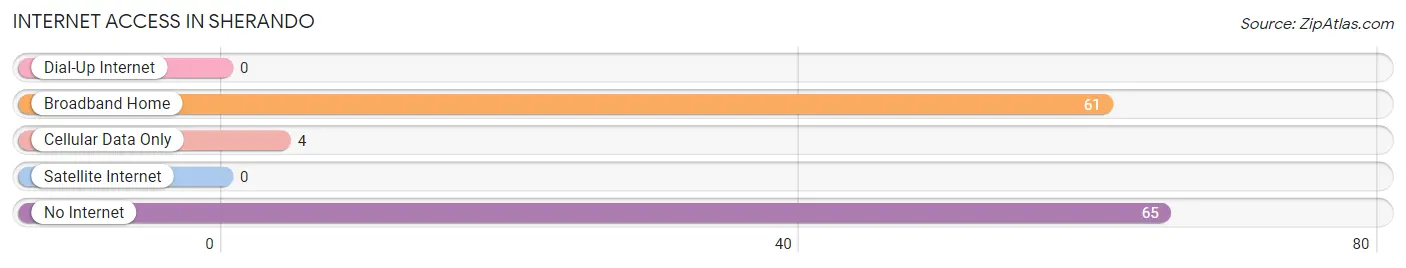
| Internet Type | # Households | % Households |
| Dial-Up Internet | 0 | 0.0% |
| Broadband Home | 61 | 46.9% |
| Cellular Data Only | 4 | 3.1% |
| Satellite Internet | 0 | 0.0% |
| No Internet | 65 | 50.0% |
| Total | 130 | 100.0% |
Sherando Summary
Sherando, Virginia is a small town located in the Shenandoah Valley of Virginia. It is situated in the foothills of the Blue Ridge Mountains and is part of the larger Winchester metropolitan area. The town was founded in 1750 and has a population of approximately 1,500 people.
History
Sherando, Virginia was founded in 1750 by a group of settlers from Pennsylvania. The town was named after the nearby Sherando Creek, which was named after the Native American tribe that lived in the area. The town was originally a farming community, but it soon became a center for the production of wool and other textiles. In the late 19th century, the town became a popular tourist destination due to its proximity to the Shenandoah National Park.
Geography
Sherando, Virginia is located in the Shenandoah Valley of Virginia. The town is situated in the foothills of the Blue Ridge Mountains and is part of the larger Winchester metropolitan area. The town is located at the intersection of US Route 11 and US Route 340. The town is surrounded by the George Washington National Forest and the Shenandoah National Park.
Economy
Sherando, Virginia is a small town with a population of approximately 1,500 people. The town’s economy is largely based on tourism, as it is located near the Shenandoah National Park. The town also has a few small businesses, including a grocery store, a hardware store, and a few restaurants.
Demographics
As of the 2010 census, the population of Sherando, Virginia was 1,500 people. The racial makeup of the town was 95.3% White, 1.7% African American, 0.7% Native American, 0.3% Asian, and 1.7% from other races. The median household income was $45,000 and the median family income was $50,000. The town has a high rate of homeownership, with over 80% of the population owning their own homes.
Sherando, Virginia is a small town with a rich history and a vibrant economy. The town is located in the beautiful Shenandoah Valley and is surrounded by the George Washington National Forest and the Shenandoah National Park. The town has a diverse population and a strong sense of community. Sherando, Virginia is a great place to live and visit.
Common Questions
What is Per Capita Income in Sherando?
Per Capita income in Sherando is $40,569.
What is Income or Wage Gap in Sherando?
Income or Wage Gap in Sherando is 52.2%.
Women in Sherando earn 47.8 cents for every dollar earned by a man.
What is Inequality or Gini Index in Sherando?
Inequality or Gini Index in Sherando is 0.50.
What is the Total Population of Sherando?
Total Population of Sherando is 246.
What is the Total Male Population of Sherando?
Total Male Population of Sherando is 135.
What is the Total Female Population of Sherando?
Total Female Population of Sherando is 111.
What is the Ratio of Males per 100 Females in Sherando?
There are 121.62 Males per 100 Females in Sherando.
What is the Ratio of Females per 100 Males in Sherando?
There are 82.22 Females per 100 Males in Sherando.
What is the Median Population Age in Sherando?
Median Population Age in Sherando is 60.9 Years.
What is the Average Family Size in Sherando
Average Family Size in Sherando is 2.2 People.
What is the Average Household Size in Sherando
Average Household Size in Sherando is 1.9 People.
How Large is the Labor Force in Sherando?
There are 126 People in the Labor Forcein in Sherando.
What is the Percentage of People in the Labor Force in Sherando?
51.2% of People are in the Labor Force in Sherando.