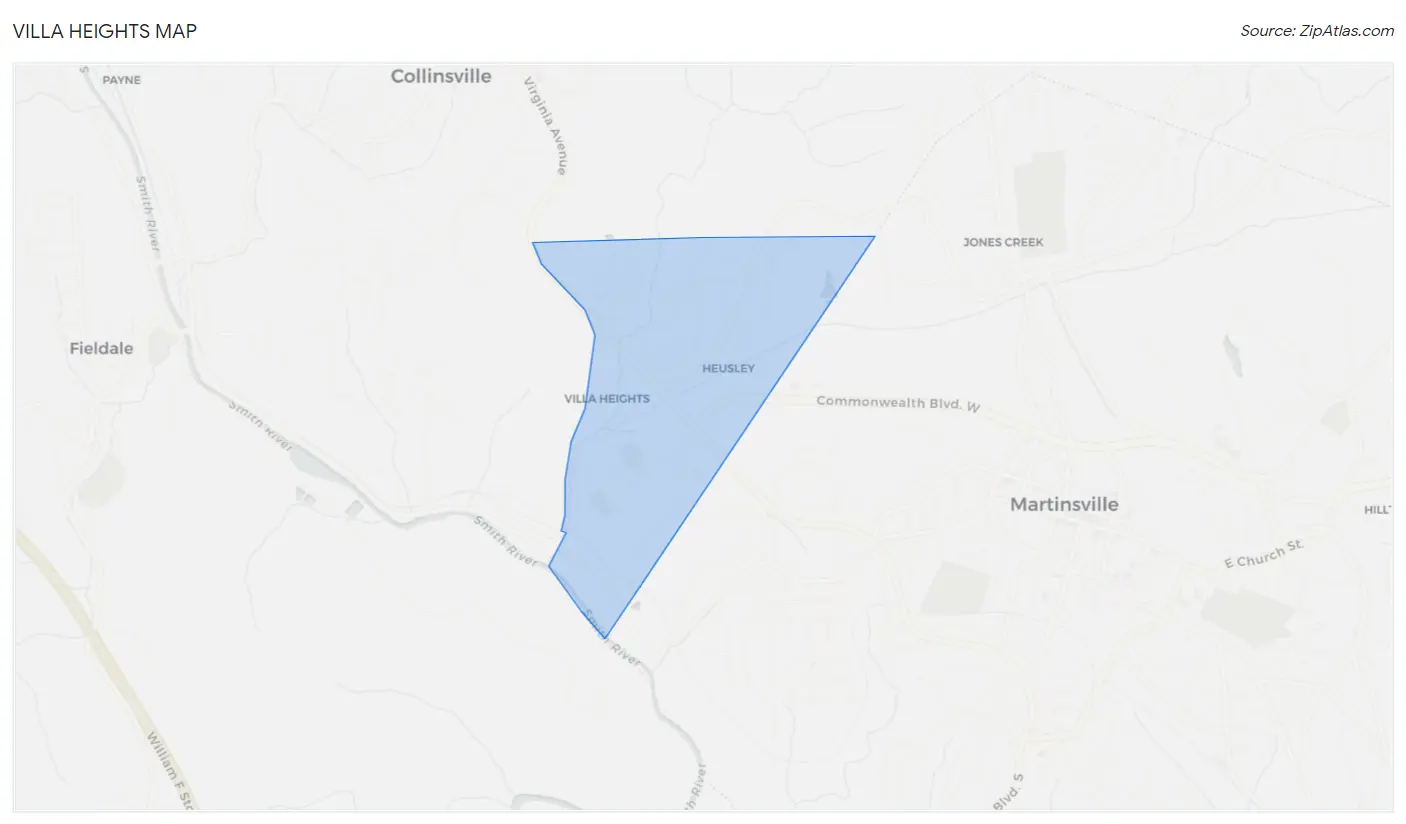
Villa Heights, VA Map & Demographics
Villa Heights Map
Villa Heights Overview
$25,296
PER CAPITA INCOME
$23,784
AVG HOUSEHOLD INCOME
0.50
INEQUALITY / GINI INDEX
540
TOTAL POPULATION
170
MALE POPULATION
370
FEMALE POPULATION
45.95
MALES / 100 FEMALES
217.65
FEMALES / 100 MALES
68.2
MEDIAN AGE
2.6
AVG FAMILY SIZE
1.6
AVG HOUSEHOLD SIZE
130
LABOR FORCE [ PEOPLE ]
25.4%
PERCENT IN LABOR FORCE
Income in Villa Heights
Income Overview in Villa Heights
| Characteristic | Number | Measure |
| Per Capita Income | 540 | $25,296 |
| Median Family Income | 101 | $0 |
| Mean Family Income | 101 | $71,106 |
| Median Household Income | 339 | $23,784 |
| Mean Household Income | 339 | $35,719 |
| Income Deficit | 101 | $0 |
| Wage / Income Gap (%) | 540 | 0.00% |
| Wage / Income Gap ($) | 540 | 100.00¢ per $1 |
| Gini / Inequality Index | 540 | 0.50 |
Earnings by Sex in Villa Heights
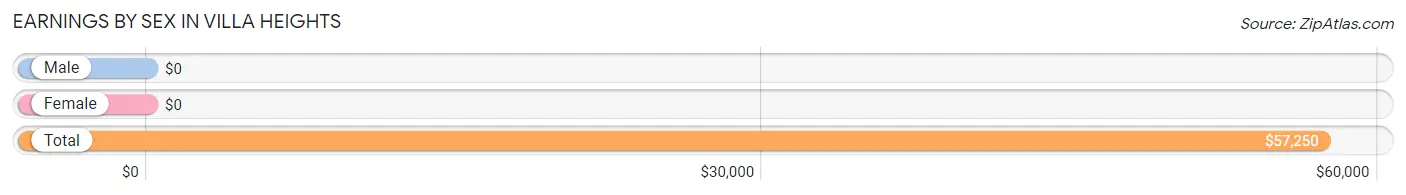
| Sex | Number | Average Earnings |
| Male | 13 (10.0%) | $0 |
| Female | 117 (90.0%) | $0 |
| Total | 130 (100.0%) | $57,250 |
Earnings by Sex by Income Bracket in Villa Heights
The most common earnings brackets in Villa Heights are $100,000+ for men (13 | 100.0%) and $55,000 to $64,999 for women (61 | 52.1%).
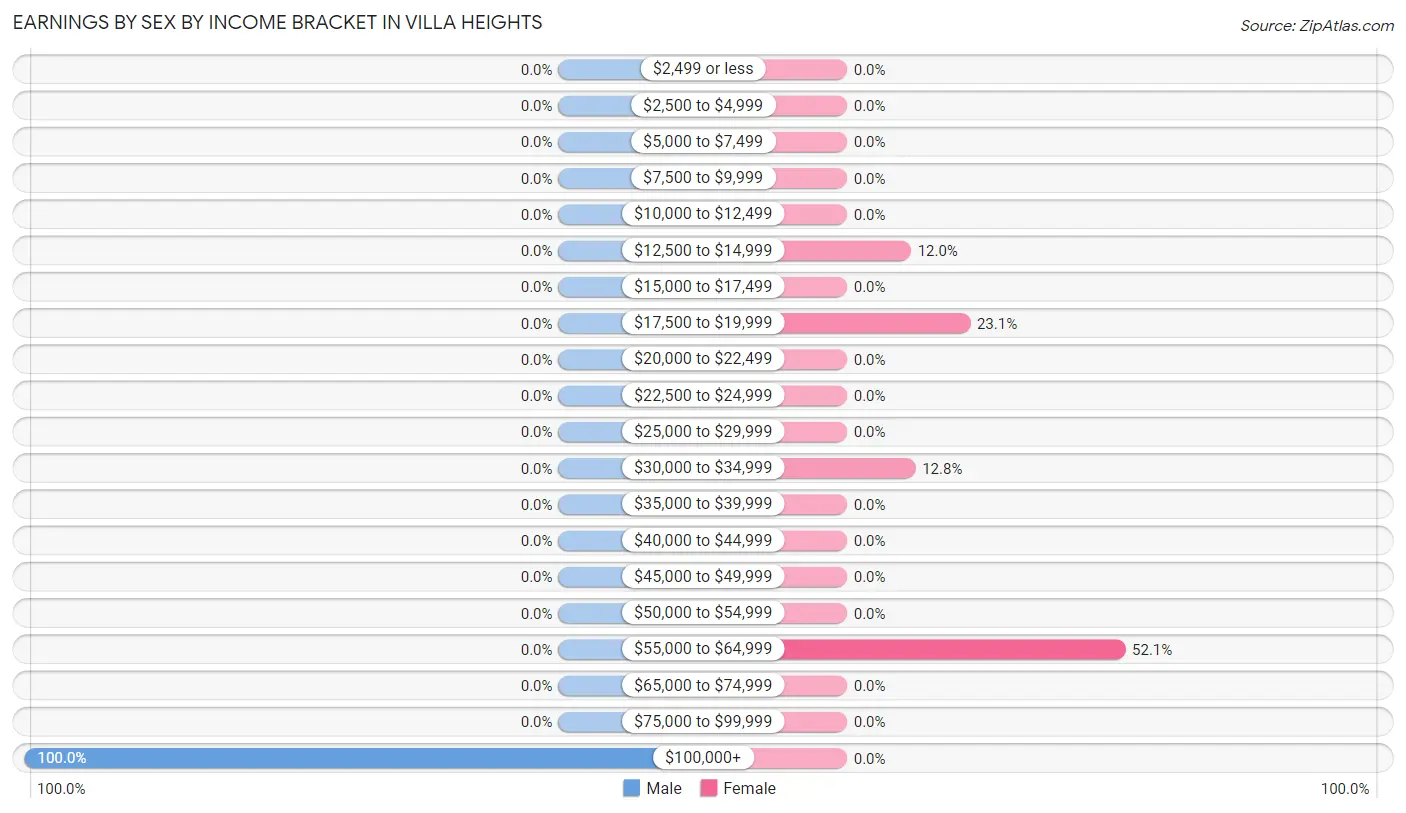
| Income | Male | Female |
| $2,499 or less | 0 (0.0%) | 0 (0.0%) |
| $2,500 to $4,999 | 0 (0.0%) | 0 (0.0%) |
| $5,000 to $7,499 | 0 (0.0%) | 0 (0.0%) |
| $7,500 to $9,999 | 0 (0.0%) | 0 (0.0%) |
| $10,000 to $12,499 | 0 (0.0%) | 0 (0.0%) |
| $12,500 to $14,999 | 0 (0.0%) | 14 (12.0%) |
| $15,000 to $17,499 | 0 (0.0%) | 0 (0.0%) |
| $17,500 to $19,999 | 0 (0.0%) | 27 (23.1%) |
| $20,000 to $22,499 | 0 (0.0%) | 0 (0.0%) |
| $22,500 to $24,999 | 0 (0.0%) | 0 (0.0%) |
| $25,000 to $29,999 | 0 (0.0%) | 0 (0.0%) |
| $30,000 to $34,999 | 0 (0.0%) | 15 (12.8%) |
| $35,000 to $39,999 | 0 (0.0%) | 0 (0.0%) |
| $40,000 to $44,999 | 0 (0.0%) | 0 (0.0%) |
| $45,000 to $49,999 | 0 (0.0%) | 0 (0.0%) |
| $50,000 to $54,999 | 0 (0.0%) | 0 (0.0%) |
| $55,000 to $64,999 | 0 (0.0%) | 61 (52.1%) |
| $65,000 to $74,999 | 0 (0.0%) | 0 (0.0%) |
| $75,000 to $99,999 | 0 (0.0%) | 0 (0.0%) |
| $100,000+ | 13 (100.0%) | 0 (0.0%) |
| Total | 13 (100.0%) | 117 (100.0%) |
Earnings by Sex by Educational Attainment in Villa Heights
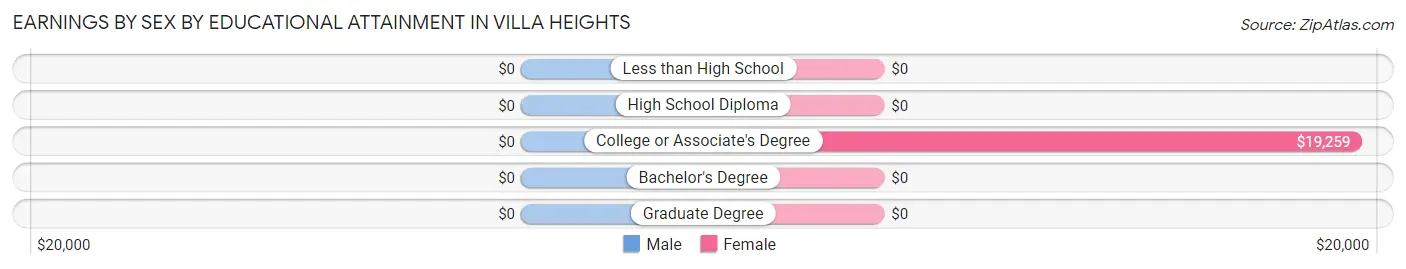
| Educational Attainment | Male Income | Female Income |
| Less than High School | - | - |
| High School Diploma | - | - |
| College or Associate's Degree | - | - |
| Bachelor's Degree | - | - |
| Graduate Degree | - | - |
| Total | - | - |
Family Income in Villa Heights
Family Income Brackets in Villa Heights
According to the Villa Heights family income data, there are 38 families falling into the $25,000 to $34,999 income range, which is the most common income bracket and makes up 37.6% of all families.
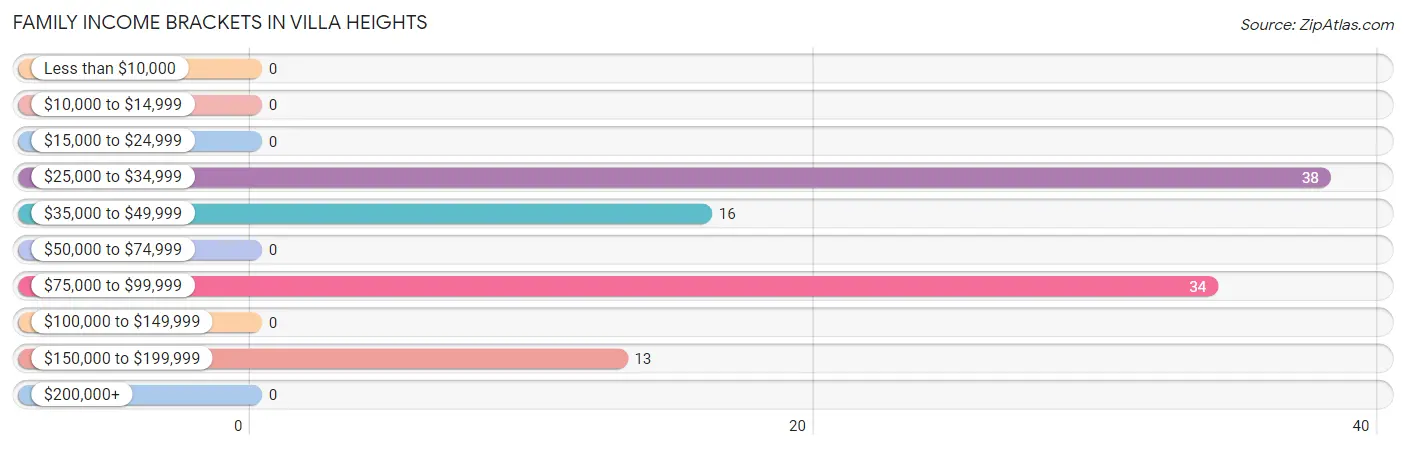
| Income Bracket | # Families | % Families |
| Less than $10,000 | 0 | 0.0% |
| $10,000 to $14,999 | 0 | 0.0% |
| $15,000 to $24,999 | 0 | 0.0% |
| $25,000 to $34,999 | 38 | 37.6% |
| $35,000 to $49,999 | 16 | 15.8% |
| $50,000 to $74,999 | 0 | 0.0% |
| $75,000 to $99,999 | 34 | 33.7% |
| $100,000 to $149,999 | 0 | 0.0% |
| $150,000 to $199,999 | 13 | 12.9% |
| $200,000+ | 0 | 0.0% |
Family Income by Famaliy Size in Villa Heights
| Income Bracket | # Families | Median Income |
| 2-Person Families | 90 (89.1%) | $0 |
| 3-Person Families | 11 (10.9%) | $0 |
| 4-Person Families | 0 (0.0%) | $0 |
| 5-Person Families | 0 (0.0%) | $0 |
| 6-Person Families | 0 (0.0%) | $0 |
| 7+ Person Families | 0 (0.0%) | $0 |
| Total | 101 (100.0%) | $0 |
Family Income by Number of Earners in Villa Heights
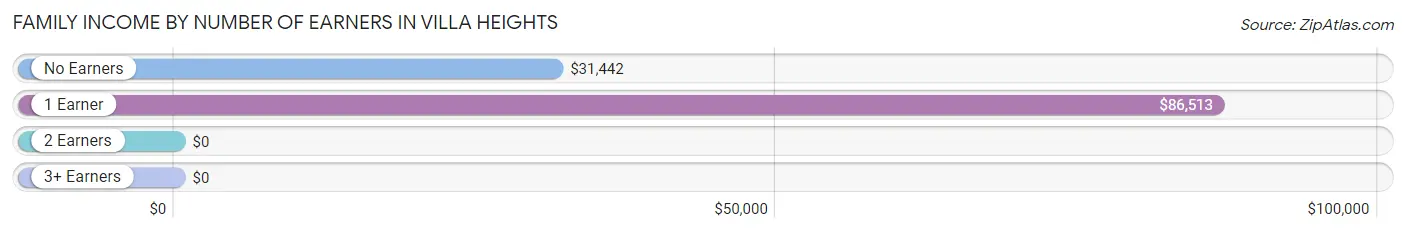
| Number of Earners | # Families | Median Income |
| No Earners | 43 (42.6%) | $31,442 |
| 1 Earner | 45 (44.6%) | $86,513 |
| 2 Earners | 13 (12.9%) | $0 |
| 3+ Earners | 0 (0.0%) | $0 |
| Total | 101 (100.0%) | $0 |
Household Income in Villa Heights
Household Income Brackets in Villa Heights
With 125 households falling in the category, the $15,000 to $24,999 income range is the most frequent in Villa Heights, accounting for 36.9% of all households.
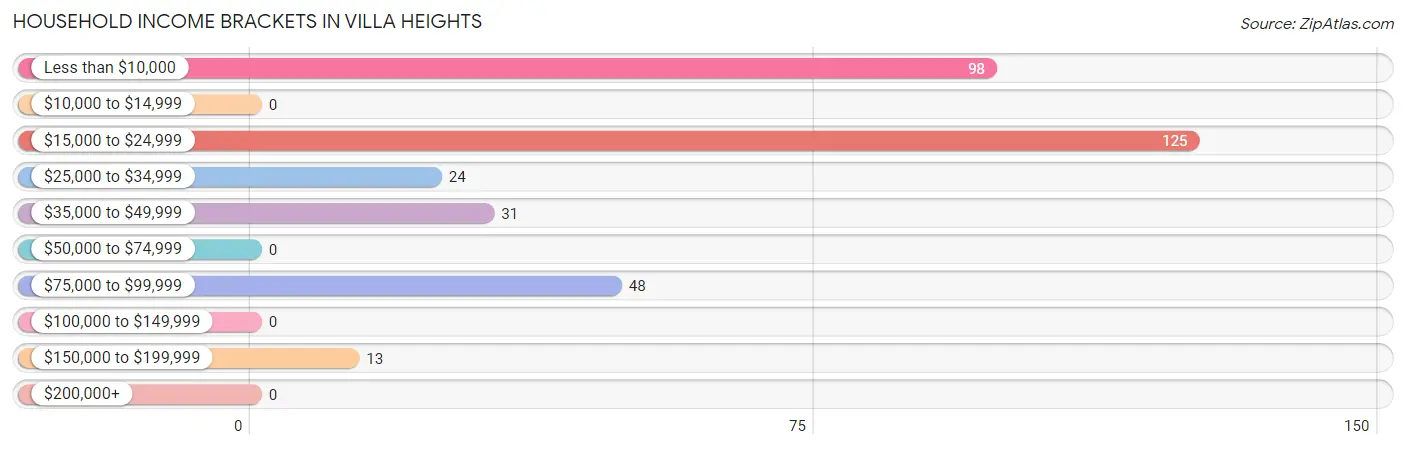
| Income Bracket | # Households | % Households |
| Less than $10,000 | 98 | 28.9% |
| $10,000 to $14,999 | 0 | 0.0% |
| $15,000 to $24,999 | 125 | 36.9% |
| $25,000 to $34,999 | 24 | 7.1% |
| $35,000 to $49,999 | 31 | 9.1% |
| $50,000 to $74,999 | 0 | 0.0% |
| $75,000 to $99,999 | 48 | 14.2% |
| $100,000 to $149,999 | 0 | 0.0% |
| $150,000 to $199,999 | 13 | 3.8% |
| $200,000+ | 0 | 0.0% |
Household Income by Householder Age in Villa Heights
The median household income in Villa Heights is $23,784, with the highest median household income of $24,318 found in the 65+ years age bracket for the primary householder. A total of 190 households (56.0%) fall into this category.
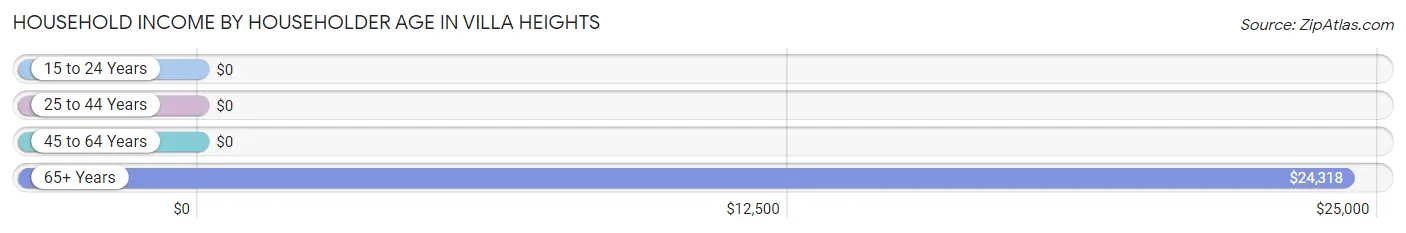
| Income Bracket | # Households | Median Income |
| 15 to 24 Years | 0 (0.0%) | $0 |
| 25 to 44 Years | 94 (27.7%) | $0 |
| 45 to 64 Years | 55 (16.2%) | $0 |
| 65+ Years | 190 (56.0%) | $24,318 |
| Total | 339 (100.0%) | $23,784 |
Poverty in Villa Heights
Income Below Poverty by Sex and Age in Villa Heights
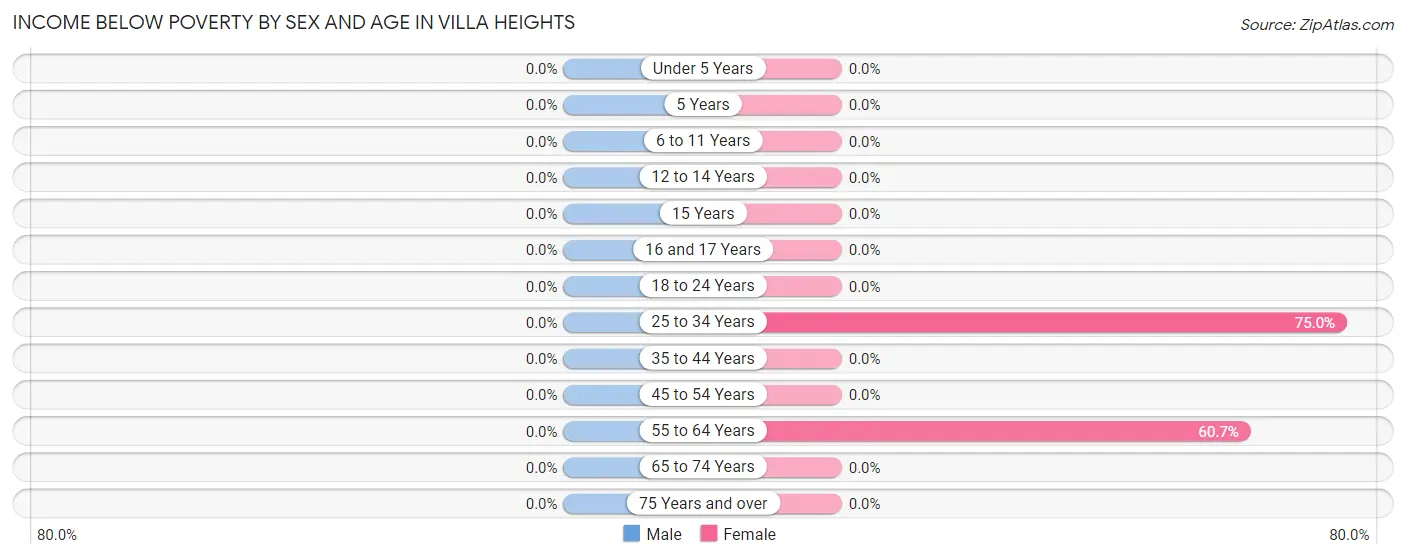
| Age Bracket | Male | Female |
| Under 5 Years | 0 (0.0%) | 0 (0.0%) |
| 5 Years | 0 (0.0%) | 0 (0.0%) |
| 6 to 11 Years | 0 (0.0%) | 0 (0.0%) |
| 12 to 14 Years | 0 (0.0%) | 0 (0.0%) |
| 15 Years | 0 (0.0%) | 0 (0.0%) |
| 16 and 17 Years | 0 (0.0%) | 0 (0.0%) |
| 18 to 24 Years | 0 (0.0%) | 0 (0.0%) |
| 25 to 34 Years | 0 (0.0%) | 81 (75.0%) |
| 35 to 44 Years | 0 (0.0%) | 0 (0.0%) |
| 45 to 54 Years | 0 (0.0%) | 0 (0.0%) |
| 55 to 64 Years | 0 (0.0%) | 17 (60.7%) |
| 65 to 74 Years | 0 (0.0%) | 0 (0.0%) |
| 75 Years and over | 0 (0.0%) | 0 (0.0%) |
| Total | 0 (0.0%) | 98 (26.5%) |
Income Above Poverty by Sex and Age in Villa Heights
According to the poverty statistics in Villa Heights, males aged 12 to 14 years and females aged 45 to 54 years are the age groups that are most secure financially, with 100.0% of males and 100.0% of females in these age groups living above the poverty line.
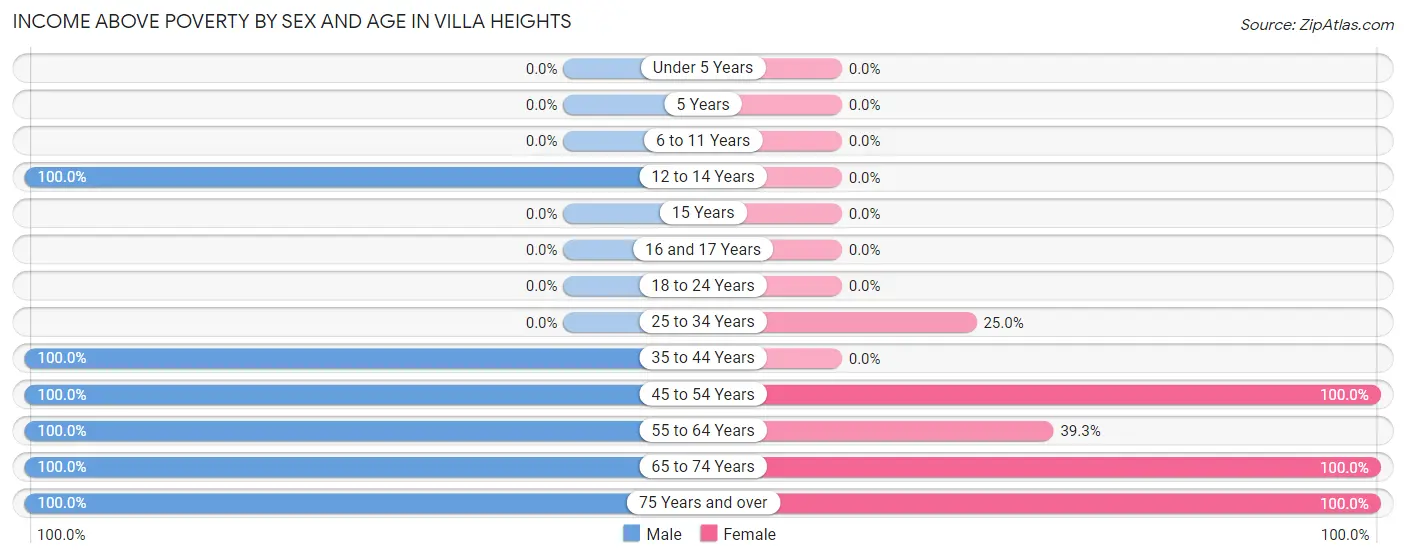
| Age Bracket | Male | Female |
| Under 5 Years | 0 (0.0%) | 0 (0.0%) |
| 5 Years | 0 (0.0%) | 0 (0.0%) |
| 6 to 11 Years | 0 (0.0%) | 0 (0.0%) |
| 12 to 14 Years | 28 (100.0%) | 0 (0.0%) |
| 15 Years | 0 (0.0%) | 0 (0.0%) |
| 16 and 17 Years | 0 (0.0%) | 0 (0.0%) |
| 18 to 24 Years | 0 (0.0%) | 0 (0.0%) |
| 25 to 34 Years | 0 (0.0%) | 27 (25.0%) |
| 35 to 44 Years | 13 (100.0%) | 0 (0.0%) |
| 45 to 54 Years | 13 (100.0%) | 44 (100.0%) |
| 55 to 64 Years | 14 (100.0%) | 11 (39.3%) |
| 65 to 74 Years | 39 (100.0%) | 136 (100.0%) |
| 75 Years and over | 63 (100.0%) | 54 (100.0%) |
| Total | 170 (100.0%) | 272 (73.5%) |
Income Below Poverty Among Married-Couple Families in Villa Heights
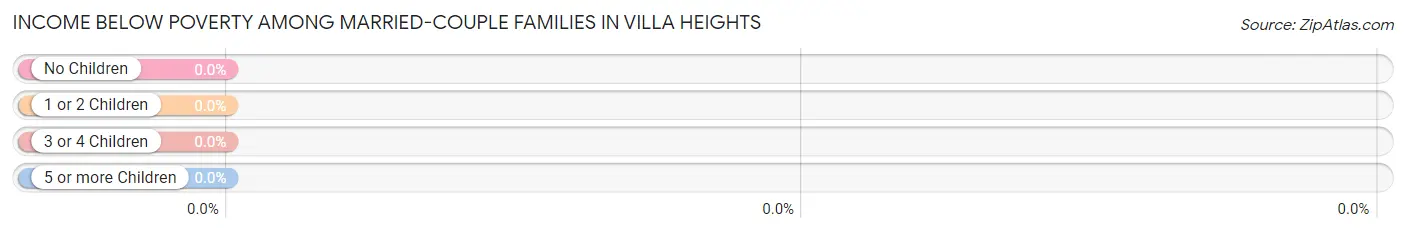
| Children | Above Poverty | Below Poverty |
| No Children | 63 (100.0%) | 0 (0.0%) |
| 1 or 2 Children | 0 (0.0%) | 0 (0.0%) |
| 3 or 4 Children | 0 (0.0%) | 0 (0.0%) |
| 5 or more Children | 0 (0.0%) | 0 (0.0%) |
| Total | 63 (100.0%) | 0 (0.0%) |
Income Below Poverty Among Single-Parent Households in Villa Heights
| Children | Single Father | Single Mother |
| No Children | 0 (0.0%) | 0 (0.0%) |
| 1 or 2 Children | 0 (0.0%) | 0 (0.0%) |
| 3 or 4 Children | 0 (0.0%) | 0 (0.0%) |
| 5 or more Children | 0 (0.0%) | 0 (0.0%) |
| Total | 0 (0.0%) | 0 (0.0%) |
Income Below Poverty Among Married-Couple vs Single-Parent Households in Villa Heights
| Children | Married-Couple Families | Single-Parent Households |
| No Children | 0 (0.0%) | 0 (0.0%) |
| 1 or 2 Children | 0 (0.0%) | 0 (0.0%) |
| 3 or 4 Children | 0 (0.0%) | 0 (0.0%) |
| 5 or more Children | 0 (0.0%) | 0 (0.0%) |
| Total | 0 (0.0%) | 0 (0.0%) |
Race in Villa Heights
The most populous races in Villa Heights are White / Caucasian (374 | 69.3%), Black / African American (109 | 20.2%), and Hispanic or Latino (38 | 7.0%).
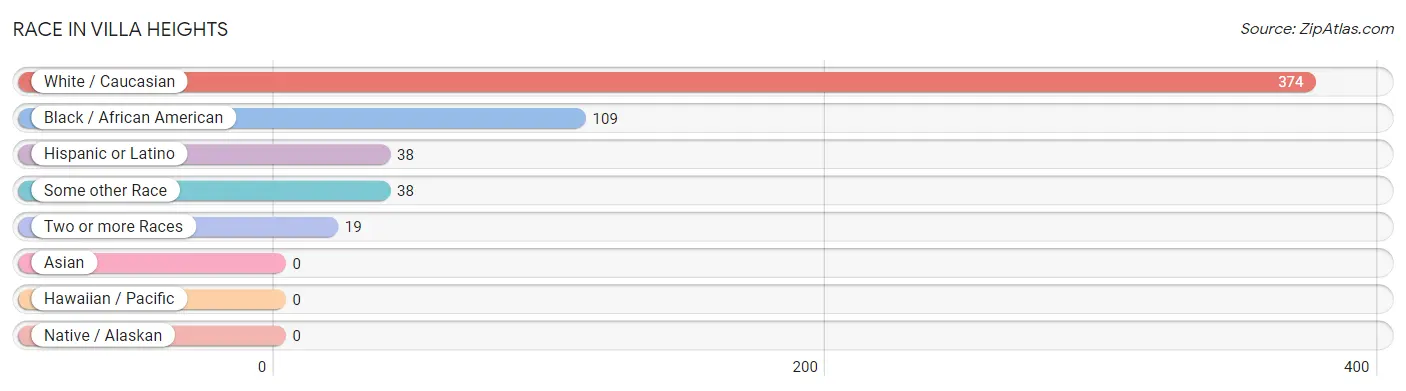
| Race | # Population | % Population |
| Asian | 0 | 0.0% |
| Black / African American | 109 | 20.2% |
| Hawaiian / Pacific | 0 | 0.0% |
| Hispanic or Latino | 38 | 7.0% |
| Native / Alaskan | 0 | 0.0% |
| White / Caucasian | 374 | 69.3% |
| Two or more Races | 19 | 3.5% |
| Some other Race | 38 | 7.0% |
| Total | 540 | 100.0% |
Ancestry in Villa Heights
The most populous ancestries reported in Villa Heights are American (124 | 23.0%), English (49 | 9.1%), Irish (38 | 7.0%), Polish (15 | 2.8%), and Portuguese (15 | 2.8%), together accounting for 44.6% of all Villa Heights residents.
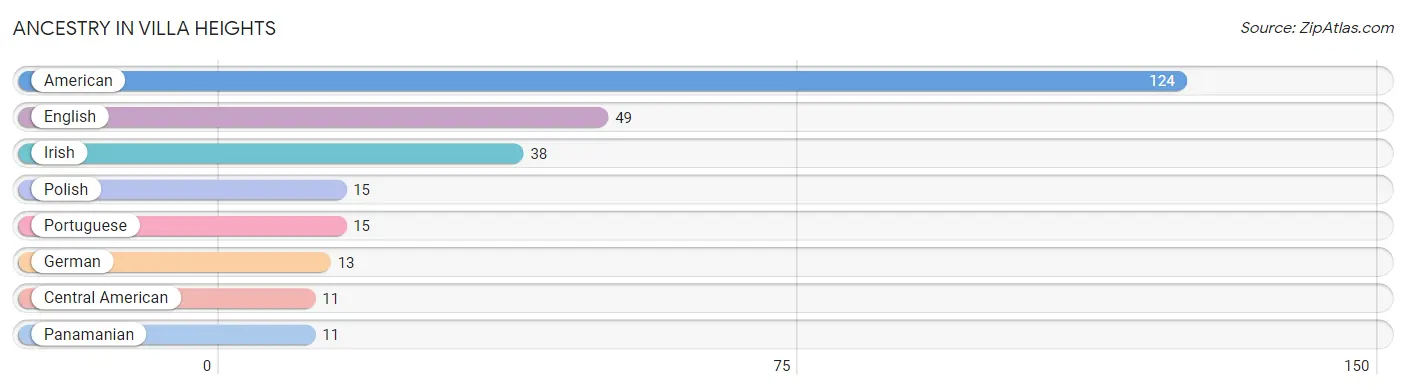
| Ancestry | # Population | % Population |
| American | 124 | 23.0% |
| Central American | 11 | 2.0% |
| English | 49 | 9.1% |
| German | 13 | 2.4% |
| Irish | 38 | 7.0% |
| Panamanian | 11 | 2.0% |
| Polish | 15 | 2.8% |
| Portuguese | 15 | 2.8% | View All 8 Rows |
Immigrants in Villa Heights

| Immigration Origin | # Population | % Population | View All 0 Rows |
Sex and Age in Villa Heights
Sex and Age in Villa Heights
The most populous age groups in Villa Heights are 75 to 79 Years (47 | 27.7%) for men and 70 to 74 Years (136 | 36.8%) for women.
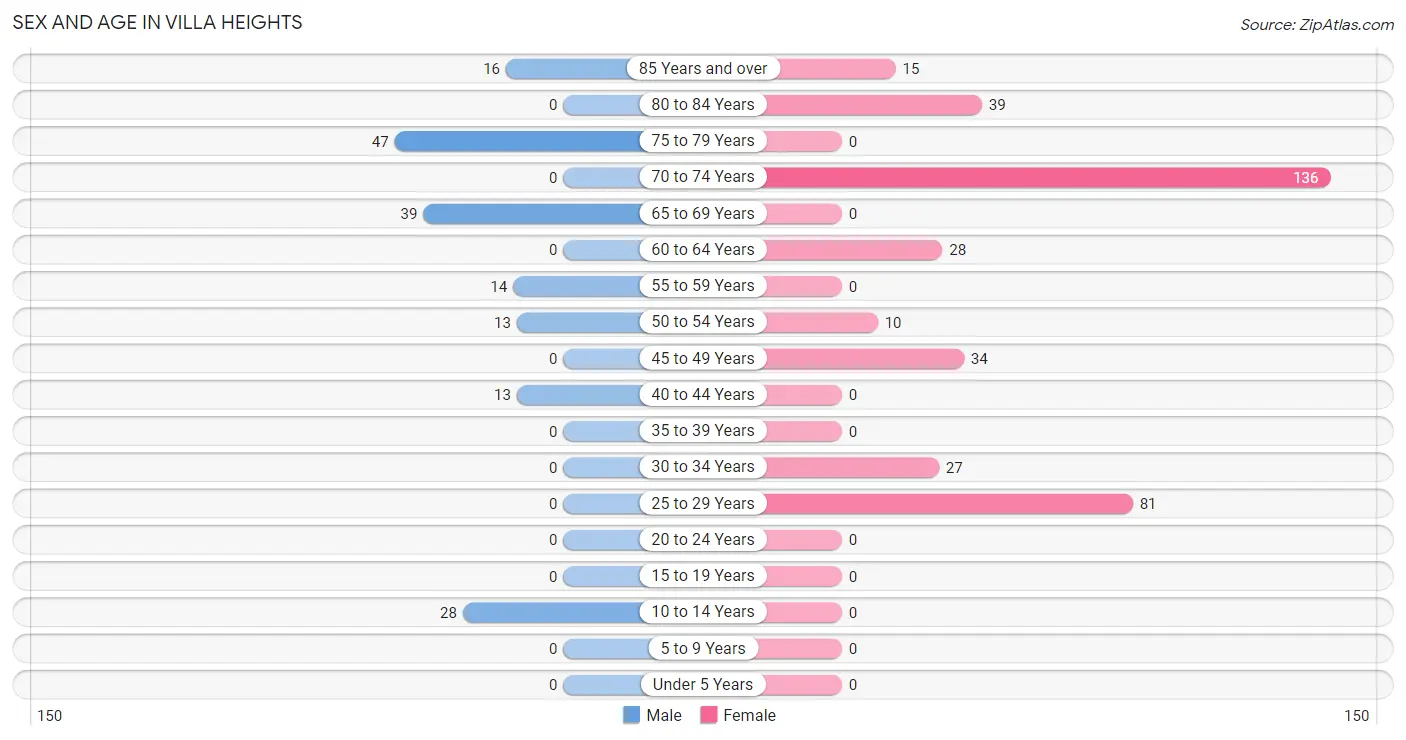
| Age Bracket | Male | Female |
| Under 5 Years | 0 (0.0%) | 0 (0.0%) |
| 5 to 9 Years | 0 (0.0%) | 0 (0.0%) |
| 10 to 14 Years | 28 (16.5%) | 0 (0.0%) |
| 15 to 19 Years | 0 (0.0%) | 0 (0.0%) |
| 20 to 24 Years | 0 (0.0%) | 0 (0.0%) |
| 25 to 29 Years | 0 (0.0%) | 81 (21.9%) |
| 30 to 34 Years | 0 (0.0%) | 27 (7.3%) |
| 35 to 39 Years | 0 (0.0%) | 0 (0.0%) |
| 40 to 44 Years | 13 (7.6%) | 0 (0.0%) |
| 45 to 49 Years | 0 (0.0%) | 34 (9.2%) |
| 50 to 54 Years | 13 (7.6%) | 10 (2.7%) |
| 55 to 59 Years | 14 (8.2%) | 0 (0.0%) |
| 60 to 64 Years | 0 (0.0%) | 28 (7.6%) |
| 65 to 69 Years | 39 (22.9%) | 0 (0.0%) |
| 70 to 74 Years | 0 (0.0%) | 136 (36.8%) |
| 75 to 79 Years | 47 (27.7%) | 0 (0.0%) |
| 80 to 84 Years | 0 (0.0%) | 39 (10.5%) |
| 85 Years and over | 16 (9.4%) | 15 (4.1%) |
| Total | 170 (100.0%) | 370 (100.0%) |
Families and Households in Villa Heights
Median Family Size in Villa Heights
The median family size in Villa Heights is 2.65 persons per family, with single female/mother families (11 | 10.9%) accounting for the largest median family size of 6 persons per family. On the other hand, married-couple families (63 | 62.4%) represent the smallest median family size with 1.89 persons per family.
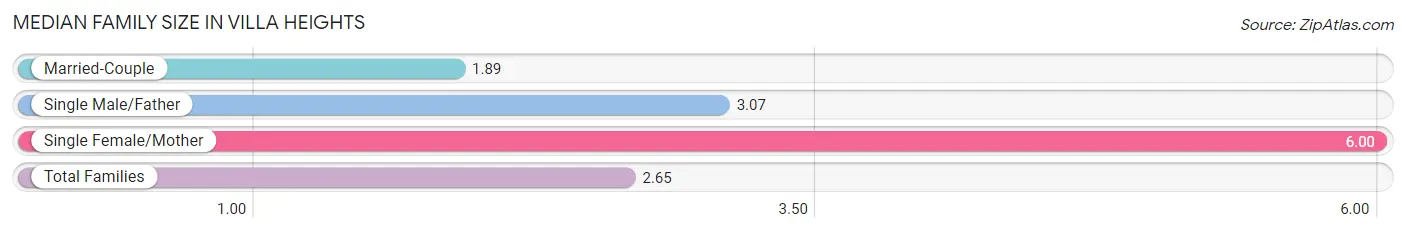
| Family Type | # Families | Family Size |
| Married-Couple | 63 (62.4%) | 1.89 |
| Single Male/Father | 27 (26.7%) | 3.07 |
| Single Female/Mother | 11 (10.9%) | 6.00 |
| Total Families | 101 (100.0%) | 2.65 |
Median Household Size in Villa Heights
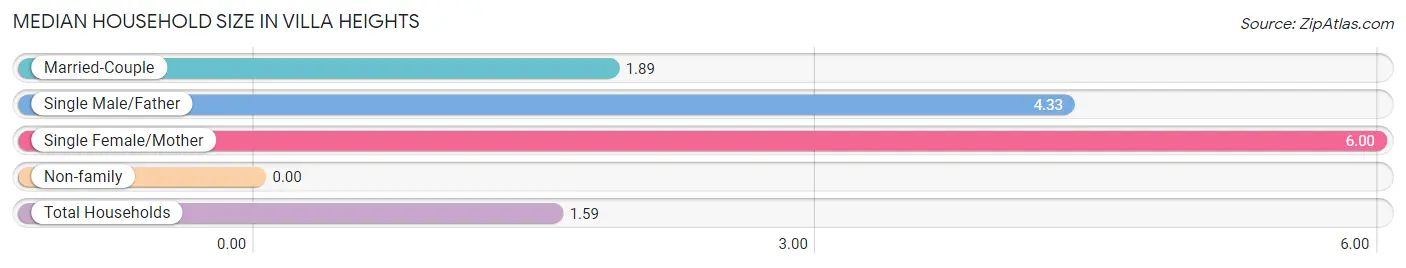
| Household Type | # Households | Household Size |
| Married-Couple | 63 (18.6%) | 1.89 |
| Single Male/Father | 27 (8.0%) | 4.33 |
| Single Female/Mother | 11 (3.2%) | 6.00 |
| Non-family | 238 (70.2%) | - |
| Total Households | 339 (100.0%) | 1.59 |
Household Size by Marriage Status in Villa Heights
Out of a total of 339 households in Villa Heights, 101 (29.8%) are family households, while 238 (70.2%) are nonfamily households. The most numerous type of family households are 2-person households, comprising 76, and the most common type of nonfamily households are 1-person households, comprising 238.
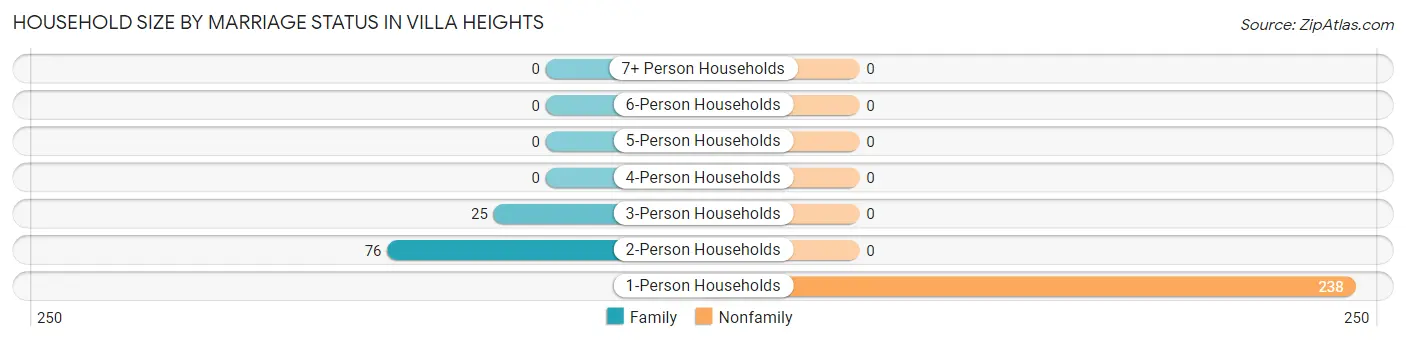
| Household Size | Family Households | Nonfamily Households |
| 1-Person Households | - | 238 (70.2%) |
| 2-Person Households | 76 (22.4%) | 0 (0.0%) |
| 3-Person Households | 25 (7.4%) | 0 (0.0%) |
| 4-Person Households | 0 (0.0%) | 0 (0.0%) |
| 5-Person Households | 0 (0.0%) | 0 (0.0%) |
| 6-Person Households | 0 (0.0%) | 0 (0.0%) |
| 7+ Person Households | 0 (0.0%) | 0 (0.0%) |
| Total | 101 (29.8%) | 238 (70.2%) |
Female Fertility in Villa Heights
Fertility by Age in Villa Heights
| Age Bracket | Women with Births | Births / 1,000 Women |
| 15 to 19 years | 0 (0.0%) | 0.0 |
| 20 to 34 years | 0 (0.0%) | 0.0 |
| 35 to 50 years | 0 (0.0%) | 0.0 |
| Total | 0 (0.0%) | 0.0 |
Fertility by Age by Marriage Status in Villa Heights
| Age Bracket | Married | Unmarried |
| 15 to 19 years | 0 (0.0%) | 0 (0.0%) |
| 20 to 34 years | 0 (0.0%) | 0 (0.0%) |
| 35 to 50 years | 0 (0.0%) | 0 (0.0%) |
| Total | 0 (0.0%) | 0 (0.0%) |
Fertility by Education in Villa Heights
| Educational Attainment | Women with Births | Births / 1,000 Women |
| Less than High School | 0 (0.0%) | 0.0 |
| High School Diploma | 0 (0.0%) | 0.0 |
| College or Associate's Degree | 0 (0.0%) | 0.0 |
| Bachelor's Degree | 0 (0.0%) | 0.0 |
| Graduate Degree | 0 (0.0%) | 0.0 |
| Total | 0 (0.0%) | 0.0 |
Fertility by Education by Marriage Status in Villa Heights
| Educational Attainment | Married | Unmarried |
| Less than High School | 0 (0.0%) | 0 (0.0%) |
| High School Diploma | 0 (0.0%) | 0 (0.0%) |
| College or Associate's Degree | 0 (0.0%) | 0 (0.0%) |
| Bachelor's Degree | 0 (0.0%) | 0 (0.0%) |
| Graduate Degree | 0 (0.0%) | 0 (0.0%) |
| Total | 0 (0.0%) | 0 (0.0%) |
Employment Characteristics in Villa Heights
Employment by Class of Employer in Villa Heights
Among the 130 employed individuals in Villa Heights, private company employees (113 | 86.9%), and self-employed (incorporated) (17 | 13.1%) make up the most common classes of employment.
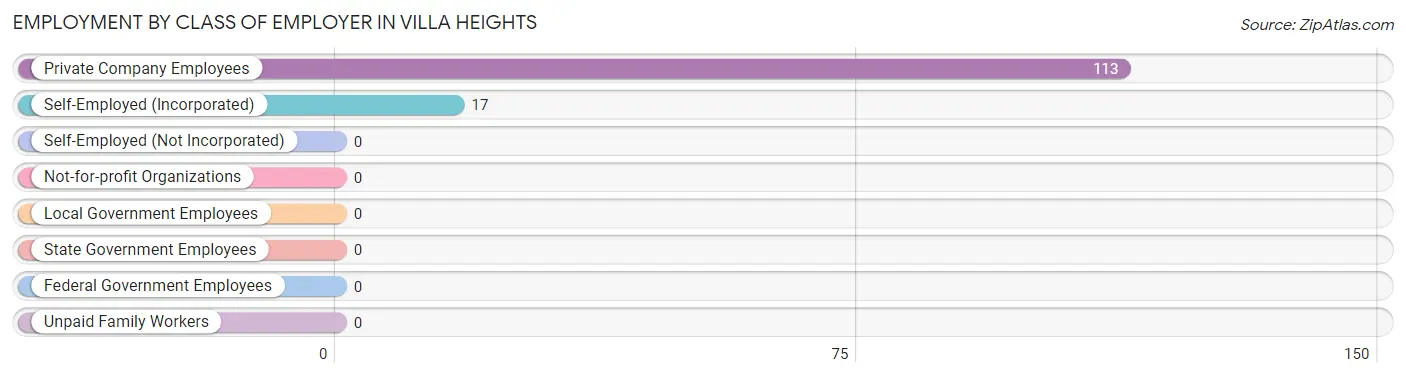
| Employer Class | # Employees | % Employees |
| Private Company Employees | 113 | 86.9% |
| Self-Employed (Incorporated) | 17 | 13.1% |
| Self-Employed (Not Incorporated) | 0 | 0.0% |
| Not-for-profit Organizations | 0 | 0.0% |
| Local Government Employees | 0 | 0.0% |
| State Government Employees | 0 | 0.0% |
| Federal Government Employees | 0 | 0.0% |
| Unpaid Family Workers | 0 | 0.0% |
| Total | 130 | 100.0% |
Employment Status by Age in Villa Heights
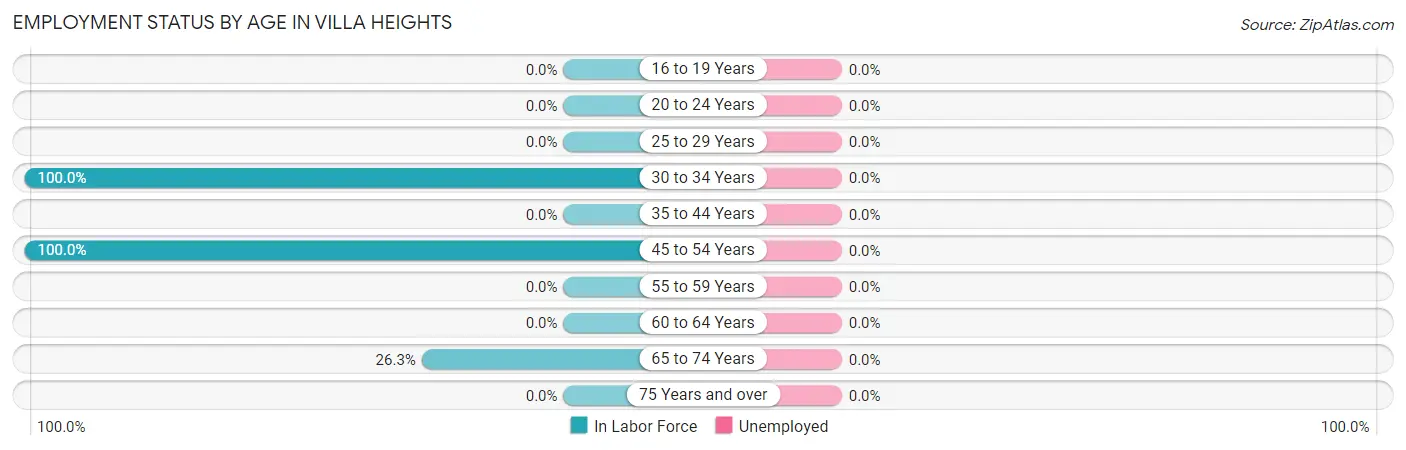
| Age Bracket | In Labor Force | Unemployed |
| 16 to 19 Years | 0 (0.0%) | 0 (0.0%) |
| 20 to 24 Years | 0 (0.0%) | 0 (0.0%) |
| 25 to 29 Years | 0 (0.0%) | 0 (0.0%) |
| 30 to 34 Years | 27 (100.0%) | 0 (0.0%) |
| 35 to 44 Years | 0 (0.0%) | 0 (0.0%) |
| 45 to 54 Years | 57 (100.0%) | 0 (0.0%) |
| 55 to 59 Years | 0 (0.0%) | 0 (0.0%) |
| 60 to 64 Years | 0 (0.0%) | 0 (0.0%) |
| 65 to 74 Years | 46 (26.3%) | 0 (0.0%) |
| 75 Years and over | 0 (0.0%) | 0 (0.0%) |
| Total | 130 (25.4%) | 0 (0.0%) |
Employment Status by Educational Attainment in Villa Heights
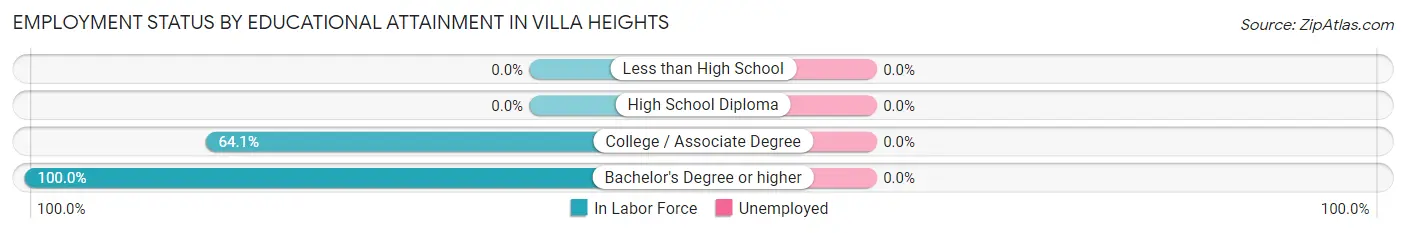
| Educational Attainment | In Labor Force | Unemployed |
| Less than High School | 0 (0.0%) | 0 (0.0%) |
| High School Diploma | 0 (0.0%) | 0 (0.0%) |
| College / Associate Degree | 50 (64.1%) | 0 (0.0%) |
| Bachelor's Degree or higher | 34 (100.0%) | 0 (0.0%) |
| Total | 84 (38.2%) | 0 (0.0%) |
Employment Occupations by Sex in Villa Heights
Management, Business, Science and Arts Occupations
The most common Management, Business, Science and Arts occupations in Villa Heights are Management (17 | 13.1%), Computers, Engineering & Science (13 | 10.0%), Computers & Mathematics (13 | 10.0%), and Business & Financial (10 | 7.7%).
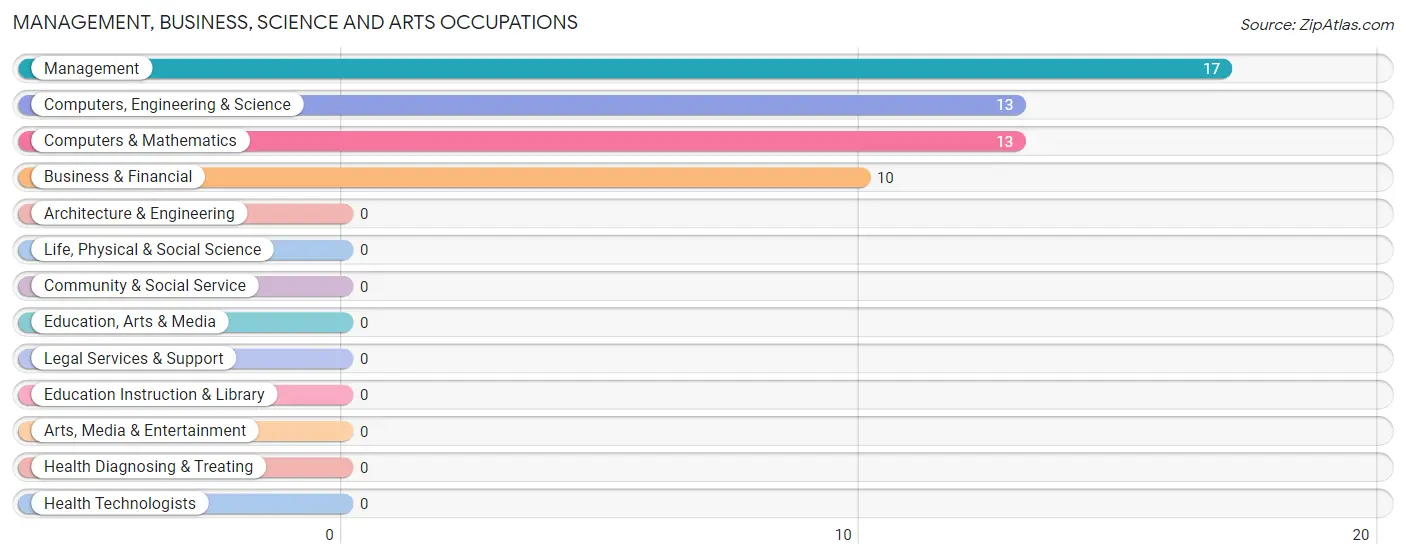
Management, Business, Science and Arts Occupations by Sex
Within the Management, Business, Science and Arts occupations in Villa Heights, the most male-oriented occupations are Computers, Engineering & Science (100.0%), and Computers & Mathematics (100.0%), while the most female-oriented occupations are Management (100.0%), and Business & Financial (100.0%).
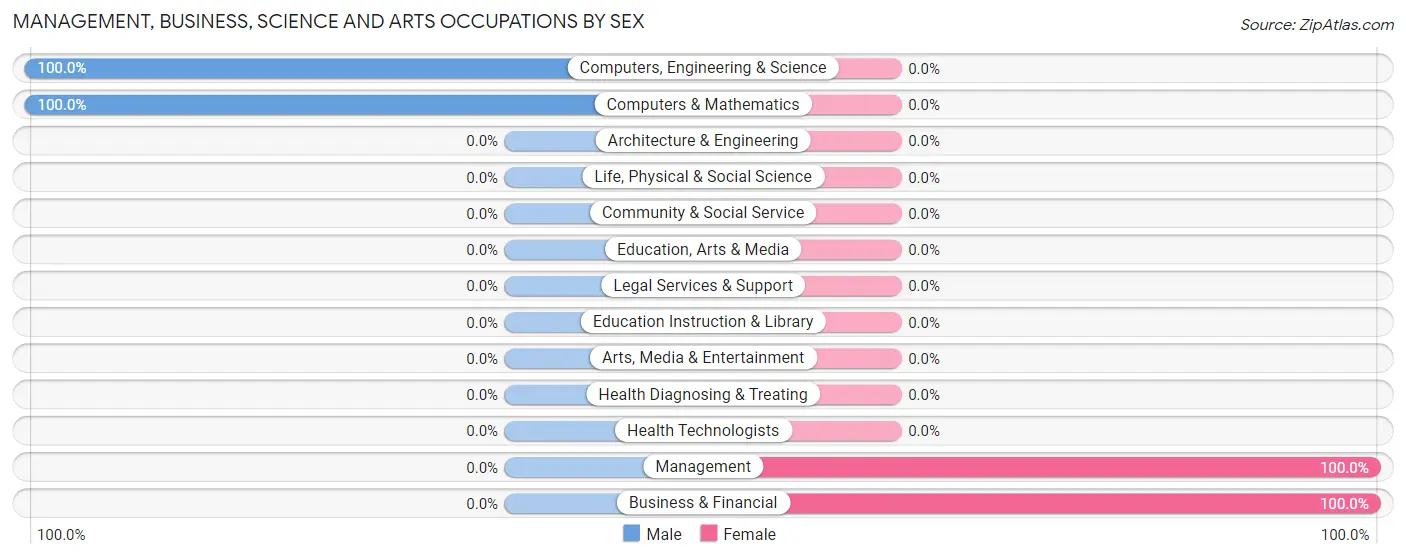
| Occupation | Male | Female |
| Management | 0 (0.0%) | 17 (100.0%) |
| Business & Financial | 0 (0.0%) | 10 (100.0%) |
| Computers, Engineering & Science | 13 (100.0%) | 0 (0.0%) |
| Computers & Mathematics | 13 (100.0%) | 0 (0.0%) |
| Architecture & Engineering | 0 (0.0%) | 0 (0.0%) |
| Life, Physical & Social Science | 0 (0.0%) | 0 (0.0%) |
| Community & Social Service | 0 (0.0%) | 0 (0.0%) |
| Education, Arts & Media | 0 (0.0%) | 0 (0.0%) |
| Legal Services & Support | 0 (0.0%) | 0 (0.0%) |
| Education Instruction & Library | 0 (0.0%) | 0 (0.0%) |
| Arts, Media & Entertainment | 0 (0.0%) | 0 (0.0%) |
| Health Diagnosing & Treating | 0 (0.0%) | 0 (0.0%) |
| Health Technologists | 0 (0.0%) | 0 (0.0%) |
| Total (Category) | 13 (32.5%) | 27 (67.5%) |
| Total (Overall) | 13 (10.0%) | 117 (90.0%) |
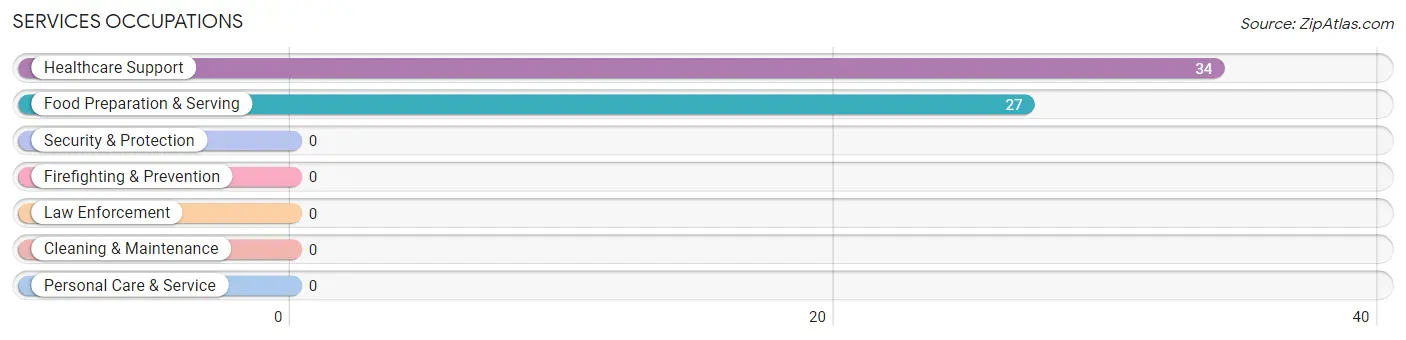
Services Occupations
The most common Services occupations in Villa Heights are Healthcare Support (34 | 26.2%), and Food Preparation & Serving (27 | 20.8%).
Services Occupations by Sex
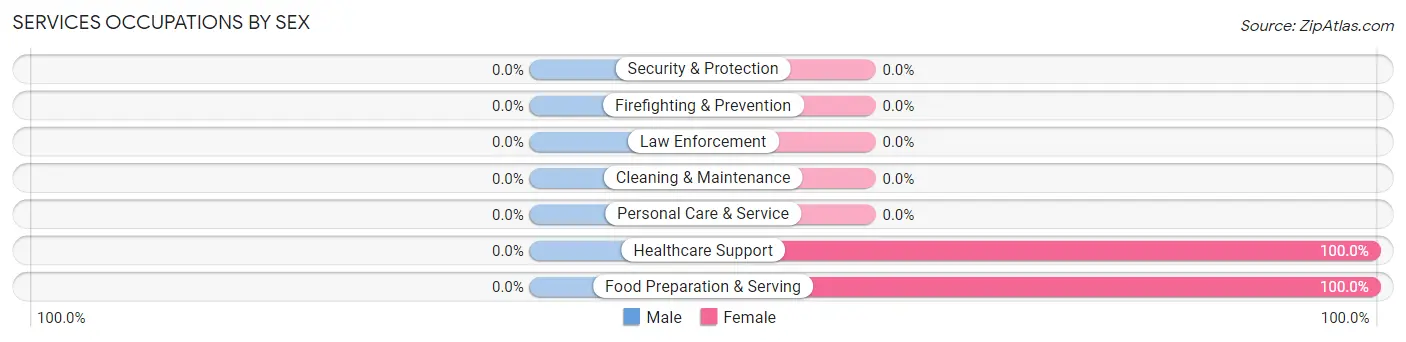
| Occupation | Male | Female |
| Healthcare Support | 0 (0.0%) | 34 (100.0%) |
| Security & Protection | 0 (0.0%) | 0 (0.0%) |
| Firefighting & Prevention | 0 (0.0%) | 0 (0.0%) |
| Law Enforcement | 0 (0.0%) | 0 (0.0%) |
| Food Preparation & Serving | 0 (0.0%) | 27 (100.0%) |
| Cleaning & Maintenance | 0 (0.0%) | 0 (0.0%) |
| Personal Care & Service | 0 (0.0%) | 0 (0.0%) |
| Total (Category) | 0 (0.0%) | 61 (100.0%) |
| Total (Overall) | 13 (10.0%) | 117 (90.0%) |
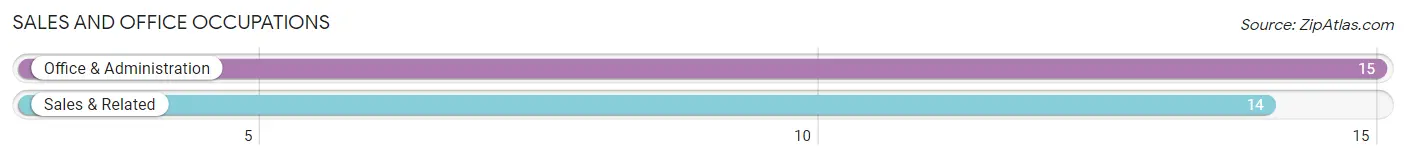
Sales and Office Occupations
The most common Sales and Office occupations in Villa Heights are Office & Administration (15 | 11.5%), and Sales & Related (14 | 10.8%).
Sales and Office Occupations by Sex
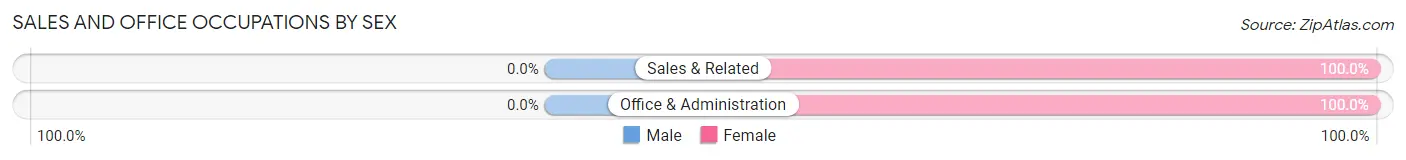
| Occupation | Male | Female |
| Sales & Related | 0 (0.0%) | 14 (100.0%) |
| Office & Administration | 0 (0.0%) | 15 (100.0%) |
| Total (Category) | 0 (0.0%) | 29 (100.0%) |
| Total (Overall) | 13 (10.0%) | 117 (90.0%) |
Natural Resources, Construction and Maintenance Occupations
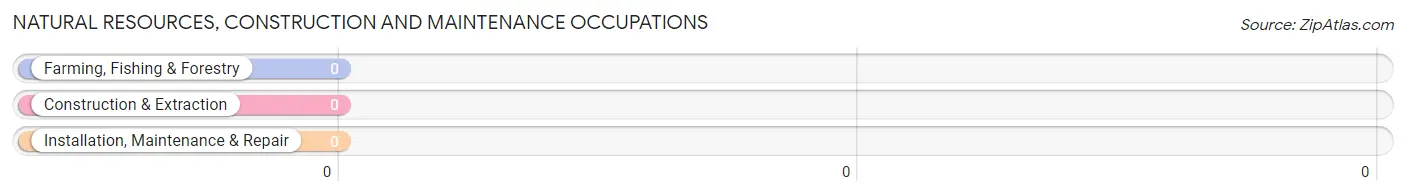
Natural Resources, Construction and Maintenance Occupations by Sex
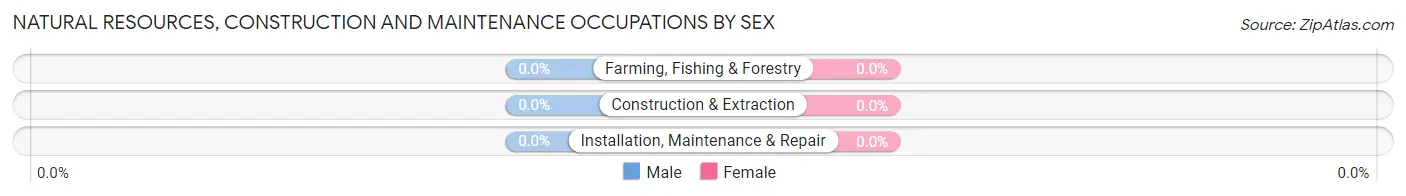
| Occupation | Male | Female |
| Farming, Fishing & Forestry | 0 (0.0%) | 0 (0.0%) |
| Construction & Extraction | 0 (0.0%) | 0 (0.0%) |
| Installation, Maintenance & Repair | 0 (0.0%) | 0 (0.0%) |
| Total (Category) | 0 (0.0%) | 0 (0.0%) |
| Total (Overall) | 13 (10.0%) | 117 (90.0%) |
Production, Transportation and Moving Occupations
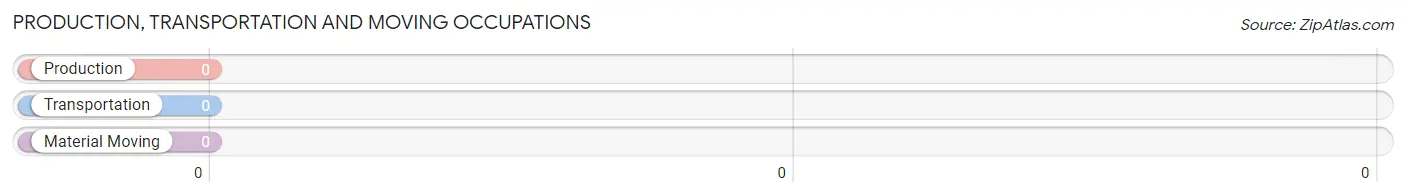
Production, Transportation and Moving Occupations by Sex
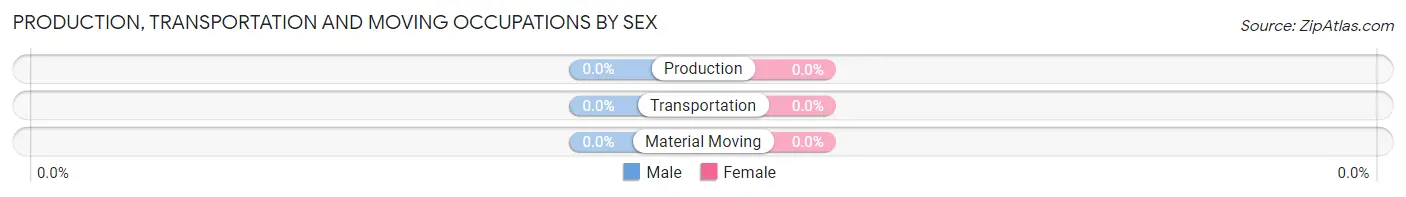
| Occupation | Male | Female |
| Production | 0 (0.0%) | 0 (0.0%) |
| Transportation | 0 (0.0%) | 0 (0.0%) |
| Material Moving | 0 (0.0%) | 0 (0.0%) |
| Total (Category) | 0 (0.0%) | 0 (0.0%) |
| Total (Overall) | 13 (10.0%) | 117 (90.0%) |
Employment Industries by Sex in Villa Heights
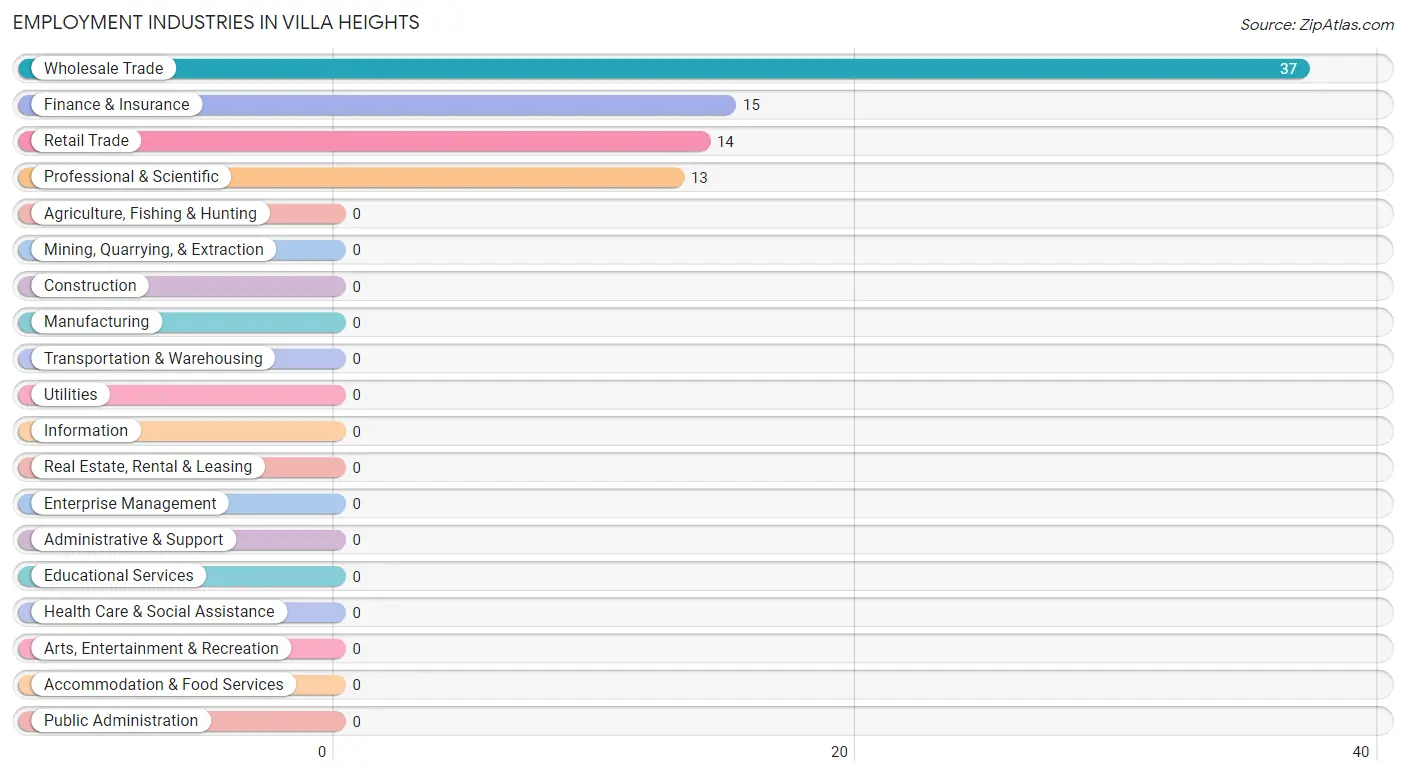
Employment Industries in Villa Heights
The major employment industries in Villa Heights include Wholesale Trade (37 | 28.5%), Finance & Insurance (15 | 11.5%), Retail Trade (14 | 10.8%), and Professional & Scientific (13 | 10.0%).
Employment Industries by Sex in Villa Heights
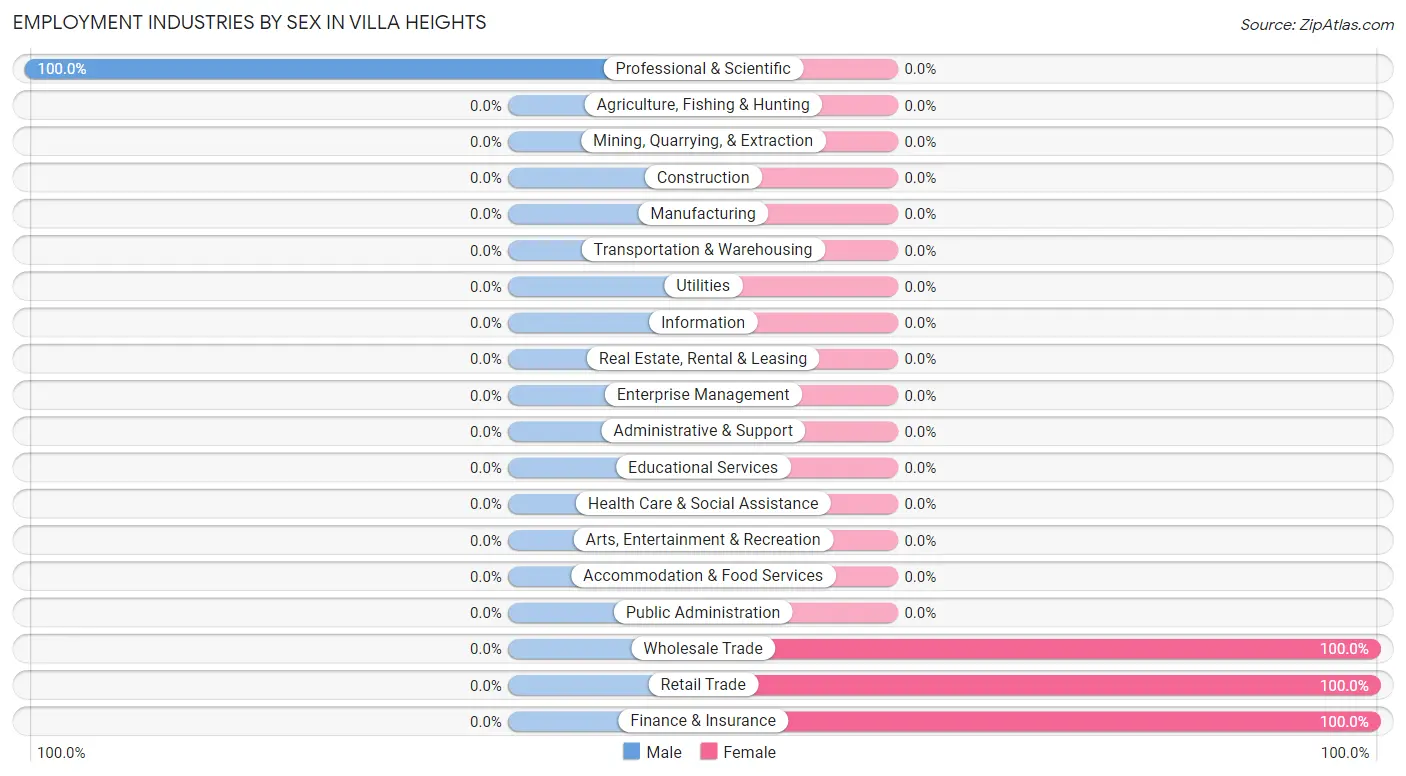
| Industry | Male | Female |
| Agriculture, Fishing & Hunting | 0 (0.0%) | 0 (0.0%) |
| Mining, Quarrying, & Extraction | 0 (0.0%) | 0 (0.0%) |
| Construction | 0 (0.0%) | 0 (0.0%) |
| Manufacturing | 0 (0.0%) | 0 (0.0%) |
| Wholesale Trade | 0 (0.0%) | 37 (100.0%) |
| Retail Trade | 0 (0.0%) | 14 (100.0%) |
| Transportation & Warehousing | 0 (0.0%) | 0 (0.0%) |
| Utilities | 0 (0.0%) | 0 (0.0%) |
| Information | 0 (0.0%) | 0 (0.0%) |
| Finance & Insurance | 0 (0.0%) | 15 (100.0%) |
| Real Estate, Rental & Leasing | 0 (0.0%) | 0 (0.0%) |
| Professional & Scientific | 13 (100.0%) | 0 (0.0%) |
| Enterprise Management | 0 (0.0%) | 0 (0.0%) |
| Administrative & Support | 0 (0.0%) | 0 (0.0%) |
| Educational Services | 0 (0.0%) | 0 (0.0%) |
| Health Care & Social Assistance | 0 (0.0%) | 0 (0.0%) |
| Arts, Entertainment & Recreation | 0 (0.0%) | 0 (0.0%) |
| Accommodation & Food Services | 0 (0.0%) | 0 (0.0%) |
| Public Administration | 0 (0.0%) | 0 (0.0%) |
| Total | 13 (10.0%) | 117 (90.0%) |
Education in Villa Heights
School Enrollment in Villa Heights
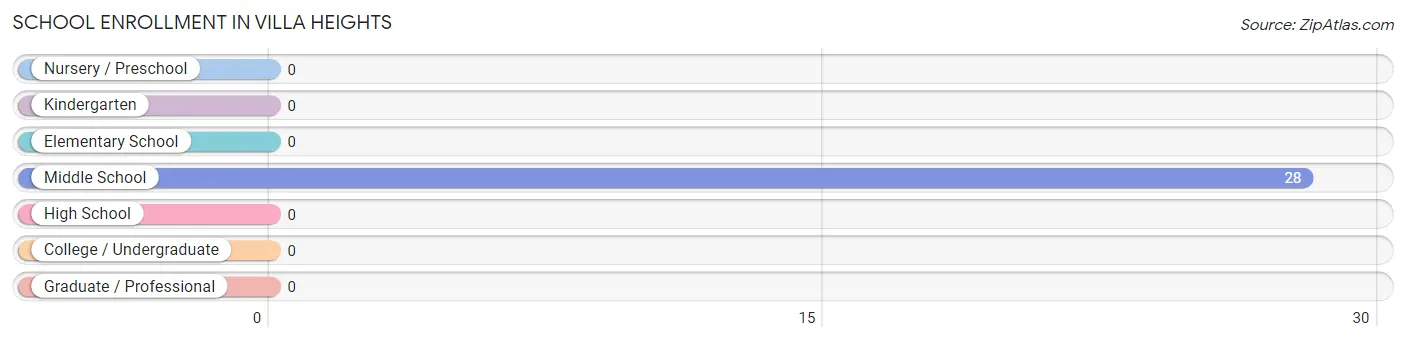
| School Level | # Students | % Students |
| Nursery / Preschool | 0 | 0.0% |
| Kindergarten | 0 | 0.0% |
| Elementary School | 0 | 0.0% |
| Middle School | 28 | 100.0% |
| High School | 0 | 0.0% |
| College / Undergraduate | 0 | 0.0% |
| Graduate / Professional | 0 | 0.0% |
| Total | 28 | 100.0% |
School Enrollment by Age by Funding Source in Villa Heights
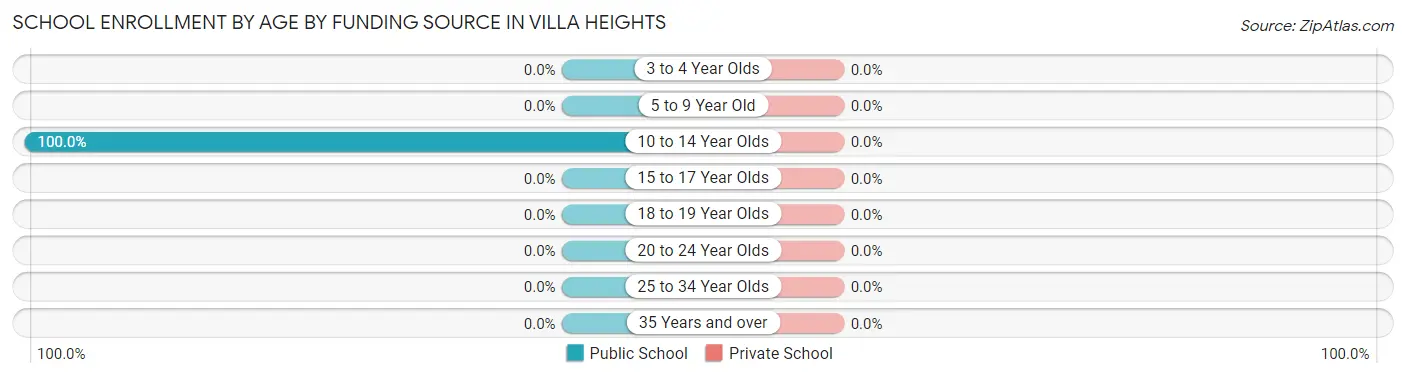
| Age Bracket | Public School | Private School |
| 3 to 4 Year Olds | 0 (0.0%) | 0 (0.0%) |
| 5 to 9 Year Old | 0 (0.0%) | 0 (0.0%) |
| 10 to 14 Year Olds | 28 (100.0%) | 0 (0.0%) |
| 15 to 17 Year Olds | 0 (0.0%) | 0 (0.0%) |
| 18 to 19 Year Olds | 0 (0.0%) | 0 (0.0%) |
| 20 to 24 Year Olds | 0 (0.0%) | 0 (0.0%) |
| 25 to 34 Year Olds | 0 (0.0%) | 0 (0.0%) |
| 35 Years and over | 0 (0.0%) | 0 (0.0%) |
| Total | 28 (100.0%) | 0 (0.0%) |
Educational Attainment by Field of Study in Villa Heights
, and science & technology (51 | 100.0%) are the most common fields of study among 51 individuals in Villa Heights who have obtained a bachelor's degree or higher.
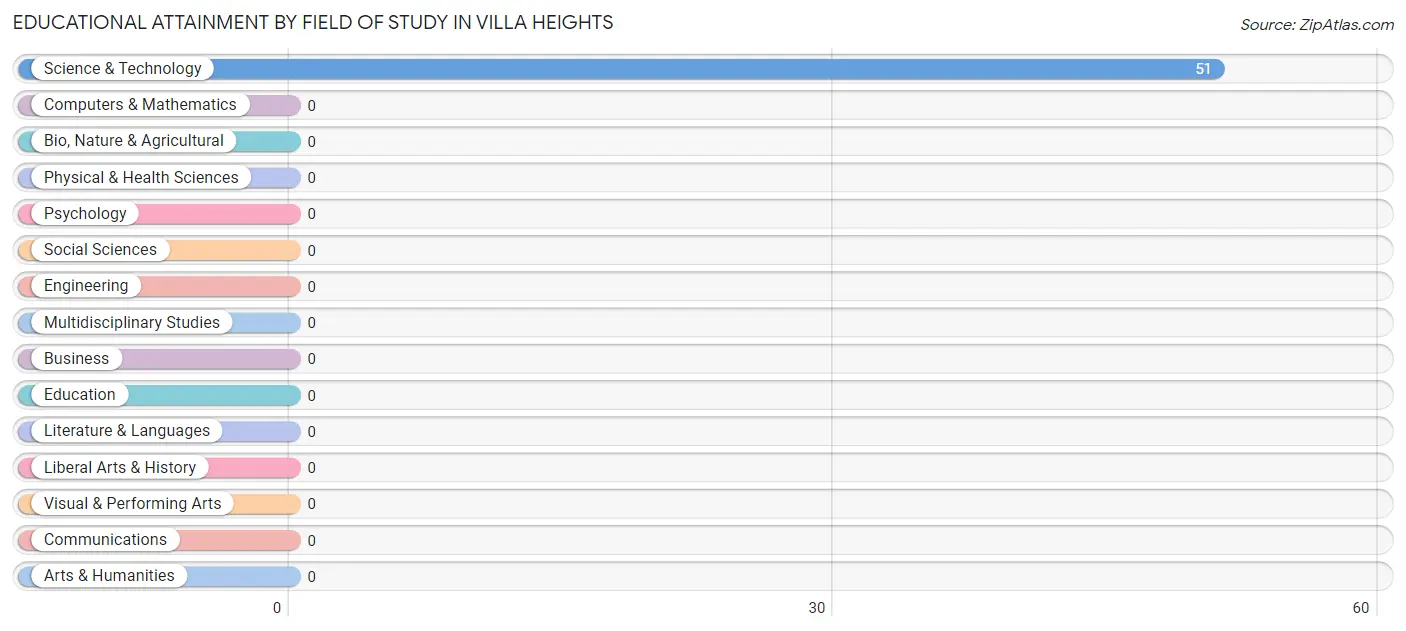
| Field of Study | # Graduates | % Graduates |
| Computers & Mathematics | 0 | 0.0% |
| Bio, Nature & Agricultural | 0 | 0.0% |
| Physical & Health Sciences | 0 | 0.0% |
| Psychology | 0 | 0.0% |
| Social Sciences | 0 | 0.0% |
| Engineering | 0 | 0.0% |
| Multidisciplinary Studies | 0 | 0.0% |
| Science & Technology | 51 | 100.0% |
| Business | 0 | 0.0% |
| Education | 0 | 0.0% |
| Literature & Languages | 0 | 0.0% |
| Liberal Arts & History | 0 | 0.0% |
| Visual & Performing Arts | 0 | 0.0% |
| Communications | 0 | 0.0% |
| Arts & Humanities | 0 | 0.0% |
| Total | 51 | 100.0% |
Transportation & Commute in Villa Heights
Vehicle Availability by Sex in Villa Heights
The most prevalent vehicle ownership categories in Villa Heights are males with 2 vehicles (13, accounting for 100.0%) and females with 2 vehicles (85, making up 11.1%).
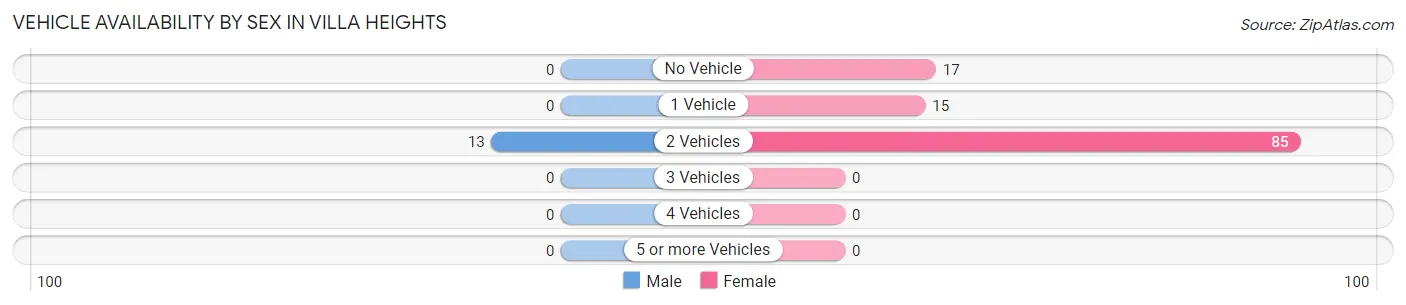
| Vehicles Available | Male | Female |
| No Vehicle | 0 (0.0%) | 17 (14.5%) |
| 1 Vehicle | 0 (0.0%) | 15 (12.8%) |
| 2 Vehicles | 13 (100.0%) | 85 (72.7%) |
| 3 Vehicles | 0 (0.0%) | 0 (0.0%) |
| 4 Vehicles | 0 (0.0%) | 0 (0.0%) |
| 5 or more Vehicles | 0 (0.0%) | 0 (0.0%) |
| Total | 13 (100.0%) | 117 (100.0%) |
Commute Time in Villa Heights
The most frequently occuring commute durations in Villa Heights are 20 to 24 minutes (48 commuters, 36.9%), 15 to 19 minutes (32 commuters, 24.6%), and 30 to 34 minutes (27 commuters, 20.8%).
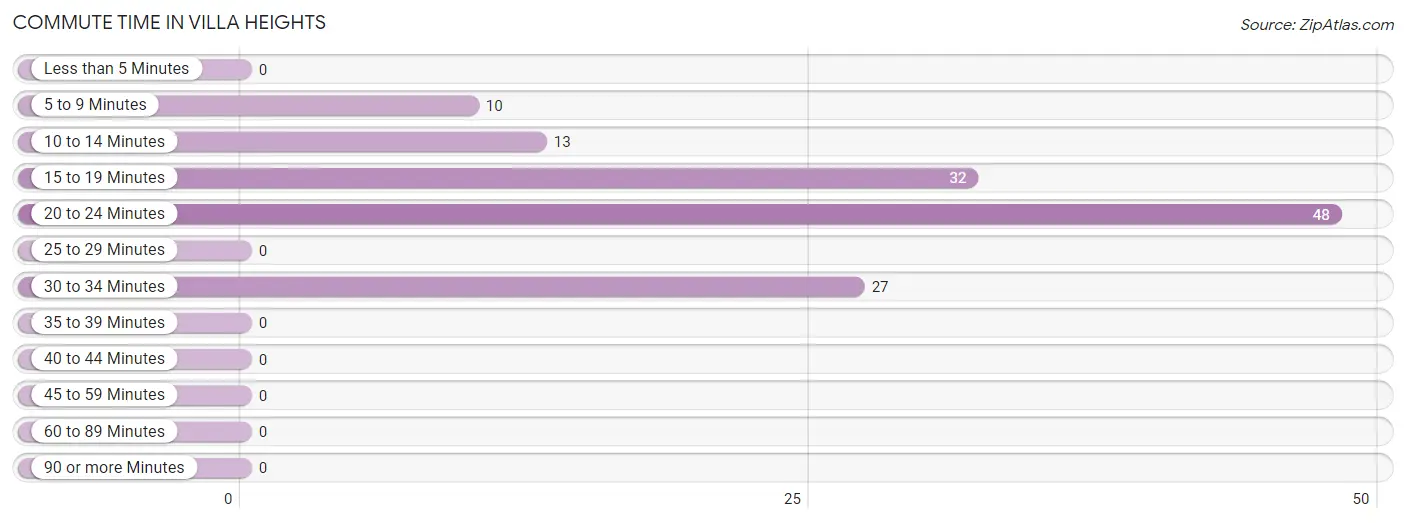
| Commute Time | # Commuters | % Commuters |
| Less than 5 Minutes | 0 | 0.0% |
| 5 to 9 Minutes | 10 | 7.7% |
| 10 to 14 Minutes | 13 | 10.0% |
| 15 to 19 Minutes | 32 | 24.6% |
| 20 to 24 Minutes | 48 | 36.9% |
| 25 to 29 Minutes | 0 | 0.0% |
| 30 to 34 Minutes | 27 | 20.8% |
| 35 to 39 Minutes | 0 | 0.0% |
| 40 to 44 Minutes | 0 | 0.0% |
| 45 to 59 Minutes | 0 | 0.0% |
| 60 to 89 Minutes | 0 | 0.0% |
| 90 or more Minutes | 0 | 0.0% |
Commute Time by Sex in Villa Heights
The most common commute times in Villa Heights are 10 to 14 minutes (13 commuters, 100.0%) for males and 20 to 24 minutes (48 commuters, 41.0%) for females.
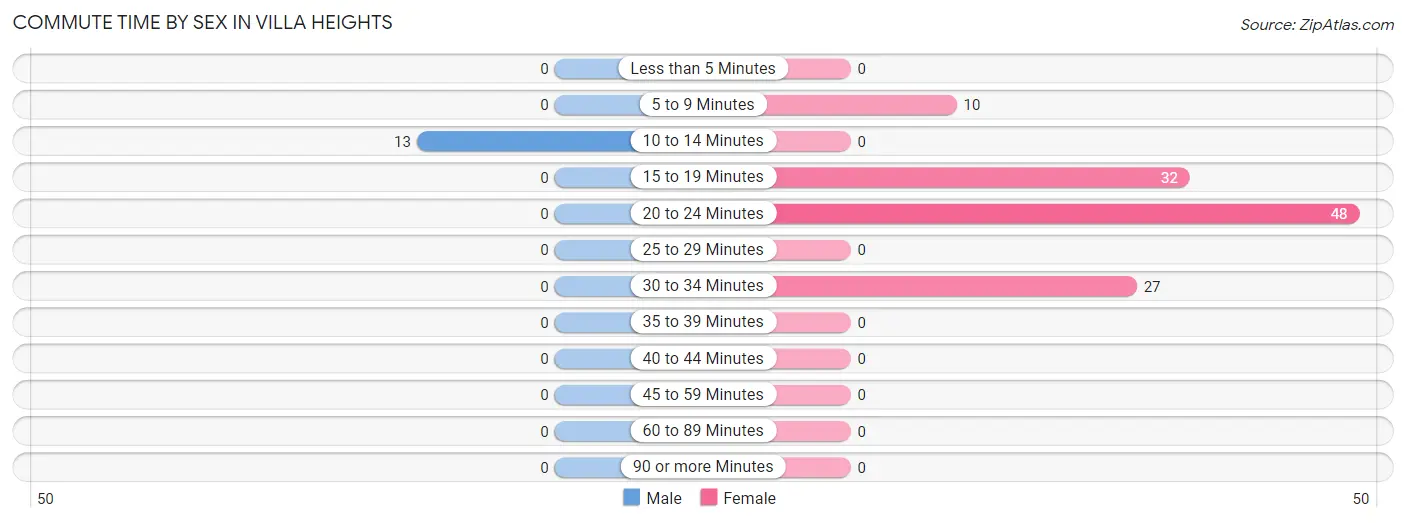
| Commute Time | Male | Female |
| Less than 5 Minutes | 0 (0.0%) | 0 (0.0%) |
| 5 to 9 Minutes | 0 (0.0%) | 10 (8.6%) |
| 10 to 14 Minutes | 13 (100.0%) | 0 (0.0%) |
| 15 to 19 Minutes | 0 (0.0%) | 32 (27.4%) |
| 20 to 24 Minutes | 0 (0.0%) | 48 (41.0%) |
| 25 to 29 Minutes | 0 (0.0%) | 0 (0.0%) |
| 30 to 34 Minutes | 0 (0.0%) | 27 (23.1%) |
| 35 to 39 Minutes | 0 (0.0%) | 0 (0.0%) |
| 40 to 44 Minutes | 0 (0.0%) | 0 (0.0%) |
| 45 to 59 Minutes | 0 (0.0%) | 0 (0.0%) |
| 60 to 89 Minutes | 0 (0.0%) | 0 (0.0%) |
| 90 or more Minutes | 0 (0.0%) | 0 (0.0%) |
Time of Departure to Work by Sex in Villa Heights
The most frequent times of departure to work in Villa Heights are 6:30 AM to 6:59 AM (13, 100.0%) for males and 6:30 AM to 6:59 AM (34, 29.1%) for females.
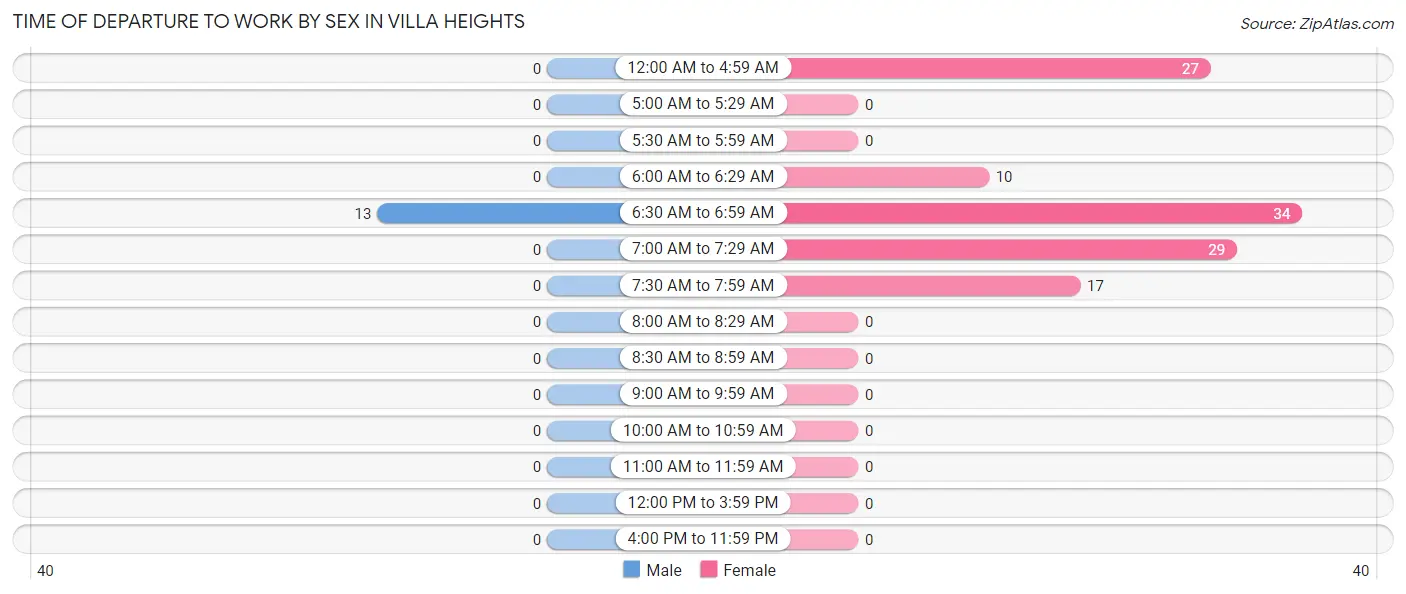
| Time of Departure | Male | Female |
| 12:00 AM to 4:59 AM | 0 (0.0%) | 27 (23.1%) |
| 5:00 AM to 5:29 AM | 0 (0.0%) | 0 (0.0%) |
| 5:30 AM to 5:59 AM | 0 (0.0%) | 0 (0.0%) |
| 6:00 AM to 6:29 AM | 0 (0.0%) | 10 (8.6%) |
| 6:30 AM to 6:59 AM | 13 (100.0%) | 34 (29.1%) |
| 7:00 AM to 7:29 AM | 0 (0.0%) | 29 (24.8%) |
| 7:30 AM to 7:59 AM | 0 (0.0%) | 17 (14.5%) |
| 8:00 AM to 8:29 AM | 0 (0.0%) | 0 (0.0%) |
| 8:30 AM to 8:59 AM | 0 (0.0%) | 0 (0.0%) |
| 9:00 AM to 9:59 AM | 0 (0.0%) | 0 (0.0%) |
| 10:00 AM to 10:59 AM | 0 (0.0%) | 0 (0.0%) |
| 11:00 AM to 11:59 AM | 0 (0.0%) | 0 (0.0%) |
| 12:00 PM to 3:59 PM | 0 (0.0%) | 0 (0.0%) |
| 4:00 PM to 11:59 PM | 0 (0.0%) | 0 (0.0%) |
| Total | 13 (100.0%) | 117 (100.0%) |
Housing Occupancy in Villa Heights
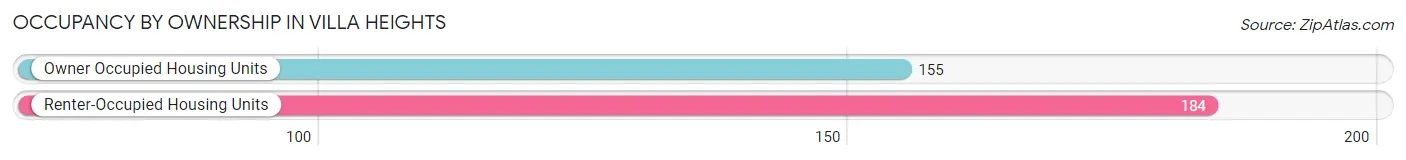
Occupancy by Ownership in Villa Heights
Of the total 339 dwellings in Villa Heights, owner-occupied units account for 155 (45.7%), while renter-occupied units make up 184 (54.3%).
| Occupancy | # Housing Units | % Housing Units |
| Owner Occupied Housing Units | 155 | 45.7% |
| Renter-Occupied Housing Units | 184 | 54.3% |
| Total Occupied Housing Units | 339 | 100.0% |
Occupancy by Household Size in Villa Heights
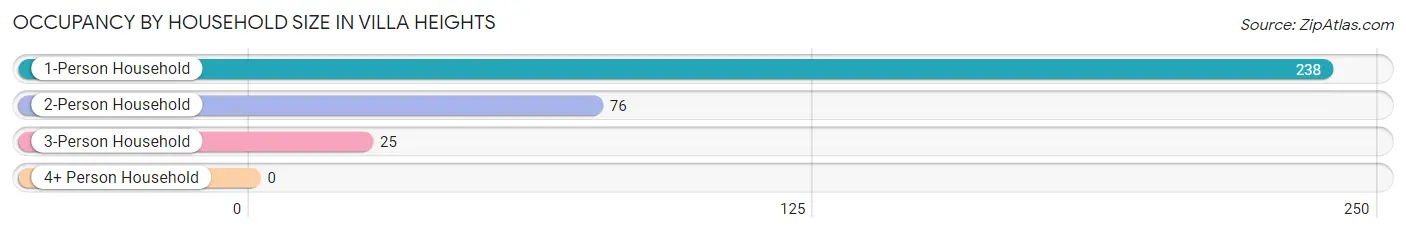
| Household Size | # Housing Units | % Housing Units |
| 1-Person Household | 238 | 70.2% |
| 2-Person Household | 76 | 22.4% |
| 3-Person Household | 25 | 7.4% |
| 4+ Person Household | 0 | 0.0% |
| Total Housing Units | 339 | 100.0% |
Occupancy by Ownership by Household Size in Villa Heights
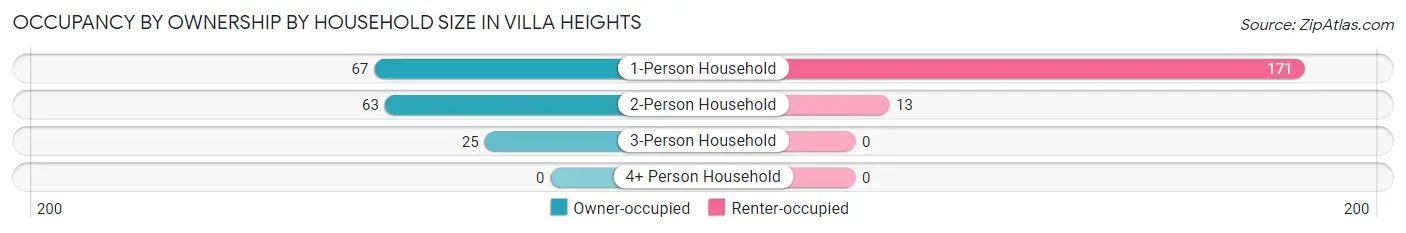
| Household Size | Owner-occupied | Renter-occupied |
| 1-Person Household | 67 (28.1%) | 171 (71.9%) |
| 2-Person Household | 63 (82.9%) | 13 (17.1%) |
| 3-Person Household | 25 (100.0%) | 0 (0.0%) |
| 4+ Person Household | 0 (0.0%) | 0 (0.0%) |
| Total Housing Units | 155 (45.7%) | 184 (54.3%) |
Occupancy by Educational Attainment in Villa Heights
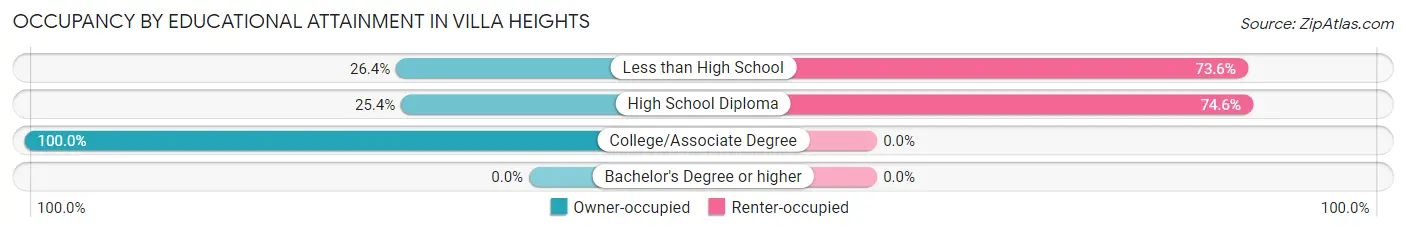
| Household Size | Owner-occupied | Renter-occupied |
| Less than High School | 29 (26.4%) | 81 (73.6%) |
| High School Diploma | 35 (25.4%) | 103 (74.6%) |
| College/Associate Degree | 91 (100.0%) | 0 (0.0%) |
| Bachelor's Degree or higher | 0 (0.0%) | 0 (0.0%) |
Occupancy by Age of Householder in Villa Heights
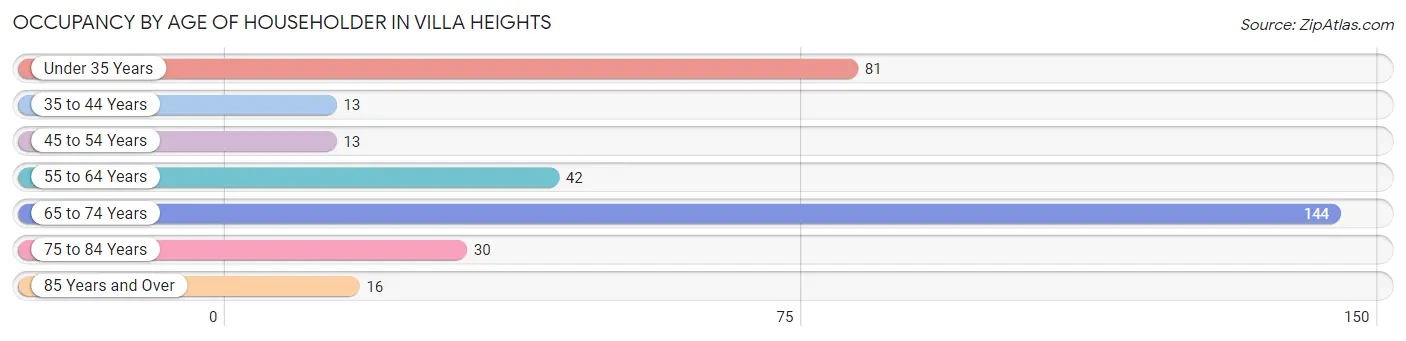
| Age Bracket | # Households | % Households |
| Under 35 Years | 81 | 23.9% |
| 35 to 44 Years | 13 | 3.8% |
| 45 to 54 Years | 13 | 3.8% |
| 55 to 64 Years | 42 | 12.4% |
| 65 to 74 Years | 144 | 42.5% |
| 75 to 84 Years | 30 | 8.8% |
| 85 Years and Over | 16 | 4.7% |
| Total | 339 | 100.0% |
Housing Finances in Villa Heights
Median Income by Occupancy in Villa Heights
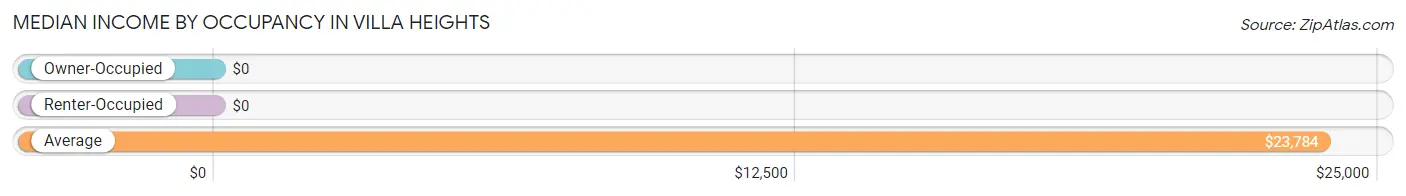
| Occupancy Type | # Households | Median Income |
| Owner-Occupied | 155 (45.7%) | $0 |
| Renter-Occupied | 184 (54.3%) | $0 |
| Average | 339 (100.0%) | $23,784 |
Occupancy by Householder Income Bracket in Villa Heights
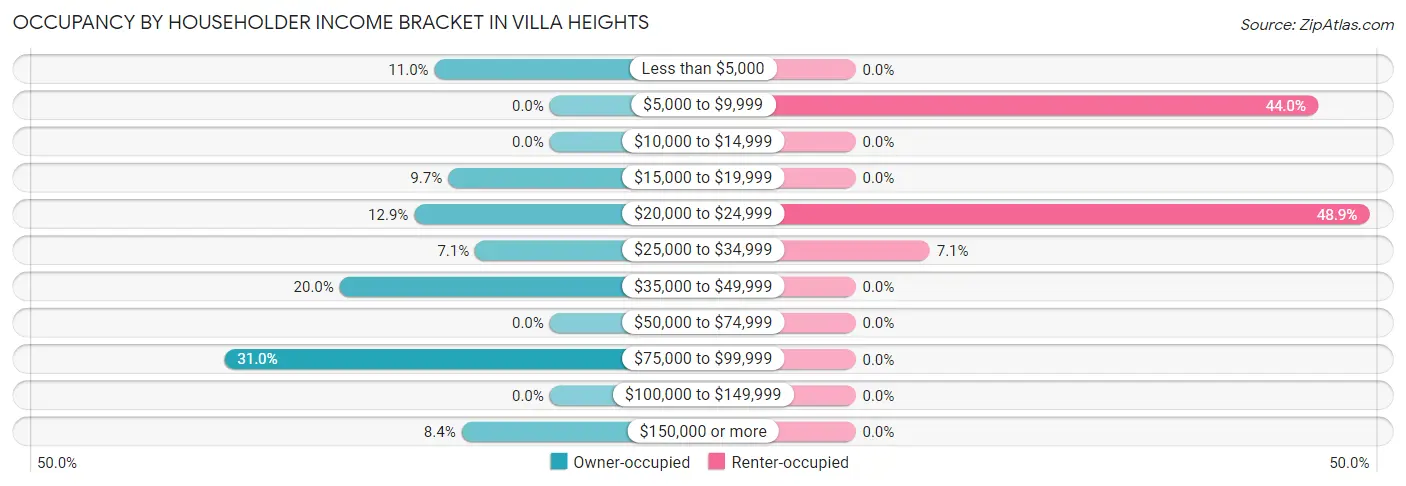
| Income Bracket | Owner-occupied | Renter-occupied |
| Less than $5,000 | 17 (11.0%) | 0 (0.0%) |
| $5,000 to $9,999 | 0 (0.0%) | 81 (44.0%) |
| $10,000 to $14,999 | 0 (0.0%) | 0 (0.0%) |
| $15,000 to $19,999 | 15 (9.7%) | 0 (0.0%) |
| $20,000 to $24,999 | 20 (12.9%) | 90 (48.9%) |
| $25,000 to $34,999 | 11 (7.1%) | 13 (7.1%) |
| $35,000 to $49,999 | 31 (20.0%) | 0 (0.0%) |
| $50,000 to $74,999 | 0 (0.0%) | 0 (0.0%) |
| $75,000 to $99,999 | 48 (31.0%) | 0 (0.0%) |
| $100,000 to $149,999 | 0 (0.0%) | 0 (0.0%) |
| $150,000 or more | 13 (8.4%) | 0 (0.0%) |
| Total | 155 (100.0%) | 184 (100.0%) |
Monthly Housing Cost Tiers in Villa Heights
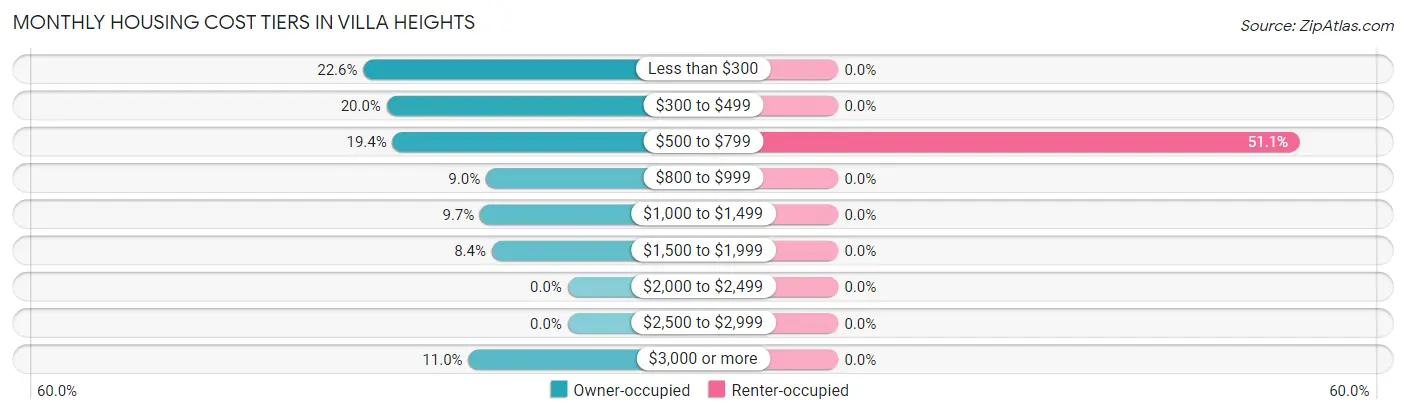
| Monthly Cost | Owner-occupied | Renter-occupied |
| Less than $300 | 35 (22.6%) | 0 (0.0%) |
| $300 to $499 | 31 (20.0%) | 0 (0.0%) |
| $500 to $799 | 30 (19.4%) | 94 (51.1%) |
| $800 to $999 | 14 (9.0%) | 0 (0.0%) |
| $1,000 to $1,499 | 15 (9.7%) | 0 (0.0%) |
| $1,500 to $1,999 | 13 (8.4%) | 0 (0.0%) |
| $2,000 to $2,499 | 0 (0.0%) | 0 (0.0%) |
| $2,500 to $2,999 | 0 (0.0%) | 0 (0.0%) |
| $3,000 or more | 17 (11.0%) | 0 (0.0%) |
| Total | 155 (100.0%) | 184 (100.0%) |
Physical Housing Characteristics in Villa Heights
Housing Structures in Villa Heights
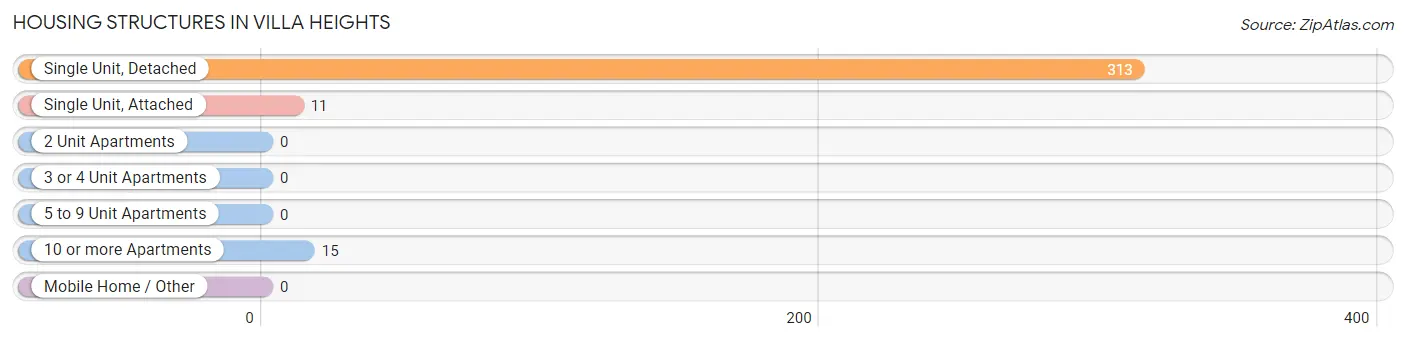
| Structure Type | # Housing Units | % Housing Units |
| Single Unit, Detached | 313 | 92.3% |
| Single Unit, Attached | 11 | 3.2% |
| 2 Unit Apartments | 0 | 0.0% |
| 3 or 4 Unit Apartments | 0 | 0.0% |
| 5 to 9 Unit Apartments | 0 | 0.0% |
| 10 or more Apartments | 15 | 4.4% |
| Mobile Home / Other | 0 | 0.0% |
| Total | 339 | 100.0% |
Housing Structures by Occupancy in Villa Heights
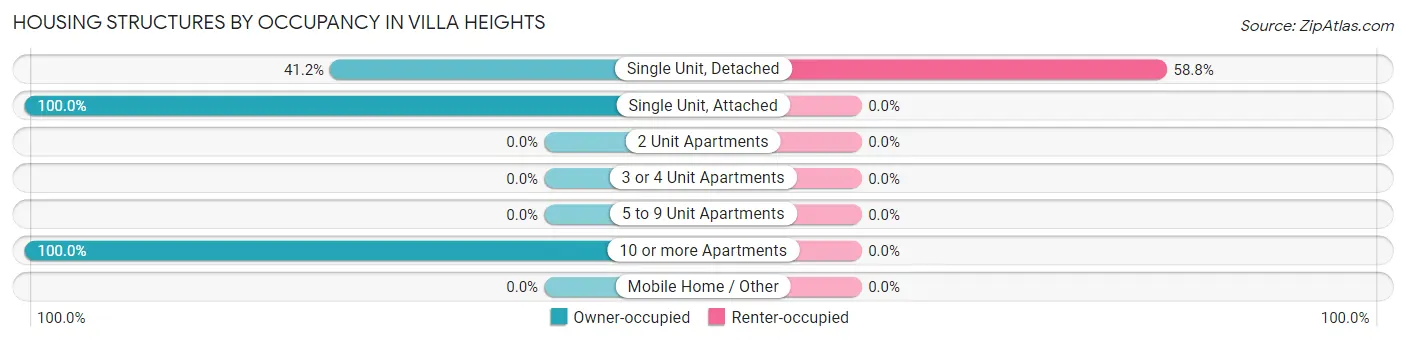
| Structure Type | Owner-occupied | Renter-occupied |
| Single Unit, Detached | 129 (41.2%) | 184 (58.8%) |
| Single Unit, Attached | 11 (100.0%) | 0 (0.0%) |
| 2 Unit Apartments | 0 (0.0%) | 0 (0.0%) |
| 3 or 4 Unit Apartments | 0 (0.0%) | 0 (0.0%) |
| 5 to 9 Unit Apartments | 0 (0.0%) | 0 (0.0%) |
| 10 or more Apartments | 15 (100.0%) | 0 (0.0%) |
| Mobile Home / Other | 0 (0.0%) | 0 (0.0%) |
| Total | 155 (45.7%) | 184 (54.3%) |
Housing Structures by Number of Rooms in Villa Heights
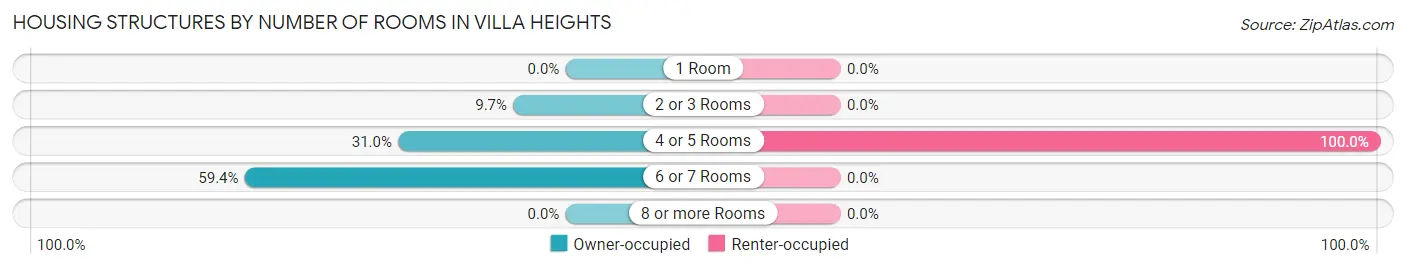
| Number of Rooms | Owner-occupied | Renter-occupied |
| 1 Room | 0 (0.0%) | 0 (0.0%) |
| 2 or 3 Rooms | 15 (9.7%) | 0 (0.0%) |
| 4 or 5 Rooms | 48 (31.0%) | 184 (100.0%) |
| 6 or 7 Rooms | 92 (59.4%) | 0 (0.0%) |
| 8 or more Rooms | 0 (0.0%) | 0 (0.0%) |
| Total | 155 (100.0%) | 184 (100.0%) |
Housing Structure by Heating Type in Villa Heights
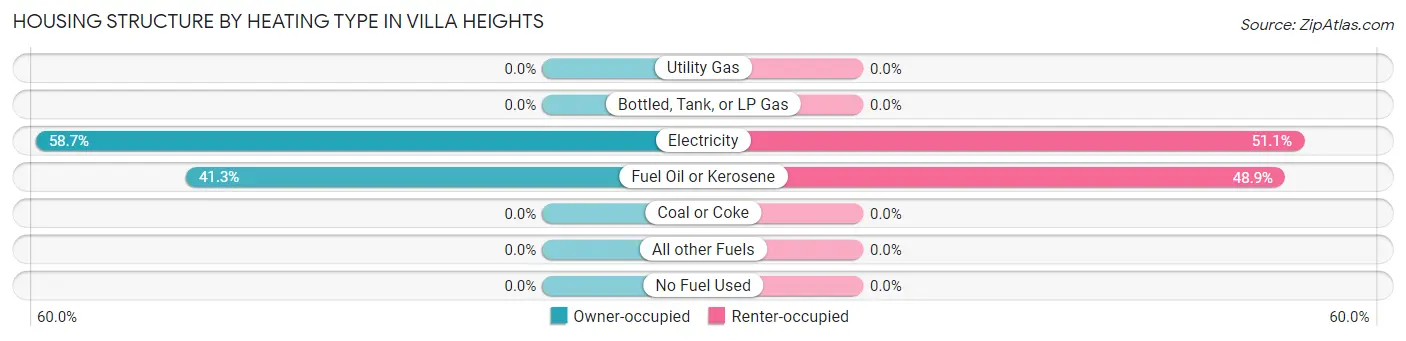
| Heating Type | Owner-occupied | Renter-occupied |
| Utility Gas | 0 (0.0%) | 0 (0.0%) |
| Bottled, Tank, or LP Gas | 0 (0.0%) | 0 (0.0%) |
| Electricity | 91 (58.7%) | 94 (51.1%) |
| Fuel Oil or Kerosene | 64 (41.3%) | 90 (48.9%) |
| Coal or Coke | 0 (0.0%) | 0 (0.0%) |
| All other Fuels | 0 (0.0%) | 0 (0.0%) |
| No Fuel Used | 0 (0.0%) | 0 (0.0%) |
| Total | 155 (100.0%) | 184 (100.0%) |
Household Vehicle Usage in Villa Heights
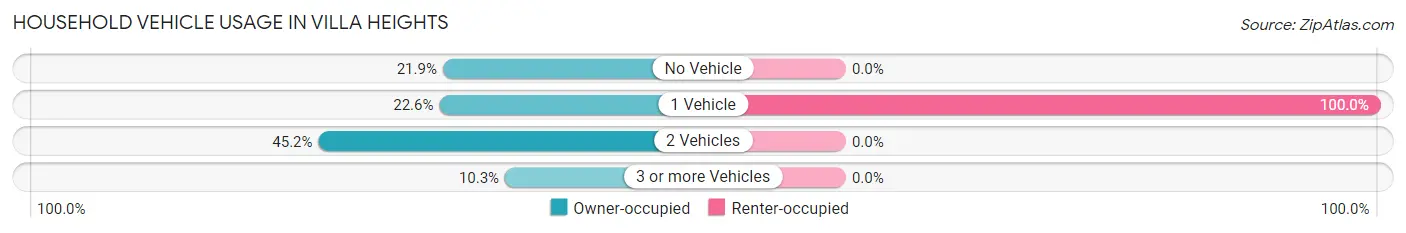
| Vehicles per Household | Owner-occupied | Renter-occupied |
| No Vehicle | 34 (21.9%) | 0 (0.0%) |
| 1 Vehicle | 35 (22.6%) | 184 (100.0%) |
| 2 Vehicles | 70 (45.2%) | 0 (0.0%) |
| 3 or more Vehicles | 16 (10.3%) | 0 (0.0%) |
| Total | 155 (100.0%) | 184 (100.0%) |
Real Estate & Mortgages in Villa Heights
Real Estate and Mortgage Overview in Villa Heights
| Characteristic | Without Mortgage | With Mortgage |
| Housing Units | 76 | 79 |
| Median Property Value | $86,900 | $109,200 |
| Median Household Income | - | - |
| Monthly Housing Costs | $359 | $17 |
| Real Estate Taxes | - | - |
Property Value by Mortgage Status in Villa Heights
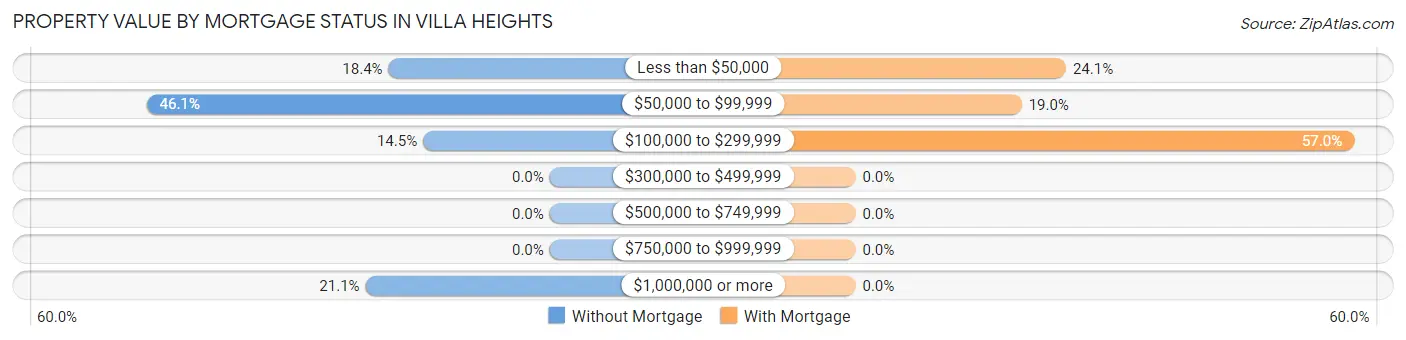
| Property Value | Without Mortgage | With Mortgage |
| Less than $50,000 | 14 (18.4%) | 19 (24.0%) |
| $50,000 to $99,999 | 35 (46.1%) | 15 (19.0%) |
| $100,000 to $299,999 | 11 (14.5%) | 45 (57.0%) |
| $300,000 to $499,999 | 0 (0.0%) | 0 (0.0%) |
| $500,000 to $749,999 | 0 (0.0%) | 0 (0.0%) |
| $750,000 to $999,999 | 0 (0.0%) | 0 (0.0%) |
| $1,000,000 or more | 16 (21.0%) | 0 (0.0%) |
| Total | 76 (100.0%) | 79 (100.0%) |
Household Income by Mortgage Status in Villa Heights
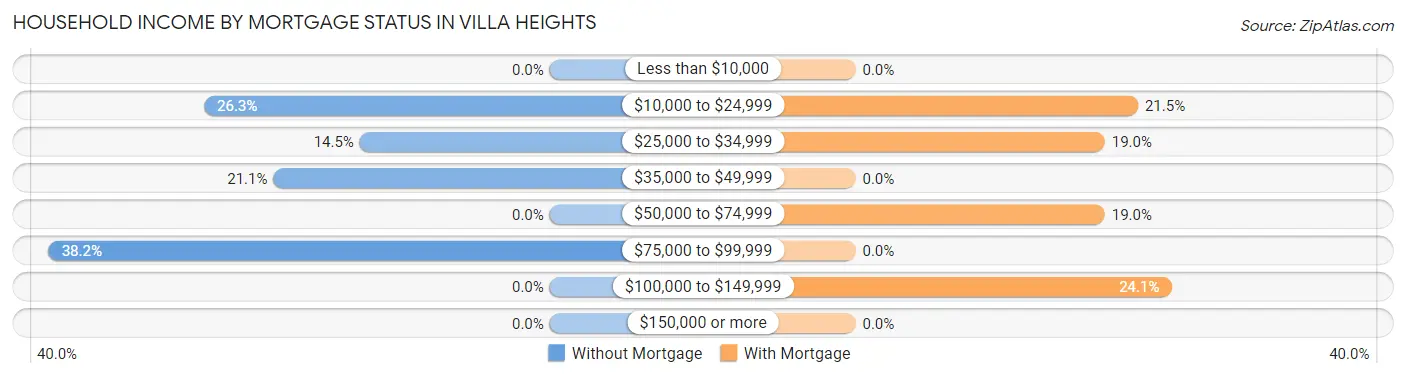
| Household Income | Without Mortgage | With Mortgage |
| Less than $10,000 | 0 (0.0%) | 0 (0.0%) |
| $10,000 to $24,999 | 20 (26.3%) | 17 (21.5%) |
| $25,000 to $34,999 | 11 (14.5%) | 15 (19.0%) |
| $35,000 to $49,999 | 16 (21.0%) | 0 (0.0%) |
| $50,000 to $74,999 | 0 (0.0%) | 15 (19.0%) |
| $75,000 to $99,999 | 29 (38.2%) | 0 (0.0%) |
| $100,000 to $149,999 | 0 (0.0%) | 19 (24.0%) |
| $150,000 or more | 0 (0.0%) | 0 (0.0%) |
| Total | 76 (100.0%) | 79 (100.0%) |
Property Value to Household Income Ratio in Villa Heights
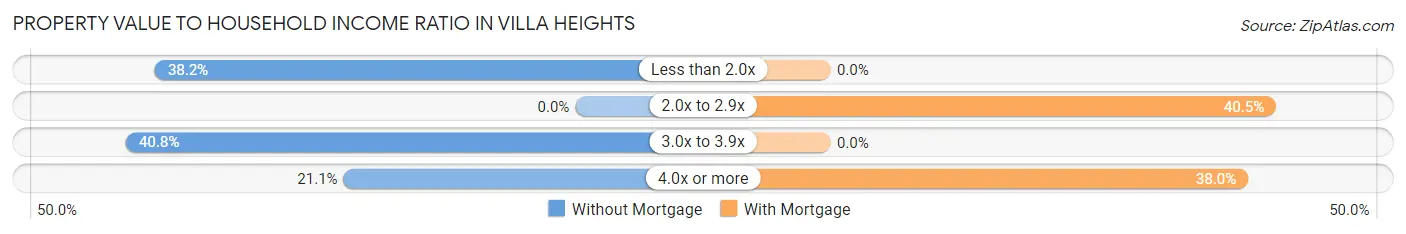
| Value-to-Income Ratio | Without Mortgage | With Mortgage |
| Less than 2.0x | 29 (38.2%) | 0 (0.0%) |
| 2.0x to 2.9x | 0 (0.0%) | 32 (40.5%) |
| 3.0x to 3.9x | 31 (40.8%) | 0 (0.0%) |
| 4.0x or more | 16 (21.0%) | 30 (38.0%) |
| Total | 76 (100.0%) | 79 (100.0%) |
Real Estate Taxes by Mortgage Status in Villa Heights
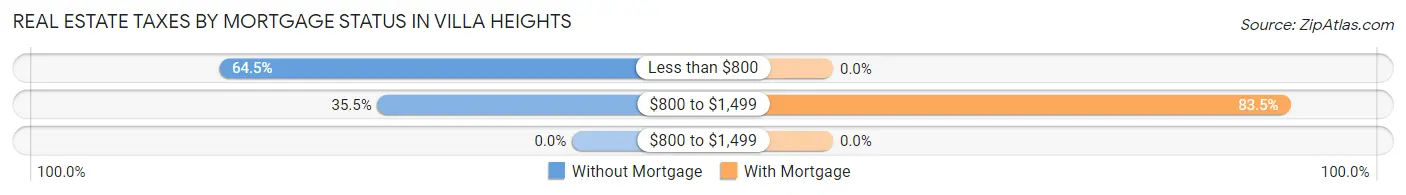
| Property Taxes | Without Mortgage | With Mortgage |
| Less than $800 | 49 (64.5%) | 0 (0.0%) |
| $800 to $1,499 | 27 (35.5%) | 66 (83.5%) |
| $800 to $1,499 | 0 (0.0%) | 0 (0.0%) |
| Total | 76 (100.0%) | 79 (100.0%) |
Health & Disability in Villa Heights
Health Insurance Coverage by Age in Villa Heights
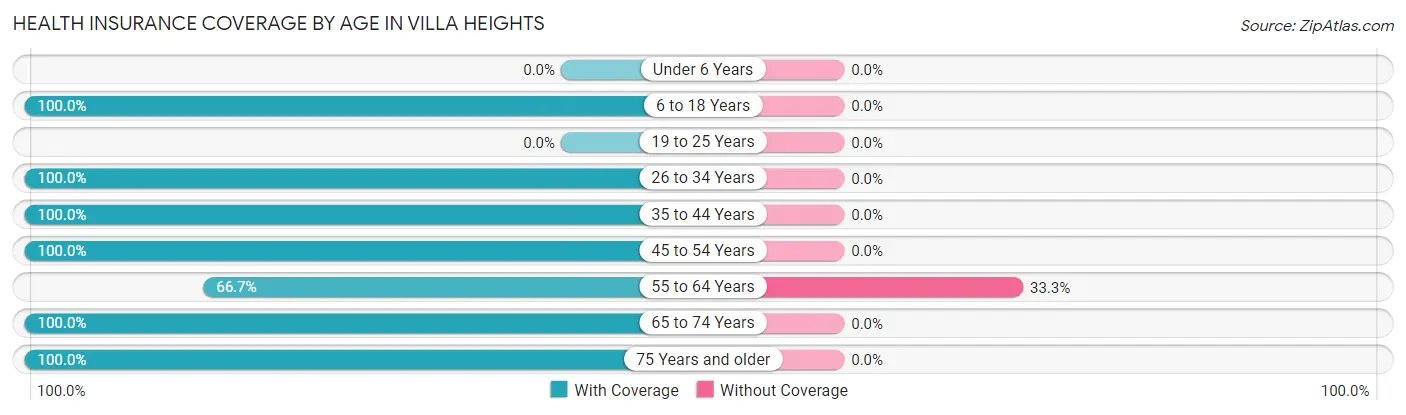
| Age Bracket | With Coverage | Without Coverage |
| Under 6 Years | 0 (0.0%) | 0 (0.0%) |
| 6 to 18 Years | 28 (100.0%) | 0 (0.0%) |
| 19 to 25 Years | 0 (0.0%) | 0 (0.0%) |
| 26 to 34 Years | 108 (100.0%) | 0 (0.0%) |
| 35 to 44 Years | 13 (100.0%) | 0 (0.0%) |
| 45 to 54 Years | 57 (100.0%) | 0 (0.0%) |
| 55 to 64 Years | 28 (66.7%) | 14 (33.3%) |
| 65 to 74 Years | 175 (100.0%) | 0 (0.0%) |
| 75 Years and older | 117 (100.0%) | 0 (0.0%) |
| Total | 526 (97.4%) | 14 (2.6%) |
Health Insurance Coverage by Citizenship Status in Villa Heights
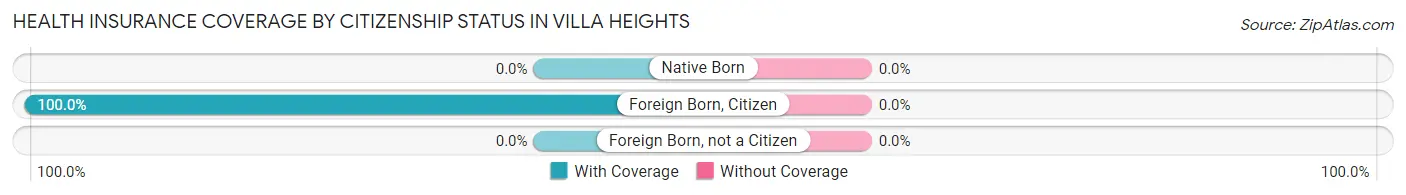
| Citizenship Status | With Coverage | Without Coverage |
| Native Born | 0 (0.0%) | 0 (0.0%) |
| Foreign Born, Citizen | 28 (100.0%) | 0 (0.0%) |
| Foreign Born, not a Citizen | 0 (0.0%) | 0 (0.0%) |
Health Insurance Coverage by Household Income in Villa Heights
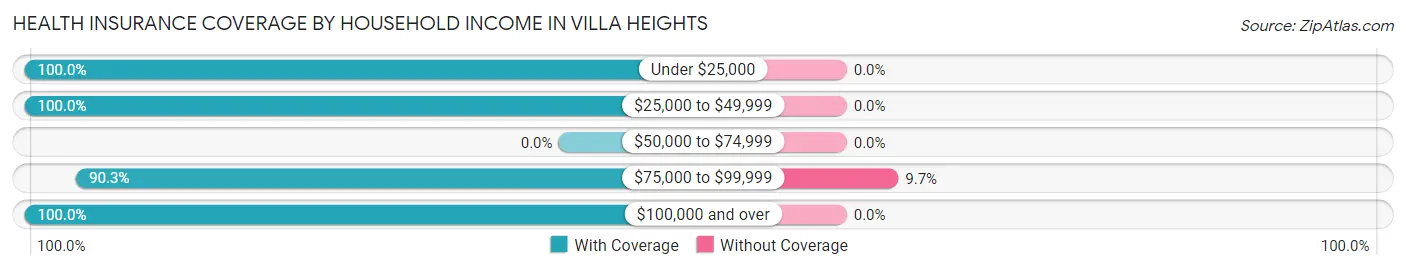
| Household Income | With Coverage | Without Coverage |
| Under $25,000 | 223 (100.0%) | 0 (0.0%) |
| $25,000 to $49,999 | 149 (100.0%) | 0 (0.0%) |
| $50,000 to $74,999 | 0 (0.0%) | 0 (0.0%) |
| $75,000 to $99,999 | 131 (90.3%) | 14 (9.7%) |
| $100,000 and over | 23 (100.0%) | 0 (0.0%) |
Public vs Private Health Insurance Coverage by Age in Villa Heights
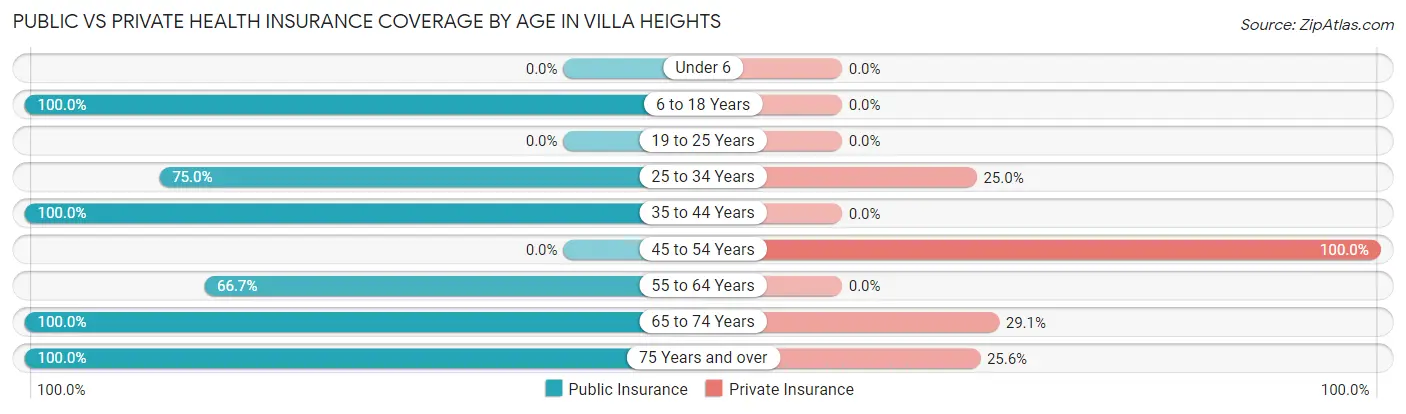
| Age Bracket | Public Insurance | Private Insurance |
| Under 6 | 0 (0.0%) | 0 (0.0%) |
| 6 to 18 Years | 28 (100.0%) | 0 (0.0%) |
| 19 to 25 Years | 0 (0.0%) | 0 (0.0%) |
| 25 to 34 Years | 81 (75.0%) | 27 (25.0%) |
| 35 to 44 Years | 13 (100.0%) | 0 (0.0%) |
| 45 to 54 Years | 0 (0.0%) | 57 (100.0%) |
| 55 to 64 Years | 28 (66.7%) | 0 (0.0%) |
| 65 to 74 Years | 175 (100.0%) | 51 (29.1%) |
| 75 Years and over | 117 (100.0%) | 30 (25.6%) |
| Total | 442 (81.9%) | 165 (30.6%) |
Disability Status by Sex by Age in Villa Heights
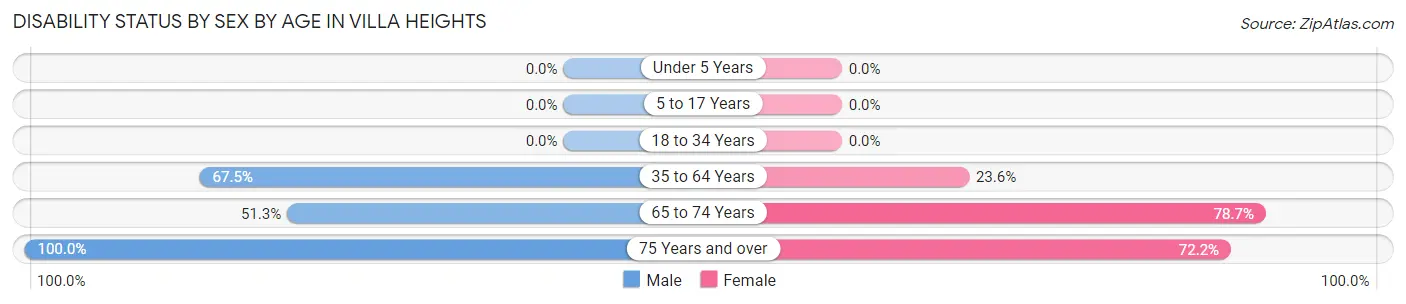
| Age Bracket | Male | Female |
| Under 5 Years | 0 (0.0%) | 0 (0.0%) |
| 5 to 17 Years | 0 (0.0%) | 0 (0.0%) |
| 18 to 34 Years | 0 (0.0%) | 0 (0.0%) |
| 35 to 64 Years | 27 (67.5%) | 17 (23.6%) |
| 65 to 74 Years | 20 (51.3%) | 107 (78.7%) |
| 75 Years and over | 63 (100.0%) | 39 (72.2%) |
Disability Class by Sex by Age in Villa Heights
Disability Class: Hearing Difficulty
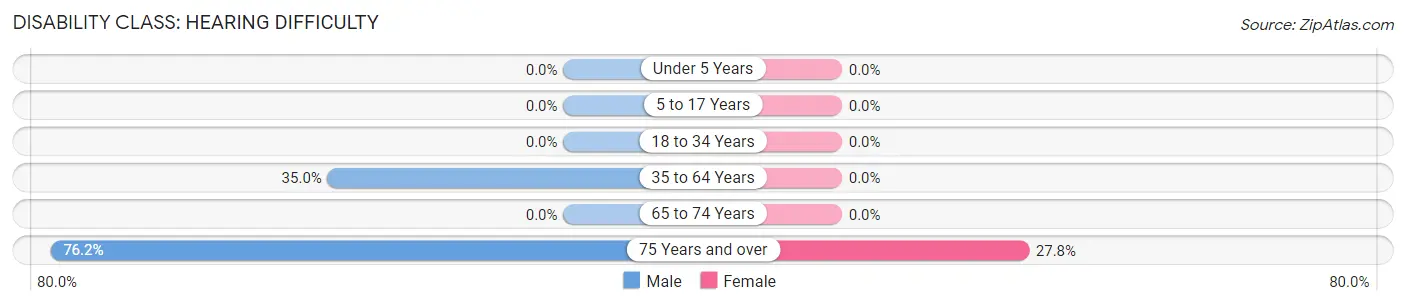
| Age Bracket | Male | Female |
| Under 5 Years | 0 (0.0%) | 0 (0.0%) |
| 5 to 17 Years | 0 (0.0%) | 0 (0.0%) |
| 18 to 34 Years | 0 (0.0%) | 0 (0.0%) |
| 35 to 64 Years | 14 (35.0%) | 0 (0.0%) |
| 65 to 74 Years | 0 (0.0%) | 0 (0.0%) |
| 75 Years and over | 48 (76.2%) | 15 (27.8%) |
Disability Class: Vision Difficulty
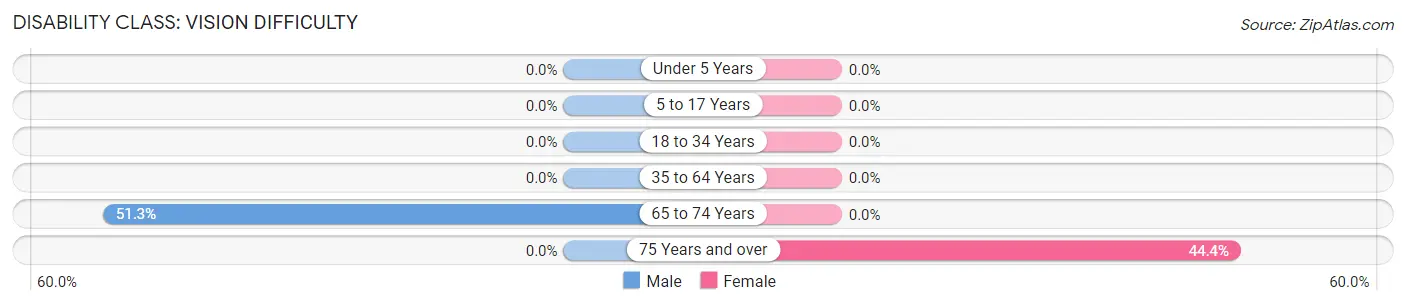
| Age Bracket | Male | Female |
| Under 5 Years | 0 (0.0%) | 0 (0.0%) |
| 5 to 17 Years | 0 (0.0%) | 0 (0.0%) |
| 18 to 34 Years | 0 (0.0%) | 0 (0.0%) |
| 35 to 64 Years | 0 (0.0%) | 0 (0.0%) |
| 65 to 74 Years | 20 (51.3%) | 0 (0.0%) |
| 75 Years and over | 0 (0.0%) | 24 (44.4%) |
Disability Class: Cognitive Difficulty
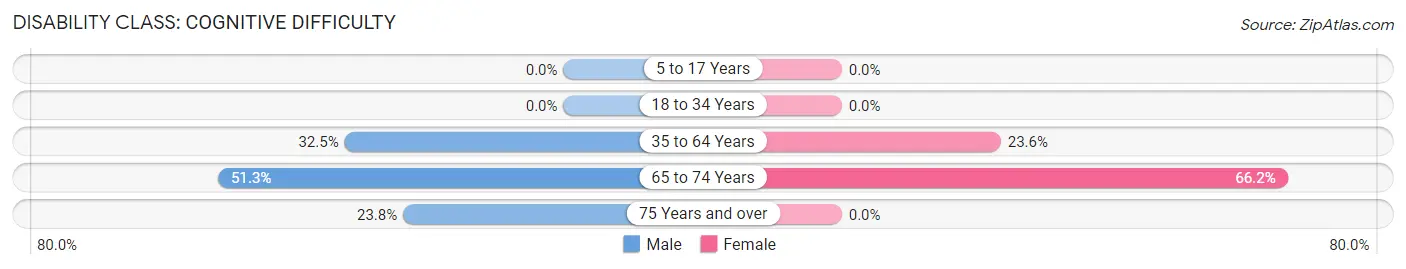
| Age Bracket | Male | Female |
| 5 to 17 Years | 0 (0.0%) | 0 (0.0%) |
| 18 to 34 Years | 0 (0.0%) | 0 (0.0%) |
| 35 to 64 Years | 13 (32.5%) | 17 (23.6%) |
| 65 to 74 Years | 20 (51.3%) | 90 (66.2%) |
| 75 Years and over | 15 (23.8%) | 0 (0.0%) |
Disability Class: Ambulatory Difficulty
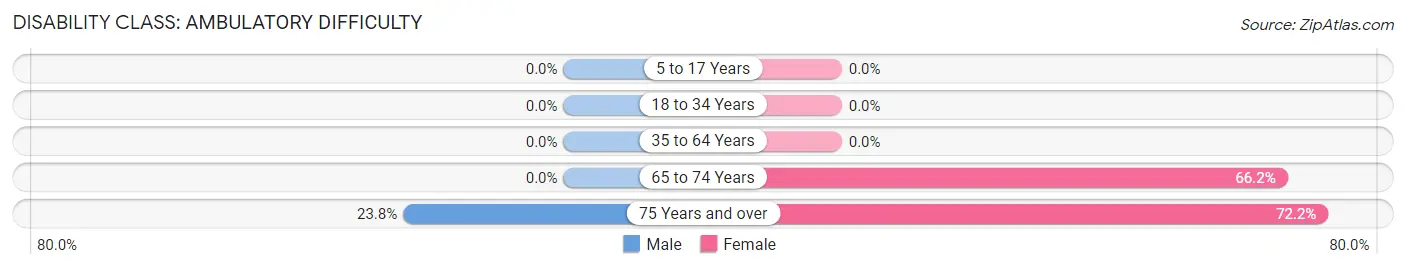
| Age Bracket | Male | Female |
| 5 to 17 Years | 0 (0.0%) | 0 (0.0%) |
| 18 to 34 Years | 0 (0.0%) | 0 (0.0%) |
| 35 to 64 Years | 0 (0.0%) | 0 (0.0%) |
| 65 to 74 Years | 0 (0.0%) | 90 (66.2%) |
| 75 Years and over | 15 (23.8%) | 39 (72.2%) |
Disability Class: Self-Care Difficulty
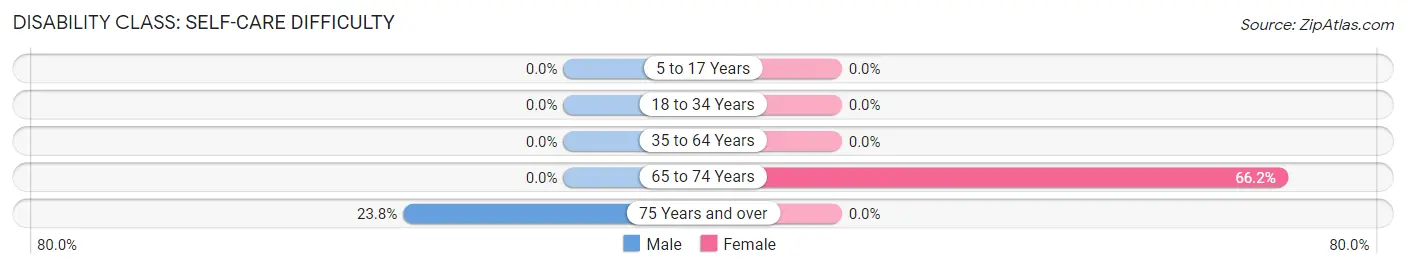
| Age Bracket | Male | Female |
| 5 to 17 Years | 0 (0.0%) | 0 (0.0%) |
| 18 to 34 Years | 0 (0.0%) | 0 (0.0%) |
| 35 to 64 Years | 0 (0.0%) | 0 (0.0%) |
| 65 to 74 Years | 0 (0.0%) | 90 (66.2%) |
| 75 Years and over | 15 (23.8%) | 0 (0.0%) |
Technology Access in Villa Heights
Computing Device Access in Villa Heights
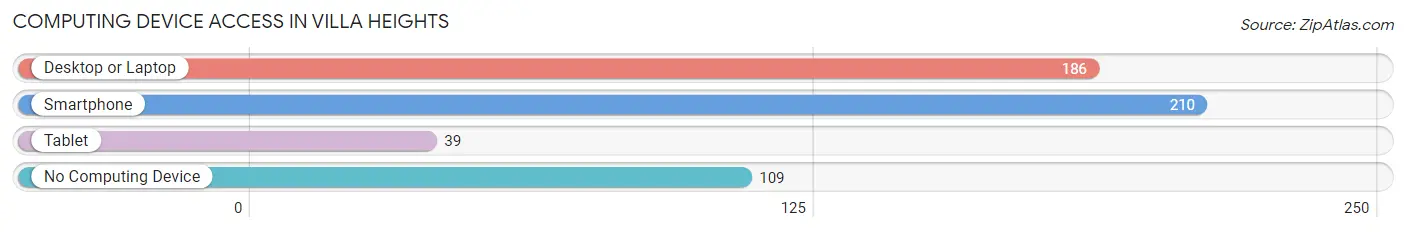
| Device Type | # Households | % Households |
| Desktop or Laptop | 186 | 54.9% |
| Smartphone | 210 | 62.0% |
| Tablet | 39 | 11.5% |
| No Computing Device | 109 | 32.2% |
| Total | 339 | 100.0% |
Internet Access in Villa Heights
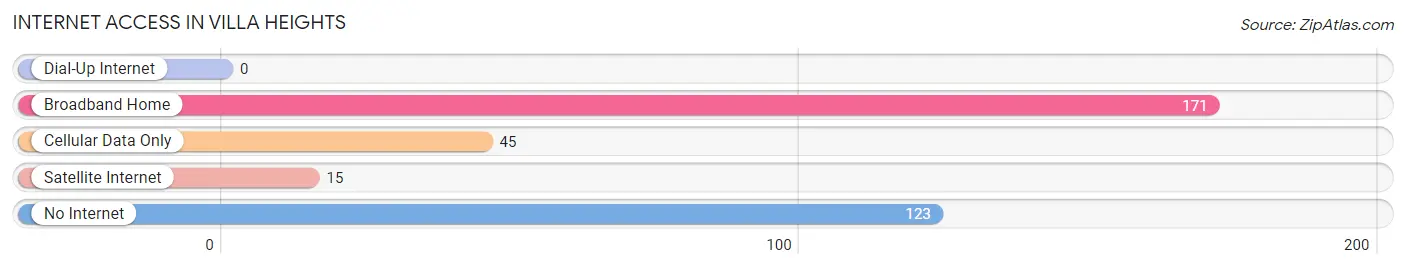
| Internet Type | # Households | % Households |
| Dial-Up Internet | 0 | 0.0% |
| Broadband Home | 171 | 50.4% |
| Cellular Data Only | 45 | 13.3% |
| Satellite Internet | 15 | 4.4% |
| No Internet | 123 | 36.3% |
| Total | 339 | 100.0% |
Villa Heights Summary
Villa Heights is a neighborhood located in the city of Charlotte, North Carolina. It is located in the northwest corner of the city, just south of the University area. The neighborhood is bounded by North Tryon Street to the east, Beatties Ford Road to the south, and I-77 to the west. It is a predominantly African-American neighborhood, with a population of approximately 4,000 people.
History
Villa Heights was originally part of the larger neighborhood of Brooklyn, which was annexed by the city of Charlotte in the early 1900s. The neighborhood was named after the Villa Heights Hotel, which was built in the area in the late 1800s. The hotel was a popular destination for travelers and was known for its luxurious accommodations.
In the early 1900s, the neighborhood began to experience a period of growth and development. The area was home to a variety of businesses, including a grocery store, a barber shop, and a movie theater. The neighborhood also had a number of churches, including the Villa Heights Baptist Church, which was founded in the early 1900s.
In the 1950s, the neighborhood began to experience a period of decline. Many of the businesses in the area closed, and the population began to decline. In the late 1960s, the city of Charlotte began to redevelop the area, and the neighborhood was renamed Villa Heights.
Geography
Villa Heights is located in the northwest corner of the city of Charlotte, just south of the University area. The neighborhood is bounded by North Tryon Street to the east, Beatties Ford Road to the south, and I-77 to the west. The neighborhood is located in the Piedmont region of North Carolina, and is characterized by rolling hills and lush vegetation.
Economy
Villa Heights is a predominantly residential neighborhood, and the majority of the population is employed in the service industry. The neighborhood is home to a variety of small businesses, including restaurants, convenience stores, and beauty salons. The neighborhood is also home to a number of churches, including the Villa Heights Baptist Church.
Demographics
As of the 2010 census, the population of Villa Heights was 4,000 people. The population is predominantly African-American, with a small percentage of Hispanic and Asian residents. The median household income is $30,000, and the median home value is $90,000. The neighborhood has a high rate of poverty, with approximately 40% of the population living below the poverty line.
Common Questions
What is Per Capita Income in Villa Heights?
Per Capita income in Villa Heights is $25,296.
What is the Median Household income in Villa Heights?
Median Household Income in Villa Heights is $23,784.
What is Inequality or Gini Index in Villa Heights?
Inequality or Gini Index in Villa Heights is 0.50.
What is the Total Population of Villa Heights?
Total Population of Villa Heights is 540.
What is the Total Male Population of Villa Heights?
Total Male Population of Villa Heights is 170.
What is the Total Female Population of Villa Heights?
Total Female Population of Villa Heights is 370.
What is the Ratio of Males per 100 Females in Villa Heights?
There are 45.95 Males per 100 Females in Villa Heights.
What is the Ratio of Females per 100 Males in Villa Heights?
There are 217.65 Females per 100 Males in Villa Heights.
What is the Median Population Age in Villa Heights?
Median Population Age in Villa Heights is 68.2 Years.
What is the Average Family Size in Villa Heights
Average Family Size in Villa Heights is 2.6 People.
What is the Average Household Size in Villa Heights
Average Household Size in Villa Heights is 1.6 People.
How Large is the Labor Force in Villa Heights?
There are 130 People in the Labor Forcein in Villa Heights.
What is the Percentage of People in the Labor Force in Villa Heights?
25.4% of People are in the Labor Force in Villa Heights.