Lupton, MI Map & Demographics
Lupton Map
Lupton Overview
$21,039
PER CAPITA INCOME
$60,313
AVG FAMILY INCOME
$58,750
AVG HOUSEHOLD INCOME
0.34
INEQUALITY / GINI INDEX
277
TOTAL POPULATION
133
MALE POPULATION
144
FEMALE POPULATION
92.36
MALES / 100 FEMALES
108.27
FEMALES / 100 MALES
52.2
MEDIAN AGE
2.8
AVG FAMILY SIZE
2.3
AVG HOUSEHOLD SIZE
95
LABOR FORCE [ PEOPLE ]
38.9%
PERCENT IN LABOR FORCE
10.5%
UNEMPLOYMENT RATE
Lupton Zip Codes
Lupton Area Codes
Income in Lupton
Income Overview in Lupton
Per Capita Income in Lupton is $21,039, while median incomes of families and households are $60,313 and $58,750 respectively.
| Characteristic | Number | Measure |
| Per Capita Income | 277 | $21,039 |
| Median Family Income | 70 | $60,313 |
| Mean Family Income | 70 | $56,367 |
| Median Household Income | 120 | $58,750 |
| Mean Household Income | 120 | $49,249 |
| Income Deficit | 70 | $0 |
| Wage / Income Gap (%) | 277 | 0.00% |
| Wage / Income Gap ($) | 277 | 100.00¢ per $1 |
| Gini / Inequality Index | 277 | 0.34 |
Earnings by Sex in Lupton
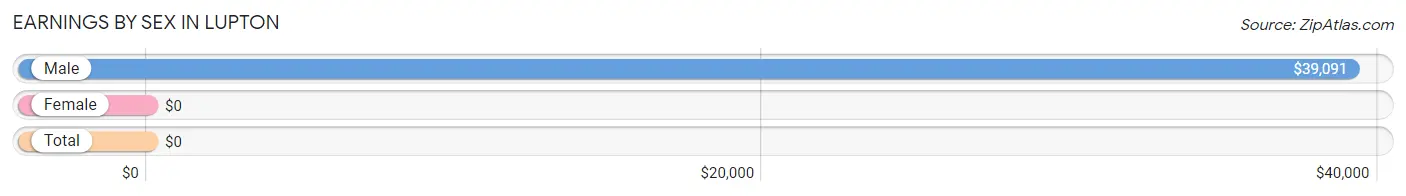
| Sex | Number | Average Earnings |
| Male | 52 (49.5%) | $39,091 |
| Female | 53 (50.5%) | $0 |
| Total | 105 (100.0%) | $0 |
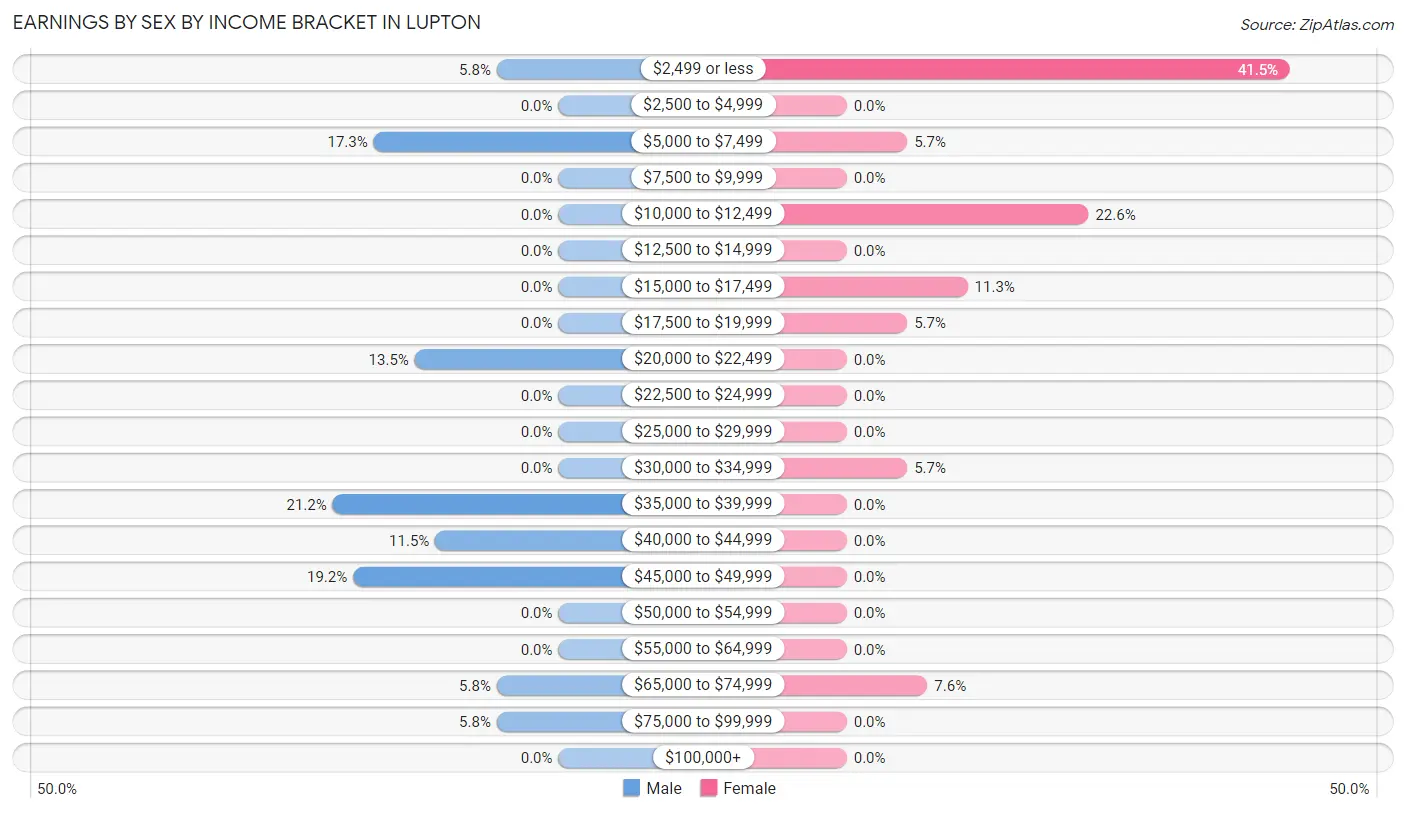
Earnings by Sex by Income Bracket in Lupton
The most common earnings brackets in Lupton are $35,000 to $39,999 for men (11 | 21.1%) and $2,499 or less for women (22 | 41.5%).
| Income | Male | Female |
| $2,499 or less | 3 (5.8%) | 22 (41.5%) |
| $2,500 to $4,999 | 0 (0.0%) | 0 (0.0%) |
| $5,000 to $7,499 | 9 (17.3%) | 3 (5.7%) |
| $7,500 to $9,999 | 0 (0.0%) | 0 (0.0%) |
| $10,000 to $12,499 | 0 (0.0%) | 12 (22.6%) |
| $12,500 to $14,999 | 0 (0.0%) | 0 (0.0%) |
| $15,000 to $17,499 | 0 (0.0%) | 6 (11.3%) |
| $17,500 to $19,999 | 0 (0.0%) | 3 (5.7%) |
| $20,000 to $22,499 | 7 (13.5%) | 0 (0.0%) |
| $22,500 to $24,999 | 0 (0.0%) | 0 (0.0%) |
| $25,000 to $29,999 | 0 (0.0%) | 0 (0.0%) |
| $30,000 to $34,999 | 0 (0.0%) | 3 (5.7%) |
| $35,000 to $39,999 | 11 (21.1%) | 0 (0.0%) |
| $40,000 to $44,999 | 6 (11.5%) | 0 (0.0%) |
| $45,000 to $49,999 | 10 (19.2%) | 0 (0.0%) |
| $50,000 to $54,999 | 0 (0.0%) | 0 (0.0%) |
| $55,000 to $64,999 | 0 (0.0%) | 0 (0.0%) |
| $65,000 to $74,999 | 3 (5.8%) | 4 (7.5%) |
| $75,000 to $99,999 | 3 (5.8%) | 0 (0.0%) |
| $100,000+ | 0 (0.0%) | 0 (0.0%) |
| Total | 52 (100.0%) | 53 (100.0%) |
Earnings by Sex by Educational Attainment in Lupton
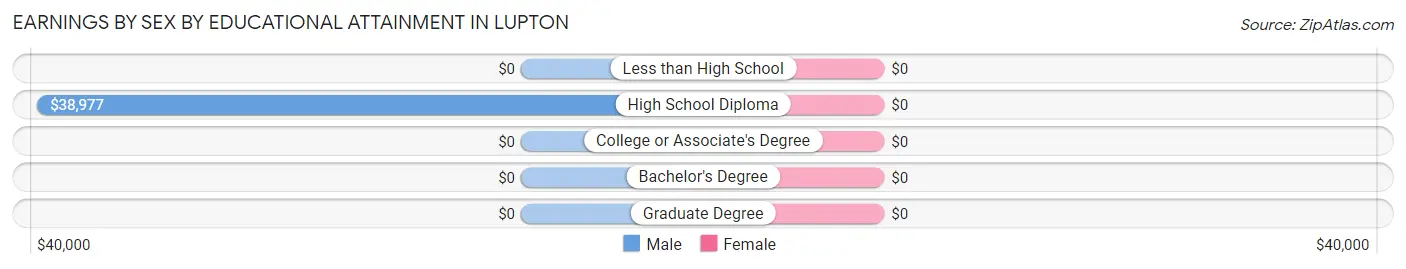
| Educational Attainment | Male Income | Female Income |
| Less than High School | - | - |
| High School Diploma | $38,977 | $0 |
| College or Associate's Degree | - | - |
| Bachelor's Degree | - | - |
| Graduate Degree | - | - |
| Total | $42,708 | $15,208 |
Family Income in Lupton
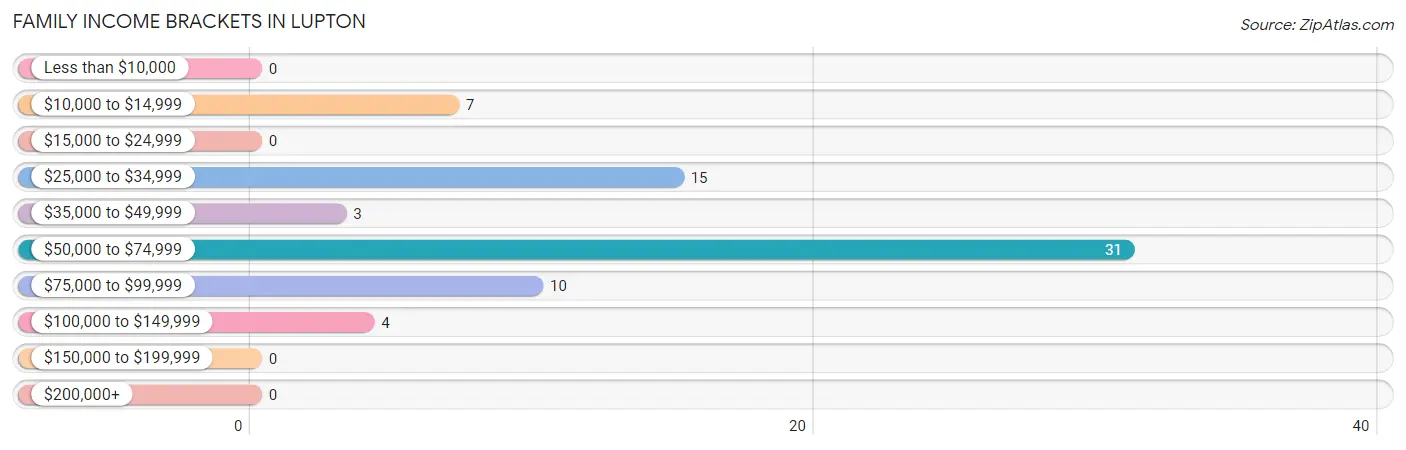
Family Income Brackets in Lupton
According to the Lupton family income data, there are 31 families falling into the $50,000 to $74,999 income range, which is the most common income bracket and makes up 44.3% of all families.
| Income Bracket | # Families | % Families |
| Less than $10,000 | 0 | 0.0% |
| $10,000 to $14,999 | 7 | 10.0% |
| $15,000 to $24,999 | 0 | 0.0% |
| $25,000 to $34,999 | 15 | 21.4% |
| $35,000 to $49,999 | 3 | 4.3% |
| $50,000 to $74,999 | 31 | 44.3% |
| $75,000 to $99,999 | 10 | 14.3% |
| $100,000 to $149,999 | 4 | 5.7% |
| $150,000 to $199,999 | 0 | 0.0% |
| $200,000+ | 0 | 0.0% |
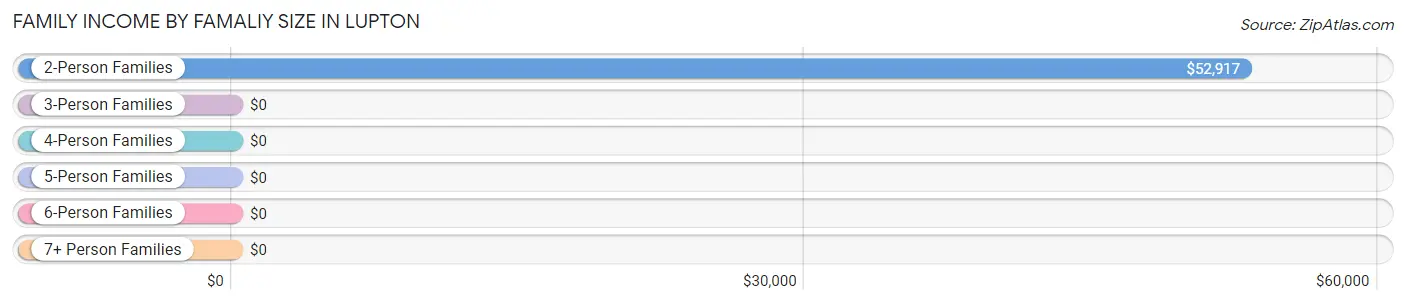
Family Income by Famaliy Size in Lupton
2-person families (51 | 72.9%) account for the highest median family income in Lupton with $52,917 per family, while 2-person families (51 | 72.9%) have the highest median income of $26,458 per family member.
| Income Bracket | # Families | Median Income |
| 2-Person Families | 51 (72.9%) | $52,917 |
| 3-Person Families | 0 (0.0%) | $0 |
| 4-Person Families | 11 (15.7%) | $0 |
| 5-Person Families | 0 (0.0%) | $0 |
| 6-Person Families | 0 (0.0%) | $0 |
| 7+ Person Families | 8 (11.4%) | $0 |
| Total | 70 (100.0%) | $60,313 |
Family Income by Number of Earners in Lupton
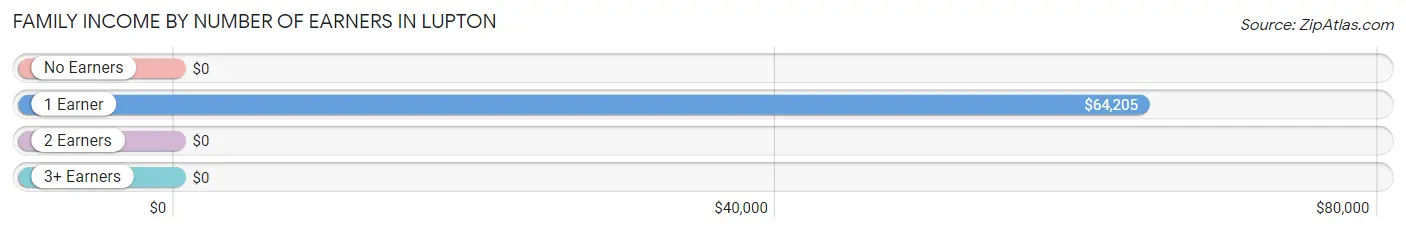
| Number of Earners | # Families | Median Income |
| No Earners | 26 (37.1%) | $0 |
| 1 Earner | 21 (30.0%) | $64,205 |
| 2 Earners | 15 (21.4%) | $0 |
| 3+ Earners | 8 (11.4%) | $0 |
| Total | 70 (100.0%) | $60,313 |
Household Income in Lupton
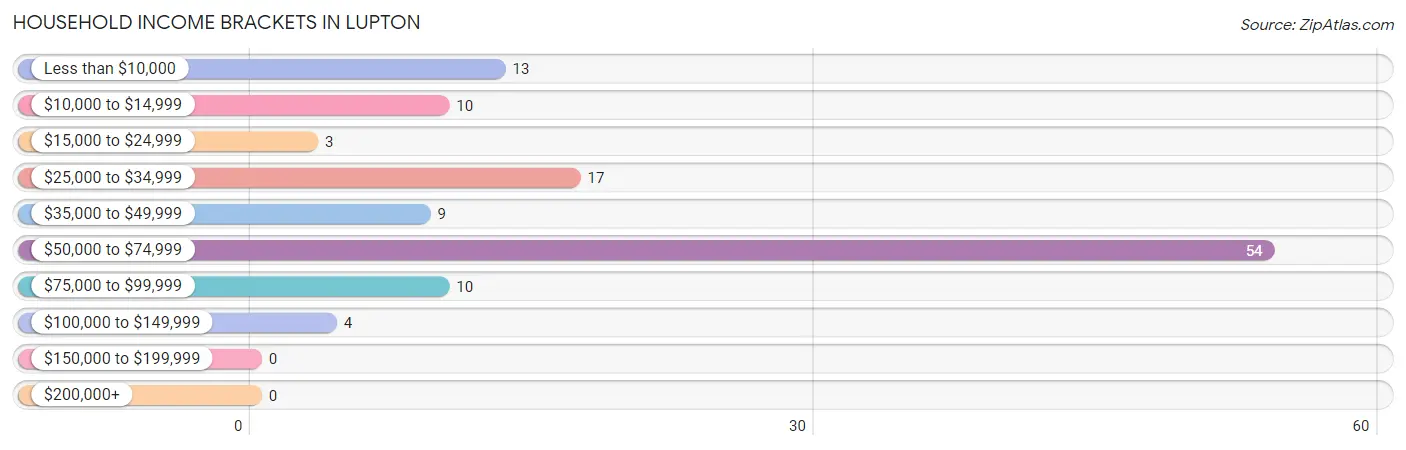
Household Income Brackets in Lupton
With 54 households falling in the category, the $50,000 to $74,999 income range is the most frequent in Lupton, accounting for 45.0% of all households.
| Income Bracket | # Households | % Households |
| Less than $10,000 | 13 | 10.8% |
| $10,000 to $14,999 | 10 | 8.3% |
| $15,000 to $24,999 | 3 | 2.5% |
| $25,000 to $34,999 | 17 | 14.2% |
| $35,000 to $49,999 | 9 | 7.5% |
| $50,000 to $74,999 | 54 | 45.0% |
| $75,000 to $99,999 | 10 | 8.3% |
| $100,000 to $149,999 | 4 | 3.3% |
| $150,000 to $199,999 | 0 | 0.0% |
| $200,000+ | 0 | 0.0% |
Household Income by Householder Age in Lupton
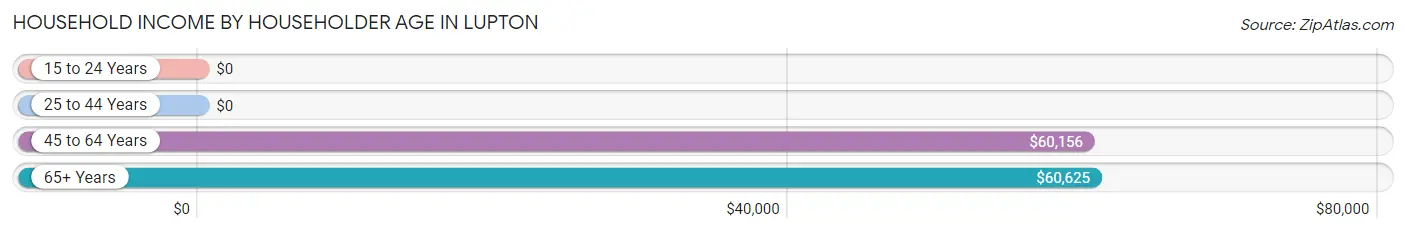
The median household income in Lupton is $58,750, with the highest median household income of $60,625 found in the 65+ years age bracket for the primary householder. A total of 34 households (28.3%) fall into this category.
| Income Bracket | # Households | Median Income |
| 15 to 24 Years | 0 (0.0%) | $0 |
| 25 to 44 Years | 21 (17.5%) | $0 |
| 45 to 64 Years | 65 (54.2%) | $60,156 |
| 65+ Years | 34 (28.3%) | $60,625 |
| Total | 120 (100.0%) | $58,750 |
Poverty in Lupton
Income Below Poverty by Sex and Age in Lupton
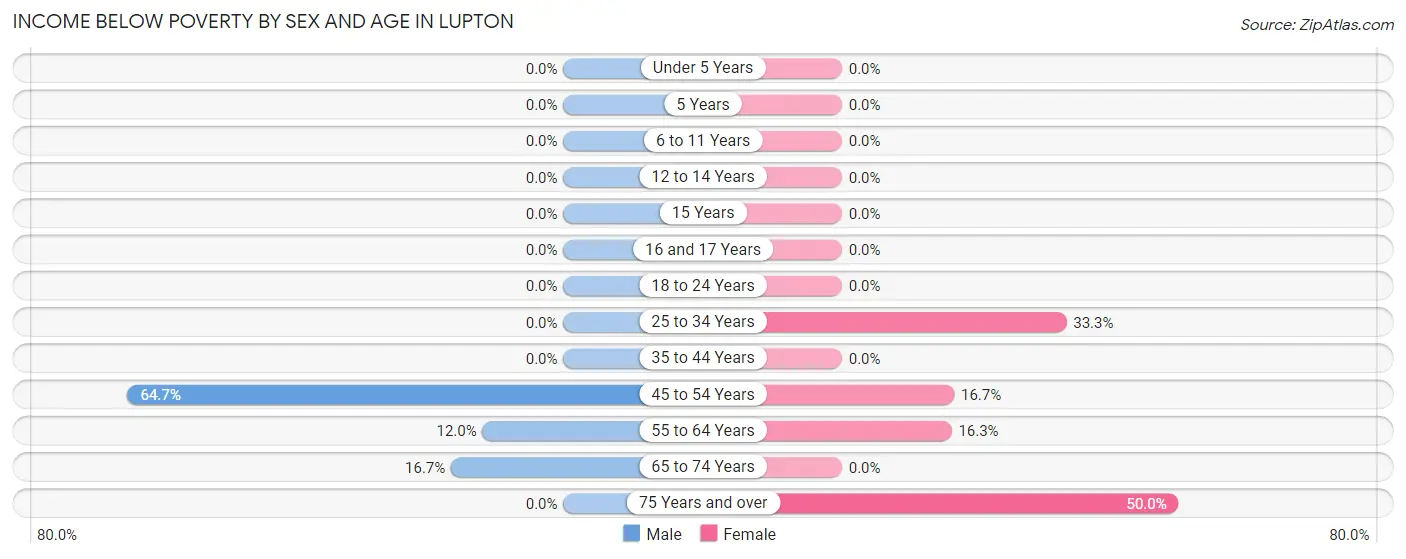
With 13.8% poverty level for males and 11.1% for females among the residents of Lupton, 45 to 54 year old males and 75 year old and over females are the most vulnerable to poverty, with 11 males (64.7%) and 4 females (50.0%) in their respective age groups living below the poverty level.
| Age Bracket | Male | Female |
| Under 5 Years | 0 (0.0%) | 0 (0.0%) |
| 5 Years | 0 (0.0%) | 0 (0.0%) |
| 6 to 11 Years | 0 (0.0%) | 0 (0.0%) |
| 12 to 14 Years | 0 (0.0%) | 0 (0.0%) |
| 15 Years | 0 (0.0%) | 0 (0.0%) |
| 16 and 17 Years | 0 (0.0%) | 0 (0.0%) |
| 18 to 24 Years | 0 (0.0%) | 0 (0.0%) |
| 25 to 34 Years | 0 (0.0%) | 3 (33.3%) |
| 35 to 44 Years | 0 (0.0%) | 0 (0.0%) |
| 45 to 54 Years | 11 (64.7%) | 2 (16.7%) |
| 55 to 64 Years | 3 (12.0%) | 7 (16.3%) |
| 65 to 74 Years | 3 (16.7%) | 0 (0.0%) |
| 75 Years and over | 0 (0.0%) | 4 (50.0%) |
| Total | 17 (13.8%) | 16 (11.1%) |
Income Above Poverty by Sex and Age in Lupton
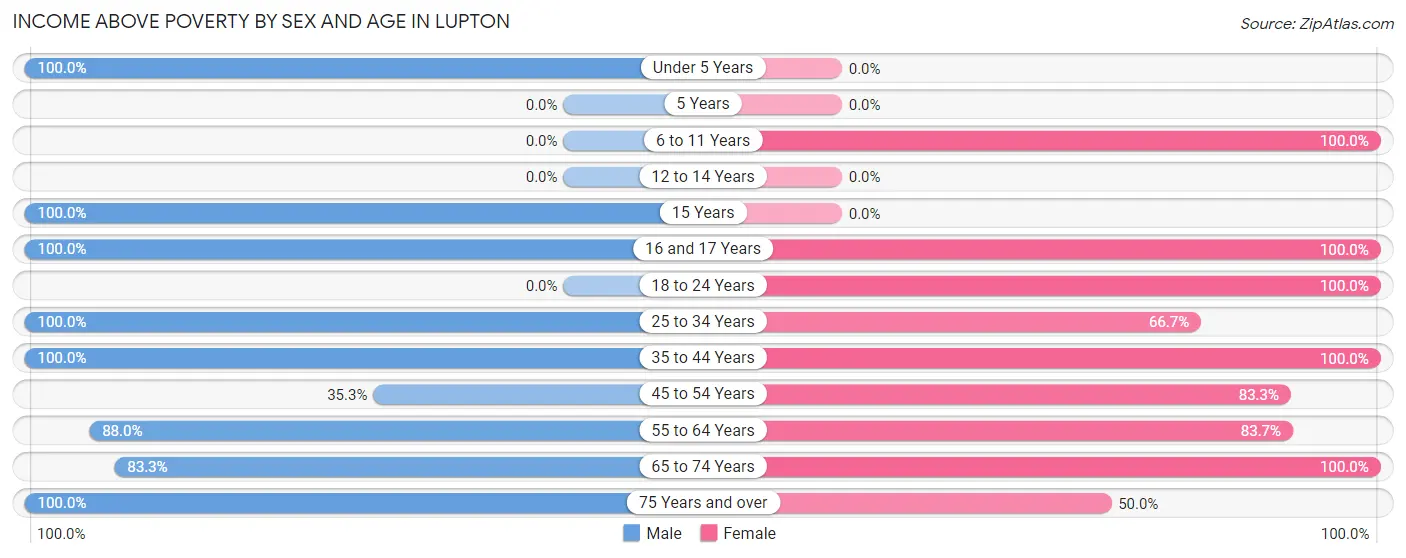
According to the poverty statistics in Lupton, males aged under 5 years and females aged 6 to 11 years are the age groups that are most secure financially, with 100.0% of males and 100.0% of females in these age groups living above the poverty line.
| Age Bracket | Male | Female |
| Under 5 Years | 7 (100.0%) | 0 (0.0%) |
| 5 Years | 0 (0.0%) | 0 (0.0%) |
| 6 to 11 Years | 0 (0.0%) | 8 (100.0%) |
| 12 to 14 Years | 0 (0.0%) | 0 (0.0%) |
| 15 Years | 8 (100.0%) | 0 (0.0%) |
| 16 and 17 Years | 9 (100.0%) | 26 (100.0%) |
| 18 to 24 Years | 0 (0.0%) | 9 (100.0%) |
| 25 to 34 Years | 15 (100.0%) | 6 (66.7%) |
| 35 to 44 Years | 10 (100.0%) | 15 (100.0%) |
| 45 to 54 Years | 6 (35.3%) | 10 (83.3%) |
| 55 to 64 Years | 22 (88.0%) | 36 (83.7%) |
| 65 to 74 Years | 15 (83.3%) | 14 (100.0%) |
| 75 Years and over | 14 (100.0%) | 4 (50.0%) |
| Total | 106 (86.2%) | 128 (88.9%) |
Income Below Poverty Among Married-Couple Families in Lupton
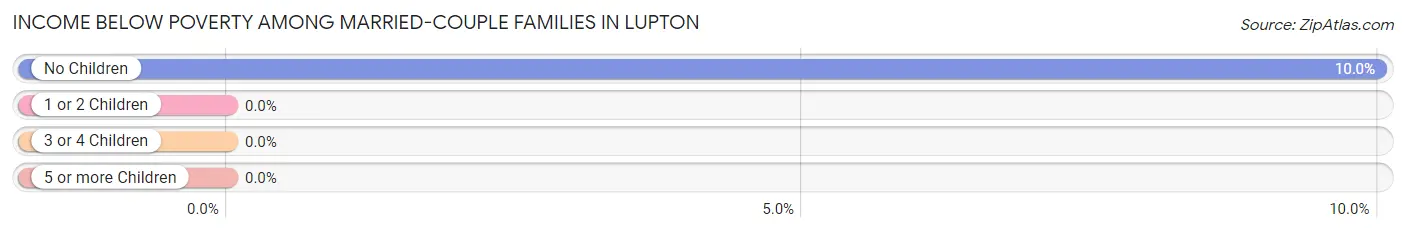
The poverty statistics for married-couple families in Lupton show that 10.0% or 4 of the total 40 families live below the poverty line. Families with no children have the highest poverty rate of 10.0%, comprising of 4 families. On the other hand, families with no children have the lowest poverty rate of 10.0%, which includes 4 families.
| Children | Above Poverty | Below Poverty |
| No Children | 36 (90.0%) | 4 (10.0%) |
| 1 or 2 Children | 0 (0.0%) | 0 (0.0%) |
| 3 or 4 Children | 0 (0.0%) | 0 (0.0%) |
| 5 or more Children | 0 (0.0%) | 0 (0.0%) |
| Total | 36 (90.0%) | 4 (10.0%) |
Income Below Poverty Among Single-Parent Households in Lupton
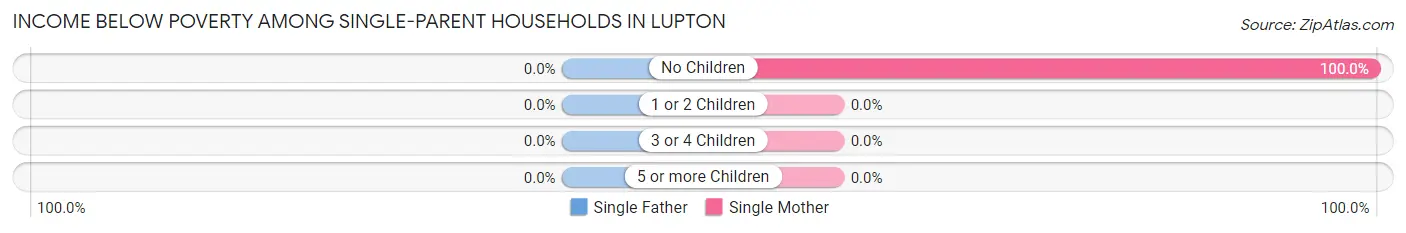
| Children | Single Father | Single Mother |
| No Children | 0 (0.0%) | 3 (100.0%) |
| 1 or 2 Children | 0 (0.0%) | 0 (0.0%) |
| 3 or 4 Children | 0 (0.0%) | 0 (0.0%) |
| 5 or more Children | 0 (0.0%) | 0 (0.0%) |
| Total | 0 (0.0%) | 3 (10.0%) |
Income Below Poverty Among Married-Couple vs Single-Parent Households in Lupton
The poverty data for Lupton shows that 4 of the married-couple family households (10.0%) and 3 of the single-parent households (10.0%) are living below the poverty level. Within the married-couple family households, those with no children have the highest poverty rate, with 4 households (10.0%) falling below the poverty line. Among the single-parent households, those with no children have the highest poverty rate, with 3 household (100.0%) living below poverty.
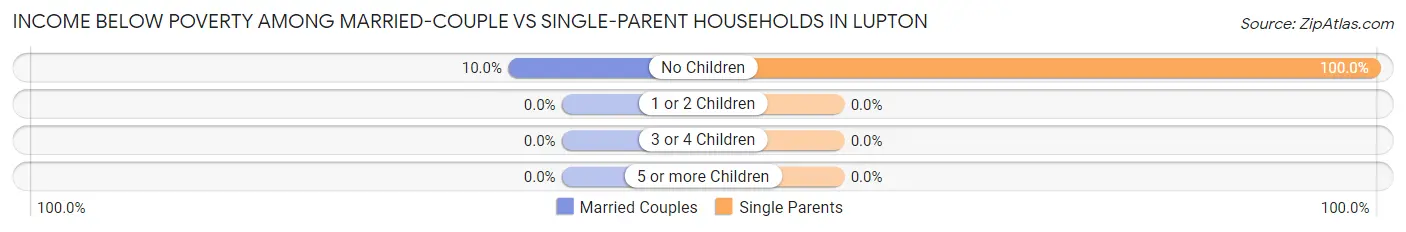
| Children | Married-Couple Families | Single-Parent Households |
| No Children | 4 (10.0%) | 3 (100.0%) |
| 1 or 2 Children | 0 (0.0%) | 0 (0.0%) |
| 3 or 4 Children | 0 (0.0%) | 0 (0.0%) |
| 5 or more Children | 0 (0.0%) | 0 (0.0%) |
| Total | 4 (10.0%) | 3 (10.0%) |
Race in Lupton
The most populous races in Lupton are White / Caucasian (274 | 98.9%), Hispanic or Latino (27 | 9.8%), and Two or more Races (3 | 1.1%).
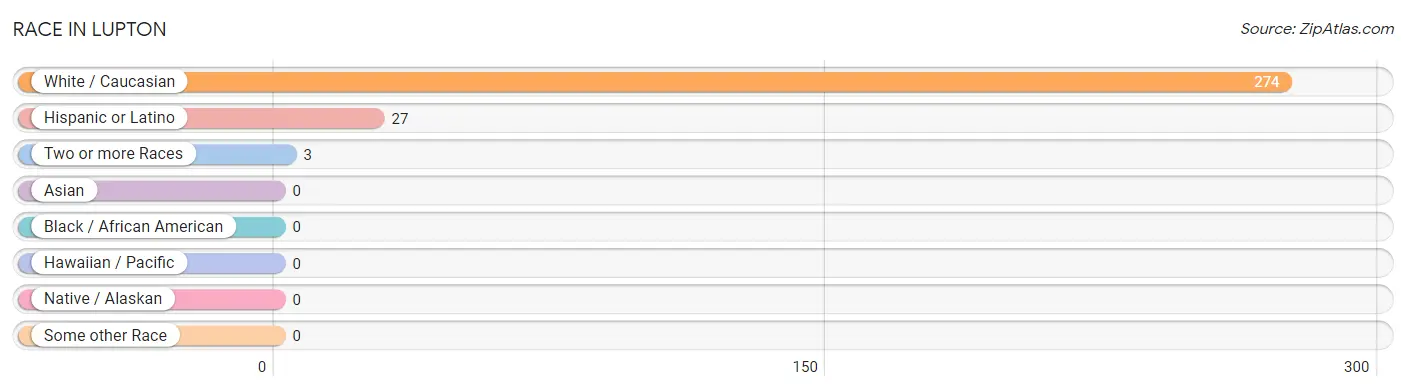
| Race | # Population | % Population |
| Asian | 0 | 0.0% |
| Black / African American | 0 | 0.0% |
| Hawaiian / Pacific | 0 | 0.0% |
| Hispanic or Latino | 27 | 9.8% |
| Native / Alaskan | 0 | 0.0% |
| White / Caucasian | 274 | 98.9% |
| Two or more Races | 3 | 1.1% |
| Some other Race | 0 | 0.0% |
| Total | 277 | 100.0% |
Ancestry in Lupton
The most populous ancestries reported in Lupton are German (91 | 32.9%), French (65 | 23.5%), Irish (65 | 23.5%), English (25 | 9.0%), and Puerto Rican (17 | 6.1%), together accounting for 95.0% of all Lupton residents.
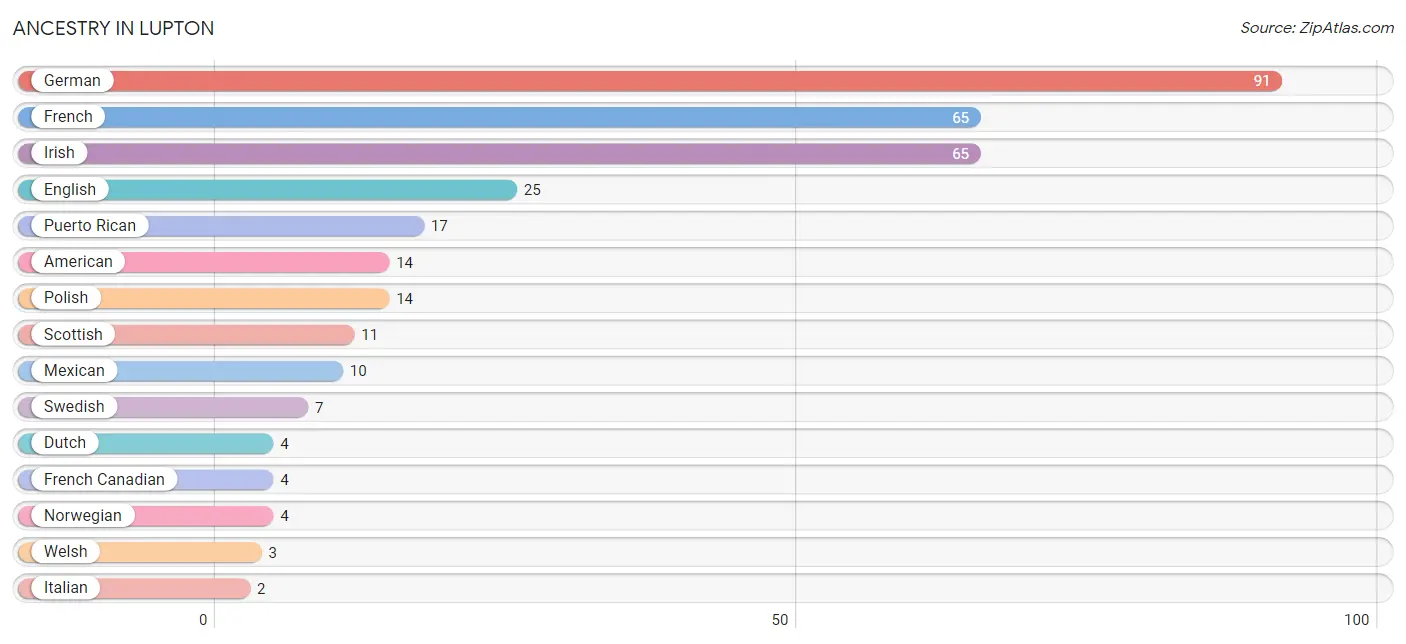
| Ancestry | # Population | % Population |
| American | 14 | 5.1% |
| Dutch | 4 | 1.4% |
| English | 25 | 9.0% |
| French | 65 | 23.5% |
| French Canadian | 4 | 1.4% |
| German | 91 | 32.9% |
| Irish | 65 | 23.5% |
| Italian | 2 | 0.7% |
| Mexican | 10 | 3.6% |
| Norwegian | 4 | 1.4% |
| Polish | 14 | 5.1% |
| Puerto Rican | 17 | 6.1% |
| Scottish | 11 | 4.0% |
| Swedish | 7 | 2.5% |
| Welsh | 3 | 1.1% | View All 15 Rows |
Immigrants in Lupton

| Immigration Origin | # Population | % Population | View All 0 Rows |
Sex and Age in Lupton
Sex and Age in Lupton
The most populous age groups in Lupton are 60 to 64 Years (19 | 14.3%) for men and 60 to 64 Years (28 | 19.4%) for women.
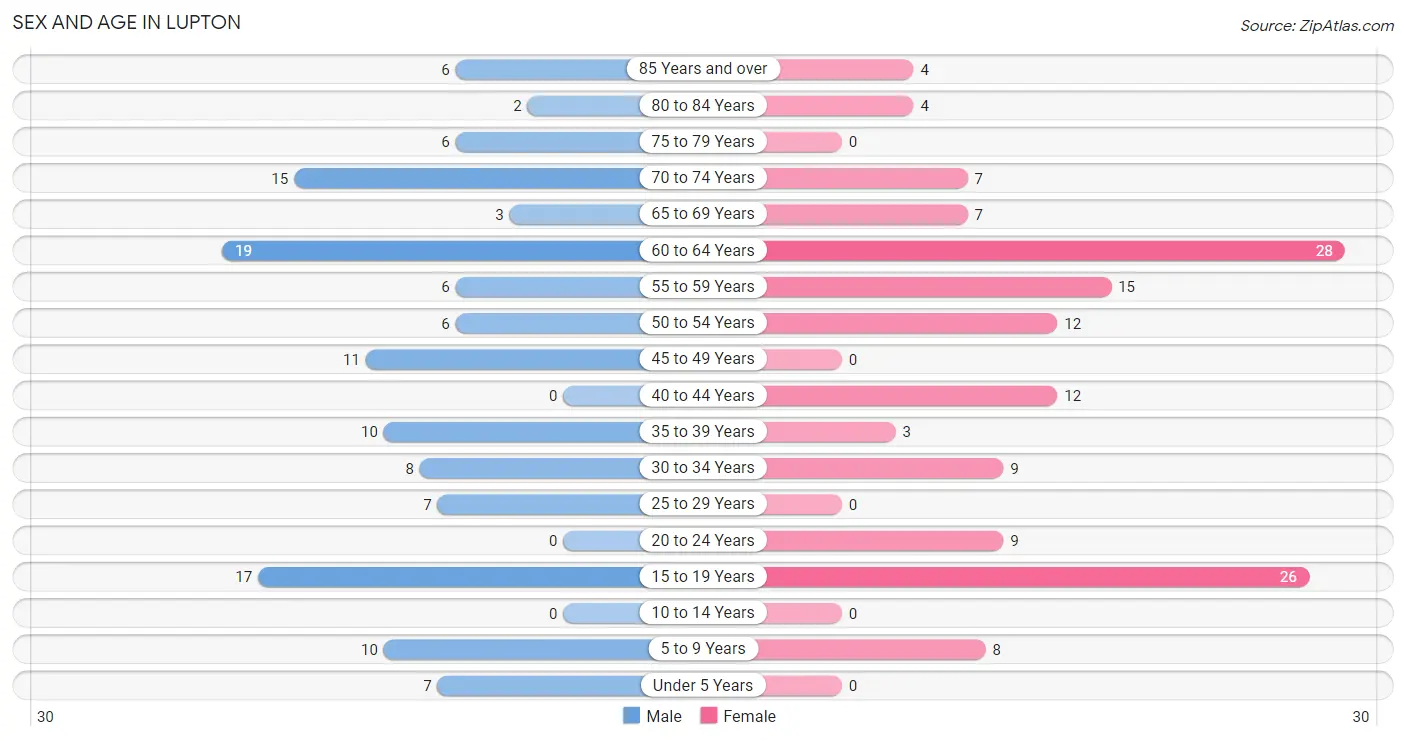
| Age Bracket | Male | Female |
| Under 5 Years | 7 (5.3%) | 0 (0.0%) |
| 5 to 9 Years | 10 (7.5%) | 8 (5.6%) |
| 10 to 14 Years | 0 (0.0%) | 0 (0.0%) |
| 15 to 19 Years | 17 (12.8%) | 26 (18.1%) |
| 20 to 24 Years | 0 (0.0%) | 9 (6.2%) |
| 25 to 29 Years | 7 (5.3%) | 0 (0.0%) |
| 30 to 34 Years | 8 (6.0%) | 9 (6.2%) |
| 35 to 39 Years | 10 (7.5%) | 3 (2.1%) |
| 40 to 44 Years | 0 (0.0%) | 12 (8.3%) |
| 45 to 49 Years | 11 (8.3%) | 0 (0.0%) |
| 50 to 54 Years | 6 (4.5%) | 12 (8.3%) |
| 55 to 59 Years | 6 (4.5%) | 15 (10.4%) |
| 60 to 64 Years | 19 (14.3%) | 28 (19.4%) |
| 65 to 69 Years | 3 (2.3%) | 7 (4.9%) |
| 70 to 74 Years | 15 (11.3%) | 7 (4.9%) |
| 75 to 79 Years | 6 (4.5%) | 0 (0.0%) |
| 80 to 84 Years | 2 (1.5%) | 4 (2.8%) |
| 85 Years and over | 6 (4.5%) | 4 (2.8%) |
| Total | 133 (100.0%) | 144 (100.0%) |
Families and Households in Lupton
Median Family Size in Lupton
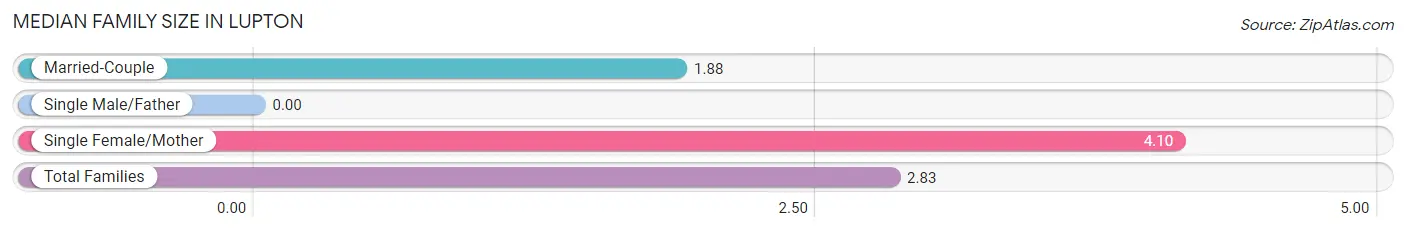
| Family Type | # Families | Family Size |
| Married-Couple | 40 (57.1%) | 1.88 |
| Single Male/Father | 0 (0.0%) | - |
| Single Female/Mother | 30 (42.9%) | 4.10 |
| Total Families | 70 (100.0%) | 2.83 |
Median Household Size in Lupton
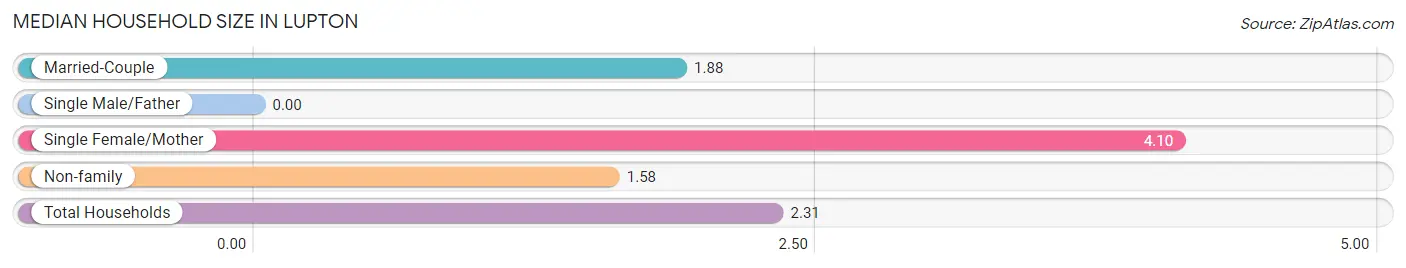
| Household Type | # Households | Household Size |
| Married-Couple | 40 (33.3%) | 1.88 |
| Single Male/Father | 0 (0.0%) | - |
| Single Female/Mother | 30 (25.0%) | 4.10 |
| Non-family | 50 (41.7%) | 1.58 |
| Total Households | 120 (100.0%) | 2.31 |
Household Size by Marriage Status in Lupton
Out of a total of 120 households in Lupton, 70 (58.3%) are family households, while 50 (41.7%) are nonfamily households. The most numerous type of family households are 2-person households, comprising 51, and the most common type of nonfamily households are 1-person households, comprising 35.
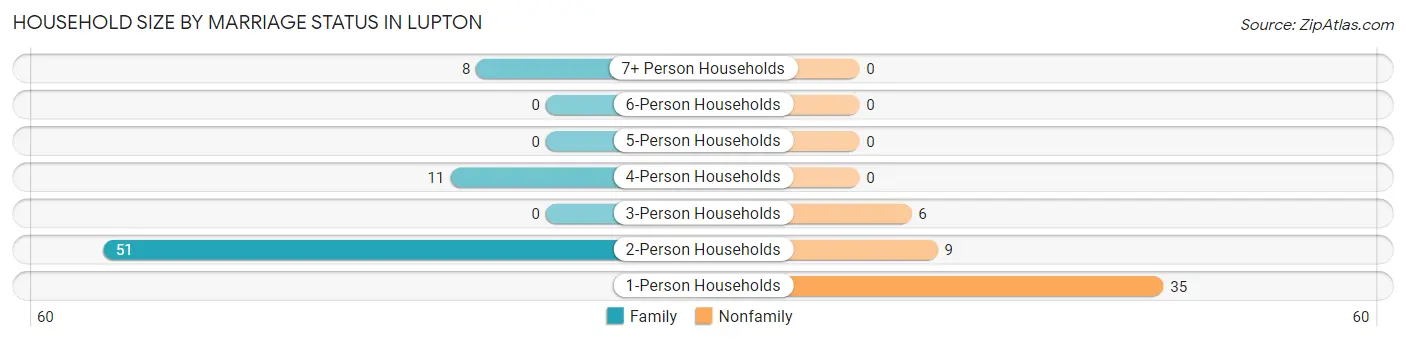
| Household Size | Family Households | Nonfamily Households |
| 1-Person Households | - | 35 (29.2%) |
| 2-Person Households | 51 (42.5%) | 9 (7.5%) |
| 3-Person Households | 0 (0.0%) | 6 (5.0%) |
| 4-Person Households | 11 (9.2%) | 0 (0.0%) |
| 5-Person Households | 0 (0.0%) | 0 (0.0%) |
| 6-Person Households | 0 (0.0%) | 0 (0.0%) |
| 7+ Person Households | 8 (6.7%) | 0 (0.0%) |
| Total | 70 (58.3%) | 50 (41.7%) |
Female Fertility in Lupton
Fertility by Age in Lupton
| Age Bracket | Women with Births | Births / 1,000 Women |
| 15 to 19 years | 0 (0.0%) | 0.0 |
| 20 to 34 years | 0 (0.0%) | 0.0 |
| 35 to 50 years | 0 (0.0%) | 0.0 |
| Total | 0 (0.0%) | 0.0 |
Fertility by Age by Marriage Status in Lupton
| Age Bracket | Married | Unmarried |
| 15 to 19 years | 0 (0.0%) | 0 (0.0%) |
| 20 to 34 years | 0 (0.0%) | 0 (0.0%) |
| 35 to 50 years | 0 (0.0%) | 0 (0.0%) |
| Total | 0 (0.0%) | 0 (0.0%) |
Fertility by Education in Lupton
| Educational Attainment | Women with Births | Births / 1,000 Women |
| Less than High School | 0 (0.0%) | 0.0 |
| High School Diploma | 0 (0.0%) | 0.0 |
| College or Associate's Degree | 0 (0.0%) | 0.0 |
| Bachelor's Degree | 0 (0.0%) | 0.0 |
| Graduate Degree | 0 (0.0%) | 0.0 |
| Total | 0 (0.0%) | 0.0 |
Fertility by Education by Marriage Status in Lupton
| Educational Attainment | Married | Unmarried |
| Less than High School | 0 (0.0%) | 0 (0.0%) |
| High School Diploma | 0 (0.0%) | 0 (0.0%) |
| College or Associate's Degree | 0 (0.0%) | 0 (0.0%) |
| Bachelor's Degree | 0 (0.0%) | 0 (0.0%) |
| Graduate Degree | 0 (0.0%) | 0 (0.0%) |
| Total | 0 (0.0%) | 0 (0.0%) |
Employment Characteristics in Lupton
Employment by Class of Employer in Lupton
Among the 85 employed individuals in Lupton, private company employees (64 | 75.3%), self-employed (incorporated) (8 | 9.4%), and state government employees (7 | 8.2%) make up the most common classes of employment.
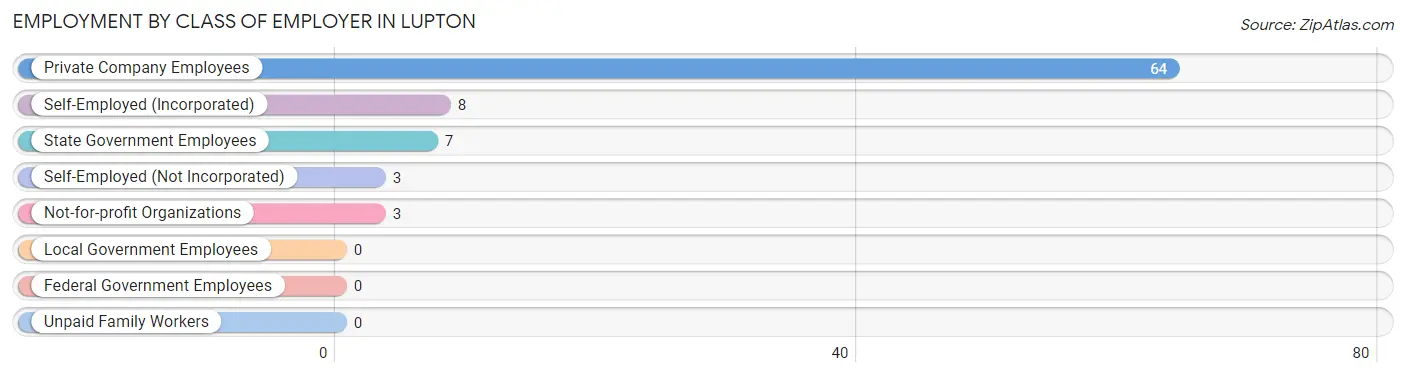
| Employer Class | # Employees | % Employees |
| Private Company Employees | 64 | 75.3% |
| Self-Employed (Incorporated) | 8 | 9.4% |
| Self-Employed (Not Incorporated) | 3 | 3.5% |
| Not-for-profit Organizations | 3 | 3.5% |
| Local Government Employees | 0 | 0.0% |
| State Government Employees | 7 | 8.2% |
| Federal Government Employees | 0 | 0.0% |
| Unpaid Family Workers | 0 | 0.0% |
| Total | 85 | 100.0% |
Employment Status by Age in Lupton
According to the labor force statistics for Lupton, out of the total population over 16 years of age (244), 38.9% or 95 individuals are in the labor force, with 10.5% or 10 of them unemployed. The age group with the highest labor force participation rate is 20 to 24 years, with 100.0% or 9 individuals in the labor force. Within the labor force, the 35 to 44 years age range has the highest percentage of unemployed individuals, with 55.6% or 10 of them being unemployed.
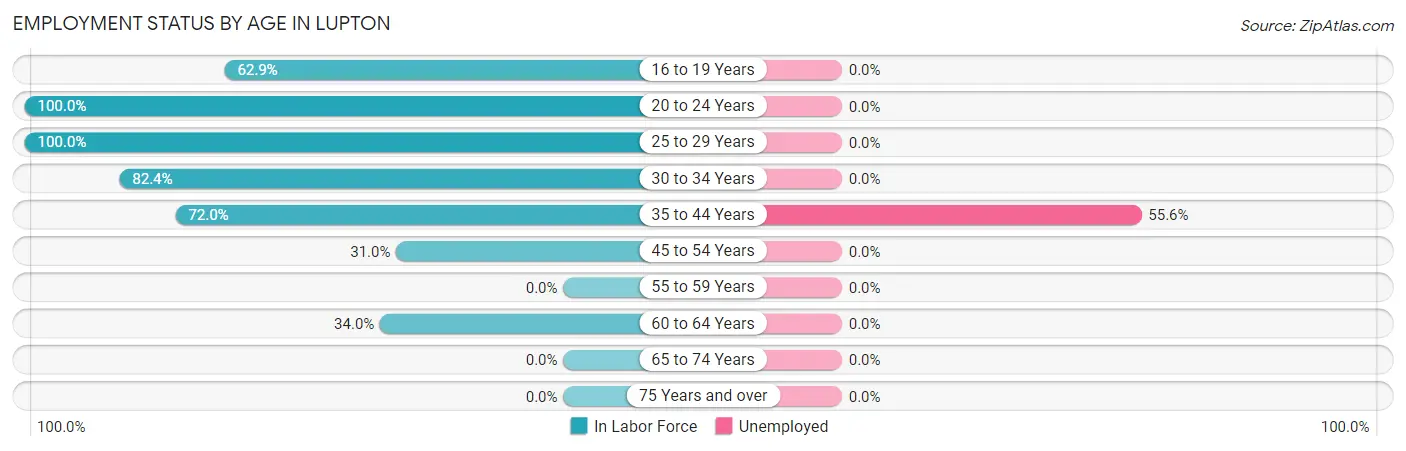
| Age Bracket | In Labor Force | Unemployed |
| 16 to 19 Years | 22 (62.9%) | 0 (0.0%) |
| 20 to 24 Years | 9 (100.0%) | 0 (0.0%) |
| 25 to 29 Years | 7 (100.0%) | 0 (0.0%) |
| 30 to 34 Years | 14 (82.4%) | 0 (0.0%) |
| 35 to 44 Years | 18 (72.0%) | 10 (55.6%) |
| 45 to 54 Years | 9 (31.0%) | 0 (0.0%) |
| 55 to 59 Years | 0 (0.0%) | 0 (0.0%) |
| 60 to 64 Years | 16 (34.0%) | 0 (0.0%) |
| 65 to 74 Years | 0 (0.0%) | 0 (0.0%) |
| 75 Years and over | 0 (0.0%) | 0 (0.0%) |
| Total | 95 (38.9%) | 10 (10.5%) |
Employment Status by Educational Attainment in Lupton
According to labor force statistics for Lupton, 43.8% of individuals (64) out of the total population between 25 and 64 years of age (146) are in the labor force, with 15.6% or 10 of them being unemployed. The group with the highest labor force participation rate are those with the educational attainment of bachelor's degree or higher, with 71.4% or 10 individuals in the labor force. Within the labor force, individuals with college / associate degree education have the highest percentage of unemployment, with 55.6% or 10 of them being unemployed.
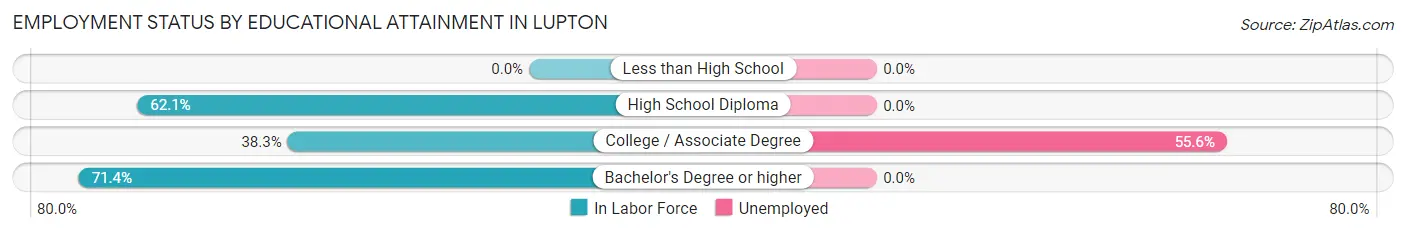
| Educational Attainment | In Labor Force | Unemployed |
| Less than High School | 0 (0.0%) | 0 (0.0%) |
| High School Diploma | 36 (62.1%) | 0 (0.0%) |
| College / Associate Degree | 18 (38.3%) | 26 (55.6%) |
| Bachelor's Degree or higher | 10 (71.4%) | 0 (0.0%) |
| Total | 64 (43.8%) | 23 (15.6%) |
Employment Occupations by Sex in Lupton
Management, Business, Science and Arts Occupations
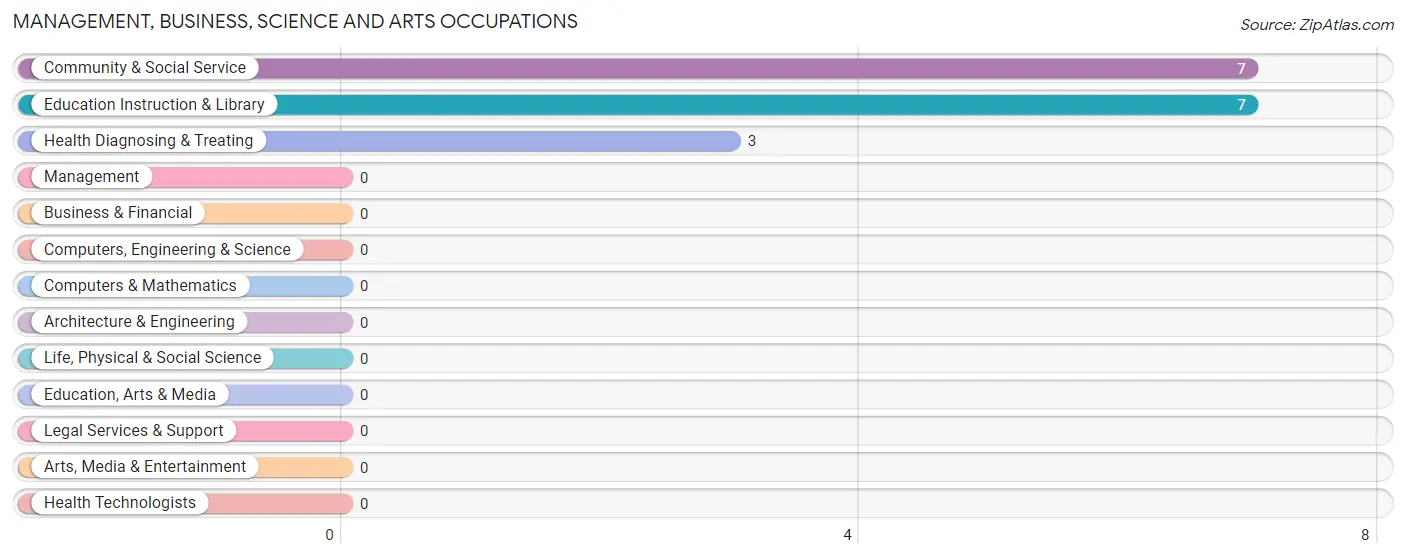
The most common Management, Business, Science and Arts occupations in Lupton are Community & Social Service (7 | 8.2%), Education Instruction & Library (7 | 8.2%), and Health Diagnosing & Treating (3 | 3.5%).
Management, Business, Science and Arts Occupations by Sex
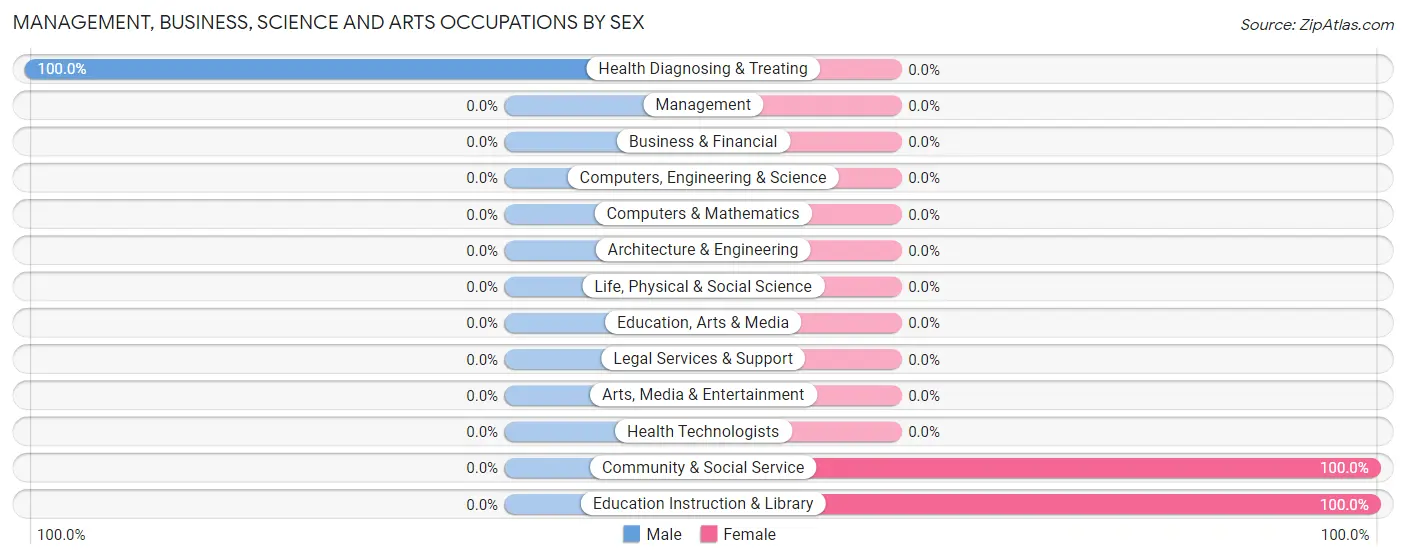
| Occupation | Male | Female |
| Management | 0 (0.0%) | 0 (0.0%) |
| Business & Financial | 0 (0.0%) | 0 (0.0%) |
| Computers, Engineering & Science | 0 (0.0%) | 0 (0.0%) |
| Computers & Mathematics | 0 (0.0%) | 0 (0.0%) |
| Architecture & Engineering | 0 (0.0%) | 0 (0.0%) |
| Life, Physical & Social Science | 0 (0.0%) | 0 (0.0%) |
| Community & Social Service | 0 (0.0%) | 7 (100.0%) |
| Education, Arts & Media | 0 (0.0%) | 0 (0.0%) |
| Legal Services & Support | 0 (0.0%) | 0 (0.0%) |
| Education Instruction & Library | 0 (0.0%) | 7 (100.0%) |
| Arts, Media & Entertainment | 0 (0.0%) | 0 (0.0%) |
| Health Diagnosing & Treating | 3 (100.0%) | 0 (0.0%) |
| Health Technologists | 0 (0.0%) | 0 (0.0%) |
| Total (Category) | 3 (30.0%) | 7 (70.0%) |
| Total (Overall) | 39 (45.9%) | 46 (54.1%) |
Services Occupations
The most common Services occupations in Lupton are Healthcare Support (8 | 9.4%), and Personal Care & Service (6 | 7.1%).
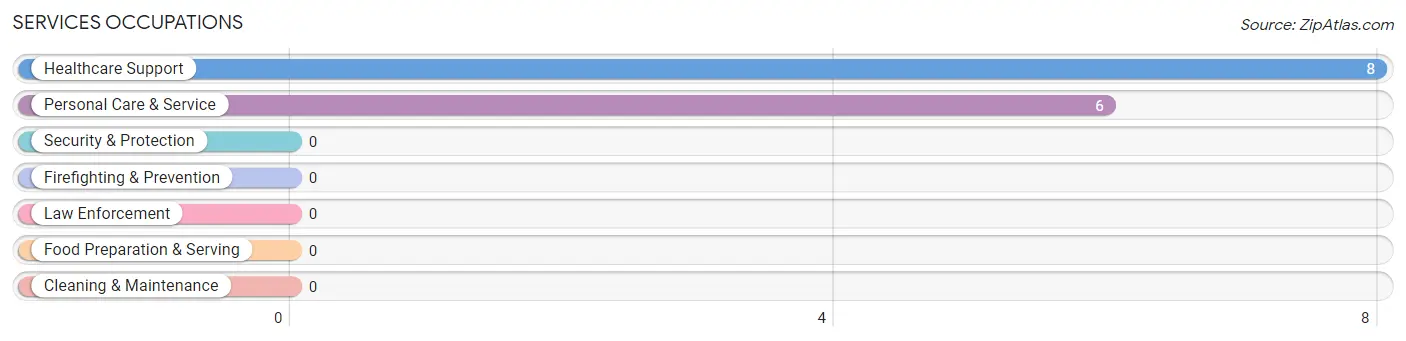
Services Occupations by Sex
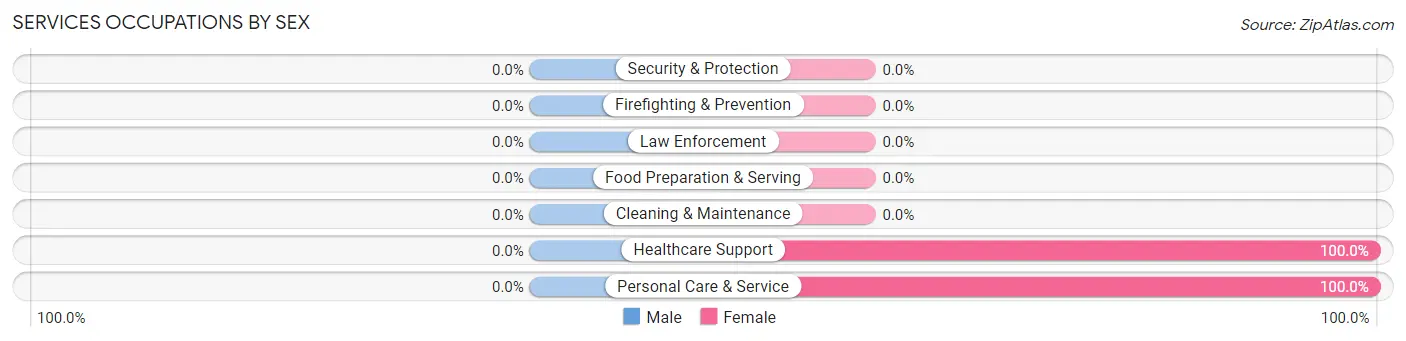
| Occupation | Male | Female |
| Healthcare Support | 0 (0.0%) | 8 (100.0%) |
| Security & Protection | 0 (0.0%) | 0 (0.0%) |
| Firefighting & Prevention | 0 (0.0%) | 0 (0.0%) |
| Law Enforcement | 0 (0.0%) | 0 (0.0%) |
| Food Preparation & Serving | 0 (0.0%) | 0 (0.0%) |
| Cleaning & Maintenance | 0 (0.0%) | 0 (0.0%) |
| Personal Care & Service | 0 (0.0%) | 6 (100.0%) |
| Total (Category) | 0 (0.0%) | 14 (100.0%) |
| Total (Overall) | 39 (45.9%) | 46 (54.1%) |
Sales and Office Occupations
The most common Sales and Office occupations in Lupton are Sales & Related (22 | 25.9%), and Office & Administration (3 | 3.5%).

Sales and Office Occupations by Sex

| Occupation | Male | Female |
| Sales & Related | 0 (0.0%) | 22 (100.0%) |
| Office & Administration | 0 (0.0%) | 3 (100.0%) |
| Total (Category) | 0 (0.0%) | 25 (100.0%) |
| Total (Overall) | 39 (45.9%) | 46 (54.1%) |
Natural Resources, Construction and Maintenance Occupations
The most common Natural Resources, Construction and Maintenance occupations in Lupton are Construction & Extraction (14 | 16.5%), and Installation, Maintenance & Repair (3 | 3.5%).
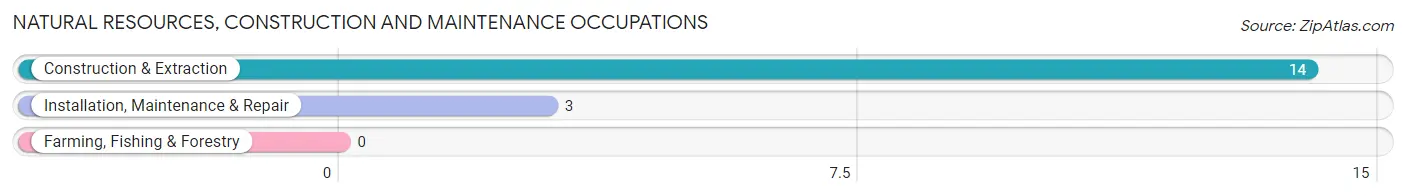
Natural Resources, Construction and Maintenance Occupations by Sex
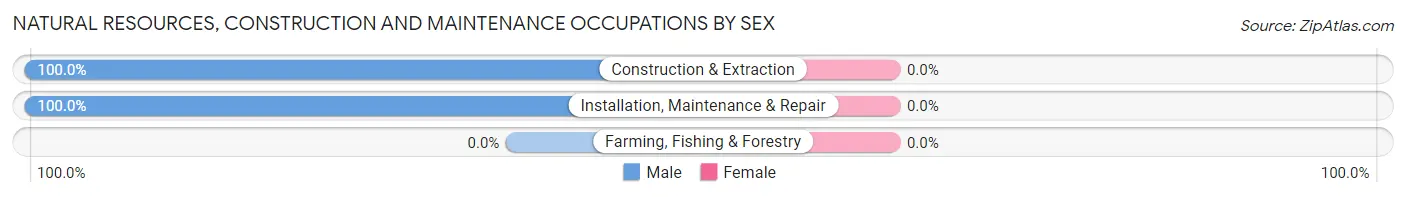
| Occupation | Male | Female |
| Farming, Fishing & Forestry | 0 (0.0%) | 0 (0.0%) |
| Construction & Extraction | 14 (100.0%) | 0 (0.0%) |
| Installation, Maintenance & Repair | 3 (100.0%) | 0 (0.0%) |
| Total (Category) | 17 (100.0%) | 0 (0.0%) |
| Total (Overall) | 39 (45.9%) | 46 (54.1%) |
Production, Transportation and Moving Occupations
The most common Production, Transportation and Moving occupations in Lupton are Production (10 | 11.8%), and Material Moving (9 | 10.6%).
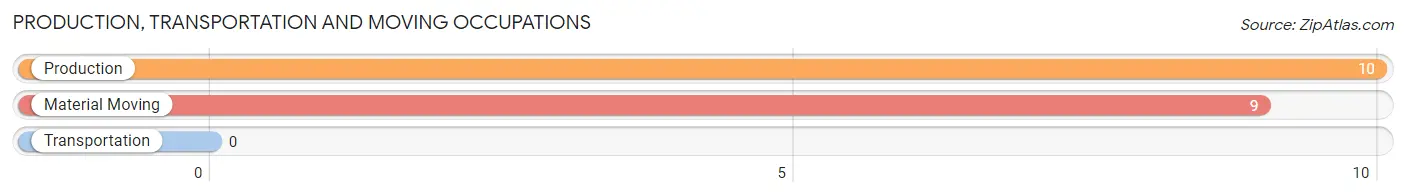
Production, Transportation and Moving Occupations by Sex
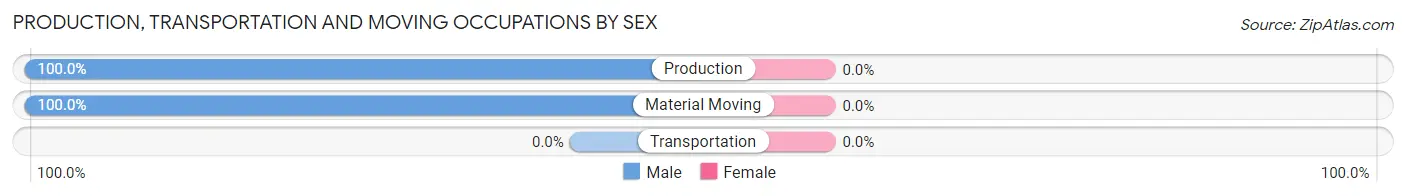
| Occupation | Male | Female |
| Production | 10 (100.0%) | 0 (0.0%) |
| Transportation | 0 (0.0%) | 0 (0.0%) |
| Material Moving | 9 (100.0%) | 0 (0.0%) |
| Total (Category) | 19 (100.0%) | 0 (0.0%) |
| Total (Overall) | 39 (45.9%) | 46 (54.1%) |
Employment Industries by Sex in Lupton
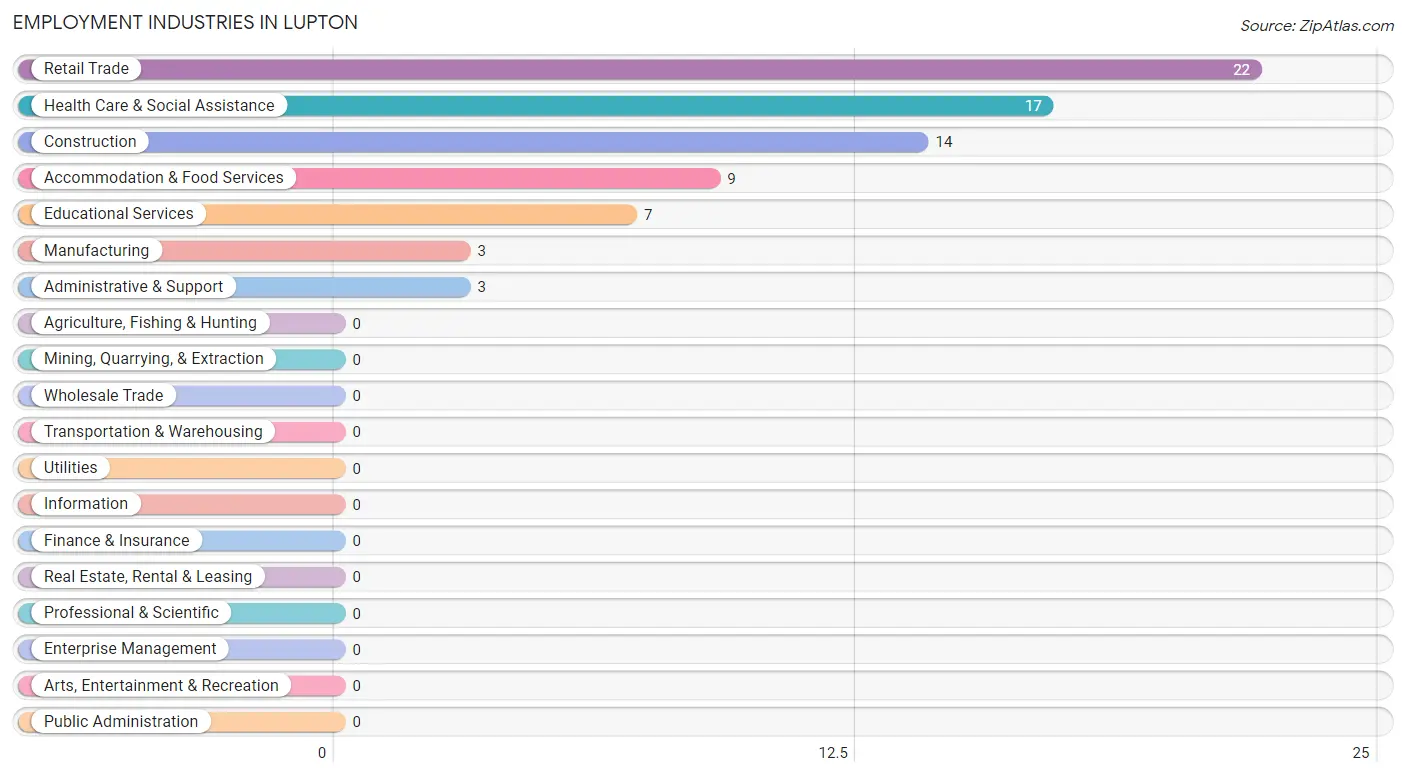
Employment Industries in Lupton
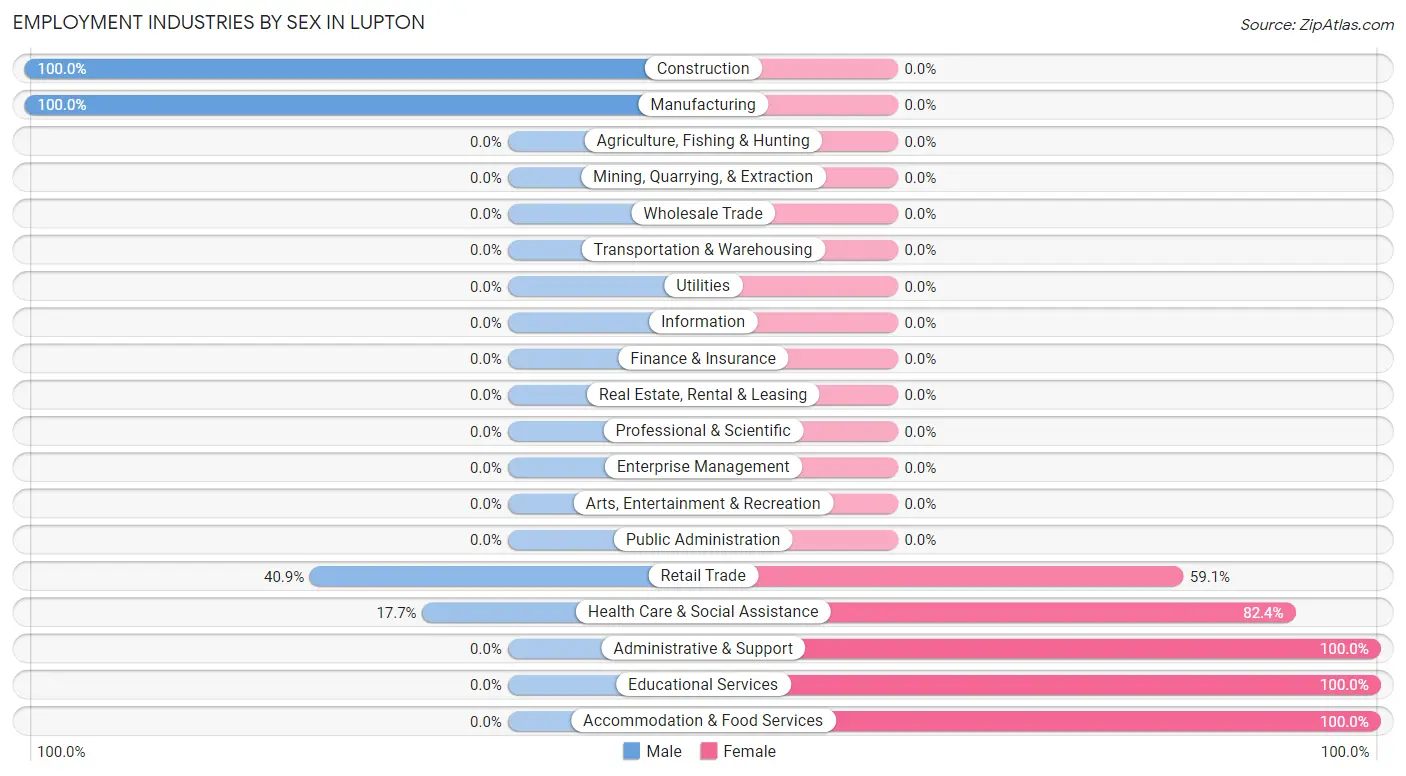
The major employment industries in Lupton include Retail Trade (22 | 25.9%), Health Care & Social Assistance (17 | 20.0%), Construction (14 | 16.5%), Accommodation & Food Services (9 | 10.6%), and Educational Services (7 | 8.2%).
Employment Industries by Sex in Lupton
The Lupton industries that see more men than women are Construction (100.0%), Manufacturing (100.0%), and Retail Trade (40.9%), whereas the industries that tend to have a higher number of women are Administrative & Support (100.0%), Educational Services (100.0%), and Accommodation & Food Services (100.0%).
| Industry | Male | Female |
| Agriculture, Fishing & Hunting | 0 (0.0%) | 0 (0.0%) |
| Mining, Quarrying, & Extraction | 0 (0.0%) | 0 (0.0%) |
| Construction | 14 (100.0%) | 0 (0.0%) |
| Manufacturing | 3 (100.0%) | 0 (0.0%) |
| Wholesale Trade | 0 (0.0%) | 0 (0.0%) |
| Retail Trade | 9 (40.9%) | 13 (59.1%) |
| Transportation & Warehousing | 0 (0.0%) | 0 (0.0%) |
| Utilities | 0 (0.0%) | 0 (0.0%) |
| Information | 0 (0.0%) | 0 (0.0%) |
| Finance & Insurance | 0 (0.0%) | 0 (0.0%) |
| Real Estate, Rental & Leasing | 0 (0.0%) | 0 (0.0%) |
| Professional & Scientific | 0 (0.0%) | 0 (0.0%) |
| Enterprise Management | 0 (0.0%) | 0 (0.0%) |
| Administrative & Support | 0 (0.0%) | 3 (100.0%) |
| Educational Services | 0 (0.0%) | 7 (100.0%) |
| Health Care & Social Assistance | 3 (17.6%) | 14 (82.4%) |
| Arts, Entertainment & Recreation | 0 (0.0%) | 0 (0.0%) |
| Accommodation & Food Services | 0 (0.0%) | 9 (100.0%) |
| Public Administration | 0 (0.0%) | 0 (0.0%) |
| Total | 39 (45.9%) | 46 (54.1%) |
Education in Lupton
School Enrollment in Lupton
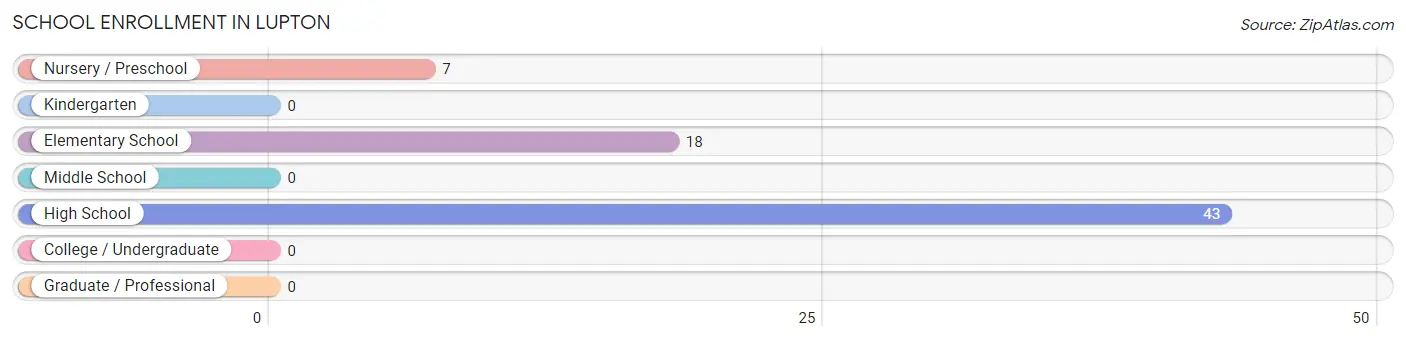
The most common levels of schooling among the 68 students in Lupton are high school (43 | 63.2%), elementary school (18 | 26.5%), and nursery / preschool (7 | 10.3%).
| School Level | # Students | % Students |
| Nursery / Preschool | 7 | 10.3% |
| Kindergarten | 0 | 0.0% |
| Elementary School | 18 | 26.5% |
| Middle School | 0 | 0.0% |
| High School | 43 | 63.2% |
| College / Undergraduate | 0 | 0.0% |
| Graduate / Professional | 0 | 0.0% |
| Total | 68 | 100.0% |
School Enrollment by Age by Funding Source in Lupton
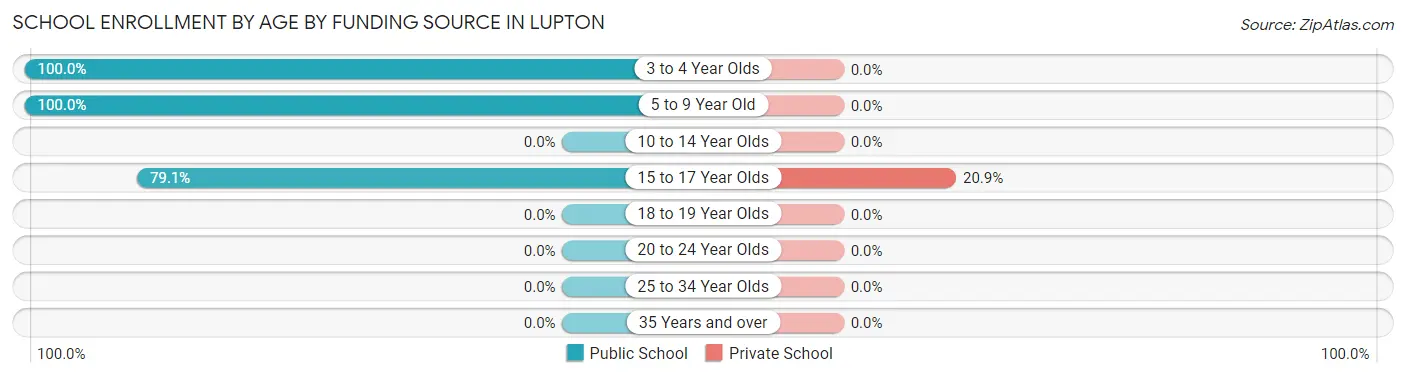
Out of a total of 68 students who are enrolled in schools in Lupton, 9 (13.2%) attend a private institution, while the remaining 59 (86.8%) are enrolled in public schools. The age group of 15 to 17 year olds has the highest likelihood of being enrolled in private schools, with 9 (20.9% in the age bracket) enrolled. Conversely, the age group of 3 to 4 year olds has the lowest likelihood of being enrolled in a private school, with 7 (100.0% in the age bracket) attending a public institution.
| Age Bracket | Public School | Private School |
| 3 to 4 Year Olds | 7 (100.0%) | 0 (0.0%) |
| 5 to 9 Year Old | 18 (100.0%) | 0 (0.0%) |
| 10 to 14 Year Olds | 0 (0.0%) | 0 (0.0%) |
| 15 to 17 Year Olds | 34 (79.1%) | 9 (20.9%) |
| 18 to 19 Year Olds | 0 (0.0%) | 0 (0.0%) |
| 20 to 24 Year Olds | 0 (0.0%) | 0 (0.0%) |
| 25 to 34 Year Olds | 0 (0.0%) | 0 (0.0%) |
| 35 Years and over | 0 (0.0%) | 0 (0.0%) |
| Total | 59 (86.8%) | 9 (13.2%) |
Educational Attainment by Field of Study in Lupton
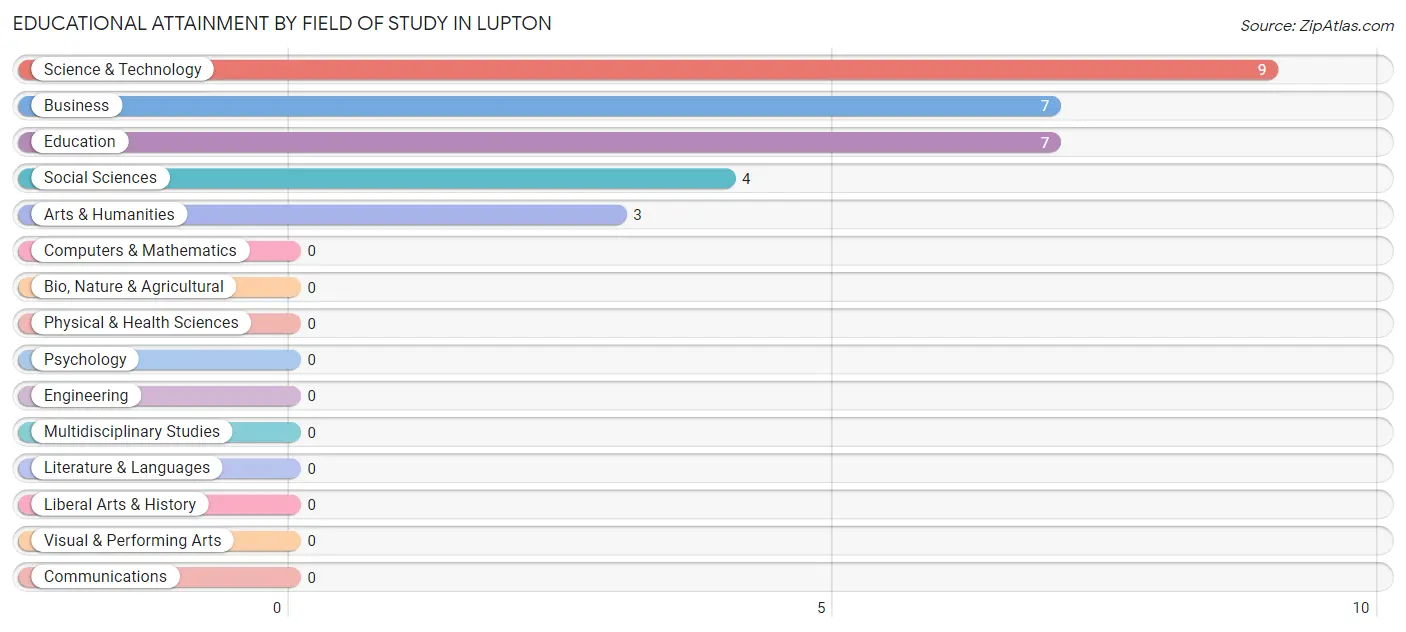
Science & technology (9 | 30.0%), business (7 | 23.3%), education (7 | 23.3%), social sciences (4 | 13.3%), and arts & humanities (3 | 10.0%) are the most common fields of study among 30 individuals in Lupton who have obtained a bachelor's degree or higher.
| Field of Study | # Graduates | % Graduates |
| Computers & Mathematics | 0 | 0.0% |
| Bio, Nature & Agricultural | 0 | 0.0% |
| Physical & Health Sciences | 0 | 0.0% |
| Psychology | 0 | 0.0% |
| Social Sciences | 4 | 13.3% |
| Engineering | 0 | 0.0% |
| Multidisciplinary Studies | 0 | 0.0% |
| Science & Technology | 9 | 30.0% |
| Business | 7 | 23.3% |
| Education | 7 | 23.3% |
| Literature & Languages | 0 | 0.0% |
| Liberal Arts & History | 0 | 0.0% |
| Visual & Performing Arts | 0 | 0.0% |
| Communications | 0 | 0.0% |
| Arts & Humanities | 3 | 10.0% |
| Total | 30 | 100.0% |
Transportation & Commute in Lupton
Vehicle Availability by Sex in Lupton
The most prevalent vehicle ownership categories in Lupton are males with 2 vehicles (20, accounting for 51.3%) and females with 2 vehicles (15, making up 43.5%).
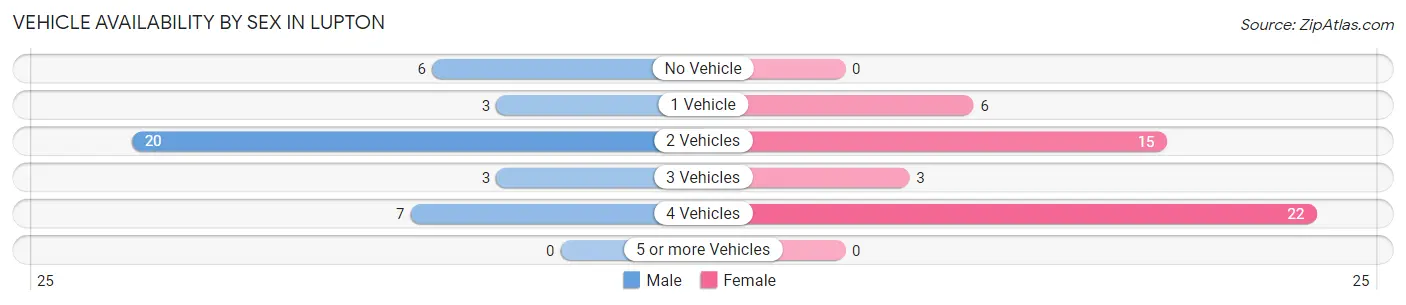
| Vehicles Available | Male | Female |
| No Vehicle | 6 (15.4%) | 0 (0.0%) |
| 1 Vehicle | 3 (7.7%) | 6 (13.0%) |
| 2 Vehicles | 20 (51.3%) | 15 (32.6%) |
| 3 Vehicles | 3 (7.7%) | 3 (6.5%) |
| 4 Vehicles | 7 (17.9%) | 22 (47.8%) |
| 5 or more Vehicles | 0 (0.0%) | 0 (0.0%) |
| Total | 39 (100.0%) | 46 (100.0%) |
Commute Time in Lupton
The most frequently occuring commute durations in Lupton are 40 to 44 minutes (22 commuters, 28.9%), 10 to 14 minutes (17 commuters, 22.4%), and 90 or more minutes (15 commuters, 19.7%).
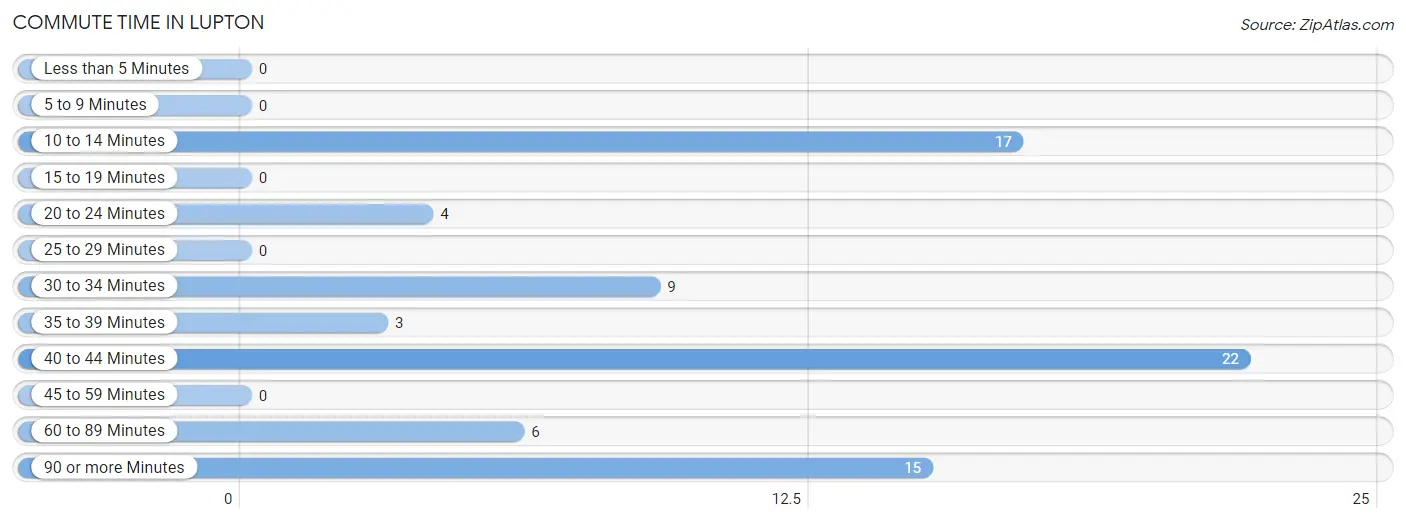
| Commute Time | # Commuters | % Commuters |
| Less than 5 Minutes | 0 | 0.0% |
| 5 to 9 Minutes | 0 | 0.0% |
| 10 to 14 Minutes | 17 | 22.4% |
| 15 to 19 Minutes | 0 | 0.0% |
| 20 to 24 Minutes | 4 | 5.3% |
| 25 to 29 Minutes | 0 | 0.0% |
| 30 to 34 Minutes | 9 | 11.8% |
| 35 to 39 Minutes | 3 | 4.0% |
| 40 to 44 Minutes | 22 | 28.9% |
| 45 to 59 Minutes | 0 | 0.0% |
| 60 to 89 Minutes | 6 | 7.9% |
| 90 or more Minutes | 15 | 19.7% |
Commute Time by Sex in Lupton
The most common commute times in Lupton are 90 or more minutes (15 commuters, 50.0%) for males and 40 to 44 minutes (22 commuters, 47.8%) for females.
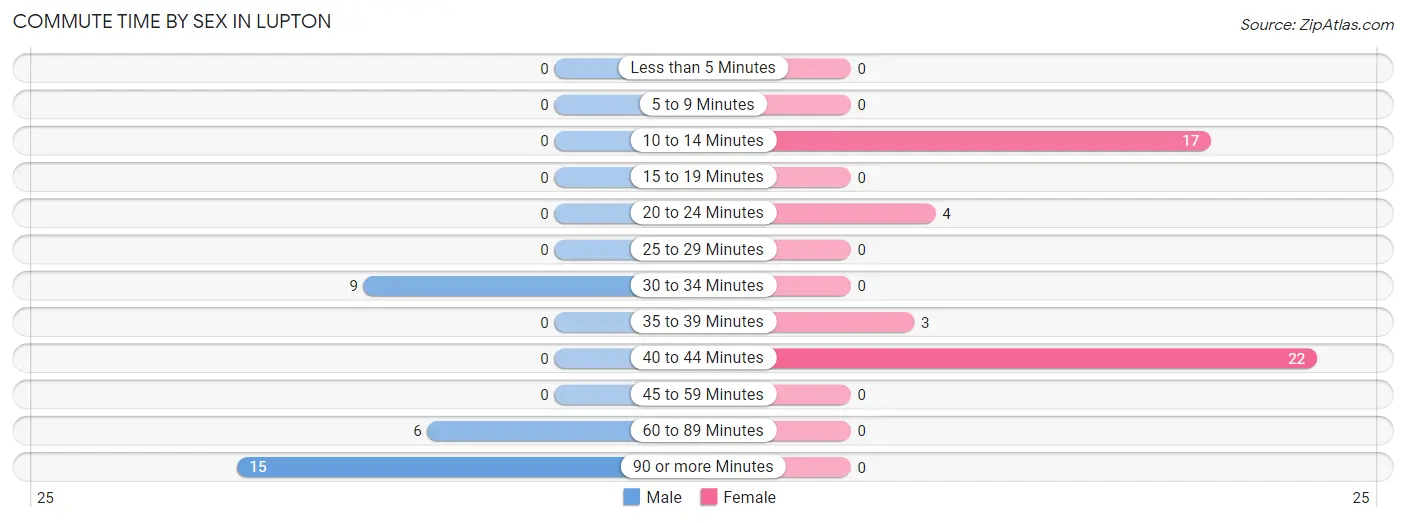
| Commute Time | Male | Female |
| Less than 5 Minutes | 0 (0.0%) | 0 (0.0%) |
| 5 to 9 Minutes | 0 (0.0%) | 0 (0.0%) |
| 10 to 14 Minutes | 0 (0.0%) | 17 (37.0%) |
| 15 to 19 Minutes | 0 (0.0%) | 0 (0.0%) |
| 20 to 24 Minutes | 0 (0.0%) | 4 (8.7%) |
| 25 to 29 Minutes | 0 (0.0%) | 0 (0.0%) |
| 30 to 34 Minutes | 9 (30.0%) | 0 (0.0%) |
| 35 to 39 Minutes | 0 (0.0%) | 3 (6.5%) |
| 40 to 44 Minutes | 0 (0.0%) | 22 (47.8%) |
| 45 to 59 Minutes | 0 (0.0%) | 0 (0.0%) |
| 60 to 89 Minutes | 6 (20.0%) | 0 (0.0%) |
| 90 or more Minutes | 15 (50.0%) | 0 (0.0%) |
Time of Departure to Work by Sex in Lupton
The most frequent times of departure to work in Lupton are 12:00 AM to 4:59 AM (15, 50.0%) for males and 12:00 PM to 3:59 PM (13, 28.3%) for females.
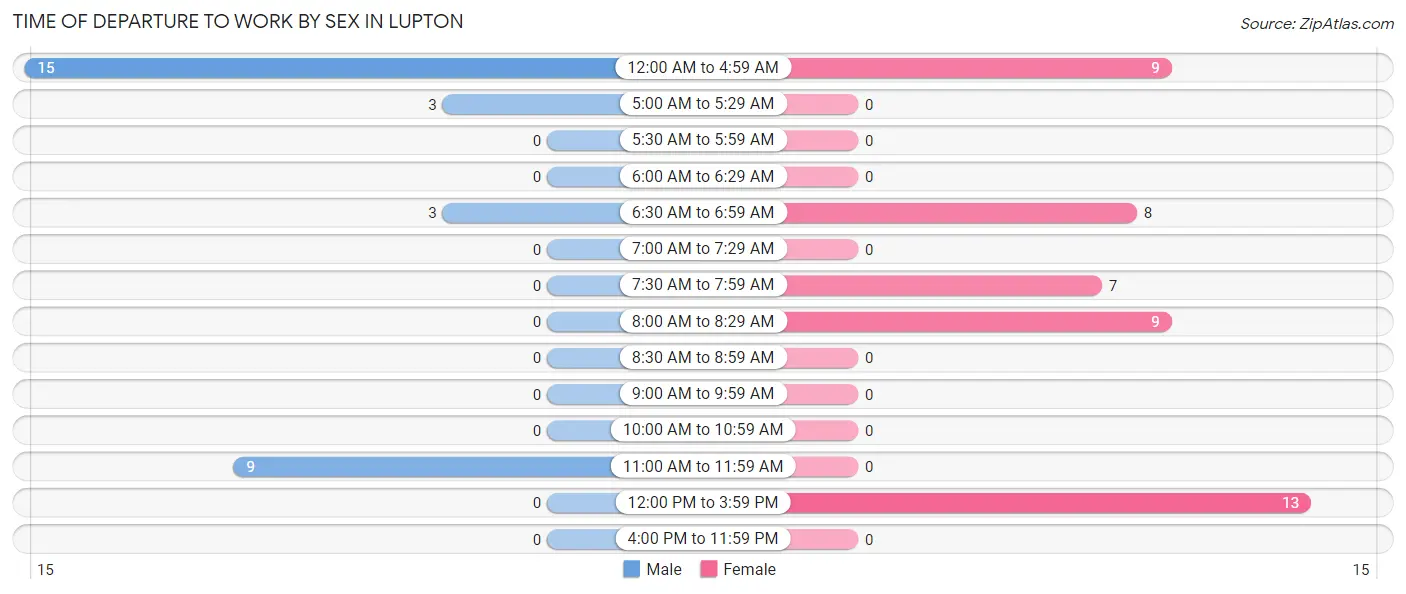
| Time of Departure | Male | Female |
| 12:00 AM to 4:59 AM | 15 (50.0%) | 9 (19.6%) |
| 5:00 AM to 5:29 AM | 3 (10.0%) | 0 (0.0%) |
| 5:30 AM to 5:59 AM | 0 (0.0%) | 0 (0.0%) |
| 6:00 AM to 6:29 AM | 0 (0.0%) | 0 (0.0%) |
| 6:30 AM to 6:59 AM | 3 (10.0%) | 8 (17.4%) |
| 7:00 AM to 7:29 AM | 0 (0.0%) | 0 (0.0%) |
| 7:30 AM to 7:59 AM | 0 (0.0%) | 7 (15.2%) |
| 8:00 AM to 8:29 AM | 0 (0.0%) | 9 (19.6%) |
| 8:30 AM to 8:59 AM | 0 (0.0%) | 0 (0.0%) |
| 9:00 AM to 9:59 AM | 0 (0.0%) | 0 (0.0%) |
| 10:00 AM to 10:59 AM | 0 (0.0%) | 0 (0.0%) |
| 11:00 AM to 11:59 AM | 9 (30.0%) | 0 (0.0%) |
| 12:00 PM to 3:59 PM | 0 (0.0%) | 13 (28.3%) |
| 4:00 PM to 11:59 PM | 0 (0.0%) | 0 (0.0%) |
| Total | 30 (100.0%) | 46 (100.0%) |
Housing Occupancy in Lupton
Occupancy by Ownership in Lupton
Of the total 120 dwellings in Lupton, owner-occupied units account for 98 (81.7%), while renter-occupied units make up 22 (18.3%).
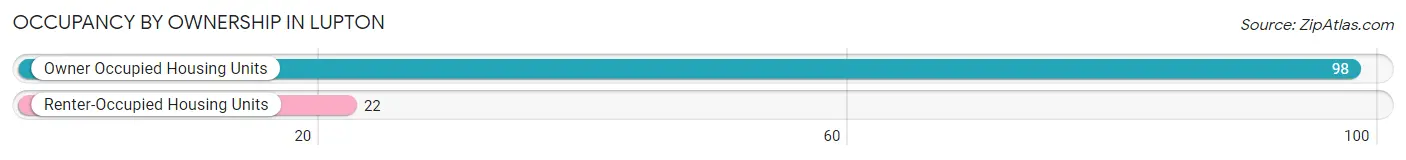
| Occupancy | # Housing Units | % Housing Units |
| Owner Occupied Housing Units | 98 | 81.7% |
| Renter-Occupied Housing Units | 22 | 18.3% |
| Total Occupied Housing Units | 120 | 100.0% |
Occupancy by Household Size in Lupton
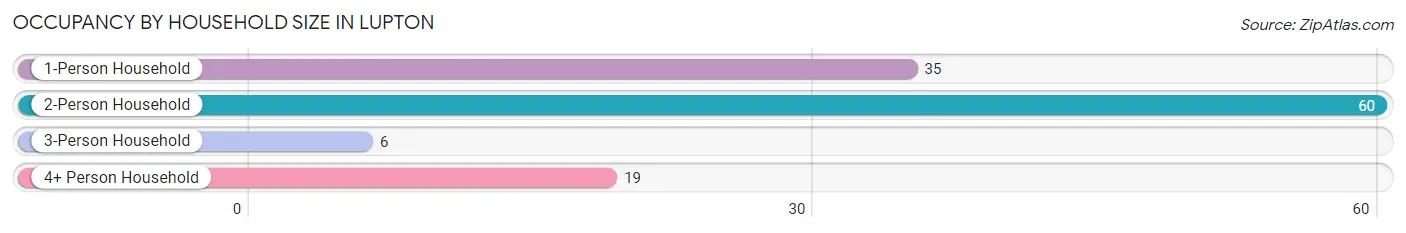
| Household Size | # Housing Units | % Housing Units |
| 1-Person Household | 35 | 29.2% |
| 2-Person Household | 60 | 50.0% |
| 3-Person Household | 6 | 5.0% |
| 4+ Person Household | 19 | 15.8% |
| Total Housing Units | 120 | 100.0% |
Occupancy by Ownership by Household Size in Lupton
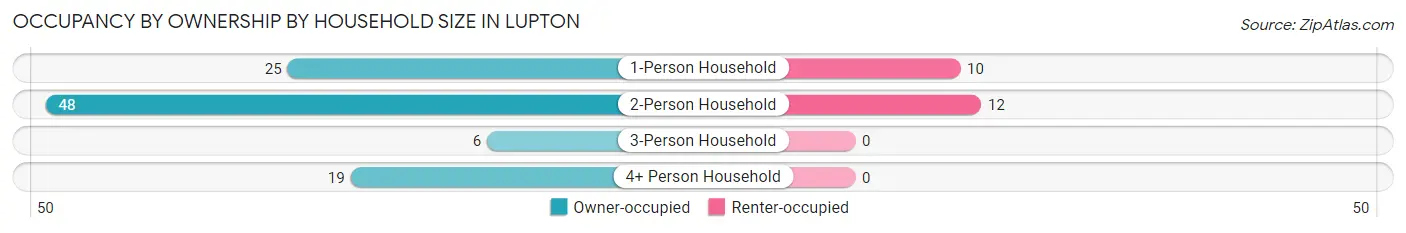
| Household Size | Owner-occupied | Renter-occupied |
| 1-Person Household | 25 (71.4%) | 10 (28.6%) |
| 2-Person Household | 48 (80.0%) | 12 (20.0%) |
| 3-Person Household | 6 (100.0%) | 0 (0.0%) |
| 4+ Person Household | 19 (100.0%) | 0 (0.0%) |
| Total Housing Units | 98 (81.7%) | 22 (18.3%) |
Occupancy by Educational Attainment in Lupton
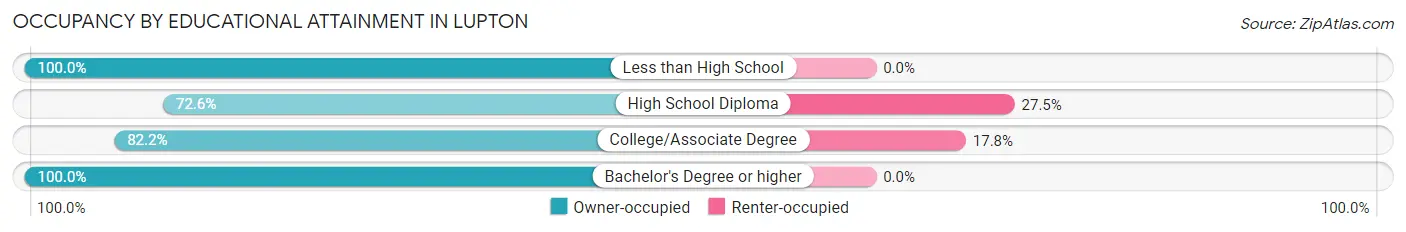
| Household Size | Owner-occupied | Renter-occupied |
| Less than High School | 11 (100.0%) | 0 (0.0%) |
| High School Diploma | 37 (72.6%) | 14 (27.5%) |
| College/Associate Degree | 37 (82.2%) | 8 (17.8%) |
| Bachelor's Degree or higher | 13 (100.0%) | 0 (0.0%) |
Occupancy by Age of Householder in Lupton
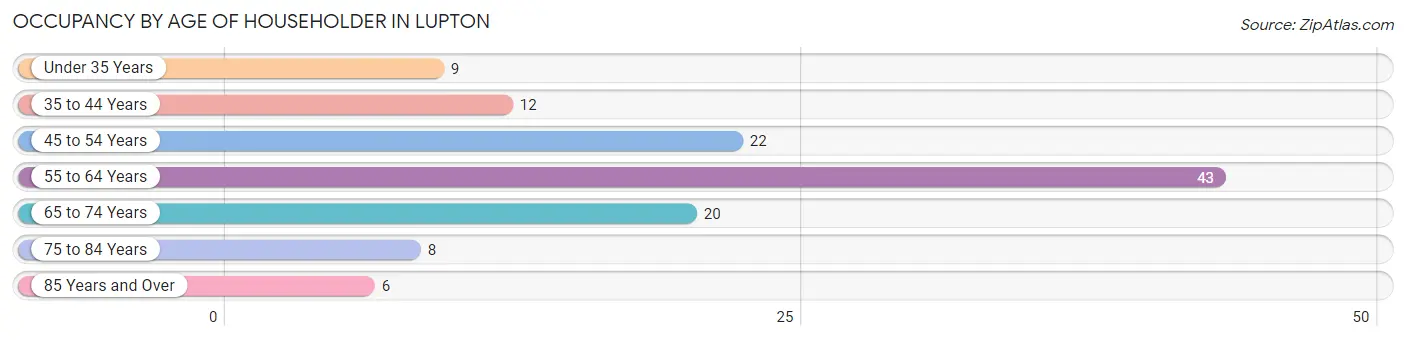
| Age Bracket | # Households | % Households |
| Under 35 Years | 9 | 7.5% |
| 35 to 44 Years | 12 | 10.0% |
| 45 to 54 Years | 22 | 18.3% |
| 55 to 64 Years | 43 | 35.8% |
| 65 to 74 Years | 20 | 16.7% |
| 75 to 84 Years | 8 | 6.7% |
| 85 Years and Over | 6 | 5.0% |
| Total | 120 | 100.0% |
Housing Finances in Lupton
Median Income by Occupancy in Lupton
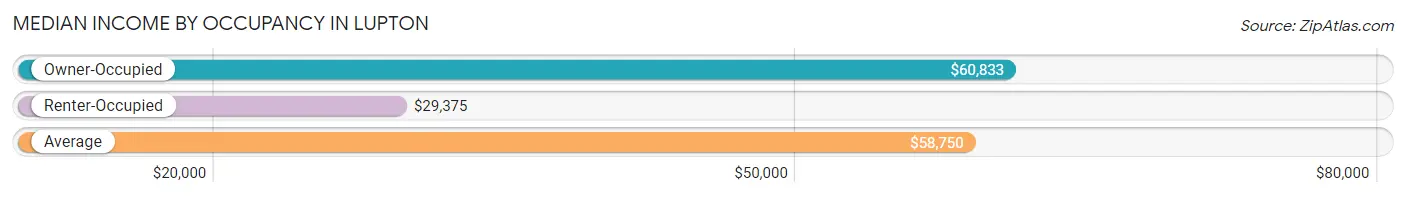
| Occupancy Type | # Households | Median Income |
| Owner-Occupied | 98 (81.7%) | $60,833 |
| Renter-Occupied | 22 (18.3%) | $29,375 |
| Average | 120 (100.0%) | $58,750 |
Occupancy by Householder Income Bracket in Lupton
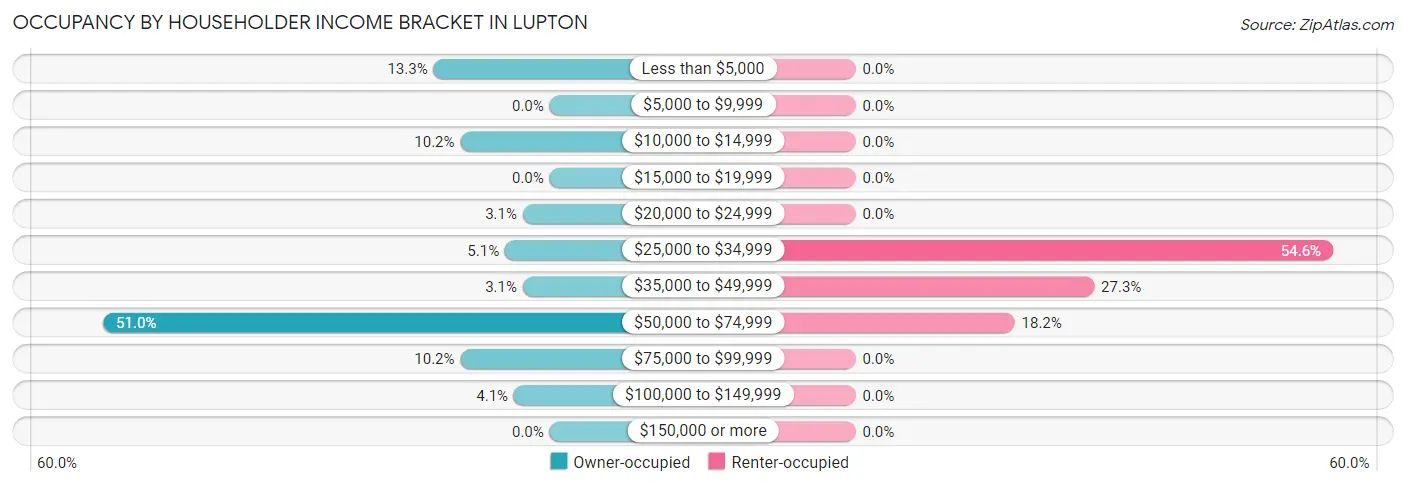
| Income Bracket | Owner-occupied | Renter-occupied |
| Less than $5,000 | 13 (13.3%) | 0 (0.0%) |
| $5,000 to $9,999 | 0 (0.0%) | 0 (0.0%) |
| $10,000 to $14,999 | 10 (10.2%) | 0 (0.0%) |
| $15,000 to $19,999 | 0 (0.0%) | 0 (0.0%) |
| $20,000 to $24,999 | 3 (3.1%) | 0 (0.0%) |
| $25,000 to $34,999 | 5 (5.1%) | 12 (54.5%) |
| $35,000 to $49,999 | 3 (3.1%) | 6 (27.3%) |
| $50,000 to $74,999 | 50 (51.0%) | 4 (18.2%) |
| $75,000 to $99,999 | 10 (10.2%) | 0 (0.0%) |
| $100,000 to $149,999 | 4 (4.1%) | 0 (0.0%) |
| $150,000 or more | 0 (0.0%) | 0 (0.0%) |
| Total | 98 (100.0%) | 22 (100.0%) |
Monthly Housing Cost Tiers in Lupton
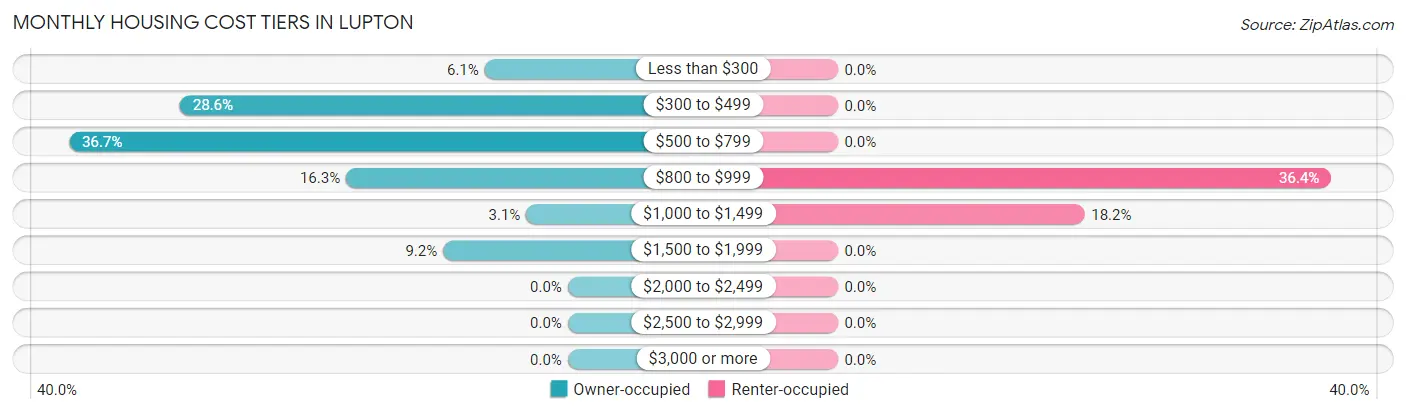
| Monthly Cost | Owner-occupied | Renter-occupied |
| Less than $300 | 6 (6.1%) | 0 (0.0%) |
| $300 to $499 | 28 (28.6%) | 0 (0.0%) |
| $500 to $799 | 36 (36.7%) | 0 (0.0%) |
| $800 to $999 | 16 (16.3%) | 8 (36.4%) |
| $1,000 to $1,499 | 3 (3.1%) | 4 (18.2%) |
| $1,500 to $1,999 | 9 (9.2%) | 0 (0.0%) |
| $2,000 to $2,499 | 0 (0.0%) | 0 (0.0%) |
| $2,500 to $2,999 | 0 (0.0%) | 0 (0.0%) |
| $3,000 or more | 0 (0.0%) | 0 (0.0%) |
| Total | 98 (100.0%) | 22 (100.0%) |
Physical Housing Characteristics in Lupton
Housing Structures in Lupton
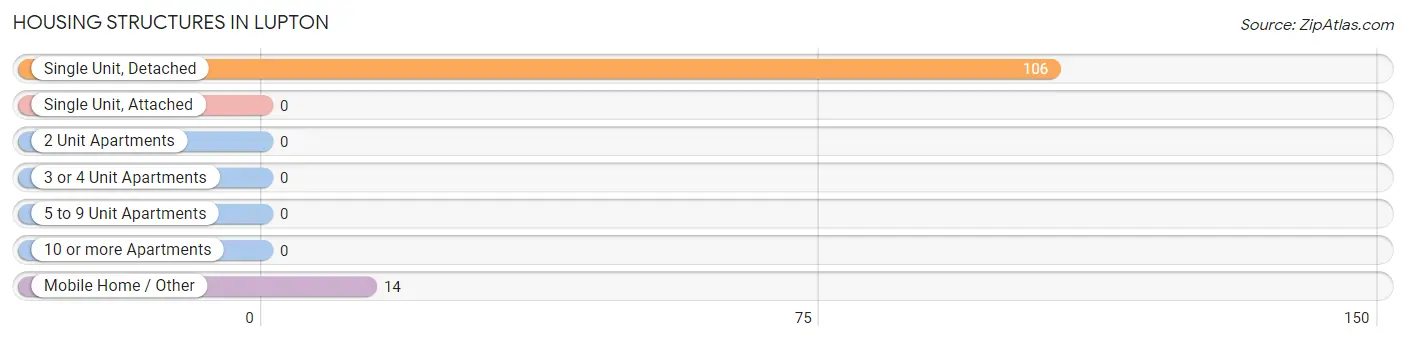
| Structure Type | # Housing Units | % Housing Units |
| Single Unit, Detached | 106 | 88.3% |
| Single Unit, Attached | 0 | 0.0% |
| 2 Unit Apartments | 0 | 0.0% |
| 3 or 4 Unit Apartments | 0 | 0.0% |
| 5 to 9 Unit Apartments | 0 | 0.0% |
| 10 or more Apartments | 0 | 0.0% |
| Mobile Home / Other | 14 | 11.7% |
| Total | 120 | 100.0% |
Housing Structures by Occupancy in Lupton
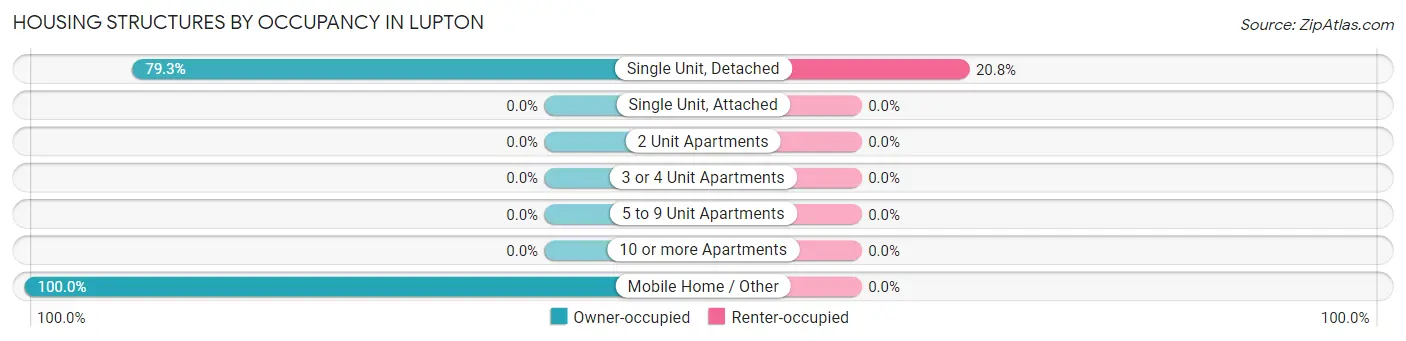
| Structure Type | Owner-occupied | Renter-occupied |
| Single Unit, Detached | 84 (79.2%) | 22 (20.7%) |
| Single Unit, Attached | 0 (0.0%) | 0 (0.0%) |
| 2 Unit Apartments | 0 (0.0%) | 0 (0.0%) |
| 3 or 4 Unit Apartments | 0 (0.0%) | 0 (0.0%) |
| 5 to 9 Unit Apartments | 0 (0.0%) | 0 (0.0%) |
| 10 or more Apartments | 0 (0.0%) | 0 (0.0%) |
| Mobile Home / Other | 14 (100.0%) | 0 (0.0%) |
| Total | 98 (81.7%) | 22 (18.3%) |
Housing Structures by Number of Rooms in Lupton
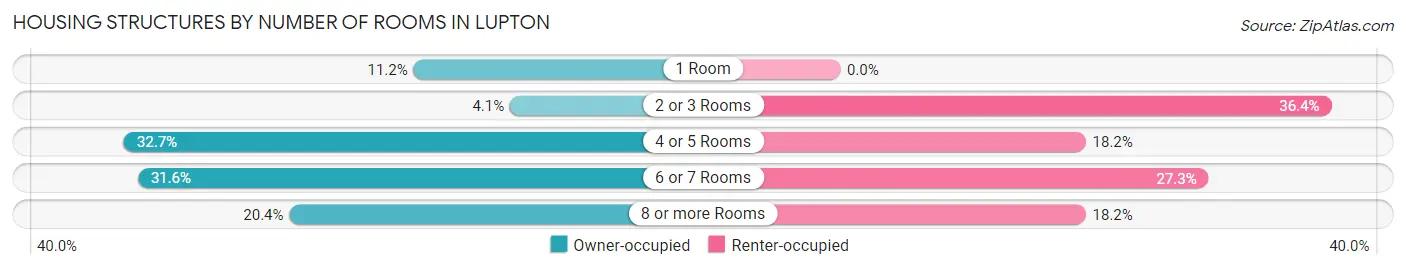
| Number of Rooms | Owner-occupied | Renter-occupied |
| 1 Room | 11 (11.2%) | 0 (0.0%) |
| 2 or 3 Rooms | 4 (4.1%) | 8 (36.4%) |
| 4 or 5 Rooms | 32 (32.7%) | 4 (18.2%) |
| 6 or 7 Rooms | 31 (31.6%) | 6 (27.3%) |
| 8 or more Rooms | 20 (20.4%) | 4 (18.2%) |
| Total | 98 (100.0%) | 22 (100.0%) |
Housing Structure by Heating Type in Lupton
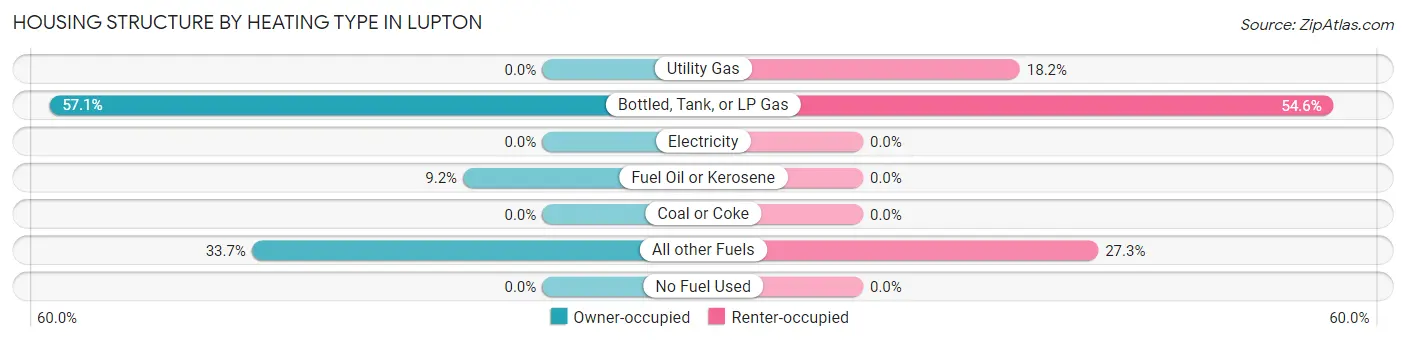
| Heating Type | Owner-occupied | Renter-occupied |
| Utility Gas | 0 (0.0%) | 4 (18.2%) |
| Bottled, Tank, or LP Gas | 56 (57.1%) | 12 (54.5%) |
| Electricity | 0 (0.0%) | 0 (0.0%) |
| Fuel Oil or Kerosene | 9 (9.2%) | 0 (0.0%) |
| Coal or Coke | 0 (0.0%) | 0 (0.0%) |
| All other Fuels | 33 (33.7%) | 6 (27.3%) |
| No Fuel Used | 0 (0.0%) | 0 (0.0%) |
| Total | 98 (100.0%) | 22 (100.0%) |
Household Vehicle Usage in Lupton
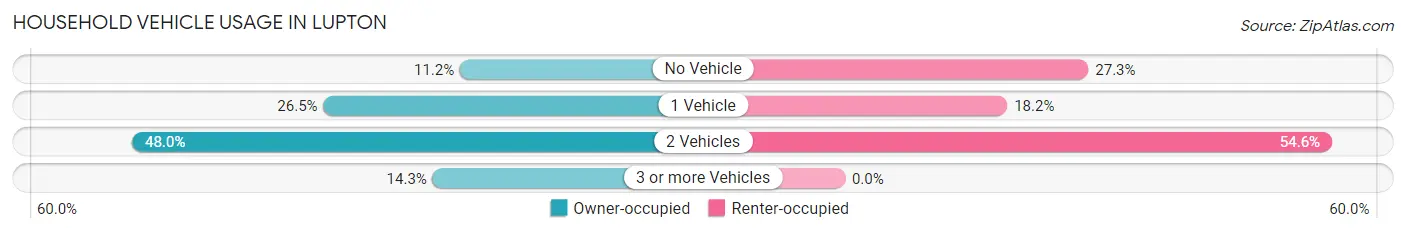
| Vehicles per Household | Owner-occupied | Renter-occupied |
| No Vehicle | 11 (11.2%) | 6 (27.3%) |
| 1 Vehicle | 26 (26.5%) | 4 (18.2%) |
| 2 Vehicles | 47 (48.0%) | 12 (54.5%) |
| 3 or more Vehicles | 14 (14.3%) | 0 (0.0%) |
| Total | 98 (100.0%) | 22 (100.0%) |
Real Estate & Mortgages in Lupton
Real Estate and Mortgage Overview in Lupton
| Characteristic | Without Mortgage | With Mortgage |
| Housing Units | 63 | 35 |
| Median Property Value | $80,500 | $99,200 |
| Median Household Income | $58,958 | $0 |
| Monthly Housing Costs | $508 | $0 |
| Real Estate Taxes | $1,208 | $0 |
Property Value by Mortgage Status in Lupton
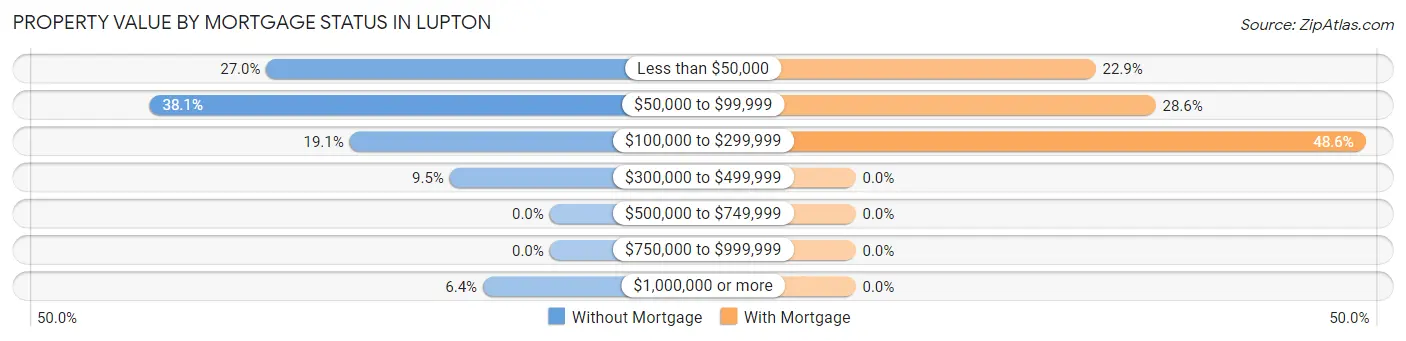
| Property Value | Without Mortgage | With Mortgage |
| Less than $50,000 | 17 (27.0%) | 8 (22.9%) |
| $50,000 to $99,999 | 24 (38.1%) | 10 (28.6%) |
| $100,000 to $299,999 | 12 (19.1%) | 17 (48.6%) |
| $300,000 to $499,999 | 6 (9.5%) | 0 (0.0%) |
| $500,000 to $749,999 | 0 (0.0%) | 0 (0.0%) |
| $750,000 to $999,999 | 0 (0.0%) | 0 (0.0%) |
| $1,000,000 or more | 4 (6.4%) | 0 (0.0%) |
| Total | 63 (100.0%) | 35 (100.0%) |
Household Income by Mortgage Status in Lupton
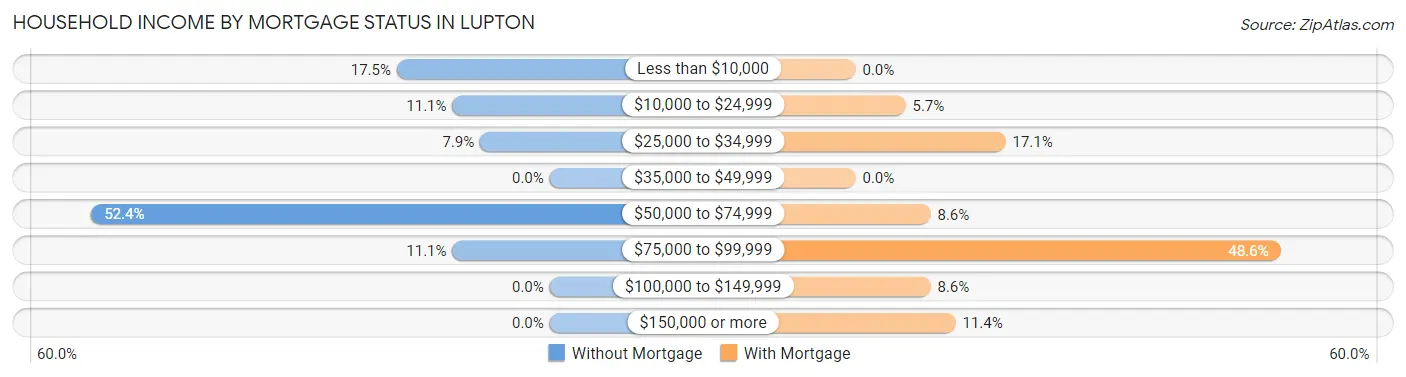
| Household Income | Without Mortgage | With Mortgage |
| Less than $10,000 | 11 (17.5%) | 0 (0.0%) |
| $10,000 to $24,999 | 7 (11.1%) | 2 (5.7%) |
| $25,000 to $34,999 | 5 (7.9%) | 6 (17.1%) |
| $35,000 to $49,999 | 0 (0.0%) | 0 (0.0%) |
| $50,000 to $74,999 | 33 (52.4%) | 3 (8.6%) |
| $75,000 to $99,999 | 7 (11.1%) | 17 (48.6%) |
| $100,000 to $149,999 | 0 (0.0%) | 3 (8.6%) |
| $150,000 or more | 0 (0.0%) | 4 (11.4%) |
| Total | 63 (100.0%) | 35 (100.0%) |
Property Value to Household Income Ratio in Lupton
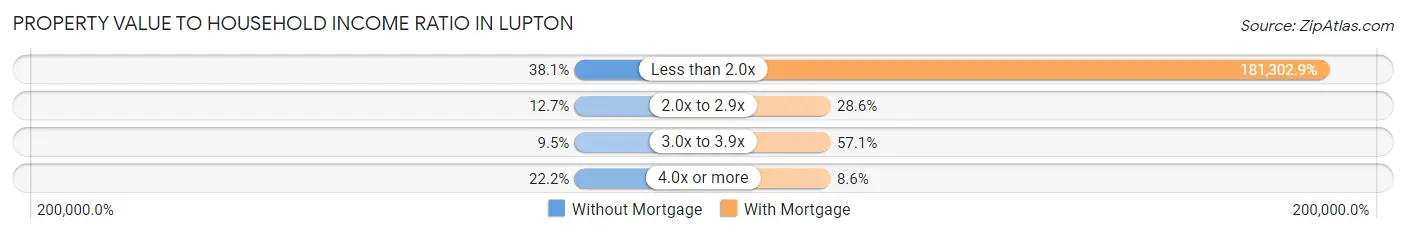
| Value-to-Income Ratio | Without Mortgage | With Mortgage |
| Less than 2.0x | 24 (38.1%) | 63,456 (181,302.9%) |
| 2.0x to 2.9x | 8 (12.7%) | 10 (28.6%) |
| 3.0x to 3.9x | 6 (9.5%) | 20 (57.1%) |
| 4.0x or more | 14 (22.2%) | 3 (8.6%) |
| Total | 63 (100.0%) | 35 (100.0%) |
Real Estate Taxes by Mortgage Status in Lupton
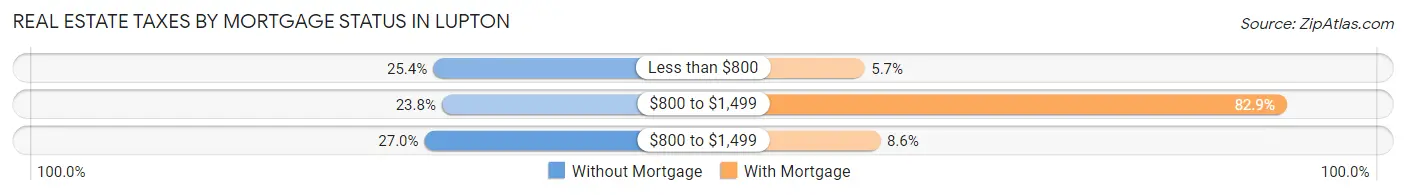
| Property Taxes | Without Mortgage | With Mortgage |
| Less than $800 | 16 (25.4%) | 2 (5.7%) |
| $800 to $1,499 | 15 (23.8%) | 29 (82.9%) |
| $800 to $1,499 | 17 (27.0%) | 3 (8.6%) |
| Total | 63 (100.0%) | 35 (100.0%) |
Health & Disability in Lupton
Health Insurance Coverage by Age in Lupton
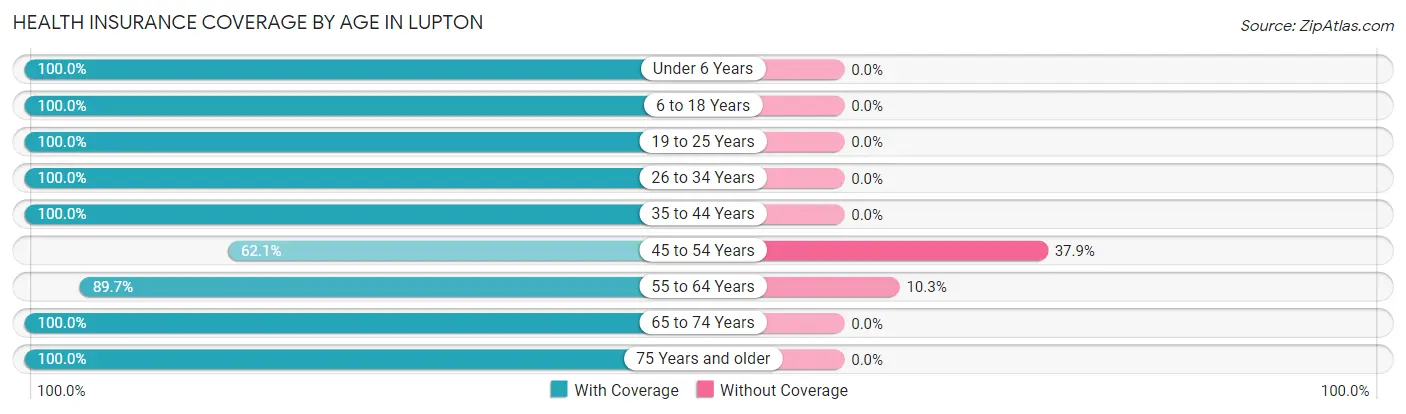
| Age Bracket | With Coverage | Without Coverage |
| Under 6 Years | 7 (100.0%) | 0 (0.0%) |
| 6 to 18 Years | 61 (100.0%) | 0 (0.0%) |
| 19 to 25 Years | 9 (100.0%) | 0 (0.0%) |
| 26 to 34 Years | 24 (100.0%) | 0 (0.0%) |
| 35 to 44 Years | 25 (100.0%) | 0 (0.0%) |
| 45 to 54 Years | 18 (62.1%) | 11 (37.9%) |
| 55 to 64 Years | 61 (89.7%) | 7 (10.3%) |
| 65 to 74 Years | 32 (100.0%) | 0 (0.0%) |
| 75 Years and older | 22 (100.0%) | 0 (0.0%) |
| Total | 259 (93.5%) | 18 (6.5%) |
Health Insurance Coverage by Citizenship Status in Lupton
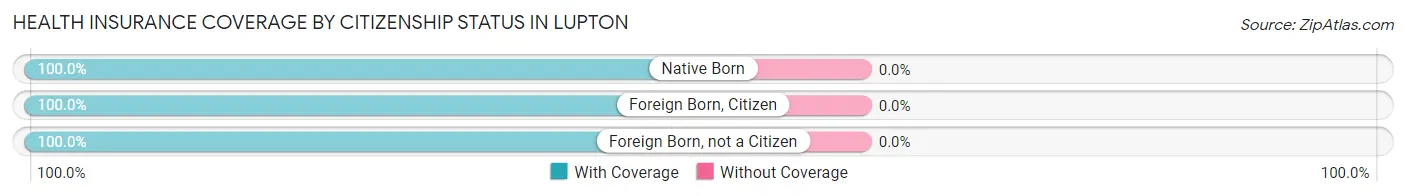
| Citizenship Status | With Coverage | Without Coverage |
| Native Born | 7 (100.0%) | 0 (0.0%) |
| Foreign Born, Citizen | 61 (100.0%) | 0 (0.0%) |
| Foreign Born, not a Citizen | 9 (100.0%) | 0 (0.0%) |
Health Insurance Coverage by Household Income in Lupton
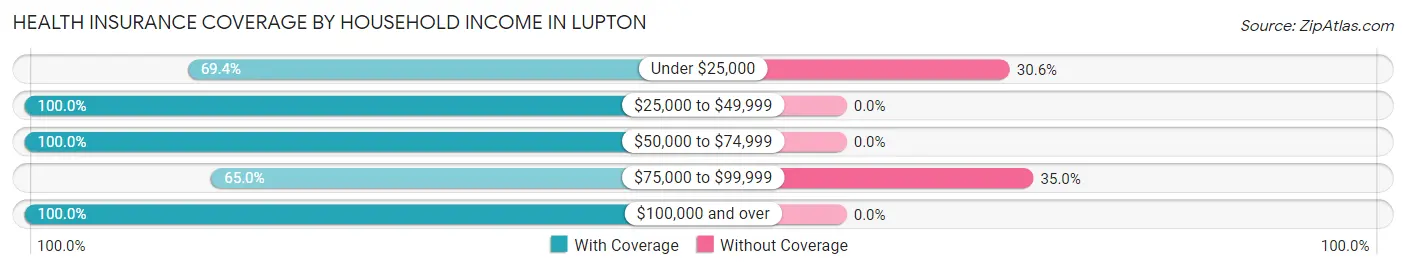
| Household Income | With Coverage | Without Coverage |
| Under $25,000 | 25 (69.4%) | 11 (30.6%) |
| $25,000 to $49,999 | 43 (100.0%) | 0 (0.0%) |
| $50,000 to $74,999 | 170 (100.0%) | 0 (0.0%) |
| $75,000 to $99,999 | 13 (65.0%) | 7 (35.0%) |
| $100,000 and over | 8 (100.0%) | 0 (0.0%) |
Public vs Private Health Insurance Coverage by Age in Lupton
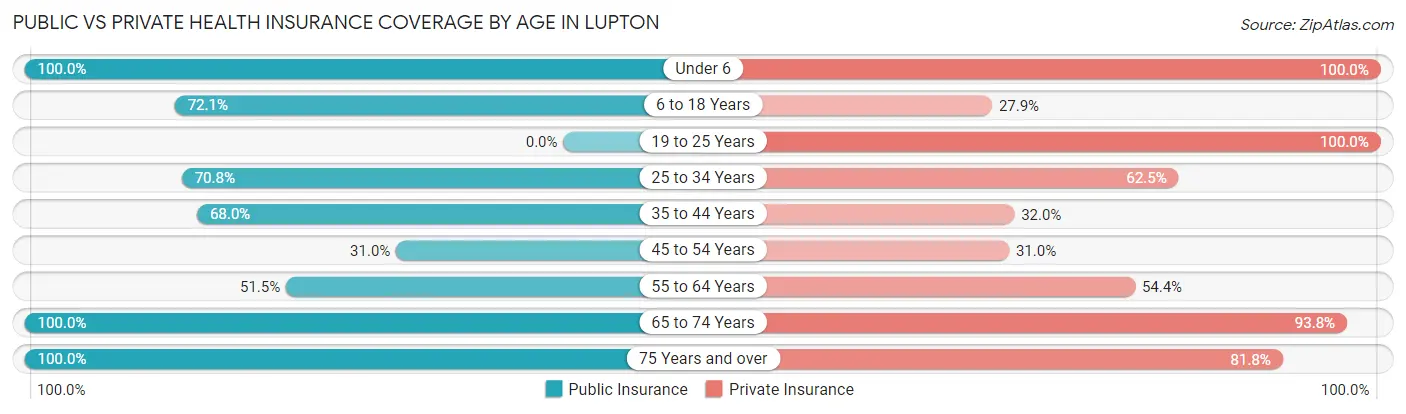
| Age Bracket | Public Insurance | Private Insurance |
| Under 6 | 7 (100.0%) | 7 (100.0%) |
| 6 to 18 Years | 44 (72.1%) | 17 (27.9%) |
| 19 to 25 Years | 0 (0.0%) | 9 (100.0%) |
| 25 to 34 Years | 17 (70.8%) | 15 (62.5%) |
| 35 to 44 Years | 17 (68.0%) | 8 (32.0%) |
| 45 to 54 Years | 9 (31.0%) | 9 (31.0%) |
| 55 to 64 Years | 35 (51.5%) | 37 (54.4%) |
| 65 to 74 Years | 32 (100.0%) | 30 (93.8%) |
| 75 Years and over | 22 (100.0%) | 18 (81.8%) |
| Total | 183 (66.1%) | 150 (54.1%) |
Disability Status by Sex by Age in Lupton
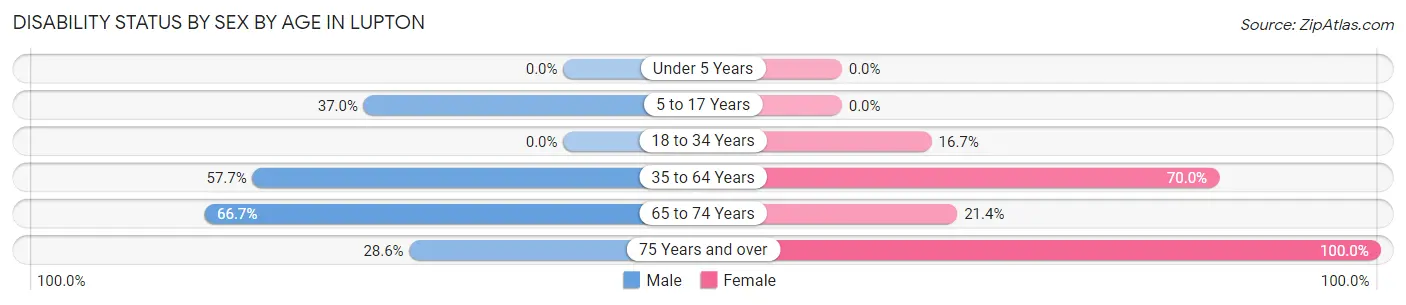
| Age Bracket | Male | Female |
| Under 5 Years | 0 (0.0%) | 0 (0.0%) |
| 5 to 17 Years | 10 (37.0%) | 0 (0.0%) |
| 18 to 34 Years | 0 (0.0%) | 3 (16.7%) |
| 35 to 64 Years | 30 (57.7%) | 49 (70.0%) |
| 65 to 74 Years | 12 (66.7%) | 3 (21.4%) |
| 75 Years and over | 4 (28.6%) | 8 (100.0%) |
Disability Class by Sex by Age in Lupton
Disability Class: Hearing Difficulty
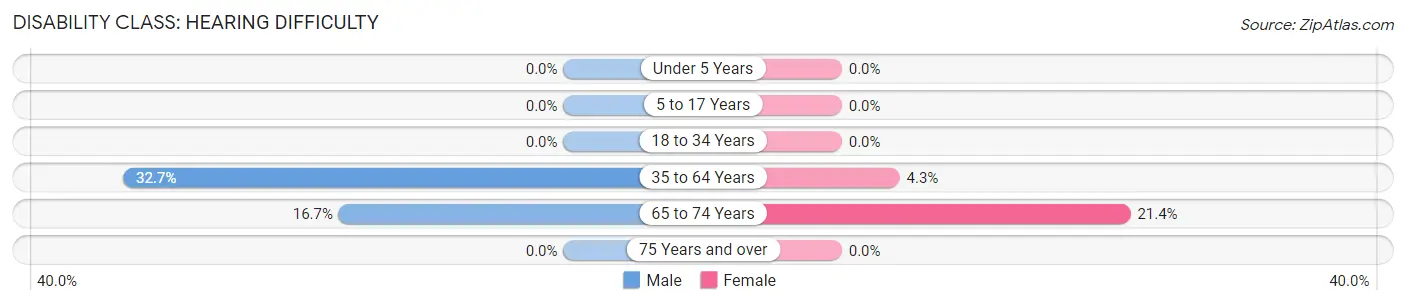
| Age Bracket | Male | Female |
| Under 5 Years | 0 (0.0%) | 0 (0.0%) |
| 5 to 17 Years | 0 (0.0%) | 0 (0.0%) |
| 18 to 34 Years | 0 (0.0%) | 0 (0.0%) |
| 35 to 64 Years | 17 (32.7%) | 3 (4.3%) |
| 65 to 74 Years | 3 (16.7%) | 3 (21.4%) |
| 75 Years and over | 0 (0.0%) | 0 (0.0%) |
Disability Class: Vision Difficulty
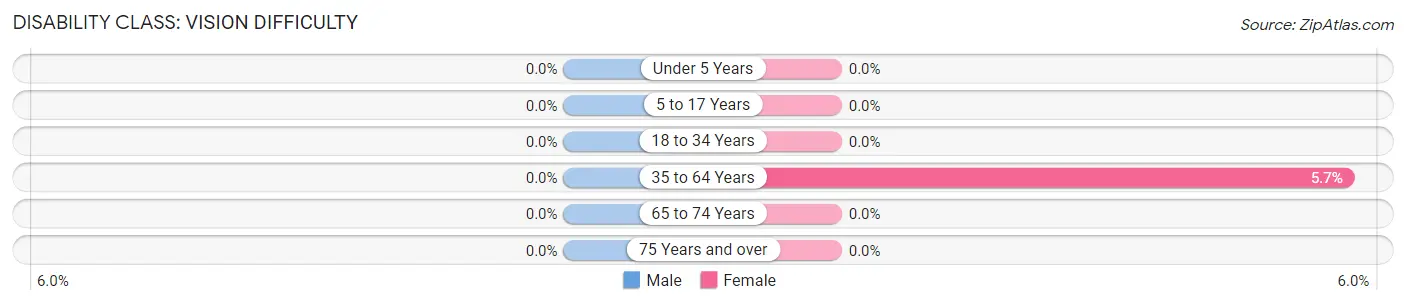
| Age Bracket | Male | Female |
| Under 5 Years | 0 (0.0%) | 0 (0.0%) |
| 5 to 17 Years | 0 (0.0%) | 0 (0.0%) |
| 18 to 34 Years | 0 (0.0%) | 0 (0.0%) |
| 35 to 64 Years | 0 (0.0%) | 4 (5.7%) |
| 65 to 74 Years | 0 (0.0%) | 0 (0.0%) |
| 75 Years and over | 0 (0.0%) | 0 (0.0%) |
Disability Class: Cognitive Difficulty
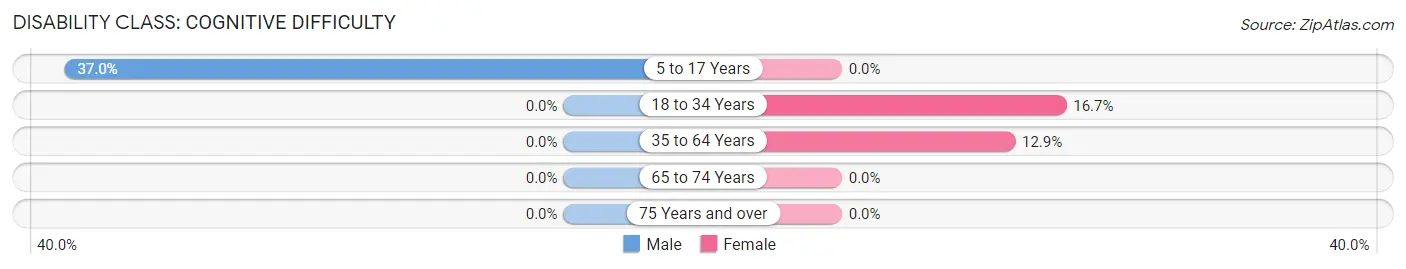
| Age Bracket | Male | Female |
| 5 to 17 Years | 10 (37.0%) | 0 (0.0%) |
| 18 to 34 Years | 0 (0.0%) | 3 (16.7%) |
| 35 to 64 Years | 0 (0.0%) | 9 (12.9%) |
| 65 to 74 Years | 0 (0.0%) | 0 (0.0%) |
| 75 Years and over | 0 (0.0%) | 0 (0.0%) |
Disability Class: Ambulatory Difficulty
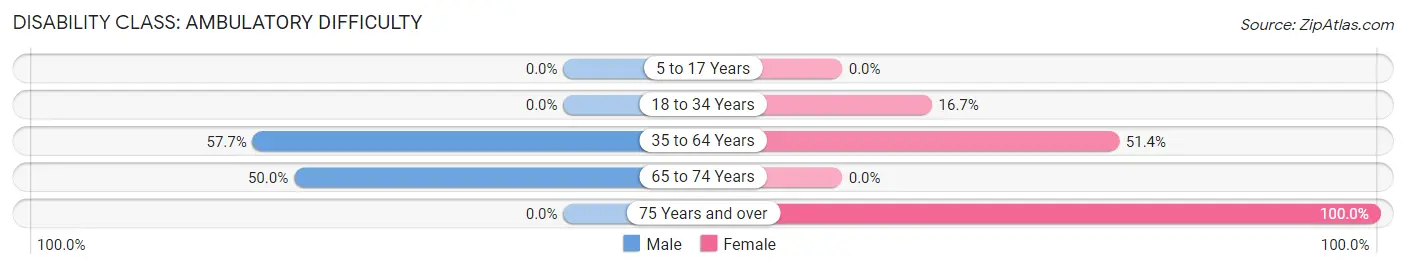
| Age Bracket | Male | Female |
| 5 to 17 Years | 0 (0.0%) | 0 (0.0%) |
| 18 to 34 Years | 0 (0.0%) | 3 (16.7%) |
| 35 to 64 Years | 30 (57.7%) | 36 (51.4%) |
| 65 to 74 Years | 9 (50.0%) | 0 (0.0%) |
| 75 Years and over | 0 (0.0%) | 8 (100.0%) |
Disability Class: Self-Care Difficulty
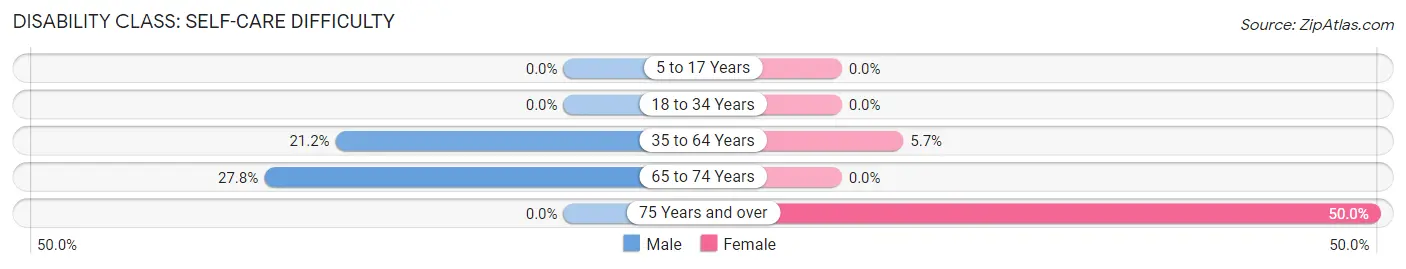
| Age Bracket | Male | Female |
| 5 to 17 Years | 0 (0.0%) | 0 (0.0%) |
| 18 to 34 Years | 0 (0.0%) | 0 (0.0%) |
| 35 to 64 Years | 11 (21.1%) | 4 (5.7%) |
| 65 to 74 Years | 5 (27.8%) | 0 (0.0%) |
| 75 Years and over | 0 (0.0%) | 4 (50.0%) |
Technology Access in Lupton
Computing Device Access in Lupton
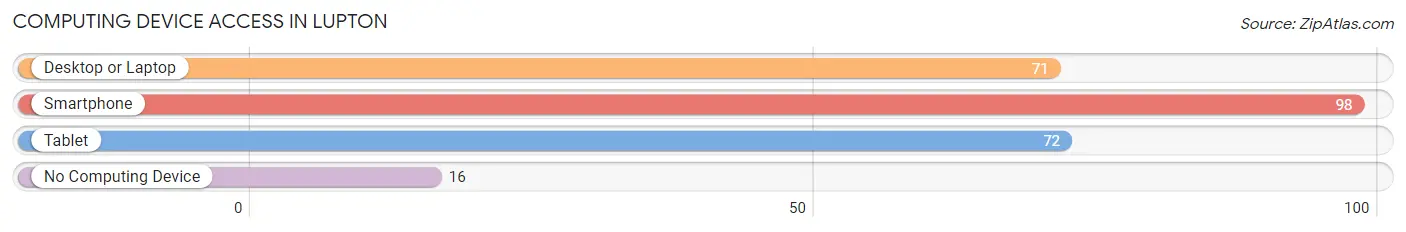
| Device Type | # Households | % Households |
| Desktop or Laptop | 71 | 59.2% |
| Smartphone | 98 | 81.7% |
| Tablet | 72 | 60.0% |
| No Computing Device | 16 | 13.3% |
| Total | 120 | 100.0% |
Internet Access in Lupton
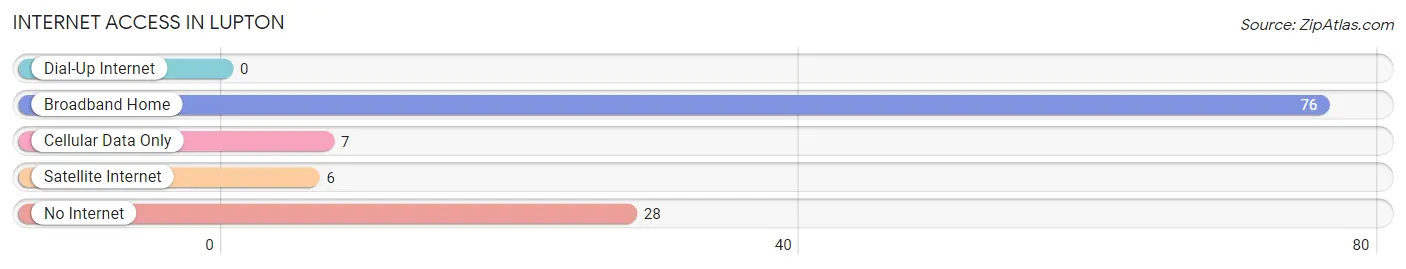
| Internet Type | # Households | % Households |
| Dial-Up Internet | 0 | 0.0% |
| Broadband Home | 76 | 63.3% |
| Cellular Data Only | 7 | 5.8% |
| Satellite Internet | 6 | 5.0% |
| No Internet | 28 | 23.3% |
| Total | 120 | 100.0% |
Lupton Summary
Lupton, Michigan is a small unincorporated community located in the northern part of the state, in the Upper Peninsula. It is situated in Menominee County, and is part of the Menominee Indian Reservation. The population of Lupton was estimated to be around 200 people in 2020.
History
The area that is now Lupton was originally inhabited by the Menominee Indians. The first European settlers arrived in the area in the late 1800s, and the community was officially founded in 1891. The town was named after the first settler, William Lupton, who was a lumberman.
The town grew quickly, and by the early 1900s, it had become a bustling lumber town. The lumber industry was the main source of employment for the town, and it was also the main source of income. The town also had a few small businesses, such as a general store, a blacksmith, and a post office.
In the 1920s, the lumber industry began to decline, and the town began to suffer economically. The population began to decline, and by the 1950s, the town was nearly abandoned. In the 1960s, the town was revitalized by the construction of a new highway, which brought new businesses and people to the area.
Geography
Lupton is located in the northern part of Michigan, in the Upper Peninsula. It is situated in Menominee County, and is part of the Menominee Indian Reservation. The town is located on the banks of the Menominee River, and is surrounded by forests and lakes.
The climate in Lupton is typical of the Upper Peninsula, with cold winters and warm summers. The average temperature in the winter is around 20 degrees Fahrenheit, and the average temperature in the summer is around 70 degrees Fahrenheit.
Economy
The economy of Lupton is largely based on tourism. The town is a popular destination for outdoor activities, such as fishing, hunting, and camping. There are also several small businesses in the town, such as restaurants, stores, and a gas station.
The town also has a few small manufacturing businesses, such as a furniture factory and a woodworking shop. The town is also home to a few small farms, which produce vegetables and livestock.
Demographics
The population of Lupton was estimated to be around 200 people in 2020. The majority of the population is white, with a small percentage of Native Americans. The median age of the population is around 40 years old. The median household income is around $40,000 per year.
The town is served by a single school district, which serves students from kindergarten through 12th grade. The town also has a few churches, a library, and a post office.
Conclusion
Lupton, Michigan is a small unincorporated community located in the northern part of the state, in the Upper Peninsula. It is situated in Menominee County, and is part of the Menominee Indian Reservation. The population of Lupton was estimated to be around 200 people in 2020. The economy of the town is largely based on tourism, and there are also several small businesses in the town. The majority of the population is white, with a small percentage of Native Americans. The median age of the population is around 40 years old, and the median household income is around $40,000 per year.
Common Questions
What is Per Capita Income in Lupton?
Per Capita income in Lupton is $21,039.
What is the Median Family Income in Lupton?
Median Family Income in Lupton is $60,313.
What is the Median Household income in Lupton?
Median Household Income in Lupton is $58,750.
What is Inequality or Gini Index in Lupton?
Inequality or Gini Index in Lupton is 0.34.
What is the Total Population of Lupton?
Total Population of Lupton is 277.
What is the Total Male Population of Lupton?
Total Male Population of Lupton is 133.
What is the Total Female Population of Lupton?
Total Female Population of Lupton is 144.
What is the Ratio of Males per 100 Females in Lupton?
There are 92.36 Males per 100 Females in Lupton.
What is the Ratio of Females per 100 Males in Lupton?
There are 108.27 Females per 100 Males in Lupton.
What is the Median Population Age in Lupton?
Median Population Age in Lupton is 52.2 Years.
What is the Average Family Size in Lupton
Average Family Size in Lupton is 2.8 People.
What is the Average Household Size in Lupton
Average Household Size in Lupton is 2.3 People.
How Large is the Labor Force in Lupton?
There are 95 People in the Labor Forcein in Lupton.
What is the Percentage of People in the Labor Force in Lupton?
38.9% of People are in the Labor Force in Lupton.
What is the Unemployment Rate in Lupton?
Unemployment Rate in Lupton is 10.5%.