Grant, MI Map & Demographics
Grant Map
Grant Overview
$22,813
PER CAPITA INCOME
$64,750
AVG FAMILY INCOME
$44,837
AVG HOUSEHOLD INCOME
16.8%
WAGE / INCOME GAP [ % ]
83.2¢/ $1
WAGE / INCOME GAP [ $ ]
$16,762
FAMILY INCOME DEFICIT
0.47
INEQUALITY / GINI INDEX
1,347
TOTAL POPULATION
574
MALE POPULATION
773
FEMALE POPULATION
74.26
MALES / 100 FEMALES
134.67
FEMALES / 100 MALES
37.9
MEDIAN AGE
3.2
AVG FAMILY SIZE
3.0
AVG HOUSEHOLD SIZE
508
LABOR FORCE [ PEOPLE ]
50.1%
PERCENT IN LABOR FORCE
11.8%
UNEMPLOYMENT RATE
Grant Zip Codes
Grant Area Codes
Income in Grant
Income Overview in Grant
Per Capita Income in Grant is $22,813, while median incomes of families and households are $64,750 and $44,837 respectively.
| Characteristic | Number | Measure |
| Per Capita Income | 1,347 | $22,813 |
| Median Family Income | 260 | $64,750 |
| Mean Family Income | 260 | $69,671 |
| Median Household Income | 455 | $44,837 |
| Mean Household Income | 455 | $63,095 |
| Income Deficit | 260 | $16,762 |
| Wage / Income Gap (%) | 1,347 | 16.80% |
| Wage / Income Gap ($) | 1,347 | 83.20¢ per $1 |
| Gini / Inequality Index | 1,347 | 0.47 |
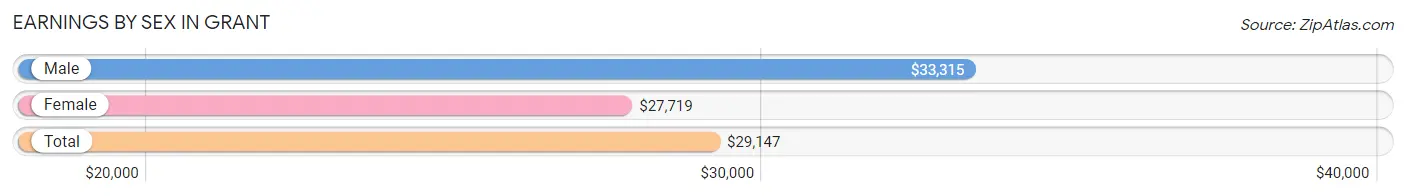
Earnings by Sex in Grant
Average Earnings in Grant are $29,147, $33,315 for men and $27,719 for women, a difference of 16.8%.
| Sex | Number | Average Earnings |
| Male | 246 (46.5%) | $33,315 |
| Female | 283 (53.5%) | $27,719 |
| Total | 529 (100.0%) | $29,147 |
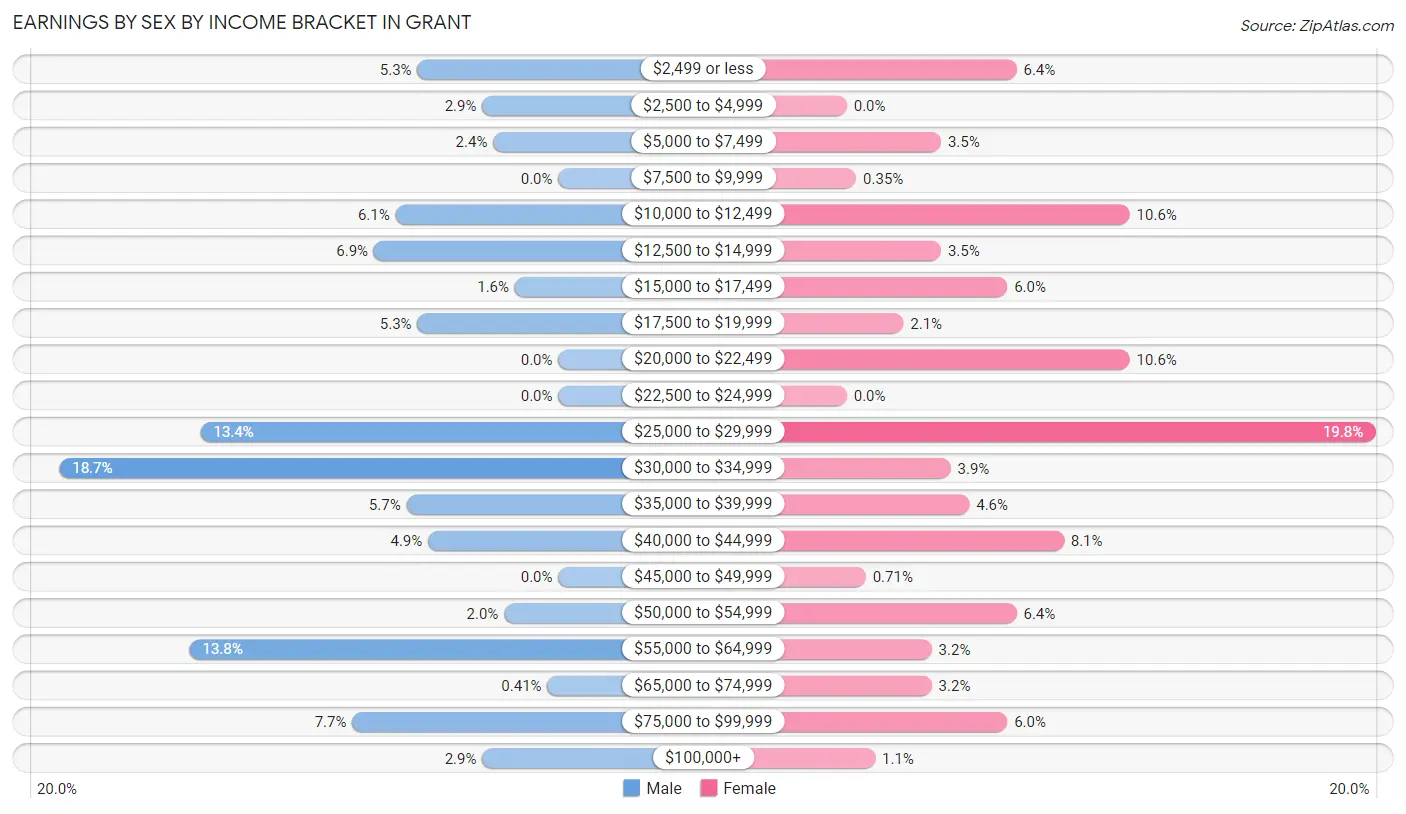
Earnings by Sex by Income Bracket in Grant
The most common earnings brackets in Grant are $30,000 to $34,999 for men (46 | 18.7%) and $25,000 to $29,999 for women (56 | 19.8%).
| Income | Male | Female |
| $2,499 or less | 13 (5.3%) | 18 (6.4%) |
| $2,500 to $4,999 | 7 (2.9%) | 0 (0.0%) |
| $5,000 to $7,499 | 6 (2.4%) | 10 (3.5%) |
| $7,500 to $9,999 | 0 (0.0%) | 1 (0.4%) |
| $10,000 to $12,499 | 15 (6.1%) | 30 (10.6%) |
| $12,500 to $14,999 | 17 (6.9%) | 10 (3.5%) |
| $15,000 to $17,499 | 4 (1.6%) | 17 (6.0%) |
| $17,500 to $19,999 | 13 (5.3%) | 6 (2.1%) |
| $20,000 to $22,499 | 0 (0.0%) | 30 (10.6%) |
| $22,500 to $24,999 | 0 (0.0%) | 0 (0.0%) |
| $25,000 to $29,999 | 33 (13.4%) | 56 (19.8%) |
| $30,000 to $34,999 | 46 (18.7%) | 11 (3.9%) |
| $35,000 to $39,999 | 14 (5.7%) | 13 (4.6%) |
| $40,000 to $44,999 | 12 (4.9%) | 23 (8.1%) |
| $45,000 to $49,999 | 0 (0.0%) | 2 (0.7%) |
| $50,000 to $54,999 | 5 (2.0%) | 18 (6.4%) |
| $55,000 to $64,999 | 34 (13.8%) | 9 (3.2%) |
| $65,000 to $74,999 | 1 (0.4%) | 9 (3.2%) |
| $75,000 to $99,999 | 19 (7.7%) | 17 (6.0%) |
| $100,000+ | 7 (2.9%) | 3 (1.1%) |
| Total | 246 (100.0%) | 283 (100.0%) |
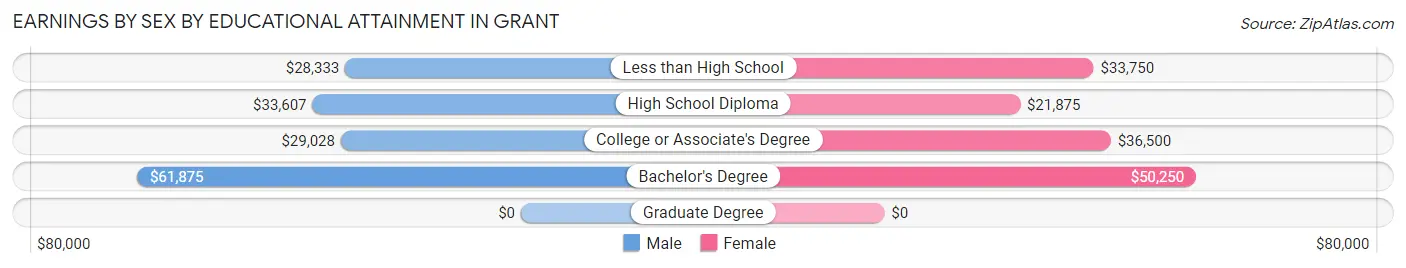
Earnings by Sex by Educational Attainment in Grant
Average earnings in Grant are $33,581 for men and $30,795 for women, a difference of 8.3%. Men with an educational attainment of bachelor's degree enjoy the highest average annual earnings of $61,875, while those with less than high school education earn the least with $28,333. Women with an educational attainment of bachelor's degree earn the most with the average annual earnings of $50,250, while those with high school diploma education have the smallest earnings of $21,875.
| Educational Attainment | Male Income | Female Income |
| Less than High School | $28,333 | $33,750 |
| High School Diploma | $33,607 | $21,875 |
| College or Associate's Degree | $29,028 | $36,500 |
| Bachelor's Degree | $61,875 | $50,250 |
| Graduate Degree | - | - |
| Total | $33,581 | $30,795 |
Family Income in Grant
Family Income Brackets in Grant
According to the Grant family income data, there are 64 families falling into the $75,000 to $99,999 income range, which is the most common income bracket and makes up 24.6% of all families.
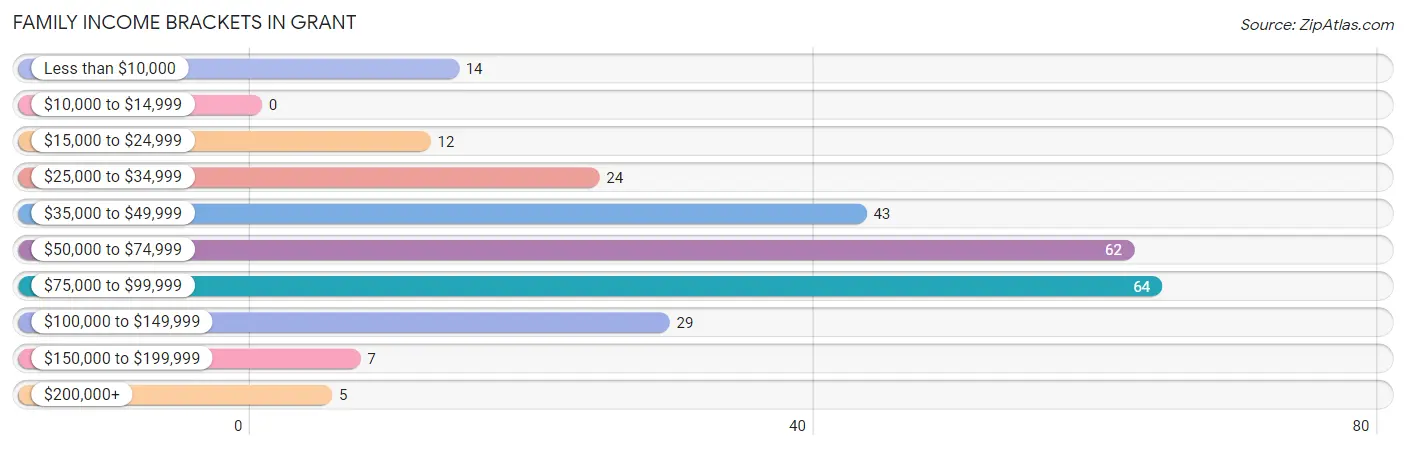
| Income Bracket | # Families | % Families |
| Less than $10,000 | 14 | 5.4% |
| $10,000 to $14,999 | 0 | 0.0% |
| $15,000 to $24,999 | 12 | 4.6% |
| $25,000 to $34,999 | 24 | 9.2% |
| $35,000 to $49,999 | 43 | 16.5% |
| $50,000 to $74,999 | 62 | 23.8% |
| $75,000 to $99,999 | 64 | 24.6% |
| $100,000 to $149,999 | 29 | 11.2% |
| $150,000 to $199,999 | 7 | 2.7% |
| $200,000+ | 5 | 1.9% |
Family Income by Famaliy Size in Grant
3-person families (79 | 30.4%) account for the highest median family income in Grant with $85,464 per family, while 2-person families (83 | 31.9%) have the highest median income of $33,958 per family member.
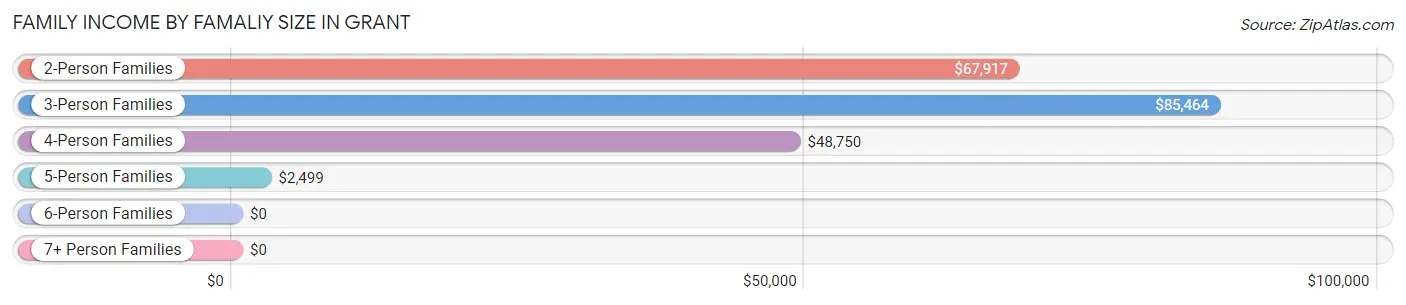
| Income Bracket | # Families | Median Income |
| 2-Person Families | 83 (31.9%) | $67,917 |
| 3-Person Families | 79 (30.4%) | $85,464 |
| 4-Person Families | 51 (19.6%) | $48,750 |
| 5-Person Families | 23 (8.8%) | $2,499 |
| 6-Person Families | 16 (6.1%) | $0 |
| 7+ Person Families | 8 (3.1%) | $0 |
| Total | 260 (100.0%) | $64,750 |
Family Income by Number of Earners in Grant
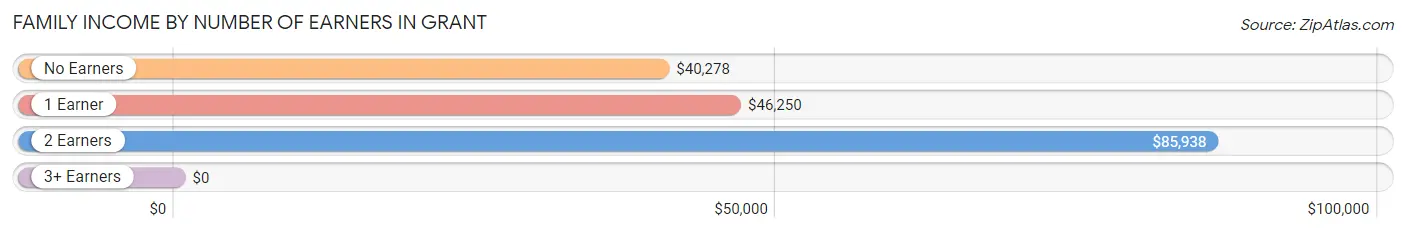
| Number of Earners | # Families | Median Income |
| No Earners | 50 (19.2%) | $40,278 |
| 1 Earner | 88 (33.9%) | $46,250 |
| 2 Earners | 108 (41.5%) | $85,938 |
| 3+ Earners | 14 (5.4%) | $0 |
| Total | 260 (100.0%) | $64,750 |
Household Income in Grant
Household Income Brackets in Grant
With 82 households falling in the category, the $75,000 to $99,999 income range is the most frequent in Grant, accounting for 18.0% of all households. In contrast, only 7 households (1.5%) fall into the $150,000 to $199,999 income bracket, making it the least populous group.
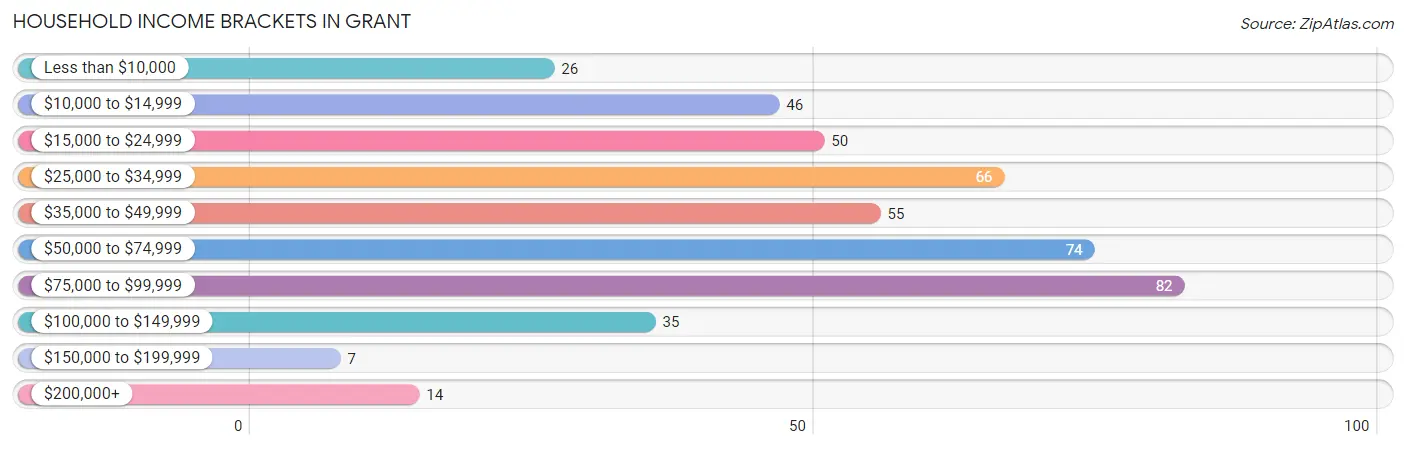
| Income Bracket | # Households | % Households |
| Less than $10,000 | 26 | 5.7% |
| $10,000 to $14,999 | 46 | 10.1% |
| $15,000 to $24,999 | 50 | 11.0% |
| $25,000 to $34,999 | 66 | 14.5% |
| $35,000 to $49,999 | 55 | 12.1% |
| $50,000 to $74,999 | 74 | 16.3% |
| $75,000 to $99,999 | 82 | 18.0% |
| $100,000 to $149,999 | 35 | 7.7% |
| $150,000 to $199,999 | 7 | 1.5% |
| $200,000+ | 14 | 3.1% |
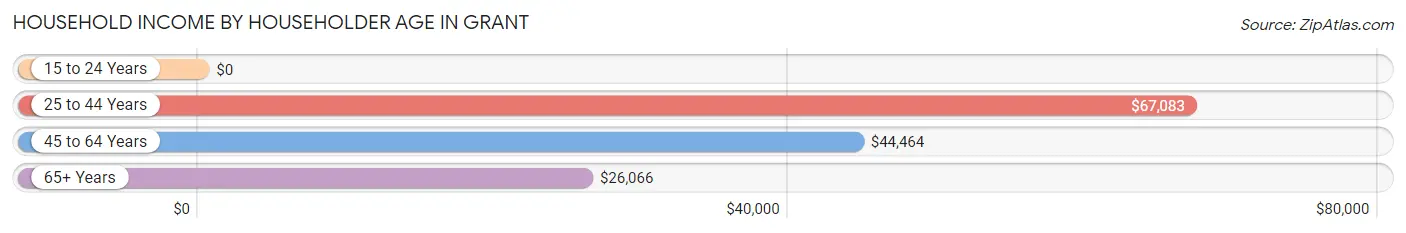
Household Income by Householder Age in Grant
The median household income in Grant is $44,837, with the highest median household income of $67,083 found in the 25 to 44 years age bracket for the primary householder. A total of 185 households (40.7%) fall into this category. Meanwhile, the 15 to 24 years age bracket for the primary householder has the lowest median household income of $0, with 26 households (5.7%) in this group.
| Income Bracket | # Households | Median Income |
| 15 to 24 Years | 26 (5.7%) | $0 |
| 25 to 44 Years | 185 (40.7%) | $67,083 |
| 45 to 64 Years | 79 (17.4%) | $44,464 |
| 65+ Years | 165 (36.3%) | $26,066 |
| Total | 455 (100.0%) | $44,837 |
Poverty in Grant
Income Below Poverty by Sex and Age in Grant
With 18.1% poverty level for males and 26.8% for females among the residents of Grant, 15 year old males and under 5 year old females are the most vulnerable to poverty, with 2 males (100.0%) and 27 females (38.0%) in their respective age groups living below the poverty level.
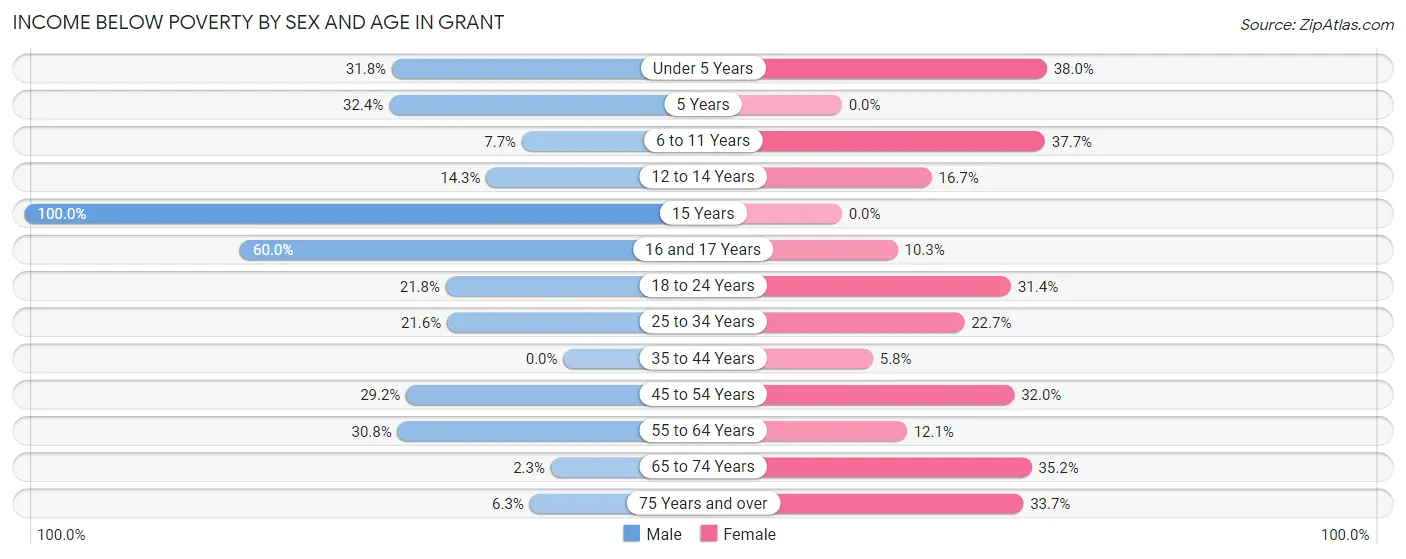
| Age Bracket | Male | Female |
| Under 5 Years | 14 (31.8%) | 27 (38.0%) |
| 5 Years | 22 (32.4%) | 0 (0.0%) |
| 6 to 11 Years | 3 (7.7%) | 23 (37.7%) |
| 12 to 14 Years | 4 (14.3%) | 3 (16.7%) |
| 15 Years | 2 (100.0%) | 0 (0.0%) |
| 16 and 17 Years | 6 (60.0%) | 3 (10.3%) |
| 18 to 24 Years | 12 (21.8%) | 27 (31.4%) |
| 25 to 34 Years | 19 (21.6%) | 10 (22.7%) |
| 35 to 44 Years | 0 (0.0%) | 5 (5.8%) |
| 45 to 54 Years | 7 (29.2%) | 8 (32.0%) |
| 55 to 64 Years | 8 (30.8%) | 10 (12.0%) |
| 65 to 74 Years | 1 (2.3%) | 25 (35.2%) |
| 75 Years and over | 6 (6.2%) | 66 (33.7%) |
| Total | 104 (18.1%) | 207 (26.8%) |
Income Above Poverty by Sex and Age in Grant
According to the poverty statistics in Grant, males aged 35 to 44 years and females aged 15 years are the age groups that are most secure financially, with 100.0% of males and 100.0% of females in these age groups living above the poverty line.
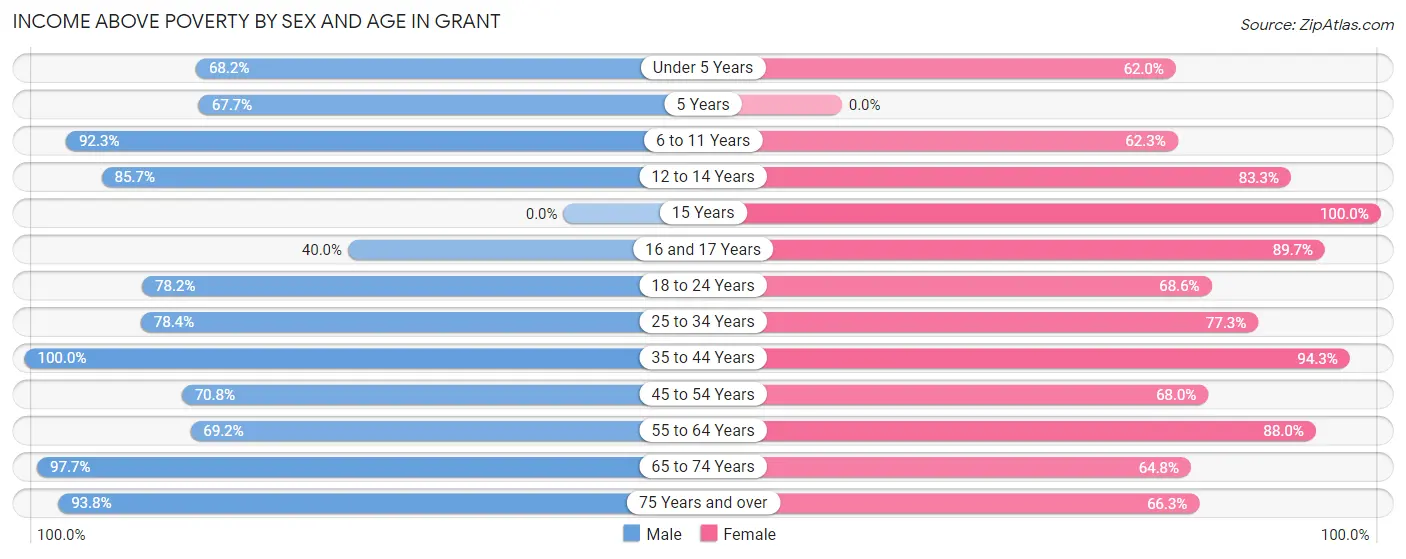
| Age Bracket | Male | Female |
| Under 5 Years | 30 (68.2%) | 44 (62.0%) |
| 5 Years | 46 (67.6%) | 0 (0.0%) |
| 6 to 11 Years | 36 (92.3%) | 38 (62.3%) |
| 12 to 14 Years | 24 (85.7%) | 15 (83.3%) |
| 15 Years | 0 (0.0%) | 2 (100.0%) |
| 16 and 17 Years | 4 (40.0%) | 26 (89.7%) |
| 18 to 24 Years | 43 (78.2%) | 59 (68.6%) |
| 25 to 34 Years | 69 (78.4%) | 34 (77.3%) |
| 35 to 44 Years | 51 (100.0%) | 82 (94.3%) |
| 45 to 54 Years | 17 (70.8%) | 17 (68.0%) |
| 55 to 64 Years | 18 (69.2%) | 73 (87.9%) |
| 65 to 74 Years | 42 (97.7%) | 46 (64.8%) |
| 75 Years and over | 90 (93.8%) | 130 (66.3%) |
| Total | 470 (81.9%) | 566 (73.2%) |
Income Below Poverty Among Married-Couple Families in Grant
The poverty statistics for married-couple families in Grant show that 11.3% or 18 of the total 160 families live below the poverty line. Families with 5 or more children have the highest poverty rate of 100.0%, comprising of 8 families. On the other hand, families with no children have the lowest poverty rate of 0.0%, which includes 0 families.
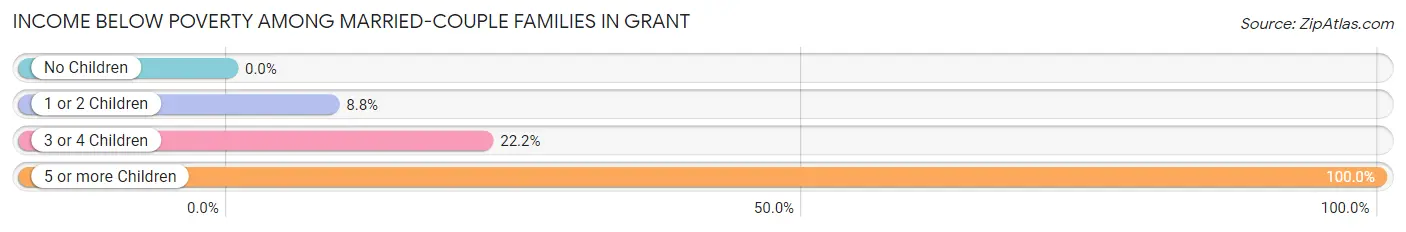
| Children | Above Poverty | Below Poverty |
| No Children | 66 (100.0%) | 0 (0.0%) |
| 1 or 2 Children | 62 (91.2%) | 6 (8.8%) |
| 3 or 4 Children | 14 (77.8%) | 4 (22.2%) |
| 5 or more Children | 0 (0.0%) | 8 (100.0%) |
| Total | 142 (88.7%) | 18 (11.3%) |
Income Below Poverty Among Single-Parent Households in Grant
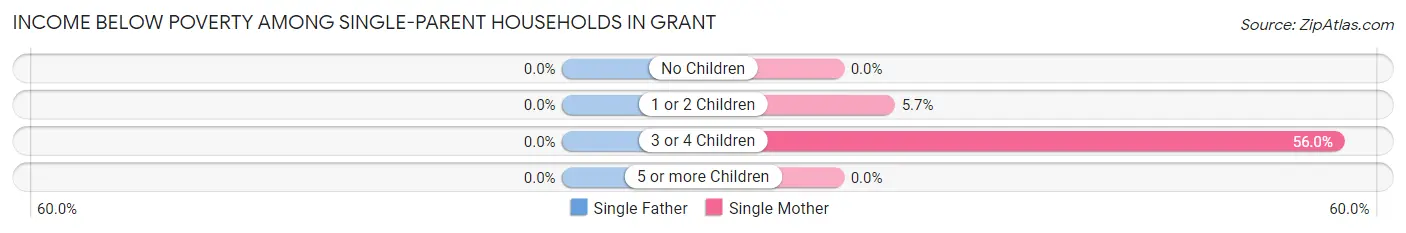
| Children | Single Father | Single Mother |
| No Children | 0 (0.0%) | 0 (0.0%) |
| 1 or 2 Children | 0 (0.0%) | 2 (5.7%) |
| 3 or 4 Children | 0 (0.0%) | 14 (56.0%) |
| 5 or more Children | 0 (0.0%) | 0 (0.0%) |
| Total | 0 (0.0%) | 16 (21.0%) |
Income Below Poverty Among Married-Couple vs Single-Parent Households in Grant
The poverty data for Grant shows that 18 of the married-couple family households (11.3%) and 16 of the single-parent households (16.0%) are living below the poverty level. Within the married-couple family households, those with 5 or more children have the highest poverty rate, with 8 households (100.0%) falling below the poverty line. Among the single-parent households, those with 3 or 4 children have the highest poverty rate, with 14 household (40.0%) living below poverty.
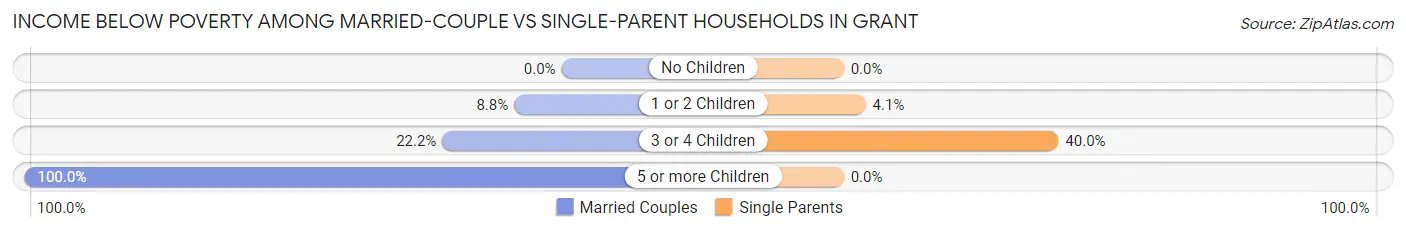
| Children | Married-Couple Families | Single-Parent Households |
| No Children | 0 (0.0%) | 0 (0.0%) |
| 1 or 2 Children | 6 (8.8%) | 2 (4.1%) |
| 3 or 4 Children | 4 (22.2%) | 14 (40.0%) |
| 5 or more Children | 8 (100.0%) | 0 (0.0%) |
| Total | 18 (11.3%) | 16 (16.0%) |
Race in Grant
The most populous races in Grant are White / Caucasian (1,239 | 92.0%), Hispanic or Latino (283 | 21.0%), and Two or more Races (72 | 5.3%).
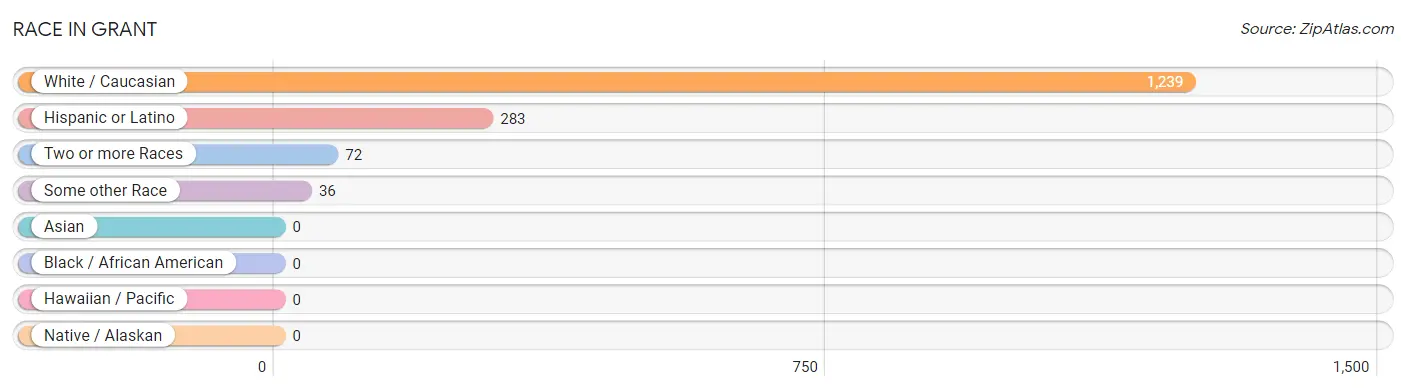
| Race | # Population | % Population |
| Asian | 0 | 0.0% |
| Black / African American | 0 | 0.0% |
| Hawaiian / Pacific | 0 | 0.0% |
| Hispanic or Latino | 283 | 21.0% |
| Native / Alaskan | 0 | 0.0% |
| White / Caucasian | 1,239 | 92.0% |
| Two or more Races | 72 | 5.3% |
| Some other Race | 36 | 2.7% |
| Total | 1,347 | 100.0% |
Ancestry in Grant
The most populous ancestries reported in Grant are Mexican (220 | 16.3%), German (189 | 14.0%), Irish (173 | 12.8%), French (133 | 9.9%), and English (93 | 6.9%), together accounting for 60.0% of all Grant residents.
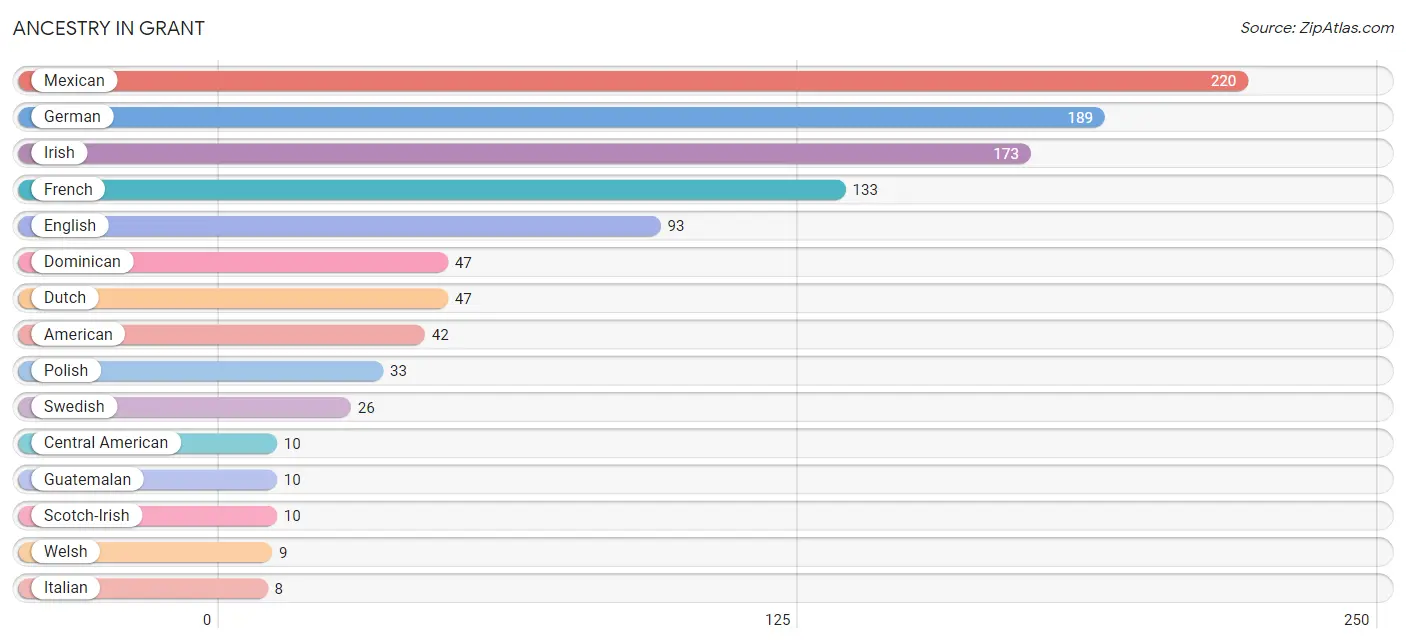
| Ancestry | # Population | % Population |
| American | 42 | 3.1% |
| Arab | 5 | 0.4% |
| Australian | 2 | 0.2% |
| Belgian | 7 | 0.5% |
| Central American | 10 | 0.7% |
| Cherokee | 5 | 0.4% |
| Danish | 6 | 0.4% |
| Dominican | 47 | 3.5% |
| Dutch | 47 | 3.5% |
| English | 93 | 6.9% |
| French | 133 | 9.9% |
| German | 189 | 14.0% |
| Guatemalan | 10 | 0.7% |
| Iranian | 2 | 0.2% |
| Irish | 173 | 12.8% |
| Italian | 8 | 0.6% |
| Lebanese | 5 | 0.4% |
| Lithuanian | 3 | 0.2% |
| Maltese | 3 | 0.2% |
| Mexican | 220 | 16.3% |
| Northern European | 2 | 0.2% |
| Polish | 33 | 2.5% |
| Russian | 1 | 0.1% |
| Scotch-Irish | 10 | 0.7% |
| Scottish | 7 | 0.5% |
| Spaniard | 1 | 0.1% |
| Spanish | 5 | 0.4% |
| Swedish | 26 | 1.9% |
| Welsh | 9 | 0.7% | View All 29 Rows |
Immigrants in Grant
The most numerous immigrant groups reported in Grant came from Latin America (41 | 3.0%), Central America (29 | 2.1%), Mexico (21 | 1.6%), Caribbean (12 | 0.9%), and Dominican Republic (12 | 0.9%), together accounting for 8.5% of all Grant residents.
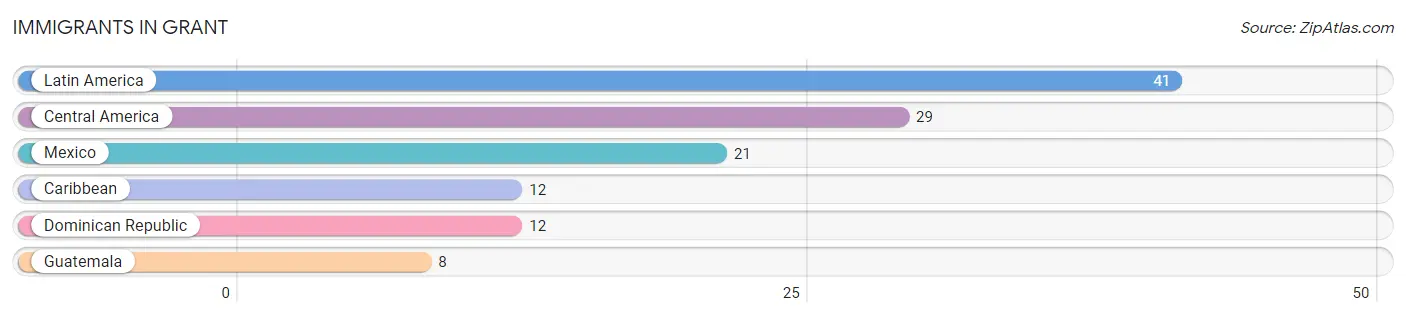
| Immigration Origin | # Population | % Population |
| Caribbean | 12 | 0.9% |
| Central America | 29 | 2.1% |
| Dominican Republic | 12 | 0.9% |
| Guatemala | 8 | 0.6% |
| Latin America | 41 | 3.0% |
| Mexico | 21 | 1.6% | View All 6 Rows |
Sex and Age in Grant
Sex and Age in Grant
The most populous age groups in Grant are 5 to 9 Years (94 | 16.4%) for men and 85 Years and over (87 | 11.3%) for women.
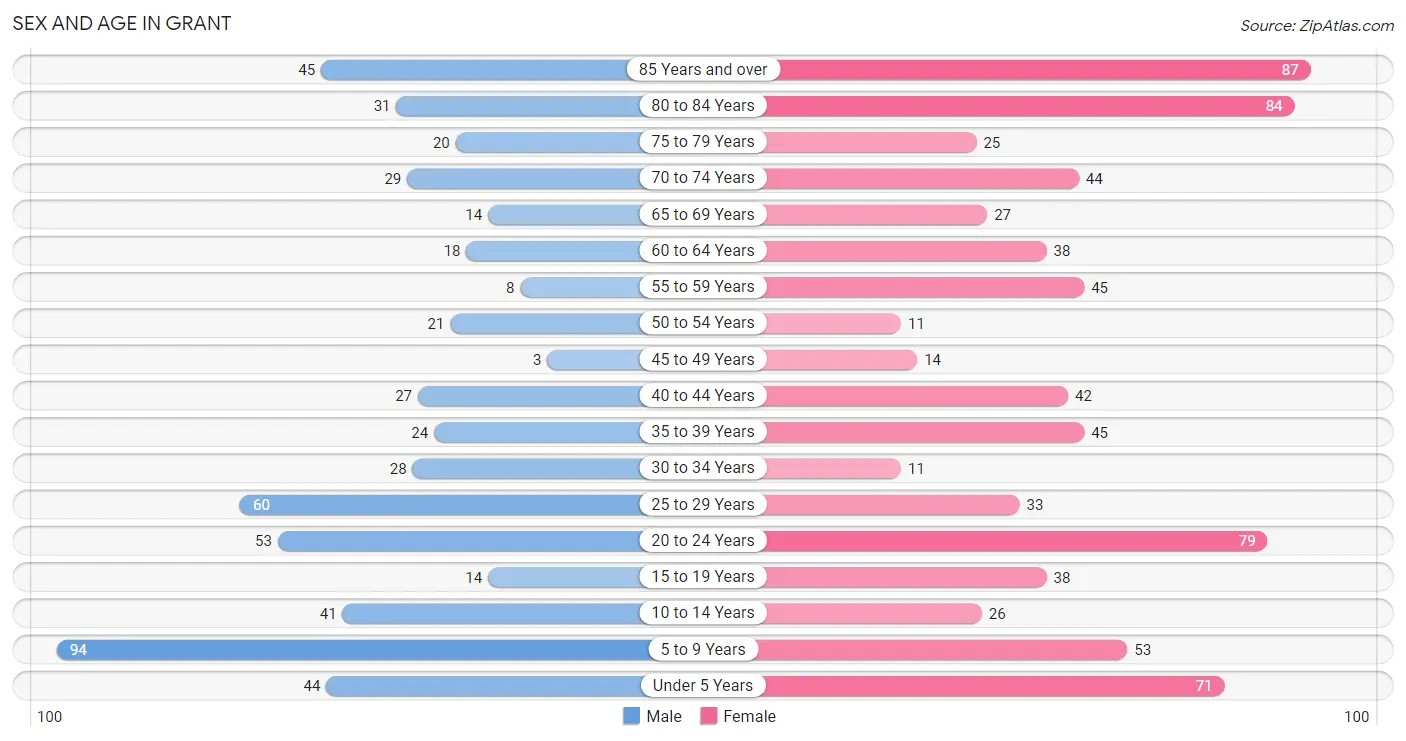
| Age Bracket | Male | Female |
| Under 5 Years | 44 (7.7%) | 71 (9.2%) |
| 5 to 9 Years | 94 (16.4%) | 53 (6.9%) |
| 10 to 14 Years | 41 (7.1%) | 26 (3.4%) |
| 15 to 19 Years | 14 (2.4%) | 38 (4.9%) |
| 20 to 24 Years | 53 (9.2%) | 79 (10.2%) |
| 25 to 29 Years | 60 (10.4%) | 33 (4.3%) |
| 30 to 34 Years | 28 (4.9%) | 11 (1.4%) |
| 35 to 39 Years | 24 (4.2%) | 45 (5.8%) |
| 40 to 44 Years | 27 (4.7%) | 42 (5.4%) |
| 45 to 49 Years | 3 (0.5%) | 14 (1.8%) |
| 50 to 54 Years | 21 (3.7%) | 11 (1.4%) |
| 55 to 59 Years | 8 (1.4%) | 45 (5.8%) |
| 60 to 64 Years | 18 (3.1%) | 38 (4.9%) |
| 65 to 69 Years | 14 (2.4%) | 27 (3.5%) |
| 70 to 74 Years | 29 (5.1%) | 44 (5.7%) |
| 75 to 79 Years | 20 (3.5%) | 25 (3.2%) |
| 80 to 84 Years | 31 (5.4%) | 84 (10.9%) |
| 85 Years and over | 45 (7.8%) | 87 (11.3%) |
| Total | 574 (100.0%) | 773 (100.0%) |
Families and Households in Grant
Median Family Size in Grant
The median family size in Grant is 3.25 persons per family, with single male/father families (24 | 9.2%) accounting for the largest median family size of 4.33 persons per family. On the other hand, married-couple families (160 | 61.5%) represent the smallest median family size with 3.08 persons per family.
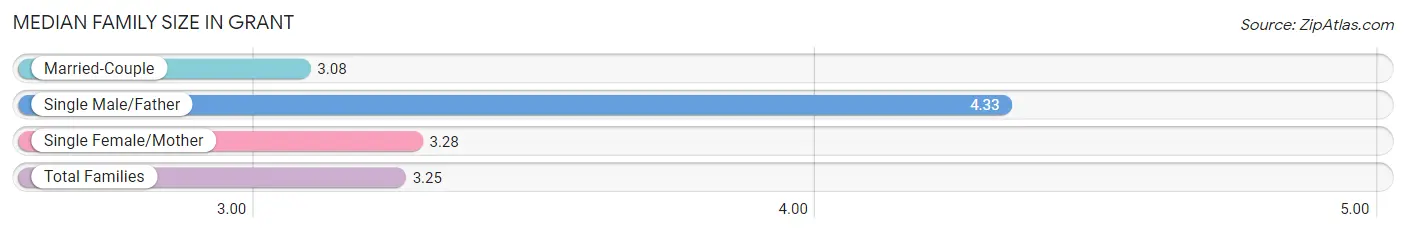
| Family Type | # Families | Family Size |
| Married-Couple | 160 (61.5%) | 3.08 |
| Single Male/Father | 24 (9.2%) | 4.33 |
| Single Female/Mother | 76 (29.2%) | 3.28 |
| Total Families | 260 (100.0%) | 3.25 |
Median Household Size in Grant
The median household size in Grant is 2.95 persons per household, with single male/father households (24 | 5.3%) accounting for the largest median household size of 6.04 persons per household. non-family households (195 | 42.9%) represent the smallest median household size with 2.19 persons per household.
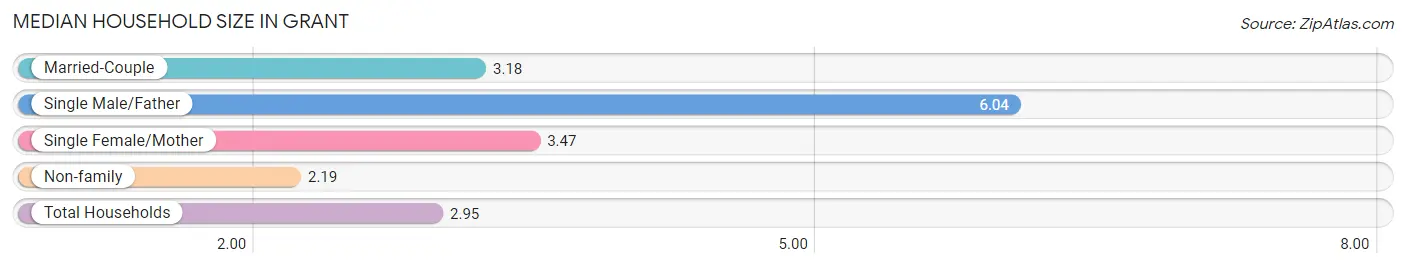
| Household Type | # Households | Household Size |
| Married-Couple | 160 (35.2%) | 3.18 |
| Single Male/Father | 24 (5.3%) | 6.04 |
| Single Female/Mother | 76 (16.7%) | 3.47 |
| Non-family | 195 (42.9%) | 2.19 |
| Total Households | 455 (100.0%) | 2.95 |
Household Size by Marriage Status in Grant
Out of a total of 455 households in Grant, 260 (57.1%) are family households, while 195 (42.9%) are nonfamily households. The most numerous type of family households are 2-person households, comprising 76, and the most common type of nonfamily households are 1-person households, comprising 170.
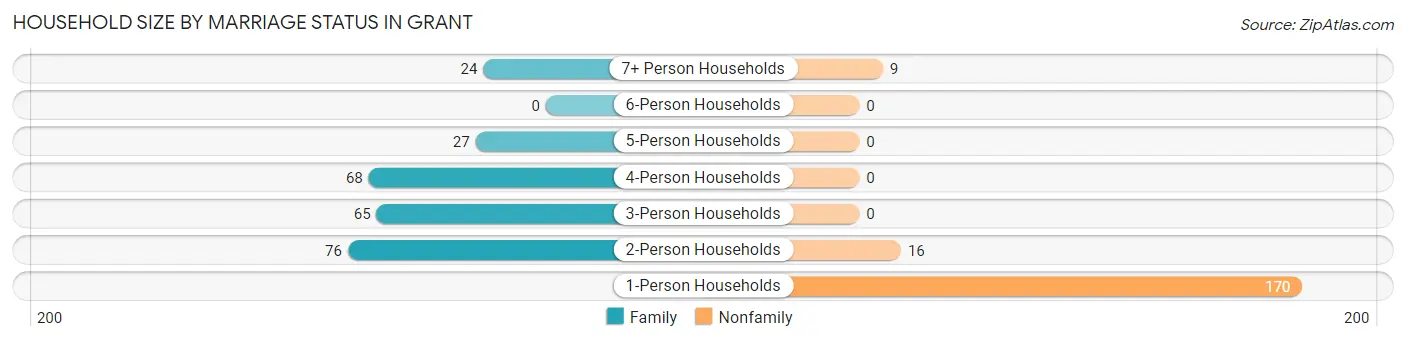
| Household Size | Family Households | Nonfamily Households |
| 1-Person Households | - | 170 (37.4%) |
| 2-Person Households | 76 (16.7%) | 16 (3.5%) |
| 3-Person Households | 65 (14.3%) | 0 (0.0%) |
| 4-Person Households | 68 (14.9%) | 0 (0.0%) |
| 5-Person Households | 27 (5.9%) | 0 (0.0%) |
| 6-Person Households | 0 (0.0%) | 0 (0.0%) |
| 7+ Person Households | 24 (5.3%) | 9 (2.0%) |
| Total | 260 (57.1%) | 195 (42.9%) |
Female Fertility in Grant
Fertility by Age in Grant
Average fertility rate in Grant is 133.0 births per 1,000 women. Women in the age bracket of 20 to 34 years have the highest fertility rate with 293.0 births per 1,000 women. Women in the age bracket of 20 to 34 years acount for 100.0% of all women with births.
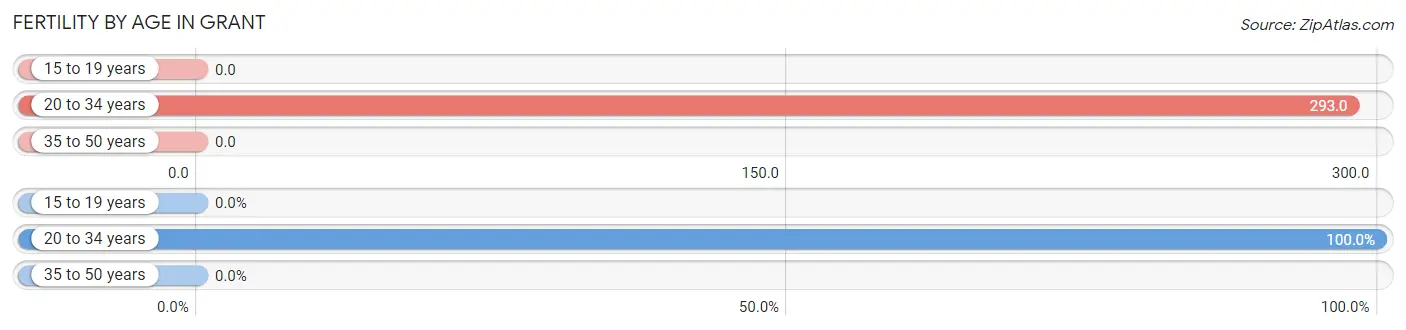
| Age Bracket | Women with Births | Births / 1,000 Women |
| 15 to 19 years | 0 (0.0%) | 0.0 |
| 20 to 34 years | 36 (100.0%) | 293.0 |
| 35 to 50 years | 0 (0.0%) | 0.0 |
| Total | 36 (100.0%) | 133.0 |
Fertility by Age by Marriage Status in Grant
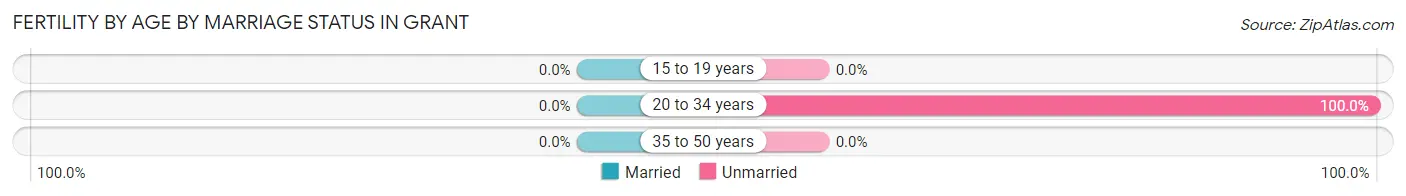
| Age Bracket | Married | Unmarried |
| 15 to 19 years | 0 (0.0%) | 0 (0.0%) |
| 20 to 34 years | 0 (0.0%) | 36 (100.0%) |
| 35 to 50 years | 0 (0.0%) | 0 (0.0%) |
| Total | 0 (0.0%) | 36 (100.0%) |
Fertility by Education in Grant
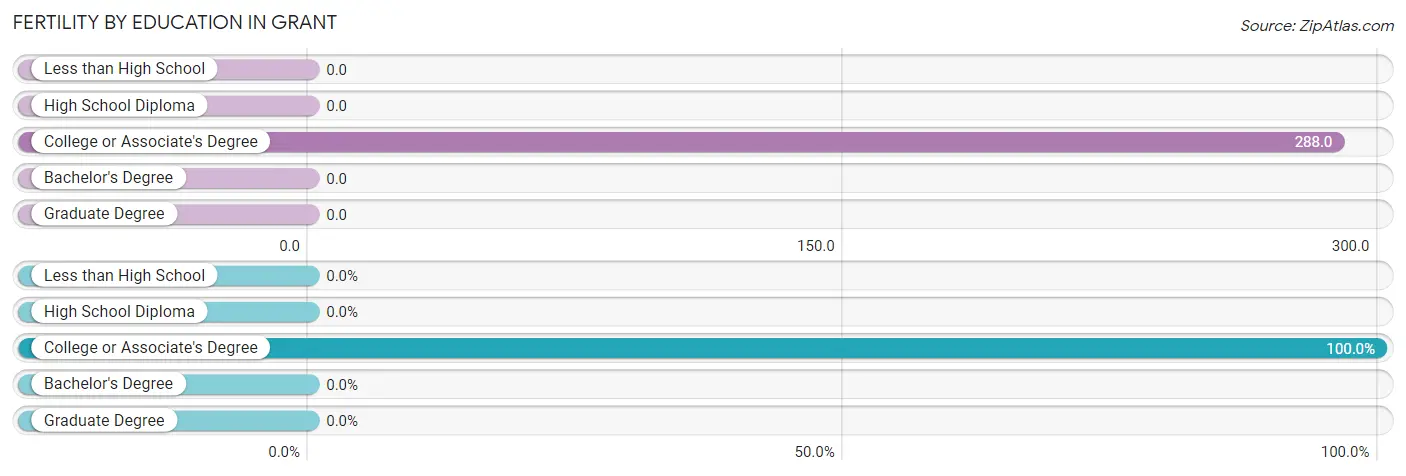
| Educational Attainment | Women with Births | Births / 1,000 Women |
| Less than High School | 0 (0.0%) | 0.0 |
| High School Diploma | 0 (0.0%) | 0.0 |
| College or Associate's Degree | 36 (100.0%) | 288.0 |
| Bachelor's Degree | 0 (0.0%) | 0.0 |
| Graduate Degree | 0 (0.0%) | 0.0 |
| Total | 36 (100.0%) | 133.0 |
Fertility by Education by Marriage Status in Grant
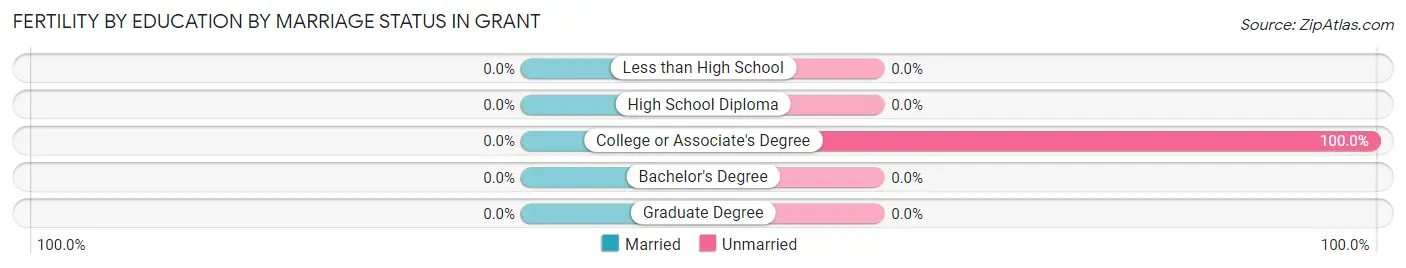
| Educational Attainment | Married | Unmarried |
| Less than High School | 0 (0.0%) | 0 (0.0%) |
| High School Diploma | 0 (0.0%) | 0 (0.0%) |
| College or Associate's Degree | 0 (0.0%) | 36 (100.0%) |
| Bachelor's Degree | 0 (0.0%) | 0 (0.0%) |
| Graduate Degree | 0 (0.0%) | 0 (0.0%) |
| Total | 0 (0.0%) | 36 (100.0%) |
Employment Characteristics in Grant
Employment by Class of Employer in Grant
Among the 448 employed individuals in Grant, private company employees (309 | 69.0%), not-for-profit organizations (80 | 17.9%), and self-employed (not incorporated) (28 | 6.2%) make up the most common classes of employment.
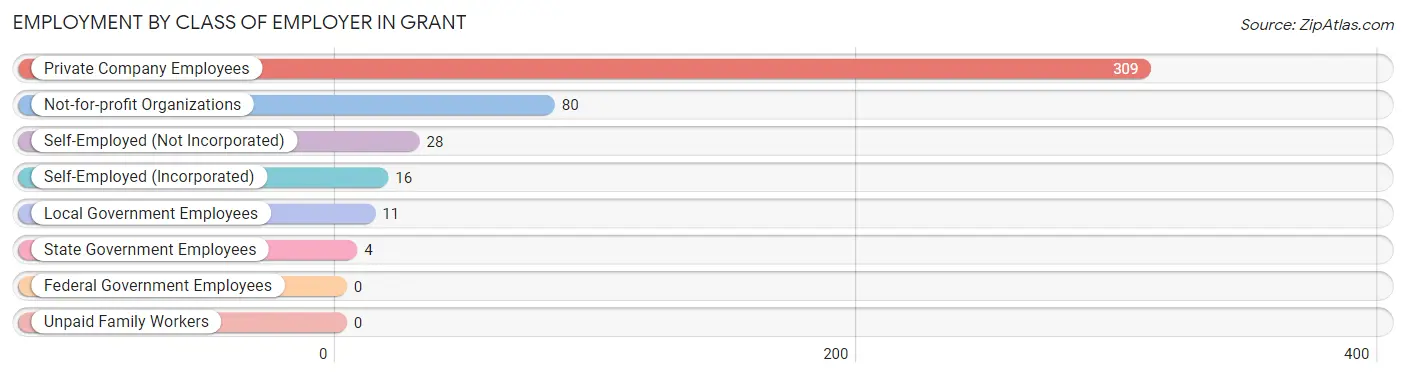
| Employer Class | # Employees | % Employees |
| Private Company Employees | 309 | 69.0% |
| Self-Employed (Incorporated) | 16 | 3.6% |
| Self-Employed (Not Incorporated) | 28 | 6.2% |
| Not-for-profit Organizations | 80 | 17.9% |
| Local Government Employees | 11 | 2.5% |
| State Government Employees | 4 | 0.9% |
| Federal Government Employees | 0 | 0.0% |
| Unpaid Family Workers | 0 | 0.0% |
| Total | 448 | 100.0% |
Employment Status by Age in Grant
According to the labor force statistics for Grant, out of the total population over 16 years of age (1,014), 50.1% or 508 individuals are in the labor force, with 11.8% or 60 of them unemployed. The age group with the highest labor force participation rate is 35 to 44 years, with 91.3% or 126 individuals in the labor force. Within the labor force, the 25 to 29 years age range has the highest percentage of unemployed individuals, with 41.7% or 35 of them being unemployed.
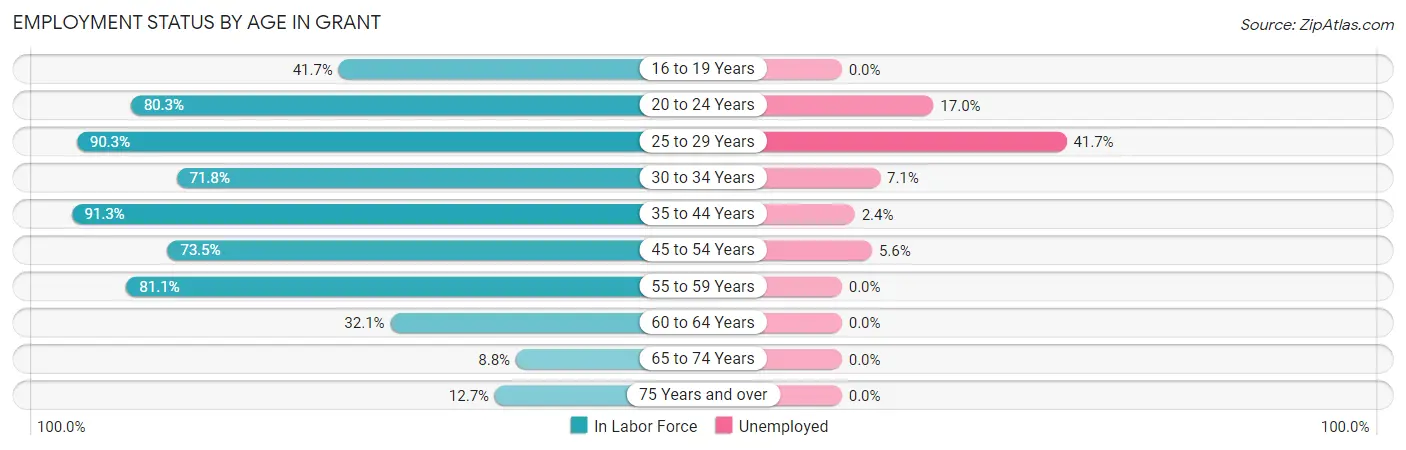
| Age Bracket | In Labor Force | Unemployed |
| 16 to 19 Years | 20 (41.7%) | 0 (0.0%) |
| 20 to 24 Years | 106 (80.3%) | 18 (17.0%) |
| 25 to 29 Years | 84 (90.3%) | 35 (41.7%) |
| 30 to 34 Years | 28 (71.8%) | 2 (7.1%) |
| 35 to 44 Years | 126 (91.3%) | 3 (2.4%) |
| 45 to 54 Years | 36 (73.5%) | 2 (5.6%) |
| 55 to 59 Years | 43 (81.1%) | 0 (0.0%) |
| 60 to 64 Years | 18 (32.1%) | 0 (0.0%) |
| 65 to 74 Years | 10 (8.8%) | 0 (0.0%) |
| 75 Years and over | 37 (12.7%) | 0 (0.0%) |
| Total | 508 (50.1%) | 60 (11.8%) |
Employment Status by Educational Attainment in Grant
According to labor force statistics for Grant, 78.3% of individuals (335) out of the total population between 25 and 64 years of age (428) are in the labor force, with 12.5% or 42 of them being unemployed. The group with the highest labor force participation rate are those with the educational attainment of college / associate degree, with 91.6% or 141 individuals in the labor force. Within the labor force, individuals with high school diploma education have the highest percentage of unemployment, with 30.4% or 35 of them being unemployed.
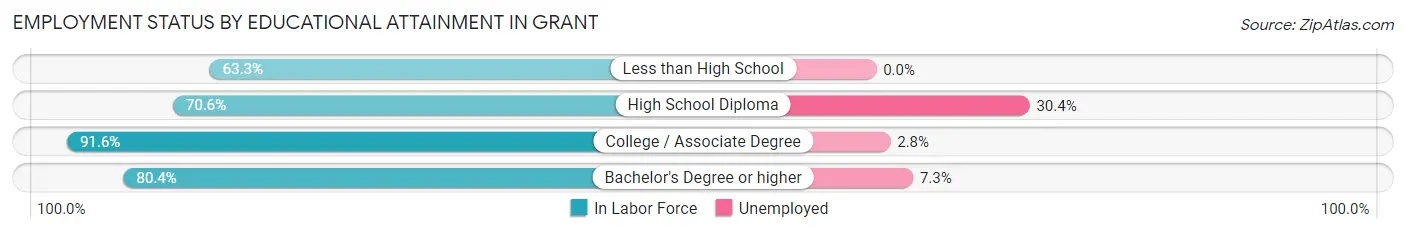
| Educational Attainment | In Labor Force | Unemployed |
| Less than High School | 38 (63.3%) | 0 (0.0%) |
| High School Diploma | 115 (70.6%) | 50 (30.4%) |
| College / Associate Degree | 141 (91.6%) | 4 (2.8%) |
| Bachelor's Degree or higher | 41 (80.4%) | 4 (7.3%) |
| Total | 335 (78.3%) | 54 (12.5%) |
Employment Occupations by Sex in Grant
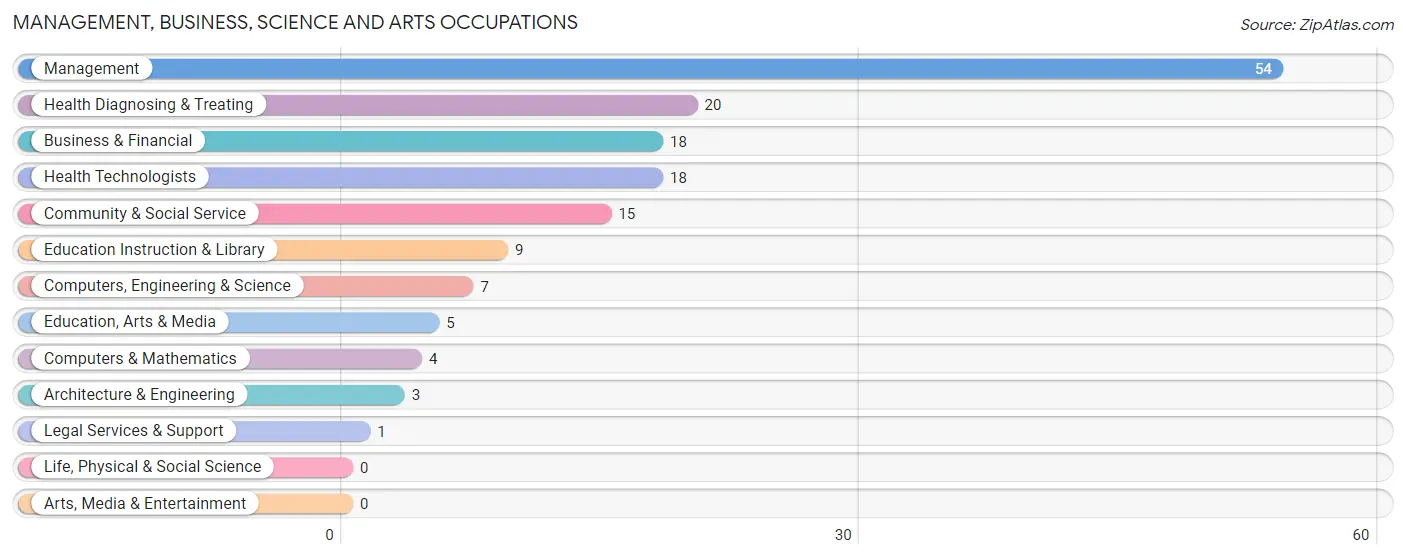
Management, Business, Science and Arts Occupations
The most common Management, Business, Science and Arts occupations in Grant are Management (54 | 12.0%), Health Diagnosing & Treating (20 | 4.5%), Business & Financial (18 | 4.0%), Health Technologists (18 | 4.0%), and Community & Social Service (15 | 3.4%).
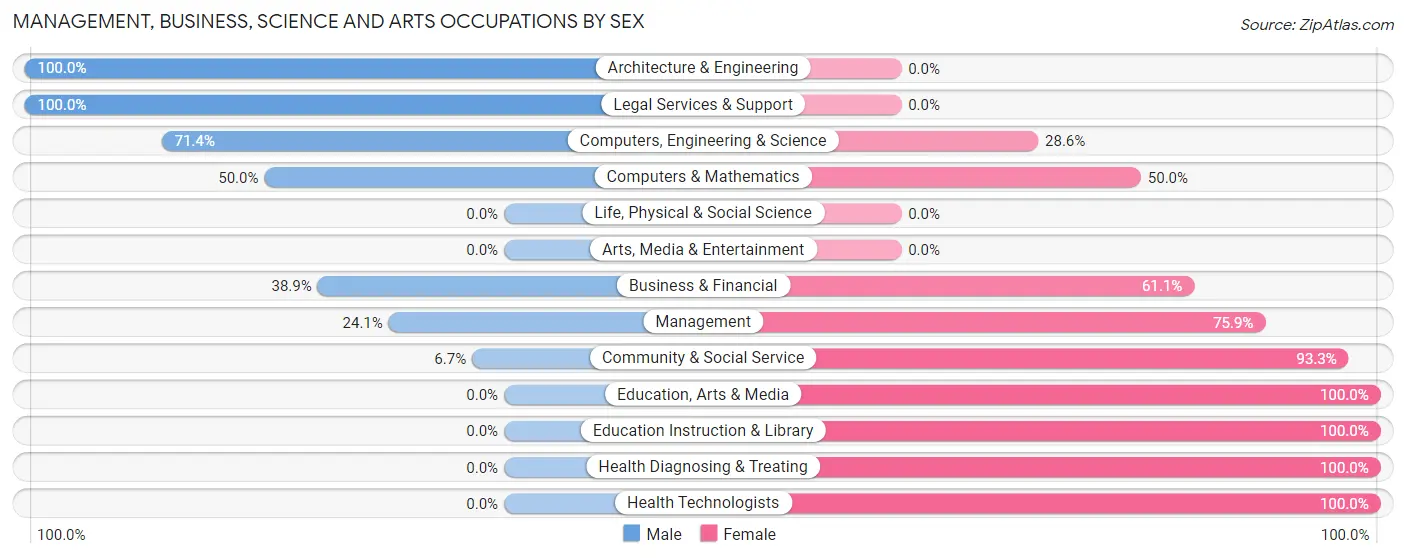
Management, Business, Science and Arts Occupations by Sex
Within the Management, Business, Science and Arts occupations in Grant, the most male-oriented occupations are Architecture & Engineering (100.0%), Legal Services & Support (100.0%), and Computers, Engineering & Science (71.4%), while the most female-oriented occupations are Education, Arts & Media (100.0%), Education Instruction & Library (100.0%), and Health Diagnosing & Treating (100.0%).
| Occupation | Male | Female |
| Management | 13 (24.1%) | 41 (75.9%) |
| Business & Financial | 7 (38.9%) | 11 (61.1%) |
| Computers, Engineering & Science | 5 (71.4%) | 2 (28.6%) |
| Computers & Mathematics | 2 (50.0%) | 2 (50.0%) |
| Architecture & Engineering | 3 (100.0%) | 0 (0.0%) |
| Life, Physical & Social Science | 0 (0.0%) | 0 (0.0%) |
| Community & Social Service | 1 (6.7%) | 14 (93.3%) |
| Education, Arts & Media | 0 (0.0%) | 5 (100.0%) |
| Legal Services & Support | 1 (100.0%) | 0 (0.0%) |
| Education Instruction & Library | 0 (0.0%) | 9 (100.0%) |
| Arts, Media & Entertainment | 0 (0.0%) | 0 (0.0%) |
| Health Diagnosing & Treating | 0 (0.0%) | 20 (100.0%) |
| Health Technologists | 0 (0.0%) | 18 (100.0%) |
| Total (Category) | 26 (22.8%) | 88 (77.2%) |
| Total (Overall) | 191 (42.6%) | 257 (57.4%) |
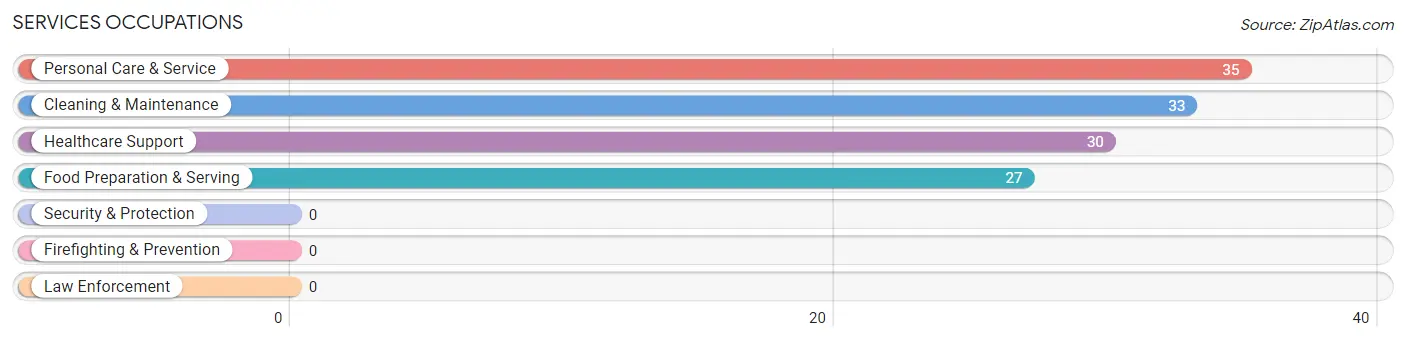
Services Occupations
The most common Services occupations in Grant are Personal Care & Service (35 | 7.8%), Cleaning & Maintenance (33 | 7.4%), Healthcare Support (30 | 6.7%), and Food Preparation & Serving (27 | 6.0%).
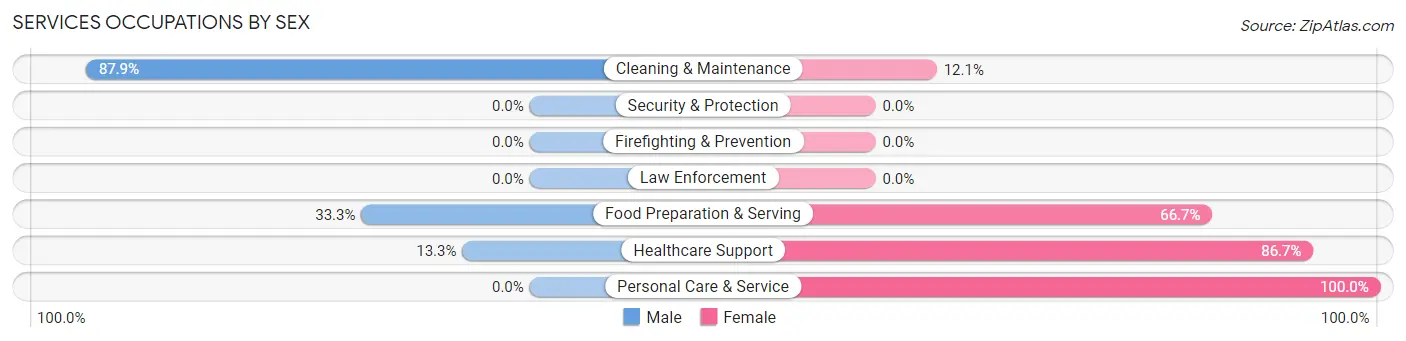
Services Occupations by Sex
Within the Services occupations in Grant, the most male-oriented occupations are Cleaning & Maintenance (87.9%), Food Preparation & Serving (33.3%), and Healthcare Support (13.3%), while the most female-oriented occupations are Personal Care & Service (100.0%), Healthcare Support (86.7%), and Food Preparation & Serving (66.7%).
| Occupation | Male | Female |
| Healthcare Support | 4 (13.3%) | 26 (86.7%) |
| Security & Protection | 0 (0.0%) | 0 (0.0%) |
| Firefighting & Prevention | 0 (0.0%) | 0 (0.0%) |
| Law Enforcement | 0 (0.0%) | 0 (0.0%) |
| Food Preparation & Serving | 9 (33.3%) | 18 (66.7%) |
| Cleaning & Maintenance | 29 (87.9%) | 4 (12.1%) |
| Personal Care & Service | 0 (0.0%) | 35 (100.0%) |
| Total (Category) | 42 (33.6%) | 83 (66.4%) |
| Total (Overall) | 191 (42.6%) | 257 (57.4%) |
Sales and Office Occupations
The most common Sales and Office occupations in Grant are Office & Administration (49 | 10.9%), and Sales & Related (17 | 3.8%).
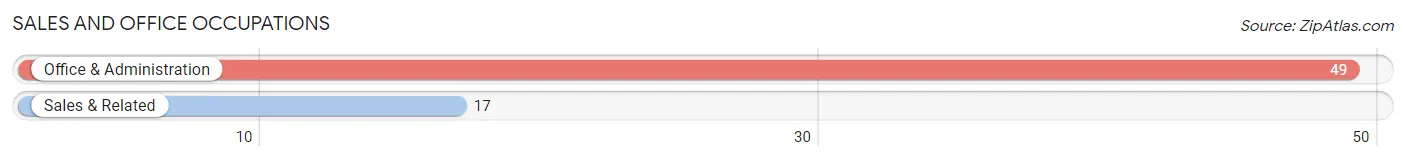
Sales and Office Occupations by Sex
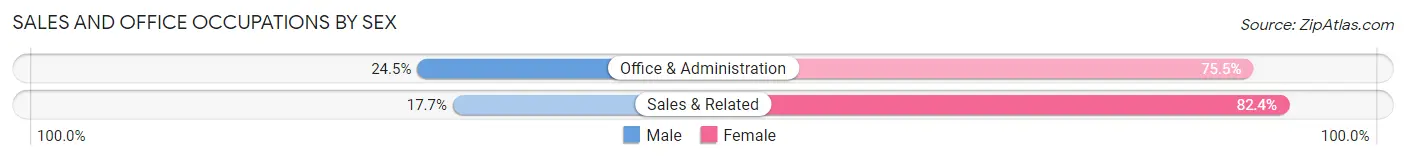
| Occupation | Male | Female |
| Sales & Related | 3 (17.6%) | 14 (82.4%) |
| Office & Administration | 12 (24.5%) | 37 (75.5%) |
| Total (Category) | 15 (22.7%) | 51 (77.3%) |
| Total (Overall) | 191 (42.6%) | 257 (57.4%) |
Natural Resources, Construction and Maintenance Occupations
The most common Natural Resources, Construction and Maintenance occupations in Grant are Construction & Extraction (27 | 6.0%), and Installation, Maintenance & Repair (9 | 2.0%).
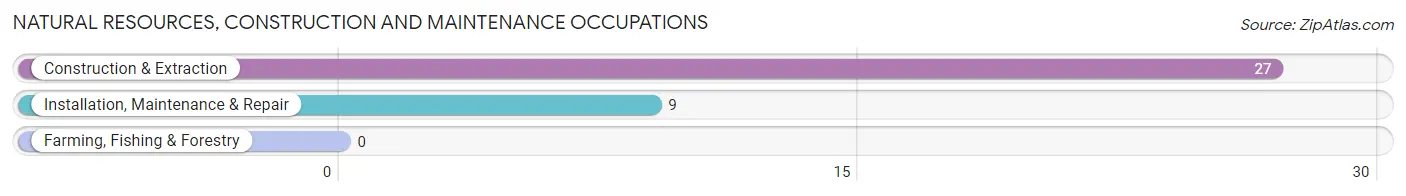
Natural Resources, Construction and Maintenance Occupations by Sex
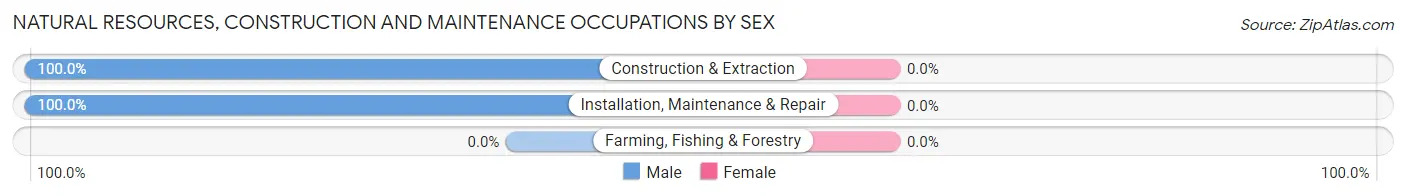
| Occupation | Male | Female |
| Farming, Fishing & Forestry | 0 (0.0%) | 0 (0.0%) |
| Construction & Extraction | 27 (100.0%) | 0 (0.0%) |
| Installation, Maintenance & Repair | 9 (100.0%) | 0 (0.0%) |
| Total (Category) | 36 (100.0%) | 0 (0.0%) |
| Total (Overall) | 191 (42.6%) | 257 (57.4%) |
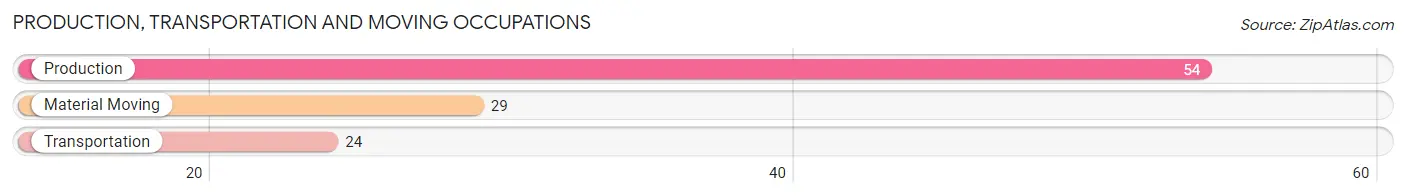
Production, Transportation and Moving Occupations
The most common Production, Transportation and Moving occupations in Grant are Production (54 | 12.0%), Material Moving (29 | 6.5%), and Transportation (24 | 5.4%).
Production, Transportation and Moving Occupations by Sex
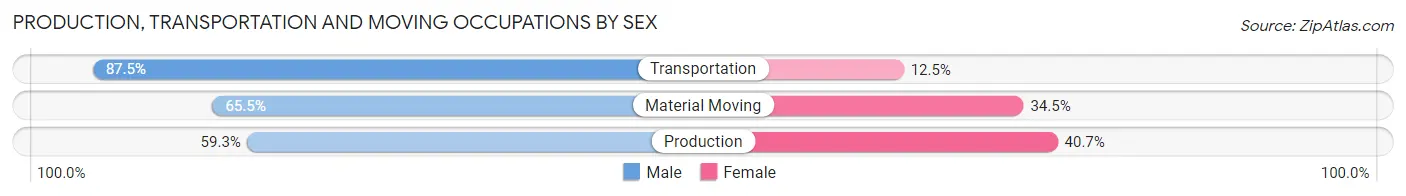
| Occupation | Male | Female |
| Production | 32 (59.3%) | 22 (40.7%) |
| Transportation | 21 (87.5%) | 3 (12.5%) |
| Material Moving | 19 (65.5%) | 10 (34.5%) |
| Total (Category) | 72 (67.3%) | 35 (32.7%) |
| Total (Overall) | 191 (42.6%) | 257 (57.4%) |
Employment Industries by Sex in Grant
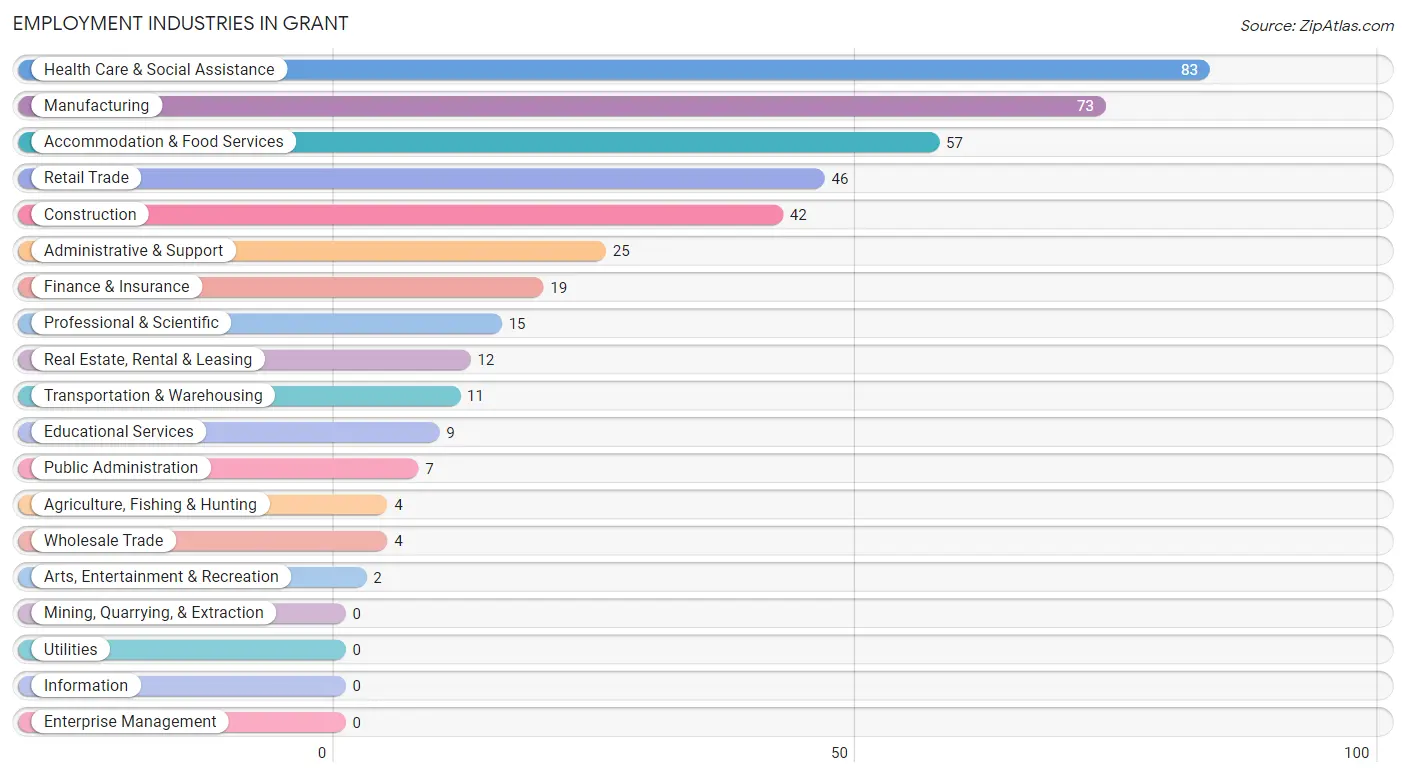
Employment Industries in Grant
The major employment industries in Grant include Health Care & Social Assistance (83 | 18.5%), Manufacturing (73 | 16.3%), Accommodation & Food Services (57 | 12.7%), Retail Trade (46 | 10.3%), and Construction (42 | 9.4%).
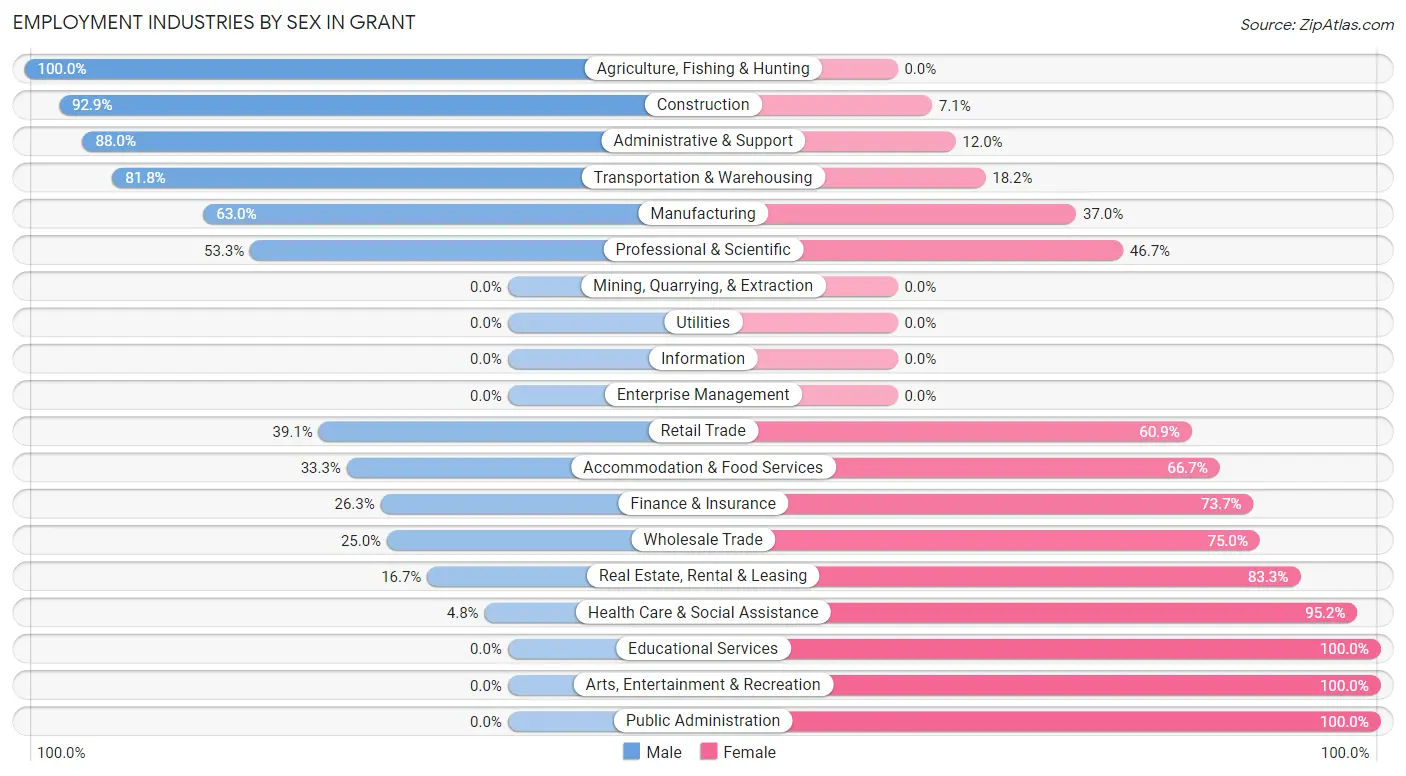
Employment Industries by Sex in Grant
The Grant industries that see more men than women are Agriculture, Fishing & Hunting (100.0%), Construction (92.9%), and Administrative & Support (88.0%), whereas the industries that tend to have a higher number of women are Educational Services (100.0%), Arts, Entertainment & Recreation (100.0%), and Public Administration (100.0%).
| Industry | Male | Female |
| Agriculture, Fishing & Hunting | 4 (100.0%) | 0 (0.0%) |
| Mining, Quarrying, & Extraction | 0 (0.0%) | 0 (0.0%) |
| Construction | 39 (92.9%) | 3 (7.1%) |
| Manufacturing | 46 (63.0%) | 27 (37.0%) |
| Wholesale Trade | 1 (25.0%) | 3 (75.0%) |
| Retail Trade | 18 (39.1%) | 28 (60.9%) |
| Transportation & Warehousing | 9 (81.8%) | 2 (18.2%) |
| Utilities | 0 (0.0%) | 0 (0.0%) |
| Information | 0 (0.0%) | 0 (0.0%) |
| Finance & Insurance | 5 (26.3%) | 14 (73.7%) |
| Real Estate, Rental & Leasing | 2 (16.7%) | 10 (83.3%) |
| Professional & Scientific | 8 (53.3%) | 7 (46.7%) |
| Enterprise Management | 0 (0.0%) | 0 (0.0%) |
| Administrative & Support | 22 (88.0%) | 3 (12.0%) |
| Educational Services | 0 (0.0%) | 9 (100.0%) |
| Health Care & Social Assistance | 4 (4.8%) | 79 (95.2%) |
| Arts, Entertainment & Recreation | 0 (0.0%) | 2 (100.0%) |
| Accommodation & Food Services | 19 (33.3%) | 38 (66.7%) |
| Public Administration | 0 (0.0%) | 7 (100.0%) |
| Total | 191 (42.6%) | 257 (57.4%) |
Education in Grant
School Enrollment in Grant
The most common levels of schooling among the 250 students in Grant are elementary school (68 | 27.2%), middle school (55 | 22.0%), and high school (53 | 21.2%).
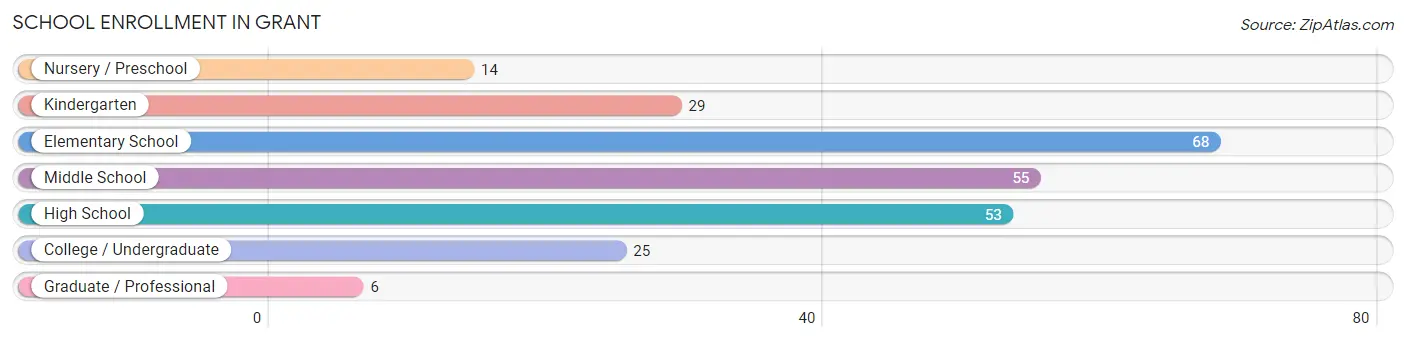
| School Level | # Students | % Students |
| Nursery / Preschool | 14 | 5.6% |
| Kindergarten | 29 | 11.6% |
| Elementary School | 68 | 27.2% |
| Middle School | 55 | 22.0% |
| High School | 53 | 21.2% |
| College / Undergraduate | 25 | 10.0% |
| Graduate / Professional | 6 | 2.4% |
| Total | 250 | 100.0% |
School Enrollment by Age by Funding Source in Grant
Out of a total of 250 students who are enrolled in schools in Grant, 29 (11.6%) attend a private institution, while the remaining 221 (88.4%) are enrolled in public schools. The age group of 25 to 34 year olds has the highest likelihood of being enrolled in private schools, with 3 (42.9% in the age bracket) enrolled. Conversely, the age group of 3 to 4 year olds has the lowest likelihood of being enrolled in a private school, with 10 (100.0% in the age bracket) attending a public institution.
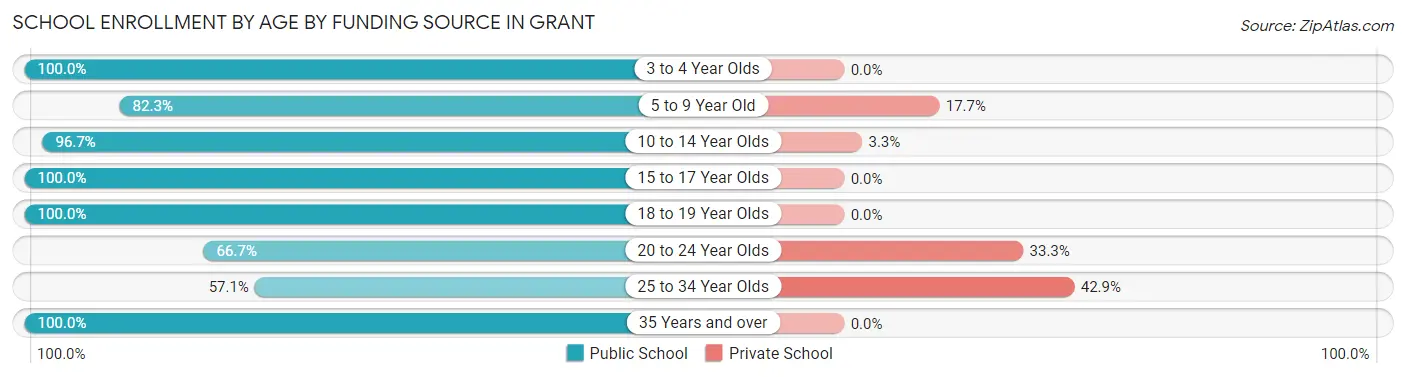
| Age Bracket | Public School | Private School |
| 3 to 4 Year Olds | 10 (100.0%) | 0 (0.0%) |
| 5 to 9 Year Old | 79 (82.3%) | 17 (17.7%) |
| 10 to 14 Year Olds | 58 (96.7%) | 2 (3.3%) |
| 15 to 17 Year Olds | 43 (100.0%) | 0 (0.0%) |
| 18 to 19 Year Olds | 5 (100.0%) | 0 (0.0%) |
| 20 to 24 Year Olds | 14 (66.7%) | 7 (33.3%) |
| 25 to 34 Year Olds | 4 (57.1%) | 3 (42.9%) |
| 35 Years and over | 8 (100.0%) | 0 (0.0%) |
| Total | 221 (88.4%) | 29 (11.6%) |
Educational Attainment by Field of Study in Grant
Education (19 | 23.7%), business (17 | 21.2%), arts & humanities (13 | 16.3%), science & technology (12 | 15.0%), and physical & health sciences (5 | 6.2%) are the most common fields of study among 80 individuals in Grant who have obtained a bachelor's degree or higher.
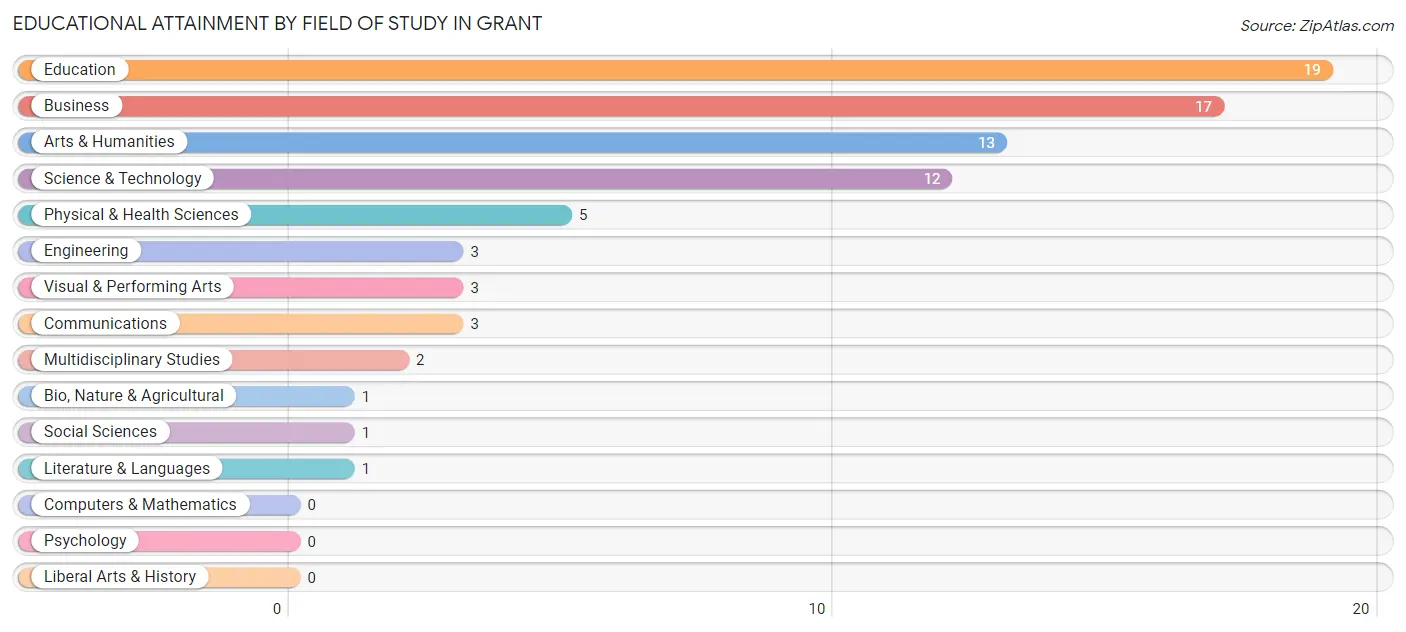
| Field of Study | # Graduates | % Graduates |
| Computers & Mathematics | 0 | 0.0% |
| Bio, Nature & Agricultural | 1 | 1.3% |
| Physical & Health Sciences | 5 | 6.2% |
| Psychology | 0 | 0.0% |
| Social Sciences | 1 | 1.3% |
| Engineering | 3 | 3.7% |
| Multidisciplinary Studies | 2 | 2.5% |
| Science & Technology | 12 | 15.0% |
| Business | 17 | 21.2% |
| Education | 19 | 23.7% |
| Literature & Languages | 1 | 1.3% |
| Liberal Arts & History | 0 | 0.0% |
| Visual & Performing Arts | 3 | 3.7% |
| Communications | 3 | 3.7% |
| Arts & Humanities | 13 | 16.3% |
| Total | 80 | 100.0% |
Transportation & Commute in Grant
Vehicle Availability by Sex in Grant
The most prevalent vehicle ownership categories in Grant are males with 2 vehicles (70, accounting for 36.6%) and females with 2 vehicles (106, making up 27.2%).
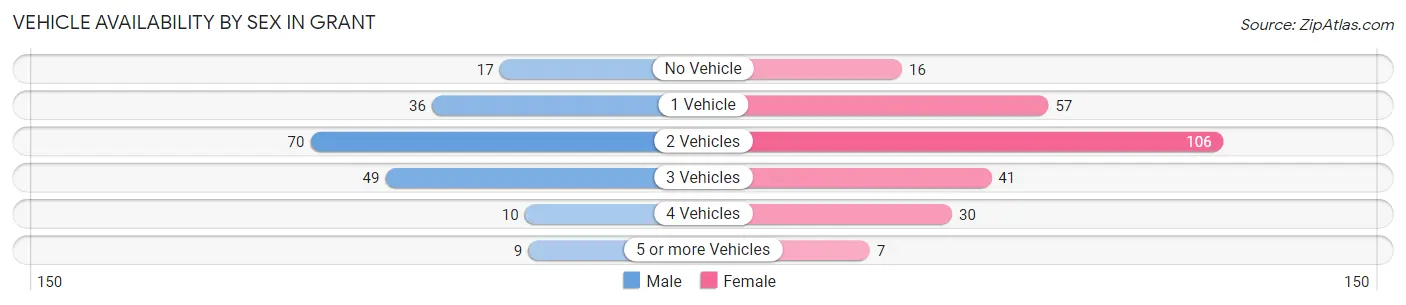
| Vehicles Available | Male | Female |
| No Vehicle | 17 (8.9%) | 16 (6.2%) |
| 1 Vehicle | 36 (18.9%) | 57 (22.2%) |
| 2 Vehicles | 70 (36.6%) | 106 (41.2%) |
| 3 Vehicles | 49 (25.7%) | 41 (16.0%) |
| 4 Vehicles | 10 (5.2%) | 30 (11.7%) |
| 5 or more Vehicles | 9 (4.7%) | 7 (2.7%) |
| Total | 191 (100.0%) | 257 (100.0%) |
Commute Time in Grant
The most frequently occuring commute durations in Grant are 20 to 24 minutes (72 commuters, 17.7%), 45 to 59 minutes (60 commuters, 14.8%), and 60 to 89 minutes (48 commuters, 11.8%).
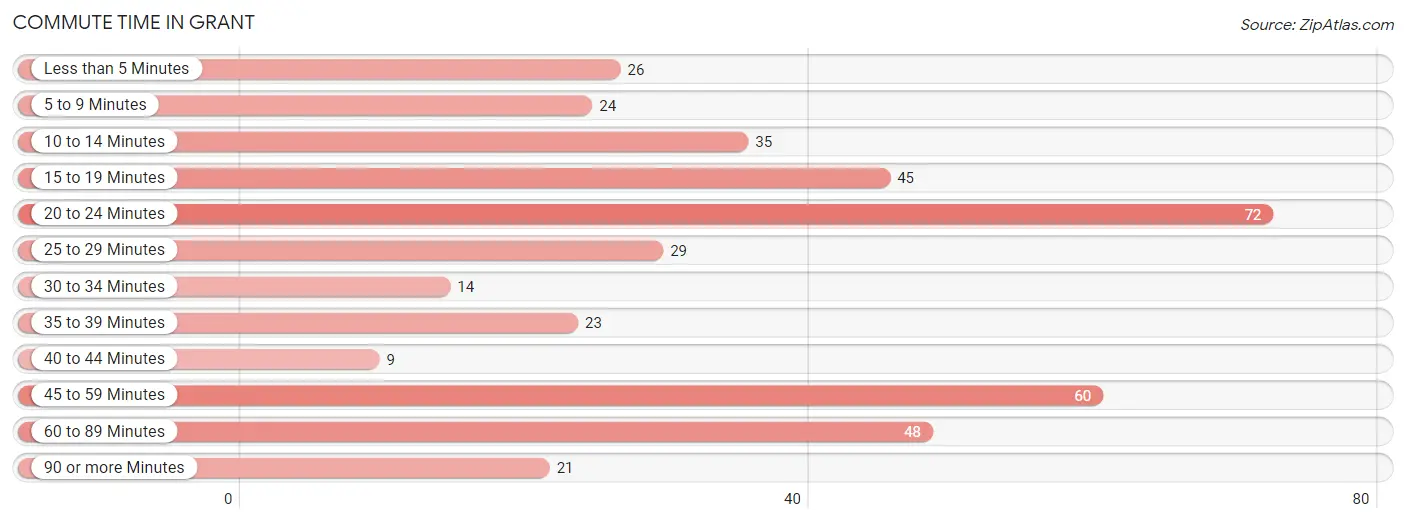
| Commute Time | # Commuters | % Commuters |
| Less than 5 Minutes | 26 | 6.4% |
| 5 to 9 Minutes | 24 | 5.9% |
| 10 to 14 Minutes | 35 | 8.6% |
| 15 to 19 Minutes | 45 | 11.1% |
| 20 to 24 Minutes | 72 | 17.7% |
| 25 to 29 Minutes | 29 | 7.1% |
| 30 to 34 Minutes | 14 | 3.5% |
| 35 to 39 Minutes | 23 | 5.7% |
| 40 to 44 Minutes | 9 | 2.2% |
| 45 to 59 Minutes | 60 | 14.8% |
| 60 to 89 Minutes | 48 | 11.8% |
| 90 or more Minutes | 21 | 5.2% |
Commute Time by Sex in Grant
The most common commute times in Grant are 60 to 89 minutes (37 commuters, 20.0%) for males and 20 to 24 minutes (50 commuters, 22.6%) for females.
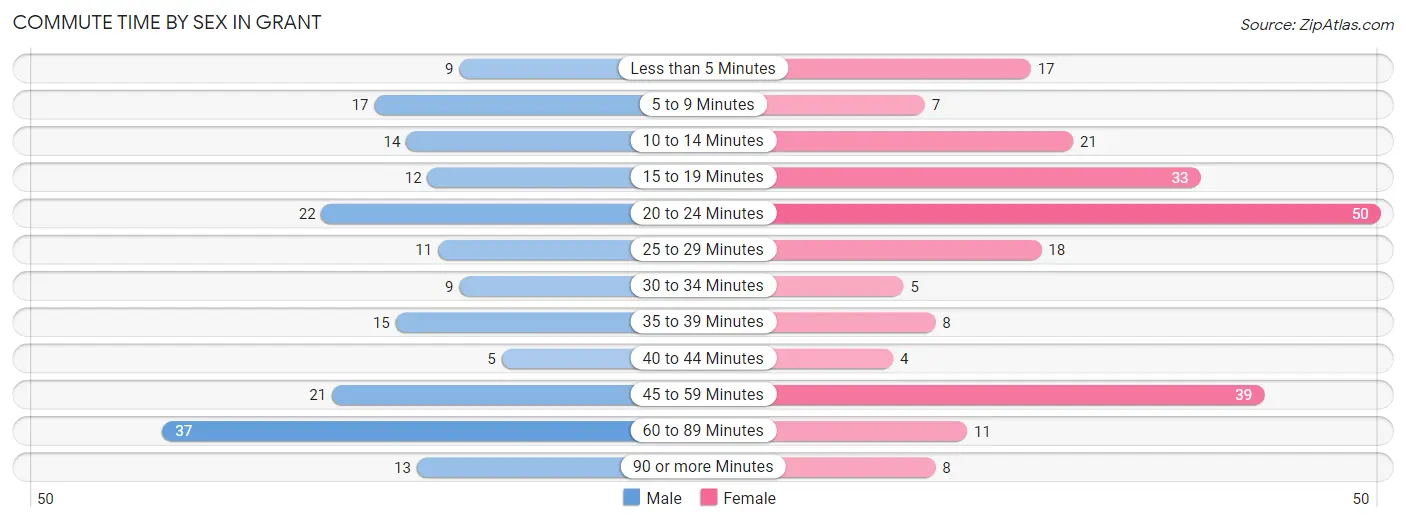
| Commute Time | Male | Female |
| Less than 5 Minutes | 9 (4.9%) | 17 (7.7%) |
| 5 to 9 Minutes | 17 (9.2%) | 7 (3.2%) |
| 10 to 14 Minutes | 14 (7.6%) | 21 (9.5%) |
| 15 to 19 Minutes | 12 (6.5%) | 33 (14.9%) |
| 20 to 24 Minutes | 22 (11.9%) | 50 (22.6%) |
| 25 to 29 Minutes | 11 (5.9%) | 18 (8.1%) |
| 30 to 34 Minutes | 9 (4.9%) | 5 (2.3%) |
| 35 to 39 Minutes | 15 (8.1%) | 8 (3.6%) |
| 40 to 44 Minutes | 5 (2.7%) | 4 (1.8%) |
| 45 to 59 Minutes | 21 (11.4%) | 39 (17.6%) |
| 60 to 89 Minutes | 37 (20.0%) | 11 (5.0%) |
| 90 or more Minutes | 13 (7.0%) | 8 (3.6%) |
Time of Departure to Work by Sex in Grant
The most frequent times of departure to work in Grant are 6:00 AM to 6:29 AM (44, 23.8%) for males and 7:30 AM to 7:59 AM (49, 22.2%) for females.
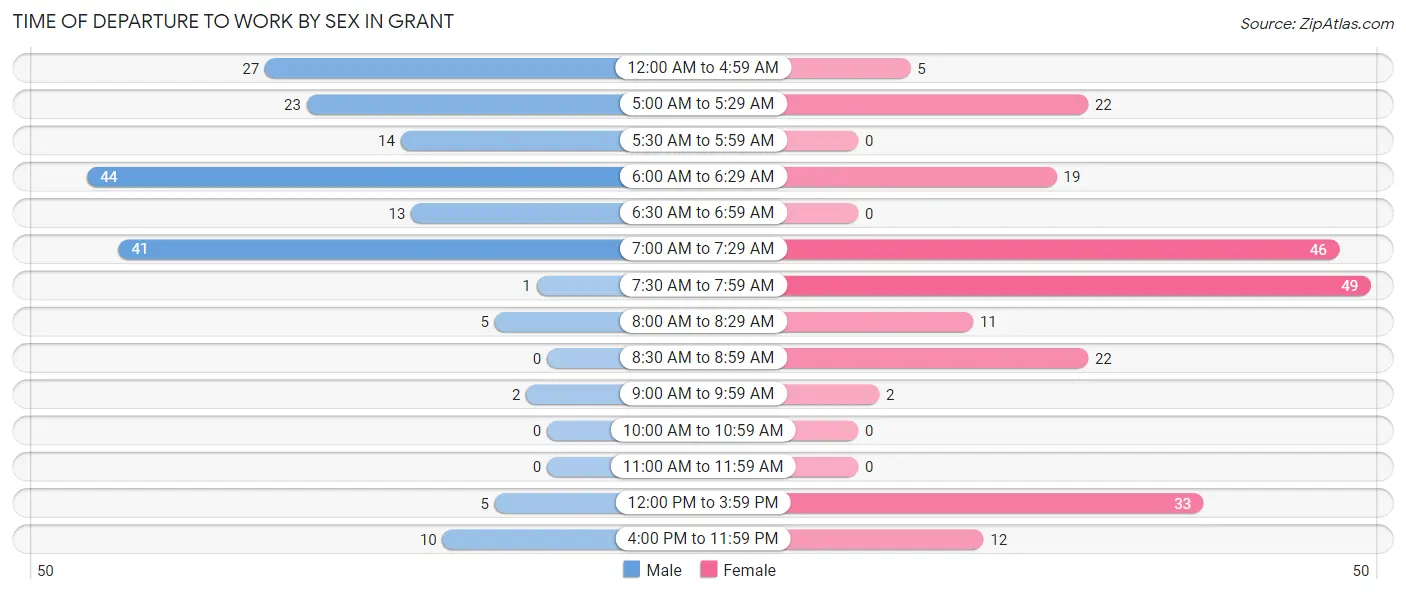
| Time of Departure | Male | Female |
| 12:00 AM to 4:59 AM | 27 (14.6%) | 5 (2.3%) |
| 5:00 AM to 5:29 AM | 23 (12.4%) | 22 (10.0%) |
| 5:30 AM to 5:59 AM | 14 (7.6%) | 0 (0.0%) |
| 6:00 AM to 6:29 AM | 44 (23.8%) | 19 (8.6%) |
| 6:30 AM to 6:59 AM | 13 (7.0%) | 0 (0.0%) |
| 7:00 AM to 7:29 AM | 41 (22.2%) | 46 (20.8%) |
| 7:30 AM to 7:59 AM | 1 (0.5%) | 49 (22.2%) |
| 8:00 AM to 8:29 AM | 5 (2.7%) | 11 (5.0%) |
| 8:30 AM to 8:59 AM | 0 (0.0%) | 22 (10.0%) |
| 9:00 AM to 9:59 AM | 2 (1.1%) | 2 (0.9%) |
| 10:00 AM to 10:59 AM | 0 (0.0%) | 0 (0.0%) |
| 11:00 AM to 11:59 AM | 0 (0.0%) | 0 (0.0%) |
| 12:00 PM to 3:59 PM | 5 (2.7%) | 33 (14.9%) |
| 4:00 PM to 11:59 PM | 10 (5.4%) | 12 (5.4%) |
| Total | 185 (100.0%) | 221 (100.0%) |
Housing Occupancy in Grant
Occupancy by Ownership in Grant
Of the total 455 dwellings in Grant, owner-occupied units account for 274 (60.2%), while renter-occupied units make up 181 (39.8%).
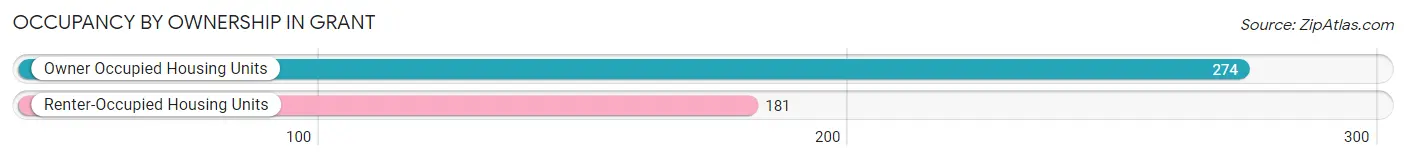
| Occupancy | # Housing Units | % Housing Units |
| Owner Occupied Housing Units | 274 | 60.2% |
| Renter-Occupied Housing Units | 181 | 39.8% |
| Total Occupied Housing Units | 455 | 100.0% |
Occupancy by Household Size in Grant
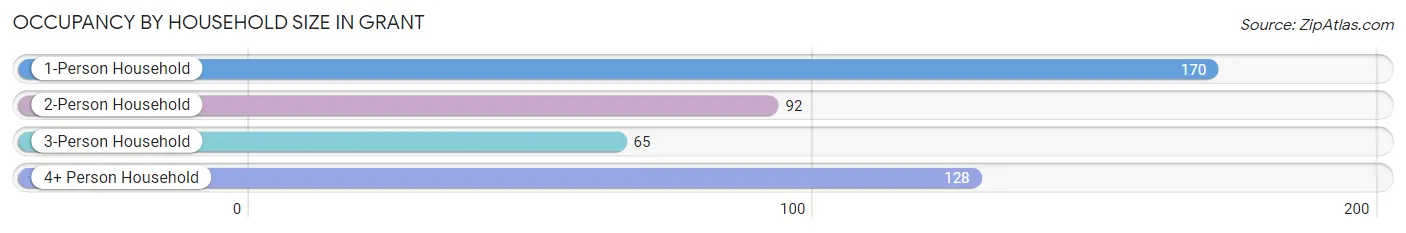
| Household Size | # Housing Units | % Housing Units |
| 1-Person Household | 170 | 37.4% |
| 2-Person Household | 92 | 20.2% |
| 3-Person Household | 65 | 14.3% |
| 4+ Person Household | 128 | 28.1% |
| Total Housing Units | 455 | 100.0% |
Occupancy by Ownership by Household Size in Grant
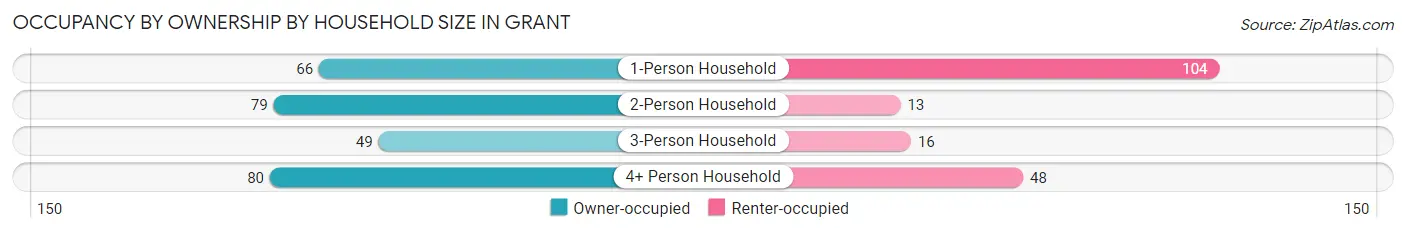
| Household Size | Owner-occupied | Renter-occupied |
| 1-Person Household | 66 (38.8%) | 104 (61.2%) |
| 2-Person Household | 79 (85.9%) | 13 (14.1%) |
| 3-Person Household | 49 (75.4%) | 16 (24.6%) |
| 4+ Person Household | 80 (62.5%) | 48 (37.5%) |
| Total Housing Units | 274 (60.2%) | 181 (39.8%) |
Occupancy by Educational Attainment in Grant
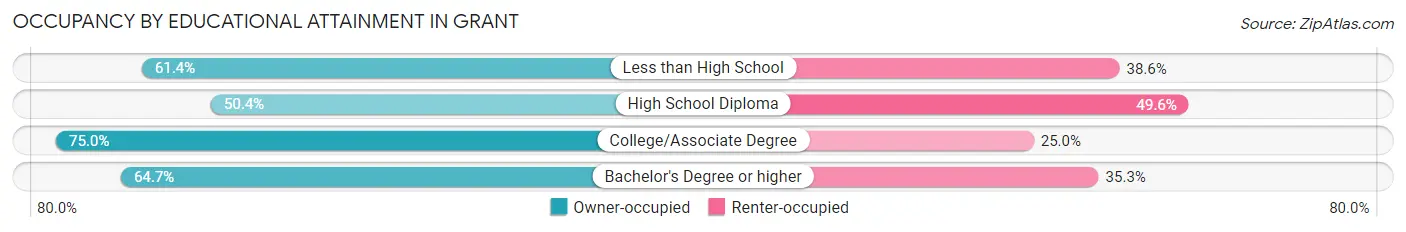
| Household Size | Owner-occupied | Renter-occupied |
| Less than High School | 35 (61.4%) | 22 (38.6%) |
| High School Diploma | 115 (50.4%) | 113 (49.6%) |
| College/Associate Degree | 102 (75.0%) | 34 (25.0%) |
| Bachelor's Degree or higher | 22 (64.7%) | 12 (35.3%) |
Occupancy by Age of Householder in Grant
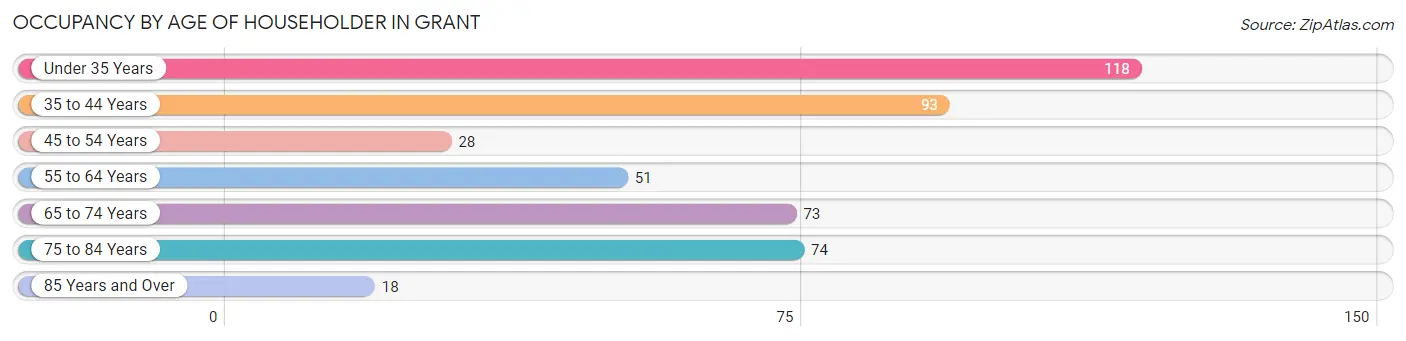
| Age Bracket | # Households | % Households |
| Under 35 Years | 118 | 25.9% |
| 35 to 44 Years | 93 | 20.4% |
| 45 to 54 Years | 28 | 6.1% |
| 55 to 64 Years | 51 | 11.2% |
| 65 to 74 Years | 73 | 16.0% |
| 75 to 84 Years | 74 | 16.3% |
| 85 Years and Over | 18 | 4.0% |
| Total | 455 | 100.0% |
Housing Finances in Grant
Median Income by Occupancy in Grant
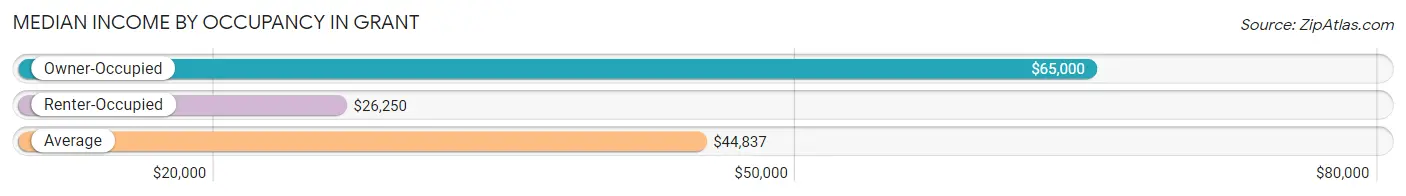
| Occupancy Type | # Households | Median Income |
| Owner-Occupied | 274 (60.2%) | $65,000 |
| Renter-Occupied | 181 (39.8%) | $26,250 |
| Average | 455 (100.0%) | $44,837 |
Occupancy by Householder Income Bracket in Grant
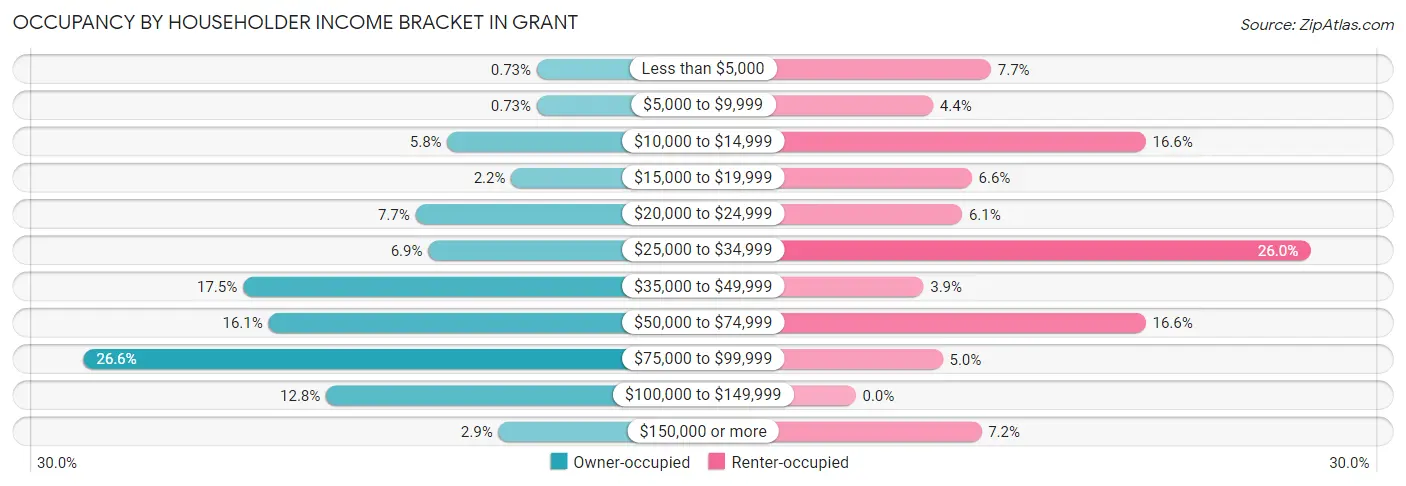
| Income Bracket | Owner-occupied | Renter-occupied |
| Less than $5,000 | 2 (0.7%) | 14 (7.7%) |
| $5,000 to $9,999 | 2 (0.7%) | 8 (4.4%) |
| $10,000 to $14,999 | 16 (5.8%) | 30 (16.6%) |
| $15,000 to $19,999 | 6 (2.2%) | 12 (6.6%) |
| $20,000 to $24,999 | 21 (7.7%) | 11 (6.1%) |
| $25,000 to $34,999 | 19 (6.9%) | 47 (26.0%) |
| $35,000 to $49,999 | 48 (17.5%) | 7 (3.9%) |
| $50,000 to $74,999 | 44 (16.1%) | 30 (16.6%) |
| $75,000 to $99,999 | 73 (26.6%) | 9 (5.0%) |
| $100,000 to $149,999 | 35 (12.8%) | 0 (0.0%) |
| $150,000 or more | 8 (2.9%) | 13 (7.2%) |
| Total | 274 (100.0%) | 181 (100.0%) |
Monthly Housing Cost Tiers in Grant
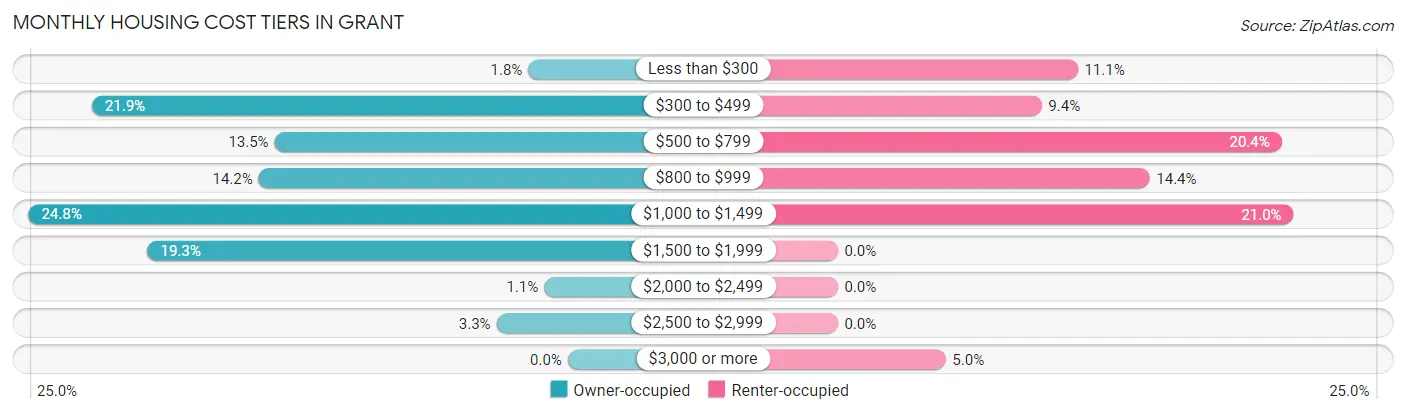
| Monthly Cost | Owner-occupied | Renter-occupied |
| Less than $300 | 5 (1.8%) | 20 (11.1%) |
| $300 to $499 | 60 (21.9%) | 17 (9.4%) |
| $500 to $799 | 37 (13.5%) | 37 (20.4%) |
| $800 to $999 | 39 (14.2%) | 26 (14.4%) |
| $1,000 to $1,499 | 68 (24.8%) | 38 (21.0%) |
| $1,500 to $1,999 | 53 (19.3%) | 0 (0.0%) |
| $2,000 to $2,499 | 3 (1.1%) | 0 (0.0%) |
| $2,500 to $2,999 | 9 (3.3%) | 0 (0.0%) |
| $3,000 or more | 0 (0.0%) | 9 (5.0%) |
| Total | 274 (100.0%) | 181 (100.0%) |
Physical Housing Characteristics in Grant
Housing Structures in Grant
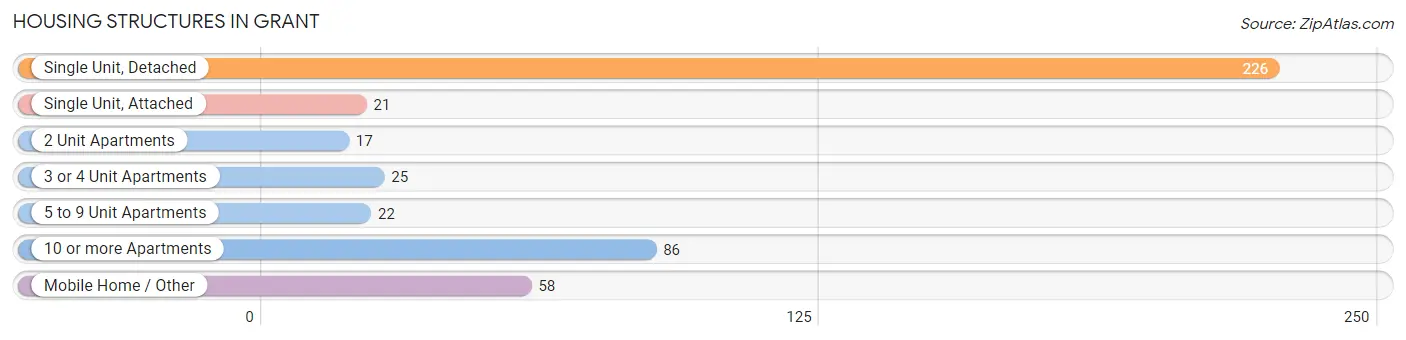
| Structure Type | # Housing Units | % Housing Units |
| Single Unit, Detached | 226 | 49.7% |
| Single Unit, Attached | 21 | 4.6% |
| 2 Unit Apartments | 17 | 3.7% |
| 3 or 4 Unit Apartments | 25 | 5.5% |
| 5 to 9 Unit Apartments | 22 | 4.8% |
| 10 or more Apartments | 86 | 18.9% |
| Mobile Home / Other | 58 | 12.8% |
| Total | 455 | 100.0% |
Housing Structures by Occupancy in Grant
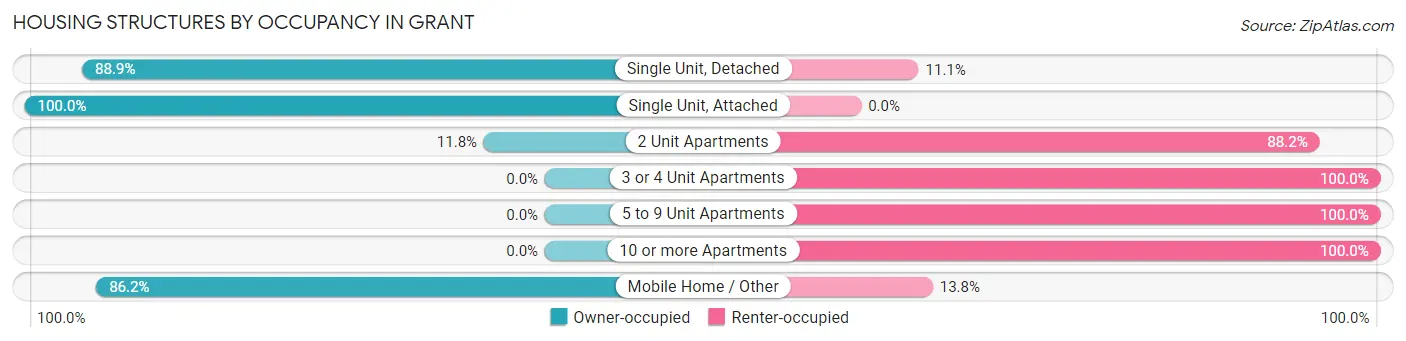
| Structure Type | Owner-occupied | Renter-occupied |
| Single Unit, Detached | 201 (88.9%) | 25 (11.1%) |
| Single Unit, Attached | 21 (100.0%) | 0 (0.0%) |
| 2 Unit Apartments | 2 (11.8%) | 15 (88.2%) |
| 3 or 4 Unit Apartments | 0 (0.0%) | 25 (100.0%) |
| 5 to 9 Unit Apartments | 0 (0.0%) | 22 (100.0%) |
| 10 or more Apartments | 0 (0.0%) | 86 (100.0%) |
| Mobile Home / Other | 50 (86.2%) | 8 (13.8%) |
| Total | 274 (60.2%) | 181 (39.8%) |
Housing Structures by Number of Rooms in Grant
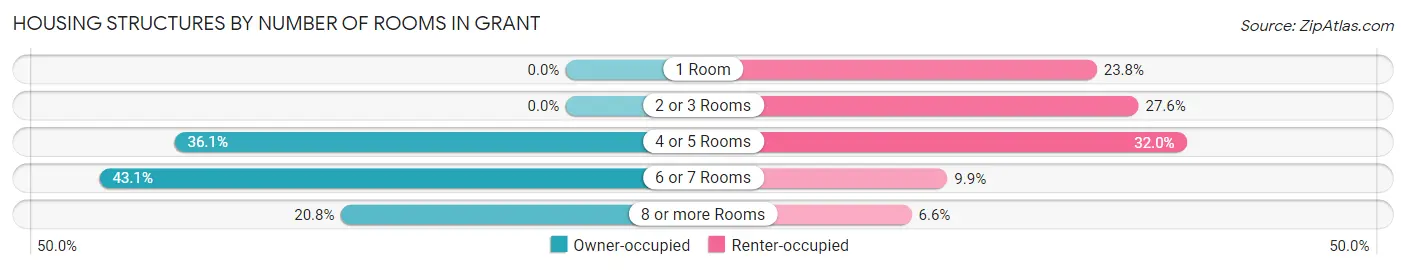
| Number of Rooms | Owner-occupied | Renter-occupied |
| 1 Room | 0 (0.0%) | 43 (23.8%) |
| 2 or 3 Rooms | 0 (0.0%) | 50 (27.6%) |
| 4 or 5 Rooms | 99 (36.1%) | 58 (32.0%) |
| 6 or 7 Rooms | 118 (43.1%) | 18 (9.9%) |
| 8 or more Rooms | 57 (20.8%) | 12 (6.6%) |
| Total | 274 (100.0%) | 181 (100.0%) |
Housing Structure by Heating Type in Grant
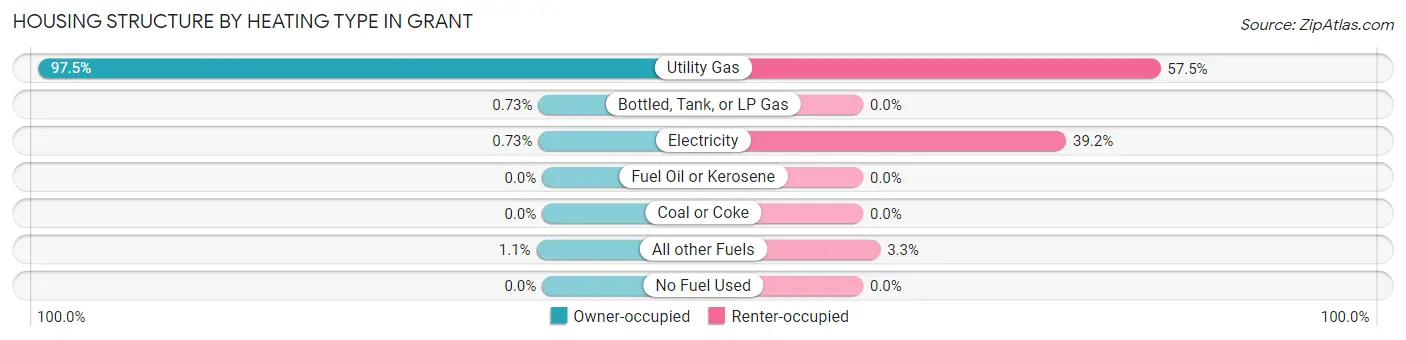
| Heating Type | Owner-occupied | Renter-occupied |
| Utility Gas | 267 (97.5%) | 104 (57.5%) |
| Bottled, Tank, or LP Gas | 2 (0.7%) | 0 (0.0%) |
| Electricity | 2 (0.7%) | 71 (39.2%) |
| Fuel Oil or Kerosene | 0 (0.0%) | 0 (0.0%) |
| Coal or Coke | 0 (0.0%) | 0 (0.0%) |
| All other Fuels | 3 (1.1%) | 6 (3.3%) |
| No Fuel Used | 0 (0.0%) | 0 (0.0%) |
| Total | 274 (100.0%) | 181 (100.0%) |
Household Vehicle Usage in Grant
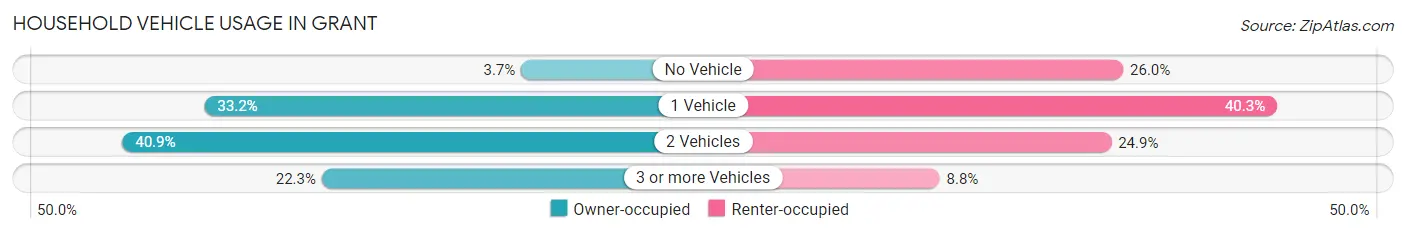
| Vehicles per Household | Owner-occupied | Renter-occupied |
| No Vehicle | 10 (3.6%) | 47 (26.0%) |
| 1 Vehicle | 91 (33.2%) | 73 (40.3%) |
| 2 Vehicles | 112 (40.9%) | 45 (24.9%) |
| 3 or more Vehicles | 61 (22.3%) | 16 (8.8%) |
| Total | 274 (100.0%) | 181 (100.0%) |
Real Estate & Mortgages in Grant
Real Estate and Mortgage Overview in Grant
| Characteristic | Without Mortgage | With Mortgage |
| Housing Units | 97 | 177 |
| Median Property Value | $150,600 | $158,200 |
| Median Household Income | $40,694 | $8 |
| Monthly Housing Costs | $462 | $0 |
| Real Estate Taxes | $1,958 | $6 |
Property Value by Mortgage Status in Grant
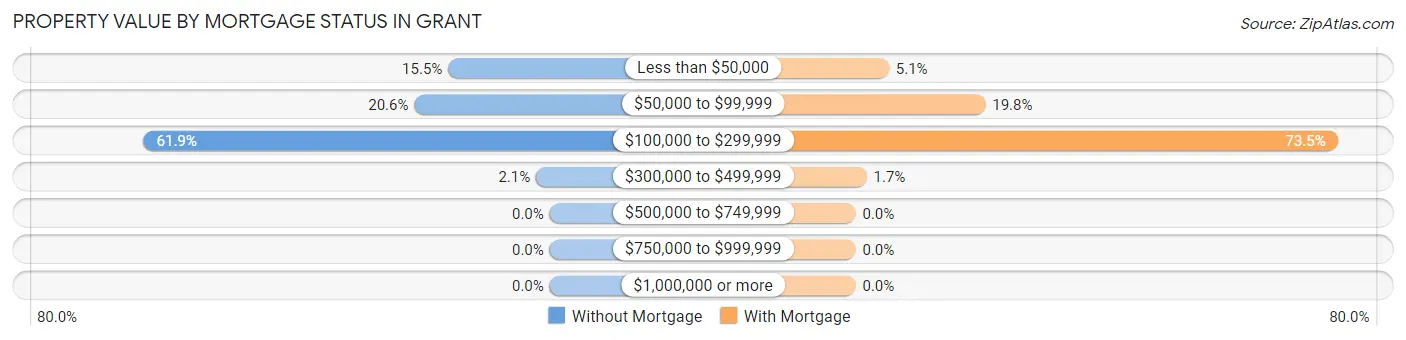
| Property Value | Without Mortgage | With Mortgage |
| Less than $50,000 | 15 (15.5%) | 9 (5.1%) |
| $50,000 to $99,999 | 20 (20.6%) | 35 (19.8%) |
| $100,000 to $299,999 | 60 (61.9%) | 130 (73.5%) |
| $300,000 to $499,999 | 2 (2.1%) | 3 (1.7%) |
| $500,000 to $749,999 | 0 (0.0%) | 0 (0.0%) |
| $750,000 to $999,999 | 0 (0.0%) | 0 (0.0%) |
| $1,000,000 or more | 0 (0.0%) | 0 (0.0%) |
| Total | 97 (100.0%) | 177 (100.0%) |
Household Income by Mortgage Status in Grant
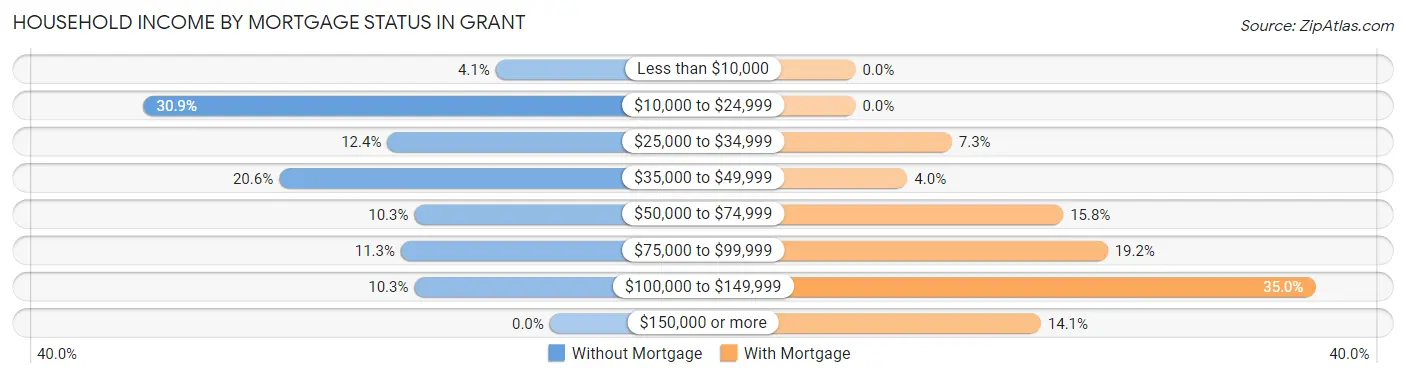
| Household Income | Without Mortgage | With Mortgage |
| Less than $10,000 | 4 (4.1%) | 0 (0.0%) |
| $10,000 to $24,999 | 30 (30.9%) | 0 (0.0%) |
| $25,000 to $34,999 | 12 (12.4%) | 13 (7.3%) |
| $35,000 to $49,999 | 20 (20.6%) | 7 (4.0%) |
| $50,000 to $74,999 | 10 (10.3%) | 28 (15.8%) |
| $75,000 to $99,999 | 11 (11.3%) | 34 (19.2%) |
| $100,000 to $149,999 | 10 (10.3%) | 62 (35.0%) |
| $150,000 or more | 0 (0.0%) | 25 (14.1%) |
| Total | 97 (100.0%) | 177 (100.0%) |
Property Value to Household Income Ratio in Grant
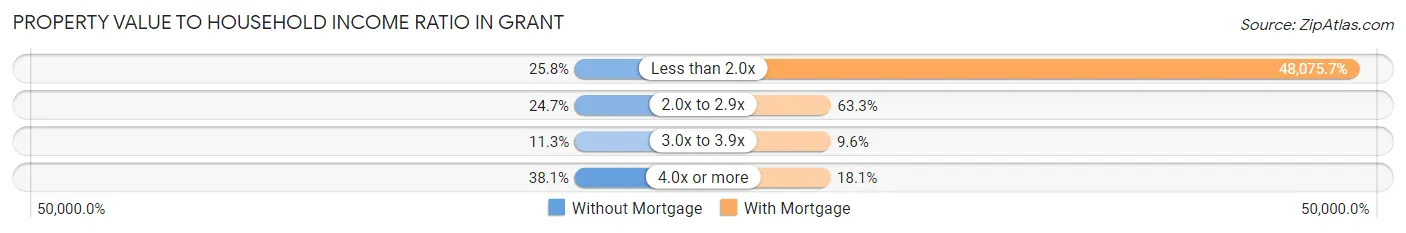
| Value-to-Income Ratio | Without Mortgage | With Mortgage |
| Less than 2.0x | 25 (25.8%) | 85,094 (48,075.7%) |
| 2.0x to 2.9x | 24 (24.7%) | 112 (63.3%) |
| 3.0x to 3.9x | 11 (11.3%) | 17 (9.6%) |
| 4.0x or more | 37 (38.1%) | 32 (18.1%) |
| Total | 97 (100.0%) | 177 (100.0%) |
Real Estate Taxes by Mortgage Status in Grant
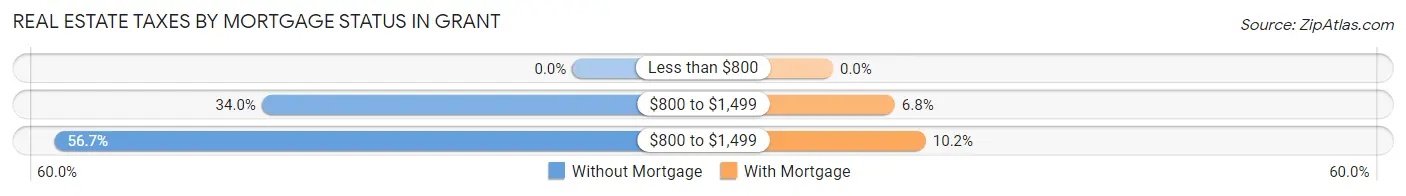
| Property Taxes | Without Mortgage | With Mortgage |
| Less than $800 | 0 (0.0%) | 0 (0.0%) |
| $800 to $1,499 | 33 (34.0%) | 12 (6.8%) |
| $800 to $1,499 | 55 (56.7%) | 18 (10.2%) |
| Total | 97 (100.0%) | 177 (100.0%) |
Health & Disability in Grant
Health Insurance Coverage by Age in Grant
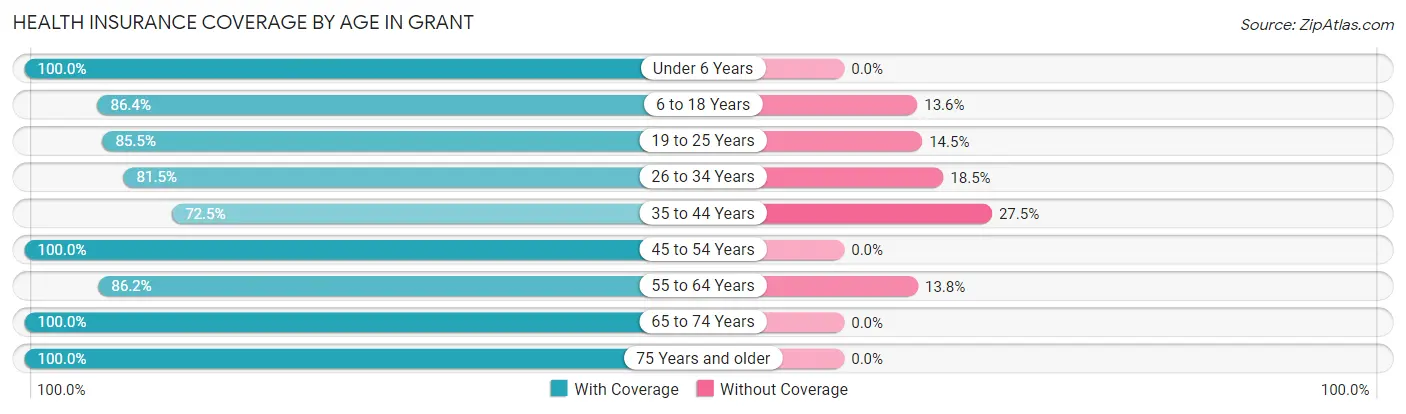
| Age Bracket | With Coverage | Without Coverage |
| Under 6 Years | 183 (100.0%) | 0 (0.0%) |
| 6 to 18 Years | 165 (86.4%) | 26 (13.6%) |
| 19 to 25 Years | 153 (85.5%) | 26 (14.5%) |
| 26 to 34 Years | 75 (81.5%) | 17 (18.5%) |
| 35 to 44 Years | 100 (72.5%) | 38 (27.5%) |
| 45 to 54 Years | 49 (100.0%) | 0 (0.0%) |
| 55 to 64 Years | 94 (86.2%) | 15 (13.8%) |
| 65 to 74 Years | 114 (100.0%) | 0 (0.0%) |
| 75 Years and older | 292 (100.0%) | 0 (0.0%) |
| Total | 1,225 (90.9%) | 122 (9.1%) |
Health Insurance Coverage by Citizenship Status in Grant
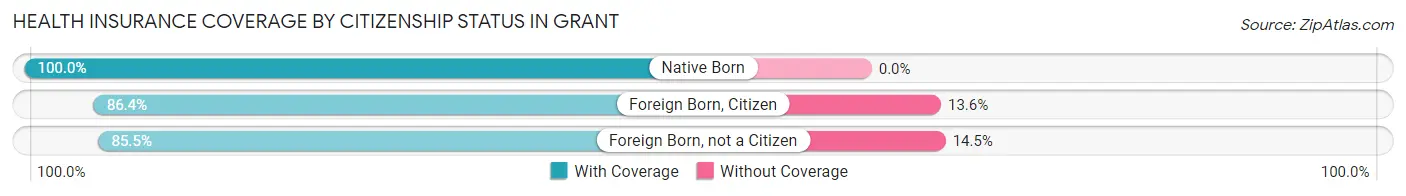
| Citizenship Status | With Coverage | Without Coverage |
| Native Born | 183 (100.0%) | 0 (0.0%) |
| Foreign Born, Citizen | 165 (86.4%) | 26 (13.6%) |
| Foreign Born, not a Citizen | 153 (85.5%) | 26 (14.5%) |
Health Insurance Coverage by Household Income in Grant
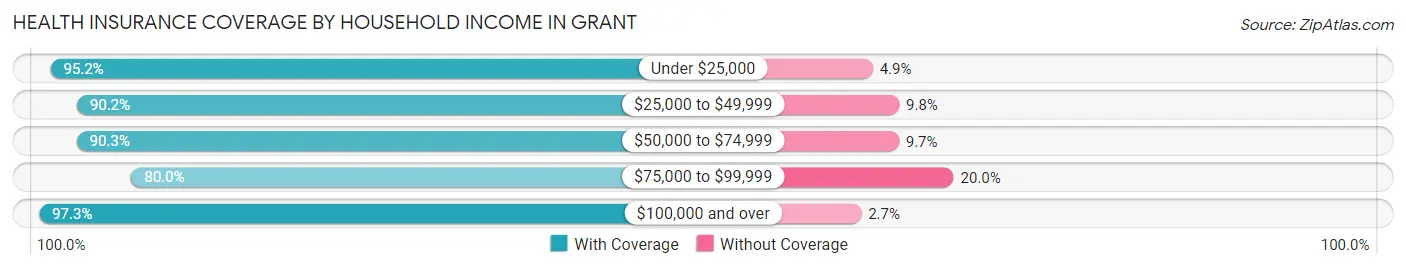
| Household Income | With Coverage | Without Coverage |
| Under $25,000 | 216 (95.2%) | 11 (4.9%) |
| $25,000 to $49,999 | 230 (90.2%) | 25 (9.8%) |
| $50,000 to $74,999 | 139 (90.3%) | 15 (9.7%) |
| $75,000 to $99,999 | 240 (80.0%) | 60 (20.0%) |
| $100,000 and over | 397 (97.3%) | 11 (2.7%) |
Public vs Private Health Insurance Coverage by Age in Grant
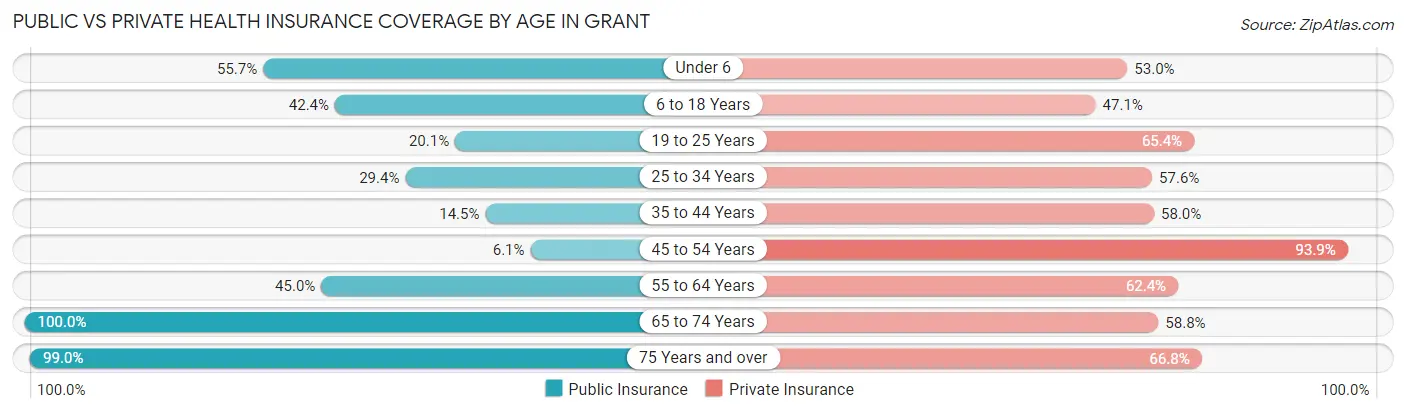
| Age Bracket | Public Insurance | Private Insurance |
| Under 6 | 102 (55.7%) | 97 (53.0%) |
| 6 to 18 Years | 81 (42.4%) | 90 (47.1%) |
| 19 to 25 Years | 36 (20.1%) | 117 (65.4%) |
| 25 to 34 Years | 27 (29.3%) | 53 (57.6%) |
| 35 to 44 Years | 20 (14.5%) | 80 (58.0%) |
| 45 to 54 Years | 3 (6.1%) | 46 (93.9%) |
| 55 to 64 Years | 49 (45.0%) | 68 (62.4%) |
| 65 to 74 Years | 114 (100.0%) | 67 (58.8%) |
| 75 Years and over | 289 (99.0%) | 195 (66.8%) |
| Total | 721 (53.5%) | 813 (60.4%) |
Disability Status by Sex by Age in Grant
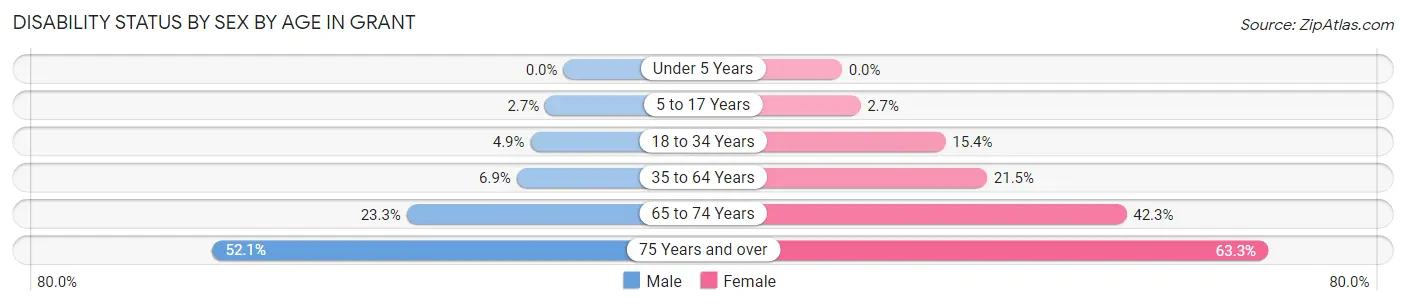
| Age Bracket | Male | Female |
| Under 5 Years | 0 (0.0%) | 0 (0.0%) |
| 5 to 17 Years | 4 (2.7%) | 3 (2.7%) |
| 18 to 34 Years | 7 (4.9%) | 20 (15.4%) |
| 35 to 64 Years | 7 (6.9%) | 42 (21.5%) |
| 65 to 74 Years | 10 (23.3%) | 30 (42.2%) |
| 75 Years and over | 50 (52.1%) | 124 (63.3%) |
Disability Class by Sex by Age in Grant
Disability Class: Hearing Difficulty
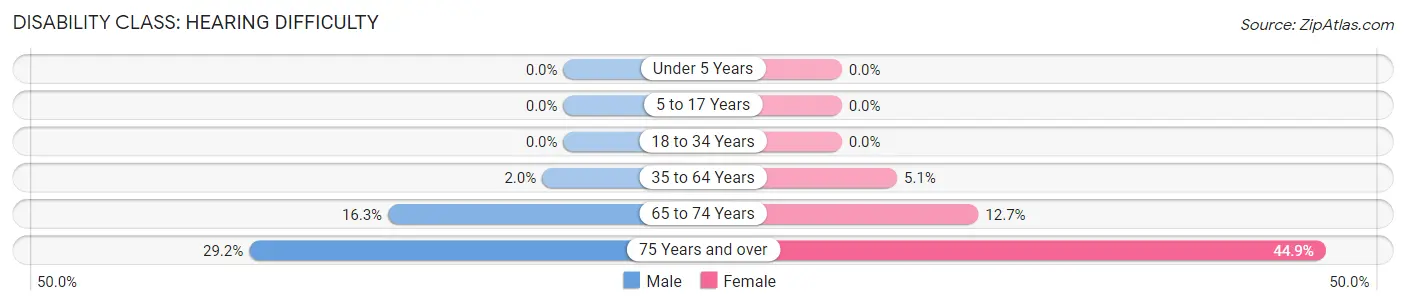
| Age Bracket | Male | Female |
| Under 5 Years | 0 (0.0%) | 0 (0.0%) |
| 5 to 17 Years | 0 (0.0%) | 0 (0.0%) |
| 18 to 34 Years | 0 (0.0%) | 0 (0.0%) |
| 35 to 64 Years | 2 (2.0%) | 10 (5.1%) |
| 65 to 74 Years | 7 (16.3%) | 9 (12.7%) |
| 75 Years and over | 28 (29.2%) | 88 (44.9%) |
Disability Class: Vision Difficulty
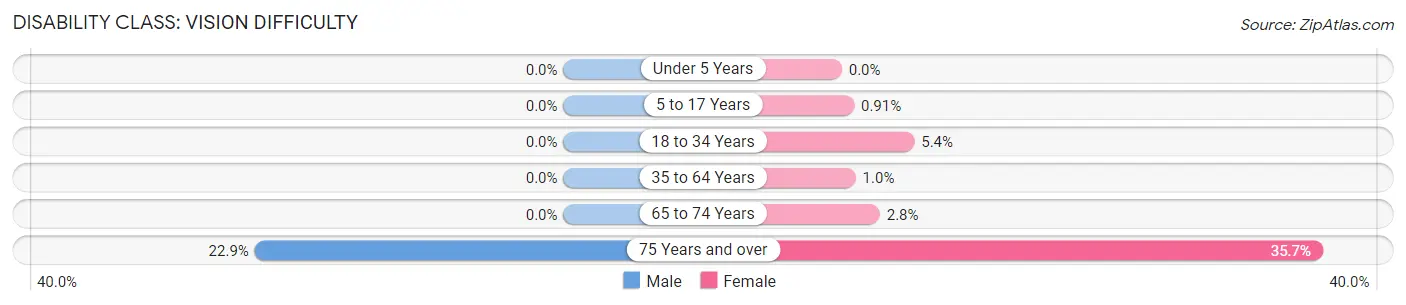
| Age Bracket | Male | Female |
| Under 5 Years | 0 (0.0%) | 0 (0.0%) |
| 5 to 17 Years | 0 (0.0%) | 1 (0.9%) |
| 18 to 34 Years | 0 (0.0%) | 7 (5.4%) |
| 35 to 64 Years | 0 (0.0%) | 2 (1.0%) |
| 65 to 74 Years | 0 (0.0%) | 2 (2.8%) |
| 75 Years and over | 22 (22.9%) | 70 (35.7%) |
Disability Class: Cognitive Difficulty
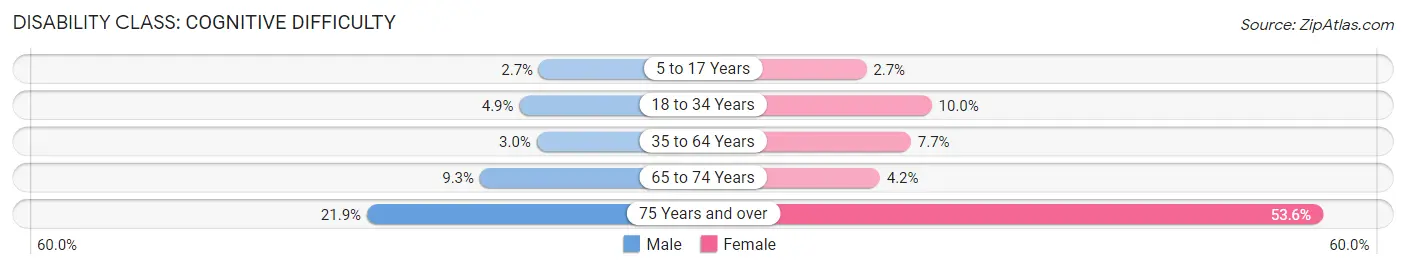
| Age Bracket | Male | Female |
| 5 to 17 Years | 4 (2.7%) | 3 (2.7%) |
| 18 to 34 Years | 7 (4.9%) | 13 (10.0%) |
| 35 to 64 Years | 3 (3.0%) | 15 (7.7%) |
| 65 to 74 Years | 4 (9.3%) | 3 (4.2%) |
| 75 Years and over | 21 (21.9%) | 105 (53.6%) |
Disability Class: Ambulatory Difficulty
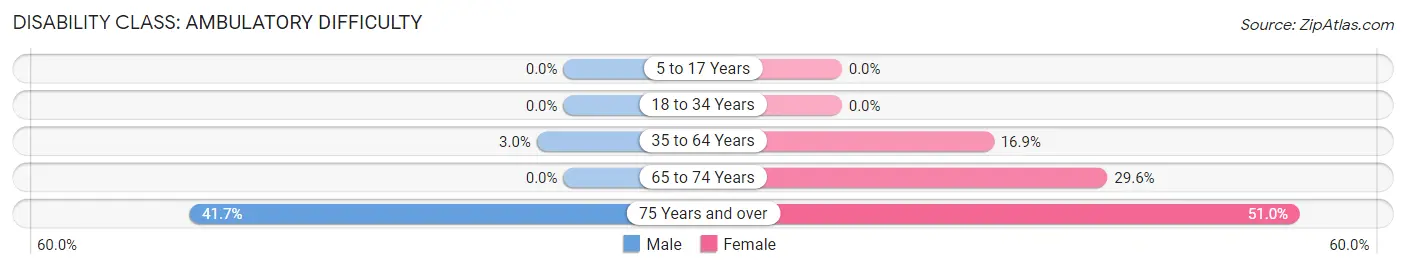
| Age Bracket | Male | Female |
| 5 to 17 Years | 0 (0.0%) | 0 (0.0%) |
| 18 to 34 Years | 0 (0.0%) | 0 (0.0%) |
| 35 to 64 Years | 3 (3.0%) | 33 (16.9%) |
| 65 to 74 Years | 0 (0.0%) | 21 (29.6%) |
| 75 Years and over | 40 (41.7%) | 100 (51.0%) |
Disability Class: Self-Care Difficulty
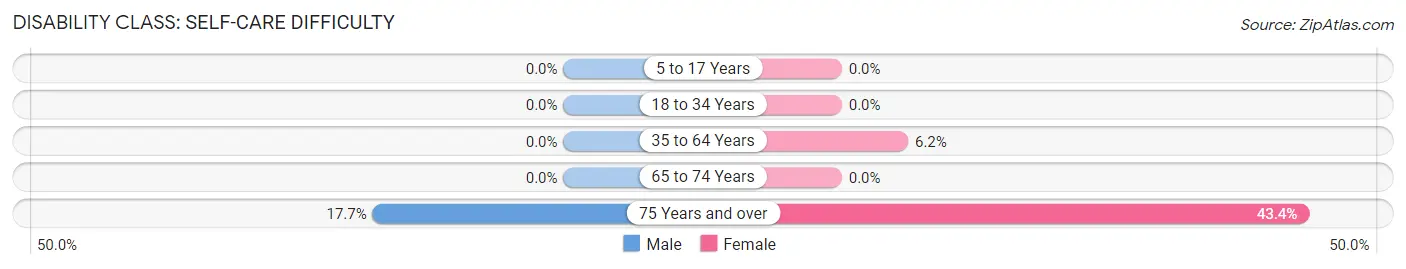
| Age Bracket | Male | Female |
| 5 to 17 Years | 0 (0.0%) | 0 (0.0%) |
| 18 to 34 Years | 0 (0.0%) | 0 (0.0%) |
| 35 to 64 Years | 0 (0.0%) | 12 (6.1%) |
| 65 to 74 Years | 0 (0.0%) | 0 (0.0%) |
| 75 Years and over | 17 (17.7%) | 85 (43.4%) |
Technology Access in Grant
Computing Device Access in Grant
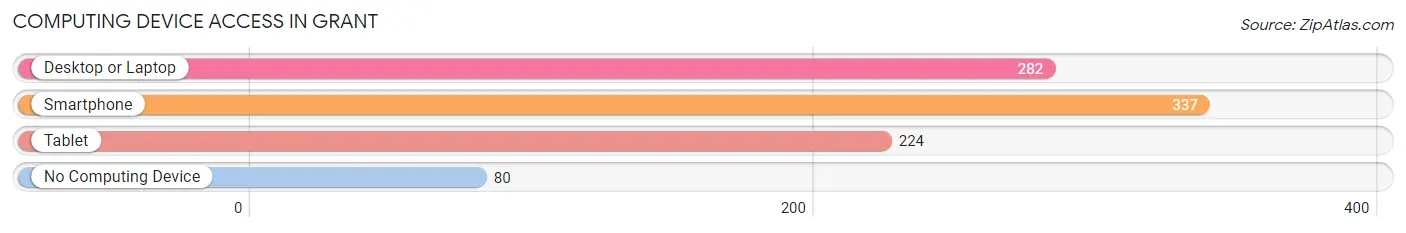
| Device Type | # Households | % Households |
| Desktop or Laptop | 282 | 62.0% |
| Smartphone | 337 | 74.1% |
| Tablet | 224 | 49.2% |
| No Computing Device | 80 | 17.6% |
| Total | 455 | 100.0% |
Internet Access in Grant
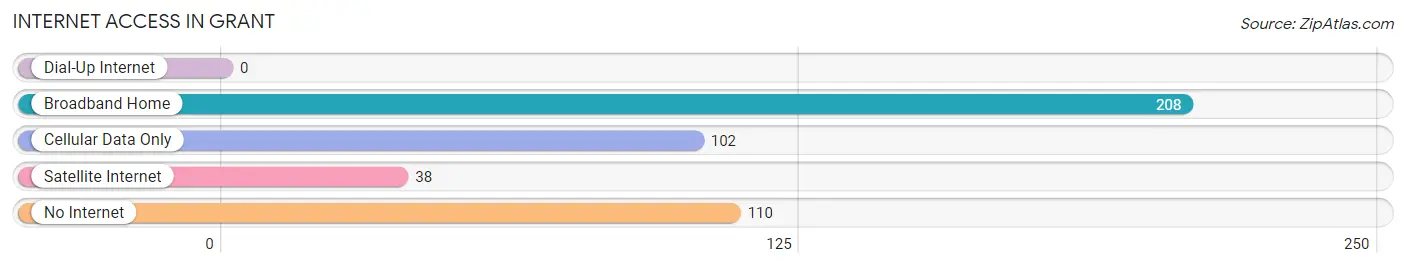
| Internet Type | # Households | % Households |
| Dial-Up Internet | 0 | 0.0% |
| Broadband Home | 208 | 45.7% |
| Cellular Data Only | 102 | 22.4% |
| Satellite Internet | 38 | 8.4% |
| No Internet | 110 | 24.2% |
| Total | 455 | 100.0% |
Grant Summary
Grant is a small city located in Newaygo County, Michigan. It is situated on the Muskegon River, approximately 25 miles northeast of Grand Rapids. The city has a population of 1,845 people, according to the 2010 census.
History
The area that is now Grant was first settled in 1837 by a group of settlers from New York. The settlement was originally known as Muskegon River Settlement, but was later renamed Grant in 1867 after President Ulysses S. Grant. The city was incorporated in 1871.
In the late 19th century, Grant was a thriving lumber town. The city was home to several sawmills and lumber companies, and the lumber industry was the main source of employment for the residents. The lumber industry declined in the early 20th century, and the city began to focus on other industries, such as agriculture and manufacturing.
Geography
Grant is located in the Muskegon River Valley, which is part of the larger Grand River Valley. The city is situated on the Muskegon River, which flows through the city from north to south. The city is surrounded by rolling hills and wooded areas.
The climate in Grant is classified as humid continental, with warm summers and cold winters. The average temperature in the summer is around 75 degrees Fahrenheit, and the average temperature in the winter is around 25 degrees Fahrenheit.
Economy
The economy of Grant is largely based on agriculture and manufacturing. The city is home to several farms, which produce a variety of crops, including corn, soybeans, and wheat. The city is also home to several manufacturing companies, which produce a variety of products, including furniture, automotive parts, and medical supplies.
The city is also home to several retail stores, restaurants, and other businesses. The city is served by several major highways, including US-131 and M-37.
Demographics
According to the 2010 census, the population of Grant was 1,845 people. The racial makeup of the city was 94.3% White, 1.2% African American, 0.7% Native American, 0.4% Asian, 0.1% Pacific Islander, and 2.3% from other races. The median household income was $37,917, and the median family income was $45,938.
The city is served by the Grant Public Schools, which includes one elementary school, one middle school, and one high school. The city is also home to several churches, including the First Presbyterian Church, the First United Methodist Church, and the Church of the Nazarene.
Conclusion
Grant is a small city located in Newaygo County, Michigan. It is situated on the Muskegon River, approximately 25 miles northeast of Grand Rapids. The city has a population of 1,845 people, according to the 2010 census. The economy of Grant is largely based on agriculture and manufacturing, and the city is served by several major highways. The racial makeup of the city is 94.3% White, 1.2% African American, 0.7% Native American, 0.4% Asian, 0.1% Pacific Islander, and 2.3% from other races. The city is served by the Grant Public Schools, and is home to several churches.
Common Questions
What is Per Capita Income in Grant?
Per Capita income in Grant is $22,813.
What is the Median Family Income in Grant?
Median Family Income in Grant is $64,750.
What is the Median Household income in Grant?
Median Household Income in Grant is $44,837.
What is Income or Wage Gap in Grant?
Income or Wage Gap in Grant is 16.8%.
Women in Grant earn 83.2 cents for every dollar earned by a man.
What is Family Income Deficit in Grant?
Family Income Deficit in Grant is $16,762.
Families that are below poverty line in Grant earn $16,762 less on average than the poverty threshold level.
What is Inequality or Gini Index in Grant?
Inequality or Gini Index in Grant is 0.47.
What is the Total Population of Grant?
Total Population of Grant is 1,347.
What is the Total Male Population of Grant?
Total Male Population of Grant is 574.
What is the Total Female Population of Grant?
Total Female Population of Grant is 773.
What is the Ratio of Males per 100 Females in Grant?
There are 74.26 Males per 100 Females in Grant.
What is the Ratio of Females per 100 Males in Grant?
There are 134.67 Females per 100 Males in Grant.
What is the Median Population Age in Grant?
Median Population Age in Grant is 37.9 Years.
What is the Average Family Size in Grant
Average Family Size in Grant is 3.2 People.
What is the Average Household Size in Grant
Average Household Size in Grant is 3.0 People.
How Large is the Labor Force in Grant?
There are 508 People in the Labor Forcein in Grant.
What is the Percentage of People in the Labor Force in Grant?
50.1% of People are in the Labor Force in Grant.
What is the Unemployment Rate in Grant?
Unemployment Rate in Grant is 11.8%.