Zip Codes with the Highest Percentage of Hispanic or Latino Population in Muskegon, MI
RELATED REPORTS & OPTIONS
Hispanic or Latino
Muskegon
Compare Zip Codes
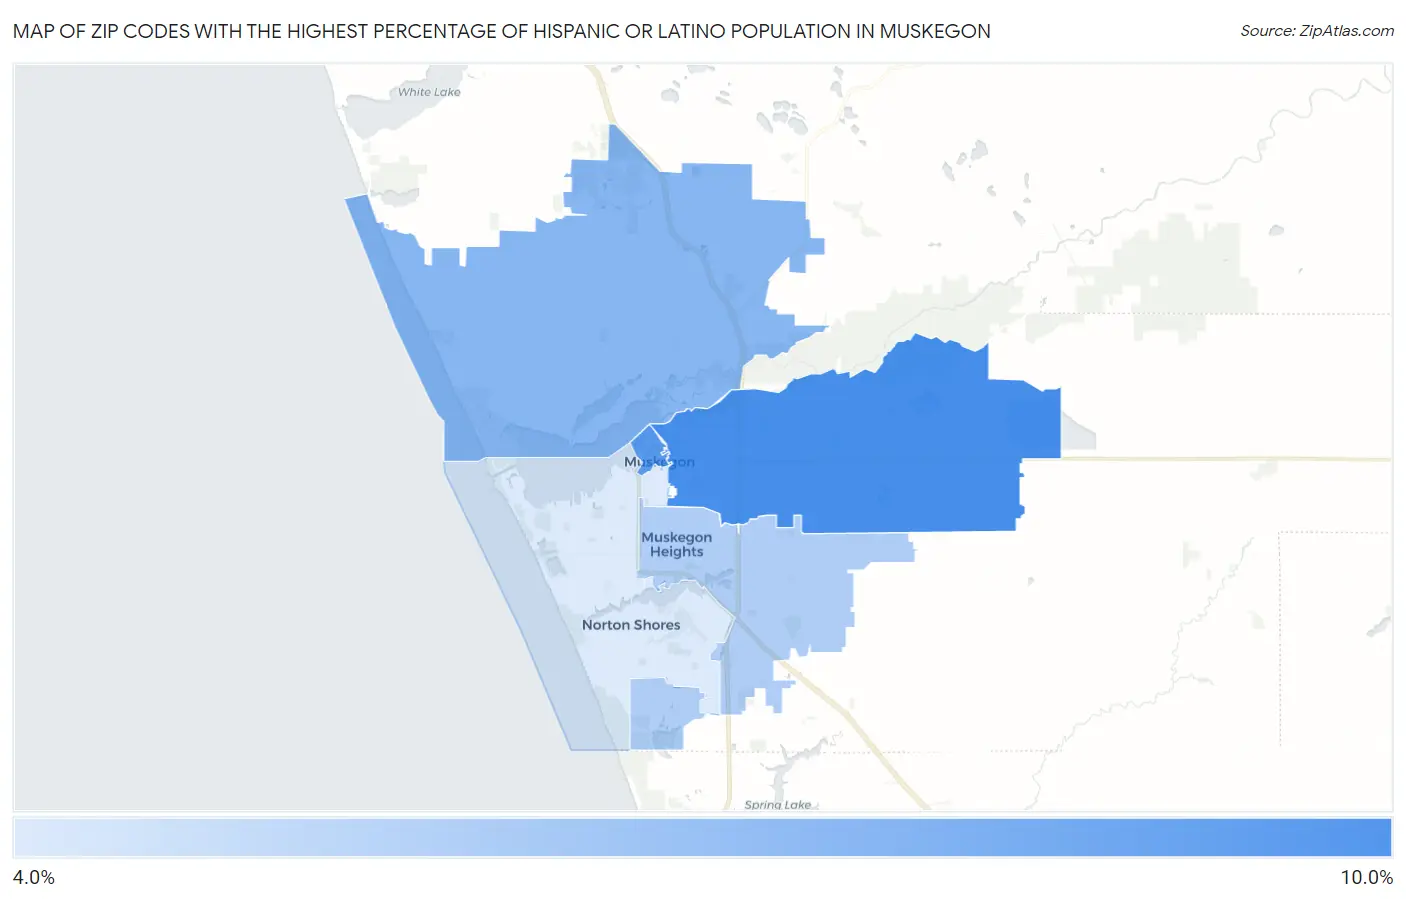
Map of Zip Codes with the Highest Percentage of Hispanic or Latino Population in Muskegon
4.5%
8.0%
Zip Codes with the Highest Percentage of Hispanic or Latino Population in Muskegon, MI
| Zip Code | Hispanic or Latino | vs State | vs National | |
| 1. | 49442 | 8.0% | 5.5%(+2.55)#101 | 18.7%(-10.6)#10,536 |
| 2. | 49440 | 7.6% | 5.5%(+2.16)#110 | 18.7%(-11.0)#10,924 |
| 3. | 49445 | 6.5% | 5.5%(+1.03)#149 | 18.7%(-12.2)#12,176 |
| 4. | 49444 | 5.6% | 5.5%(+0.096)#196 | 18.7%(-13.1)#13,385 |
| 5. | 49441 | 4.5% | 5.5%(-0.946)#289 | 18.7%(-14.1)#15,104 |
1
Common Questions
What are the Top 3 Zip Codes with the Highest Percentage of Hispanic or Latino Population in Muskegon, MI?
Top 3 Zip Codes with the Highest Percentage of Hispanic or Latino Population in Muskegon, MI are:
What zip code has the Highest Percentage of Hispanic or Latino Population in Muskegon, MI?
49442 has the Highest Percentage of Hispanic or Latino Population in Muskegon, MI with 8.0%.
What is the Percentage of Hispanic or Latino Population in Muskegon, MI?
Percentage of Hispanic or Latino Population in Muskegon is 9.7%.
What is the Percentage of Hispanic or Latino Population in Michigan?
Percentage of Hispanic or Latino Population in Michigan is 5.5%.
What is the Percentage of Hispanic or Latino Population in the United States?
Percentage of Hispanic or Latino Population in the United States is 18.7%.