Comstock Park, MI Map & Demographics
Comstock Park Map
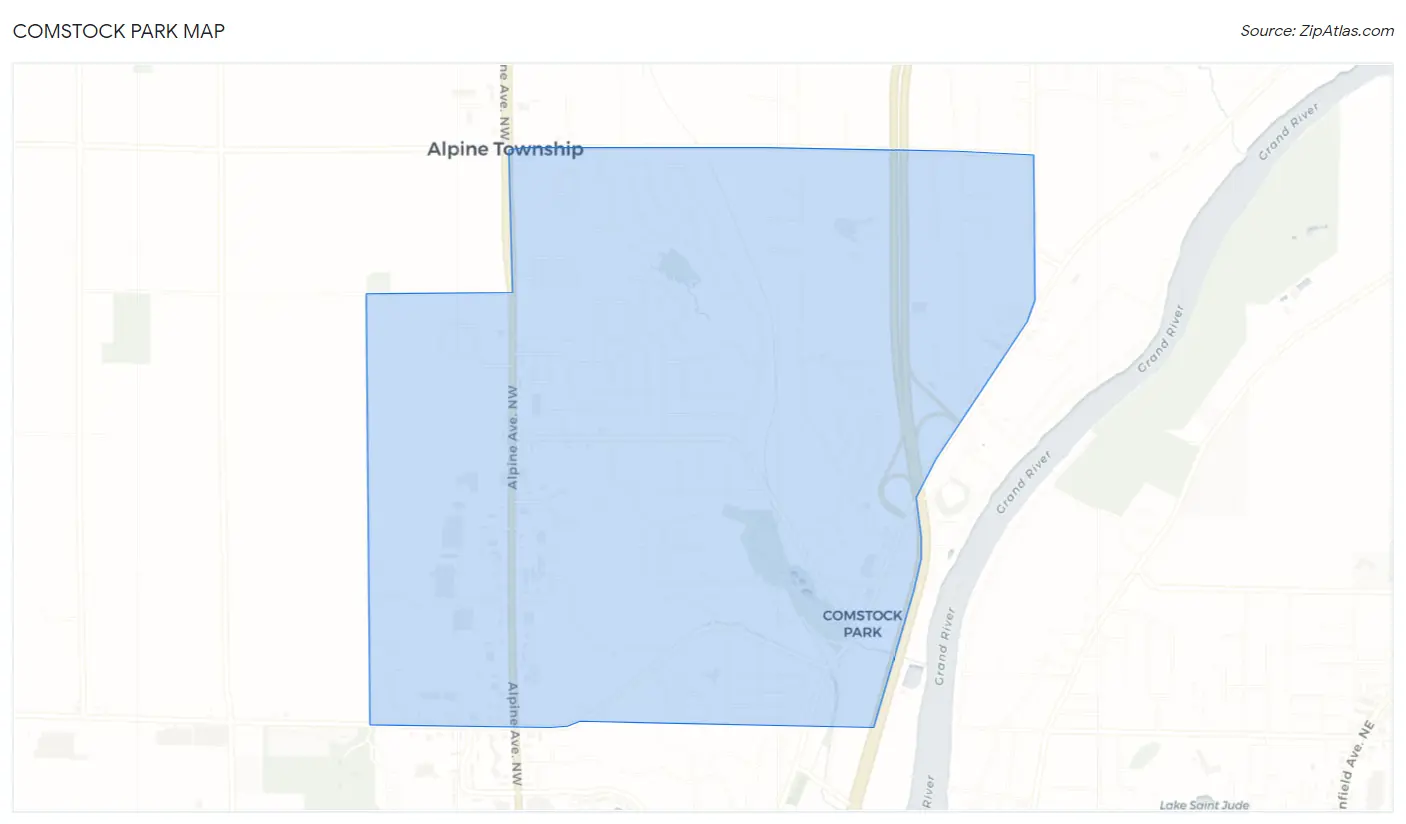
Comstock Park Overview
$30,281
PER CAPITA INCOME
$74,534
AVG FAMILY INCOME
$52,116
AVG HOUSEHOLD INCOME
26.6%
WAGE / INCOME GAP [ % ]
73.4¢/ $1
WAGE / INCOME GAP [ $ ]
$13,142
FAMILY INCOME DEFICIT
0.39
INEQUALITY / GINI INDEX
10,379
TOTAL POPULATION
5,050
MALE POPULATION
5,329
FEMALE POPULATION
94.76
MALES / 100 FEMALES
105.52
FEMALES / 100 MALES
33.8
MEDIAN AGE
3.1
AVG FAMILY SIZE
2.3
AVG HOUSEHOLD SIZE
5,686
LABOR FORCE [ PEOPLE ]
67.5%
PERCENT IN LABOR FORCE
4.0%
UNEMPLOYMENT RATE
Comstock Park Zip Codes
Comstock Park Area Codes
Income in Comstock Park
Income Overview in Comstock Park
Per Capita Income in Comstock Park is $30,281, while median incomes of families and households are $74,534 and $52,116 respectively.
| Characteristic | Number | Measure |
| Per Capita Income | 10,379 | $30,281 |
| Median Family Income | 2,533 | $74,534 |
| Mean Family Income | 2,533 | $85,253 |
| Median Household Income | 4,511 | $52,116 |
| Mean Household Income | 4,511 | $67,081 |
| Income Deficit | 2,533 | $13,142 |
| Wage / Income Gap (%) | 10,379 | 26.60% |
| Wage / Income Gap ($) | 10,379 | 73.40¢ per $1 |
| Gini / Inequality Index | 10,379 | 0.39 |
Earnings by Sex in Comstock Park
Average Earnings in Comstock Park are $36,232, $43,201 for men and $31,708 for women, a difference of 26.6%.
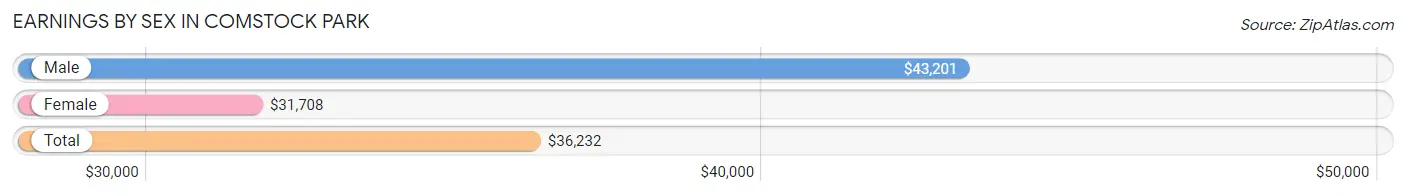
| Sex | Number | Average Earnings |
| Male | 3,044 (50.5%) | $43,201 |
| Female | 2,980 (49.5%) | $31,708 |
| Total | 6,024 (100.0%) | $36,232 |
Earnings by Sex by Income Bracket in Comstock Park
The most common earnings brackets in Comstock Park are $50,000 to $54,999 for men (338 | 11.1%) and $30,000 to $34,999 for women (292 | 9.8%).
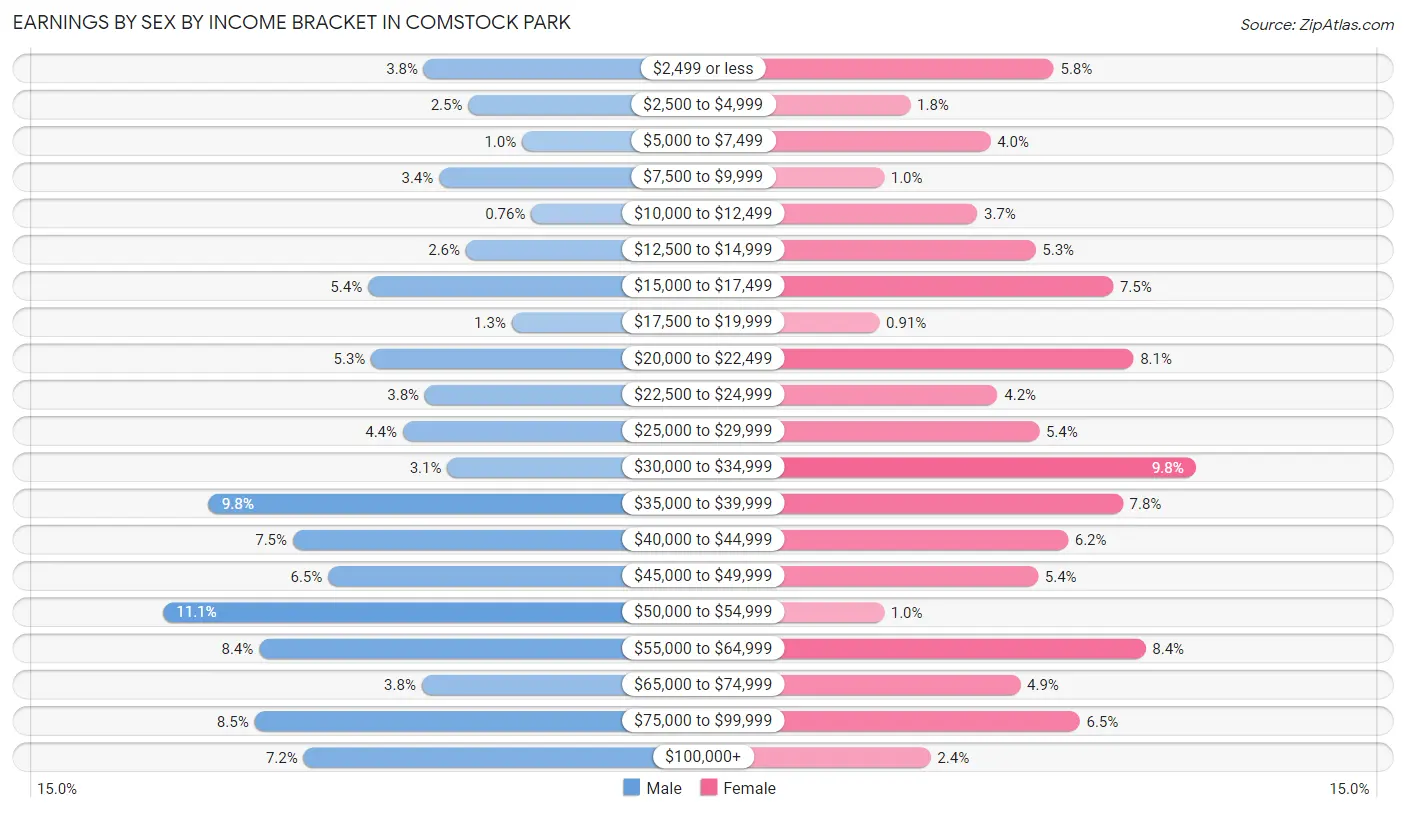
| Income | Male | Female |
| $2,499 or less | 115 (3.8%) | 173 (5.8%) |
| $2,500 to $4,999 | 77 (2.5%) | 53 (1.8%) |
| $5,000 to $7,499 | 31 (1.0%) | 120 (4.0%) |
| $7,500 to $9,999 | 102 (3.4%) | 31 (1.0%) |
| $10,000 to $12,499 | 23 (0.8%) | 109 (3.7%) |
| $12,500 to $14,999 | 79 (2.6%) | 158 (5.3%) |
| $15,000 to $17,499 | 163 (5.3%) | 223 (7.5%) |
| $17,500 to $19,999 | 40 (1.3%) | 27 (0.9%) |
| $20,000 to $22,499 | 160 (5.3%) | 240 (8.1%) |
| $22,500 to $24,999 | 114 (3.7%) | 126 (4.2%) |
| $25,000 to $29,999 | 133 (4.4%) | 161 (5.4%) |
| $30,000 to $34,999 | 95 (3.1%) | 292 (9.8%) |
| $35,000 to $39,999 | 299 (9.8%) | 231 (7.7%) |
| $40,000 to $44,999 | 227 (7.5%) | 185 (6.2%) |
| $45,000 to $49,999 | 197 (6.5%) | 160 (5.4%) |
| $50,000 to $54,999 | 338 (11.1%) | 31 (1.0%) |
| $55,000 to $64,999 | 256 (8.4%) | 250 (8.4%) |
| $65,000 to $74,999 | 117 (3.8%) | 145 (4.9%) |
| $75,000 to $99,999 | 260 (8.5%) | 195 (6.5%) |
| $100,000+ | 218 (7.2%) | 70 (2.4%) |
| Total | 3,044 (100.0%) | 2,980 (100.0%) |
Earnings by Sex by Educational Attainment in Comstock Park
Average earnings in Comstock Park are $46,506 for men and $35,086 for women, a difference of 24.6%. Men with an educational attainment of graduate degree enjoy the highest average annual earnings of $71,932, while those with high school diploma education earn the least with $36,707. Women with an educational attainment of graduate degree earn the most with the average annual earnings of $60,469, while those with high school diploma education have the smallest earnings of $21,793.
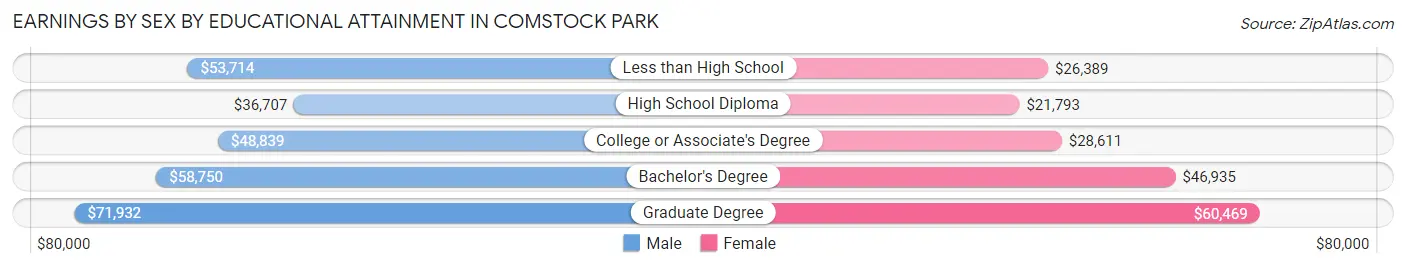
| Educational Attainment | Male Income | Female Income |
| Less than High School | $53,714 | $26,389 |
| High School Diploma | $36,707 | $21,793 |
| College or Associate's Degree | $48,839 | $28,611 |
| Bachelor's Degree | $58,750 | $46,935 |
| Graduate Degree | $71,932 | $60,469 |
| Total | $46,506 | $35,086 |
Family Income in Comstock Park
Family Income Brackets in Comstock Park
According to the Comstock Park family income data, there are 524 families falling into the $100,000 to $149,999 income range, which is the most common income bracket and makes up 20.7% of all families. Conversely, the $10,000 to $14,999 income bracket is the least frequent group with only 23 families (0.9%) belonging to this category.
| Income Bracket | # Families | % Families |
| Less than $10,000 | 134 | 5.3% |
| $10,000 to $14,999 | 23 | 0.9% |
| $15,000 to $24,999 | 94 | 3.7% |
| $25,000 to $34,999 | 155 | 6.1% |
| $35,000 to $49,999 | 400 | 15.8% |
| $50,000 to $74,999 | 471 | 18.6% |
| $75,000 to $99,999 | 466 | 18.4% |
| $100,000 to $149,999 | 524 | 20.7% |
| $150,000 to $199,999 | 134 | 5.3% |
| $200,000+ | 134 | 5.3% |
Family Income by Famaliy Size in Comstock Park
5-person families (180 | 7.1%) account for the highest median family income in Comstock Park with $92,807 per family, while 2-person families (1,249 | 49.3%) have the highest median income of $38,770 per family member.
| Income Bracket | # Families | Median Income |
| 2-Person Families | 1,249 (49.3%) | $77,540 |
| 3-Person Families | 625 (24.7%) | $59,963 |
| 4-Person Families | 375 (14.8%) | $78,194 |
| 5-Person Families | 180 (7.1%) | $92,807 |
| 6-Person Families | 73 (2.9%) | $91,339 |
| 7+ Person Families | 31 (1.2%) | $0 |
| Total | 2,533 (100.0%) | $74,534 |
Family Income by Number of Earners in Comstock Park
The median family income in Comstock Park is $74,534, with families comprising 3+ earners (224) having the highest median family income of $129,250, while families with no earners (377) have the lowest median family income of $42,813, accounting for 8.8% and 14.9% of families, respectively.
| Number of Earners | # Families | Median Income |
| No Earners | 377 (14.9%) | $42,813 |
| 1 Earner | 589 (23.3%) | $43,810 |
| 2 Earners | 1,343 (53.0%) | $92,171 |
| 3+ Earners | 224 (8.8%) | $129,250 |
| Total | 2,533 (100.0%) | $74,534 |
Household Income in Comstock Park
Household Income Brackets in Comstock Park
With 938 households falling in the category, the $35,000 to $49,999 income range is the most frequent in Comstock Park, accounting for 20.8% of all households. In contrast, only 122 households (2.7%) fall into the less than $10,000 income bracket, making it the least populous group.
| Income Bracket | # Households | % Households |
| Less than $10,000 | 122 | 2.7% |
| $10,000 to $14,999 | 131 | 2.9% |
| $15,000 to $24,999 | 708 | 15.7% |
| $25,000 to $34,999 | 248 | 5.5% |
| $35,000 to $49,999 | 938 | 20.8% |
| $50,000 to $74,999 | 925 | 20.5% |
| $75,000 to $99,999 | 586 | 13.0% |
| $100,000 to $149,999 | 555 | 12.3% |
| $150,000 to $199,999 | 167 | 3.7% |
| $200,000+ | 131 | 2.9% |
Household Income by Householder Age in Comstock Park
The median household income in Comstock Park is $52,116, with the highest median household income of $64,306 found in the 25 to 44 years age bracket for the primary householder. A total of 2,051 households (45.5%) fall into this category. Meanwhile, the 15 to 24 years age bracket for the primary householder has the lowest median household income of $33,281, with 273 households (6.0%) in this group.
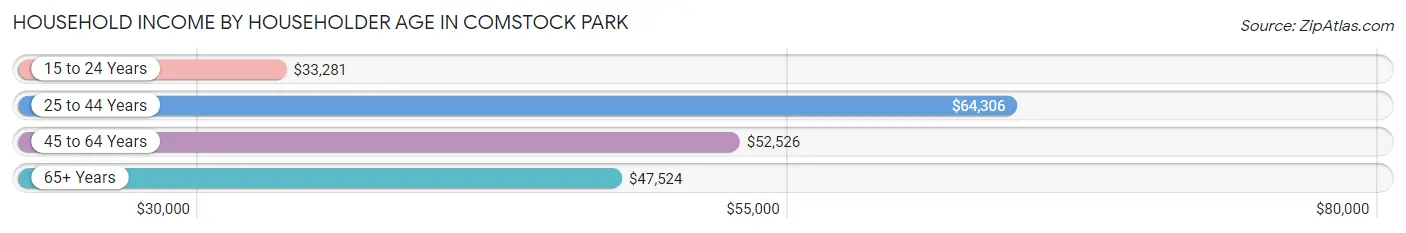
| Income Bracket | # Households | Median Income |
| 15 to 24 Years | 273 (6.0%) | $33,281 |
| 25 to 44 Years | 2,051 (45.5%) | $64,306 |
| 45 to 64 Years | 1,185 (26.3%) | $52,526 |
| 65+ Years | 1,002 (22.2%) | $47,524 |
| Total | 4,511 (100.0%) | $52,116 |
Poverty in Comstock Park
Income Below Poverty by Sex and Age in Comstock Park
With 9.5% poverty level for males and 12.2% for females among the residents of Comstock Park, 6 to 11 year old males and under 5 year old females are the most vulnerable to poverty, with 56 males (23.1%) and 86 females (35.1%) in their respective age groups living below the poverty level.
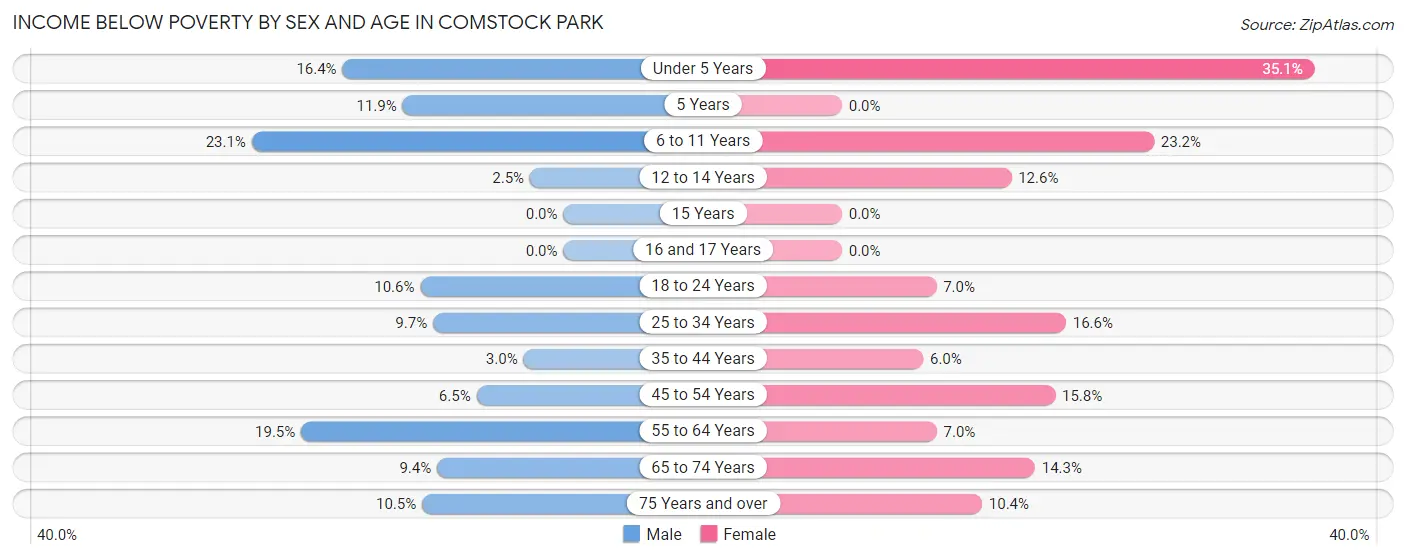
| Age Bracket | Male | Female |
| Under 5 Years | 52 (16.4%) | 86 (35.1%) |
| 5 Years | 8 (11.9%) | 0 (0.0%) |
| 6 to 11 Years | 56 (23.1%) | 92 (23.2%) |
| 12 to 14 Years | 9 (2.5%) | 20 (12.6%) |
| 15 Years | 0 (0.0%) | 0 (0.0%) |
| 16 and 17 Years | 0 (0.0%) | 0 (0.0%) |
| 18 to 24 Years | 48 (10.6%) | 42 (7.0%) |
| 25 to 34 Years | 97 (9.7%) | 167 (16.6%) |
| 35 to 44 Years | 17 (3.0%) | 53 (6.0%) |
| 45 to 54 Years | 47 (6.5%) | 44 (15.8%) |
| 55 to 64 Years | 81 (19.5%) | 40 (7.0%) |
| 65 to 74 Years | 24 (9.4%) | 43 (14.3%) |
| 75 Years and over | 41 (10.5%) | 65 (10.4%) |
| Total | 480 (9.5%) | 652 (12.2%) |
Income Above Poverty by Sex and Age in Comstock Park
According to the poverty statistics in Comstock Park, males aged 15 years and females aged 5 years are the age groups that are most secure financially, with 100.0% of males and 100.0% of females in these age groups living above the poverty line.
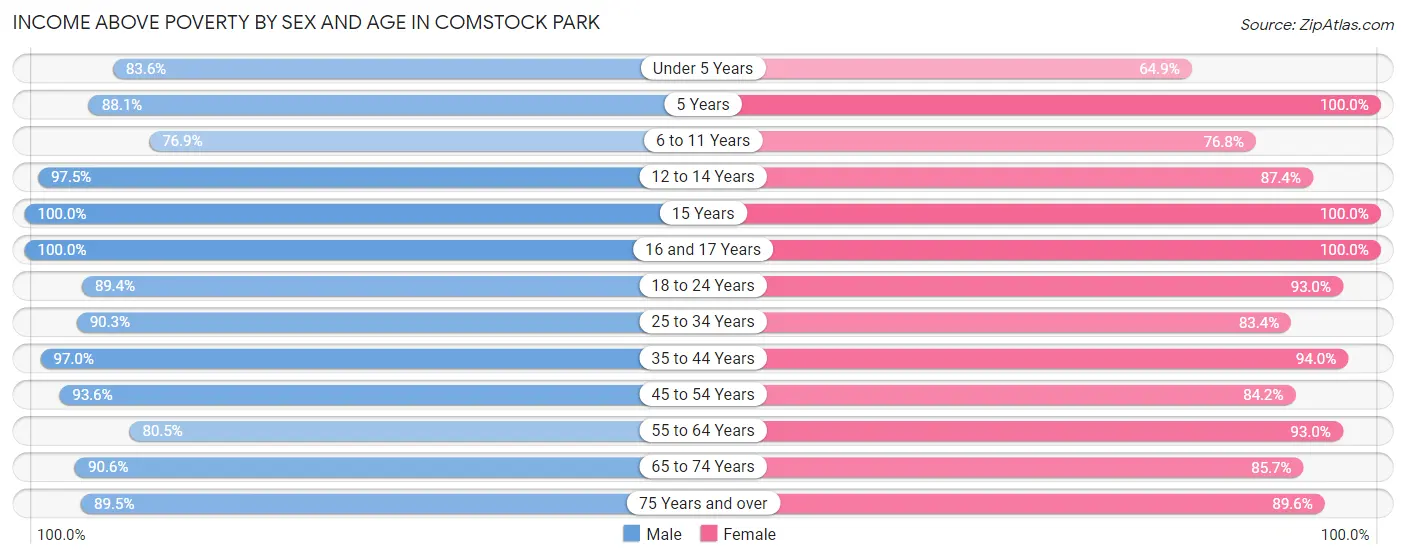
| Age Bracket | Male | Female |
| Under 5 Years | 265 (83.6%) | 159 (64.9%) |
| 5 Years | 59 (88.1%) | 42 (100.0%) |
| 6 to 11 Years | 186 (76.9%) | 305 (76.8%) |
| 12 to 14 Years | 354 (97.5%) | 139 (87.4%) |
| 15 Years | 63 (100.0%) | 60 (100.0%) |
| 16 and 17 Years | 178 (100.0%) | 170 (100.0%) |
| 18 to 24 Years | 404 (89.4%) | 557 (93.0%) |
| 25 to 34 Years | 905 (90.3%) | 837 (83.4%) |
| 35 to 44 Years | 557 (97.0%) | 826 (94.0%) |
| 45 to 54 Years | 682 (93.5%) | 234 (84.2%) |
| 55 to 64 Years | 335 (80.5%) | 528 (93.0%) |
| 65 to 74 Years | 232 (90.6%) | 257 (85.7%) |
| 75 Years and over | 350 (89.5%) | 560 (89.6%) |
| Total | 4,570 (90.5%) | 4,674 (87.8%) |
Income Below Poverty Among Married-Couple Families in Comstock Park
The poverty statistics for married-couple families in Comstock Park show that 3.9% or 65 of the total 1,669 families live below the poverty line. Families with no children have the highest poverty rate of 5.0%, comprising of 55 families. On the other hand, families with 3 or 4 children have the lowest poverty rate of 0.0%, which includes 0 families.
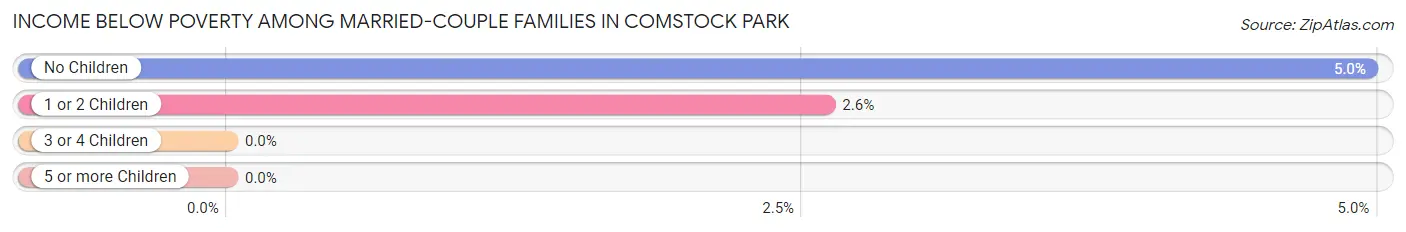
| Children | Above Poverty | Below Poverty |
| No Children | 1,053 (95.0%) | 55 (5.0%) |
| 1 or 2 Children | 374 (97.4%) | 10 (2.6%) |
| 3 or 4 Children | 158 (100.0%) | 0 (0.0%) |
| 5 or more Children | 19 (100.0%) | 0 (0.0%) |
| Total | 1,604 (96.1%) | 65 (3.9%) |
Income Below Poverty Among Single-Parent Households in Comstock Park
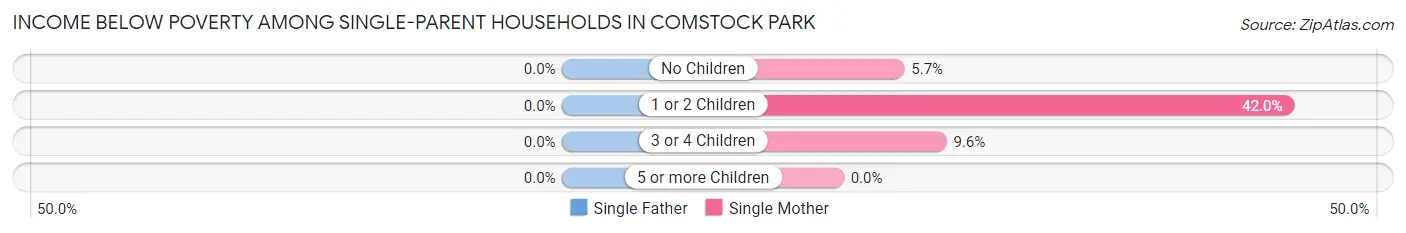
| Children | Single Father | Single Mother |
| No Children | 0 (0.0%) | 10 (5.7%) |
| 1 or 2 Children | 0 (0.0%) | 162 (42.0%) |
| 3 or 4 Children | 0 (0.0%) | 9 (9.6%) |
| 5 or more Children | 0 (0.0%) | 0 (0.0%) |
| Total | 0 (0.0%) | 181 (27.6%) |
Income Below Poverty Among Married-Couple vs Single-Parent Households in Comstock Park
The poverty data for Comstock Park shows that 65 of the married-couple family households (3.9%) and 181 of the single-parent households (20.9%) are living below the poverty level. Within the married-couple family households, those with no children have the highest poverty rate, with 55 households (5.0%) falling below the poverty line. Among the single-parent households, those with 1 or 2 children have the highest poverty rate, with 162 household (33.5%) living below poverty.
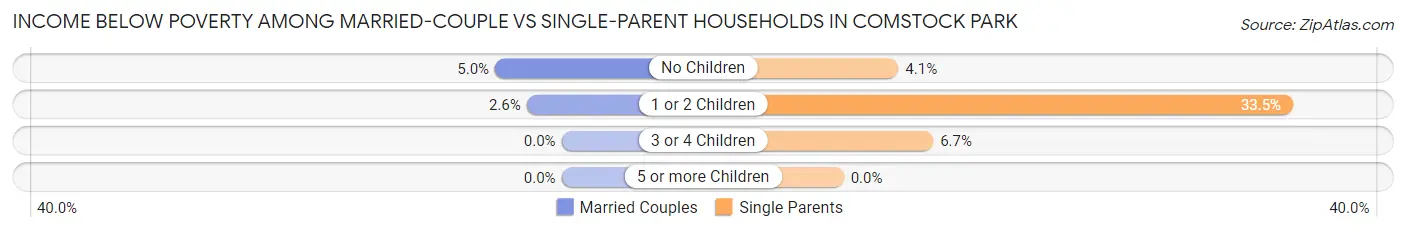
| Children | Married-Couple Families | Single-Parent Households |
| No Children | 55 (5.0%) | 10 (4.1%) |
| 1 or 2 Children | 10 (2.6%) | 162 (33.5%) |
| 3 or 4 Children | 0 (0.0%) | 9 (6.7%) |
| 5 or more Children | 0 (0.0%) | 0 (0.0%) |
| Total | 65 (3.9%) | 181 (20.9%) |
Race in Comstock Park
The most populous races in Comstock Park are White / Caucasian (8,177 | 78.8%), Hispanic or Latino (1,486 | 14.3%), and Black / African American (1,094 | 10.5%).
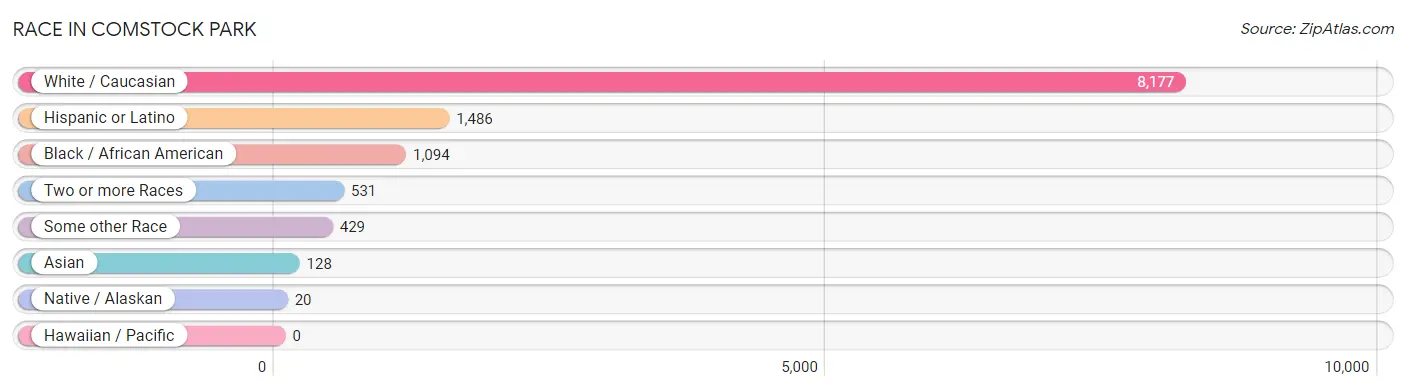
| Race | # Population | % Population |
| Asian | 128 | 1.2% |
| Black / African American | 1,094 | 10.5% |
| Hawaiian / Pacific | 0 | 0.0% |
| Hispanic or Latino | 1,486 | 14.3% |
| Native / Alaskan | 20 | 0.2% |
| White / Caucasian | 8,177 | 78.8% |
| Two or more Races | 531 | 5.1% |
| Some other Race | 429 | 4.1% |
| Total | 10,379 | 100.0% |
Ancestry in Comstock Park
The most populous ancestries reported in Comstock Park are German (1,695 | 16.3%), Polish (1,307 | 12.6%), Dutch (1,304 | 12.6%), Mexican (1,176 | 11.3%), and Irish (1,050 | 10.1%), together accounting for 62.9% of all Comstock Park residents.
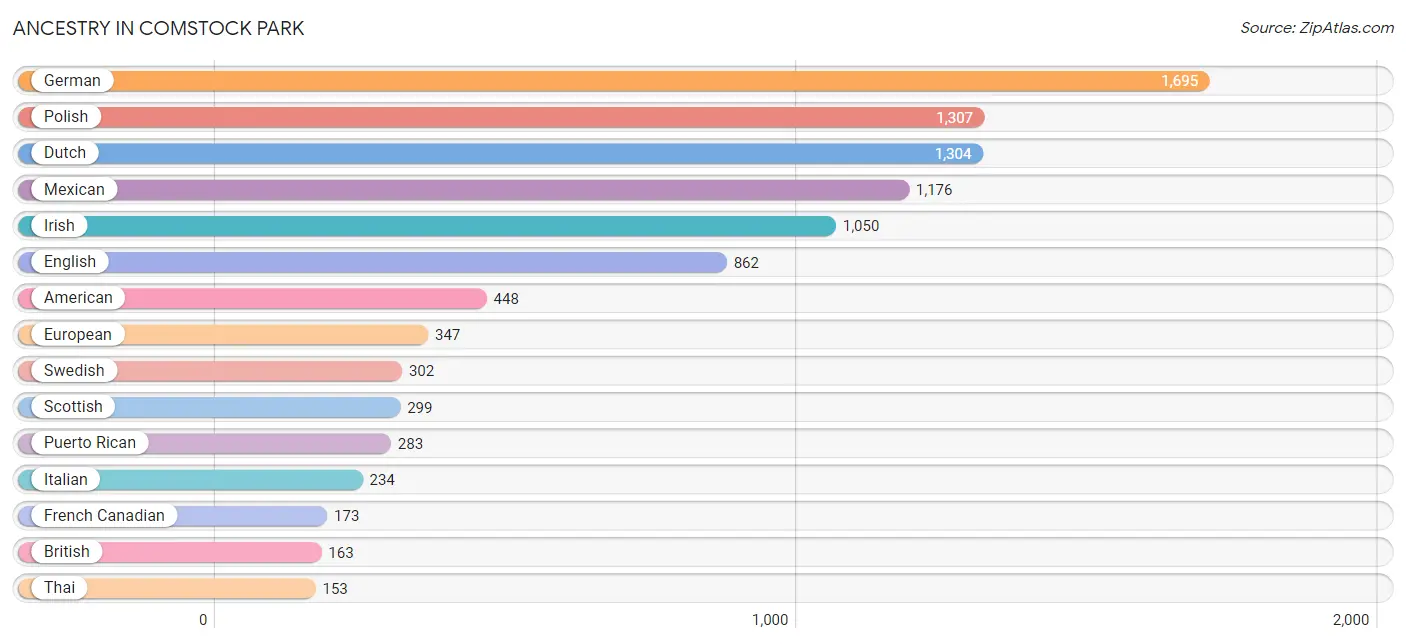
| Ancestry | # Population | % Population |
| American | 448 | 4.3% |
| Arab | 39 | 0.4% |
| Belgian | 5 | 0.1% |
| British | 163 | 1.6% |
| Bulgarian | 16 | 0.2% |
| Burmese | 52 | 0.5% |
| Central American | 26 | 0.3% |
| Cherokee | 35 | 0.3% |
| Chippewa | 55 | 0.5% |
| Croatian | 13 | 0.1% |
| Czech | 12 | 0.1% |
| Czechoslovakian | 20 | 0.2% |
| Danish | 82 | 0.8% |
| Dutch | 1,304 | 12.6% |
| English | 862 | 8.3% |
| European | 347 | 3.3% |
| Finnish | 30 | 0.3% |
| French | 115 | 1.1% |
| French Canadian | 173 | 1.7% |
| German | 1,695 | 16.3% |
| Greek | 59 | 0.6% |
| Hungarian | 108 | 1.0% |
| Indian (Asian) | 59 | 0.6% |
| Iraqi | 12 | 0.1% |
| Irish | 1,050 | 10.1% |
| Italian | 234 | 2.2% |
| Jamaican | 10 | 0.1% |
| Korean | 20 | 0.2% |
| Lebanese | 27 | 0.3% |
| Lithuanian | 25 | 0.2% |
| Luxembourger | 13 | 0.1% |
| Mexican | 1,176 | 11.3% |
| Norwegian | 40 | 0.4% |
| Polish | 1,307 | 12.6% |
| Puerto Rican | 283 | 2.7% |
| Russian | 39 | 0.4% |
| Salvadoran | 26 | 0.3% |
| Scandinavian | 37 | 0.4% |
| Scotch-Irish | 58 | 0.6% |
| Scottish | 299 | 2.9% |
| Slavic | 25 | 0.2% |
| Slovak | 13 | 0.1% |
| Spanish | 1 | 0.0% |
| Sri Lankan | 25 | 0.2% |
| Subsaharan African | 107 | 1.0% |
| Swedish | 302 | 2.9% |
| Swiss | 28 | 0.3% |
| Thai | 153 | 1.5% | View All 48 Rows |
Immigrants in Comstock Park
The most numerous immigrant groups reported in Comstock Park came from Europe (159 | 1.5%), Central America (149 | 1.4%), Latin America (149 | 1.4%), Mexico (149 | 1.4%), and Africa (107 | 1.0%), together accounting for 6.9% of all Comstock Park residents.
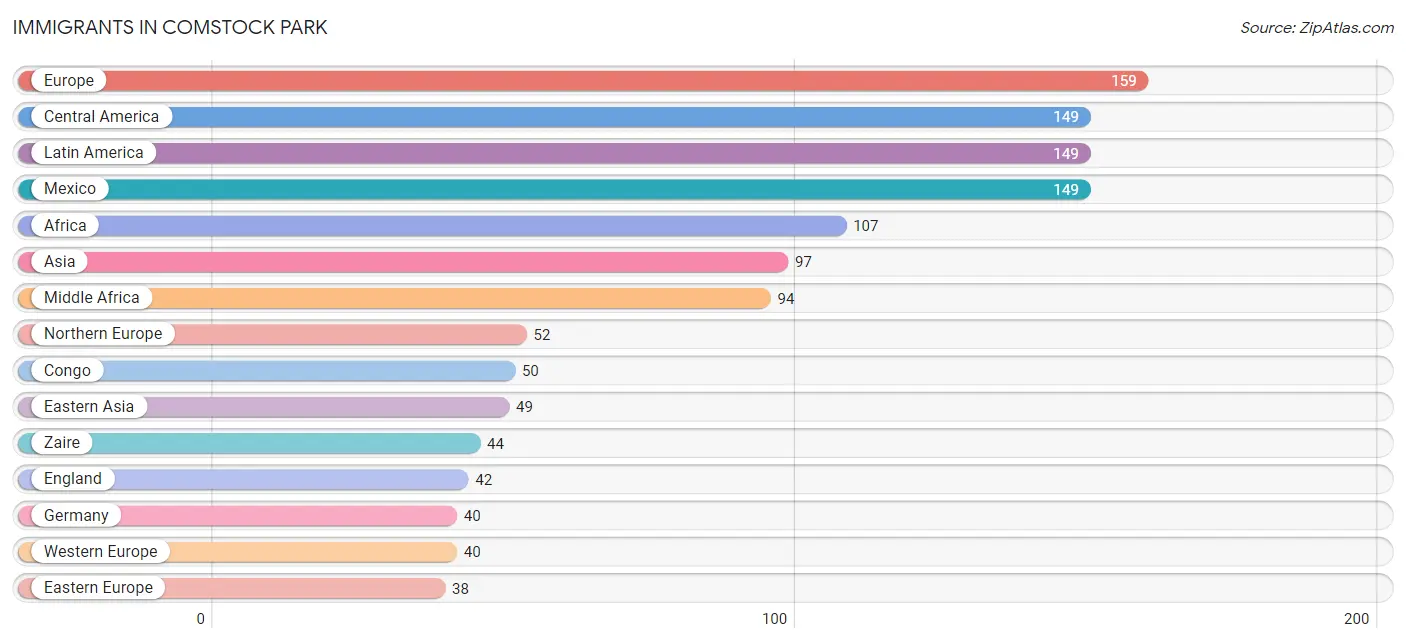
| Immigration Origin | # Population | % Population |
| Africa | 107 | 1.0% |
| Asia | 97 | 0.9% |
| Bulgaria | 16 | 0.2% |
| Canada | 28 | 0.3% |
| Central America | 149 | 1.4% |
| China | 14 | 0.1% |
| Congo | 50 | 0.5% |
| Denmark | 10 | 0.1% |
| Eastern Africa | 13 | 0.1% |
| Eastern Asia | 49 | 0.5% |
| Eastern Europe | 38 | 0.4% |
| England | 42 | 0.4% |
| Europe | 159 | 1.5% |
| Germany | 40 | 0.4% |
| Iraq | 12 | 0.1% |
| Italy | 29 | 0.3% |
| Korea | 35 | 0.3% |
| Latin America | 149 | 1.4% |
| Mexico | 149 | 1.4% |
| Middle Africa | 94 | 0.9% |
| Northern Europe | 52 | 0.5% |
| Philippines | 11 | 0.1% |
| Poland | 22 | 0.2% |
| South Eastern Asia | 36 | 0.4% |
| Southern Europe | 29 | 0.3% |
| Uganda | 13 | 0.1% |
| Vietnam | 25 | 0.2% |
| Western Asia | 12 | 0.1% |
| Western Europe | 40 | 0.4% |
| Zaire | 44 | 0.4% | View All 30 Rows |
Sex and Age in Comstock Park
Sex and Age in Comstock Park
The most populous age groups in Comstock Park are 25 to 29 Years (603 | 11.9%) for men and 25 to 29 Years (613 | 11.5%) for women.
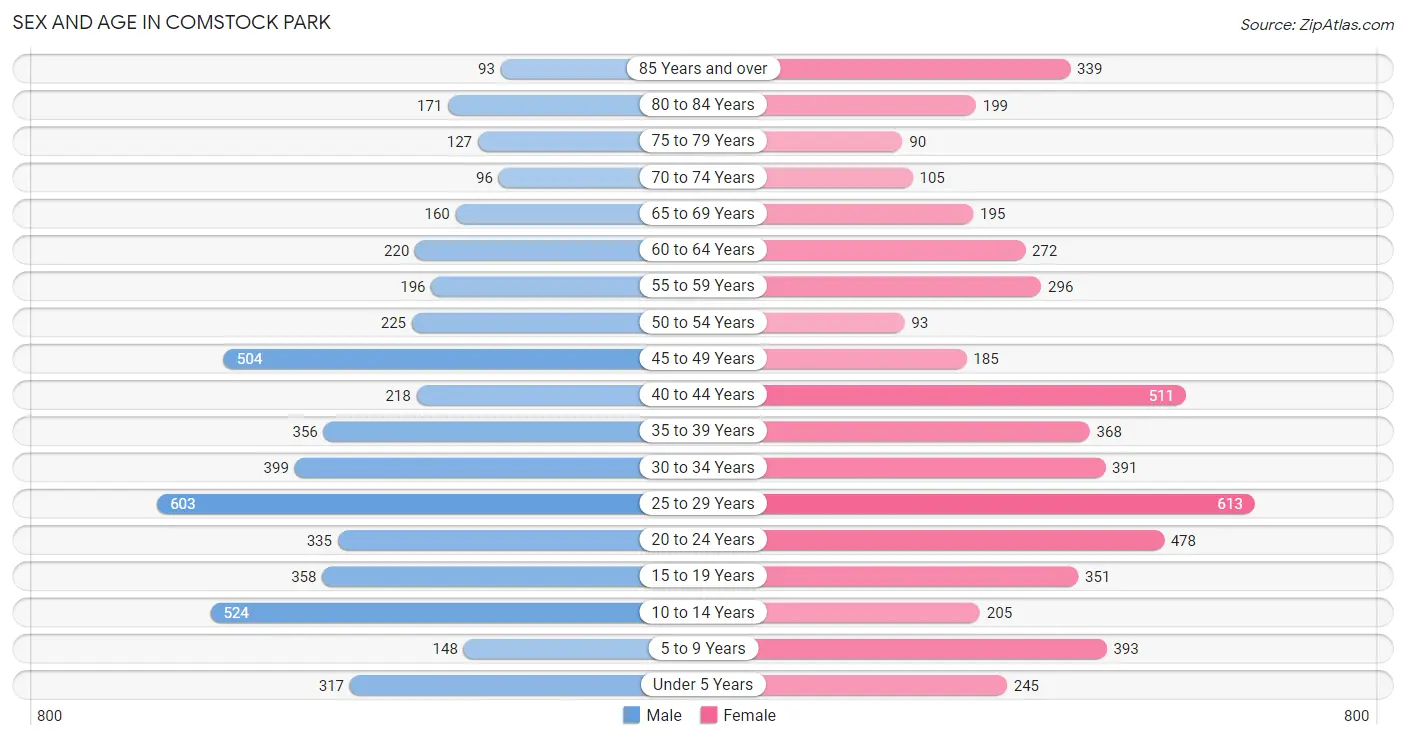
| Age Bracket | Male | Female |
| Under 5 Years | 317 (6.3%) | 245 (4.6%) |
| 5 to 9 Years | 148 (2.9%) | 393 (7.4%) |
| 10 to 14 Years | 524 (10.4%) | 205 (3.8%) |
| 15 to 19 Years | 358 (7.1%) | 351 (6.6%) |
| 20 to 24 Years | 335 (6.6%) | 478 (9.0%) |
| 25 to 29 Years | 603 (11.9%) | 613 (11.5%) |
| 30 to 34 Years | 399 (7.9%) | 391 (7.3%) |
| 35 to 39 Years | 356 (7.0%) | 368 (6.9%) |
| 40 to 44 Years | 218 (4.3%) | 511 (9.6%) |
| 45 to 49 Years | 504 (10.0%) | 185 (3.5%) |
| 50 to 54 Years | 225 (4.5%) | 93 (1.8%) |
| 55 to 59 Years | 196 (3.9%) | 296 (5.6%) |
| 60 to 64 Years | 220 (4.4%) | 272 (5.1%) |
| 65 to 69 Years | 160 (3.2%) | 195 (3.7%) |
| 70 to 74 Years | 96 (1.9%) | 105 (2.0%) |
| 75 to 79 Years | 127 (2.5%) | 90 (1.7%) |
| 80 to 84 Years | 171 (3.4%) | 199 (3.7%) |
| 85 Years and over | 93 (1.8%) | 339 (6.4%) |
| Total | 5,050 (100.0%) | 5,329 (100.0%) |
Families and Households in Comstock Park
Median Family Size in Comstock Park
The median family size in Comstock Park is 3.10 persons per family, with married-couple families (1,669 | 65.9%) accounting for the largest median family size of 3.17 persons per family. On the other hand, single male/father families (207 | 8.2%) represent the smallest median family size with 2.91 persons per family.
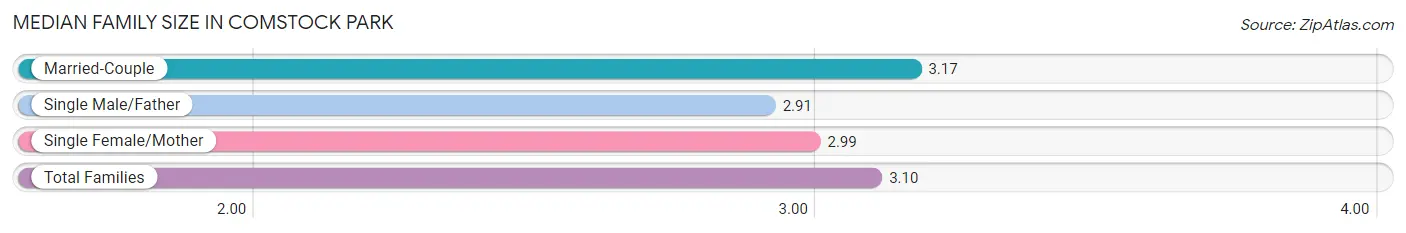
| Family Type | # Families | Family Size |
| Married-Couple | 1,669 (65.9%) | 3.17 |
| Single Male/Father | 207 (8.2%) | 2.91 |
| Single Female/Mother | 657 (25.9%) | 2.99 |
| Total Families | 2,533 (100.0%) | 3.10 |
Median Household Size in Comstock Park
The median household size in Comstock Park is 2.30 persons per household, with single female/mother households (657 | 14.6%) accounting for the largest median household size of 3.23 persons per household. non-family households (1,978 | 43.9%) represent the smallest median household size with 1.16 persons per household.
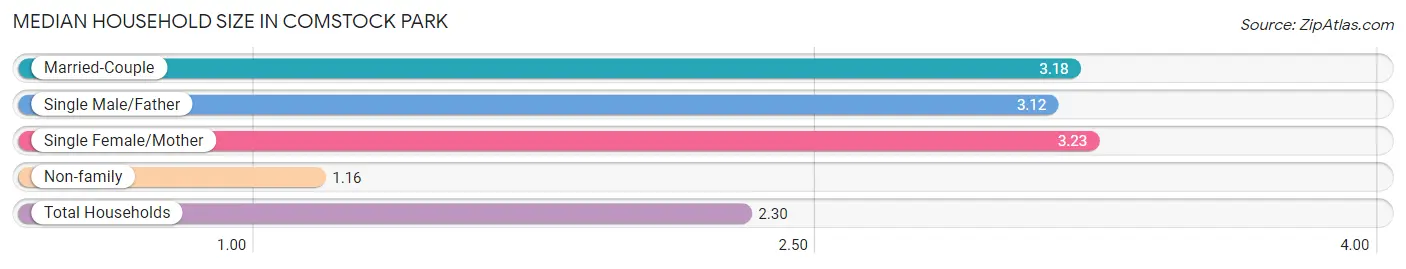
| Household Type | # Households | Household Size |
| Married-Couple | 1,669 (37.0%) | 3.18 |
| Single Male/Father | 207 (4.6%) | 3.12 |
| Single Female/Mother | 657 (14.6%) | 3.23 |
| Non-family | 1,978 (43.9%) | 1.16 |
| Total Households | 4,511 (100.0%) | 2.30 |
Household Size by Marriage Status in Comstock Park
Out of a total of 4,511 households in Comstock Park, 2,533 (56.1%) are family households, while 1,978 (43.9%) are nonfamily households. The most numerous type of family households are 2-person households, comprising 1,188, and the most common type of nonfamily households are 1-person households, comprising 1,677.
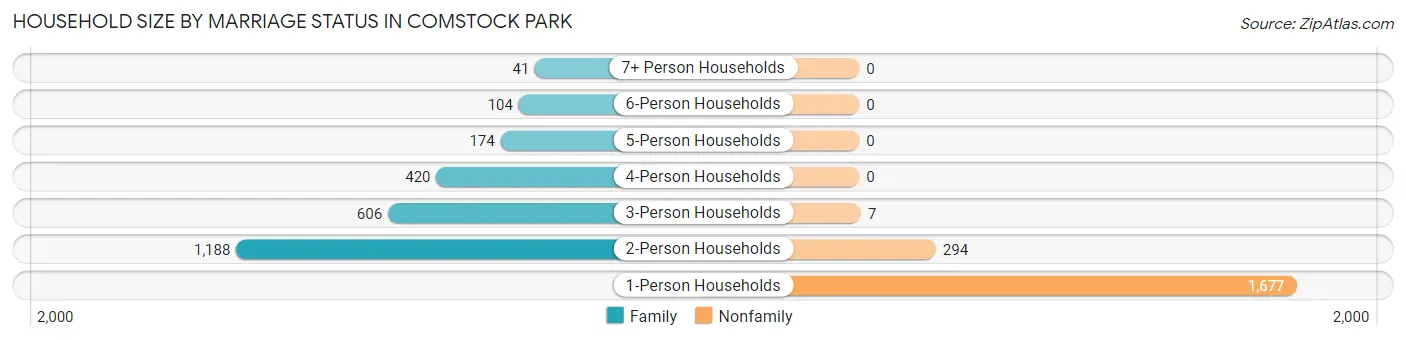
| Household Size | Family Households | Nonfamily Households |
| 1-Person Households | - | 1,677 (37.2%) |
| 2-Person Households | 1,188 (26.3%) | 294 (6.5%) |
| 3-Person Households | 606 (13.4%) | 7 (0.2%) |
| 4-Person Households | 420 (9.3%) | 0 (0.0%) |
| 5-Person Households | 174 (3.9%) | 0 (0.0%) |
| 6-Person Households | 104 (2.3%) | 0 (0.0%) |
| 7+ Person Households | 41 (0.9%) | 0 (0.0%) |
| Total | 2,533 (56.1%) | 1,978 (43.9%) |
Female Fertility in Comstock Park
Fertility by Age in Comstock Park
Average fertility rate in Comstock Park is 54.0 births per 1,000 women. Women in the age bracket of 20 to 34 years have the highest fertility rate with 73.0 births per 1,000 women. Women in the age bracket of 20 to 34 years acount for 67.9% of all women with births.
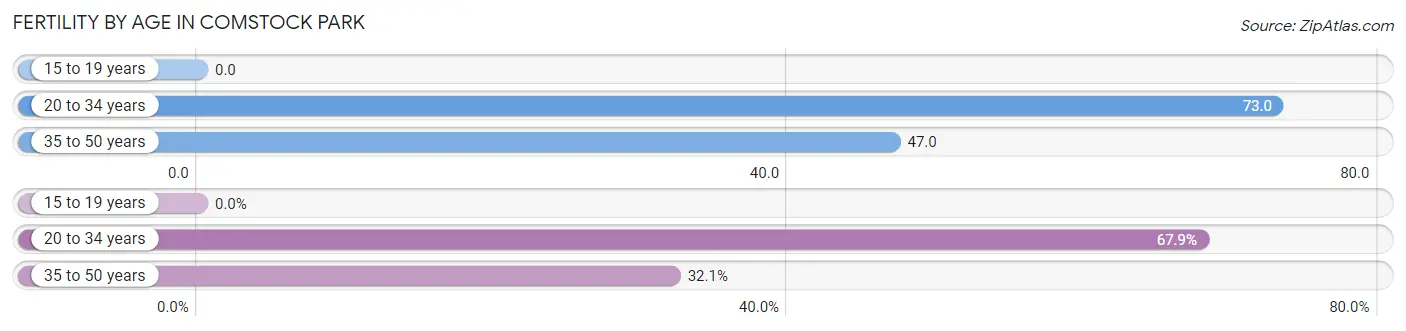
| Age Bracket | Women with Births | Births / 1,000 Women |
| 15 to 19 years | 0 (0.0%) | 0.0 |
| 20 to 34 years | 108 (67.9%) | 73.0 |
| 35 to 50 years | 51 (32.1%) | 47.0 |
| Total | 159 (100.0%) | 54.0 |
Fertility by Age by Marriage Status in Comstock Park
32.7% of women with births (159) in Comstock Park are married. The highest percentage of unmarried women with births falls into 20 to 34 years age bracket with 68.5% of them unmarried at the time of birth, while the lowest percentage of unmarried women with births belong to 35 to 50 years age bracket with 64.7% of them unmarried.
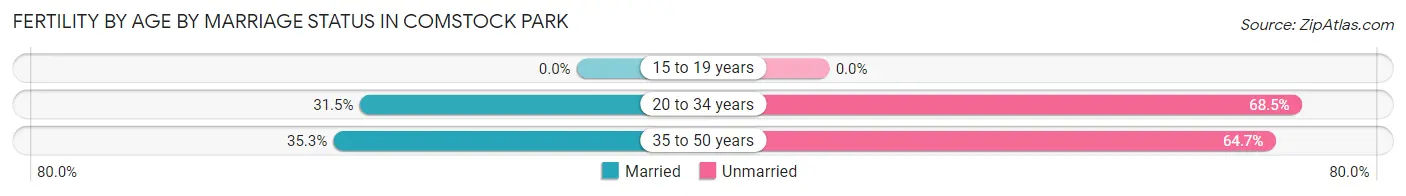
| Age Bracket | Married | Unmarried |
| 15 to 19 years | 0 (0.0%) | 0 (0.0%) |
| 20 to 34 years | 34 (31.5%) | 74 (68.5%) |
| 35 to 50 years | 18 (35.3%) | 33 (64.7%) |
| Total | 52 (32.7%) | 107 (67.3%) |
Fertility by Education in Comstock Park
Average fertility rate in Comstock Park is 54.0 births per 1,000 women. Women with the education attainment of high school diploma have the highest fertility rate of 108.0 births per 1,000 women, while women with the education attainment of bachelor's degree have the lowest fertility at 10.0 births per 1,000 women. Women with the education attainment of high school diploma represent 49.1% of all women with births.
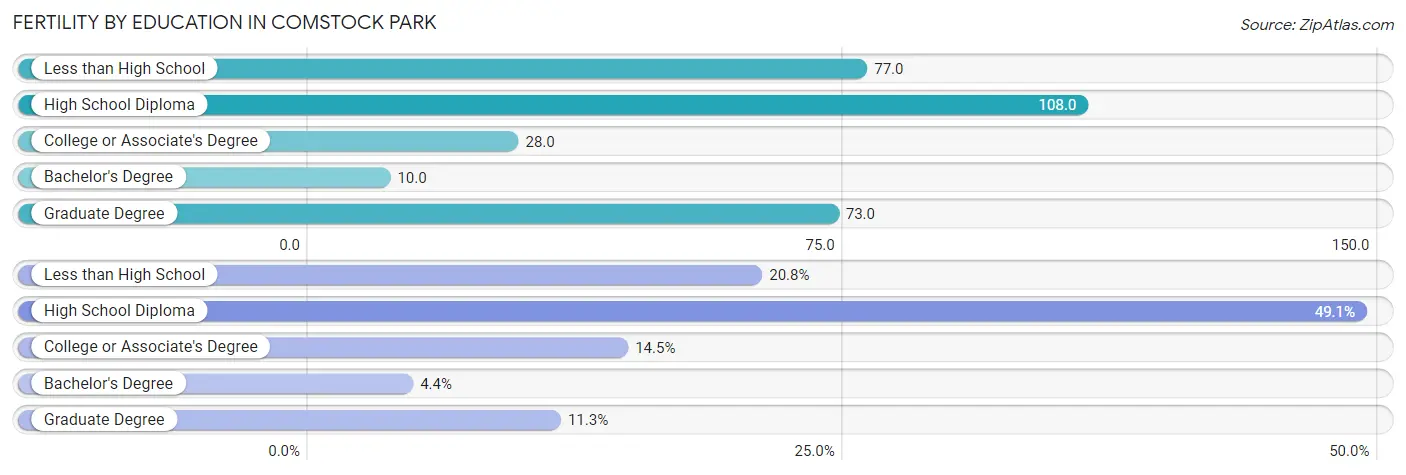
| Educational Attainment | Women with Births | Births / 1,000 Women |
| Less than High School | 33 (20.7%) | 77.0 |
| High School Diploma | 78 (49.1%) | 108.0 |
| College or Associate's Degree | 23 (14.5%) | 28.0 |
| Bachelor's Degree | 7 (4.4%) | 10.0 |
| Graduate Degree | 18 (11.3%) | 73.0 |
| Total | 159 (100.0%) | 54.0 |
Fertility by Education by Marriage Status in Comstock Park
67.3% of women with births in Comstock Park are unmarried. Women with the educational attainment of bachelor's degree are most likely to be married with 100.0% of them married at childbirth, while women with the educational attainment of less than high school are least likely to be married with 100.0% of them unmarried at childbirth.
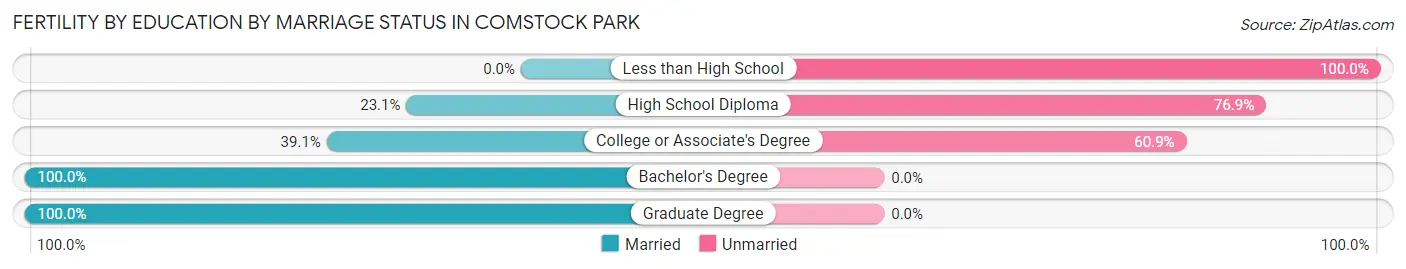
| Educational Attainment | Married | Unmarried |
| Less than High School | 0 (0.0%) | 33 (100.0%) |
| High School Diploma | 18 (23.1%) | 60 (76.9%) |
| College or Associate's Degree | 9 (39.1%) | 14 (60.9%) |
| Bachelor's Degree | 7 (100.0%) | 0 (0.0%) |
| Graduate Degree | 18 (100.0%) | 0 (0.0%) |
| Total | 52 (32.7%) | 107 (67.3%) |
Employment Characteristics in Comstock Park
Employment by Class of Employer in Comstock Park
Among the 5,373 employed individuals in Comstock Park, private company employees (4,206 | 78.3%), not-for-profit organizations (470 | 8.7%), and local government employees (233 | 4.3%) make up the most common classes of employment.
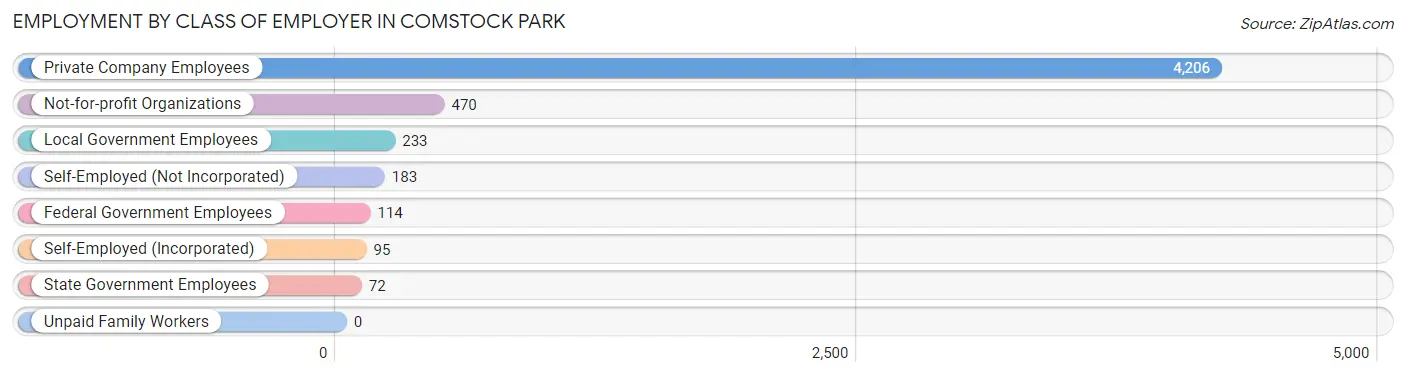
| Employer Class | # Employees | % Employees |
| Private Company Employees | 4,206 | 78.3% |
| Self-Employed (Incorporated) | 95 | 1.8% |
| Self-Employed (Not Incorporated) | 183 | 3.4% |
| Not-for-profit Organizations | 470 | 8.7% |
| Local Government Employees | 233 | 4.3% |
| State Government Employees | 72 | 1.3% |
| Federal Government Employees | 114 | 2.1% |
| Unpaid Family Workers | 0 | 0.0% |
| Total | 5,373 | 100.0% |
Employment Status by Age in Comstock Park
According to the labor force statistics for Comstock Park, out of the total population over 16 years of age (8,424), 67.5% or 5,686 individuals are in the labor force, with 4.0% or 227 of them unemployed. The age group with the highest labor force participation rate is 25 to 29 years, with 91.8% or 1,116 individuals in the labor force. Within the labor force, the 20 to 24 years age range has the highest percentage of unemployed individuals, with 12.1% or 82 of them being unemployed.
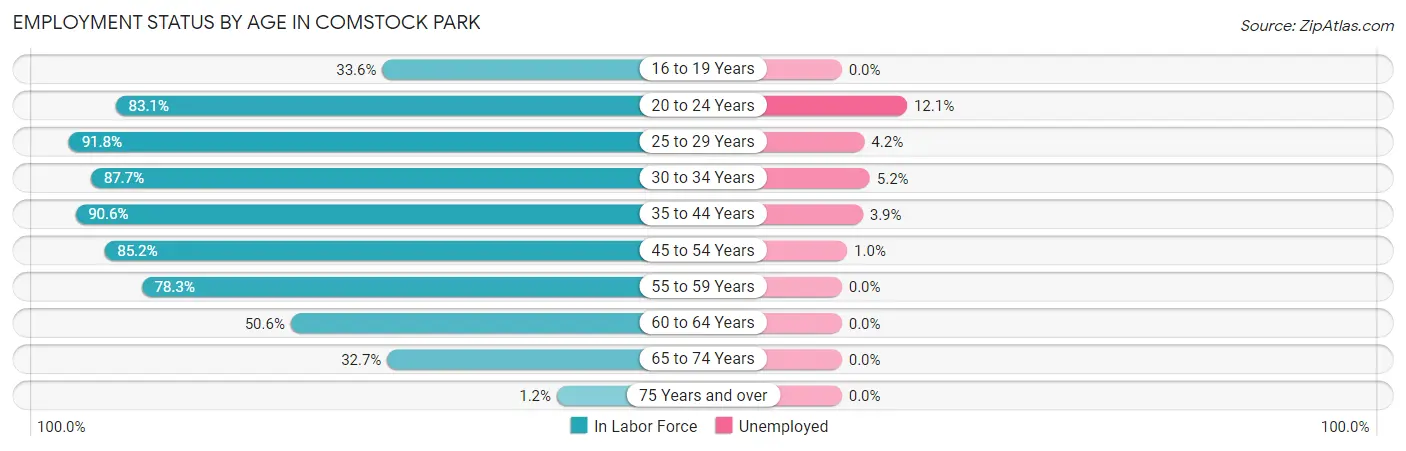
| Age Bracket | In Labor Force | Unemployed |
| 16 to 19 Years | 197 (33.6%) | 0 (0.0%) |
| 20 to 24 Years | 676 (83.1%) | 82 (12.1%) |
| 25 to 29 Years | 1,116 (91.8%) | 47 (4.2%) |
| 30 to 34 Years | 693 (87.7%) | 36 (5.2%) |
| 35 to 44 Years | 1,316 (90.6%) | 51 (3.9%) |
| 45 to 54 Years | 858 (85.2%) | 9 (1.0%) |
| 55 to 59 Years | 385 (78.3%) | 0 (0.0%) |
| 60 to 64 Years | 249 (50.6%) | 0 (0.0%) |
| 65 to 74 Years | 182 (32.7%) | 0 (0.0%) |
| 75 Years and over | 12 (1.2%) | 0 (0.0%) |
| Total | 5,686 (67.5%) | 227 (4.0%) |
Employment Status by Educational Attainment in Comstock Park
According to labor force statistics for Comstock Park, 84.7% of individuals (4,616) out of the total population between 25 and 64 years of age (5,450) are in the labor force, with 3.1% or 143 of them being unemployed. The group with the highest labor force participation rate are those with the educational attainment of bachelor's degree or higher, with 90.7% or 1,408 individuals in the labor force. Within the labor force, individuals with less than high school education have the highest percentage of unemployment, with 10.6% or 33 of them being unemployed.
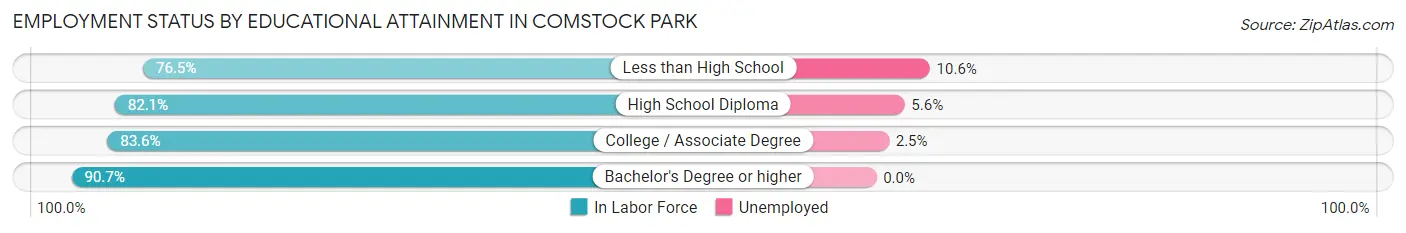
| Educational Attainment | In Labor Force | Unemployed |
| Less than High School | 310 (76.5%) | 43 (10.6%) |
| High School Diploma | 1,186 (82.1%) | 81 (5.6%) |
| College / Associate Degree | 1,712 (83.6%) | 51 (2.5%) |
| Bachelor's Degree or higher | 1,408 (90.7%) | 0 (0.0%) |
| Total | 4,616 (84.7%) | 169 (3.1%) |
Employment Occupations by Sex in Comstock Park
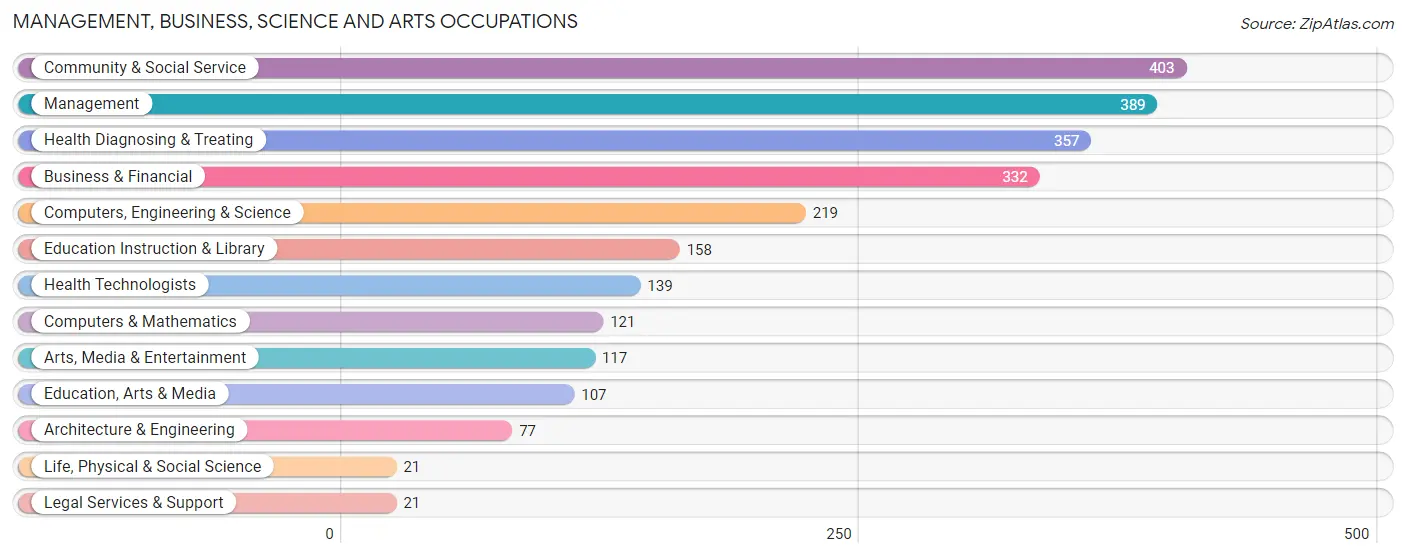
Management, Business, Science and Arts Occupations
The most common Management, Business, Science and Arts occupations in Comstock Park are Community & Social Service (403 | 7.4%), Management (389 | 7.2%), Health Diagnosing & Treating (357 | 6.6%), Business & Financial (332 | 6.1%), and Computers, Engineering & Science (219 | 4.1%).
Management, Business, Science and Arts Occupations by Sex
Within the Management, Business, Science and Arts occupations in Comstock Park, the most male-oriented occupations are Computers & Mathematics (76.9%), Computers, Engineering & Science (72.2%), and Architecture & Engineering (67.5%), while the most female-oriented occupations are Legal Services & Support (100.0%), Health Technologists (94.2%), and Education Instruction & Library (93.0%).
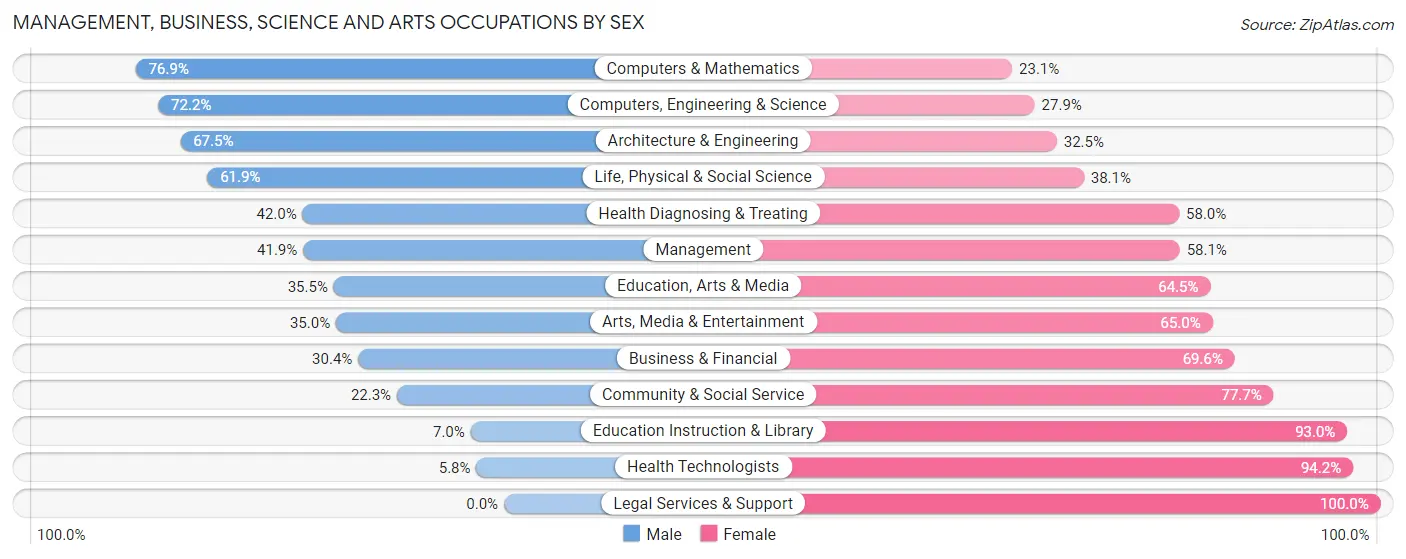
| Occupation | Male | Female |
| Management | 163 (41.9%) | 226 (58.1%) |
| Business & Financial | 101 (30.4%) | 231 (69.6%) |
| Computers, Engineering & Science | 158 (72.2%) | 61 (27.9%) |
| Computers & Mathematics | 93 (76.9%) | 28 (23.1%) |
| Architecture & Engineering | 52 (67.5%) | 25 (32.5%) |
| Life, Physical & Social Science | 13 (61.9%) | 8 (38.1%) |
| Community & Social Service | 90 (22.3%) | 313 (77.7%) |
| Education, Arts & Media | 38 (35.5%) | 69 (64.5%) |
| Legal Services & Support | 0 (0.0%) | 21 (100.0%) |
| Education Instruction & Library | 11 (7.0%) | 147 (93.0%) |
| Arts, Media & Entertainment | 41 (35.0%) | 76 (65.0%) |
| Health Diagnosing & Treating | 150 (42.0%) | 207 (58.0%) |
| Health Technologists | 8 (5.8%) | 131 (94.2%) |
| Total (Category) | 662 (38.9%) | 1,038 (61.1%) |
| Total (Overall) | 2,851 (52.7%) | 2,555 (47.3%) |
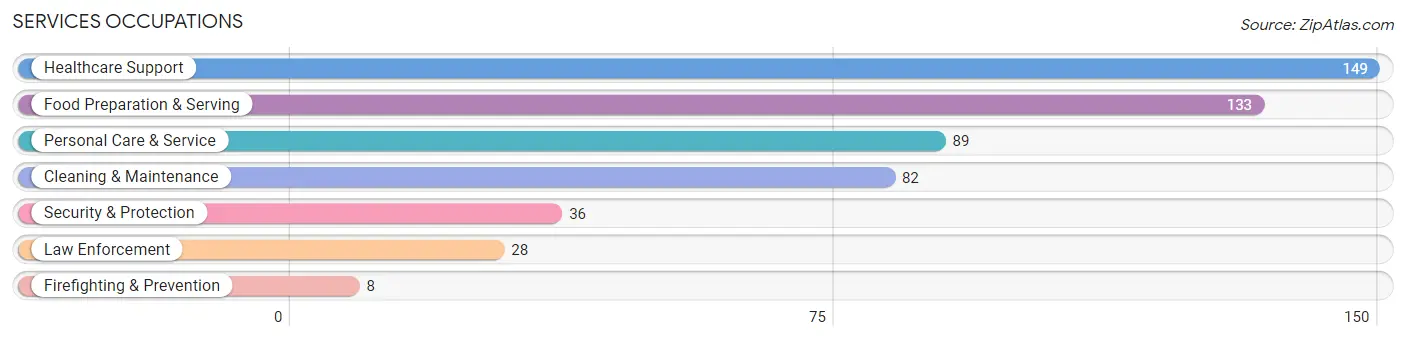
Services Occupations
The most common Services occupations in Comstock Park are Healthcare Support (149 | 2.8%), Food Preparation & Serving (133 | 2.5%), Personal Care & Service (89 | 1.7%), Cleaning & Maintenance (82 | 1.5%), and Security & Protection (36 | 0.7%).
Services Occupations by Sex
Within the Services occupations in Comstock Park, the most male-oriented occupations are Security & Protection (100.0%), Firefighting & Prevention (100.0%), and Law Enforcement (100.0%), while the most female-oriented occupations are Healthcare Support (82.6%), Personal Care & Service (67.4%), and Cleaning & Maintenance (63.4%).
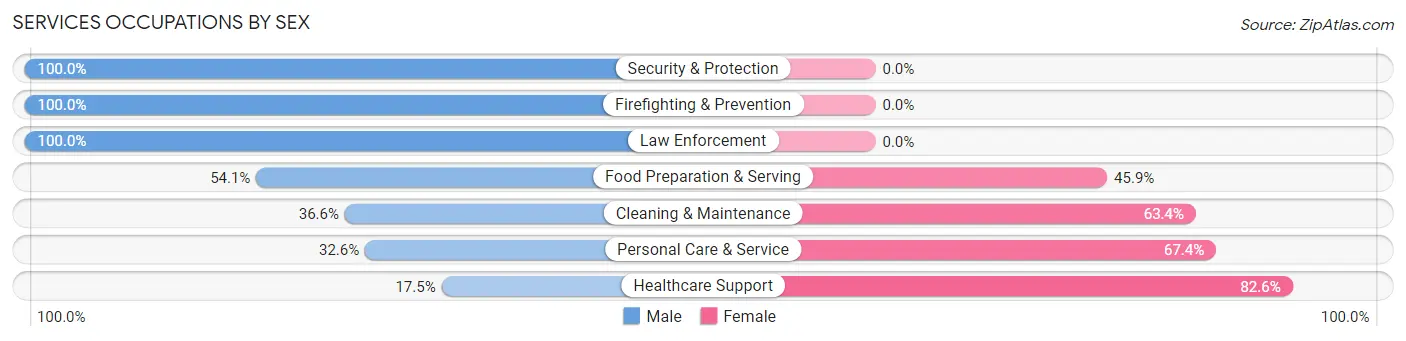
| Occupation | Male | Female |
| Healthcare Support | 26 (17.4%) | 123 (82.6%) |
| Security & Protection | 36 (100.0%) | 0 (0.0%) |
| Firefighting & Prevention | 8 (100.0%) | 0 (0.0%) |
| Law Enforcement | 28 (100.0%) | 0 (0.0%) |
| Food Preparation & Serving | 72 (54.1%) | 61 (45.9%) |
| Cleaning & Maintenance | 30 (36.6%) | 52 (63.4%) |
| Personal Care & Service | 29 (32.6%) | 60 (67.4%) |
| Total (Category) | 193 (39.5%) | 296 (60.5%) |
| Total (Overall) | 2,851 (52.7%) | 2,555 (47.3%) |
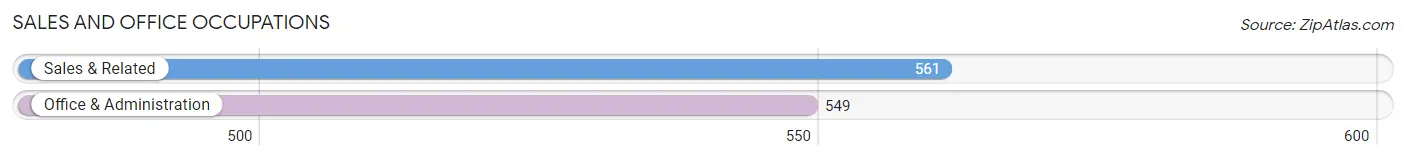
Sales and Office Occupations
The most common Sales and Office occupations in Comstock Park are Sales & Related (561 | 10.4%), and Office & Administration (549 | 10.2%).
Sales and Office Occupations by Sex
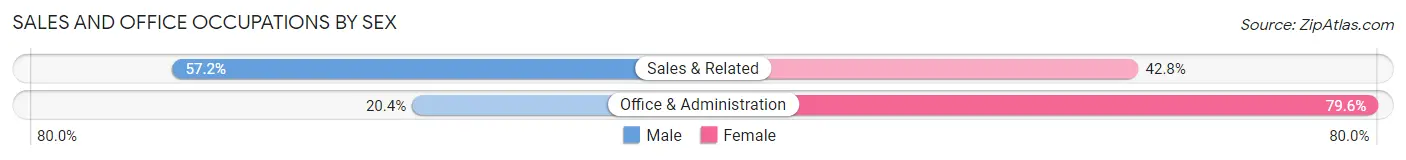
| Occupation | Male | Female |
| Sales & Related | 321 (57.2%) | 240 (42.8%) |
| Office & Administration | 112 (20.4%) | 437 (79.6%) |
| Total (Category) | 433 (39.0%) | 677 (61.0%) |
| Total (Overall) | 2,851 (52.7%) | 2,555 (47.3%) |
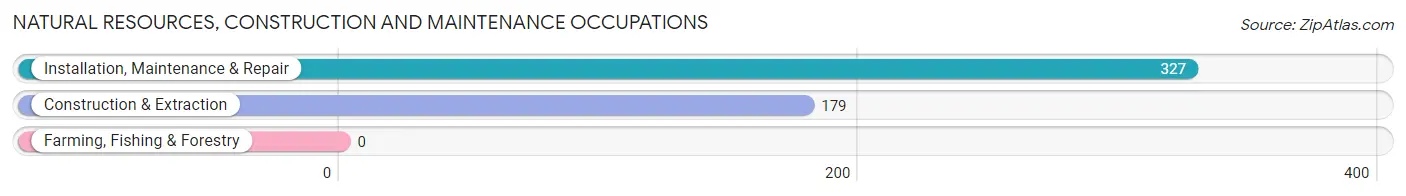
Natural Resources, Construction and Maintenance Occupations
The most common Natural Resources, Construction and Maintenance occupations in Comstock Park are Installation, Maintenance & Repair (327 | 6.0%), and Construction & Extraction (179 | 3.3%).
Natural Resources, Construction and Maintenance Occupations by Sex
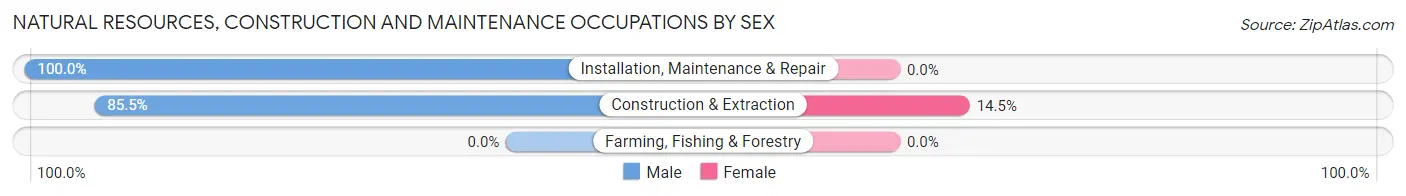
| Occupation | Male | Female |
| Farming, Fishing & Forestry | 0 (0.0%) | 0 (0.0%) |
| Construction & Extraction | 153 (85.5%) | 26 (14.5%) |
| Installation, Maintenance & Repair | 327 (100.0%) | 0 (0.0%) |
| Total (Category) | 480 (94.9%) | 26 (5.1%) |
| Total (Overall) | 2,851 (52.7%) | 2,555 (47.3%) |
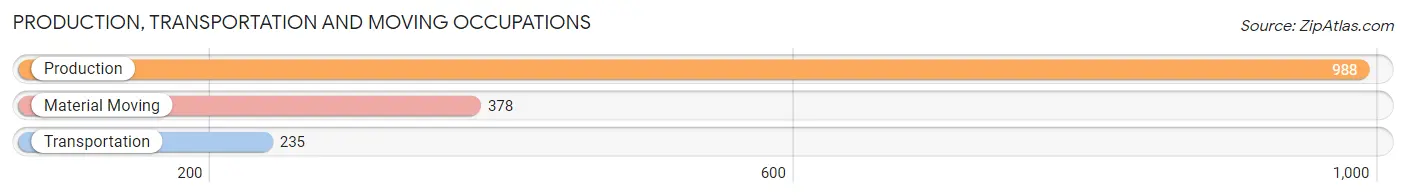
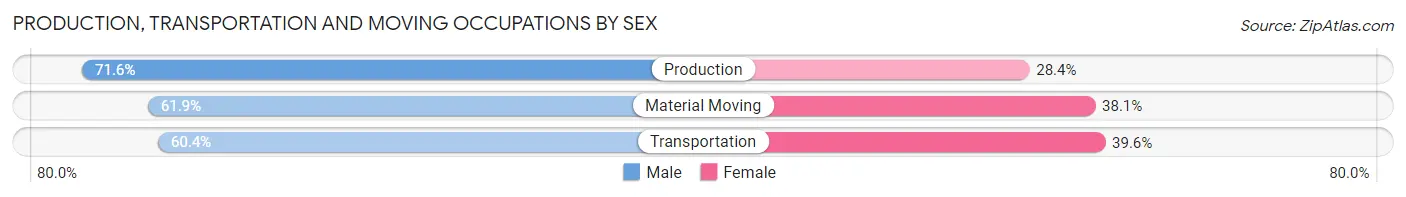
Production, Transportation and Moving Occupations
The most common Production, Transportation and Moving occupations in Comstock Park are Production (988 | 18.3%), Material Moving (378 | 7.0%), and Transportation (235 | 4.3%).
Production, Transportation and Moving Occupations by Sex
| Occupation | Male | Female |
| Production | 707 (71.6%) | 281 (28.4%) |
| Transportation | 142 (60.4%) | 93 (39.6%) |
| Material Moving | 234 (61.9%) | 144 (38.1%) |
| Total (Category) | 1,083 (67.6%) | 518 (32.4%) |
| Total (Overall) | 2,851 (52.7%) | 2,555 (47.3%) |
Employment Industries by Sex in Comstock Park
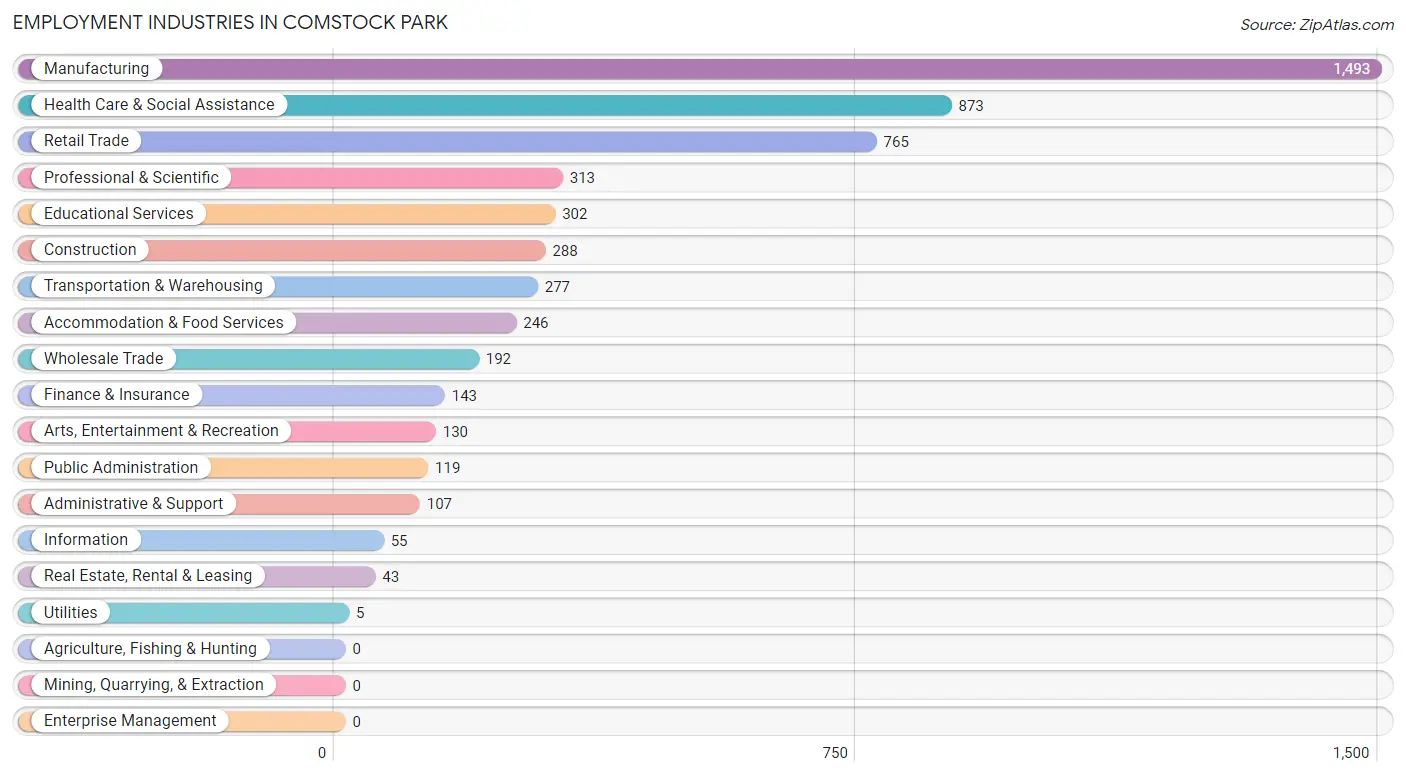
Employment Industries in Comstock Park
The major employment industries in Comstock Park include Manufacturing (1,493 | 27.6%), Health Care & Social Assistance (873 | 16.2%), Retail Trade (765 | 14.1%), Professional & Scientific (313 | 5.8%), and Educational Services (302 | 5.6%).
Employment Industries by Sex in Comstock Park
The Comstock Park industries that see more men than women are Utilities (100.0%), Information (100.0%), and Construction (89.6%), whereas the industries that tend to have a higher number of women are Health Care & Social Assistance (82.5%), Educational Services (74.8%), and Professional & Scientific (73.8%).
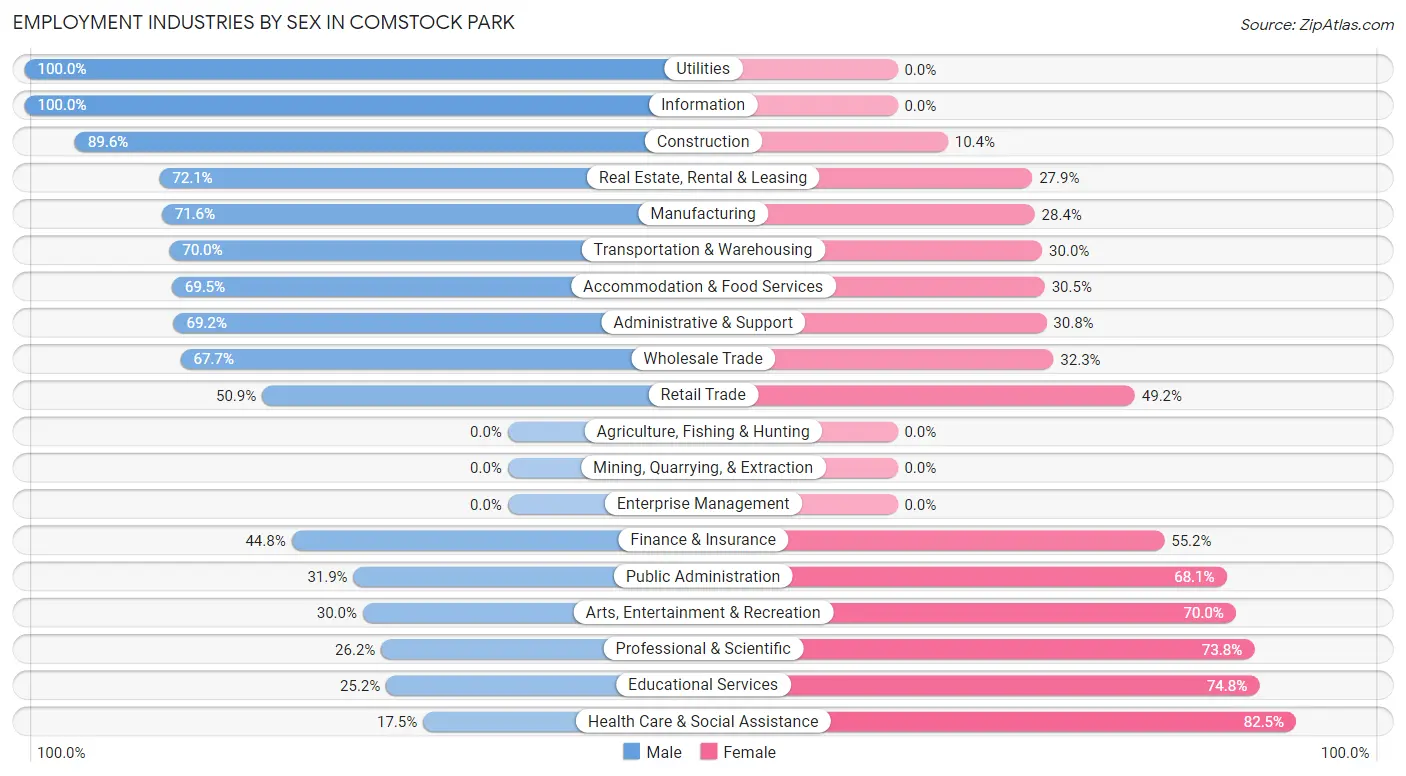
| Industry | Male | Female |
| Agriculture, Fishing & Hunting | 0 (0.0%) | 0 (0.0%) |
| Mining, Quarrying, & Extraction | 0 (0.0%) | 0 (0.0%) |
| Construction | 258 (89.6%) | 30 (10.4%) |
| Manufacturing | 1,069 (71.6%) | 424 (28.4%) |
| Wholesale Trade | 130 (67.7%) | 62 (32.3%) |
| Retail Trade | 389 (50.8%) | 376 (49.1%) |
| Transportation & Warehousing | 194 (70.0%) | 83 (30.0%) |
| Utilities | 5 (100.0%) | 0 (0.0%) |
| Information | 55 (100.0%) | 0 (0.0%) |
| Finance & Insurance | 64 (44.8%) | 79 (55.2%) |
| Real Estate, Rental & Leasing | 31 (72.1%) | 12 (27.9%) |
| Professional & Scientific | 82 (26.2%) | 231 (73.8%) |
| Enterprise Management | 0 (0.0%) | 0 (0.0%) |
| Administrative & Support | 74 (69.2%) | 33 (30.8%) |
| Educational Services | 76 (25.2%) | 226 (74.8%) |
| Health Care & Social Assistance | 153 (17.5%) | 720 (82.5%) |
| Arts, Entertainment & Recreation | 39 (30.0%) | 91 (70.0%) |
| Accommodation & Food Services | 171 (69.5%) | 75 (30.5%) |
| Public Administration | 38 (31.9%) | 81 (68.1%) |
| Total | 2,851 (52.7%) | 2,555 (47.3%) |
Education in Comstock Park
School Enrollment in Comstock Park
The most common levels of schooling among the 2,373 students in Comstock Park are middle school (614 | 25.9%), high school (561 | 23.6%), and college / undergraduate (437 | 18.4%).
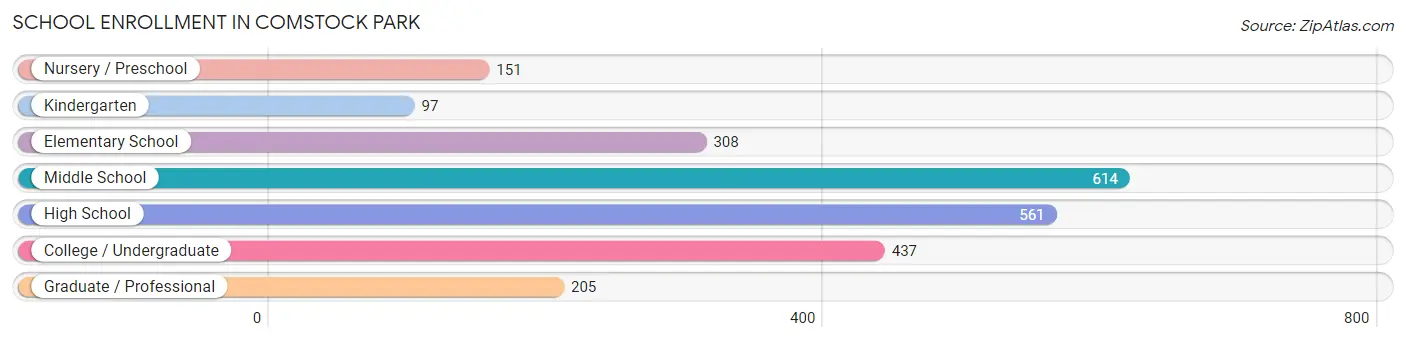
| School Level | # Students | % Students |
| Nursery / Preschool | 151 | 6.4% |
| Kindergarten | 97 | 4.1% |
| Elementary School | 308 | 13.0% |
| Middle School | 614 | 25.9% |
| High School | 561 | 23.6% |
| College / Undergraduate | 437 | 18.4% |
| Graduate / Professional | 205 | 8.6% |
| Total | 2,373 | 100.0% |
School Enrollment by Age by Funding Source in Comstock Park
Out of a total of 2,373 students who are enrolled in schools in Comstock Park, 244 (10.3%) attend a private institution, while the remaining 2,129 (89.7%) are enrolled in public schools. The age group of 35 years and over has the highest likelihood of being enrolled in private schools, with 70 (66.0% in the age bracket) enrolled. Conversely, the age group of 18 to 19 year olds has the lowest likelihood of being enrolled in a private school, with 124 (100.0% in the age bracket) attending a public institution.
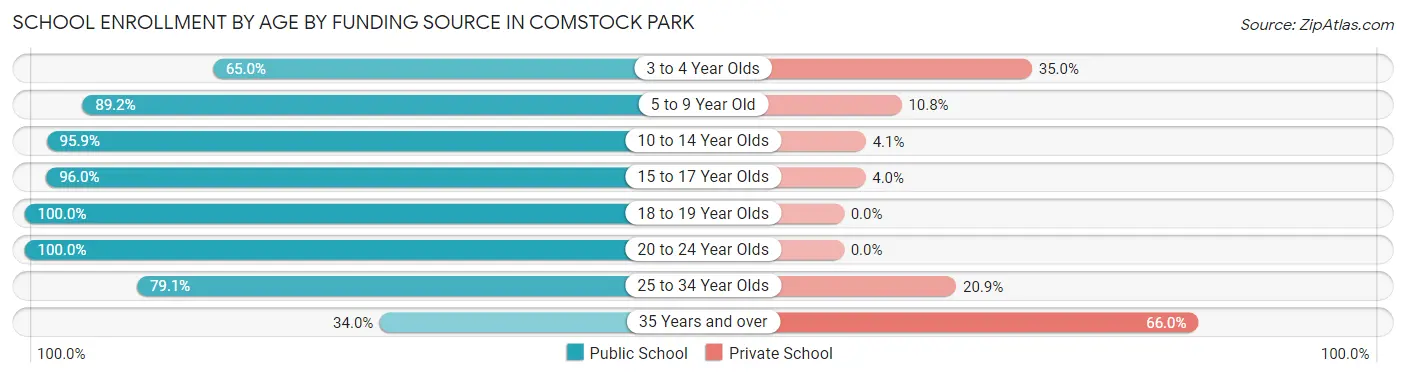
| Age Bracket | Public School | Private School |
| 3 to 4 Year Olds | 76 (65.0%) | 41 (35.0%) |
| 5 to 9 Year Old | 340 (89.2%) | 41 (10.8%) |
| 10 to 14 Year Olds | 655 (95.9%) | 28 (4.1%) |
| 15 to 17 Year Olds | 452 (96.0%) | 19 (4.0%) |
| 18 to 19 Year Olds | 124 (100.0%) | 0 (0.0%) |
| 20 to 24 Year Olds | 276 (100.0%) | 0 (0.0%) |
| 25 to 34 Year Olds | 170 (79.1%) | 45 (20.9%) |
| 35 Years and over | 36 (34.0%) | 70 (66.0%) |
| Total | 2,129 (89.7%) | 244 (10.3%) |
Educational Attainment by Field of Study in Comstock Park
Business (408 | 20.6%), education (241 | 12.2%), social sciences (221 | 11.2%), literature & languages (173 | 8.7%), and psychology (158 | 8.0%) are the most common fields of study among 1,982 individuals in Comstock Park who have obtained a bachelor's degree or higher.
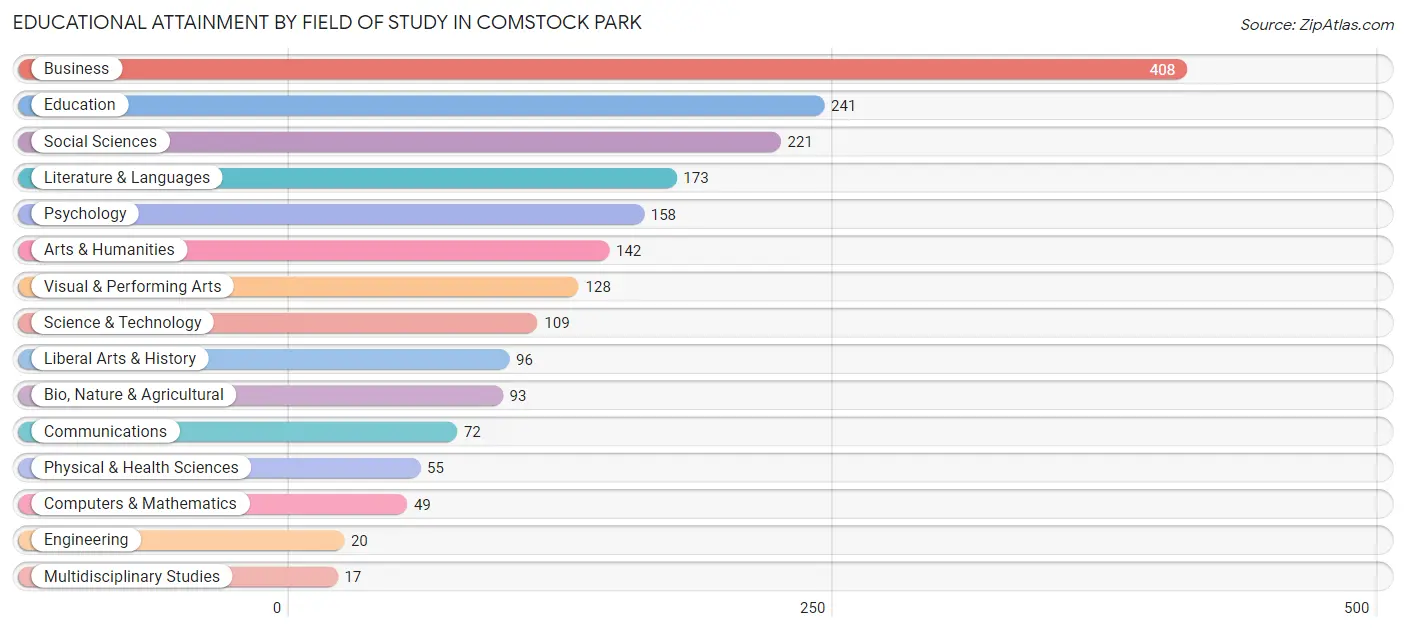
| Field of Study | # Graduates | % Graduates |
| Computers & Mathematics | 49 | 2.5% |
| Bio, Nature & Agricultural | 93 | 4.7% |
| Physical & Health Sciences | 55 | 2.8% |
| Psychology | 158 | 8.0% |
| Social Sciences | 221 | 11.2% |
| Engineering | 20 | 1.0% |
| Multidisciplinary Studies | 17 | 0.9% |
| Science & Technology | 109 | 5.5% |
| Business | 408 | 20.6% |
| Education | 241 | 12.2% |
| Literature & Languages | 173 | 8.7% |
| Liberal Arts & History | 96 | 4.8% |
| Visual & Performing Arts | 128 | 6.5% |
| Communications | 72 | 3.6% |
| Arts & Humanities | 142 | 7.2% |
| Total | 1,982 | 100.0% |
Transportation & Commute in Comstock Park
Vehicle Availability by Sex in Comstock Park
The most prevalent vehicle ownership categories in Comstock Park are males with 2 vehicles (1,414, accounting for 48.8%) and females with 2 vehicles (1,056, making up 57.1%).
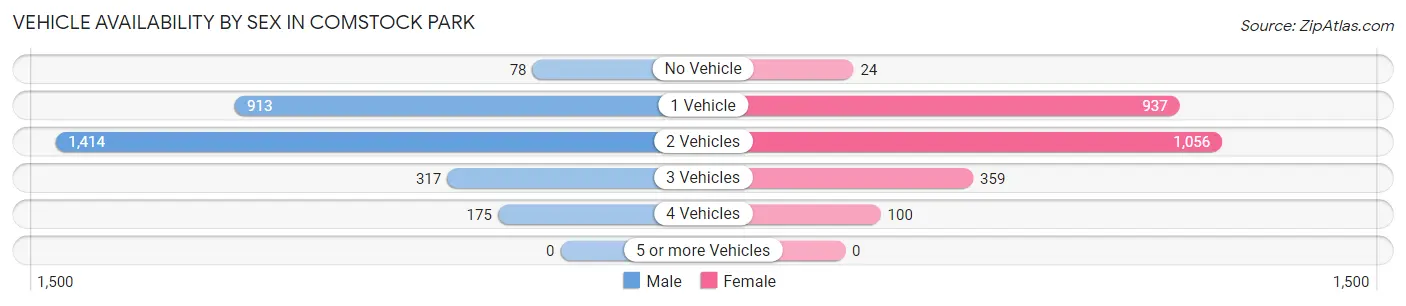
| Vehicles Available | Male | Female |
| No Vehicle | 78 (2.7%) | 24 (1.0%) |
| 1 Vehicle | 913 (31.5%) | 937 (37.8%) |
| 2 Vehicles | 1,414 (48.8%) | 1,056 (42.6%) |
| 3 Vehicles | 317 (10.9%) | 359 (14.5%) |
| 4 Vehicles | 175 (6.0%) | 100 (4.0%) |
| 5 or more Vehicles | 0 (0.0%) | 0 (0.0%) |
| Total | 2,897 (100.0%) | 2,476 (100.0%) |
Commute Time in Comstock Park
The most frequently occuring commute durations in Comstock Park are 20 to 24 minutes (1,342 commuters, 26.0%), 15 to 19 minutes (864 commuters, 16.7%), and 10 to 14 minutes (711 commuters, 13.8%).
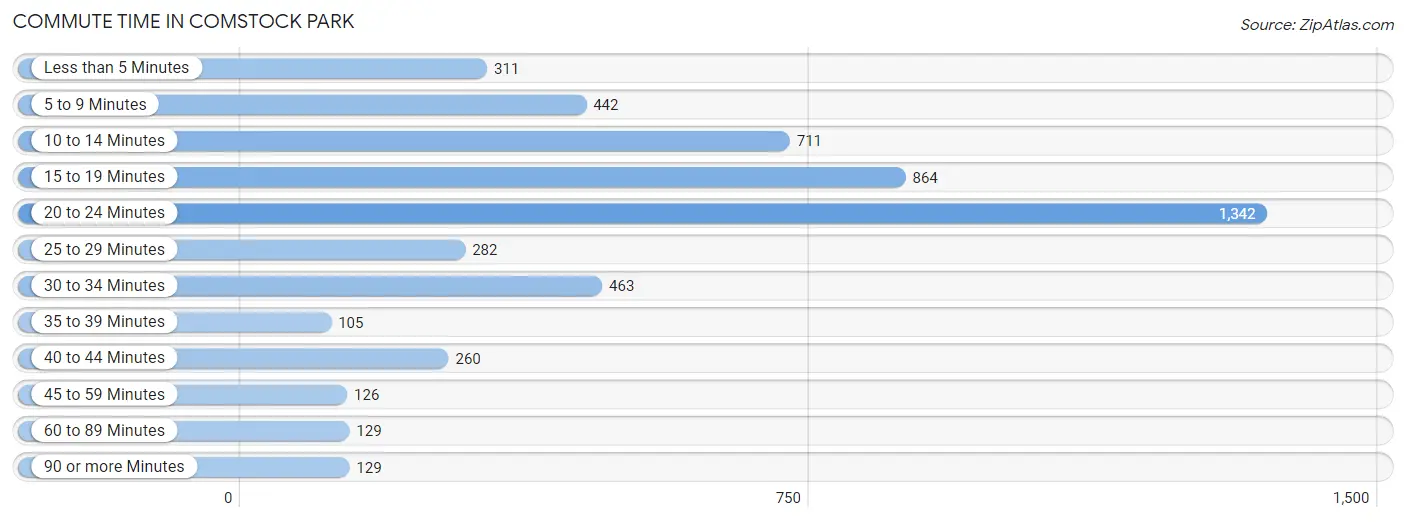
| Commute Time | # Commuters | % Commuters |
| Less than 5 Minutes | 311 | 6.0% |
| 5 to 9 Minutes | 442 | 8.6% |
| 10 to 14 Minutes | 711 | 13.8% |
| 15 to 19 Minutes | 864 | 16.7% |
| 20 to 24 Minutes | 1,342 | 26.0% |
| 25 to 29 Minutes | 282 | 5.5% |
| 30 to 34 Minutes | 463 | 9.0% |
| 35 to 39 Minutes | 105 | 2.0% |
| 40 to 44 Minutes | 260 | 5.0% |
| 45 to 59 Minutes | 126 | 2.4% |
| 60 to 89 Minutes | 129 | 2.5% |
| 90 or more Minutes | 129 | 2.5% |
Commute Time by Sex in Comstock Park
The most common commute times in Comstock Park are 20 to 24 minutes (720 commuters, 25.7%) for males and 20 to 24 minutes (622 commuters, 26.3%) for females.
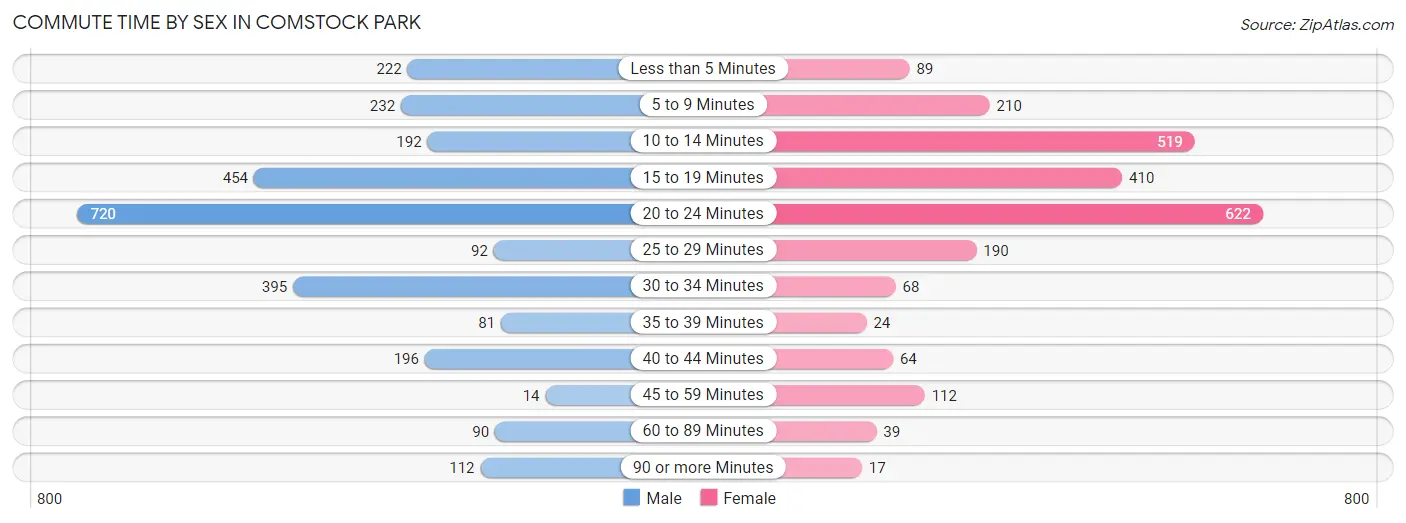
| Commute Time | Male | Female |
| Less than 5 Minutes | 222 (7.9%) | 89 (3.8%) |
| 5 to 9 Minutes | 232 (8.3%) | 210 (8.9%) |
| 10 to 14 Minutes | 192 (6.9%) | 519 (22.0%) |
| 15 to 19 Minutes | 454 (16.2%) | 410 (17.3%) |
| 20 to 24 Minutes | 720 (25.7%) | 622 (26.3%) |
| 25 to 29 Minutes | 92 (3.3%) | 190 (8.0%) |
| 30 to 34 Minutes | 395 (14.1%) | 68 (2.9%) |
| 35 to 39 Minutes | 81 (2.9%) | 24 (1.0%) |
| 40 to 44 Minutes | 196 (7.0%) | 64 (2.7%) |
| 45 to 59 Minutes | 14 (0.5%) | 112 (4.7%) |
| 60 to 89 Minutes | 90 (3.2%) | 39 (1.7%) |
| 90 or more Minutes | 112 (4.0%) | 17 (0.7%) |
Time of Departure to Work by Sex in Comstock Park
The most frequent times of departure to work in Comstock Park are 7:30 AM to 7:59 AM (581, 20.7%) for males and 7:00 AM to 7:29 AM (480, 20.3%) for females.
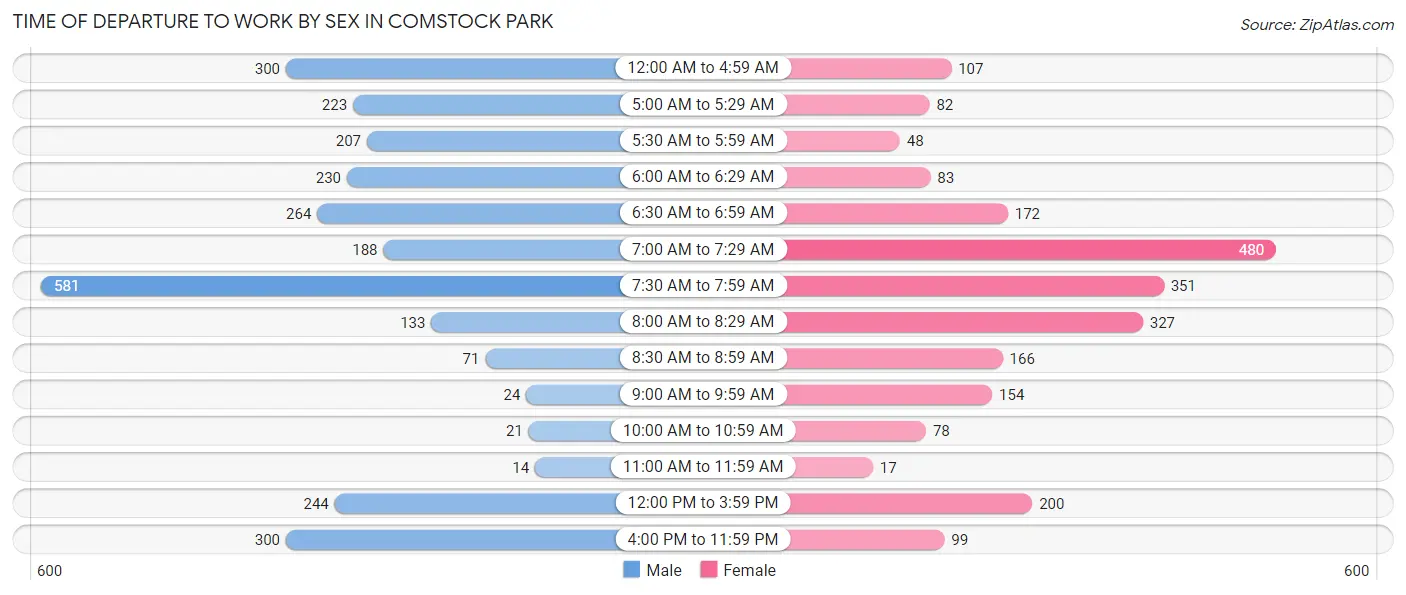
| Time of Departure | Male | Female |
| 12:00 AM to 4:59 AM | 300 (10.7%) | 107 (4.5%) |
| 5:00 AM to 5:29 AM | 223 (8.0%) | 82 (3.5%) |
| 5:30 AM to 5:59 AM | 207 (7.4%) | 48 (2.0%) |
| 6:00 AM to 6:29 AM | 230 (8.2%) | 83 (3.5%) |
| 6:30 AM to 6:59 AM | 264 (9.4%) | 172 (7.3%) |
| 7:00 AM to 7:29 AM | 188 (6.7%) | 480 (20.3%) |
| 7:30 AM to 7:59 AM | 581 (20.7%) | 351 (14.8%) |
| 8:00 AM to 8:29 AM | 133 (4.8%) | 327 (13.8%) |
| 8:30 AM to 8:59 AM | 71 (2.5%) | 166 (7.0%) |
| 9:00 AM to 9:59 AM | 24 (0.9%) | 154 (6.5%) |
| 10:00 AM to 10:59 AM | 21 (0.7%) | 78 (3.3%) |
| 11:00 AM to 11:59 AM | 14 (0.5%) | 17 (0.7%) |
| 12:00 PM to 3:59 PM | 244 (8.7%) | 200 (8.5%) |
| 4:00 PM to 11:59 PM | 300 (10.7%) | 99 (4.2%) |
| Total | 2,800 (100.0%) | 2,364 (100.0%) |
Housing Occupancy in Comstock Park
Occupancy by Ownership in Comstock Park
Of the total 4,511 dwellings in Comstock Park, owner-occupied units account for 2,357 (52.2%), while renter-occupied units make up 2,154 (47.7%).
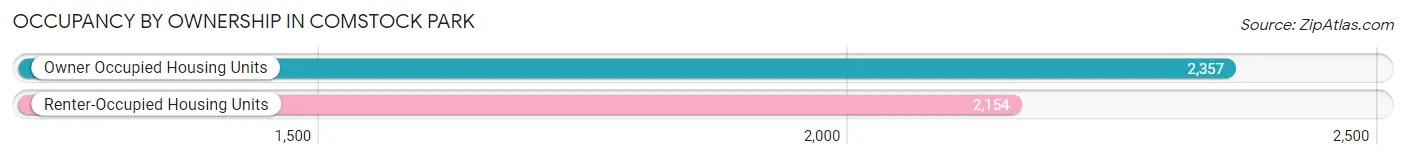
| Occupancy | # Housing Units | % Housing Units |
| Owner Occupied Housing Units | 2,357 | 52.2% |
| Renter-Occupied Housing Units | 2,154 | 47.7% |
| Total Occupied Housing Units | 4,511 | 100.0% |
Occupancy by Household Size in Comstock Park
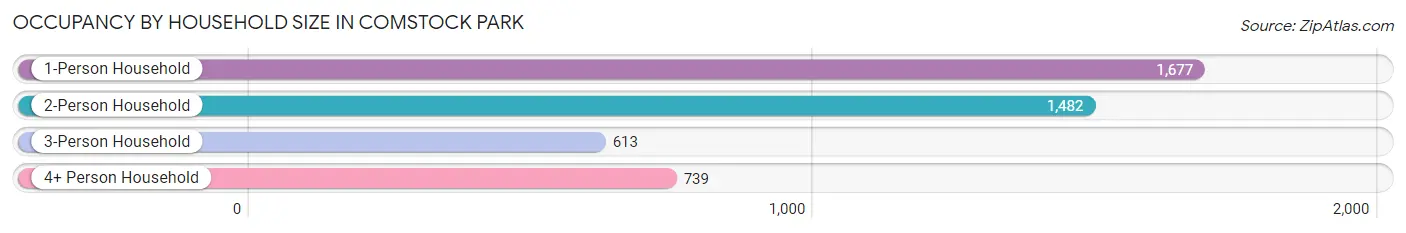
| Household Size | # Housing Units | % Housing Units |
| 1-Person Household | 1,677 | 37.2% |
| 2-Person Household | 1,482 | 32.9% |
| 3-Person Household | 613 | 13.6% |
| 4+ Person Household | 739 | 16.4% |
| Total Housing Units | 4,511 | 100.0% |
Occupancy by Ownership by Household Size in Comstock Park
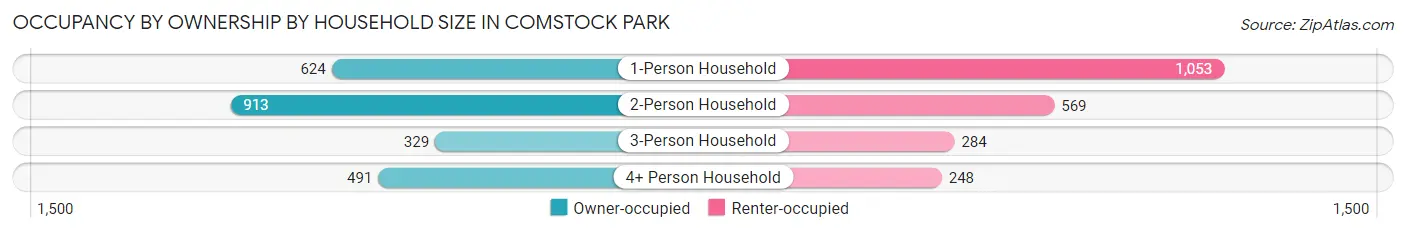
| Household Size | Owner-occupied | Renter-occupied |
| 1-Person Household | 624 (37.2%) | 1,053 (62.8%) |
| 2-Person Household | 913 (61.6%) | 569 (38.4%) |
| 3-Person Household | 329 (53.7%) | 284 (46.3%) |
| 4+ Person Household | 491 (66.4%) | 248 (33.6%) |
| Total Housing Units | 2,357 (52.2%) | 2,154 (47.7%) |
Occupancy by Educational Attainment in Comstock Park
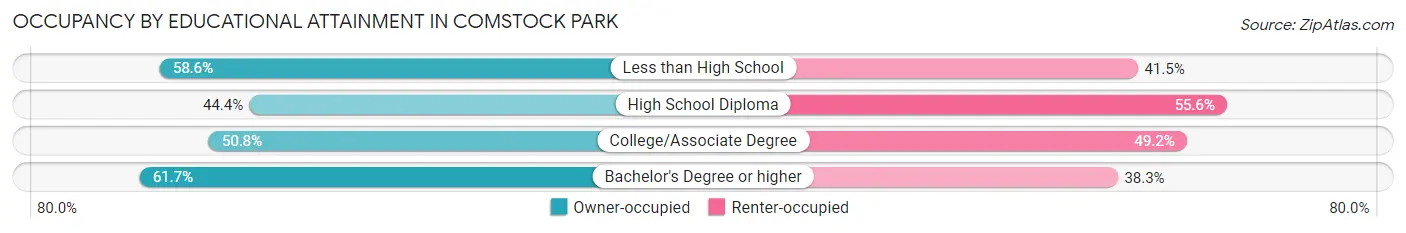
| Household Size | Owner-occupied | Renter-occupied |
| Less than High School | 137 (58.6%) | 97 (41.4%) |
| High School Diploma | 563 (44.4%) | 705 (55.6%) |
| College/Associate Degree | 928 (50.8%) | 900 (49.2%) |
| Bachelor's Degree or higher | 729 (61.7%) | 452 (38.3%) |
Occupancy by Age of Householder in Comstock Park
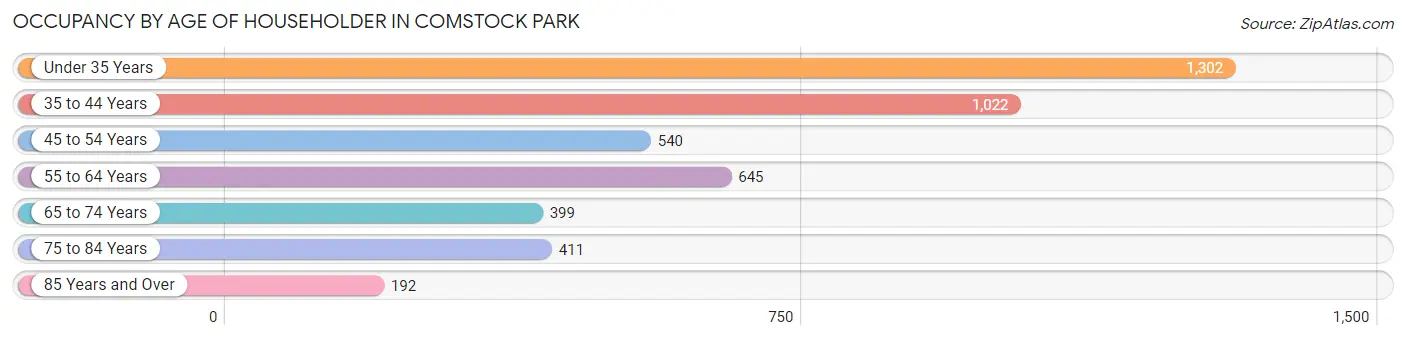
| Age Bracket | # Households | % Households |
| Under 35 Years | 1,302 | 28.9% |
| 35 to 44 Years | 1,022 | 22.7% |
| 45 to 54 Years | 540 | 12.0% |
| 55 to 64 Years | 645 | 14.3% |
| 65 to 74 Years | 399 | 8.8% |
| 75 to 84 Years | 411 | 9.1% |
| 85 Years and Over | 192 | 4.3% |
| Total | 4,511 | 100.0% |
Housing Finances in Comstock Park
Median Income by Occupancy in Comstock Park
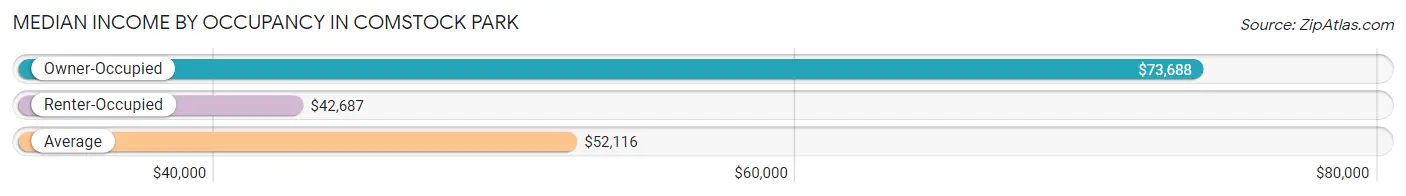
| Occupancy Type | # Households | Median Income |
| Owner-Occupied | 2,357 (52.2%) | $73,688 |
| Renter-Occupied | 2,154 (47.7%) | $42,687 |
| Average | 4,511 (100.0%) | $52,116 |
Occupancy by Householder Income Bracket in Comstock Park
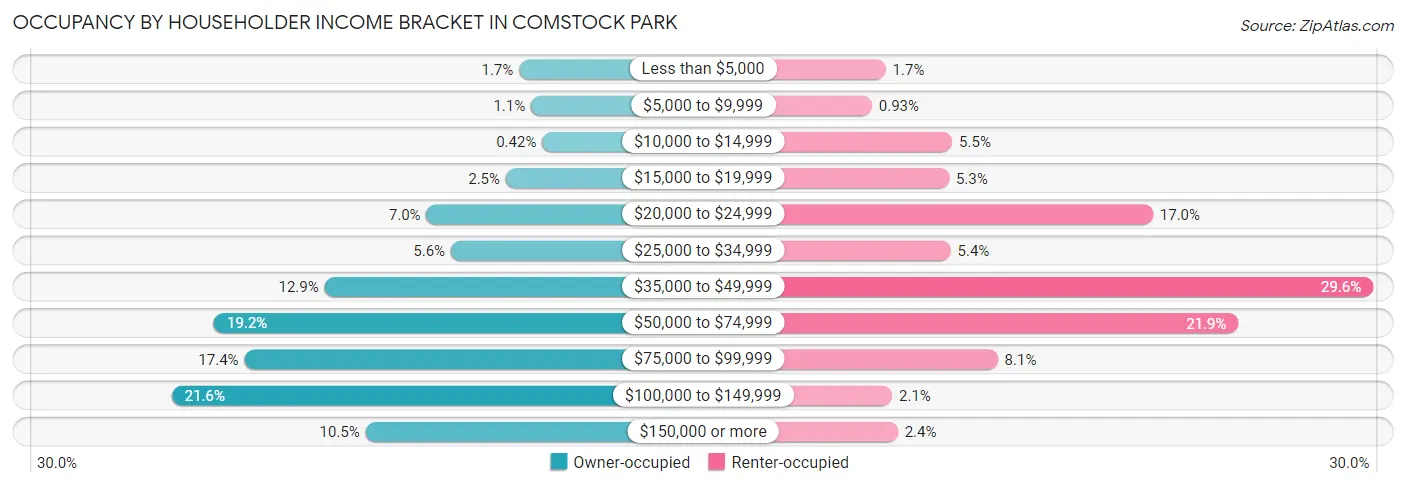
| Income Bracket | Owner-occupied | Renter-occupied |
| Less than $5,000 | 41 (1.7%) | 37 (1.7%) |
| $5,000 to $9,999 | 25 (1.1%) | 20 (0.9%) |
| $10,000 to $14,999 | 10 (0.4%) | 119 (5.5%) |
| $15,000 to $19,999 | 59 (2.5%) | 115 (5.3%) |
| $20,000 to $24,999 | 166 (7.0%) | 366 (17.0%) |
| $25,000 to $34,999 | 133 (5.6%) | 117 (5.4%) |
| $35,000 to $49,999 | 303 (12.9%) | 637 (29.6%) |
| $50,000 to $74,999 | 452 (19.2%) | 471 (21.9%) |
| $75,000 to $99,999 | 411 (17.4%) | 175 (8.1%) |
| $100,000 to $149,999 | 509 (21.6%) | 45 (2.1%) |
| $150,000 or more | 248 (10.5%) | 52 (2.4%) |
| Total | 2,357 (100.0%) | 2,154 (100.0%) |
Monthly Housing Cost Tiers in Comstock Park
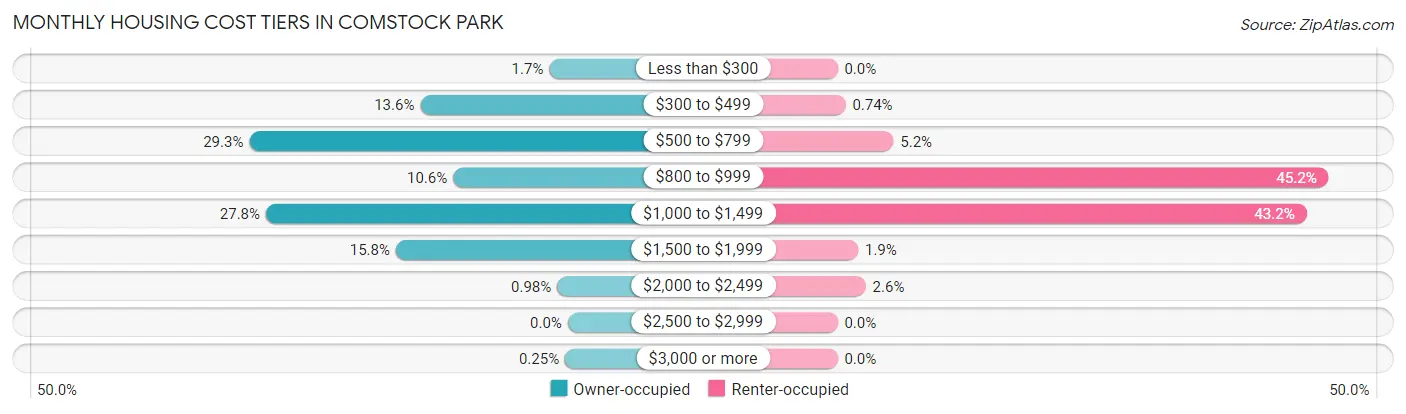
| Monthly Cost | Owner-occupied | Renter-occupied |
| Less than $300 | 40 (1.7%) | 0 (0.0%) |
| $300 to $499 | 320 (13.6%) | 16 (0.7%) |
| $500 to $799 | 691 (29.3%) | 111 (5.1%) |
| $800 to $999 | 249 (10.6%) | 974 (45.2%) |
| $1,000 to $1,499 | 655 (27.8%) | 930 (43.2%) |
| $1,500 to $1,999 | 373 (15.8%) | 41 (1.9%) |
| $2,000 to $2,499 | 23 (1.0%) | 56 (2.6%) |
| $2,500 to $2,999 | 0 (0.0%) | 0 (0.0%) |
| $3,000 or more | 6 (0.3%) | 0 (0.0%) |
| Total | 2,357 (100.0%) | 2,154 (100.0%) |
Physical Housing Characteristics in Comstock Park
Housing Structures in Comstock Park
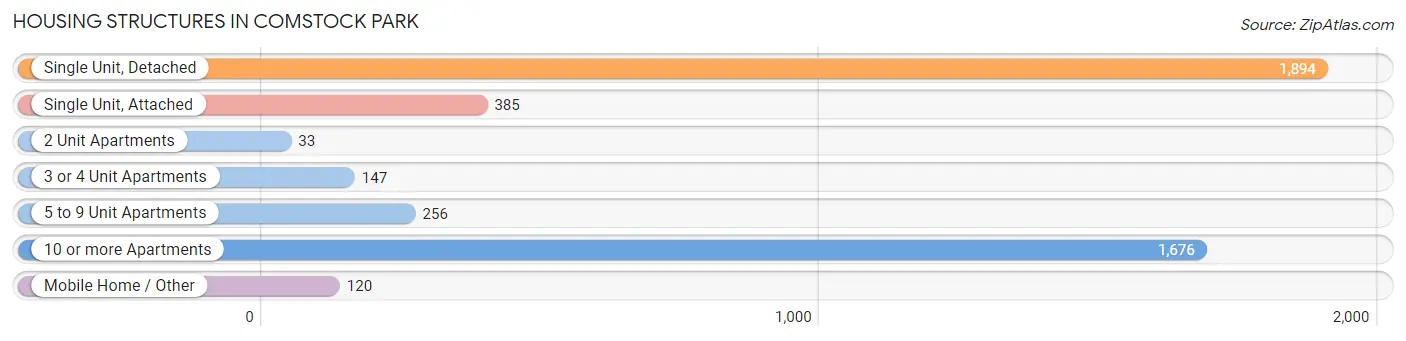
| Structure Type | # Housing Units | % Housing Units |
| Single Unit, Detached | 1,894 | 42.0% |
| Single Unit, Attached | 385 | 8.5% |
| 2 Unit Apartments | 33 | 0.7% |
| 3 or 4 Unit Apartments | 147 | 3.3% |
| 5 to 9 Unit Apartments | 256 | 5.7% |
| 10 or more Apartments | 1,676 | 37.1% |
| Mobile Home / Other | 120 | 2.7% |
| Total | 4,511 | 100.0% |
Housing Structures by Occupancy in Comstock Park
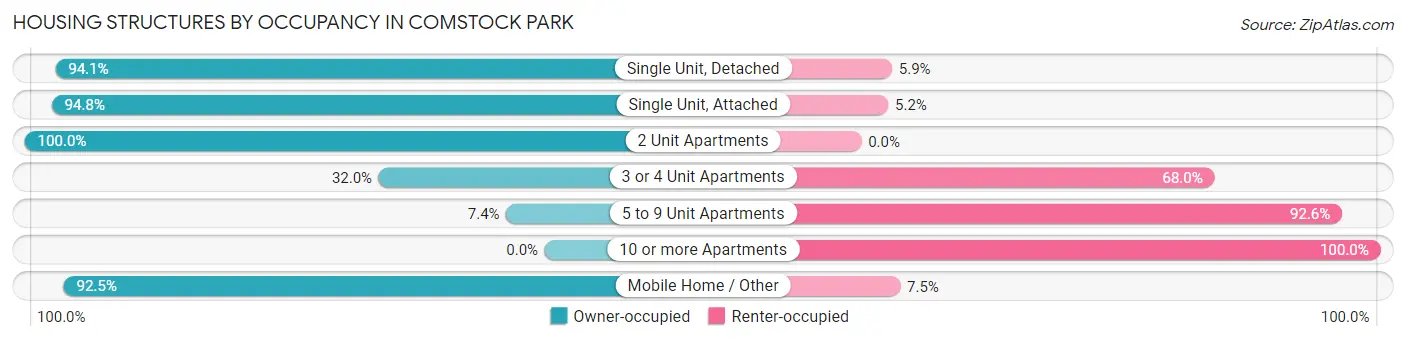
| Structure Type | Owner-occupied | Renter-occupied |
| Single Unit, Detached | 1,782 (94.1%) | 112 (5.9%) |
| Single Unit, Attached | 365 (94.8%) | 20 (5.2%) |
| 2 Unit Apartments | 33 (100.0%) | 0 (0.0%) |
| 3 or 4 Unit Apartments | 47 (32.0%) | 100 (68.0%) |
| 5 to 9 Unit Apartments | 19 (7.4%) | 237 (92.6%) |
| 10 or more Apartments | 0 (0.0%) | 1,676 (100.0%) |
| Mobile Home / Other | 111 (92.5%) | 9 (7.5%) |
| Total | 2,357 (52.2%) | 2,154 (47.7%) |
Housing Structures by Number of Rooms in Comstock Park
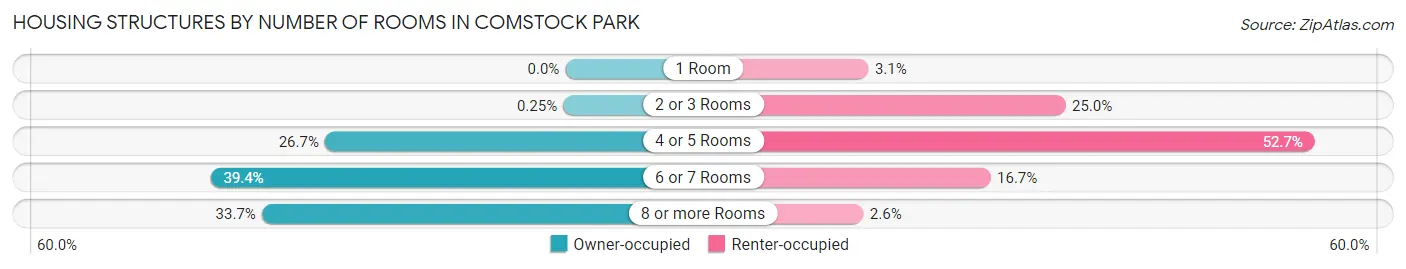
| Number of Rooms | Owner-occupied | Renter-occupied |
| 1 Room | 0 (0.0%) | 67 (3.1%) |
| 2 or 3 Rooms | 6 (0.3%) | 538 (25.0%) |
| 4 or 5 Rooms | 629 (26.7%) | 1,135 (52.7%) |
| 6 or 7 Rooms | 928 (39.4%) | 359 (16.7%) |
| 8 or more Rooms | 794 (33.7%) | 55 (2.5%) |
| Total | 2,357 (100.0%) | 2,154 (100.0%) |
Housing Structure by Heating Type in Comstock Park
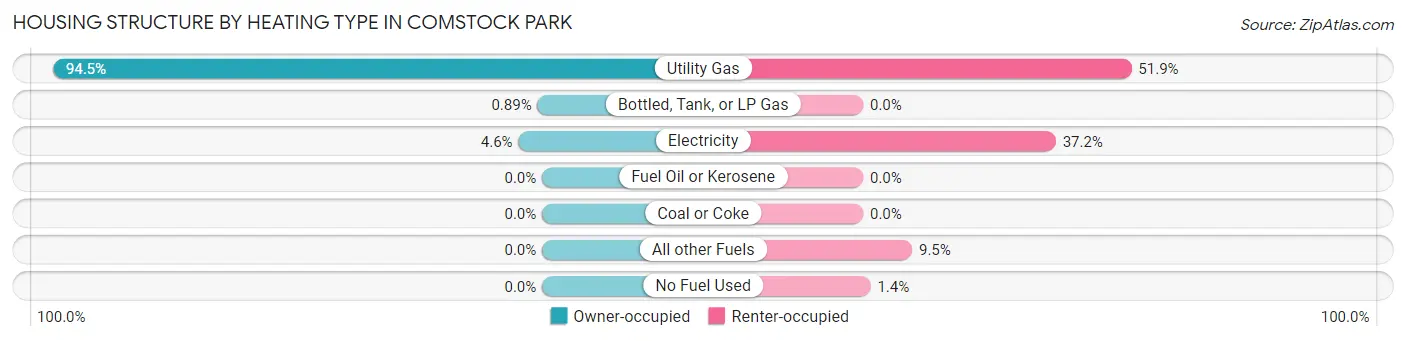
| Heating Type | Owner-occupied | Renter-occupied |
| Utility Gas | 2,228 (94.5%) | 1,117 (51.9%) |
| Bottled, Tank, or LP Gas | 21 (0.9%) | 0 (0.0%) |
| Electricity | 108 (4.6%) | 802 (37.2%) |
| Fuel Oil or Kerosene | 0 (0.0%) | 0 (0.0%) |
| Coal or Coke | 0 (0.0%) | 0 (0.0%) |
| All other Fuels | 0 (0.0%) | 204 (9.5%) |
| No Fuel Used | 0 (0.0%) | 31 (1.4%) |
| Total | 2,357 (100.0%) | 2,154 (100.0%) |
Household Vehicle Usage in Comstock Park
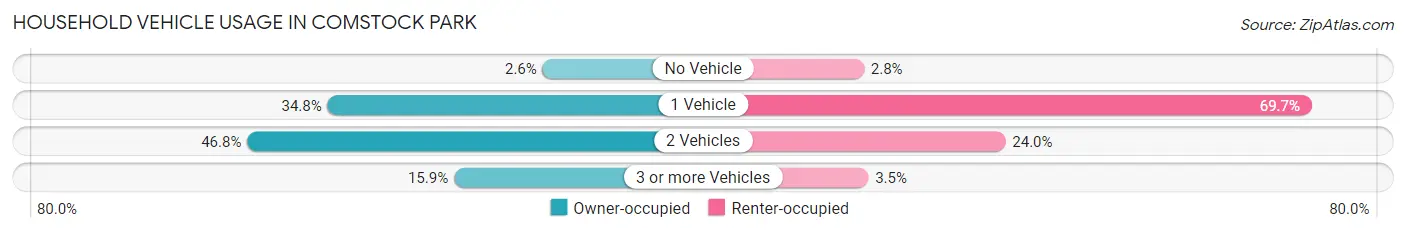
| Vehicles per Household | Owner-occupied | Renter-occupied |
| No Vehicle | 62 (2.6%) | 61 (2.8%) |
| 1 Vehicle | 819 (34.7%) | 1,502 (69.7%) |
| 2 Vehicles | 1,102 (46.8%) | 516 (24.0%) |
| 3 or more Vehicles | 374 (15.9%) | 75 (3.5%) |
| Total | 2,357 (100.0%) | 2,154 (100.0%) |
Real Estate & Mortgages in Comstock Park
Real Estate and Mortgage Overview in Comstock Park
| Characteristic | Without Mortgage | With Mortgage |
| Housing Units | 1,018 | 1,339 |
| Median Property Value | $196,400 | $213,200 |
| Median Household Income | $61,786 | $166 |
| Monthly Housing Costs | $567 | $6 |
| Real Estate Taxes | $2,657 | $42 |
Property Value by Mortgage Status in Comstock Park
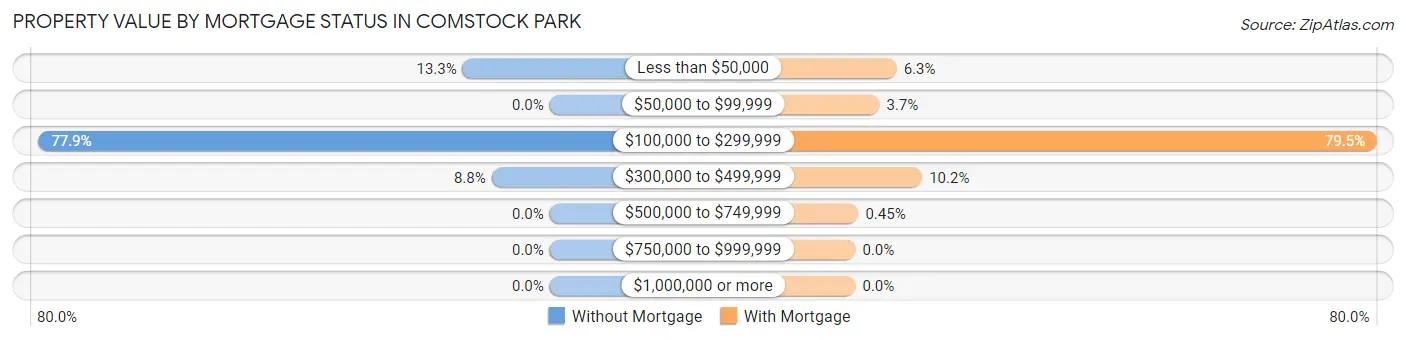
| Property Value | Without Mortgage | With Mortgage |
| Less than $50,000 | 135 (13.3%) | 84 (6.3%) |
| $50,000 to $99,999 | 0 (0.0%) | 49 (3.7%) |
| $100,000 to $299,999 | 793 (77.9%) | 1,064 (79.5%) |
| $300,000 to $499,999 | 90 (8.8%) | 136 (10.2%) |
| $500,000 to $749,999 | 0 (0.0%) | 6 (0.4%) |
| $750,000 to $999,999 | 0 (0.0%) | 0 (0.0%) |
| $1,000,000 or more | 0 (0.0%) | 0 (0.0%) |
| Total | 1,018 (100.0%) | 1,339 (100.0%) |
Household Income by Mortgage Status in Comstock Park
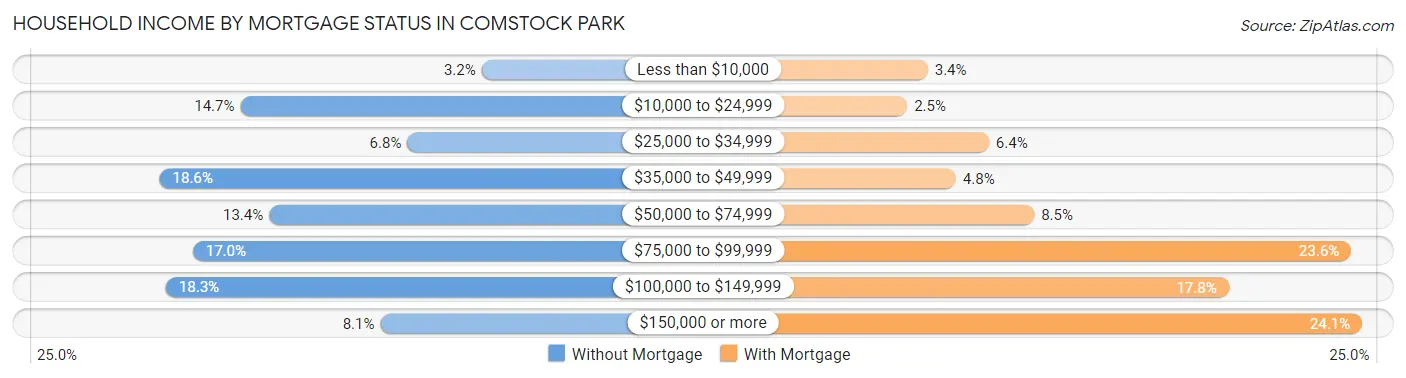
| Household Income | Without Mortgage | With Mortgage |
| Less than $10,000 | 33 (3.2%) | 46 (3.4%) |
| $10,000 to $24,999 | 150 (14.7%) | 33 (2.5%) |
| $25,000 to $34,999 | 69 (6.8%) | 85 (6.4%) |
| $35,000 to $49,999 | 189 (18.6%) | 64 (4.8%) |
| $50,000 to $74,999 | 136 (13.4%) | 114 (8.5%) |
| $75,000 to $99,999 | 173 (17.0%) | 316 (23.6%) |
| $100,000 to $149,999 | 186 (18.3%) | 238 (17.8%) |
| $150,000 or more | 82 (8.1%) | 323 (24.1%) |
| Total | 1,018 (100.0%) | 1,339 (100.0%) |
Property Value to Household Income Ratio in Comstock Park
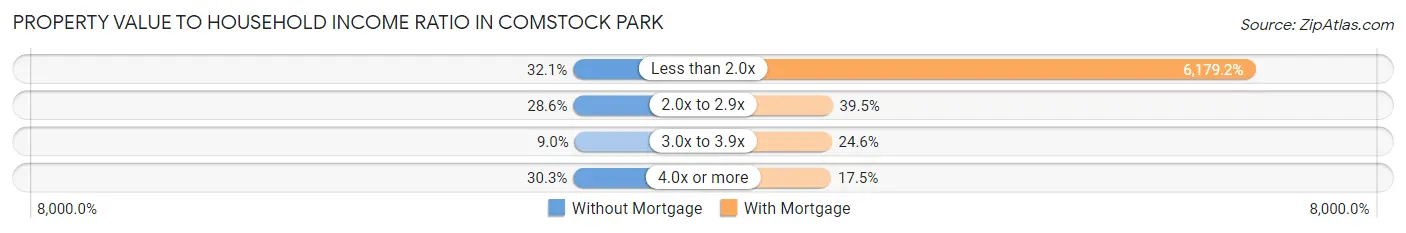
| Value-to-Income Ratio | Without Mortgage | With Mortgage |
| Less than 2.0x | 327 (32.1%) | 82,740 (6,179.2%) |
| 2.0x to 2.9x | 291 (28.6%) | 529 (39.5%) |
| 3.0x to 3.9x | 92 (9.0%) | 329 (24.6%) |
| 4.0x or more | 308 (30.3%) | 234 (17.5%) |
| Total | 1,018 (100.0%) | 1,339 (100.0%) |
Real Estate Taxes by Mortgage Status in Comstock Park
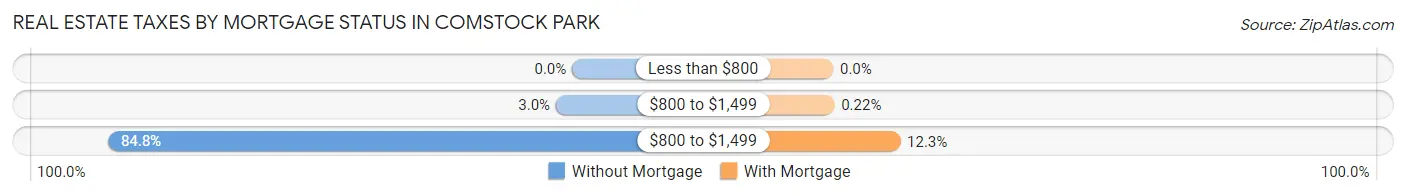
| Property Taxes | Without Mortgage | With Mortgage |
| Less than $800 | 0 (0.0%) | 0 (0.0%) |
| $800 to $1,499 | 30 (2.9%) | 3 (0.2%) |
| $800 to $1,499 | 863 (84.8%) | 164 (12.2%) |
| Total | 1,018 (100.0%) | 1,339 (100.0%) |
Health & Disability in Comstock Park
Health Insurance Coverage by Age in Comstock Park
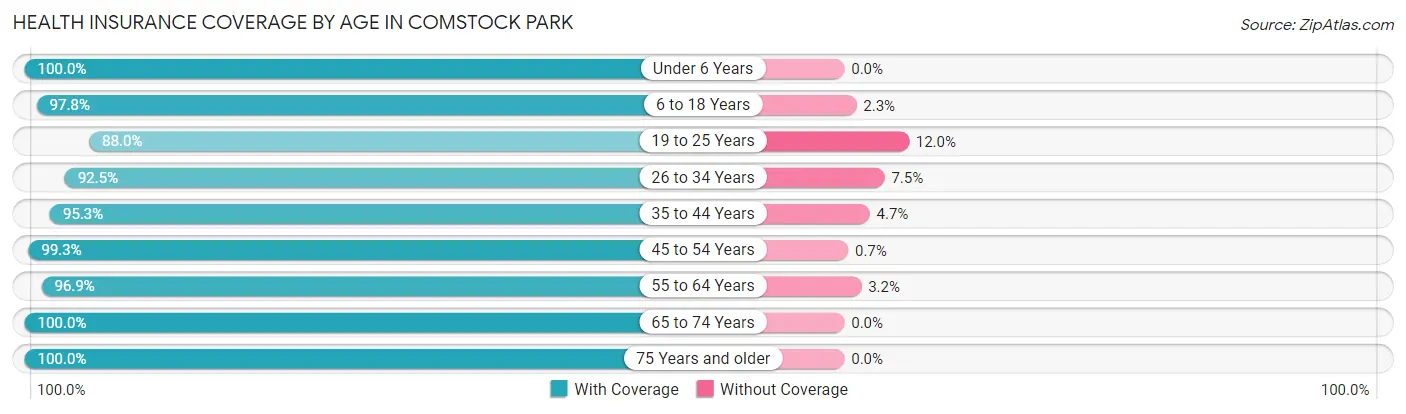
| Age Bracket | With Coverage | Without Coverage |
| Under 6 Years | 671 (100.0%) | 0 (0.0%) |
| 6 to 18 Years | 1,736 (97.8%) | 40 (2.2%) |
| 19 to 25 Years | 988 (88.0%) | 135 (12.0%) |
| 26 to 34 Years | 1,656 (92.5%) | 134 (7.5%) |
| 35 to 44 Years | 1,331 (95.3%) | 66 (4.7%) |
| 45 to 54 Years | 1,000 (99.3%) | 7 (0.7%) |
| 55 to 64 Years | 953 (96.9%) | 31 (3.2%) |
| 65 to 74 Years | 556 (100.0%) | 0 (0.0%) |
| 75 Years and older | 1,016 (100.0%) | 0 (0.0%) |
| Total | 9,907 (96.0%) | 413 (4.0%) |
Health Insurance Coverage by Citizenship Status in Comstock Park
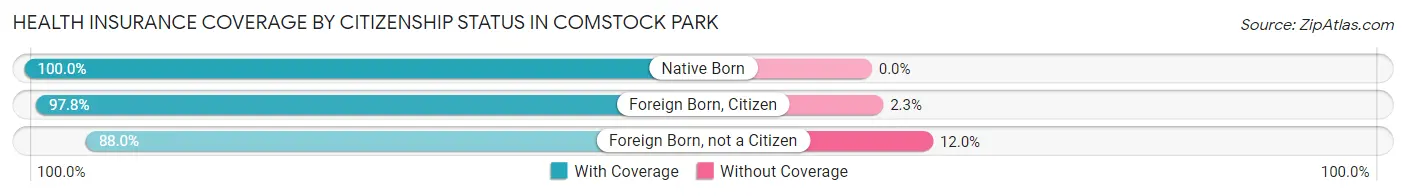
| Citizenship Status | With Coverage | Without Coverage |
| Native Born | 671 (100.0%) | 0 (0.0%) |
| Foreign Born, Citizen | 1,736 (97.8%) | 40 (2.2%) |
| Foreign Born, not a Citizen | 988 (88.0%) | 135 (12.0%) |
Health Insurance Coverage by Household Income in Comstock Park
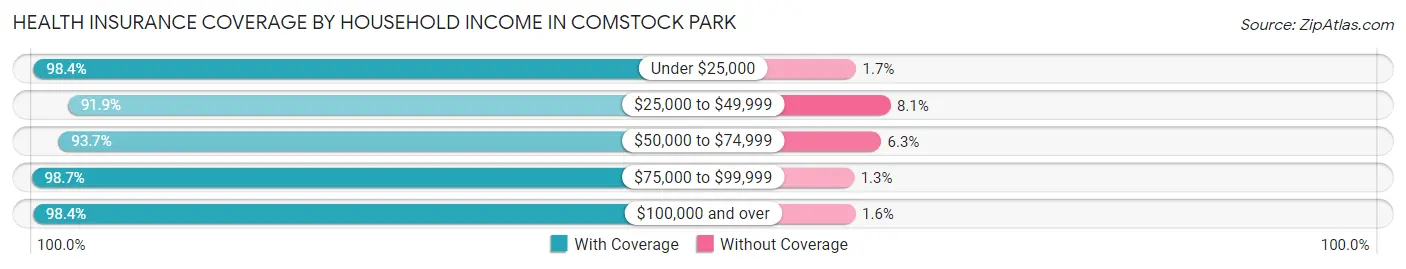
| Household Income | With Coverage | Without Coverage |
| Under $25,000 | 1,248 (98.4%) | 21 (1.7%) |
| $25,000 to $49,999 | 2,253 (91.9%) | 198 (8.1%) |
| $50,000 to $74,999 | 1,878 (93.7%) | 127 (6.3%) |
| $75,000 to $99,999 | 1,754 (98.7%) | 23 (1.3%) |
| $100,000 and over | 2,773 (98.4%) | 44 (1.6%) |
Public vs Private Health Insurance Coverage by Age in Comstock Park
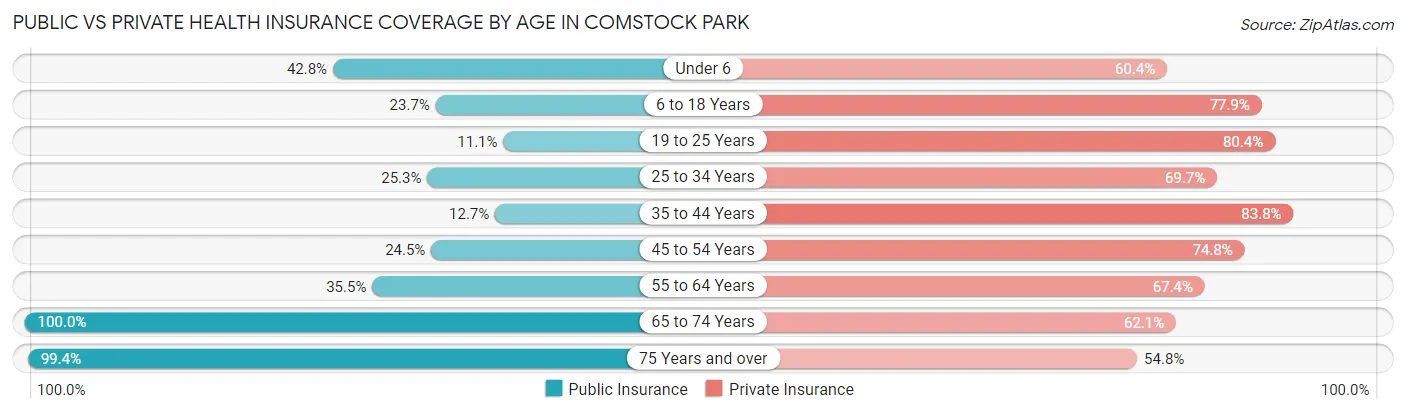
| Age Bracket | Public Insurance | Private Insurance |
| Under 6 | 287 (42.8%) | 405 (60.4%) |
| 6 to 18 Years | 421 (23.7%) | 1,384 (77.9%) |
| 19 to 25 Years | 125 (11.1%) | 903 (80.4%) |
| 25 to 34 Years | 452 (25.3%) | 1,247 (69.7%) |
| 35 to 44 Years | 177 (12.7%) | 1,171 (83.8%) |
| 45 to 54 Years | 247 (24.5%) | 753 (74.8%) |
| 55 to 64 Years | 349 (35.5%) | 663 (67.4%) |
| 65 to 74 Years | 556 (100.0%) | 345 (62.1%) |
| 75 Years and over | 1,010 (99.4%) | 557 (54.8%) |
| Total | 3,624 (35.1%) | 7,428 (72.0%) |
Disability Status by Sex by Age in Comstock Park
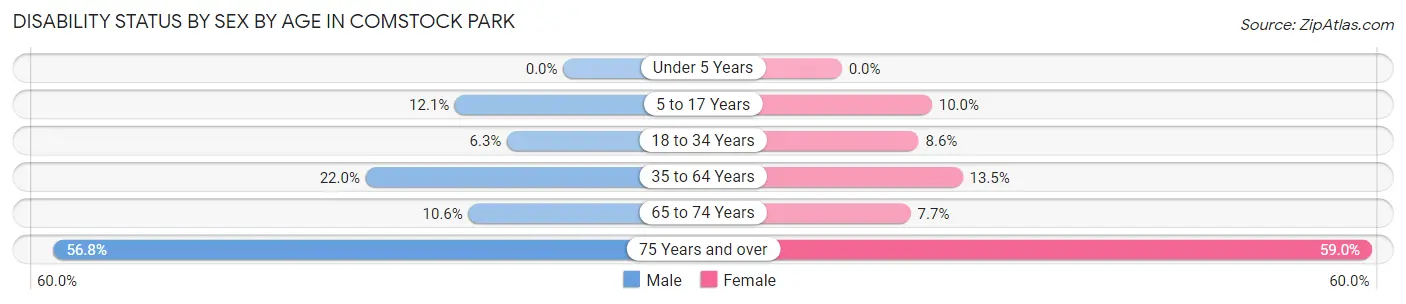
| Age Bracket | Male | Female |
| Under 5 Years | 0 (0.0%) | 0 (0.0%) |
| 5 to 17 Years | 110 (12.0%) | 83 (10.0%) |
| 18 to 34 Years | 91 (6.3%) | 137 (8.6%) |
| 35 to 64 Years | 366 (22.0%) | 232 (13.5%) |
| 65 to 74 Years | 27 (10.5%) | 23 (7.7%) |
| 75 Years and over | 222 (56.8%) | 369 (59.0%) |
Disability Class by Sex by Age in Comstock Park
Disability Class: Hearing Difficulty
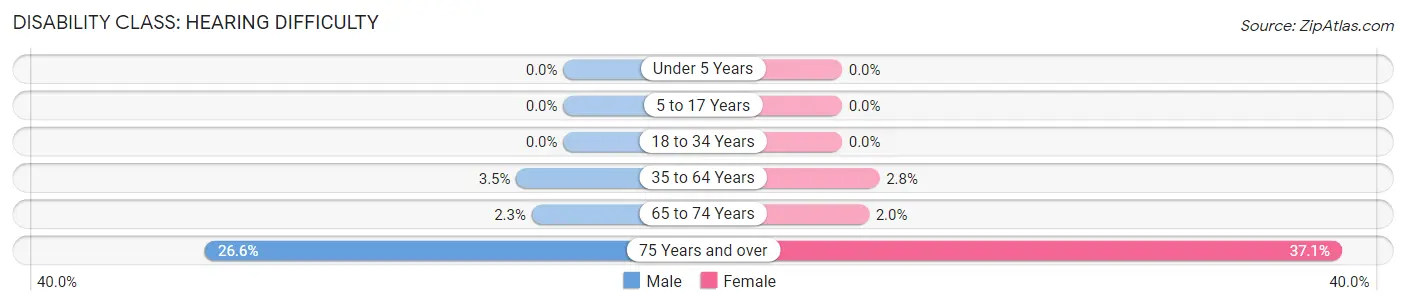
| Age Bracket | Male | Female |
| Under 5 Years | 0 (0.0%) | 0 (0.0%) |
| 5 to 17 Years | 0 (0.0%) | 0 (0.0%) |
| 18 to 34 Years | 0 (0.0%) | 0 (0.0%) |
| 35 to 64 Years | 58 (3.5%) | 48 (2.8%) |
| 65 to 74 Years | 6 (2.3%) | 6 (2.0%) |
| 75 Years and over | 104 (26.6%) | 232 (37.1%) |
Disability Class: Vision Difficulty
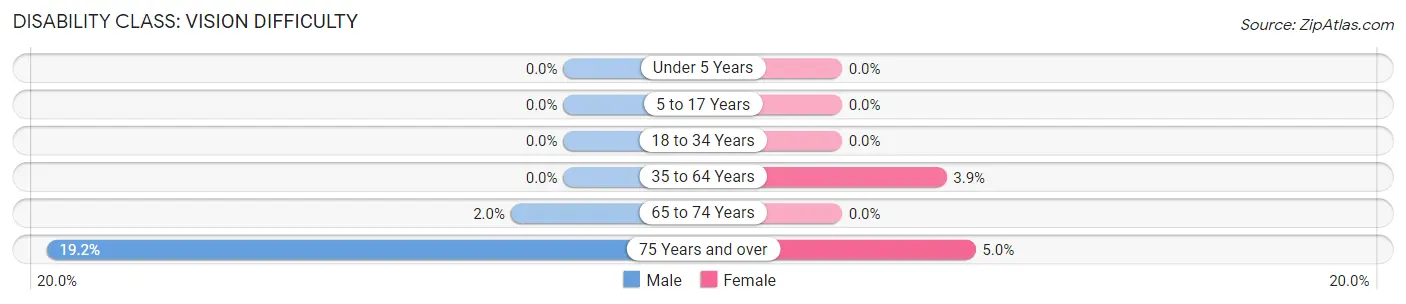
| Age Bracket | Male | Female |
| Under 5 Years | 0 (0.0%) | 0 (0.0%) |
| 5 to 17 Years | 0 (0.0%) | 0 (0.0%) |
| 18 to 34 Years | 0 (0.0%) | 0 (0.0%) |
| 35 to 64 Years | 0 (0.0%) | 67 (3.9%) |
| 65 to 74 Years | 5 (1.9%) | 0 (0.0%) |
| 75 Years and over | 75 (19.2%) | 31 (5.0%) |
Disability Class: Cognitive Difficulty
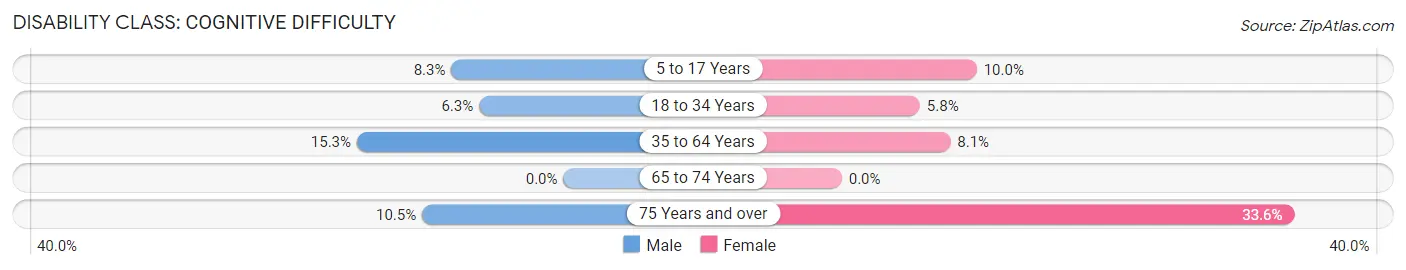
| Age Bracket | Male | Female |
| 5 to 17 Years | 76 (8.3%) | 83 (10.0%) |
| 18 to 34 Years | 91 (6.3%) | 93 (5.8%) |
| 35 to 64 Years | 255 (15.3%) | 139 (8.1%) |
| 65 to 74 Years | 0 (0.0%) | 0 (0.0%) |
| 75 Years and over | 41 (10.5%) | 210 (33.6%) |
Disability Class: Ambulatory Difficulty
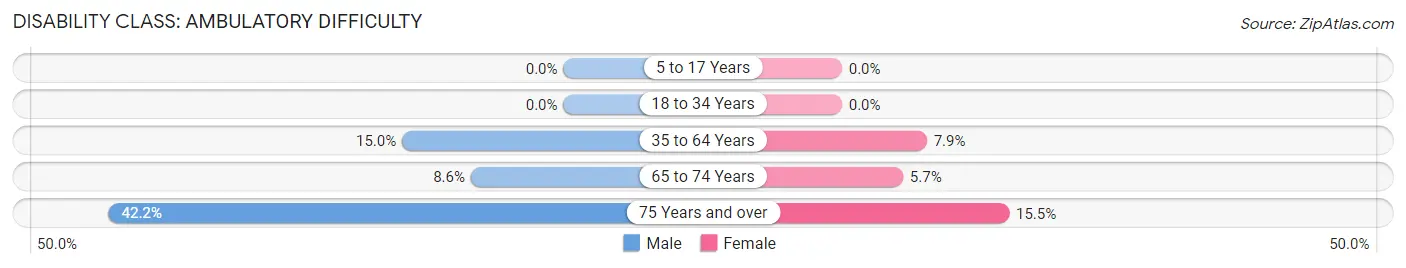
| Age Bracket | Male | Female |
| 5 to 17 Years | 0 (0.0%) | 0 (0.0%) |
| 18 to 34 Years | 0 (0.0%) | 0 (0.0%) |
| 35 to 64 Years | 249 (15.0%) | 136 (7.9%) |
| 65 to 74 Years | 22 (8.6%) | 17 (5.7%) |
| 75 Years and over | 165 (42.2%) | 97 (15.5%) |
Disability Class: Self-Care Difficulty
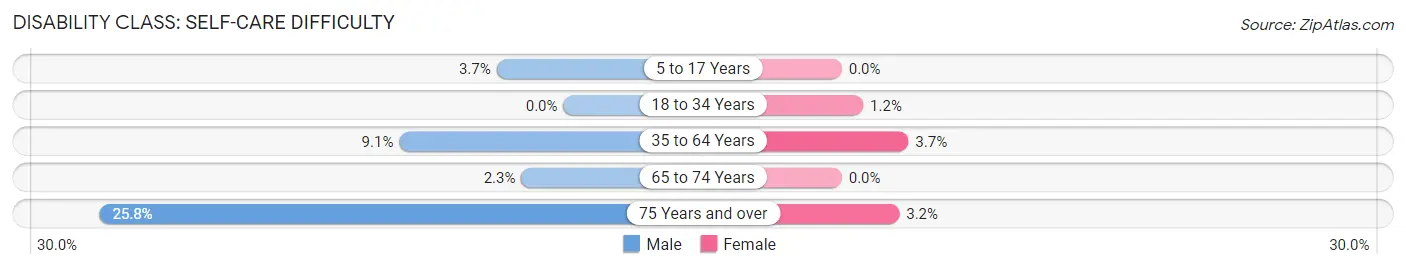
| Age Bracket | Male | Female |
| 5 to 17 Years | 34 (3.7%) | 0 (0.0%) |
| 18 to 34 Years | 0 (0.0%) | 19 (1.2%) |
| 35 to 64 Years | 152 (9.1%) | 64 (3.7%) |
| 65 to 74 Years | 6 (2.3%) | 0 (0.0%) |
| 75 Years and over | 101 (25.8%) | 20 (3.2%) |
Technology Access in Comstock Park
Computing Device Access in Comstock Park
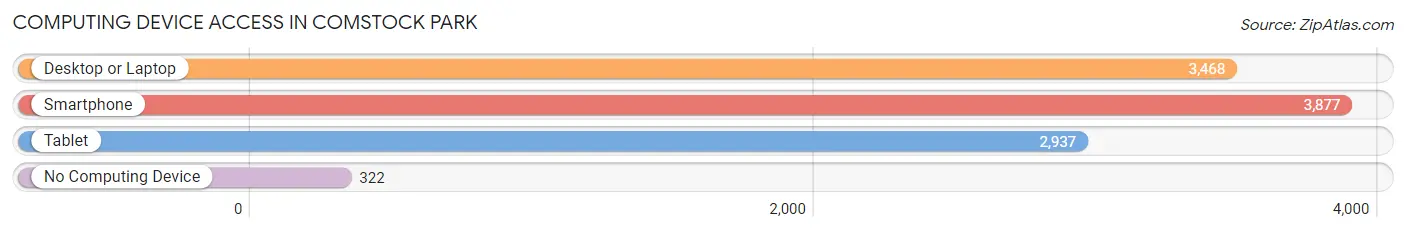
| Device Type | # Households | % Households |
| Desktop or Laptop | 3,468 | 76.9% |
| Smartphone | 3,877 | 86.0% |
| Tablet | 2,937 | 65.1% |
| No Computing Device | 322 | 7.1% |
| Total | 4,511 | 100.0% |
Internet Access in Comstock Park
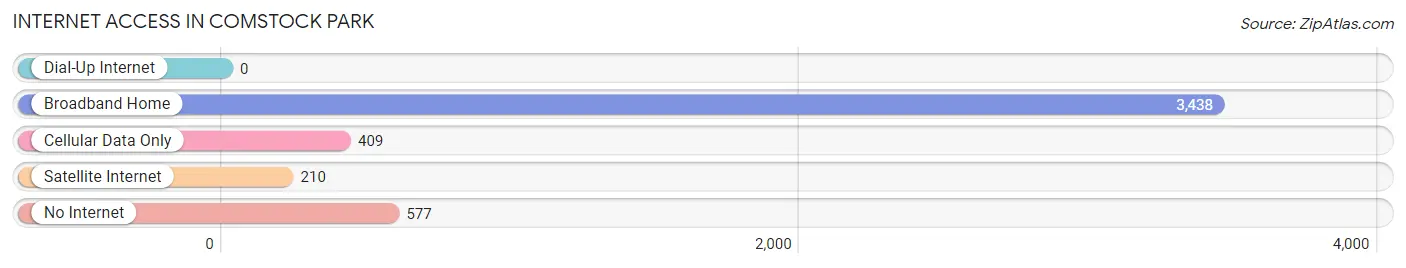
| Internet Type | # Households | % Households |
| Dial-Up Internet | 0 | 0.0% |
| Broadband Home | 3,438 | 76.2% |
| Cellular Data Only | 409 | 9.1% |
| Satellite Internet | 210 | 4.7% |
| No Internet | 577 | 12.8% |
| Total | 4,511 | 100.0% |
Comstock Park Summary
Comstock Park is a small unincorporated community located in the northern part of Kent County, Michigan. It is situated on the Grand River, just north of Grand Rapids. The population of Comstock Park was estimated to be 8,845 in 2019.
History
Comstock Park was first settled in 1837 by John Comstock, who purchased the land from the government. He built a sawmill and a gristmill on the Grand River, and the area became known as Comstock's Mills. In 1845, the area was renamed Comstock Park. The village was incorporated in 1867, and the first post office was established in 1868.
The village grew slowly, but by the early 1900s, it had become a popular summer resort destination. The Grand Rapids and Indiana Railroad built a station in Comstock Park in 1891, and the village was connected to Grand Rapids by streetcar in 1906.
In the 1950s, Comstock Park began to experience rapid growth as the city of Grand Rapids expanded. The village was annexed by the city in 1961, and the population has continued to grow since then.
Geography
Comstock Park is located in northern Kent County, Michigan, about 8 miles north of Grand Rapids. It is situated on the Grand River, and is bordered by Alpine Township to the north, Plainfield Township to the east, and the city of Grand Rapids to the south and west.
The terrain of Comstock Park is mostly flat, with some rolling hills. The village is located in the Grand River Valley, and is surrounded by wooded areas. The climate is humid continental, with cold winters and warm summers.
Economy
Comstock Park is primarily a residential community, but it does have some commercial and industrial businesses. The largest employers in the village are the Grand Rapids Public Schools, the Grand Rapids Community College, and the Grand Rapids Public Library.
Other businesses in the village include a variety of retail stores, restaurants, and service providers. Comstock Park is also home to several light industrial and manufacturing businesses.
Demographics
As of the 2010 census, the population of Comstock Park was 8,845. The racial makeup of the village was 87.3% White, 5.7% African American, 0.7% Native American, 1.7% Asian, and 3.6% from other races. Hispanic or Latino of any race were 6.2% of the population.
The median household income in Comstock Park was $50,945 in 2019, and the median home value was $179,400. The village has a high rate of homeownership, with 73.3% of residents owning their homes.
Conclusion
Comstock Park is a small unincorporated community located in northern Kent County, Michigan. It was first settled in 1837, and has grown steadily since then. The village is primarily residential, but it does have some commercial and industrial businesses. The population of Comstock Park was estimated to be 8,845 in 2019, and the median household income was $50,945. Comstock Park is a diverse community, with a mix of racial and ethnic backgrounds.
Common Questions
What is Per Capita Income in Comstock Park?
Per Capita income in Comstock Park is $30,281.
What is the Median Family Income in Comstock Park?
Median Family Income in Comstock Park is $74,534.
What is the Median Household income in Comstock Park?
Median Household Income in Comstock Park is $52,116.
What is Income or Wage Gap in Comstock Park?
Income or Wage Gap in Comstock Park is 26.6%.
Women in Comstock Park earn 73.4 cents for every dollar earned by a man.
What is Family Income Deficit in Comstock Park?
Family Income Deficit in Comstock Park is $13,142.
Families that are below poverty line in Comstock Park earn $13,142 less on average than the poverty threshold level.
What is Inequality or Gini Index in Comstock Park?
Inequality or Gini Index in Comstock Park is 0.39.
What is the Total Population of Comstock Park?
Total Population of Comstock Park is 10,379.
What is the Total Male Population of Comstock Park?
Total Male Population of Comstock Park is 5,050.
What is the Total Female Population of Comstock Park?
Total Female Population of Comstock Park is 5,329.
What is the Ratio of Males per 100 Females in Comstock Park?
There are 94.76 Males per 100 Females in Comstock Park.
What is the Ratio of Females per 100 Males in Comstock Park?
There are 105.52 Females per 100 Males in Comstock Park.
What is the Median Population Age in Comstock Park?
Median Population Age in Comstock Park is 33.8 Years.
What is the Average Family Size in Comstock Park
Average Family Size in Comstock Park is 3.1 People.
What is the Average Household Size in Comstock Park
Average Household Size in Comstock Park is 2.3 People.
How Large is the Labor Force in Comstock Park?
There are 5,686 People in the Labor Forcein in Comstock Park.
What is the Percentage of People in the Labor Force in Comstock Park?
67.5% of People are in the Labor Force in Comstock Park.
What is the Unemployment Rate in Comstock Park?
Unemployment Rate in Comstock Park is 4.0%.