Zip Codes with the Highest Percentage of Families with Income Below $10,000 in Sterling Heights, MI
RELATED REPORTS & OPTIONS
Family Income | $0-10k
Sterling Heights
Compare Zip Codes
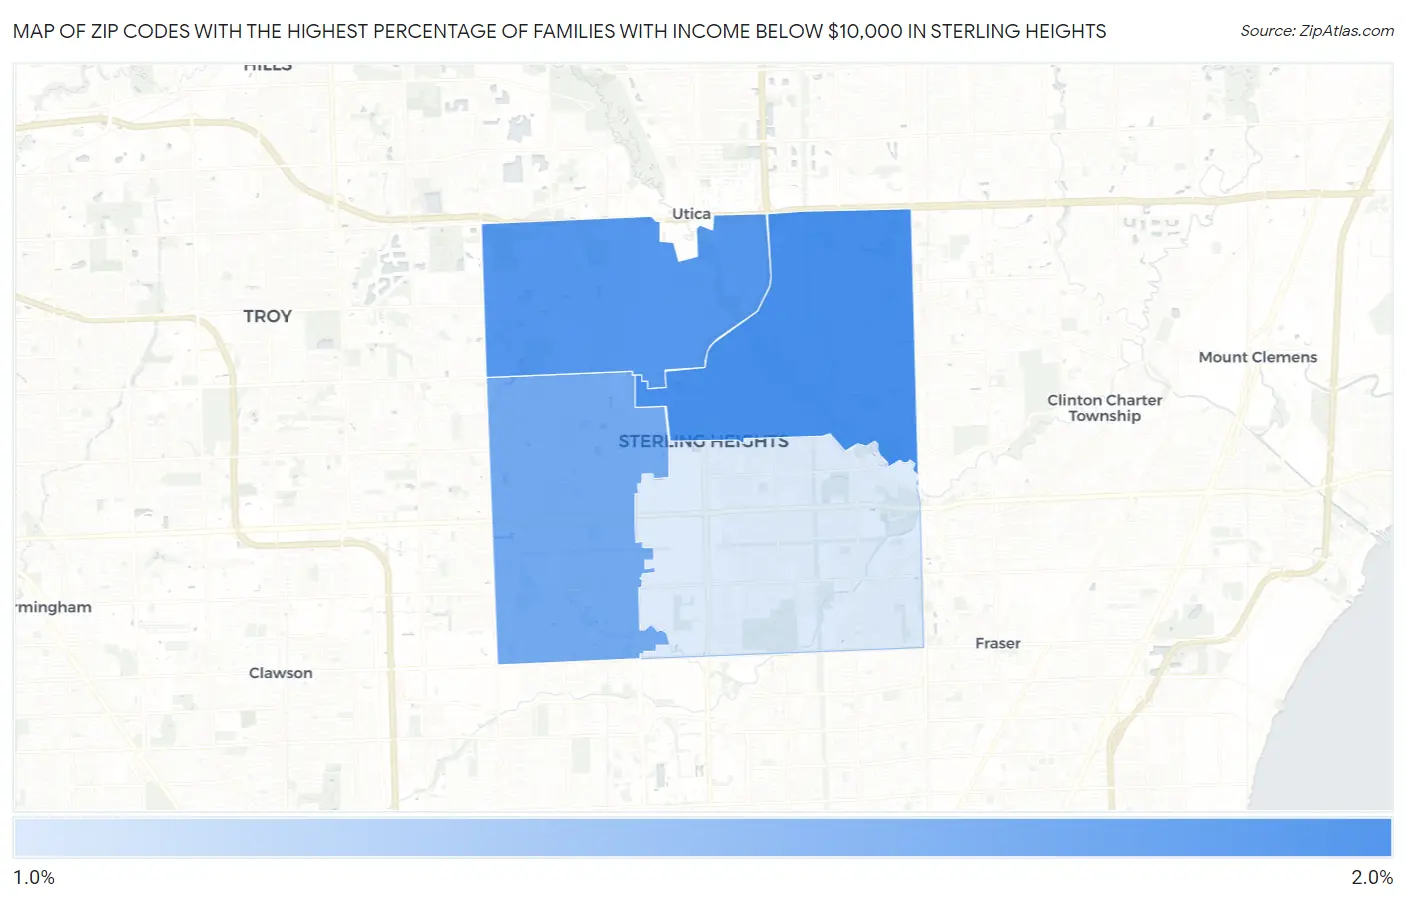
Map of Zip Codes with the Highest Percentage of Families with Income Below $10,000 in Sterling Heights
1.0%
2.0%
Zip Codes with the Highest Percentage of Families with Income Below $10,000 in Sterling Heights, MI
| Zip Code | Families with Income < $10k | vs State | vs National | |
| 1. | 48313 | 2.0% | 3.0%(-1.000)#485 | 3.1%(-1.10)#15,307 |
| 2. | 48314 | 1.9% | 3.0%(-1.10)#504 | 3.1%(-1.20)#15,846 |
| 3. | 48310 | 1.7% | 3.0%(-1.30)#537 | 3.1%(-1.40)#16,710 |
| 4. | 48312 | 1.0% | 3.0%(-2.00)#692 | 3.1%(-2.10)#20,237 |
1
Common Questions
What are the Top 3 Zip Codes with the Highest Percentage of Families with Income Below $10,000 in Sterling Heights, MI?
Top 3 Zip Codes with the Highest Percentage of Families with Income Below $10,000 in Sterling Heights, MI are:
What zip code has the Highest Percentage of Families with Income Below $10,000 in Sterling Heights, MI?
48313 has the Highest Percentage of Families with Income Below $10,000 in Sterling Heights, MI with 2.0%.
What is the Percentage of Families with Income Below $10,000 in Sterling Heights, MI?
Percentage of Families with Income Below $10,000 in Sterling Heights is 1.6%.
What is the Percentage of Families with Income Below $10,000 in Michigan?
Percentage of Families with Income Below $10,000 in Michigan is 3.0%.
What is the Percentage of Families with Income Below $10,000 in the United States?
Percentage of Families with Income Below $10,000 in the United States is 3.1%.