Alpena, MI Map & Demographics
Alpena Map
Alpena Overview
$30,936
PER CAPITA INCOME
$56,952
AVG FAMILY INCOME
$43,613
AVG HOUSEHOLD INCOME
38.0%
WAGE / INCOME GAP [ % ]
62.0¢/ $1
WAGE / INCOME GAP [ $ ]
$9,281
FAMILY INCOME DEFICIT
0.49
INEQUALITY / GINI INDEX
10,200
TOTAL POPULATION
4,905
MALE POPULATION
5,295
FEMALE POPULATION
92.63
MALES / 100 FEMALES
107.95
FEMALES / 100 MALES
44.7
MEDIAN AGE
2.8
AVG FAMILY SIZE
2.0
AVG HOUSEHOLD SIZE
4,874
LABOR FORCE [ PEOPLE ]
56.6%
PERCENT IN LABOR FORCE
8.9%
UNEMPLOYMENT RATE
Alpena Zip Codes
Alpena Area Codes
Income in Alpena
Income Overview in Alpena
Per Capita Income in Alpena is $30,936, while median incomes of families and households are $56,952 and $43,613 respectively.
| Characteristic | Number | Measure |
| Per Capita Income | 10,200 | $30,936 |
| Median Family Income | 2,324 | $56,952 |
| Mean Family Income | 2,324 | $66,801 |
| Median Household Income | 4,903 | $43,613 |
| Mean Household Income | 4,903 | $61,653 |
| Income Deficit | 2,324 | $9,281 |
| Wage / Income Gap (%) | 10,200 | 37.99% |
| Wage / Income Gap ($) | 10,200 | 62.01¢ per $1 |
| Gini / Inequality Index | 10,200 | 0.49 |
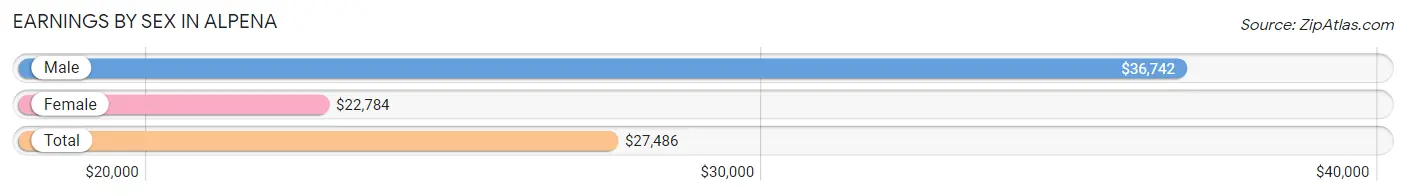
Earnings by Sex in Alpena
Average Earnings in Alpena are $27,486, $36,742 for men and $22,784 for women, a difference of 38.0%.
| Sex | Number | Average Earnings |
| Male | 2,454 (49.8%) | $36,742 |
| Female | 2,475 (50.2%) | $22,784 |
| Total | 4,929 (100.0%) | $27,486 |
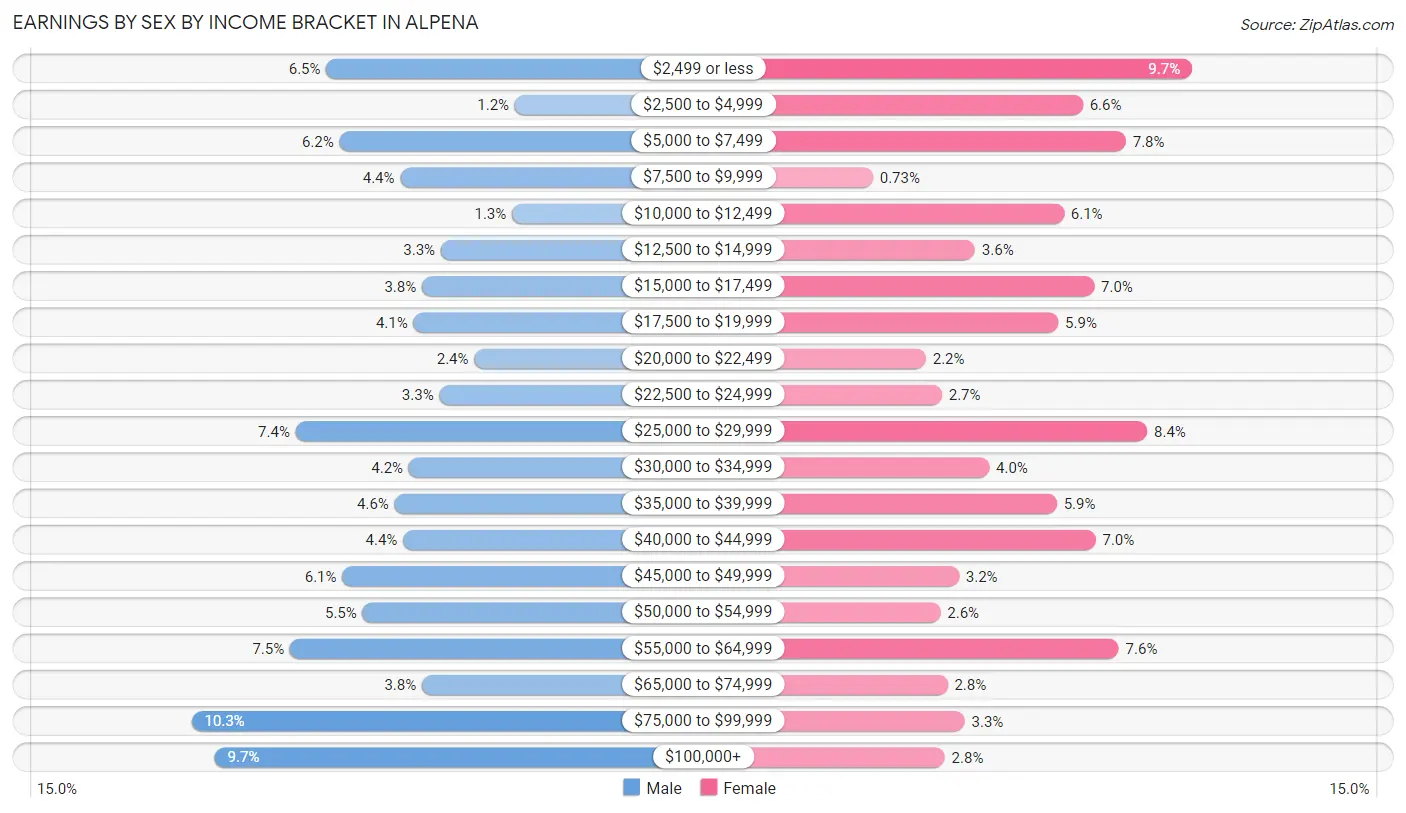
Earnings by Sex by Income Bracket in Alpena
The most common earnings brackets in Alpena are $75,000 to $99,999 for men (253 | 10.3%) and $2,499 or less for women (240 | 9.7%).
| Income | Male | Female |
| $2,499 or less | 160 (6.5%) | 240 (9.7%) |
| $2,500 to $4,999 | 30 (1.2%) | 164 (6.6%) |
| $5,000 to $7,499 | 151 (6.1%) | 194 (7.8%) |
| $7,500 to $9,999 | 109 (4.4%) | 18 (0.7%) |
| $10,000 to $12,499 | 32 (1.3%) | 151 (6.1%) |
| $12,500 to $14,999 | 81 (3.3%) | 89 (3.6%) |
| $15,000 to $17,499 | 94 (3.8%) | 172 (7.0%) |
| $17,500 to $19,999 | 100 (4.1%) | 147 (5.9%) |
| $20,000 to $22,499 | 58 (2.4%) | 55 (2.2%) |
| $22,500 to $24,999 | 82 (3.3%) | 66 (2.7%) |
| $25,000 to $29,999 | 181 (7.4%) | 209 (8.4%) |
| $30,000 to $34,999 | 103 (4.2%) | 99 (4.0%) |
| $35,000 to $39,999 | 113 (4.6%) | 146 (5.9%) |
| $40,000 to $44,999 | 107 (4.4%) | 173 (7.0%) |
| $45,000 to $49,999 | 149 (6.1%) | 78 (3.2%) |
| $50,000 to $54,999 | 135 (5.5%) | 65 (2.6%) |
| $55,000 to $64,999 | 185 (7.5%) | 189 (7.6%) |
| $65,000 to $74,999 | 94 (3.8%) | 70 (2.8%) |
| $75,000 to $99,999 | 253 (10.3%) | 82 (3.3%) |
| $100,000+ | 237 (9.7%) | 68 (2.8%) |
| Total | 2,454 (100.0%) | 2,475 (100.0%) |
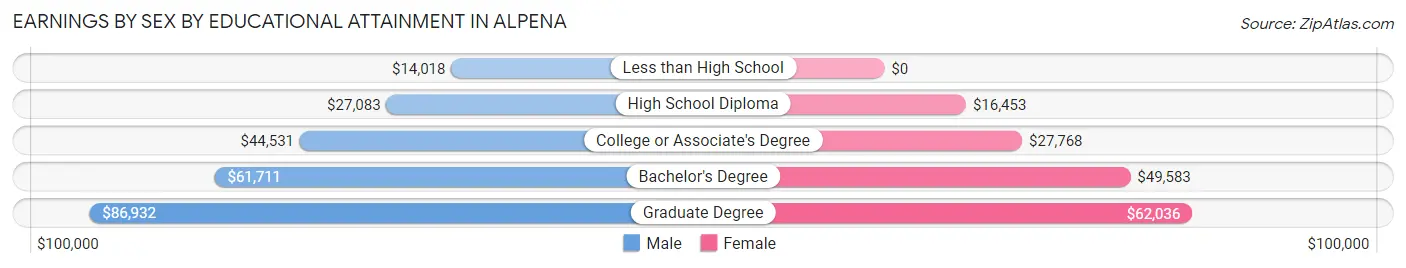
Earnings by Sex by Educational Attainment in Alpena
Average earnings in Alpena are $38,142 for men and $26,727 for women, a difference of 29.9%. Men with an educational attainment of graduate degree enjoy the highest average annual earnings of $86,932, while those with less than high school education earn the least with $14,018. Women with an educational attainment of graduate degree earn the most with the average annual earnings of $62,036, while those with high school diploma education have the smallest earnings of $16,453.
| Educational Attainment | Male Income | Female Income |
| Less than High School | $14,018 | $0 |
| High School Diploma | $27,083 | $16,453 |
| College or Associate's Degree | $44,531 | $27,768 |
| Bachelor's Degree | $61,711 | $49,583 |
| Graduate Degree | $86,932 | $62,036 |
| Total | $38,142 | $26,727 |
Family Income in Alpena
Family Income Brackets in Alpena
According to the Alpena family income data, there are 467 families falling into the $50,000 to $74,999 income range, which is the most common income bracket and makes up 20.1% of all families. Conversely, the $200,000+ income bracket is the least frequent group with only 30 families (1.3%) belonging to this category.
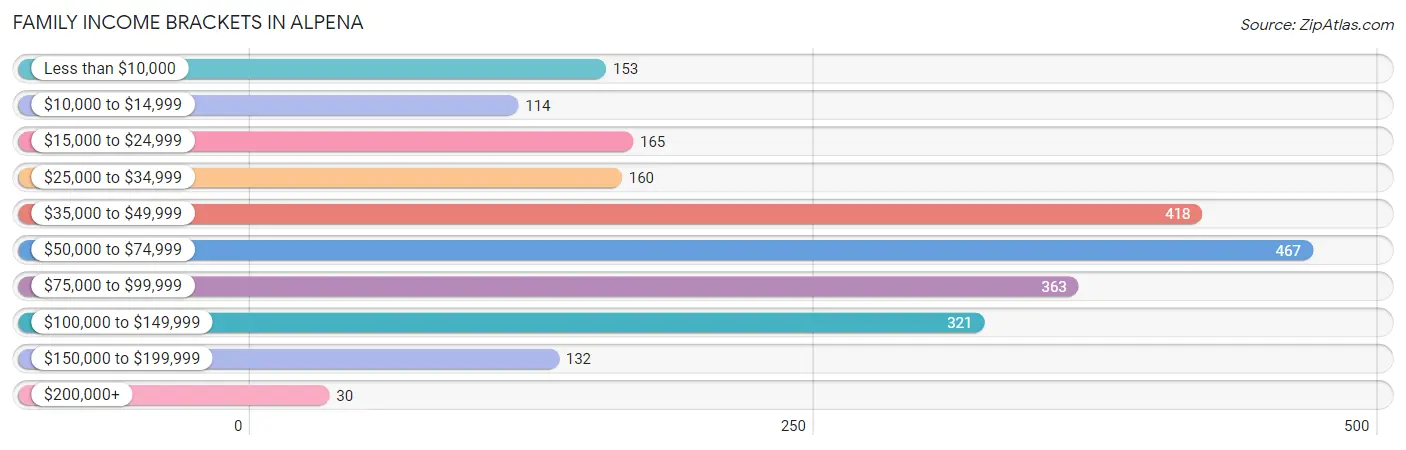
| Income Bracket | # Families | % Families |
| Less than $10,000 | 153 | 6.6% |
| $10,000 to $14,999 | 114 | 4.9% |
| $15,000 to $24,999 | 165 | 7.1% |
| $25,000 to $34,999 | 160 | 6.9% |
| $35,000 to $49,999 | 418 | 18.0% |
| $50,000 to $74,999 | 467 | 20.1% |
| $75,000 to $99,999 | 363 | 15.6% |
| $100,000 to $149,999 | 321 | 13.8% |
| $150,000 to $199,999 | 132 | 5.7% |
| $200,000+ | 30 | 1.3% |
Family Income by Famaliy Size in Alpena
4-person families (245 | 10.5%) account for the highest median family income in Alpena with $63,750 per family, while 2-person families (1,225 | 52.7%) have the highest median income of $31,836 per family member.
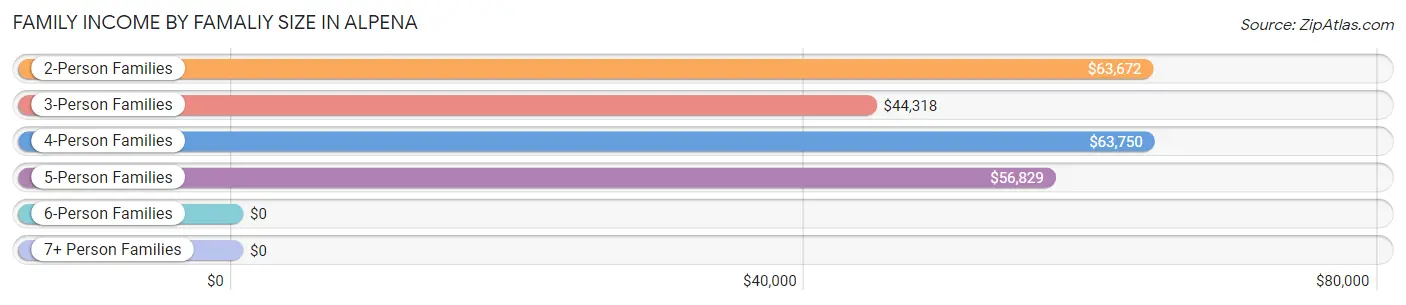
| Income Bracket | # Families | Median Income |
| 2-Person Families | 1,225 (52.7%) | $63,672 |
| 3-Person Families | 696 (29.9%) | $44,318 |
| 4-Person Families | 245 (10.5%) | $63,750 |
| 5-Person Families | 119 (5.1%) | $56,829 |
| 6-Person Families | 26 (1.1%) | $0 |
| 7+ Person Families | 13 (0.6%) | $0 |
| Total | 2,324 (100.0%) | $56,952 |
Family Income by Number of Earners in Alpena
The median family income in Alpena is $56,952, with families comprising 3+ earners (111) having the highest median family income of $79,205, while families with no earners (533) have the lowest median family income of $38,099, accounting for 4.8% and 22.9% of families, respectively.
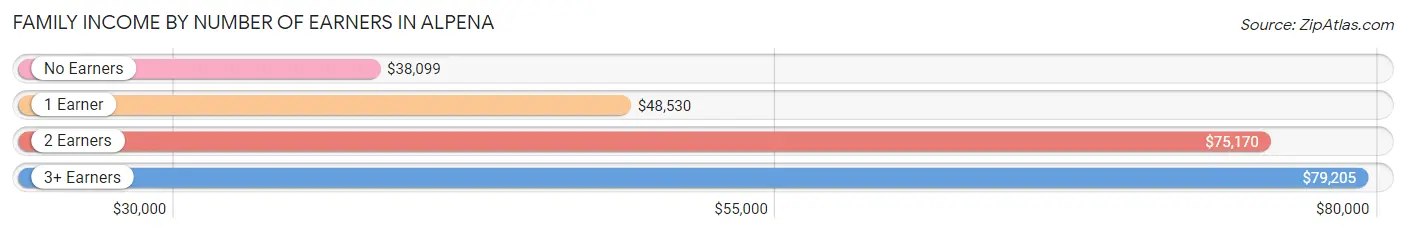
| Number of Earners | # Families | Median Income |
| No Earners | 533 (22.9%) | $38,099 |
| 1 Earner | 871 (37.5%) | $48,530 |
| 2 Earners | 809 (34.8%) | $75,170 |
| 3+ Earners | 111 (4.8%) | $79,205 |
| Total | 2,324 (100.0%) | $56,952 |
Household Income in Alpena
Household Income Brackets in Alpena
With 829 households falling in the category, the $50,000 to $74,999 income range is the most frequent in Alpena, accounting for 16.9% of all households. In contrast, only 108 households (2.2%) fall into the $200,000+ income bracket, making it the least populous group.
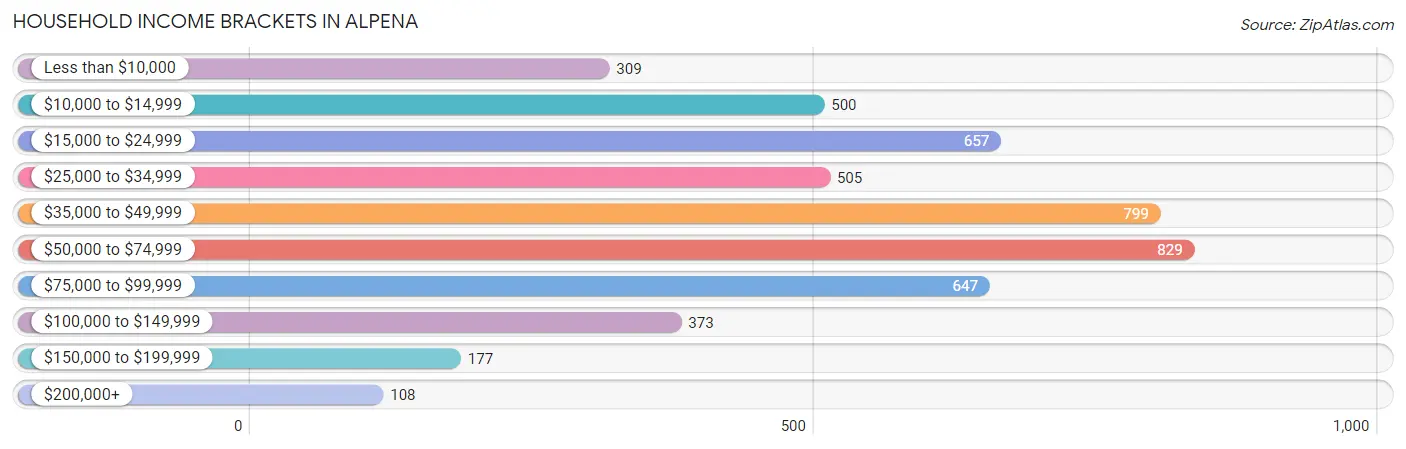
| Income Bracket | # Households | % Households |
| Less than $10,000 | 309 | 6.3% |
| $10,000 to $14,999 | 500 | 10.2% |
| $15,000 to $24,999 | 657 | 13.4% |
| $25,000 to $34,999 | 505 | 10.3% |
| $35,000 to $49,999 | 799 | 16.3% |
| $50,000 to $74,999 | 829 | 16.9% |
| $75,000 to $99,999 | 647 | 13.2% |
| $100,000 to $149,999 | 373 | 7.6% |
| $150,000 to $199,999 | 177 | 3.6% |
| $200,000+ | 108 | 2.2% |
Household Income by Householder Age in Alpena
The median household income in Alpena is $43,613, with the highest median household income of $50,216 found in the 25 to 44 years age bracket for the primary householder. A total of 1,343 households (27.4%) fall into this category. Meanwhile, the 65+ years age bracket for the primary householder has the lowest median household income of $39,383, with 1,541 households (31.4%) in this group.
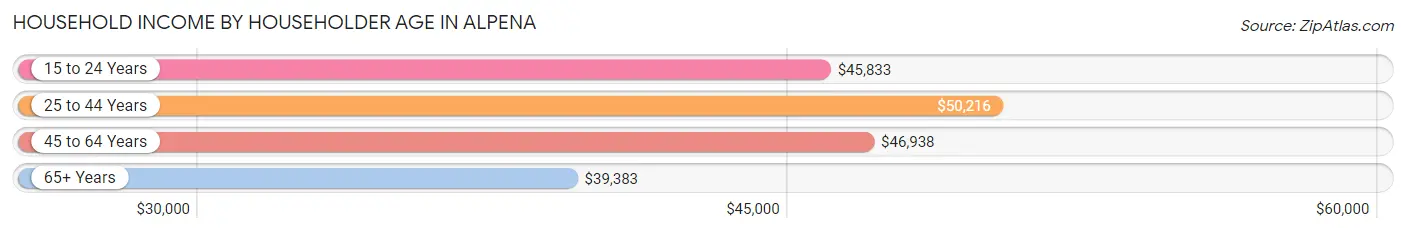
| Income Bracket | # Households | Median Income |
| 15 to 24 Years | 198 (4.0%) | $45,833 |
| 25 to 44 Years | 1,343 (27.4%) | $50,216 |
| 45 to 64 Years | 1,821 (37.1%) | $46,938 |
| 65+ Years | 1,541 (31.4%) | $39,383 |
| Total | 4,903 (100.0%) | $43,613 |
Poverty in Alpena
Income Below Poverty by Sex and Age in Alpena
With 19.0% poverty level for males and 22.7% for females among the residents of Alpena, 5 year old males and 5 year old females are the most vulnerable to poverty, with 10 males (40.0%) and 6 females (60.0%) in their respective age groups living below the poverty level.
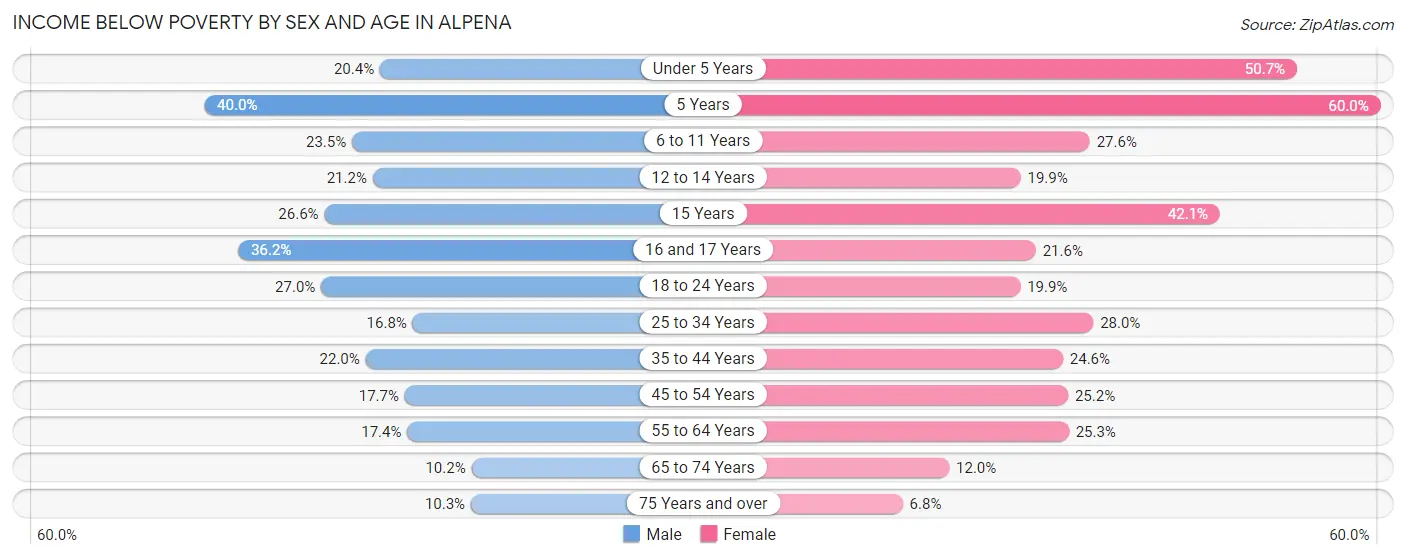
| Age Bracket | Male | Female |
| Under 5 Years | 29 (20.4%) | 150 (50.7%) |
| 5 Years | 10 (40.0%) | 6 (60.0%) |
| 6 to 11 Years | 88 (23.5%) | 45 (27.6%) |
| 12 to 14 Years | 38 (21.2%) | 46 (19.9%) |
| 15 Years | 29 (26.6%) | 16 (42.1%) |
| 16 and 17 Years | 50 (36.2%) | 27 (21.6%) |
| 18 to 24 Years | 89 (27.0%) | 60 (19.9%) |
| 25 to 34 Years | 99 (16.8%) | 168 (28.0%) |
| 35 to 44 Years | 168 (22.0%) | 144 (24.6%) |
| 45 to 54 Years | 89 (17.7%) | 170 (25.2%) |
| 55 to 64 Years | 118 (17.4%) | 237 (25.3%) |
| 65 to 74 Years | 58 (10.2%) | 60 (11.9%) |
| 75 Years and over | 35 (10.3%) | 49 (6.8%) |
| Total | 900 (19.0%) | 1,178 (22.7%) |
Income Above Poverty by Sex and Age in Alpena
According to the poverty statistics in Alpena, males aged 65 to 74 years and females aged 75 years and over are the age groups that are most secure financially, with 89.8% of males and 93.2% of females in these age groups living above the poverty line.
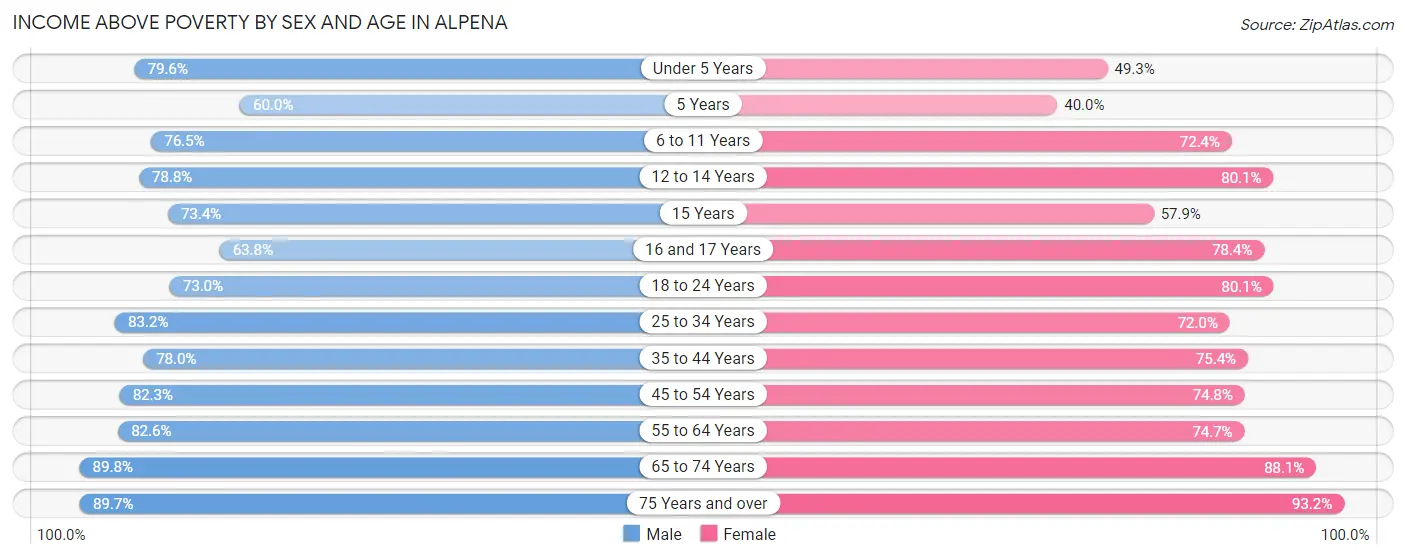
| Age Bracket | Male | Female |
| Under 5 Years | 113 (79.6%) | 146 (49.3%) |
| 5 Years | 15 (60.0%) | 4 (40.0%) |
| 6 to 11 Years | 286 (76.5%) | 118 (72.4%) |
| 12 to 14 Years | 141 (78.8%) | 185 (80.1%) |
| 15 Years | 80 (73.4%) | 22 (57.9%) |
| 16 and 17 Years | 88 (63.8%) | 98 (78.4%) |
| 18 to 24 Years | 241 (73.0%) | 242 (80.1%) |
| 25 to 34 Years | 491 (83.2%) | 432 (72.0%) |
| 35 to 44 Years | 595 (78.0%) | 441 (75.4%) |
| 45 to 54 Years | 415 (82.3%) | 505 (74.8%) |
| 55 to 64 Years | 561 (82.6%) | 701 (74.7%) |
| 65 to 74 Years | 509 (89.8%) | 442 (88.0%) |
| 75 Years and over | 305 (89.7%) | 674 (93.2%) |
| Total | 3,840 (81.0%) | 4,010 (77.3%) |
Income Below Poverty Among Married-Couple Families in Alpena
The poverty statistics for married-couple families in Alpena show that 6.4% or 104 of the total 1,636 families live below the poverty line. Families with 5 or more children have the highest poverty rate of 100.0%, comprising of 13 families. On the other hand, families with 3 or 4 children have the lowest poverty rate of 0.0%, which includes 0 families.
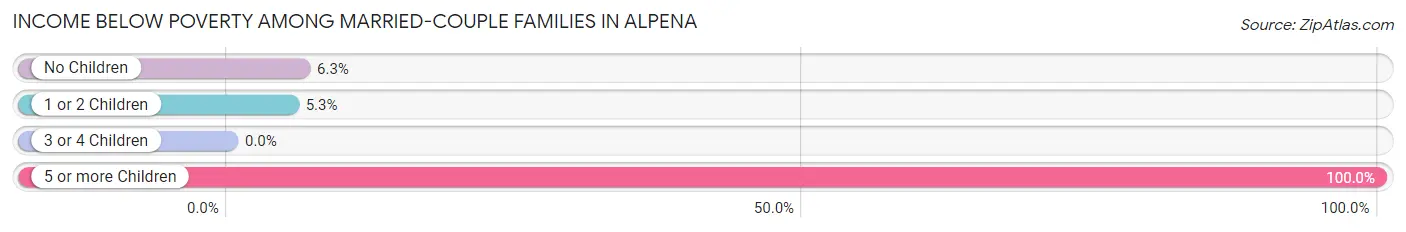
| Children | Above Poverty | Below Poverty |
| No Children | 1,092 (93.7%) | 73 (6.3%) |
| 1 or 2 Children | 323 (94.7%) | 18 (5.3%) |
| 3 or 4 Children | 117 (100.0%) | 0 (0.0%) |
| 5 or more Children | 0 (0.0%) | 13 (100.0%) |
| Total | 1,532 (93.6%) | 104 (6.4%) |
Income Below Poverty Among Single-Parent Households in Alpena
According to the poverty data in Alpena, 21.8% or 47 single-father households and 52.7% or 249 single-mother households are living below the poverty line. Among single-father households, those with no children have the highest poverty rate, with 21 households (56.8%) experiencing poverty. Likewise, among single-mother households, those with 1 or 2 children have the highest poverty rate, with 249 households (61.9%) falling below the poverty line.
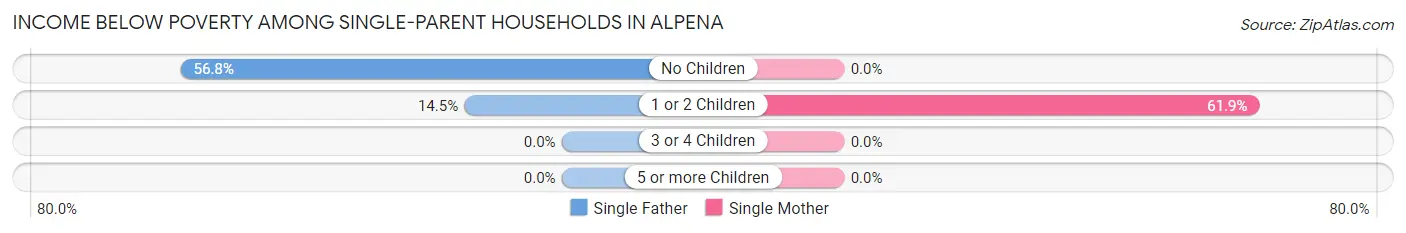
| Children | Single Father | Single Mother |
| No Children | 21 (56.8%) | 0 (0.0%) |
| 1 or 2 Children | 26 (14.5%) | 249 (61.9%) |
| 3 or 4 Children | 0 (0.0%) | 0 (0.0%) |
| 5 or more Children | 0 (0.0%) | 0 (0.0%) |
| Total | 47 (21.8%) | 249 (52.7%) |
Income Below Poverty Among Married-Couple vs Single-Parent Households in Alpena
The poverty data for Alpena shows that 104 of the married-couple family households (6.4%) and 296 of the single-parent households (43.0%) are living below the poverty level. Within the married-couple family households, those with 5 or more children have the highest poverty rate, with 13 households (100.0%) falling below the poverty line. Among the single-parent households, those with 1 or 2 children have the highest poverty rate, with 275 household (47.3%) living below poverty.
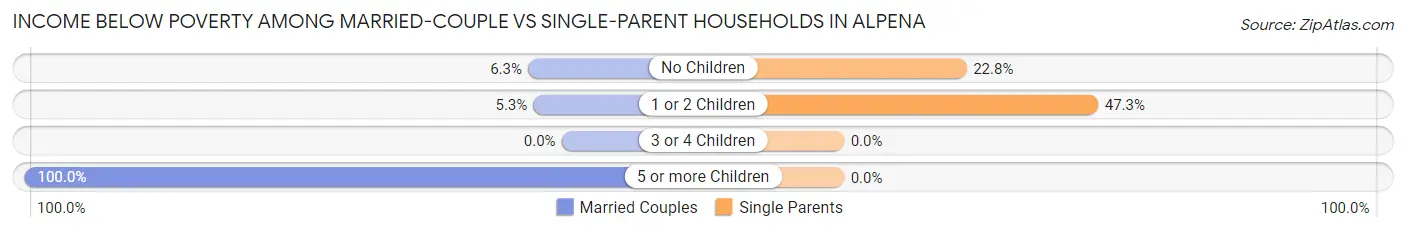
| Children | Married-Couple Families | Single-Parent Households |
| No Children | 73 (6.3%) | 21 (22.8%) |
| 1 or 2 Children | 18 (5.3%) | 275 (47.3%) |
| 3 or 4 Children | 0 (0.0%) | 0 (0.0%) |
| 5 or more Children | 13 (100.0%) | 0 (0.0%) |
| Total | 104 (6.4%) | 296 (43.0%) |
Race in Alpena
The most populous races in Alpena are White / Caucasian (9,598 | 94.1%), Two or more Races (411 | 4.0%), and Hispanic or Latino (364 | 3.6%).
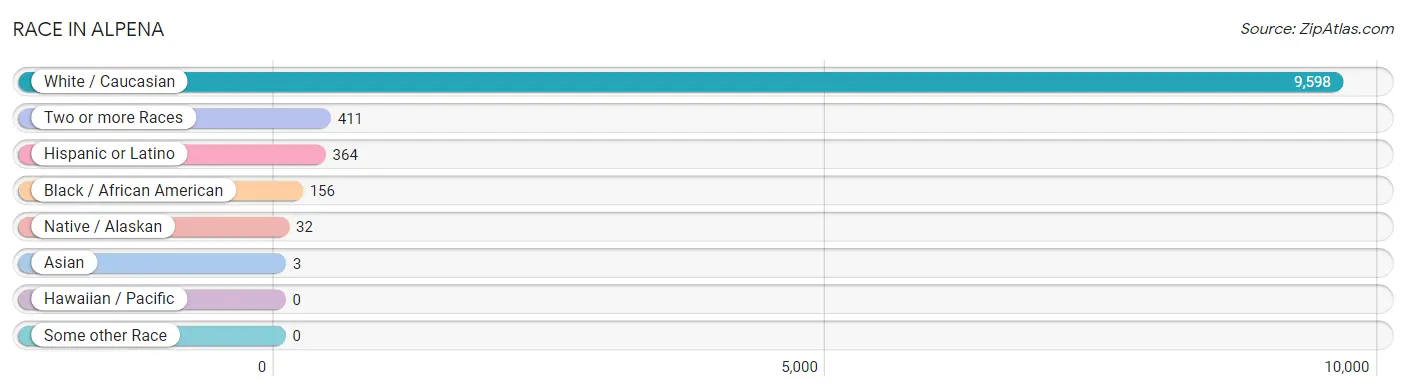
| Race | # Population | % Population |
| Asian | 3 | 0.0% |
| Black / African American | 156 | 1.5% |
| Hawaiian / Pacific | 0 | 0.0% |
| Hispanic or Latino | 364 | 3.6% |
| Native / Alaskan | 32 | 0.3% |
| White / Caucasian | 9,598 | 94.1% |
| Two or more Races | 411 | 4.0% |
| Some other Race | 0 | 0.0% |
| Total | 10,200 | 100.0% |
Ancestry in Alpena
The most populous ancestries reported in Alpena are German (2,187 | 21.4%), Polish (2,159 | 21.2%), Irish (1,175 | 11.5%), English (894 | 8.8%), and American (893 | 8.7%), together accounting for 71.6% of all Alpena residents.
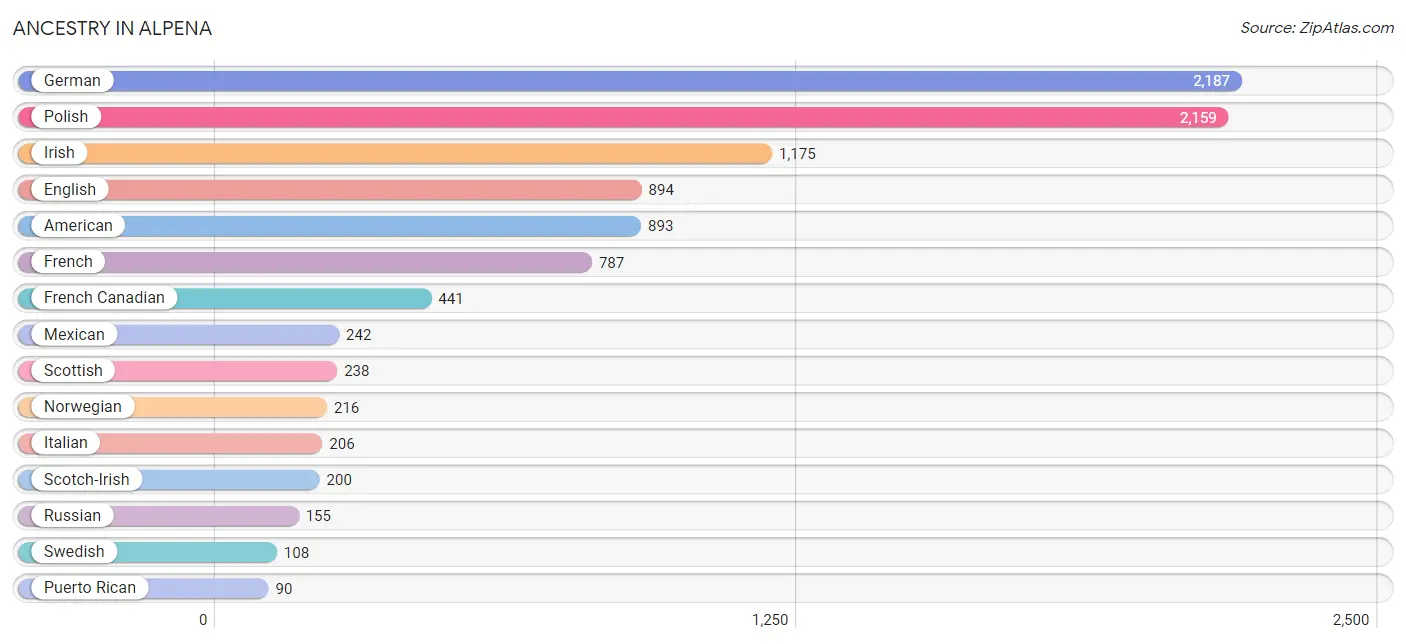
| Ancestry | # Population | % Population |
| African | 9 | 0.1% |
| American | 893 | 8.7% |
| Arab | 7 | 0.1% |
| Australian | 2 | 0.0% |
| Austrian | 10 | 0.1% |
| Belgian | 6 | 0.1% |
| British | 53 | 0.5% |
| Canadian | 6 | 0.1% |
| Cherokee | 21 | 0.2% |
| Chippewa | 7 | 0.1% |
| Choctaw | 7 | 0.1% |
| Cree | 13 | 0.1% |
| Croatian | 7 | 0.1% |
| Danish | 34 | 0.3% |
| Dutch | 89 | 0.9% |
| Eastern European | 12 | 0.1% |
| Ecuadorian | 12 | 0.1% |
| English | 894 | 8.8% |
| European | 72 | 0.7% |
| Finnish | 26 | 0.3% |
| French | 787 | 7.7% |
| French Canadian | 441 | 4.3% |
| German | 2,187 | 21.4% |
| Greek | 24 | 0.2% |
| Irish | 1,175 | 11.5% |
| Italian | 206 | 2.0% |
| Japanese | 3 | 0.0% |
| Korean | 15 | 0.2% |
| Lebanese | 7 | 0.1% |
| Lithuanian | 9 | 0.1% |
| Mexican | 242 | 2.4% |
| Northern European | 36 | 0.4% |
| Norwegian | 216 | 2.1% |
| Ottawa | 12 | 0.1% |
| Pennsylvania German | 12 | 0.1% |
| Polish | 2,159 | 21.2% |
| Puerto Rican | 90 | 0.9% |
| Russian | 155 | 1.5% |
| Scandinavian | 49 | 0.5% |
| Scotch-Irish | 200 | 2.0% |
| Scottish | 238 | 2.3% |
| Serbian | 6 | 0.1% |
| Slovak | 4 | 0.0% |
| South American | 12 | 0.1% |
| Subsaharan African | 12 | 0.1% |
| Swedish | 108 | 1.1% |
| Swiss | 9 | 0.1% |
| Syrian | 7 | 0.1% |
| Ukrainian | 14 | 0.1% |
| Welsh | 29 | 0.3% | View All 50 Rows |
Immigrants in Alpena
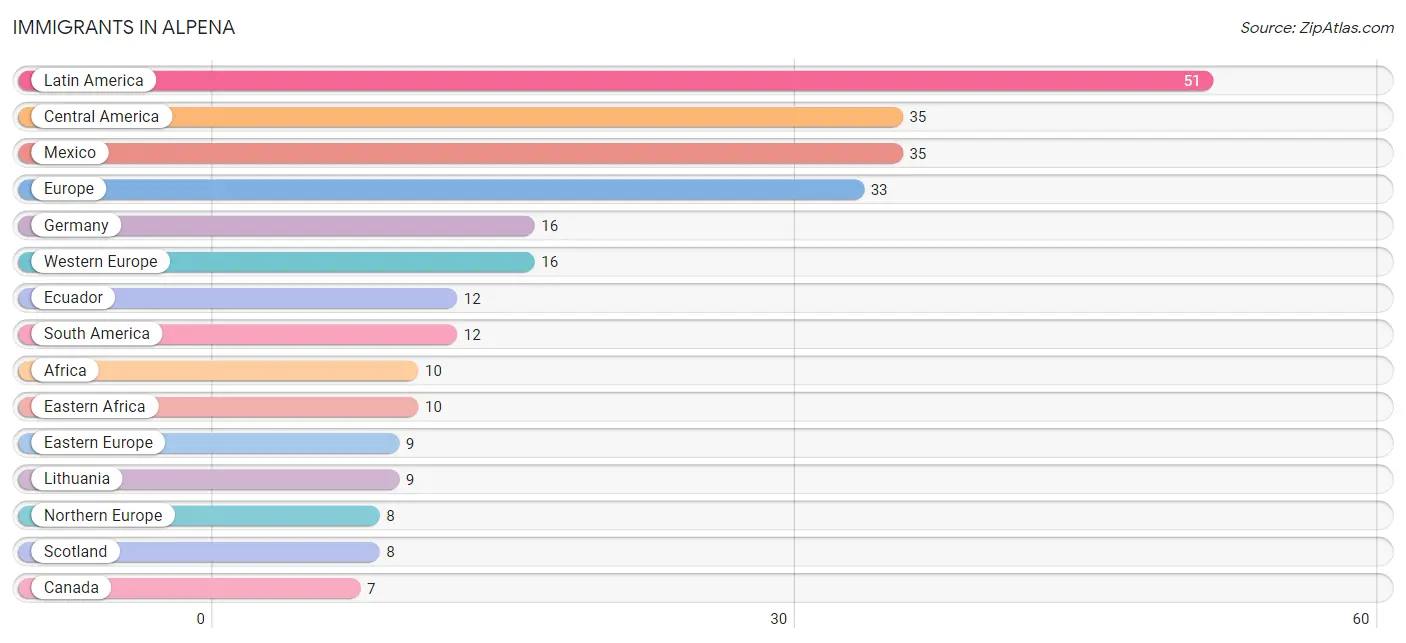
The most numerous immigrant groups reported in Alpena came from Latin America (51 | 0.5%), Central America (35 | 0.3%), Mexico (35 | 0.3%), Europe (33 | 0.3%), and Germany (16 | 0.2%), together accounting for 1.7% of all Alpena residents.
| Immigration Origin | # Population | % Population |
| Africa | 10 | 0.1% |
| Asia | 3 | 0.0% |
| Cambodia | 3 | 0.0% |
| Canada | 7 | 0.1% |
| Caribbean | 4 | 0.0% |
| Central America | 35 | 0.3% |
| Eastern Africa | 10 | 0.1% |
| Eastern Europe | 9 | 0.1% |
| Ecuador | 12 | 0.1% |
| Ethiopia | 1 | 0.0% |
| Europe | 33 | 0.3% |
| Germany | 16 | 0.2% |
| Jamaica | 4 | 0.0% |
| Latin America | 51 | 0.5% |
| Lithuania | 9 | 0.1% |
| Mexico | 35 | 0.3% |
| Northern Europe | 8 | 0.1% |
| Scotland | 8 | 0.1% |
| South America | 12 | 0.1% |
| South Eastern Asia | 3 | 0.0% |
| Western Europe | 16 | 0.2% | View All 21 Rows |
Sex and Age in Alpena
Sex and Age in Alpena
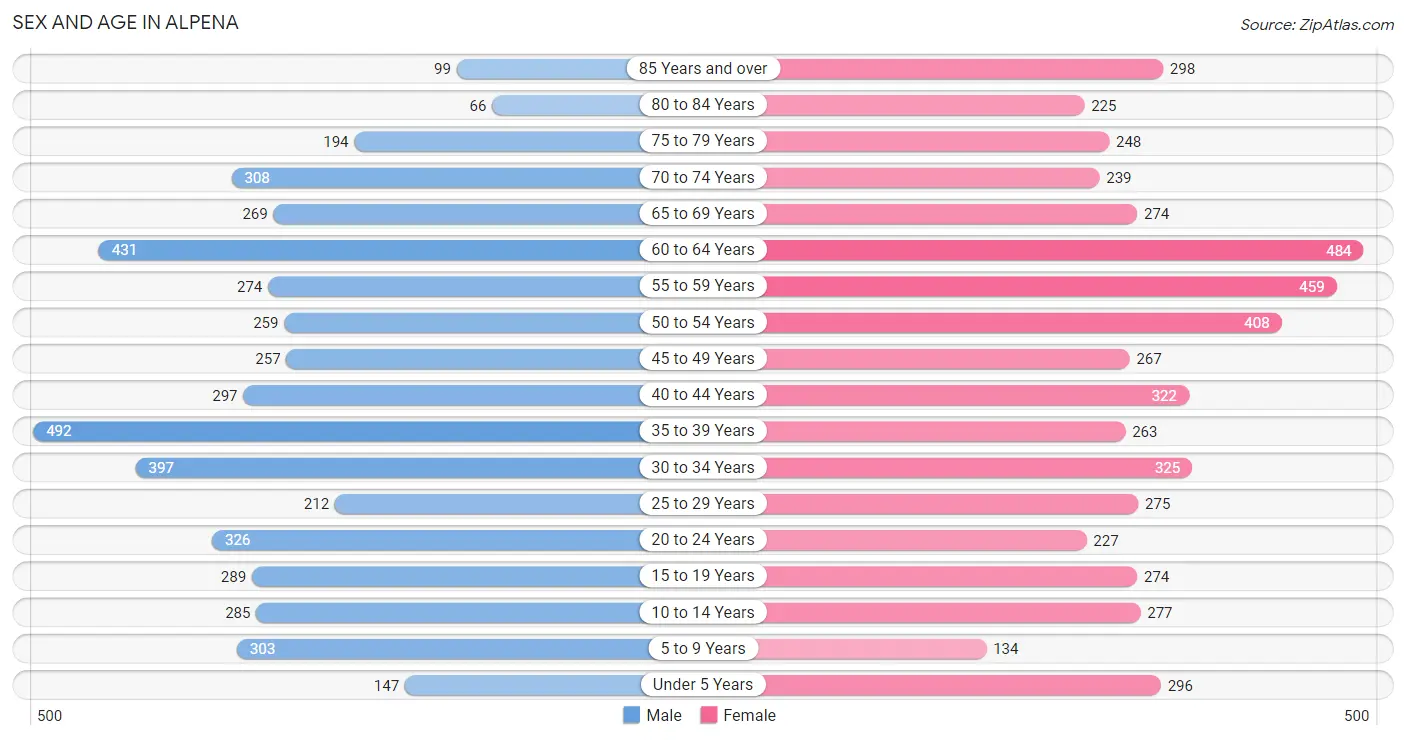
The most populous age groups in Alpena are 35 to 39 Years (492 | 10.0%) for men and 60 to 64 Years (484 | 9.1%) for women.
| Age Bracket | Male | Female |
| Under 5 Years | 147 (3.0%) | 296 (5.6%) |
| 5 to 9 Years | 303 (6.2%) | 134 (2.5%) |
| 10 to 14 Years | 285 (5.8%) | 277 (5.2%) |
| 15 to 19 Years | 289 (5.9%) | 274 (5.2%) |
| 20 to 24 Years | 326 (6.7%) | 227 (4.3%) |
| 25 to 29 Years | 212 (4.3%) | 275 (5.2%) |
| 30 to 34 Years | 397 (8.1%) | 325 (6.1%) |
| 35 to 39 Years | 492 (10.0%) | 263 (5.0%) |
| 40 to 44 Years | 297 (6.1%) | 322 (6.1%) |
| 45 to 49 Years | 257 (5.2%) | 267 (5.0%) |
| 50 to 54 Years | 259 (5.3%) | 408 (7.7%) |
| 55 to 59 Years | 274 (5.6%) | 459 (8.7%) |
| 60 to 64 Years | 431 (8.8%) | 484 (9.1%) |
| 65 to 69 Years | 269 (5.5%) | 274 (5.2%) |
| 70 to 74 Years | 308 (6.3%) | 239 (4.5%) |
| 75 to 79 Years | 194 (4.0%) | 248 (4.7%) |
| 80 to 84 Years | 66 (1.3%) | 225 (4.3%) |
| 85 Years and over | 99 (2.0%) | 298 (5.6%) |
| Total | 4,905 (100.0%) | 5,295 (100.0%) |
Families and Households in Alpena
Median Family Size in Alpena
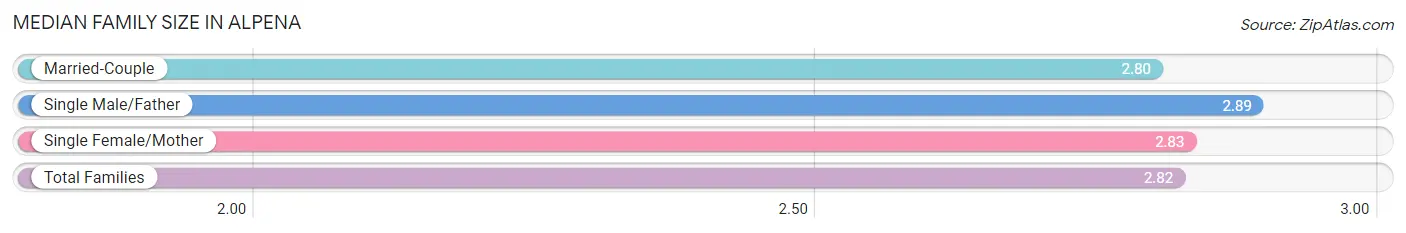
The median family size in Alpena is 2.82 persons per family, with single male/father families (216 | 9.3%) accounting for the largest median family size of 2.89 persons per family. On the other hand, married-couple families (1,636 | 70.4%) represent the smallest median family size with 2.80 persons per family.
| Family Type | # Families | Family Size |
| Married-Couple | 1,636 (70.4%) | 2.80 |
| Single Male/Father | 216 (9.3%) | 2.89 |
| Single Female/Mother | 472 (20.3%) | 2.83 |
| Total Families | 2,324 (100.0%) | 2.82 |
Median Household Size in Alpena
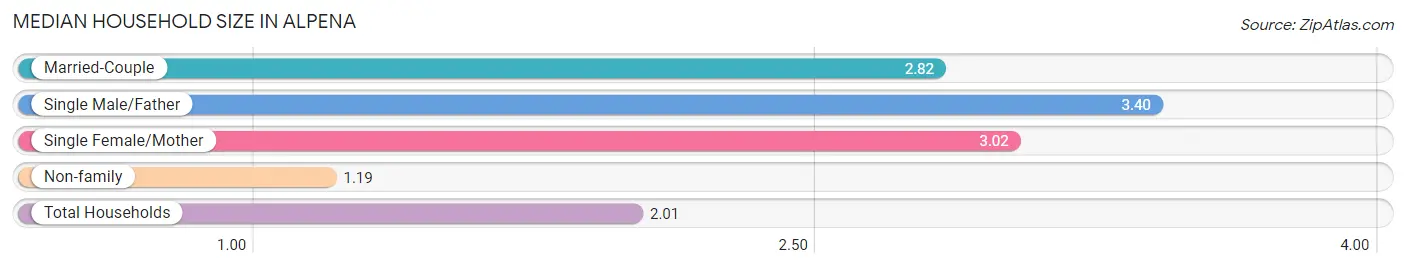
The median household size in Alpena is 2.01 persons per household, with single male/father households (216 | 4.4%) accounting for the largest median household size of 3.4 persons per household. non-family households (2,579 | 52.6%) represent the smallest median household size with 1.19 persons per household.
| Household Type | # Households | Household Size |
| Married-Couple | 1,636 (33.4%) | 2.82 |
| Single Male/Father | 216 (4.4%) | 3.40 |
| Single Female/Mother | 472 (9.6%) | 3.02 |
| Non-family | 2,579 (52.6%) | 1.19 |
| Total Households | 4,903 (100.0%) | 2.01 |
Household Size by Marriage Status in Alpena
Out of a total of 4,903 households in Alpena, 2,324 (47.4%) are family households, while 2,579 (52.6%) are nonfamily households. The most numerous type of family households are 2-person households, comprising 1,152, and the most common type of nonfamily households are 1-person households, comprising 2,217.
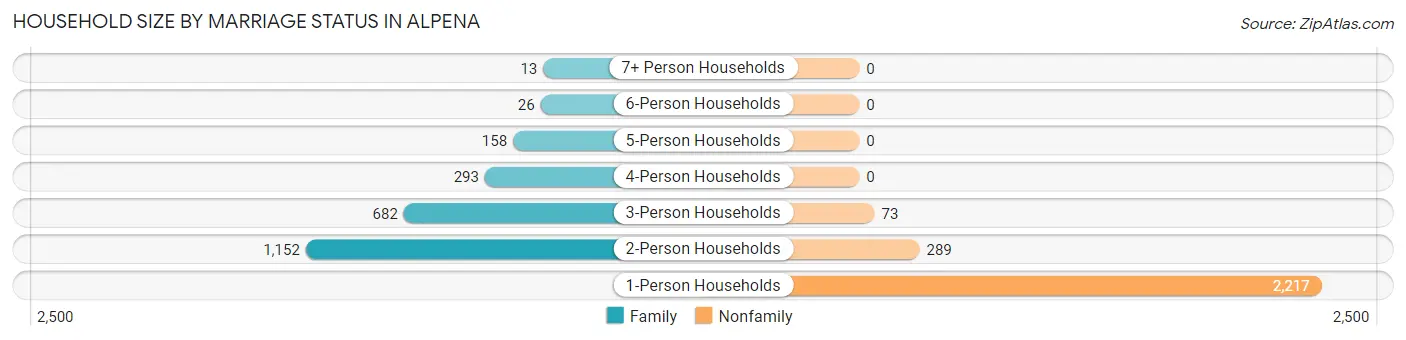
| Household Size | Family Households | Nonfamily Households |
| 1-Person Households | - | 2,217 (45.2%) |
| 2-Person Households | 1,152 (23.5%) | 289 (5.9%) |
| 3-Person Households | 682 (13.9%) | 73 (1.5%) |
| 4-Person Households | 293 (6.0%) | 0 (0.0%) |
| 5-Person Households | 158 (3.2%) | 0 (0.0%) |
| 6-Person Households | 26 (0.5%) | 0 (0.0%) |
| 7+ Person Households | 13 (0.3%) | 0 (0.0%) |
| Total | 2,324 (47.4%) | 2,579 (52.6%) |
Female Fertility in Alpena
Fertility by Age in Alpena
Average fertility rate in Alpena is 28.0 births per 1,000 women. Women in the age bracket of 15 to 19 years have the highest fertility rate with 95.0 births per 1,000 women. Women in the age bracket of 15 to 19 years acount for 44.8% of all women with births.
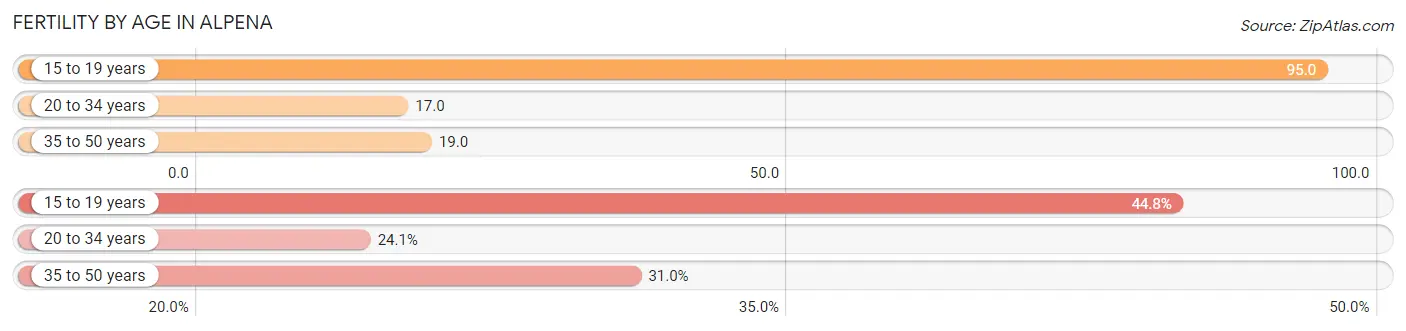
| Age Bracket | Women with Births | Births / 1,000 Women |
| 15 to 19 years | 26 (44.8%) | 95.0 |
| 20 to 34 years | 14 (24.1%) | 17.0 |
| 35 to 50 years | 18 (31.0%) | 19.0 |
| Total | 58 (100.0%) | 28.0 |
Fertility by Age by Marriage Status in Alpena
65.5% of women with births (58) in Alpena are married. The highest percentage of unmarried women with births falls into 20 to 34 years age bracket with 100.0% of them unmarried at the time of birth, while the lowest percentage of unmarried women with births belong to 15 to 19 years age bracket with 0.0% of them unmarried.
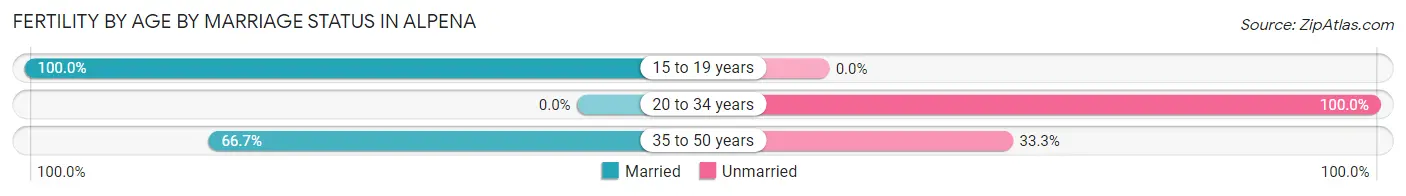
| Age Bracket | Married | Unmarried |
| 15 to 19 years | 26 (100.0%) | 0 (0.0%) |
| 20 to 34 years | 0 (0.0%) | 14 (100.0%) |
| 35 to 50 years | 12 (66.7%) | 6 (33.3%) |
| Total | 38 (65.5%) | 20 (34.5%) |
Fertility by Education in Alpena
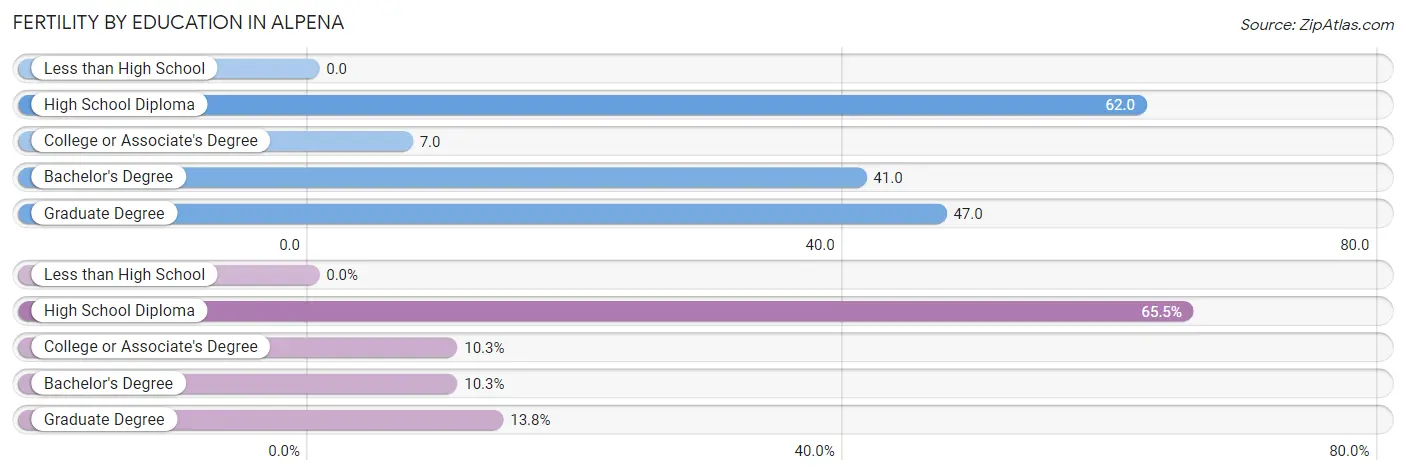
| Educational Attainment | Women with Births | Births / 1,000 Women |
| Less than High School | 0 (0.0%) | 0.0 |
| High School Diploma | 38 (65.5%) | 62.0 |
| College or Associate's Degree | 6 (10.3%) | 7.0 |
| Bachelor's Degree | 6 (10.3%) | 41.0 |
| Graduate Degree | 8 (13.8%) | 47.0 |
| Total | 58 (100.0%) | 28.0 |
Fertility by Education by Marriage Status in Alpena
34.5% of women with births in Alpena are unmarried. Women with the educational attainment of high school diploma are most likely to be married with 100.0% of them married at childbirth, while women with the educational attainment of college or associate's degree are least likely to be married with 100.0% of them unmarried at childbirth.
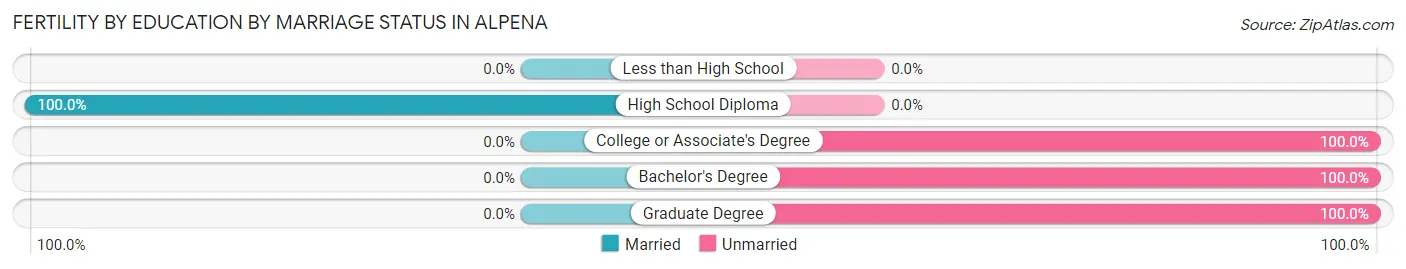
| Educational Attainment | Married | Unmarried |
| Less than High School | 0 (0.0%) | 0 (0.0%) |
| High School Diploma | 38 (100.0%) | 0 (0.0%) |
| College or Associate's Degree | 0 (0.0%) | 6 (100.0%) |
| Bachelor's Degree | 0 (0.0%) | 6 (100.0%) |
| Graduate Degree | 0 (0.0%) | 8 (100.0%) |
| Total | 38 (65.5%) | 20 (34.5%) |
Employment Characteristics in Alpena
Employment by Class of Employer in Alpena
Among the 4,345 employed individuals in Alpena, private company employees (3,235 | 74.5%), not-for-profit organizations (510 | 11.7%), and local government employees (189 | 4.3%) make up the most common classes of employment.
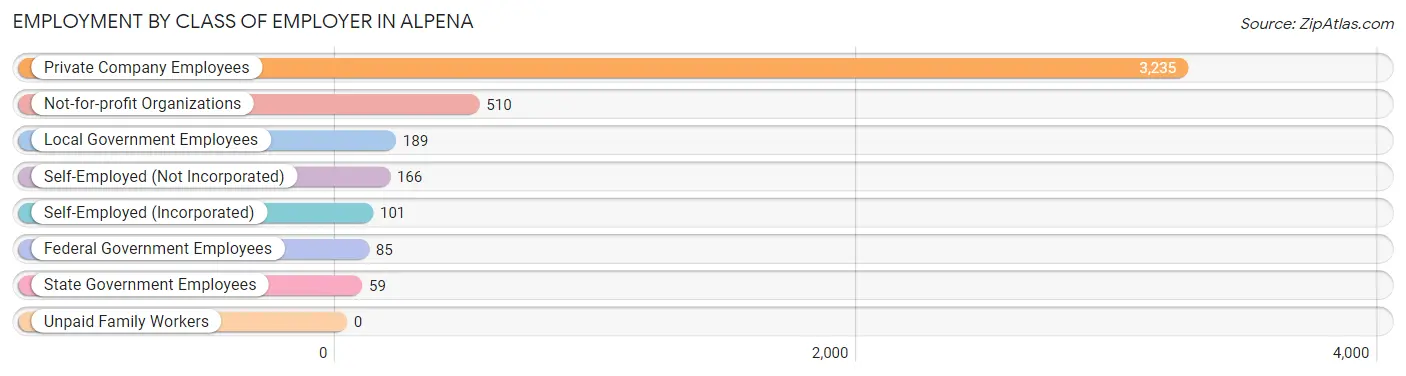
| Employer Class | # Employees | % Employees |
| Private Company Employees | 3,235 | 74.5% |
| Self-Employed (Incorporated) | 101 | 2.3% |
| Self-Employed (Not Incorporated) | 166 | 3.8% |
| Not-for-profit Organizations | 510 | 11.7% |
| Local Government Employees | 189 | 4.3% |
| State Government Employees | 59 | 1.4% |
| Federal Government Employees | 85 | 2.0% |
| Unpaid Family Workers | 0 | 0.0% |
| Total | 4,345 | 100.0% |
Employment Status by Age in Alpena
According to the labor force statistics for Alpena, out of the total population over 16 years of age (8,611), 56.6% or 4,874 individuals are in the labor force, with 8.9% or 434 of them unemployed. The age group with the highest labor force participation rate is 30 to 34 years, with 92.8% or 670 individuals in the labor force. Within the labor force, the 16 to 19 years age range has the highest percentage of unemployed individuals, with 21.5% or 51 of them being unemployed.
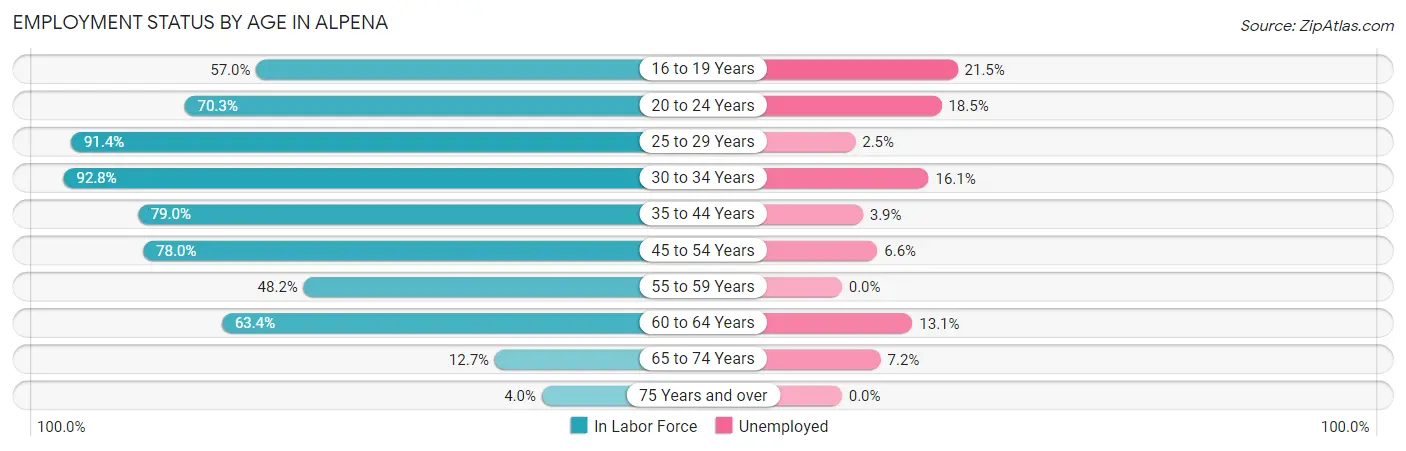
| Age Bracket | In Labor Force | Unemployed |
| 16 to 19 Years | 237 (57.0%) | 51 (21.5%) |
| 20 to 24 Years | 389 (70.3%) | 72 (18.5%) |
| 25 to 29 Years | 445 (91.4%) | 11 (2.5%) |
| 30 to 34 Years | 670 (92.8%) | 108 (16.1%) |
| 35 to 44 Years | 1,085 (79.0%) | 42 (3.9%) |
| 45 to 54 Years | 929 (78.0%) | 61 (6.6%) |
| 55 to 59 Years | 353 (48.2%) | 0 (0.0%) |
| 60 to 64 Years | 580 (63.4%) | 76 (13.1%) |
| 65 to 74 Years | 138 (12.7%) | 10 (7.2%) |
| 75 Years and over | 45 (4.0%) | 0 (0.0%) |
| Total | 4,874 (56.6%) | 434 (8.9%) |
Employment Status by Educational Attainment in Alpena
According to labor force statistics for Alpena, 74.9% of individuals (4,061) out of the total population between 25 and 64 years of age (5,422) are in the labor force, with 7.4% or 301 of them being unemployed. The group with the highest labor force participation rate are those with the educational attainment of bachelor's degree or higher, with 87.9% or 668 individuals in the labor force. Within the labor force, individuals with high school diploma education have the highest percentage of unemployment, with 12.2% or 146 of them being unemployed.
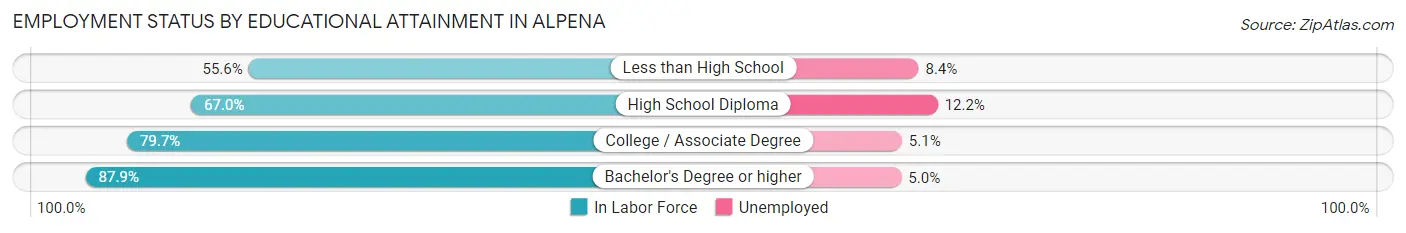
| Educational Attainment | In Labor Force | Unemployed |
| Less than High School | 215 (55.6%) | 33 (8.4%) |
| High School Diploma | 1,195 (67.0%) | 218 (12.2%) |
| College / Associate Degree | 1,985 (79.7%) | 127 (5.1%) |
| Bachelor's Degree or higher | 668 (87.9%) | 38 (5.0%) |
| Total | 4,061 (74.9%) | 401 (7.4%) |
Employment Occupations by Sex in Alpena
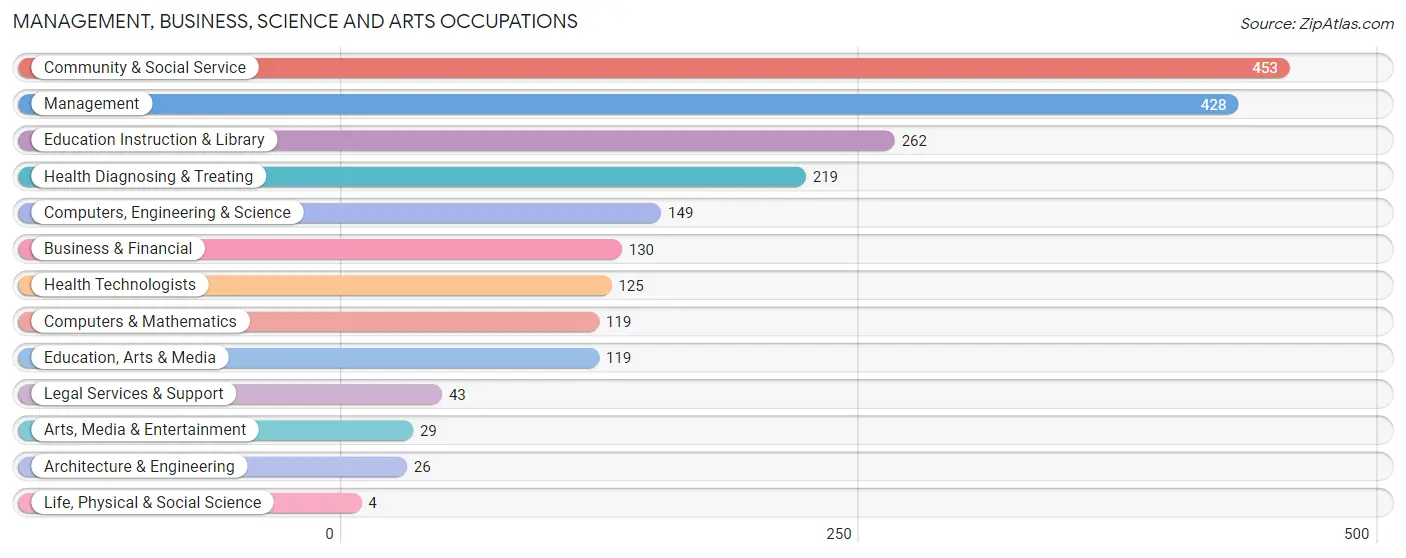
Management, Business, Science and Arts Occupations
The most common Management, Business, Science and Arts occupations in Alpena are Community & Social Service (453 | 10.3%), Management (428 | 9.7%), Education Instruction & Library (262 | 5.9%), Health Diagnosing & Treating (219 | 5.0%), and Computers, Engineering & Science (149 | 3.4%).
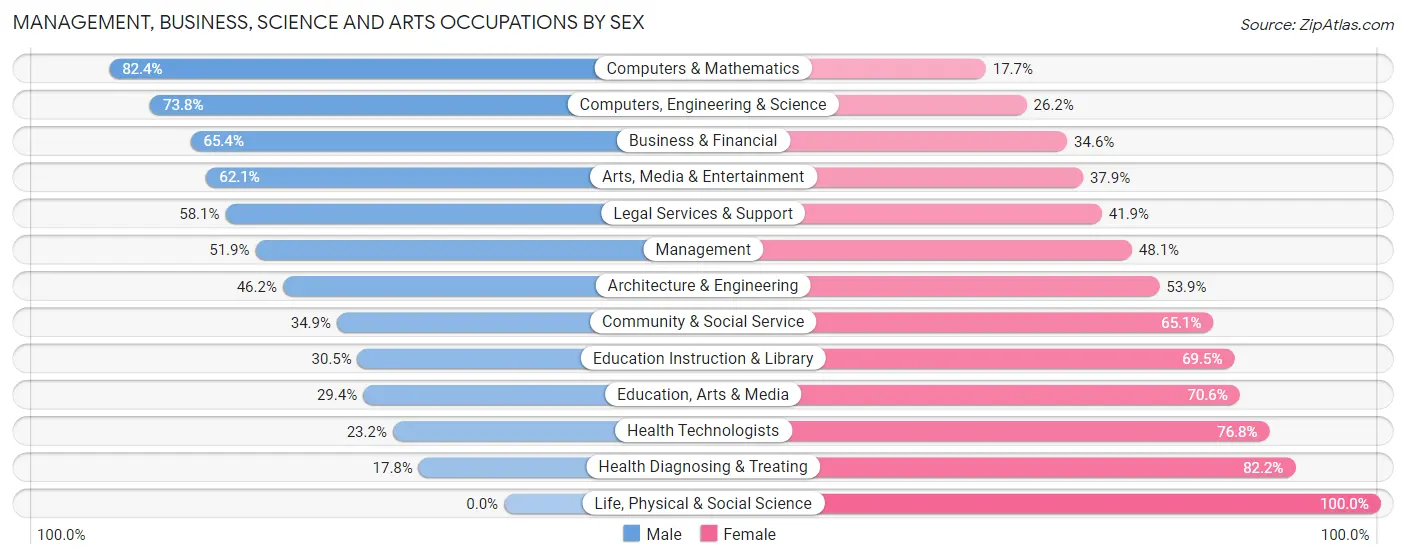
Management, Business, Science and Arts Occupations by Sex
Within the Management, Business, Science and Arts occupations in Alpena, the most male-oriented occupations are Computers & Mathematics (82.4%), Computers, Engineering & Science (73.8%), and Business & Financial (65.4%), while the most female-oriented occupations are Life, Physical & Social Science (100.0%), Health Diagnosing & Treating (82.2%), and Health Technologists (76.8%).
| Occupation | Male | Female |
| Management | 222 (51.9%) | 206 (48.1%) |
| Business & Financial | 85 (65.4%) | 45 (34.6%) |
| Computers, Engineering & Science | 110 (73.8%) | 39 (26.2%) |
| Computers & Mathematics | 98 (82.4%) | 21 (17.6%) |
| Architecture & Engineering | 12 (46.2%) | 14 (53.8%) |
| Life, Physical & Social Science | 0 (0.0%) | 4 (100.0%) |
| Community & Social Service | 158 (34.9%) | 295 (65.1%) |
| Education, Arts & Media | 35 (29.4%) | 84 (70.6%) |
| Legal Services & Support | 25 (58.1%) | 18 (41.9%) |
| Education Instruction & Library | 80 (30.5%) | 182 (69.5%) |
| Arts, Media & Entertainment | 18 (62.1%) | 11 (37.9%) |
| Health Diagnosing & Treating | 39 (17.8%) | 180 (82.2%) |
| Health Technologists | 29 (23.2%) | 96 (76.8%) |
| Total (Category) | 614 (44.5%) | 765 (55.5%) |
| Total (Overall) | 2,158 (48.9%) | 2,257 (51.1%) |
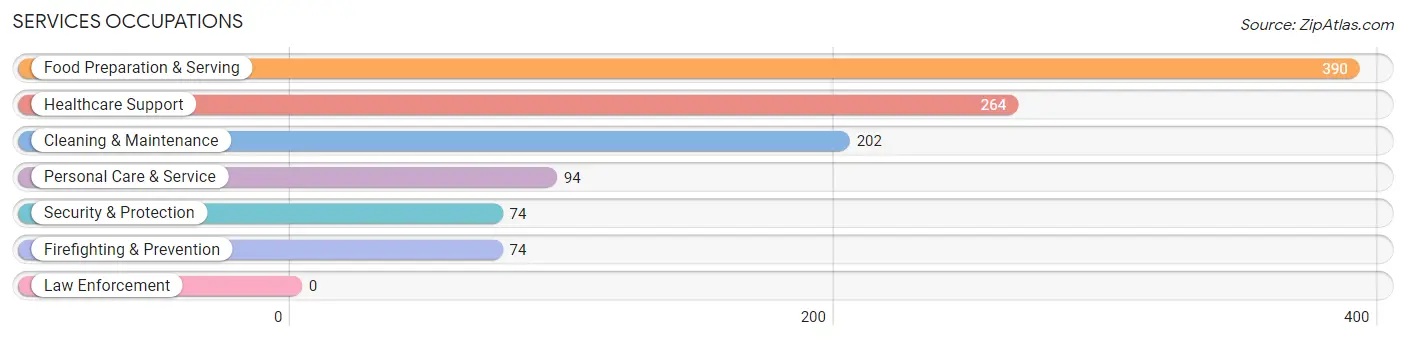
Services Occupations
The most common Services occupations in Alpena are Food Preparation & Serving (390 | 8.8%), Healthcare Support (264 | 6.0%), Cleaning & Maintenance (202 | 4.6%), Personal Care & Service (94 | 2.1%), and Security & Protection (74 | 1.7%).
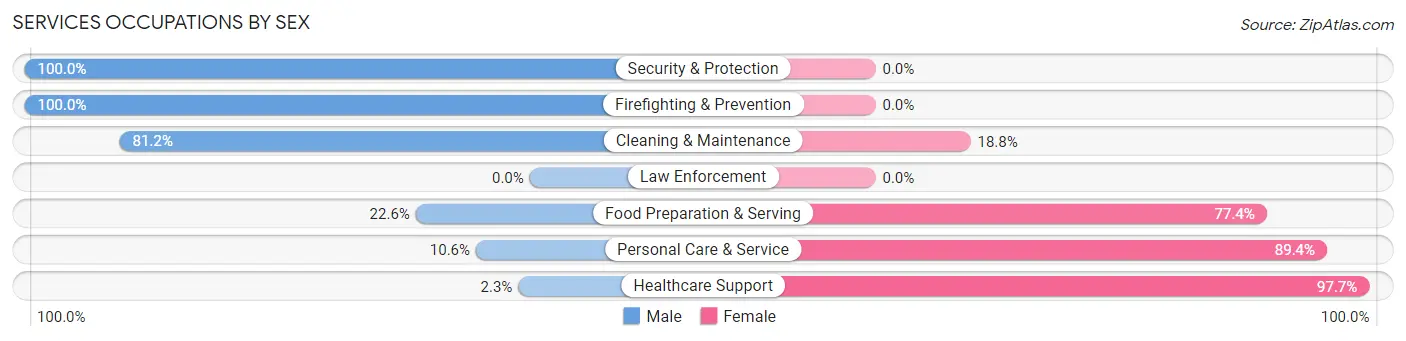
Services Occupations by Sex
Within the Services occupations in Alpena, the most male-oriented occupations are Security & Protection (100.0%), Firefighting & Prevention (100.0%), and Cleaning & Maintenance (81.2%), while the most female-oriented occupations are Healthcare Support (97.7%), Personal Care & Service (89.4%), and Food Preparation & Serving (77.4%).
| Occupation | Male | Female |
| Healthcare Support | 6 (2.3%) | 258 (97.7%) |
| Security & Protection | 74 (100.0%) | 0 (0.0%) |
| Firefighting & Prevention | 74 (100.0%) | 0 (0.0%) |
| Law Enforcement | 0 (0.0%) | 0 (0.0%) |
| Food Preparation & Serving | 88 (22.6%) | 302 (77.4%) |
| Cleaning & Maintenance | 164 (81.2%) | 38 (18.8%) |
| Personal Care & Service | 10 (10.6%) | 84 (89.4%) |
| Total (Category) | 342 (33.4%) | 682 (66.6%) |
| Total (Overall) | 2,158 (48.9%) | 2,257 (51.1%) |
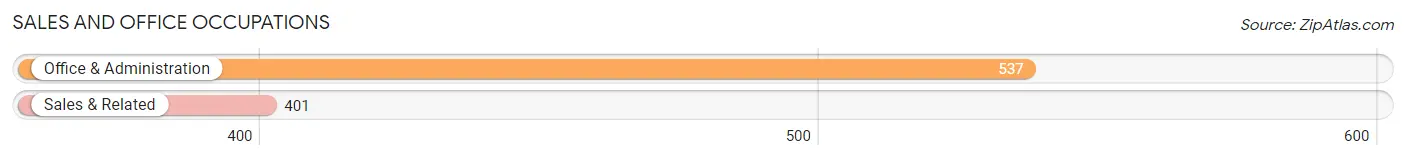
Sales and Office Occupations
The most common Sales and Office occupations in Alpena are Office & Administration (537 | 12.2%), and Sales & Related (401 | 9.1%).
Sales and Office Occupations by Sex
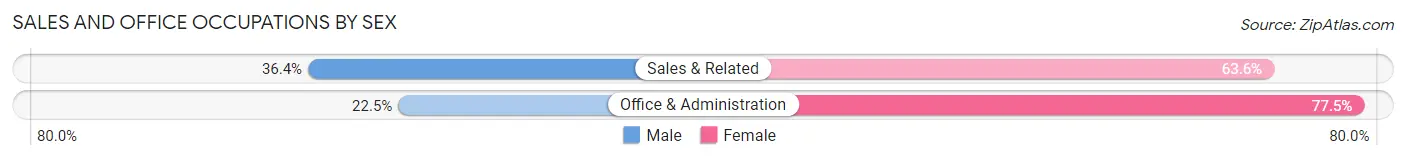
| Occupation | Male | Female |
| Sales & Related | 146 (36.4%) | 255 (63.6%) |
| Office & Administration | 121 (22.5%) | 416 (77.5%) |
| Total (Category) | 267 (28.5%) | 671 (71.5%) |
| Total (Overall) | 2,158 (48.9%) | 2,257 (51.1%) |
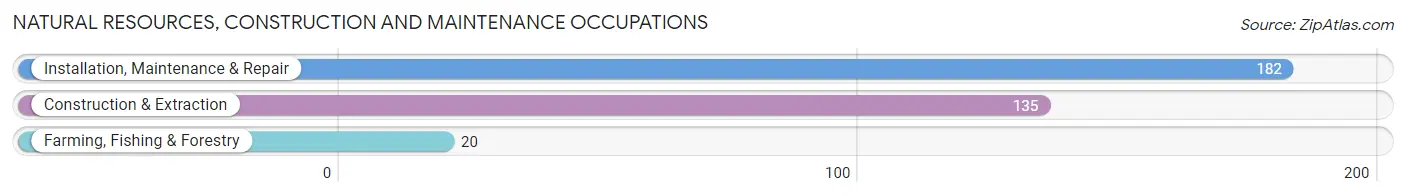
Natural Resources, Construction and Maintenance Occupations
The most common Natural Resources, Construction and Maintenance occupations in Alpena are Installation, Maintenance & Repair (182 | 4.1%), Construction & Extraction (135 | 3.1%), and Farming, Fishing & Forestry (20 | 0.4%).
Natural Resources, Construction and Maintenance Occupations by Sex
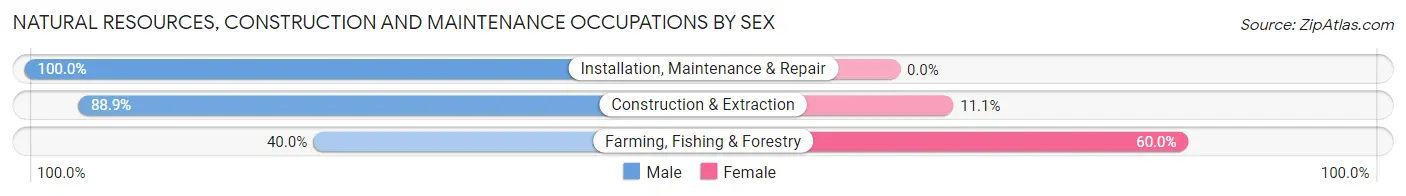
| Occupation | Male | Female |
| Farming, Fishing & Forestry | 8 (40.0%) | 12 (60.0%) |
| Construction & Extraction | 120 (88.9%) | 15 (11.1%) |
| Installation, Maintenance & Repair | 182 (100.0%) | 0 (0.0%) |
| Total (Category) | 310 (92.0%) | 27 (8.0%) |
| Total (Overall) | 2,158 (48.9%) | 2,257 (51.1%) |
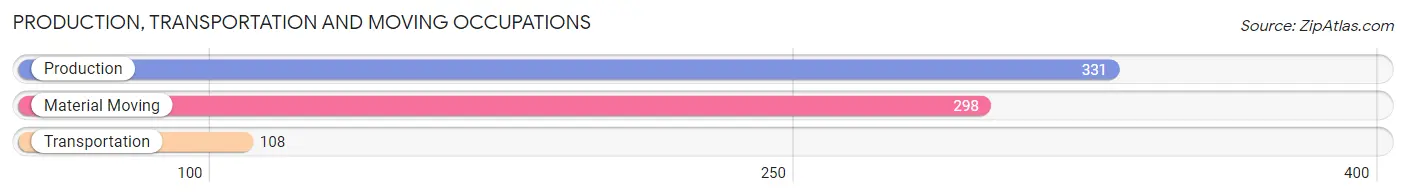
Production, Transportation and Moving Occupations
The most common Production, Transportation and Moving occupations in Alpena are Production (331 | 7.5%), Material Moving (298 | 6.8%), and Transportation (108 | 2.5%).
Production, Transportation and Moving Occupations by Sex
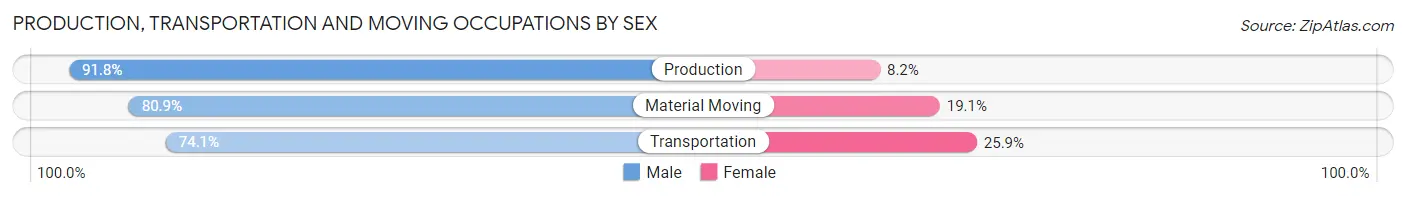
| Occupation | Male | Female |
| Production | 304 (91.8%) | 27 (8.2%) |
| Transportation | 80 (74.1%) | 28 (25.9%) |
| Material Moving | 241 (80.9%) | 57 (19.1%) |
| Total (Category) | 625 (84.8%) | 112 (15.2%) |
| Total (Overall) | 2,158 (48.9%) | 2,257 (51.1%) |
Employment Industries by Sex in Alpena
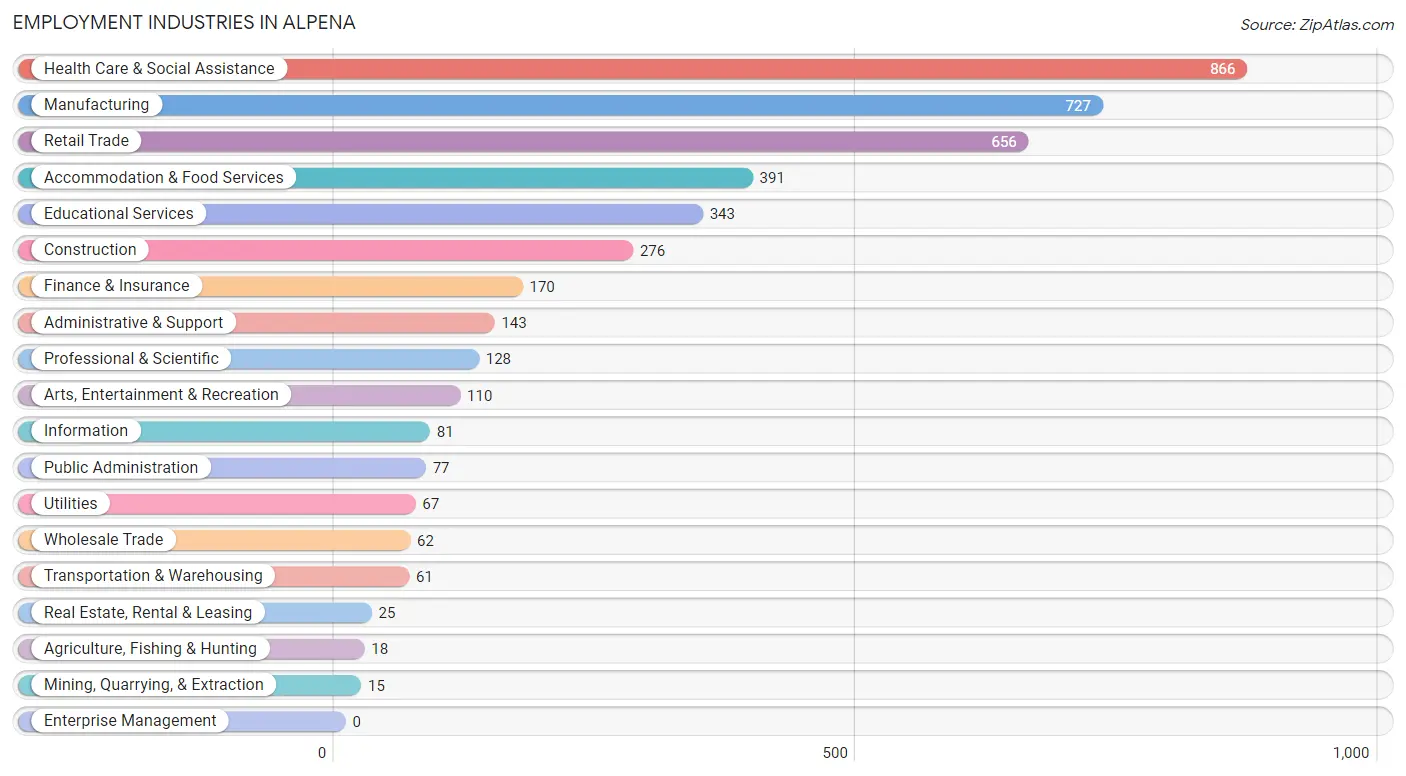
Employment Industries in Alpena
The major employment industries in Alpena include Health Care & Social Assistance (866 | 19.6%), Manufacturing (727 | 16.5%), Retail Trade (656 | 14.9%), Accommodation & Food Services (391 | 8.9%), and Educational Services (343 | 7.8%).
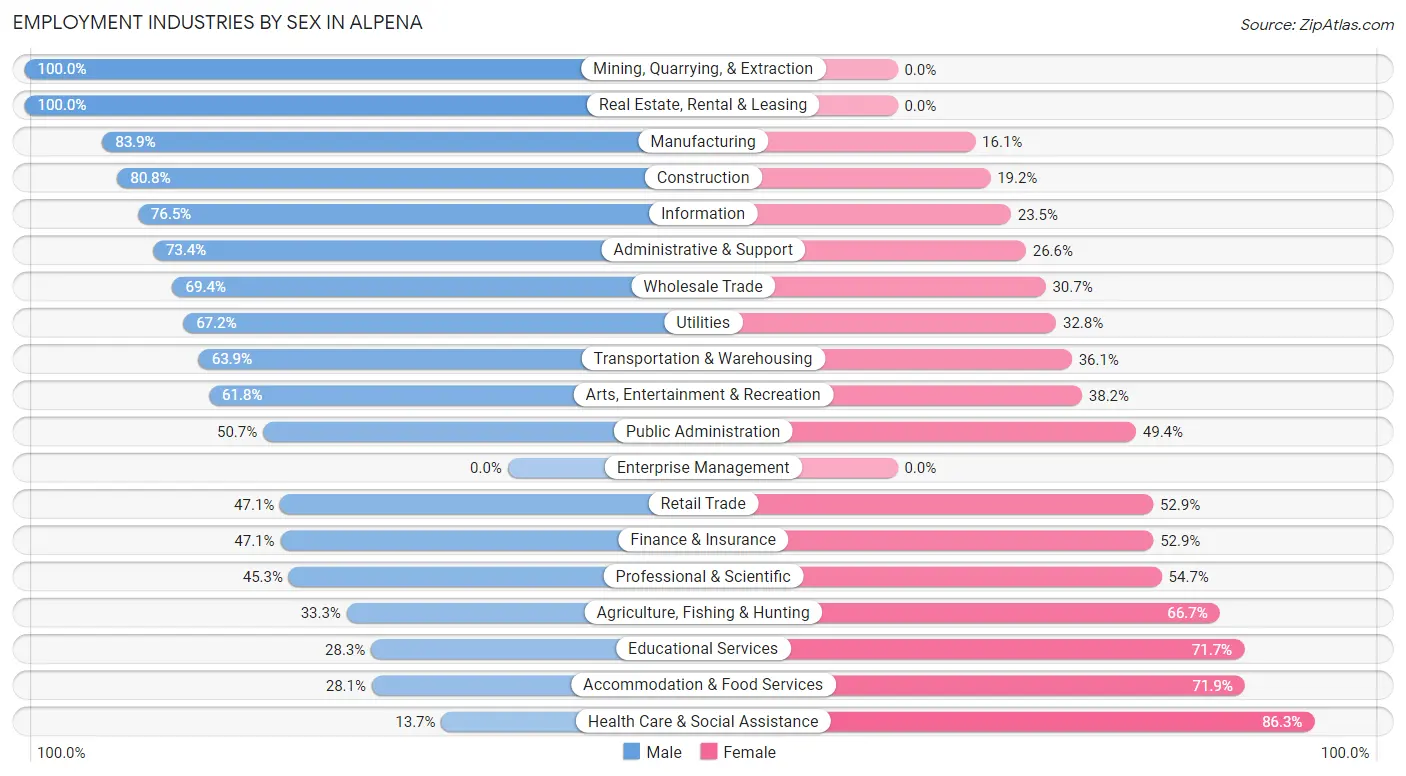
Employment Industries by Sex in Alpena
The Alpena industries that see more men than women are Mining, Quarrying, & Extraction (100.0%), Real Estate, Rental & Leasing (100.0%), and Manufacturing (83.9%), whereas the industries that tend to have a higher number of women are Health Care & Social Assistance (86.3%), Accommodation & Food Services (71.9%), and Educational Services (71.7%).
| Industry | Male | Female |
| Agriculture, Fishing & Hunting | 6 (33.3%) | 12 (66.7%) |
| Mining, Quarrying, & Extraction | 15 (100.0%) | 0 (0.0%) |
| Construction | 223 (80.8%) | 53 (19.2%) |
| Manufacturing | 610 (83.9%) | 117 (16.1%) |
| Wholesale Trade | 43 (69.4%) | 19 (30.6%) |
| Retail Trade | 309 (47.1%) | 347 (52.9%) |
| Transportation & Warehousing | 39 (63.9%) | 22 (36.1%) |
| Utilities | 45 (67.2%) | 22 (32.8%) |
| Information | 62 (76.5%) | 19 (23.5%) |
| Finance & Insurance | 80 (47.1%) | 90 (52.9%) |
| Real Estate, Rental & Leasing | 25 (100.0%) | 0 (0.0%) |
| Professional & Scientific | 58 (45.3%) | 70 (54.7%) |
| Enterprise Management | 0 (0.0%) | 0 (0.0%) |
| Administrative & Support | 105 (73.4%) | 38 (26.6%) |
| Educational Services | 97 (28.3%) | 246 (71.7%) |
| Health Care & Social Assistance | 119 (13.7%) | 747 (86.3%) |
| Arts, Entertainment & Recreation | 68 (61.8%) | 42 (38.2%) |
| Accommodation & Food Services | 110 (28.1%) | 281 (71.9%) |
| Public Administration | 39 (50.6%) | 38 (49.3%) |
| Total | 2,158 (48.9%) | 2,257 (51.1%) |
Education in Alpena
School Enrollment in Alpena
The most common levels of schooling among the 1,712 students in Alpena are high school (539 | 31.5%), middle school (394 | 23.0%), and elementary school (353 | 20.6%).
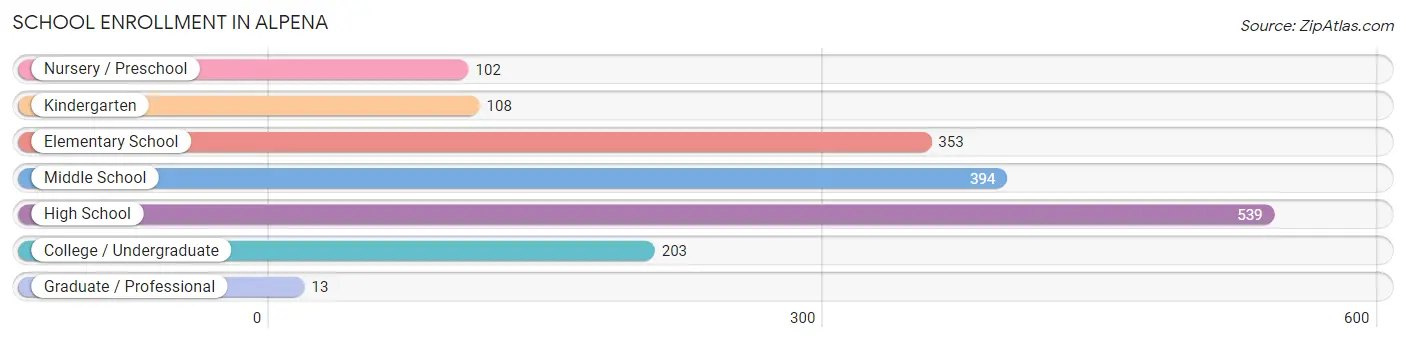
| School Level | # Students | % Students |
| Nursery / Preschool | 102 | 6.0% |
| Kindergarten | 108 | 6.3% |
| Elementary School | 353 | 20.6% |
| Middle School | 394 | 23.0% |
| High School | 539 | 31.5% |
| College / Undergraduate | 203 | 11.9% |
| Graduate / Professional | 13 | 0.8% |
| Total | 1,712 | 100.0% |
School Enrollment by Age by Funding Source in Alpena
Out of a total of 1,712 students who are enrolled in schools in Alpena, 164 (9.6%) attend a private institution, while the remaining 1,548 (90.4%) are enrolled in public schools. The age group of 20 to 24 year olds has the highest likelihood of being enrolled in private schools, with 26 (35.1% in the age bracket) enrolled. Conversely, the age group of 10 to 14 year olds has the lowest likelihood of being enrolled in a private school, with 517 (100.0% in the age bracket) attending a public institution.
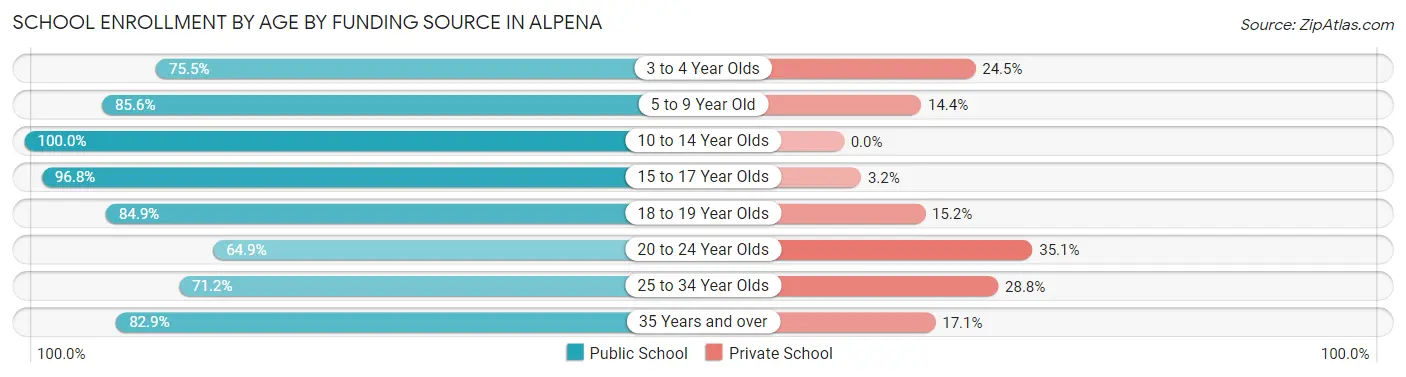
| Age Bracket | Public School | Private School |
| 3 to 4 Year Olds | 77 (75.5%) | 25 (24.5%) |
| 5 to 9 Year Old | 374 (85.6%) | 63 (14.4%) |
| 10 to 14 Year Olds | 517 (100.0%) | 0 (0.0%) |
| 15 to 17 Year Olds | 389 (96.8%) | 13 (3.2%) |
| 18 to 19 Year Olds | 56 (84.9%) | 10 (15.1%) |
| 20 to 24 Year Olds | 48 (64.9%) | 26 (35.1%) |
| 25 to 34 Year Olds | 52 (71.2%) | 21 (28.8%) |
| 35 Years and over | 34 (82.9%) | 7 (17.1%) |
| Total | 1,548 (90.4%) | 164 (9.6%) |
Educational Attainment by Field of Study in Alpena
Business (259 | 23.4%), education (164 | 14.8%), arts & humanities (116 | 10.5%), science & technology (95 | 8.6%), and literature & languages (90 | 8.1%) are the most common fields of study among 1,109 individuals in Alpena who have obtained a bachelor's degree or higher.
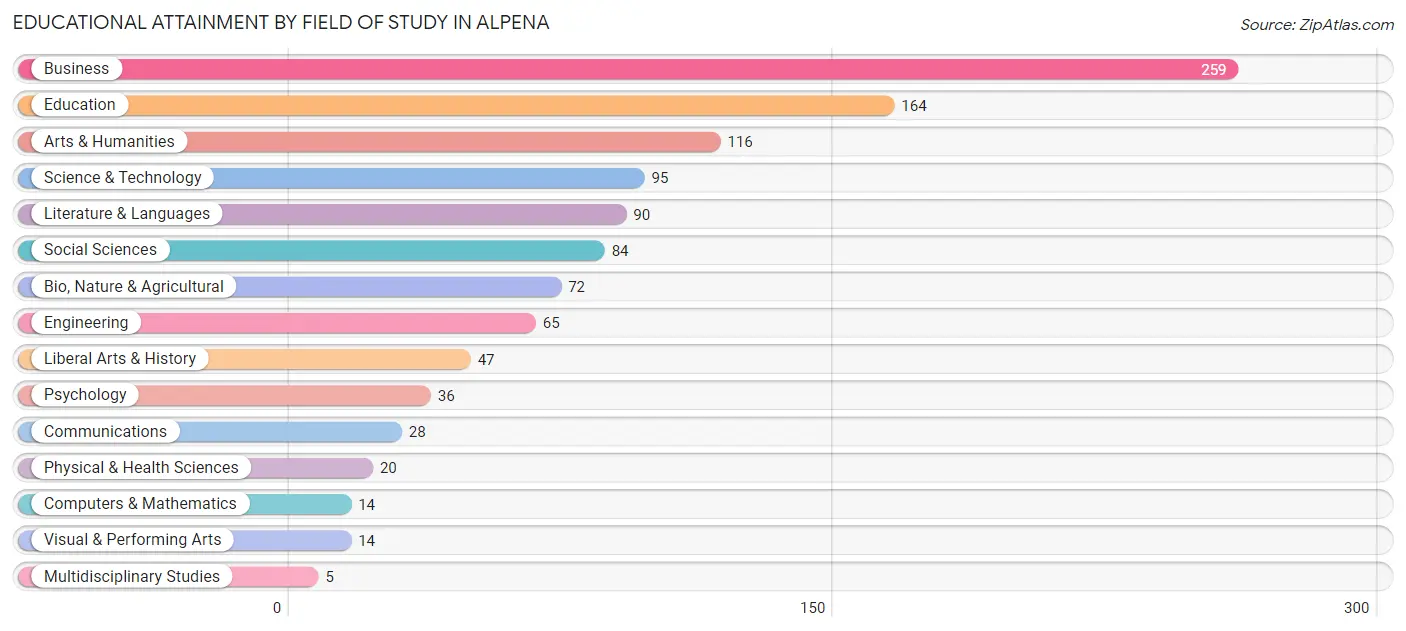
| Field of Study | # Graduates | % Graduates |
| Computers & Mathematics | 14 | 1.3% |
| Bio, Nature & Agricultural | 72 | 6.5% |
| Physical & Health Sciences | 20 | 1.8% |
| Psychology | 36 | 3.3% |
| Social Sciences | 84 | 7.6% |
| Engineering | 65 | 5.9% |
| Multidisciplinary Studies | 5 | 0.4% |
| Science & Technology | 95 | 8.6% |
| Business | 259 | 23.4% |
| Education | 164 | 14.8% |
| Literature & Languages | 90 | 8.1% |
| Liberal Arts & History | 47 | 4.2% |
| Visual & Performing Arts | 14 | 1.3% |
| Communications | 28 | 2.5% |
| Arts & Humanities | 116 | 10.5% |
| Total | 1,109 | 100.0% |
Transportation & Commute in Alpena
Vehicle Availability by Sex in Alpena
The most prevalent vehicle ownership categories in Alpena are males with 2 vehicles (974, accounting for 46.1%) and females with 2 vehicles (995, making up 45.7%).
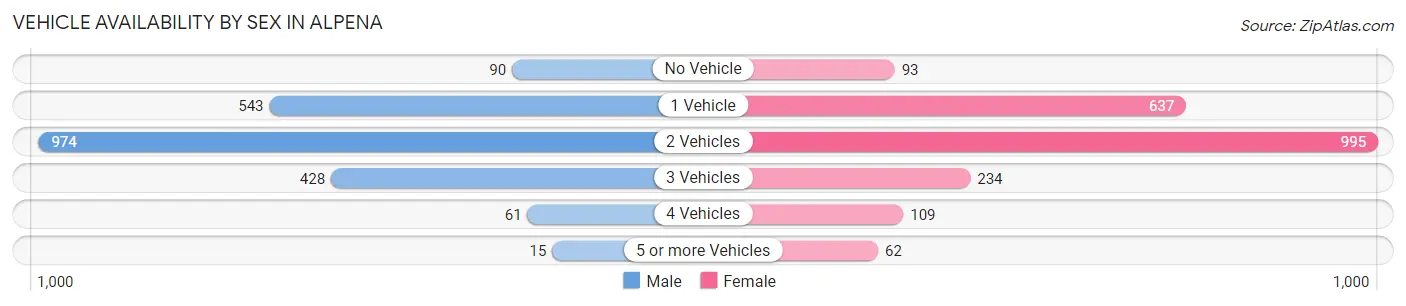
| Vehicles Available | Male | Female |
| No Vehicle | 90 (4.3%) | 93 (4.4%) |
| 1 Vehicle | 543 (25.7%) | 637 (29.9%) |
| 2 Vehicles | 974 (46.1%) | 995 (46.7%) |
| 3 Vehicles | 428 (20.3%) | 234 (11.0%) |
| 4 Vehicles | 61 (2.9%) | 109 (5.1%) |
| 5 or more Vehicles | 15 (0.7%) | 62 (2.9%) |
| Total | 2,111 (100.0%) | 2,130 (100.0%) |
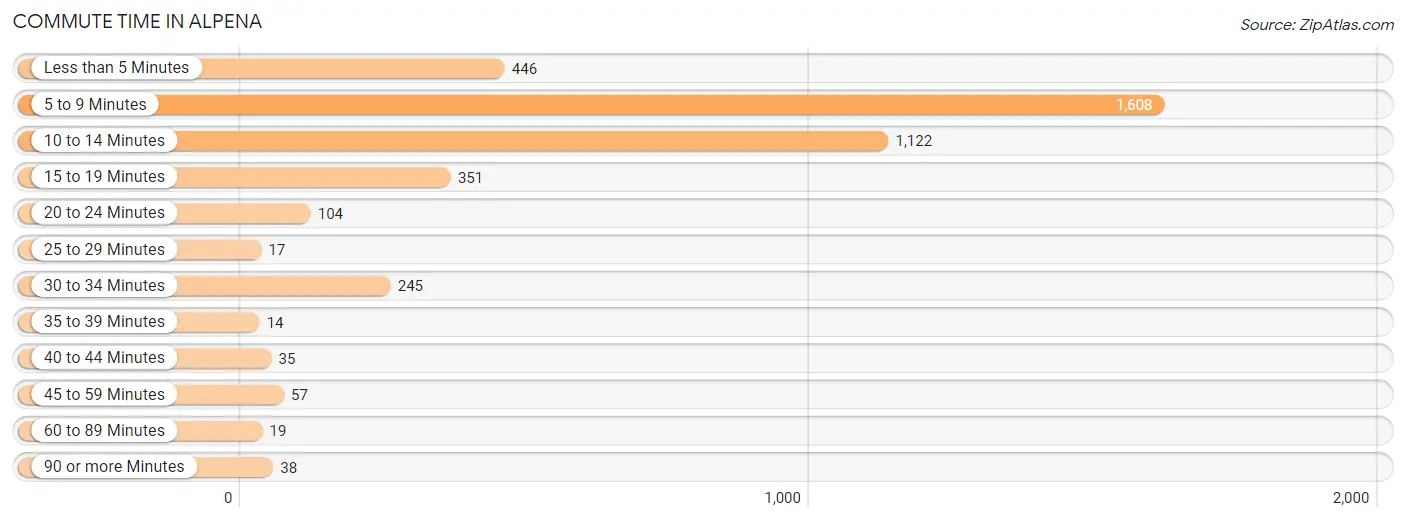
Commute Time in Alpena
The most frequently occuring commute durations in Alpena are 5 to 9 minutes (1,608 commuters, 39.6%), 10 to 14 minutes (1,122 commuters, 27.7%), and less than 5 minutes (446 commuters, 11.0%).
| Commute Time | # Commuters | % Commuters |
| Less than 5 Minutes | 446 | 11.0% |
| 5 to 9 Minutes | 1,608 | 39.6% |
| 10 to 14 Minutes | 1,122 | 27.7% |
| 15 to 19 Minutes | 351 | 8.6% |
| 20 to 24 Minutes | 104 | 2.6% |
| 25 to 29 Minutes | 17 | 0.4% |
| 30 to 34 Minutes | 245 | 6.0% |
| 35 to 39 Minutes | 14 | 0.4% |
| 40 to 44 Minutes | 35 | 0.9% |
| 45 to 59 Minutes | 57 | 1.4% |
| 60 to 89 Minutes | 19 | 0.5% |
| 90 or more Minutes | 38 | 0.9% |
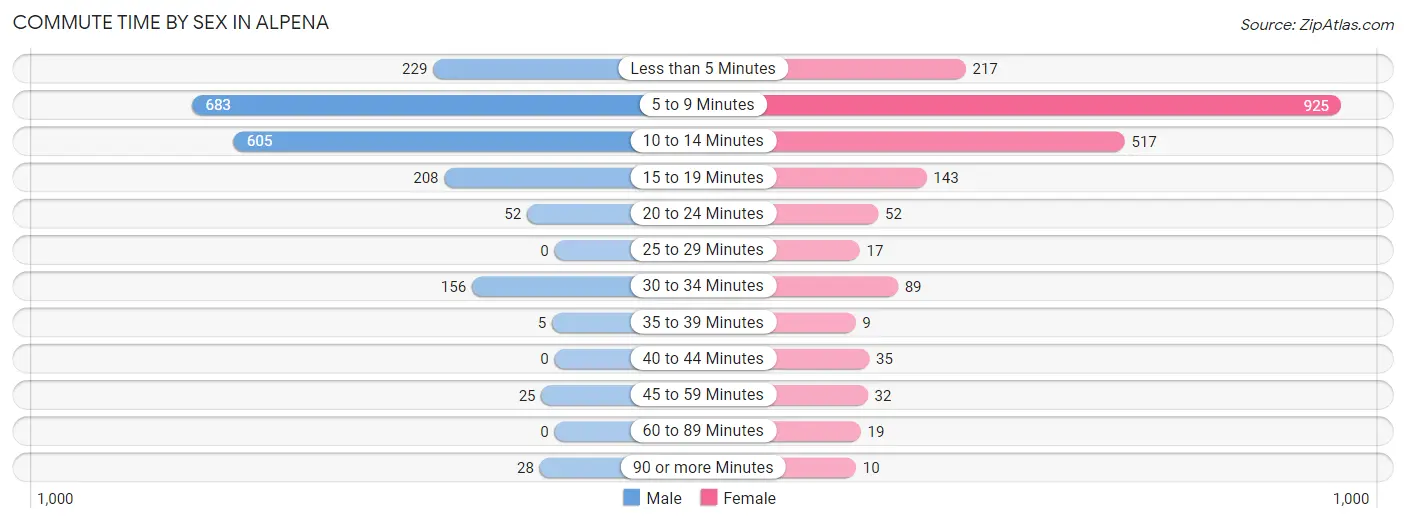
Commute Time by Sex in Alpena
The most common commute times in Alpena are 5 to 9 minutes (683 commuters, 34.3%) for males and 5 to 9 minutes (925 commuters, 44.8%) for females.
| Commute Time | Male | Female |
| Less than 5 Minutes | 229 (11.5%) | 217 (10.5%) |
| 5 to 9 Minutes | 683 (34.3%) | 925 (44.8%) |
| 10 to 14 Minutes | 605 (30.4%) | 517 (25.0%) |
| 15 to 19 Minutes | 208 (10.4%) | 143 (6.9%) |
| 20 to 24 Minutes | 52 (2.6%) | 52 (2.5%) |
| 25 to 29 Minutes | 0 (0.0%) | 17 (0.8%) |
| 30 to 34 Minutes | 156 (7.8%) | 89 (4.3%) |
| 35 to 39 Minutes | 5 (0.3%) | 9 (0.4%) |
| 40 to 44 Minutes | 0 (0.0%) | 35 (1.7%) |
| 45 to 59 Minutes | 25 (1.3%) | 32 (1.5%) |
| 60 to 89 Minutes | 0 (0.0%) | 19 (0.9%) |
| 90 or more Minutes | 28 (1.4%) | 10 (0.5%) |
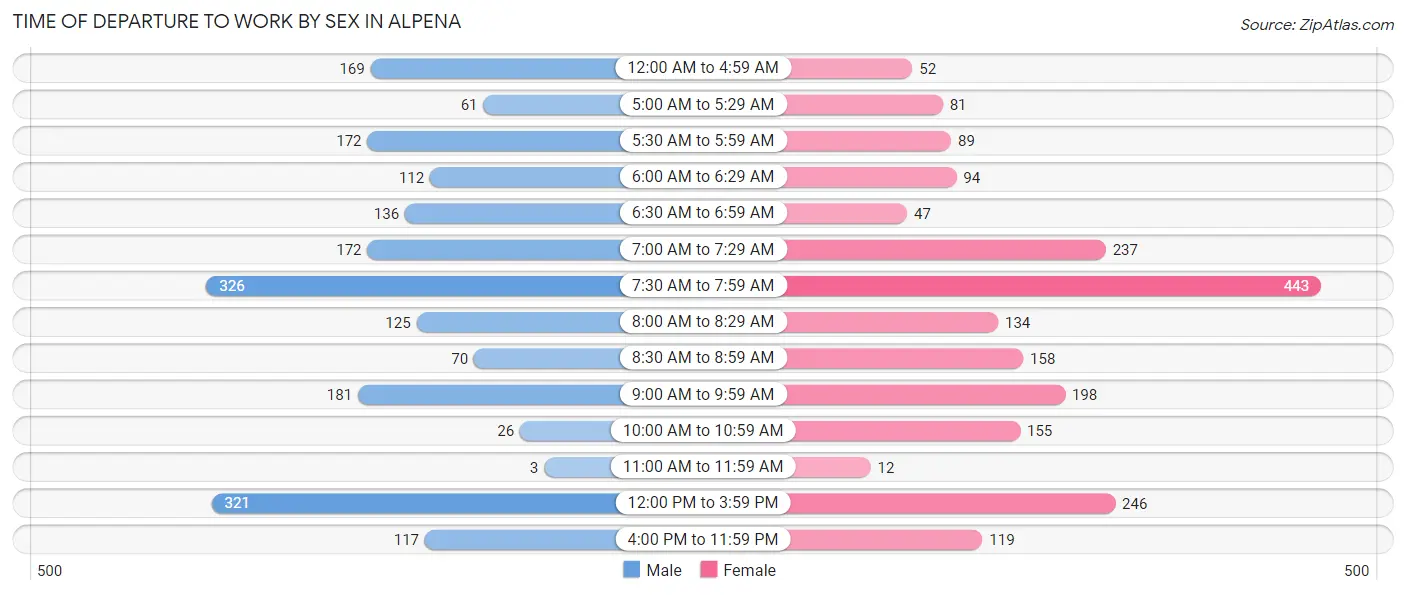
Time of Departure to Work by Sex in Alpena
The most frequent times of departure to work in Alpena are 7:30 AM to 7:59 AM (326, 16.4%) for males and 7:30 AM to 7:59 AM (443, 21.4%) for females.
| Time of Departure | Male | Female |
| 12:00 AM to 4:59 AM | 169 (8.5%) | 52 (2.5%) |
| 5:00 AM to 5:29 AM | 61 (3.1%) | 81 (3.9%) |
| 5:30 AM to 5:59 AM | 172 (8.6%) | 89 (4.3%) |
| 6:00 AM to 6:29 AM | 112 (5.6%) | 94 (4.5%) |
| 6:30 AM to 6:59 AM | 136 (6.8%) | 47 (2.3%) |
| 7:00 AM to 7:29 AM | 172 (8.6%) | 237 (11.5%) |
| 7:30 AM to 7:59 AM | 326 (16.4%) | 443 (21.4%) |
| 8:00 AM to 8:29 AM | 125 (6.3%) | 134 (6.5%) |
| 8:30 AM to 8:59 AM | 70 (3.5%) | 158 (7.6%) |
| 9:00 AM to 9:59 AM | 181 (9.1%) | 198 (9.6%) |
| 10:00 AM to 10:59 AM | 26 (1.3%) | 155 (7.5%) |
| 11:00 AM to 11:59 AM | 3 (0.2%) | 12 (0.6%) |
| 12:00 PM to 3:59 PM | 321 (16.1%) | 246 (11.9%) |
| 4:00 PM to 11:59 PM | 117 (5.9%) | 119 (5.8%) |
| Total | 1,991 (100.0%) | 2,065 (100.0%) |
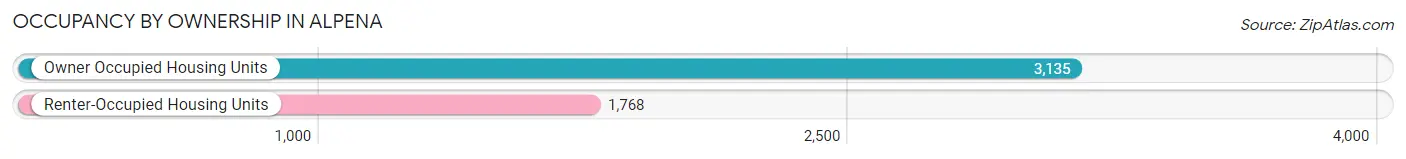
Housing Occupancy in Alpena
Occupancy by Ownership in Alpena
Of the total 4,903 dwellings in Alpena, owner-occupied units account for 3,135 (63.9%), while renter-occupied units make up 1,768 (36.1%).
| Occupancy | # Housing Units | % Housing Units |
| Owner Occupied Housing Units | 3,135 | 63.9% |
| Renter-Occupied Housing Units | 1,768 | 36.1% |
| Total Occupied Housing Units | 4,903 | 100.0% |
Occupancy by Household Size in Alpena
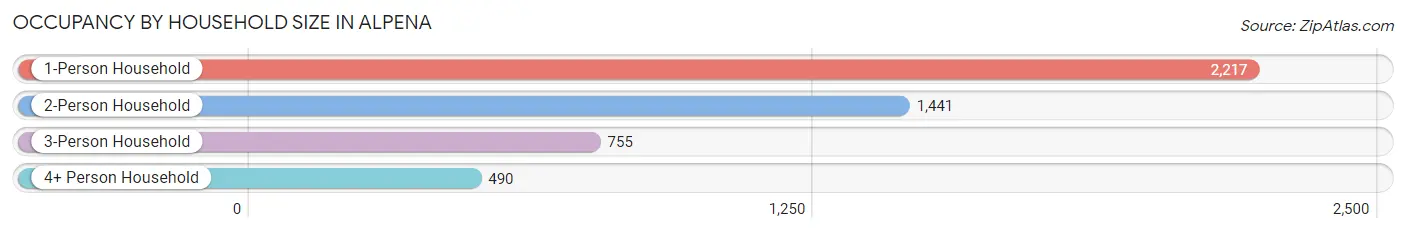
| Household Size | # Housing Units | % Housing Units |
| 1-Person Household | 2,217 | 45.2% |
| 2-Person Household | 1,441 | 29.4% |
| 3-Person Household | 755 | 15.4% |
| 4+ Person Household | 490 | 10.0% |
| Total Housing Units | 4,903 | 100.0% |
Occupancy by Ownership by Household Size in Alpena
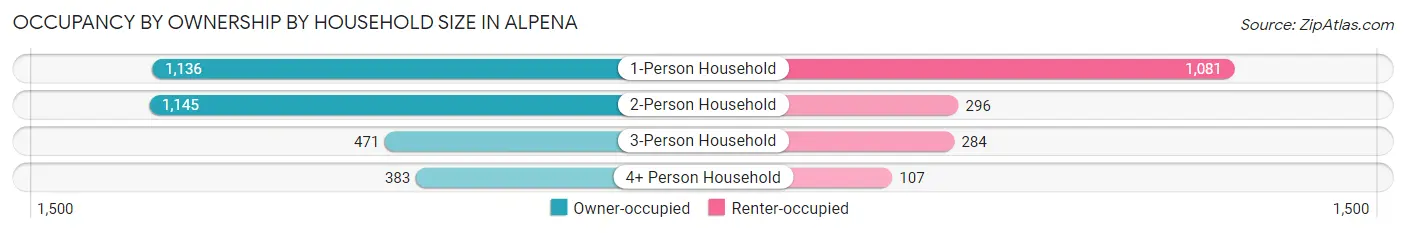
| Household Size | Owner-occupied | Renter-occupied |
| 1-Person Household | 1,136 (51.2%) | 1,081 (48.8%) |
| 2-Person Household | 1,145 (79.5%) | 296 (20.5%) |
| 3-Person Household | 471 (62.4%) | 284 (37.6%) |
| 4+ Person Household | 383 (78.2%) | 107 (21.8%) |
| Total Housing Units | 3,135 (63.9%) | 1,768 (36.1%) |
Occupancy by Educational Attainment in Alpena
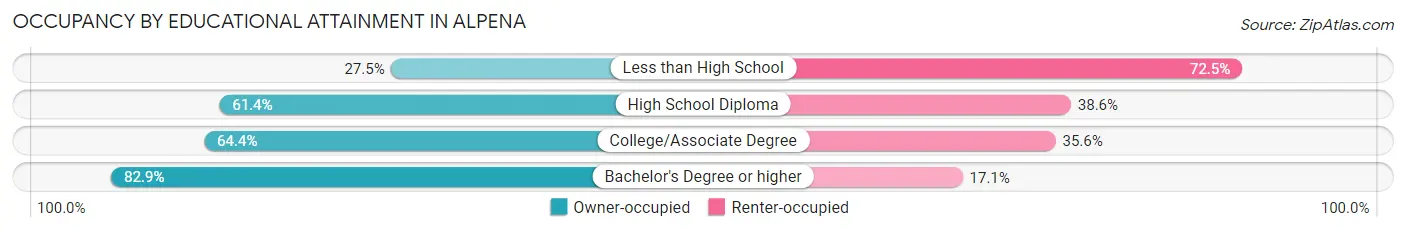
| Household Size | Owner-occupied | Renter-occupied |
| Less than High School | 95 (27.5%) | 251 (72.5%) |
| High School Diploma | 921 (61.4%) | 579 (38.6%) |
| College/Associate Degree | 1,447 (64.4%) | 799 (35.6%) |
| Bachelor's Degree or higher | 672 (82.9%) | 139 (17.1%) |
Occupancy by Age of Householder in Alpena
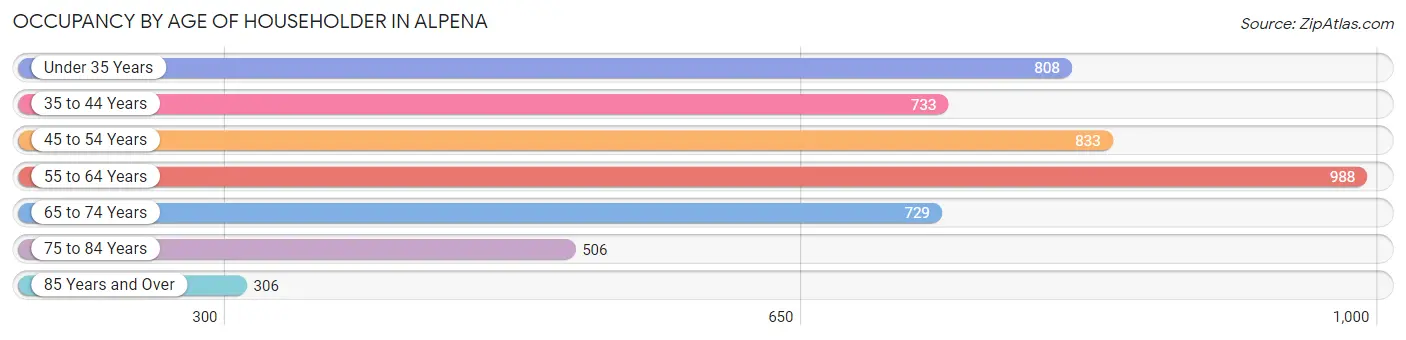
| Age Bracket | # Households | % Households |
| Under 35 Years | 808 | 16.5% |
| 35 to 44 Years | 733 | 14.9% |
| 45 to 54 Years | 833 | 17.0% |
| 55 to 64 Years | 988 | 20.2% |
| 65 to 74 Years | 729 | 14.9% |
| 75 to 84 Years | 506 | 10.3% |
| 85 Years and Over | 306 | 6.2% |
| Total | 4,903 | 100.0% |
Housing Finances in Alpena
Median Income by Occupancy in Alpena
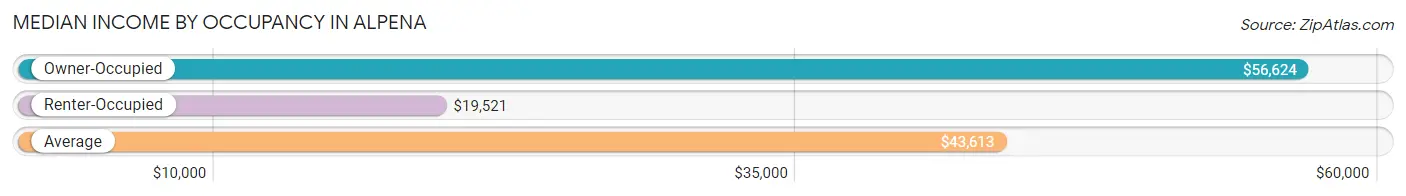
| Occupancy Type | # Households | Median Income |
| Owner-Occupied | 3,135 (63.9%) | $56,624 |
| Renter-Occupied | 1,768 (36.1%) | $19,521 |
| Average | 4,903 (100.0%) | $43,613 |
Occupancy by Householder Income Bracket in Alpena
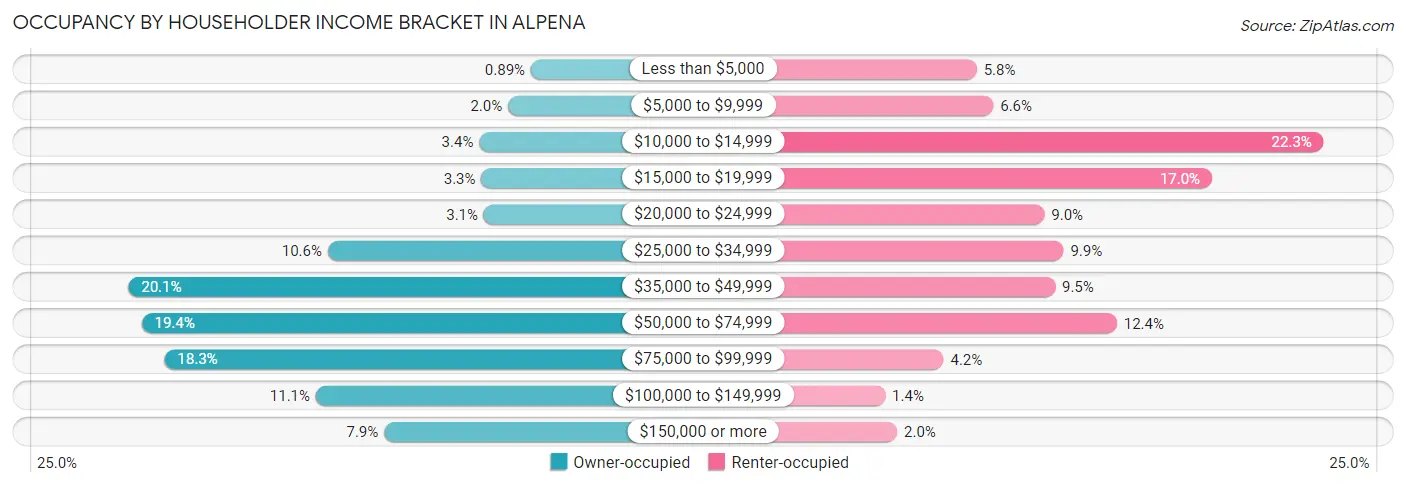
| Income Bracket | Owner-occupied | Renter-occupied |
| Less than $5,000 | 28 (0.9%) | 102 (5.8%) |
| $5,000 to $9,999 | 62 (2.0%) | 116 (6.6%) |
| $10,000 to $14,999 | 105 (3.4%) | 394 (22.3%) |
| $15,000 to $19,999 | 102 (3.3%) | 300 (17.0%) |
| $20,000 to $24,999 | 98 (3.1%) | 159 (9.0%) |
| $25,000 to $34,999 | 331 (10.6%) | 175 (9.9%) |
| $35,000 to $49,999 | 629 (20.1%) | 168 (9.5%) |
| $50,000 to $74,999 | 609 (19.4%) | 220 (12.4%) |
| $75,000 to $99,999 | 575 (18.3%) | 74 (4.2%) |
| $100,000 to $149,999 | 349 (11.1%) | 25 (1.4%) |
| $150,000 or more | 247 (7.9%) | 35 (2.0%) |
| Total | 3,135 (100.0%) | 1,768 (100.0%) |
Monthly Housing Cost Tiers in Alpena
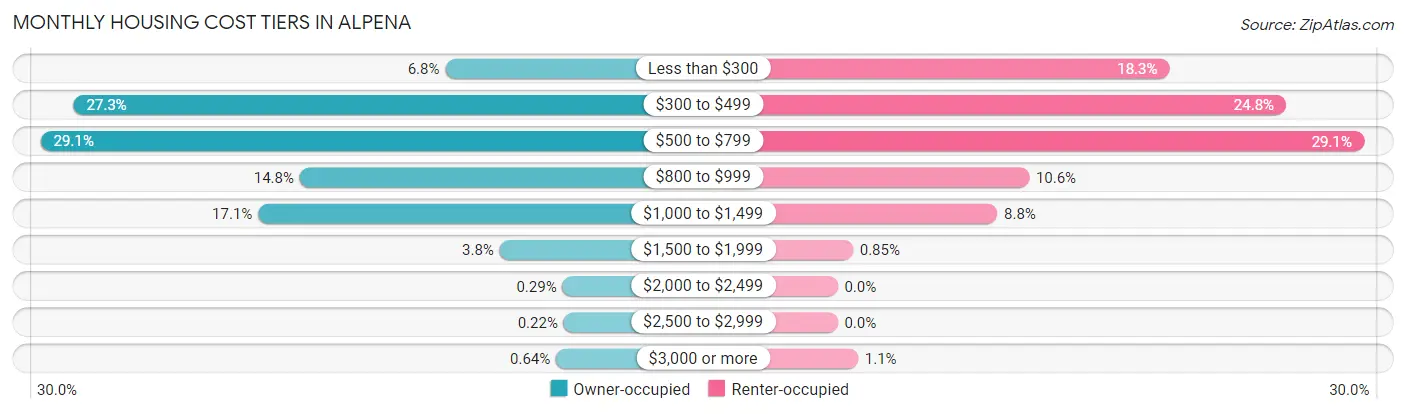
| Monthly Cost | Owner-occupied | Renter-occupied |
| Less than $300 | 212 (6.8%) | 324 (18.3%) |
| $300 to $499 | 856 (27.3%) | 438 (24.8%) |
| $500 to $799 | 913 (29.1%) | 514 (29.1%) |
| $800 to $999 | 464 (14.8%) | 187 (10.6%) |
| $1,000 to $1,499 | 536 (17.1%) | 156 (8.8%) |
| $1,500 to $1,999 | 118 (3.8%) | 15 (0.9%) |
| $2,000 to $2,499 | 9 (0.3%) | 0 (0.0%) |
| $2,500 to $2,999 | 7 (0.2%) | 0 (0.0%) |
| $3,000 or more | 20 (0.6%) | 20 (1.1%) |
| Total | 3,135 (100.0%) | 1,768 (100.0%) |
Physical Housing Characteristics in Alpena
Housing Structures in Alpena
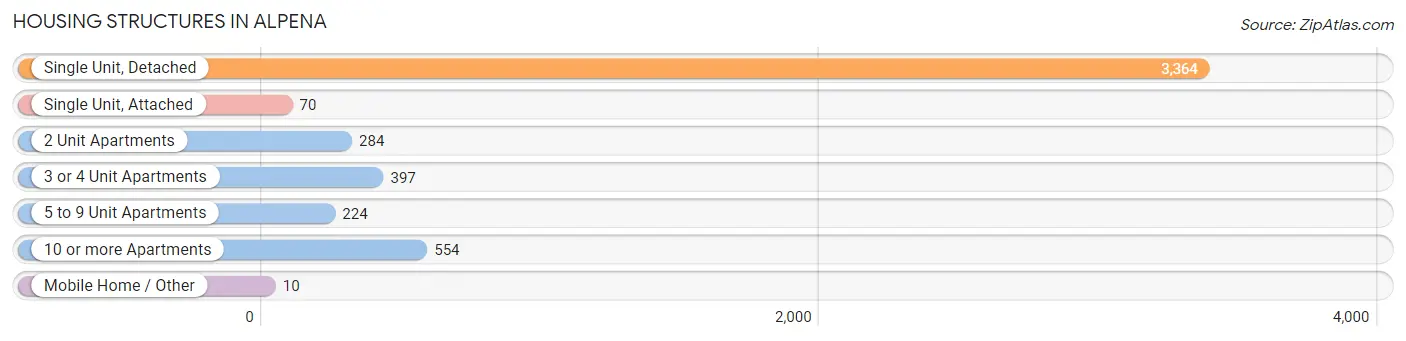
| Structure Type | # Housing Units | % Housing Units |
| Single Unit, Detached | 3,364 | 68.6% |
| Single Unit, Attached | 70 | 1.4% |
| 2 Unit Apartments | 284 | 5.8% |
| 3 or 4 Unit Apartments | 397 | 8.1% |
| 5 to 9 Unit Apartments | 224 | 4.6% |
| 10 or more Apartments | 554 | 11.3% |
| Mobile Home / Other | 10 | 0.2% |
| Total | 4,903 | 100.0% |
Housing Structures by Occupancy in Alpena
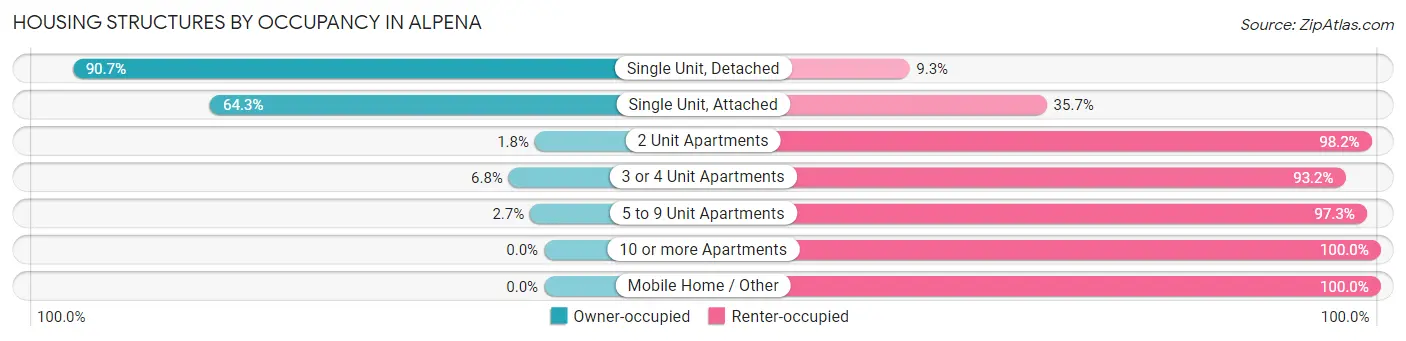
| Structure Type | Owner-occupied | Renter-occupied |
| Single Unit, Detached | 3,052 (90.7%) | 312 (9.3%) |
| Single Unit, Attached | 45 (64.3%) | 25 (35.7%) |
| 2 Unit Apartments | 5 (1.8%) | 279 (98.2%) |
| 3 or 4 Unit Apartments | 27 (6.8%) | 370 (93.2%) |
| 5 to 9 Unit Apartments | 6 (2.7%) | 218 (97.3%) |
| 10 or more Apartments | 0 (0.0%) | 554 (100.0%) |
| Mobile Home / Other | 0 (0.0%) | 10 (100.0%) |
| Total | 3,135 (63.9%) | 1,768 (36.1%) |
Housing Structures by Number of Rooms in Alpena
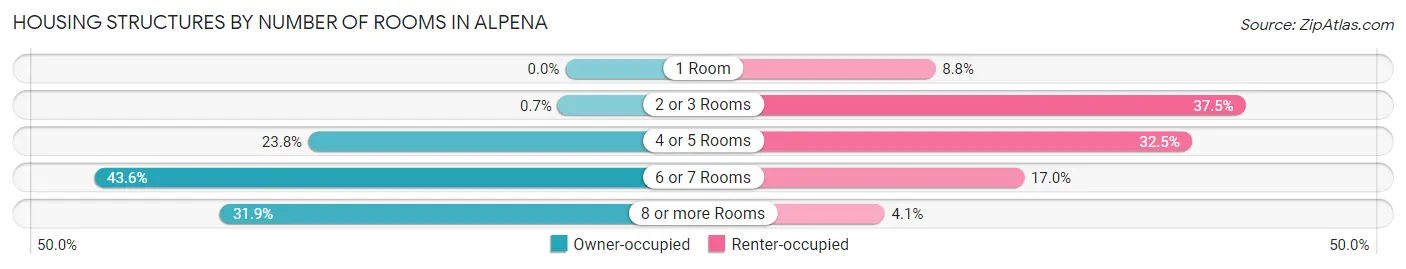
| Number of Rooms | Owner-occupied | Renter-occupied |
| 1 Room | 0 (0.0%) | 156 (8.8%) |
| 2 or 3 Rooms | 22 (0.7%) | 663 (37.5%) |
| 4 or 5 Rooms | 746 (23.8%) | 575 (32.5%) |
| 6 or 7 Rooms | 1,366 (43.6%) | 301 (17.0%) |
| 8 or more Rooms | 1,001 (31.9%) | 73 (4.1%) |
| Total | 3,135 (100.0%) | 1,768 (100.0%) |
Housing Structure by Heating Type in Alpena
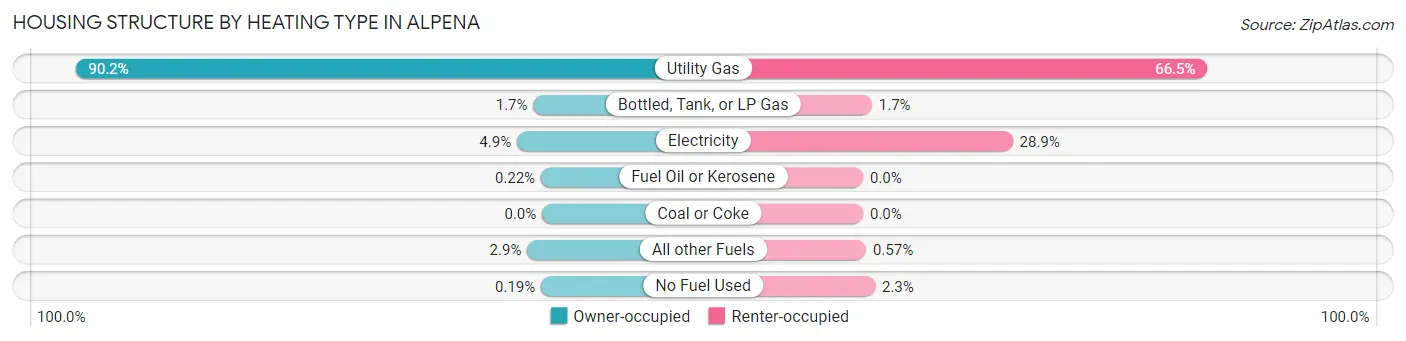
| Heating Type | Owner-occupied | Renter-occupied |
| Utility Gas | 2,827 (90.2%) | 1,176 (66.5%) |
| Bottled, Tank, or LP Gas | 53 (1.7%) | 30 (1.7%) |
| Electricity | 152 (4.9%) | 511 (28.9%) |
| Fuel Oil or Kerosene | 7 (0.2%) | 0 (0.0%) |
| Coal or Coke | 0 (0.0%) | 0 (0.0%) |
| All other Fuels | 90 (2.9%) | 10 (0.6%) |
| No Fuel Used | 6 (0.2%) | 41 (2.3%) |
| Total | 3,135 (100.0%) | 1,768 (100.0%) |
Household Vehicle Usage in Alpena
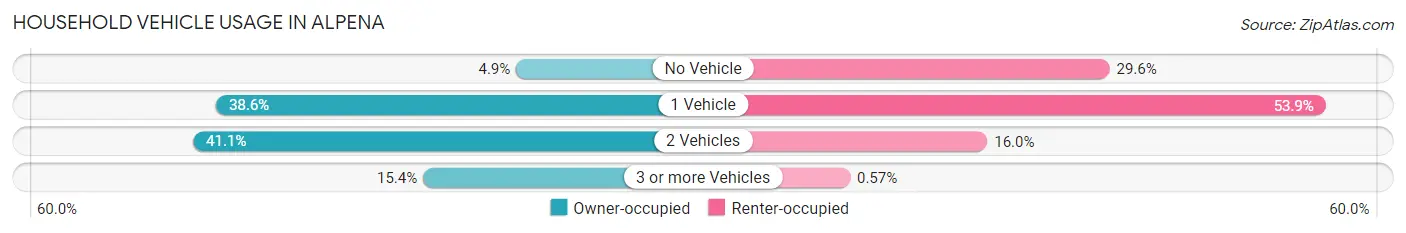
| Vehicles per Household | Owner-occupied | Renter-occupied |
| No Vehicle | 155 (4.9%) | 524 (29.6%) |
| 1 Vehicle | 1,209 (38.6%) | 952 (53.8%) |
| 2 Vehicles | 1,289 (41.1%) | 282 (16.0%) |
| 3 or more Vehicles | 482 (15.4%) | 10 (0.6%) |
| Total | 3,135 (100.0%) | 1,768 (100.0%) |
Real Estate & Mortgages in Alpena
Real Estate and Mortgage Overview in Alpena
| Characteristic | Without Mortgage | With Mortgage |
| Housing Units | 1,585 | 1,550 |
| Median Property Value | $118,100 | $90,200 |
| Median Household Income | $50,507 | $133 |
| Monthly Housing Costs | $438 | $11 |
| Real Estate Taxes | $1,724 | $9 |
Property Value by Mortgage Status in Alpena
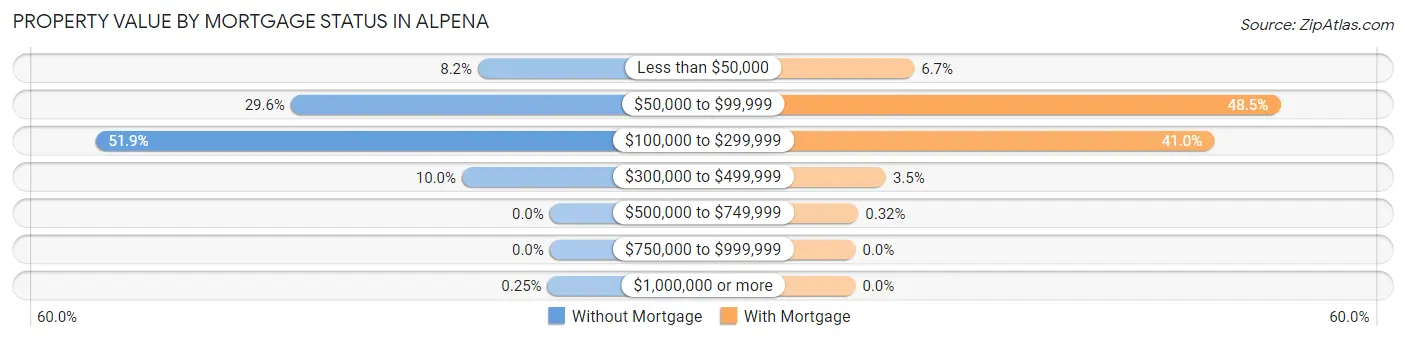
| Property Value | Without Mortgage | With Mortgage |
| Less than $50,000 | 130 (8.2%) | 104 (6.7%) |
| $50,000 to $99,999 | 469 (29.6%) | 752 (48.5%) |
| $100,000 to $299,999 | 823 (51.9%) | 635 (41.0%) |
| $300,000 to $499,999 | 159 (10.0%) | 54 (3.5%) |
| $500,000 to $749,999 | 0 (0.0%) | 5 (0.3%) |
| $750,000 to $999,999 | 0 (0.0%) | 0 (0.0%) |
| $1,000,000 or more | 4 (0.3%) | 0 (0.0%) |
| Total | 1,585 (100.0%) | 1,550 (100.0%) |
Household Income by Mortgage Status in Alpena
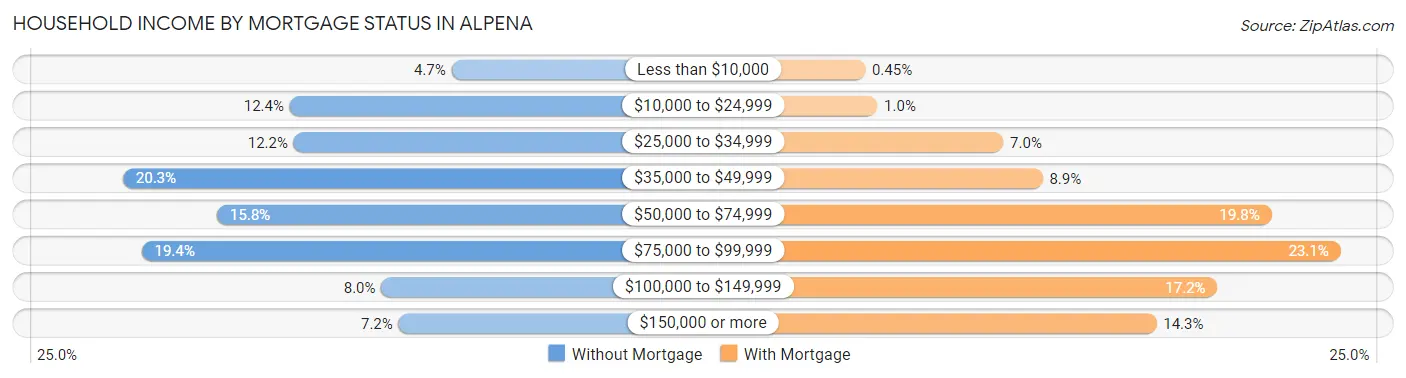
| Household Income | Without Mortgage | With Mortgage |
| Less than $10,000 | 74 (4.7%) | 7 (0.4%) |
| $10,000 to $24,999 | 196 (12.4%) | 16 (1.0%) |
| $25,000 to $34,999 | 193 (12.2%) | 109 (7.0%) |
| $35,000 to $49,999 | 322 (20.3%) | 138 (8.9%) |
| $50,000 to $74,999 | 251 (15.8%) | 307 (19.8%) |
| $75,000 to $99,999 | 308 (19.4%) | 358 (23.1%) |
| $100,000 to $149,999 | 127 (8.0%) | 267 (17.2%) |
| $150,000 or more | 114 (7.2%) | 222 (14.3%) |
| Total | 1,585 (100.0%) | 1,550 (100.0%) |
Property Value to Household Income Ratio in Alpena
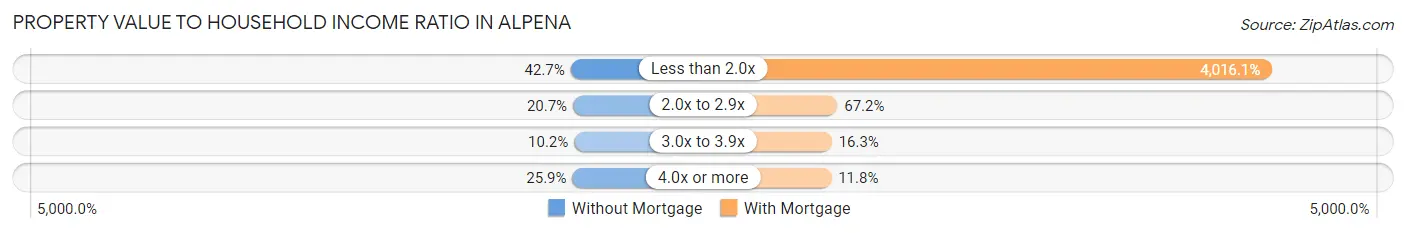
| Value-to-Income Ratio | Without Mortgage | With Mortgage |
| Less than 2.0x | 676 (42.6%) | 62,250 (4,016.1%) |
| 2.0x to 2.9x | 328 (20.7%) | 1,042 (67.2%) |
| 3.0x to 3.9x | 162 (10.2%) | 252 (16.3%) |
| 4.0x or more | 411 (25.9%) | 183 (11.8%) |
| Total | 1,585 (100.0%) | 1,550 (100.0%) |
Real Estate Taxes by Mortgage Status in Alpena
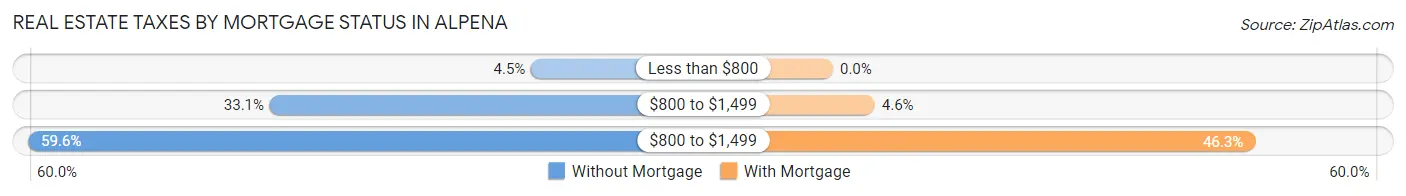
| Property Taxes | Without Mortgage | With Mortgage |
| Less than $800 | 71 (4.5%) | 0 (0.0%) |
| $800 to $1,499 | 525 (33.1%) | 71 (4.6%) |
| $800 to $1,499 | 945 (59.6%) | 717 (46.3%) |
| Total | 1,585 (100.0%) | 1,550 (100.0%) |
Health & Disability in Alpena
Health Insurance Coverage by Age in Alpena
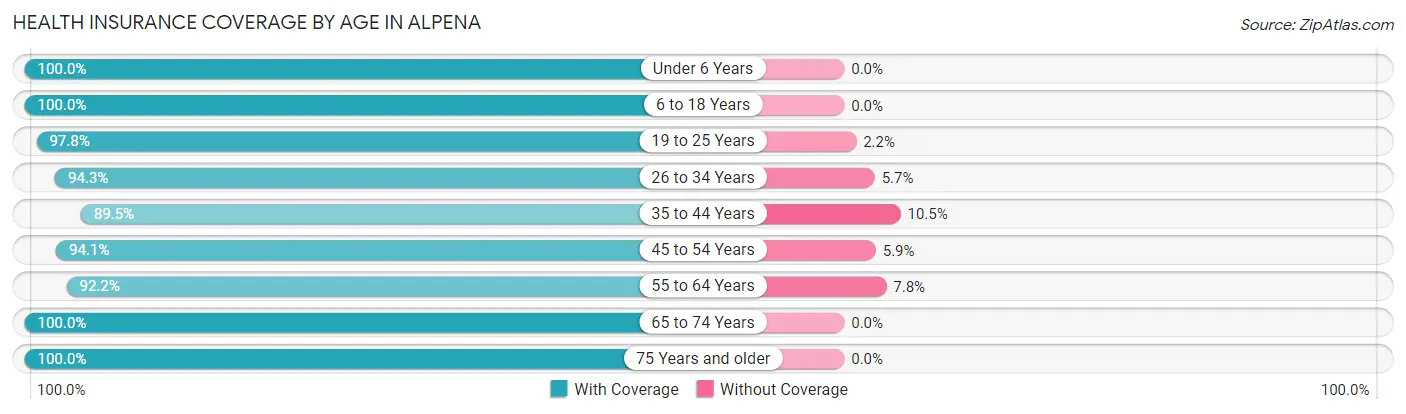
| Age Bracket | With Coverage | Without Coverage |
| Under 6 Years | 478 (100.0%) | 0 (0.0%) |
| 6 to 18 Years | 1,450 (100.0%) | 0 (0.0%) |
| 19 to 25 Years | 662 (97.8%) | 15 (2.2%) |
| 26 to 34 Years | 1,062 (94.3%) | 64 (5.7%) |
| 35 to 44 Years | 1,194 (89.5%) | 140 (10.5%) |
| 45 to 54 Years | 1,107 (94.1%) | 69 (5.9%) |
| 55 to 64 Years | 1,482 (92.2%) | 126 (7.8%) |
| 65 to 74 Years | 1,069 (100.0%) | 0 (0.0%) |
| 75 Years and older | 1,063 (100.0%) | 0 (0.0%) |
| Total | 9,567 (95.9%) | 414 (4.2%) |
Health Insurance Coverage by Citizenship Status in Alpena
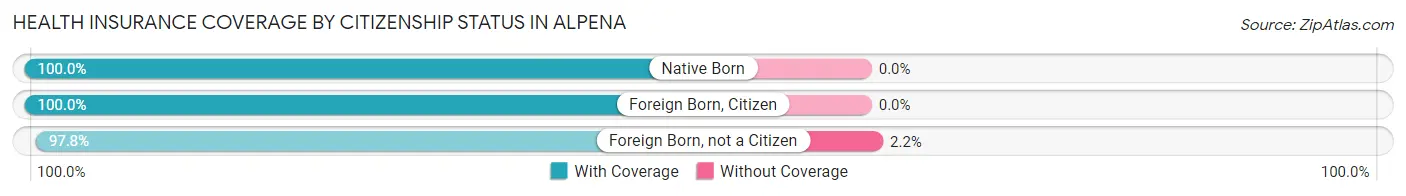
| Citizenship Status | With Coverage | Without Coverage |
| Native Born | 478 (100.0%) | 0 (0.0%) |
| Foreign Born, Citizen | 1,450 (100.0%) | 0 (0.0%) |
| Foreign Born, not a Citizen | 662 (97.8%) | 15 (2.2%) |
Health Insurance Coverage by Household Income in Alpena
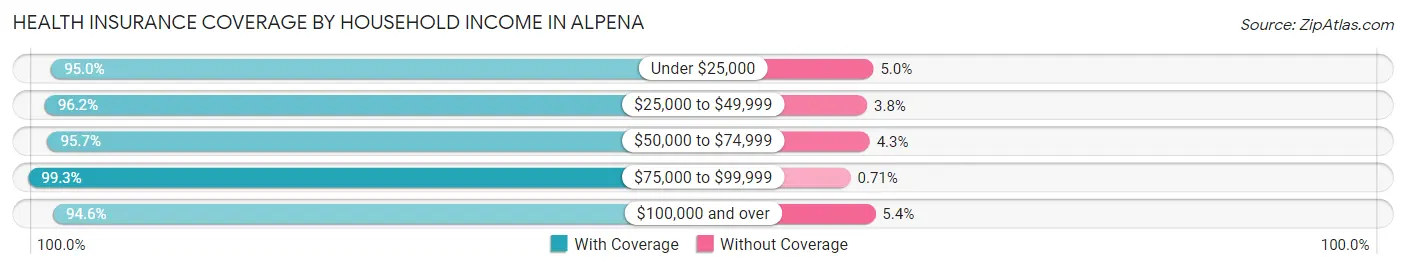
| Household Income | With Coverage | Without Coverage |
| Under $25,000 | 1,997 (95.0%) | 105 (5.0%) |
| $25,000 to $49,999 | 2,583 (96.2%) | 102 (3.8%) |
| $50,000 to $74,999 | 1,872 (95.7%) | 84 (4.3%) |
| $75,000 to $99,999 | 1,531 (99.3%) | 11 (0.7%) |
| $100,000 and over | 1,449 (94.6%) | 82 (5.4%) |
Public vs Private Health Insurance Coverage by Age in Alpena
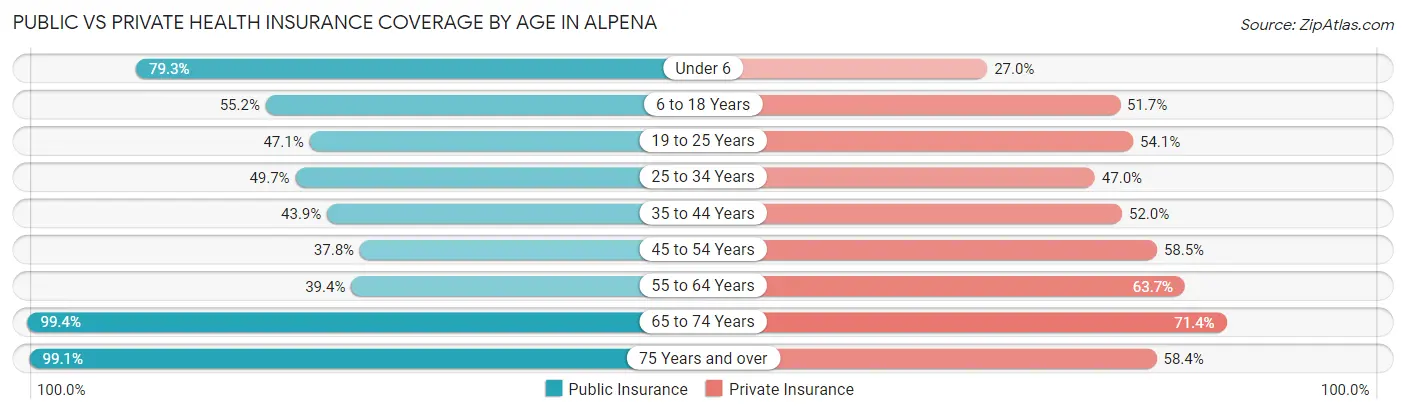
| Age Bracket | Public Insurance | Private Insurance |
| Under 6 | 379 (79.3%) | 129 (27.0%) |
| 6 to 18 Years | 801 (55.2%) | 749 (51.7%) |
| 19 to 25 Years | 319 (47.1%) | 366 (54.1%) |
| 25 to 34 Years | 560 (49.7%) | 529 (47.0%) |
| 35 to 44 Years | 585 (43.9%) | 694 (52.0%) |
| 45 to 54 Years | 444 (37.8%) | 688 (58.5%) |
| 55 to 64 Years | 633 (39.4%) | 1,024 (63.7%) |
| 65 to 74 Years | 1,063 (99.4%) | 763 (71.4%) |
| 75 Years and over | 1,053 (99.1%) | 621 (58.4%) |
| Total | 5,837 (58.5%) | 5,563 (55.7%) |
Disability Status by Sex by Age in Alpena
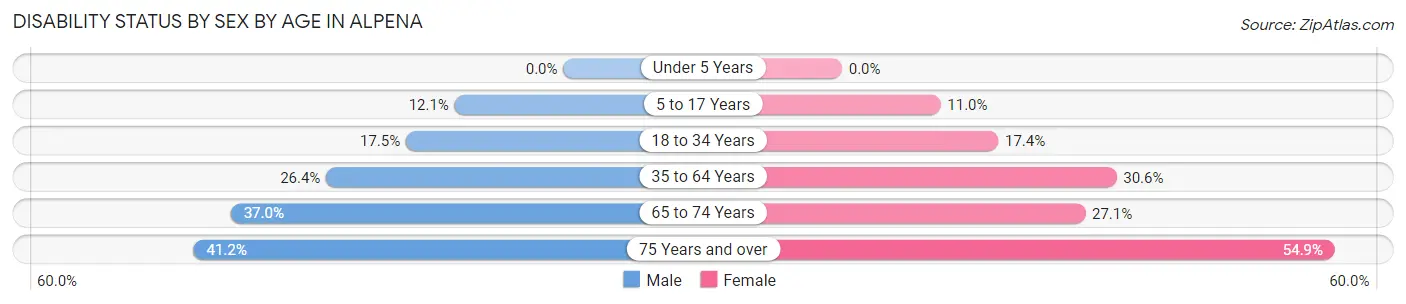
| Age Bracket | Male | Female |
| Under 5 Years | 0 (0.0%) | 0 (0.0%) |
| 5 to 17 Years | 101 (12.1%) | 63 (11.0%) |
| 18 to 34 Years | 165 (17.5%) | 163 (17.4%) |
| 35 to 64 Years | 507 (26.4%) | 672 (30.6%) |
| 65 to 74 Years | 210 (37.0%) | 136 (27.1%) |
| 75 Years and over | 140 (41.2%) | 397 (54.9%) |
Disability Class by Sex by Age in Alpena
Disability Class: Hearing Difficulty
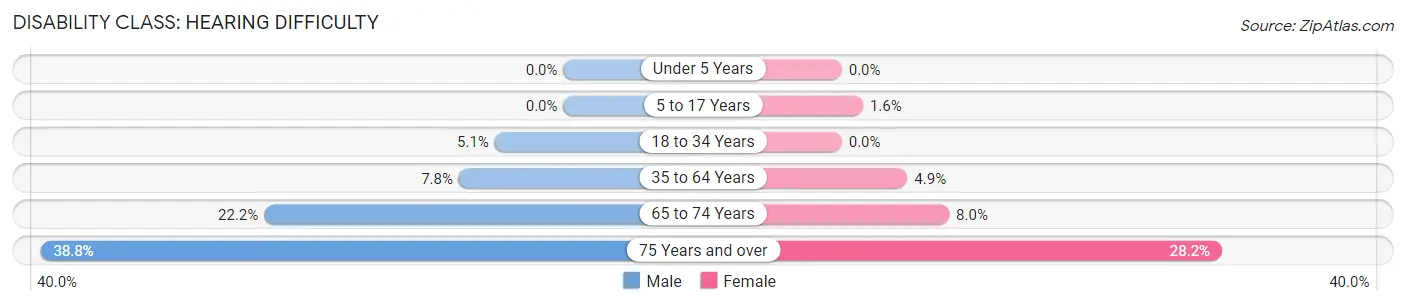
| Age Bracket | Male | Female |
| Under 5 Years | 0 (0.0%) | 0 (0.0%) |
| 5 to 17 Years | 0 (0.0%) | 9 (1.6%) |
| 18 to 34 Years | 48 (5.1%) | 0 (0.0%) |
| 35 to 64 Years | 149 (7.8%) | 107 (4.9%) |
| 65 to 74 Years | 126 (22.2%) | 40 (8.0%) |
| 75 Years and over | 132 (38.8%) | 204 (28.2%) |
Disability Class: Vision Difficulty
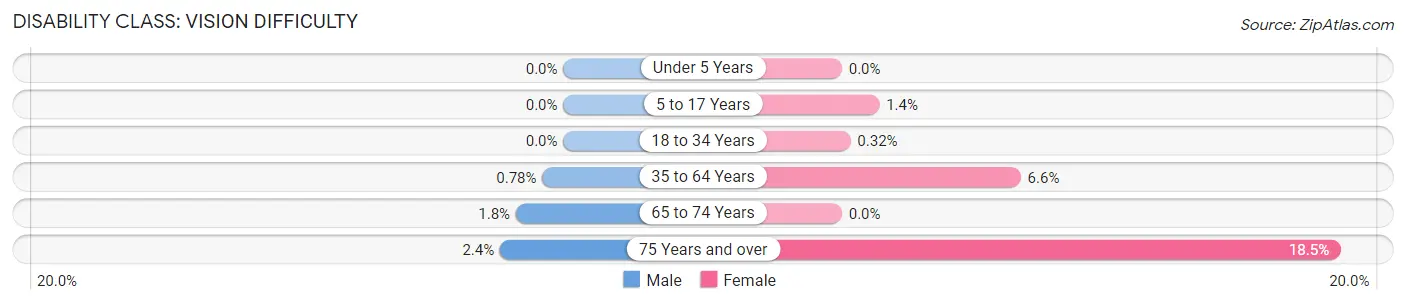
| Age Bracket | Male | Female |
| Under 5 Years | 0 (0.0%) | 0 (0.0%) |
| 5 to 17 Years | 0 (0.0%) | 8 (1.4%) |
| 18 to 34 Years | 0 (0.0%) | 3 (0.3%) |
| 35 to 64 Years | 15 (0.8%) | 146 (6.6%) |
| 65 to 74 Years | 10 (1.8%) | 0 (0.0%) |
| 75 Years and over | 8 (2.4%) | 134 (18.5%) |
Disability Class: Cognitive Difficulty
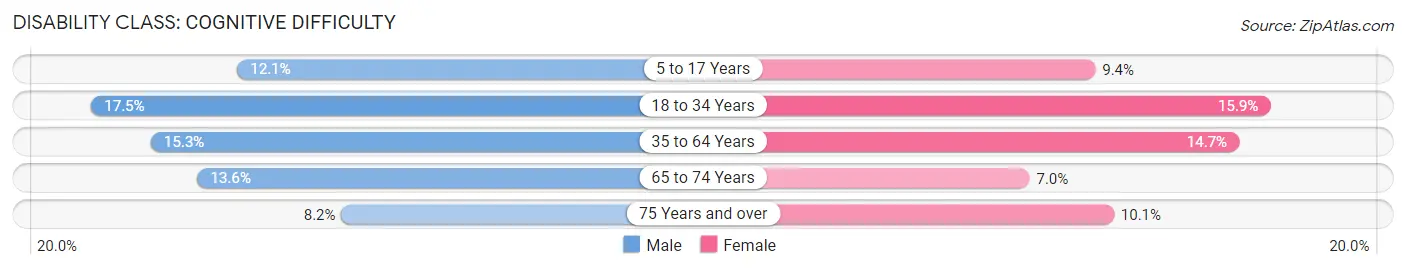
| Age Bracket | Male | Female |
| 5 to 17 Years | 101 (12.1%) | 54 (9.4%) |
| 18 to 34 Years | 165 (17.5%) | 149 (15.9%) |
| 35 to 64 Years | 294 (15.3%) | 324 (14.7%) |
| 65 to 74 Years | 77 (13.6%) | 35 (7.0%) |
| 75 Years and over | 28 (8.2%) | 73 (10.1%) |
Disability Class: Ambulatory Difficulty
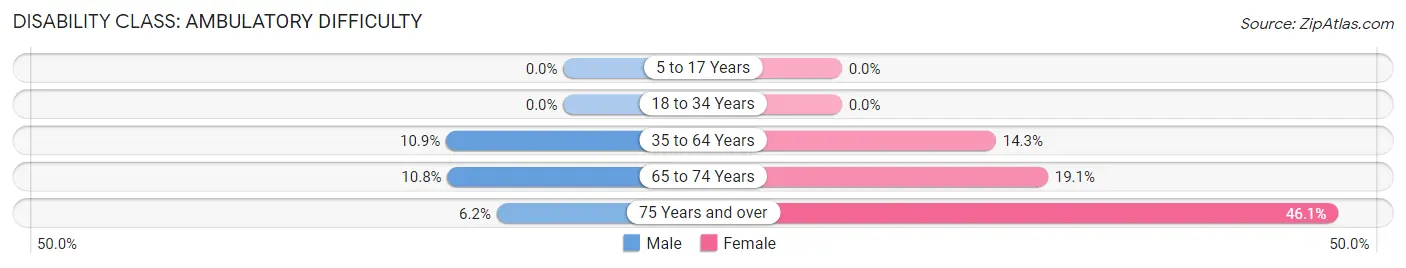
| Age Bracket | Male | Female |
| 5 to 17 Years | 0 (0.0%) | 0 (0.0%) |
| 18 to 34 Years | 0 (0.0%) | 0 (0.0%) |
| 35 to 64 Years | 209 (10.9%) | 314 (14.3%) |
| 65 to 74 Years | 61 (10.8%) | 96 (19.1%) |
| 75 Years and over | 21 (6.2%) | 333 (46.1%) |
Disability Class: Self-Care Difficulty
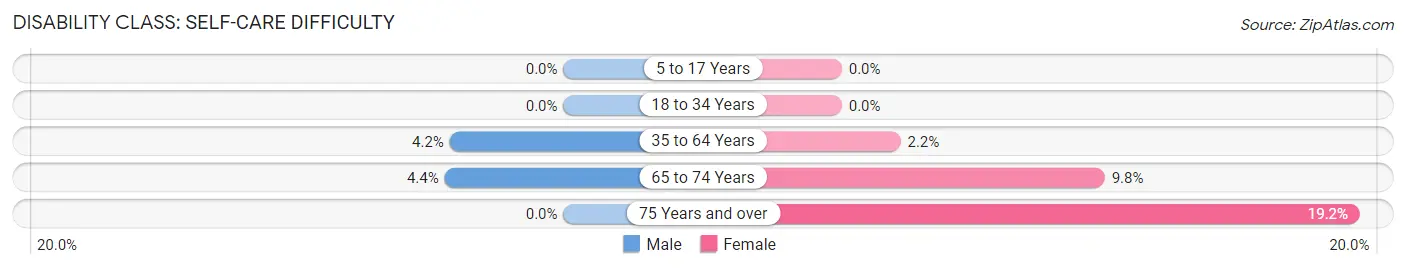
| Age Bracket | Male | Female |
| 5 to 17 Years | 0 (0.0%) | 0 (0.0%) |
| 18 to 34 Years | 0 (0.0%) | 0 (0.0%) |
| 35 to 64 Years | 81 (4.2%) | 48 (2.2%) |
| 65 to 74 Years | 25 (4.4%) | 49 (9.8%) |
| 75 Years and over | 0 (0.0%) | 139 (19.2%) |
Technology Access in Alpena
Computing Device Access in Alpena
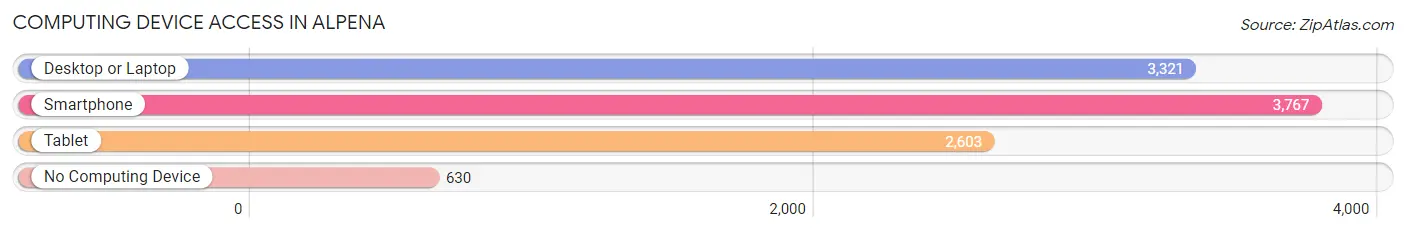
| Device Type | # Households | % Households |
| Desktop or Laptop | 3,321 | 67.7% |
| Smartphone | 3,767 | 76.8% |
| Tablet | 2,603 | 53.1% |
| No Computing Device | 630 | 12.9% |
| Total | 4,903 | 100.0% |
Internet Access in Alpena
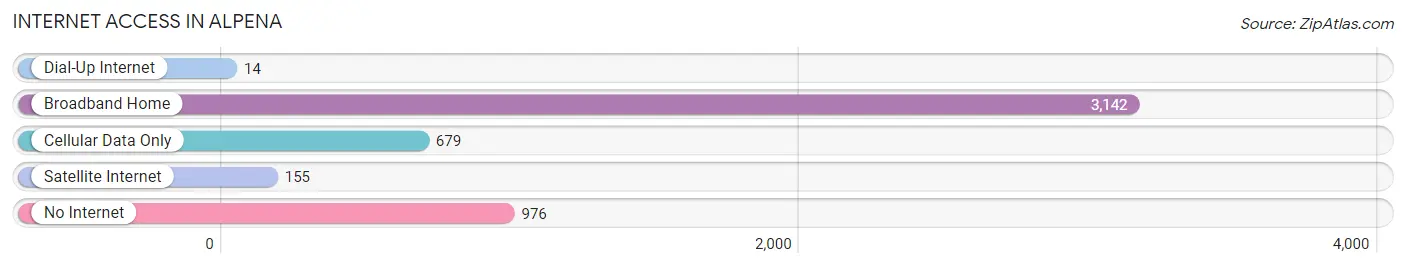
| Internet Type | # Households | % Households |
| Dial-Up Internet | 14 | 0.3% |
| Broadband Home | 3,142 | 64.1% |
| Cellular Data Only | 679 | 13.9% |
| Satellite Internet | 155 | 3.2% |
| No Internet | 976 | 19.9% |
| Total | 4,903 | 100.0% |
Alpena Summary
Alpena, Michigan is a city located in the northeastern part of the state, on the shores of Lake Huron. It is the county seat of Alpena County and is the only city in the county. The city has a population of 10,483 as of the 2010 census, making it the largest city in the county.
Geography
Alpena is located at the mouth of the Thunder Bay River, which empties into Thunder Bay, an arm of Lake Huron. The city is situated on a limestone ridge that rises from the lake and is surrounded by rolling hills and forests. The city is located about 90 miles northeast of Traverse City and about 180 miles north of Detroit.
The city has a total area of 8.2 square miles, of which 7.9 square miles is land and 0.3 square miles is water. The city is located in the humid continental climate zone, with cold, snowy winters and warm, humid summers.
Economy
Alpena's economy is largely based on manufacturing, tourism, and agriculture. The city is home to several manufacturing companies, including Alpena Manufacturing, which produces automotive parts, and Alpena Power Company, which produces electrical components. The city is also home to several tourist attractions, including the Great Lakes Maritime Heritage Center, the Thunder Bay National Marine Sanctuary, and the Alpena Wildlife Sanctuary.
Agriculture is also an important part of the local economy. The city is home to several farms, including dairy farms, fruit farms, and vegetable farms. The city is also home to several wineries and breweries.
Demographics
As of the 2010 census, the population of Alpena was 10,483. The racial makeup of the city was 94.3% White, 0.7% African American, 0.7% Native American, 0.5% Asian, 0.1% Pacific Islander, 1.2% from other races, and 2.5% from two or more races. Hispanic or Latino of any race were 3.2% of the population.
The median income for a household in the city was $35,945, and the median income for a family was $45,945. The per capita income for the city was $20,845. About 14.3% of families and 17.7% of the population were below the poverty line, including 25.2% of those under age 18 and 8.2% of those age 65 or over.
Conclusion
Alpena, Michigan is a city located in the northeastern part of the state, on the shores of Lake Huron. It is the county seat of Alpena County and is the only city in the county. The city has a population of 10,483 as of the 2010 census, making it the largest city in the county. The city has a humid continental climate and is home to several manufacturing companies, tourist attractions, and farms. The city has a median household income of $35,945 and a per capita income of $20,845. About 14.3% of families and 17.7% of the population were below the poverty line.
Common Questions
What is Per Capita Income in Alpena?
Per Capita income in Alpena is $30,936.
What is the Median Family Income in Alpena?
Median Family Income in Alpena is $56,952.
What is the Median Household income in Alpena?
Median Household Income in Alpena is $43,613.
What is Income or Wage Gap in Alpena?
Income or Wage Gap in Alpena is 38.0%.
Women in Alpena earn 62.0 cents for every dollar earned by a man.
What is Family Income Deficit in Alpena?
Family Income Deficit in Alpena is $9,281.
Families that are below poverty line in Alpena earn $9,281 less on average than the poverty threshold level.
What is Inequality or Gini Index in Alpena?
Inequality or Gini Index in Alpena is 0.49.
What is the Total Population of Alpena?
Total Population of Alpena is 10,200.
What is the Total Male Population of Alpena?
Total Male Population of Alpena is 4,905.
What is the Total Female Population of Alpena?
Total Female Population of Alpena is 5,295.
What is the Ratio of Males per 100 Females in Alpena?
There are 92.63 Males per 100 Females in Alpena.
What is the Ratio of Females per 100 Males in Alpena?
There are 107.95 Females per 100 Males in Alpena.
What is the Median Population Age in Alpena?
Median Population Age in Alpena is 44.7 Years.
What is the Average Family Size in Alpena
Average Family Size in Alpena is 2.8 People.
What is the Average Household Size in Alpena
Average Household Size in Alpena is 2.0 People.
How Large is the Labor Force in Alpena?
There are 4,874 People in the Labor Forcein in Alpena.
What is the Percentage of People in the Labor Force in Alpena?
56.6% of People are in the Labor Force in Alpena.
What is the Unemployment Rate in Alpena?
Unemployment Rate in Alpena is 8.9%.