Zip Codes with the Highest Percentage of Families with Income Below $10,000 in Battle Creek, MI
RELATED REPORTS & OPTIONS
Family Income | $0-10k
Battle Creek
Compare Zip Codes
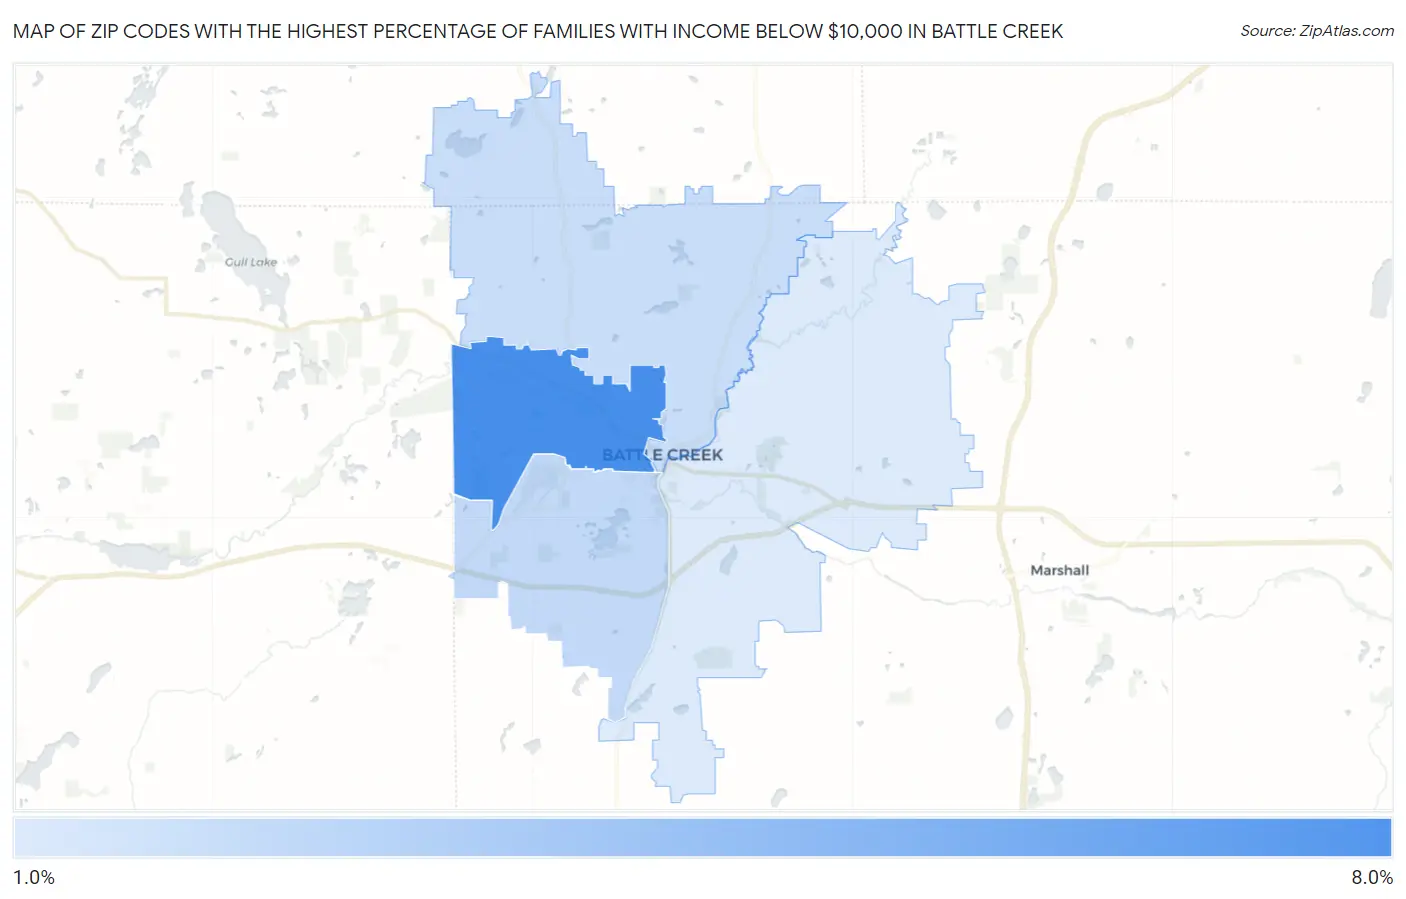
Map of Zip Codes with the Highest Percentage of Families with Income Below $10,000 in Battle Creek
1.6%
6.2%
Zip Codes with the Highest Percentage of Families with Income Below $10,000 in Battle Creek, MI
| Zip Code | Families with Income < $10k | vs State | vs National | |
| 1. | 49037 | 6.2% | 3.0%(+3.20)#97 | 3.1%(+3.10)#4,438 |
| 2. | 49015 | 2.4% | 3.0%(-0.600)#403 | 3.1%(-0.700)#13,499 |
| 3. | 49017 | 2.2% | 3.0%(-0.800)#449 | 3.1%(-0.900)#14,427 |
| 4. | 49014 | 1.6% | 3.0%(-1.40)#560 | 3.1%(-1.50)#17,298 |
1
Common Questions
What are the Top 3 Zip Codes with the Highest Percentage of Families with Income Below $10,000 in Battle Creek, MI?
Top 3 Zip Codes with the Highest Percentage of Families with Income Below $10,000 in Battle Creek, MI are:
What zip code has the Highest Percentage of Families with Income Below $10,000 in Battle Creek, MI?
49037 has the Highest Percentage of Families with Income Below $10,000 in Battle Creek, MI with 6.2%.
What is the Percentage of Families with Income Below $10,000 in Battle Creek, MI?
Percentage of Families with Income Below $10,000 in Battle Creek is 3.1%.
What is the Percentage of Families with Income Below $10,000 in Michigan?
Percentage of Families with Income Below $10,000 in Michigan is 3.0%.
What is the Percentage of Families with Income Below $10,000 in the United States?
Percentage of Families with Income Below $10,000 in the United States is 3.1%.