Cedar Springs, MI Map & Demographics
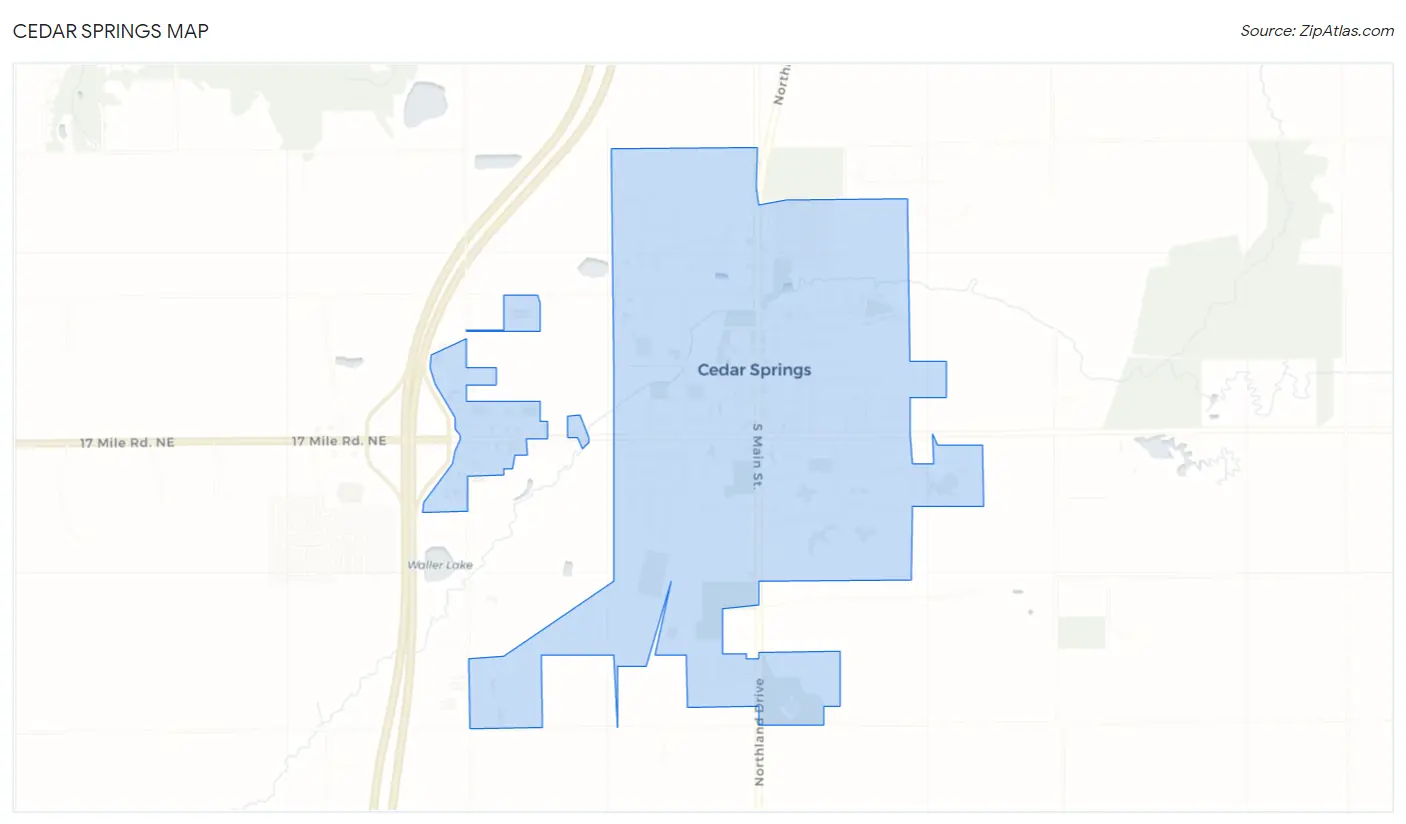
Cedar Springs Map
Cedar Springs Overview
$25,042
PER CAPITA INCOME
$63,504
AVG FAMILY INCOME
$47,300
AVG HOUSEHOLD INCOME
44.4%
WAGE / INCOME GAP [ % ]
55.6¢/ $1
WAGE / INCOME GAP [ $ ]
0.42
INEQUALITY / GINI INDEX
3,646
TOTAL POPULATION
1,534
MALE POPULATION
2,112
FEMALE POPULATION
72.63
MALES / 100 FEMALES
137.68
FEMALES / 100 MALES
41.8
MEDIAN AGE
2.9
AVG FAMILY SIZE
2.3
AVG HOUSEHOLD SIZE
1,921
LABOR FORCE [ PEOPLE ]
64.5%
PERCENT IN LABOR FORCE
7.1%
UNEMPLOYMENT RATE
Cedar Springs Zip Codes
Cedar Springs Area Codes
Income in Cedar Springs
Income Overview in Cedar Springs
Per Capita Income in Cedar Springs is $25,042, while median incomes of families and households are $63,504 and $47,300 respectively.
| Characteristic | Number | Measure |
| Per Capita Income | 3,646 | $25,042 |
| Median Family Income | 881 | $63,504 |
| Mean Family Income | 881 | $72,373 |
| Median Household Income | 1,537 | $47,300 |
| Mean Household Income | 1,537 | $58,425 |
| Income Deficit | 881 | $0 |
| Wage / Income Gap (%) | 3,646 | 44.42% |
| Wage / Income Gap ($) | 3,646 | 55.58¢ per $1 |
| Gini / Inequality Index | 3,646 | 0.42 |
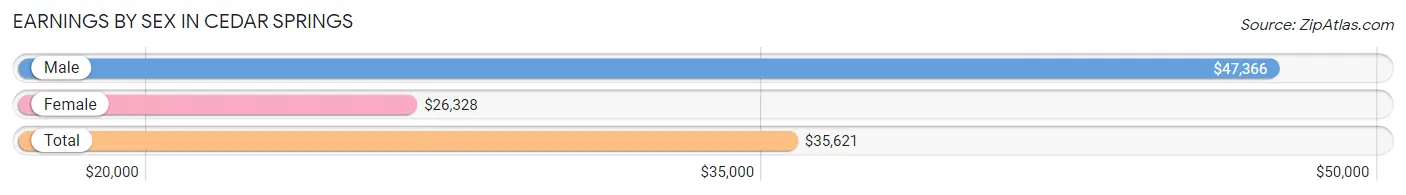
Earnings by Sex in Cedar Springs
Average Earnings in Cedar Springs are $35,621, $47,366 for men and $26,328 for women, a difference of 44.4%.
| Sex | Number | Average Earnings |
| Male | 933 (48.2%) | $47,366 |
| Female | 1,003 (51.8%) | $26,328 |
| Total | 1,936 (100.0%) | $35,621 |
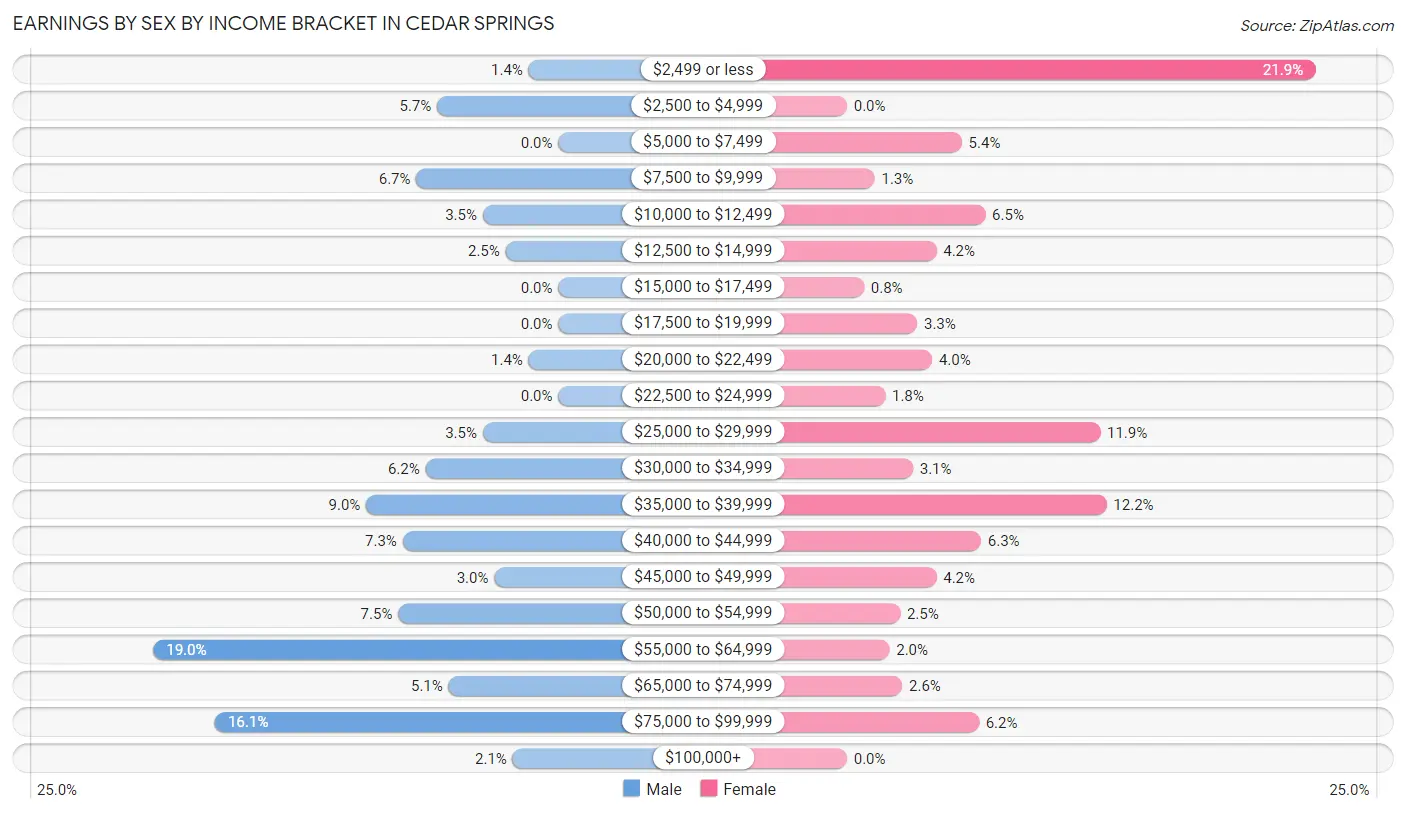
Earnings by Sex by Income Bracket in Cedar Springs
The most common earnings brackets in Cedar Springs are $55,000 to $64,999 for men (177 | 19.0%) and $2,499 or less for women (220 | 21.9%).
| Income | Male | Female |
| $2,499 or less | 13 (1.4%) | 220 (21.9%) |
| $2,500 to $4,999 | 53 (5.7%) | 0 (0.0%) |
| $5,000 to $7,499 | 0 (0.0%) | 54 (5.4%) |
| $7,500 to $9,999 | 62 (6.7%) | 13 (1.3%) |
| $10,000 to $12,499 | 33 (3.5%) | 65 (6.5%) |
| $12,500 to $14,999 | 23 (2.5%) | 42 (4.2%) |
| $15,000 to $17,499 | 0 (0.0%) | 8 (0.8%) |
| $17,500 to $19,999 | 0 (0.0%) | 33 (3.3%) |
| $20,000 to $22,499 | 13 (1.4%) | 40 (4.0%) |
| $22,500 to $24,999 | 0 (0.0%) | 18 (1.8%) |
| $25,000 to $29,999 | 33 (3.5%) | 119 (11.9%) |
| $30,000 to $34,999 | 58 (6.2%) | 31 (3.1%) |
| $35,000 to $39,999 | 84 (9.0%) | 122 (12.2%) |
| $40,000 to $44,999 | 68 (7.3%) | 63 (6.3%) |
| $45,000 to $49,999 | 28 (3.0%) | 42 (4.2%) |
| $50,000 to $54,999 | 70 (7.5%) | 25 (2.5%) |
| $55,000 to $64,999 | 177 (19.0%) | 20 (2.0%) |
| $65,000 to $74,999 | 48 (5.1%) | 26 (2.6%) |
| $75,000 to $99,999 | 150 (16.1%) | 62 (6.2%) |
| $100,000+ | 20 (2.1%) | 0 (0.0%) |
| Total | 933 (100.0%) | 1,003 (100.0%) |
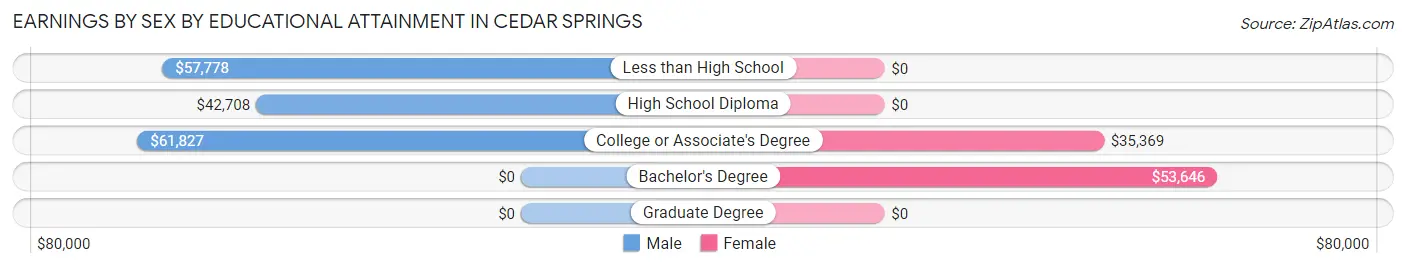
Earnings by Sex by Educational Attainment in Cedar Springs
Average earnings in Cedar Springs are $52,885 for men and $27,500 for women, a difference of 48.0%. Men with an educational attainment of college or associate's degree enjoy the highest average annual earnings of $61,827, while those with high school diploma education earn the least with $42,708. Women with an educational attainment of bachelor's degree earn the most with the average annual earnings of $53,646, while those with college or associate's degree education have the smallest earnings of $35,369.
| Educational Attainment | Male Income | Female Income |
| Less than High School | $57,778 | $0 |
| High School Diploma | $42,708 | $0 |
| College or Associate's Degree | $61,827 | $35,369 |
| Bachelor's Degree | - | - |
| Graduate Degree | - | - |
| Total | $52,885 | $27,500 |
Family Income in Cedar Springs
Family Income Brackets in Cedar Springs
According to the Cedar Springs family income data, there are 290 families falling into the $50,000 to $74,999 income range, which is the most common income bracket and makes up 32.9% of all families. Conversely, the $10,000 to $14,999 income bracket is the least frequent group with only 13 families (1.5%) belonging to this category.
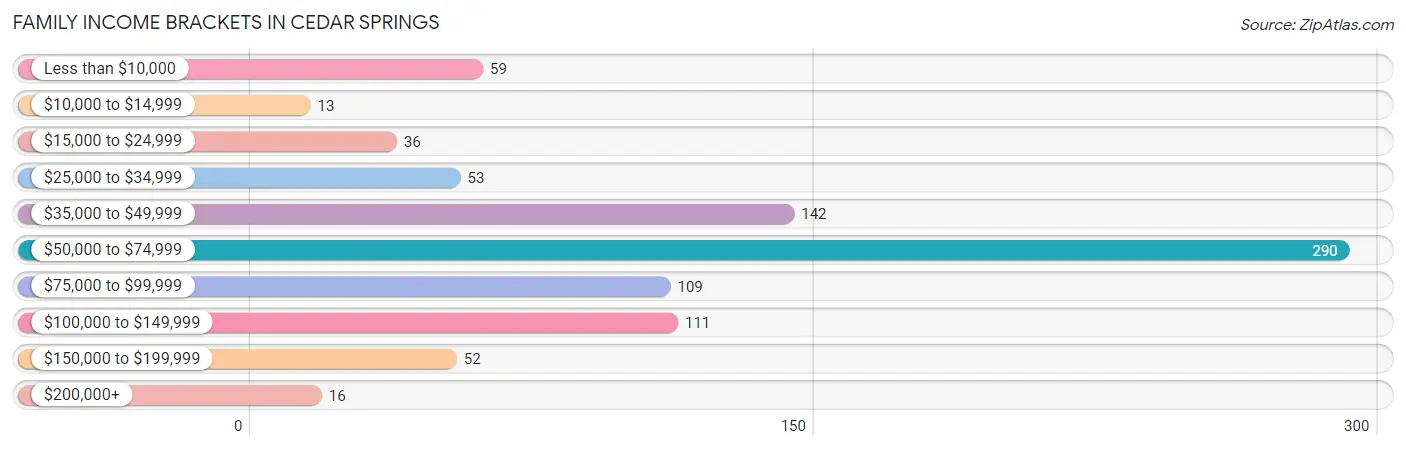
| Income Bracket | # Families | % Families |
| Less than $10,000 | 59 | 6.7% |
| $10,000 to $14,999 | 13 | 1.5% |
| $15,000 to $24,999 | 36 | 4.1% |
| $25,000 to $34,999 | 53 | 6.0% |
| $35,000 to $49,999 | 142 | 16.1% |
| $50,000 to $74,999 | 290 | 32.9% |
| $75,000 to $99,999 | 109 | 12.4% |
| $100,000 to $149,999 | 111 | 12.6% |
| $150,000 to $199,999 | 52 | 5.9% |
| $200,000+ | 16 | 1.8% |
Family Income by Famaliy Size in Cedar Springs
4-person families (180 | 20.4%) account for the highest median family income in Cedar Springs with $111,250 per family, while 2-person families (478 | 54.3%) have the highest median income of $31,272 per family member.
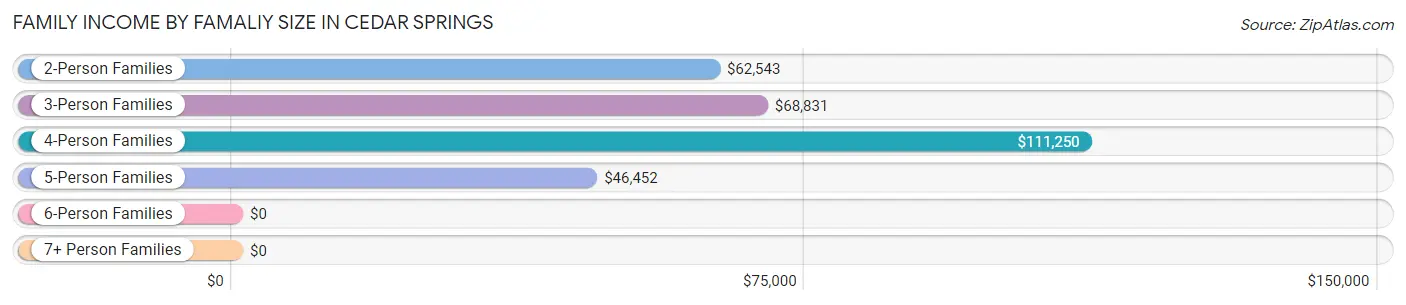
| Income Bracket | # Families | Median Income |
| 2-Person Families | 478 (54.3%) | $62,543 |
| 3-Person Families | 153 (17.4%) | $68,831 |
| 4-Person Families | 180 (20.4%) | $111,250 |
| 5-Person Families | 60 (6.8%) | $46,452 |
| 6-Person Families | 10 (1.1%) | $0 |
| 7+ Person Families | 0 (0.0%) | $0 |
| Total | 881 (100.0%) | $63,504 |
Family Income by Number of Earners in Cedar Springs
The median family income in Cedar Springs is $63,504, with families comprising 3+ earners (58) having the highest median family income of $181,563, while families with no earners (123) have the lowest median family income of $29,306, accounting for 6.6% and 14.0% of families, respectively.
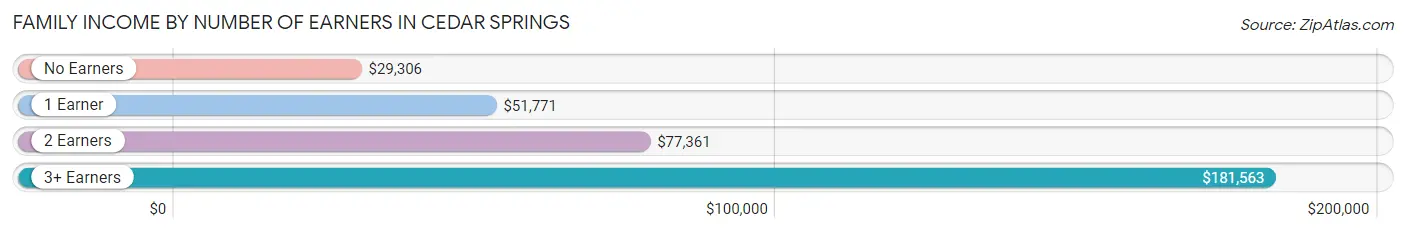
| Number of Earners | # Families | Median Income |
| No Earners | 123 (14.0%) | $29,306 |
| 1 Earner | 326 (37.0%) | $51,771 |
| 2 Earners | 374 (42.4%) | $77,361 |
| 3+ Earners | 58 (6.6%) | $181,563 |
| Total | 881 (100.0%) | $63,504 |
Household Income in Cedar Springs
Household Income Brackets in Cedar Springs
With 297 households falling in the category, the $10,000 to $14,999 income range is the most frequent in Cedar Springs, accounting for 19.3% of all households. In contrast, only 15 households (1.0%) fall into the $200,000+ income bracket, making it the least populous group.
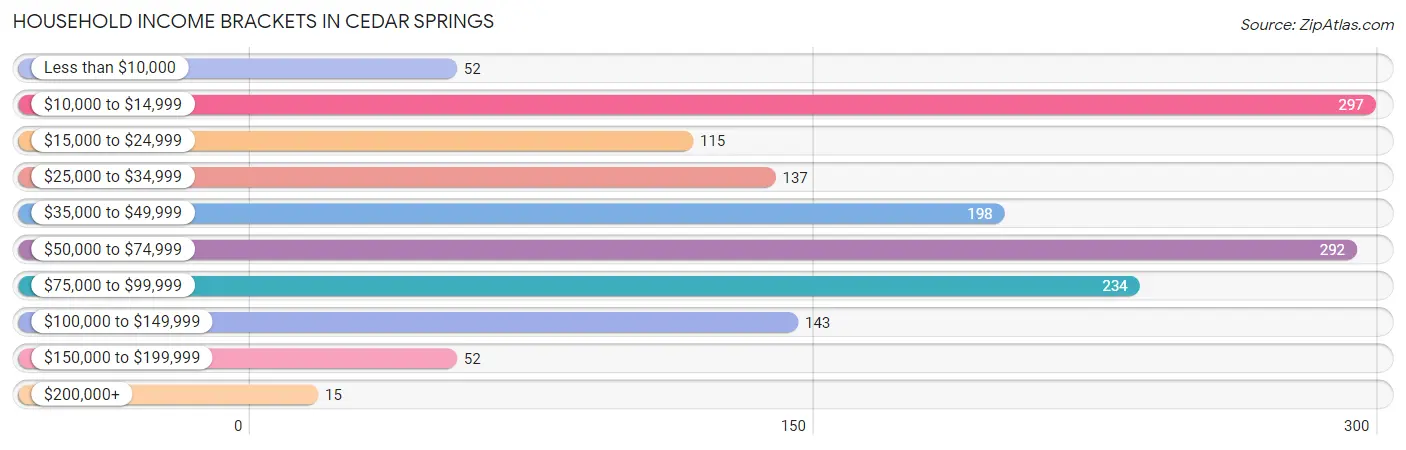
| Income Bracket | # Households | % Households |
| Less than $10,000 | 52 | 3.4% |
| $10,000 to $14,999 | 297 | 19.3% |
| $15,000 to $24,999 | 115 | 7.5% |
| $25,000 to $34,999 | 137 | 8.9% |
| $35,000 to $49,999 | 198 | 12.9% |
| $50,000 to $74,999 | 292 | 19.0% |
| $75,000 to $99,999 | 234 | 15.2% |
| $100,000 to $149,999 | 143 | 9.3% |
| $150,000 to $199,999 | 52 | 3.4% |
| $200,000+ | 15 | 1.0% |
Household Income by Householder Age in Cedar Springs
The median household income in Cedar Springs is $47,300, with the highest median household income of $119,531 found in the 15 to 24 years age bracket for the primary householder. A total of 67 households (4.4%) fall into this category. Meanwhile, the 45 to 64 years age bracket for the primary householder has the lowest median household income of $0, with 725 households (47.2%) in this group.
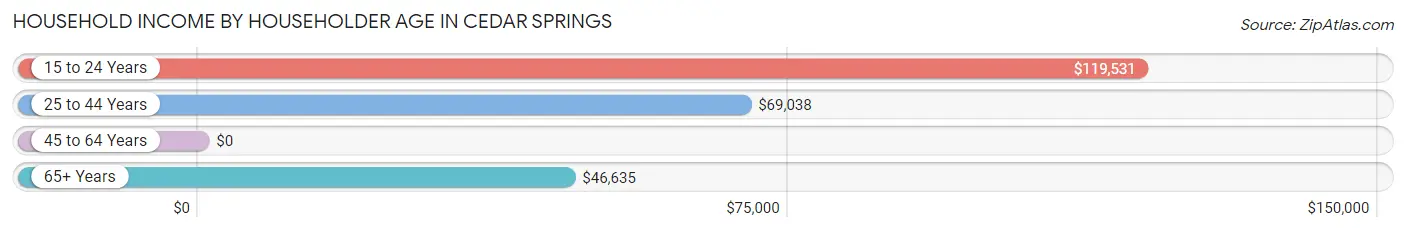
| Income Bracket | # Households | Median Income |
| 15 to 24 Years | 67 (4.4%) | $119,531 |
| 25 to 44 Years | 478 (31.1%) | $69,038 |
| 45 to 64 Years | 725 (47.2%) | $0 |
| 65+ Years | 267 (17.4%) | $46,635 |
| Total | 1,537 (100.0%) | $47,300 |
Poverty in Cedar Springs
Income Below Poverty by Sex and Age in Cedar Springs
With 19.7% poverty level for males and 28.3% for females among the residents of Cedar Springs, 5 year old males and 55 to 64 year old females are the most vulnerable to poverty, with 35 males (100.0%) and 221 females (60.6%) in their respective age groups living below the poverty level.
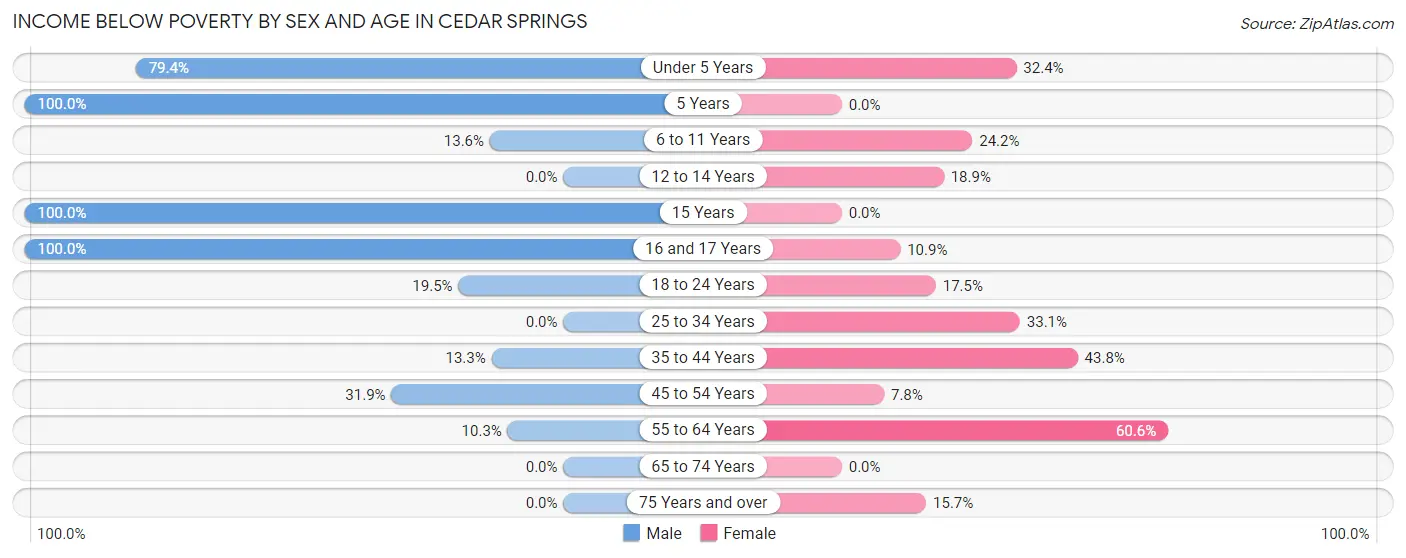
| Age Bracket | Male | Female |
| Under 5 Years | 50 (79.4%) | 35 (32.4%) |
| 5 Years | 35 (100.0%) | 0 (0.0%) |
| 6 to 11 Years | 12 (13.6%) | 39 (24.2%) |
| 12 to 14 Years | 0 (0.0%) | 14 (18.9%) |
| 15 Years | 27 (100.0%) | 0 (0.0%) |
| 16 and 17 Years | 14 (100.0%) | 14 (10.8%) |
| 18 to 24 Years | 30 (19.5%) | 26 (17.4%) |
| 25 to 34 Years | 0 (0.0%) | 77 (33.1%) |
| 35 to 44 Years | 36 (13.3%) | 109 (43.8%) |
| 45 to 54 Years | 68 (31.9%) | 28 (7.8%) |
| 55 to 64 Years | 24 (10.3%) | 221 (60.6%) |
| 65 to 74 Years | 0 (0.0%) | 0 (0.0%) |
| 75 Years and over | 0 (0.0%) | 23 (15.7%) |
| Total | 296 (19.7%) | 586 (28.3%) |
Income Above Poverty by Sex and Age in Cedar Springs
According to the poverty statistics in Cedar Springs, males aged 12 to 14 years and females aged 5 years are the age groups that are most secure financially, with 100.0% of males and 100.0% of females in these age groups living above the poverty line.
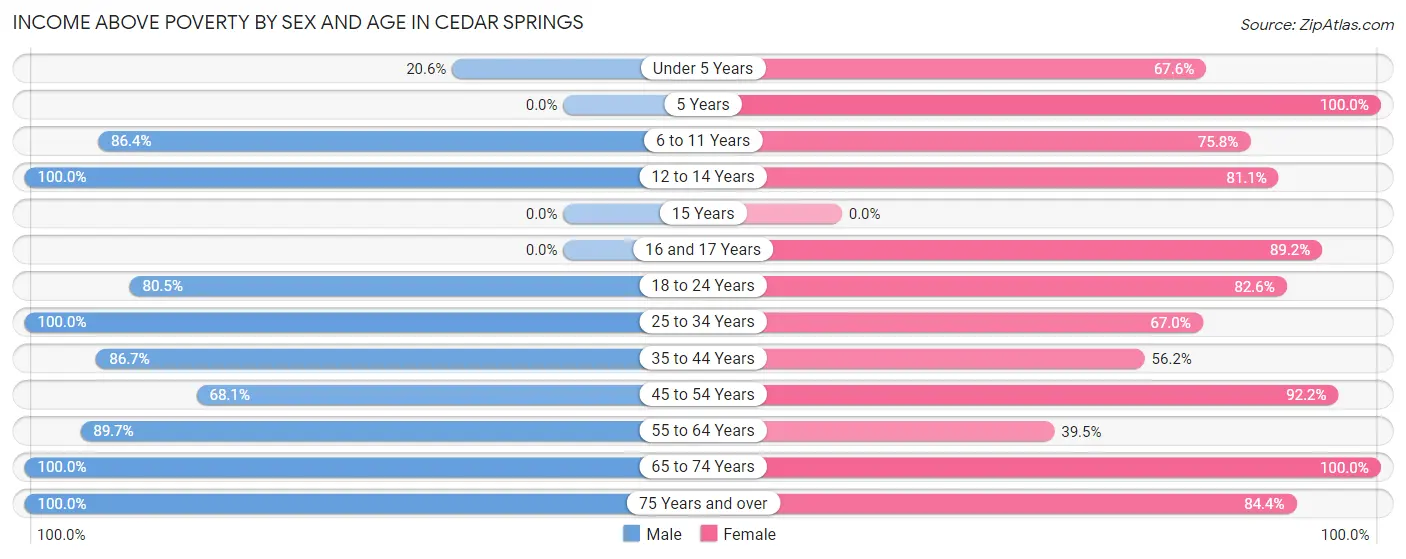
| Age Bracket | Male | Female |
| Under 5 Years | 13 (20.6%) | 73 (67.6%) |
| 5 Years | 0 (0.0%) | 18 (100.0%) |
| 6 to 11 Years | 76 (86.4%) | 122 (75.8%) |
| 12 to 14 Years | 93 (100.0%) | 60 (81.1%) |
| 15 Years | 0 (0.0%) | 0 (0.0%) |
| 16 and 17 Years | 0 (0.0%) | 115 (89.1%) |
| 18 to 24 Years | 124 (80.5%) | 123 (82.6%) |
| 25 to 34 Years | 190 (100.0%) | 156 (66.9%) |
| 35 to 44 Years | 234 (86.7%) | 140 (56.2%) |
| 45 to 54 Years | 145 (68.1%) | 329 (92.2%) |
| 55 to 64 Years | 208 (89.7%) | 144 (39.5%) |
| 65 to 74 Years | 76 (100.0%) | 82 (100.0%) |
| 75 Years and over | 49 (100.0%) | 124 (84.4%) |
| Total | 1,208 (80.3%) | 1,486 (71.7%) |
Income Below Poverty Among Married-Couple Families in Cedar Springs
The poverty statistics for married-couple families in Cedar Springs show that 2.3% or 11 of the total 478 families live below the poverty line. Families with no children have the highest poverty rate of 3.1%, comprising of 11 families. On the other hand, families with 1 or 2 children have the lowest poverty rate of 0.0%, which includes 0 families.
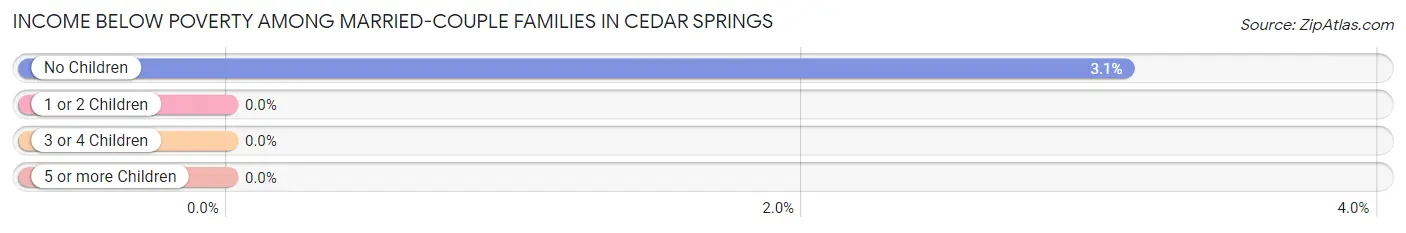
| Children | Above Poverty | Below Poverty |
| No Children | 342 (96.9%) | 11 (3.1%) |
| 1 or 2 Children | 115 (100.0%) | 0 (0.0%) |
| 3 or 4 Children | 10 (100.0%) | 0 (0.0%) |
| 5 or more Children | 0 (0.0%) | 0 (0.0%) |
| Total | 467 (97.7%) | 11 (2.3%) |
Income Below Poverty Among Single-Parent Households in Cedar Springs
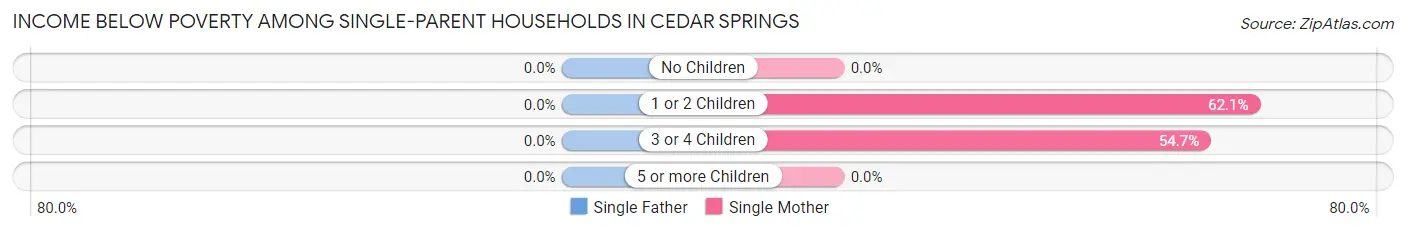
| Children | Single Father | Single Mother |
| No Children | 0 (0.0%) | 0 (0.0%) |
| 1 or 2 Children | 0 (0.0%) | 54 (62.1%) |
| 3 or 4 Children | 0 (0.0%) | 52 (54.7%) |
| 5 or more Children | 0 (0.0%) | 0 (0.0%) |
| Total | 0 (0.0%) | 106 (39.0%) |
Income Below Poverty Among Married-Couple vs Single-Parent Households in Cedar Springs
The poverty data for Cedar Springs shows that 11 of the married-couple family households (2.3%) and 106 of the single-parent households (26.3%) are living below the poverty level. Within the married-couple family households, those with no children have the highest poverty rate, with 11 households (3.1%) falling below the poverty line. Among the single-parent households, those with 3 or 4 children have the highest poverty rate, with 52 household (46.4%) living below poverty.
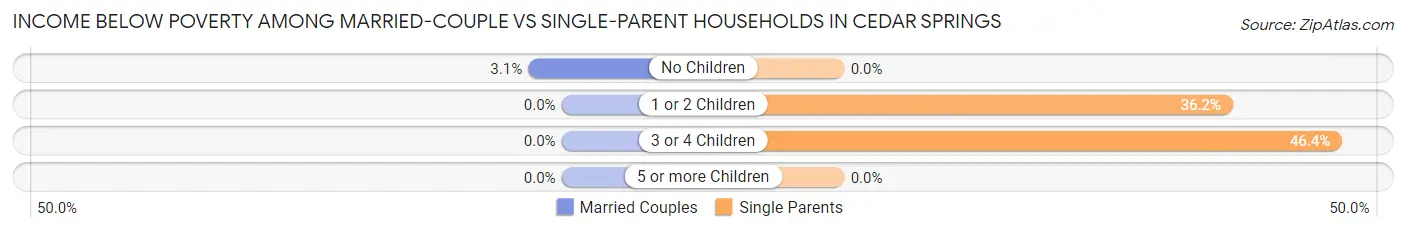
| Children | Married-Couple Families | Single-Parent Households |
| No Children | 11 (3.1%) | 0 (0.0%) |
| 1 or 2 Children | 0 (0.0%) | 54 (36.2%) |
| 3 or 4 Children | 0 (0.0%) | 52 (46.4%) |
| 5 or more Children | 0 (0.0%) | 0 (0.0%) |
| Total | 11 (2.3%) | 106 (26.3%) |
Race in Cedar Springs
The most populous races in Cedar Springs are White / Caucasian (3,323 | 91.1%), Hispanic or Latino (283 | 7.8%), and Two or more Races (236 | 6.5%).
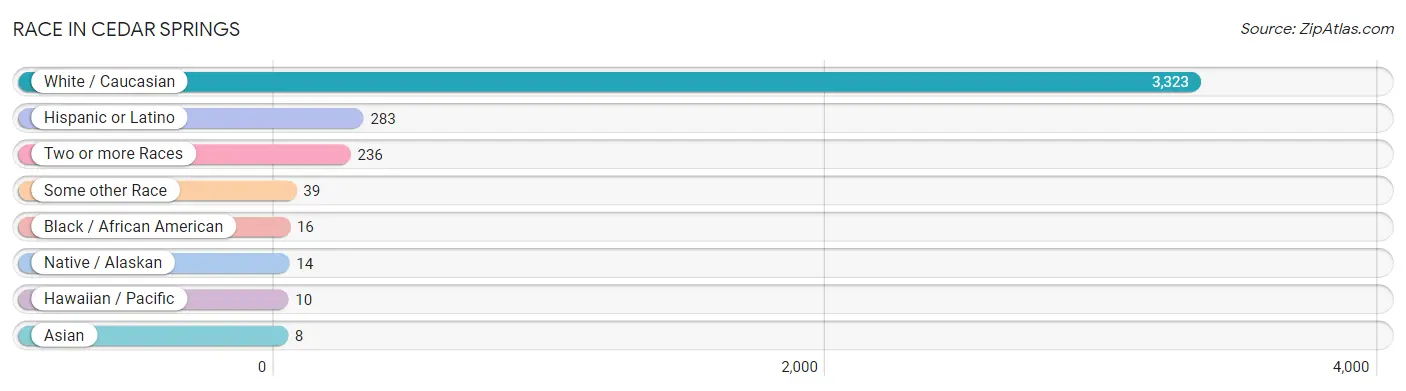
| Race | # Population | % Population |
| Asian | 8 | 0.2% |
| Black / African American | 16 | 0.4% |
| Hawaiian / Pacific | 10 | 0.3% |
| Hispanic or Latino | 283 | 7.8% |
| Native / Alaskan | 14 | 0.4% |
| White / Caucasian | 3,323 | 91.1% |
| Two or more Races | 236 | 6.5% |
| Some other Race | 39 | 1.1% |
| Total | 3,646 | 100.0% |
Ancestry in Cedar Springs
The most populous ancestries reported in Cedar Springs are German (581 | 15.9%), Dutch (532 | 14.6%), Irish (448 | 12.3%), English (325 | 8.9%), and Polish (294 | 8.1%), together accounting for 59.8% of all Cedar Springs residents.
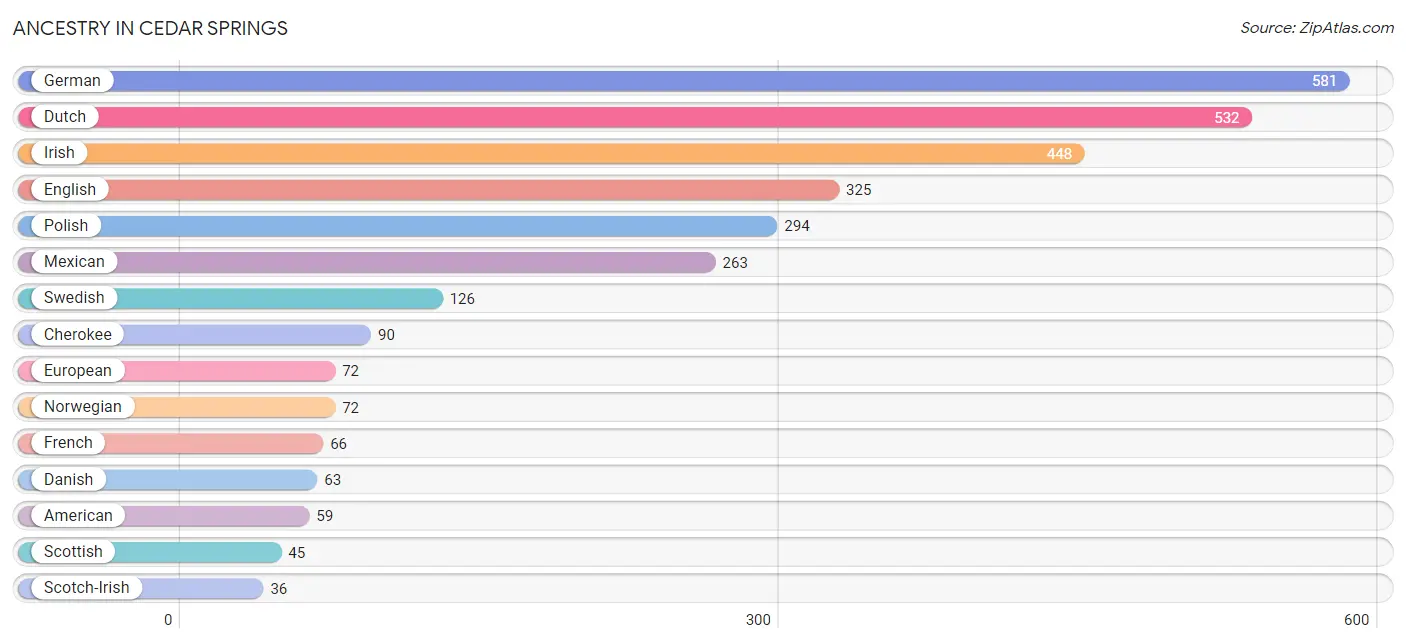
| Ancestry | # Population | % Population |
| American | 59 | 1.6% |
| Arab | 16 | 0.4% |
| Cherokee | 90 | 2.5% |
| Danish | 63 | 1.7% |
| Dutch | 532 | 14.6% |
| English | 325 | 8.9% |
| European | 72 | 2.0% |
| French | 66 | 1.8% |
| French Canadian | 13 | 0.4% |
| German | 581 | 15.9% |
| Irish | 448 | 12.3% |
| Italian | 18 | 0.5% |
| Lebanese | 16 | 0.4% |
| Lithuanian | 8 | 0.2% |
| Mexican | 263 | 7.2% |
| Native Hawaiian | 10 | 0.3% |
| Norwegian | 72 | 2.0% |
| Ottawa | 14 | 0.4% |
| Polish | 294 | 8.1% |
| Portuguese | 9 | 0.3% |
| Puerto Rican | 20 | 0.5% |
| Scotch-Irish | 36 | 1.0% |
| Scottish | 45 | 1.2% |
| Swedish | 126 | 3.5% | View All 24 Rows |
Immigrants in Cedar Springs
The most numerous immigrant groups reported in Cedar Springs came from Asia (8 | 0.2%), South Eastern Asia (8 | 0.2%), and Vietnam (8 | 0.2%), together accounting for 0.7% of all Cedar Springs residents.
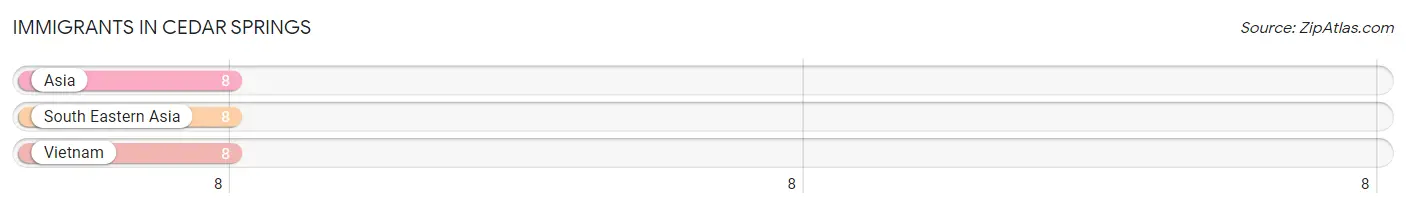
| Immigration Origin | # Population | % Population |
| Asia | 8 | 0.2% |
| South Eastern Asia | 8 | 0.2% |
| Vietnam | 8 | 0.2% | View All 3 Rows |
Sex and Age in Cedar Springs
Sex and Age in Cedar Springs
The most populous age groups in Cedar Springs are 40 to 44 Years (164 | 10.7%) for men and 60 to 64 Years (279 | 13.2%) for women.
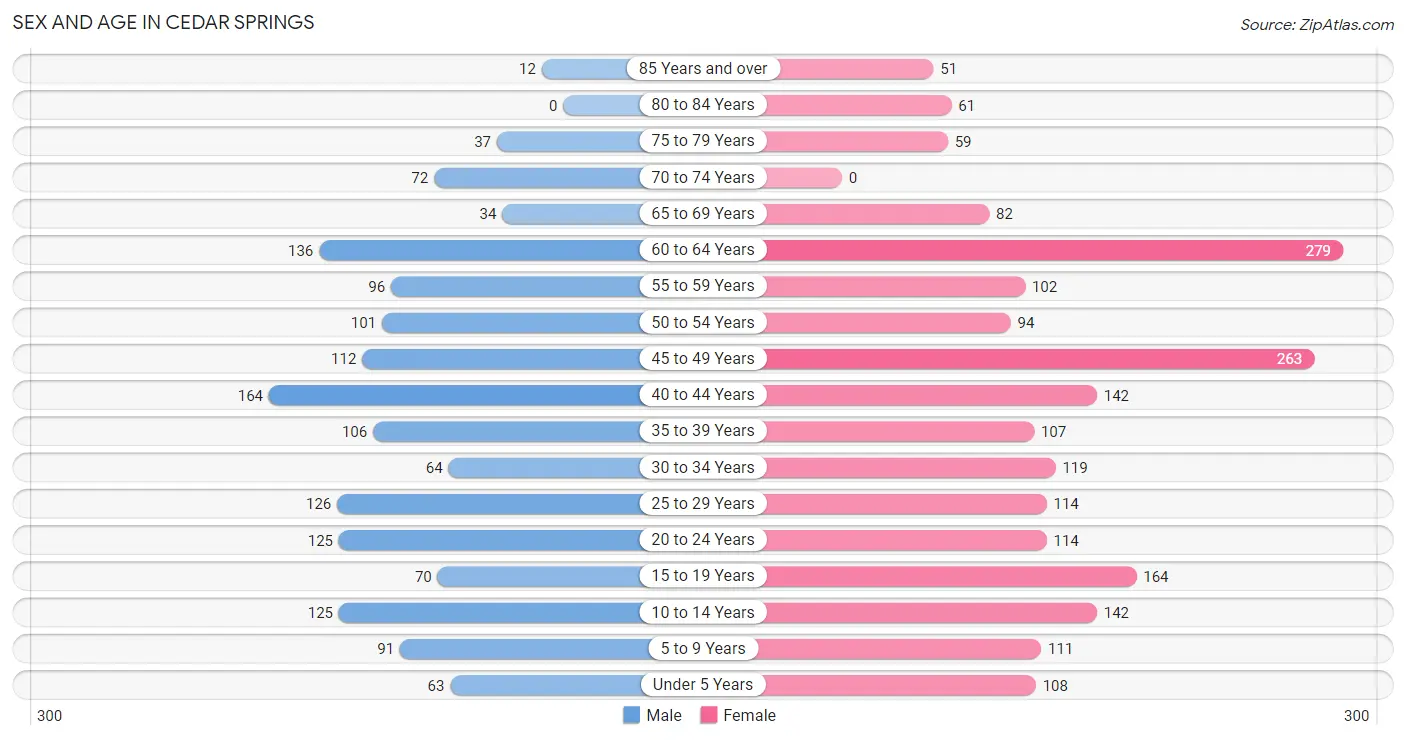
| Age Bracket | Male | Female |
| Under 5 Years | 63 (4.1%) | 108 (5.1%) |
| 5 to 9 Years | 91 (5.9%) | 111 (5.3%) |
| 10 to 14 Years | 125 (8.2%) | 142 (6.7%) |
| 15 to 19 Years | 70 (4.6%) | 164 (7.8%) |
| 20 to 24 Years | 125 (8.2%) | 114 (5.4%) |
| 25 to 29 Years | 126 (8.2%) | 114 (5.4%) |
| 30 to 34 Years | 64 (4.2%) | 119 (5.6%) |
| 35 to 39 Years | 106 (6.9%) | 107 (5.1%) |
| 40 to 44 Years | 164 (10.7%) | 142 (6.7%) |
| 45 to 49 Years | 112 (7.3%) | 263 (12.4%) |
| 50 to 54 Years | 101 (6.6%) | 94 (4.4%) |
| 55 to 59 Years | 96 (6.3%) | 102 (4.8%) |
| 60 to 64 Years | 136 (8.9%) | 279 (13.2%) |
| 65 to 69 Years | 34 (2.2%) | 82 (3.9%) |
| 70 to 74 Years | 72 (4.7%) | 0 (0.0%) |
| 75 to 79 Years | 37 (2.4%) | 59 (2.8%) |
| 80 to 84 Years | 0 (0.0%) | 61 (2.9%) |
| 85 Years and over | 12 (0.8%) | 51 (2.4%) |
| Total | 1,534 (100.0%) | 2,112 (100.0%) |
Families and Households in Cedar Springs
Median Family Size in Cedar Springs
The median family size in Cedar Springs is 2.91 persons per family, with single female/mother families (272 | 30.9%) accounting for the largest median family size of 3.07 persons per family. On the other hand, single male/father families (131 | 14.9%) represent the smallest median family size with 2.53 persons per family.
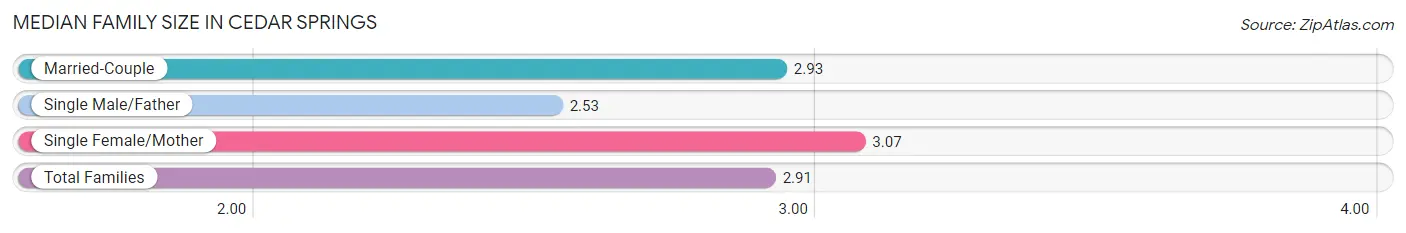
| Family Type | # Families | Family Size |
| Married-Couple | 478 (54.3%) | 2.93 |
| Single Male/Father | 131 (14.9%) | 2.53 |
| Single Female/Mother | 272 (30.9%) | 3.07 |
| Total Families | 881 (100.0%) | 2.91 |
Median Household Size in Cedar Springs
The median household size in Cedar Springs is 2.32 persons per household, with single male/father households (131 | 8.5%) accounting for the largest median household size of 3.37 persons per household. non-family households (656 | 42.7%) represent the smallest median household size with 1.26 persons per household.
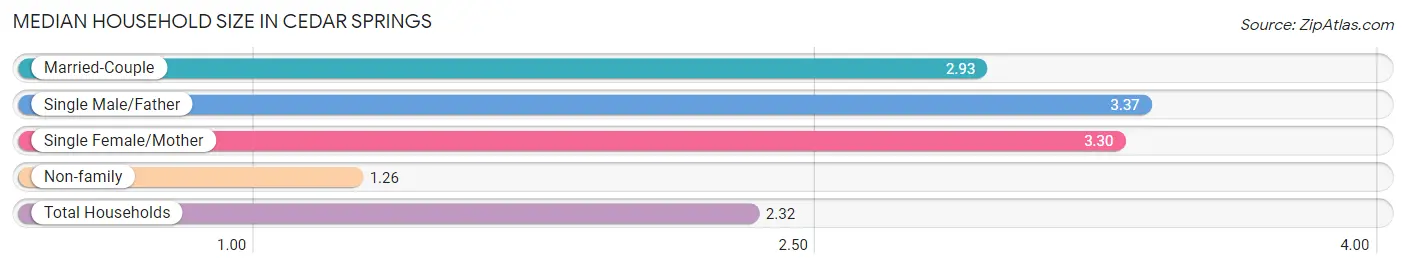
| Household Type | # Households | Household Size |
| Married-Couple | 478 (31.1%) | 2.93 |
| Single Male/Father | 131 (8.5%) | 3.37 |
| Single Female/Mother | 272 (17.7%) | 3.30 |
| Non-family | 656 (42.7%) | 1.26 |
| Total Households | 1,537 (100.0%) | 2.32 |
Household Size by Marriage Status in Cedar Springs
Out of a total of 1,537 households in Cedar Springs, 881 (57.3%) are family households, while 656 (42.7%) are nonfamily households. The most numerous type of family households are 2-person households, comprising 414, and the most common type of nonfamily households are 1-person households, comprising 501.
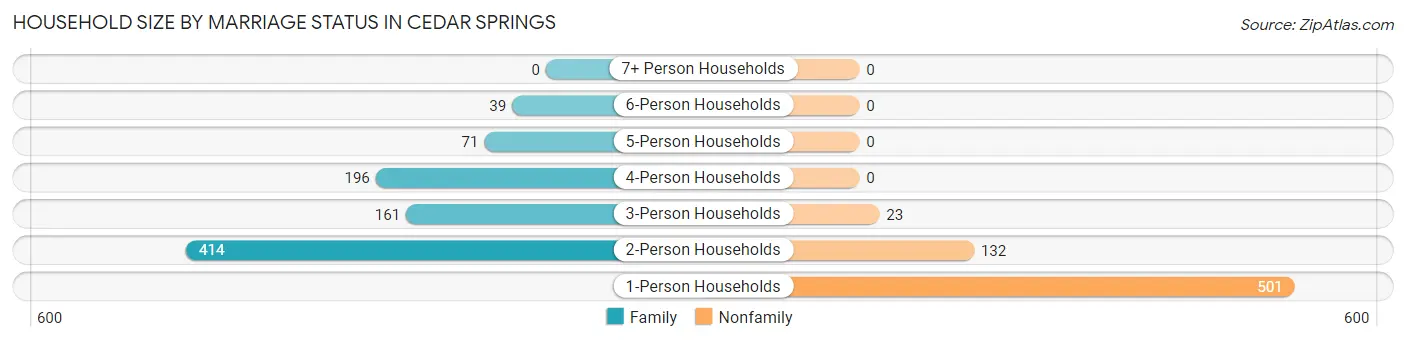
| Household Size | Family Households | Nonfamily Households |
| 1-Person Households | - | 501 (32.6%) |
| 2-Person Households | 414 (26.9%) | 132 (8.6%) |
| 3-Person Households | 161 (10.5%) | 23 (1.5%) |
| 4-Person Households | 196 (12.8%) | 0 (0.0%) |
| 5-Person Households | 71 (4.6%) | 0 (0.0%) |
| 6-Person Households | 39 (2.5%) | 0 (0.0%) |
| 7+ Person Households | 0 (0.0%) | 0 (0.0%) |
| Total | 881 (57.3%) | 656 (42.7%) |
Female Fertility in Cedar Springs
Fertility by Age in Cedar Springs
Average fertility rate in Cedar Springs is 50.0 births per 1,000 women. Women in the age bracket of 35 to 50 years have the highest fertility rate with 98.0 births per 1,000 women. Women in the age bracket of 35 to 50 years acount for 100.0% of all women with births.
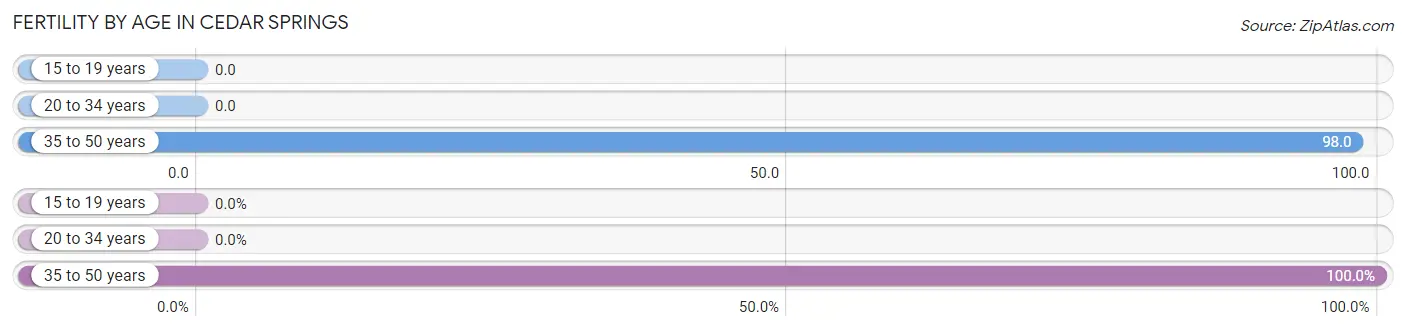
| Age Bracket | Women with Births | Births / 1,000 Women |
| 15 to 19 years | 0 (0.0%) | 0.0 |
| 20 to 34 years | 0 (0.0%) | 0.0 |
| 35 to 50 years | 52 (100.0%) | 98.0 |
| Total | 52 (100.0%) | 50.0 |
Fertility by Age by Marriage Status in Cedar Springs
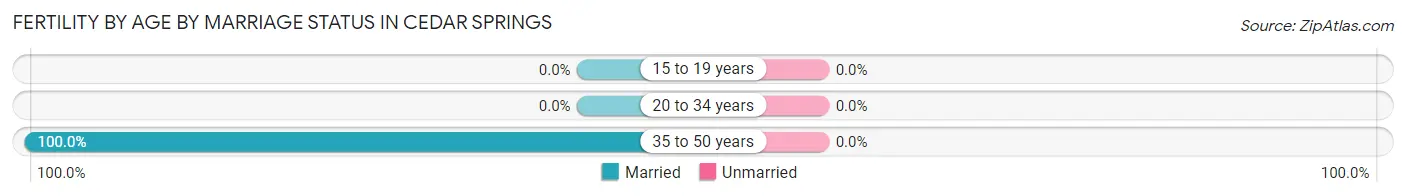
| Age Bracket | Married | Unmarried |
| 15 to 19 years | 0 (0.0%) | 0 (0.0%) |
| 20 to 34 years | 0 (0.0%) | 0 (0.0%) |
| 35 to 50 years | 52 (100.0%) | 0 (0.0%) |
| Total | 52 (100.0%) | 0 (0.0%) |
Fertility by Education in Cedar Springs
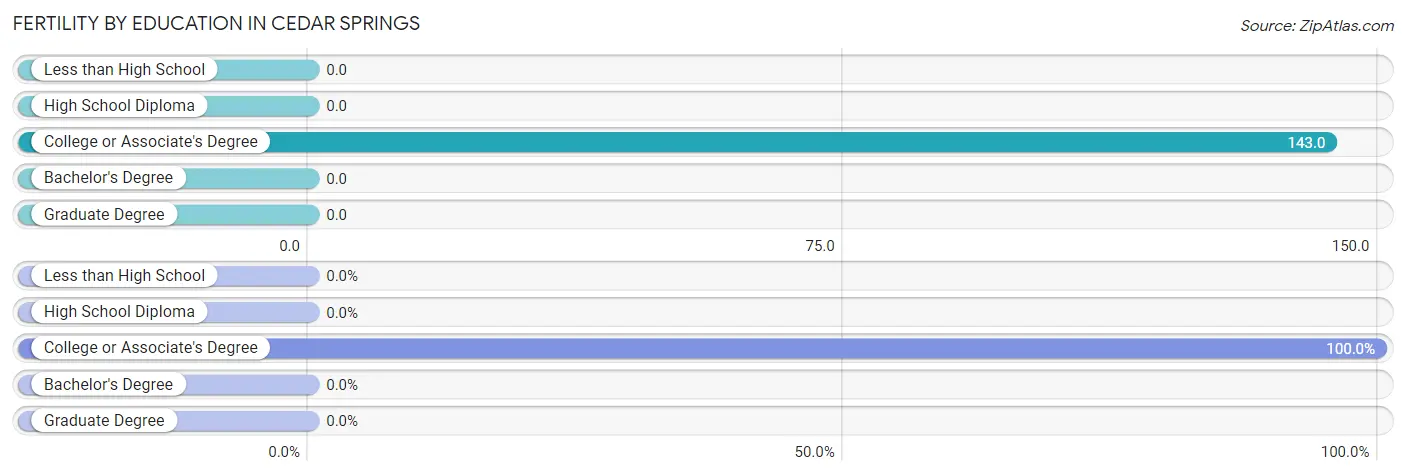
| Educational Attainment | Women with Births | Births / 1,000 Women |
| Less than High School | 0 (0.0%) | 0.0 |
| High School Diploma | 0 (0.0%) | 0.0 |
| College or Associate's Degree | 52 (100.0%) | 143.0 |
| Bachelor's Degree | 0 (0.0%) | 0.0 |
| Graduate Degree | 0 (0.0%) | 0.0 |
| Total | 52 (100.0%) | 50.0 |
Fertility by Education by Marriage Status in Cedar Springs
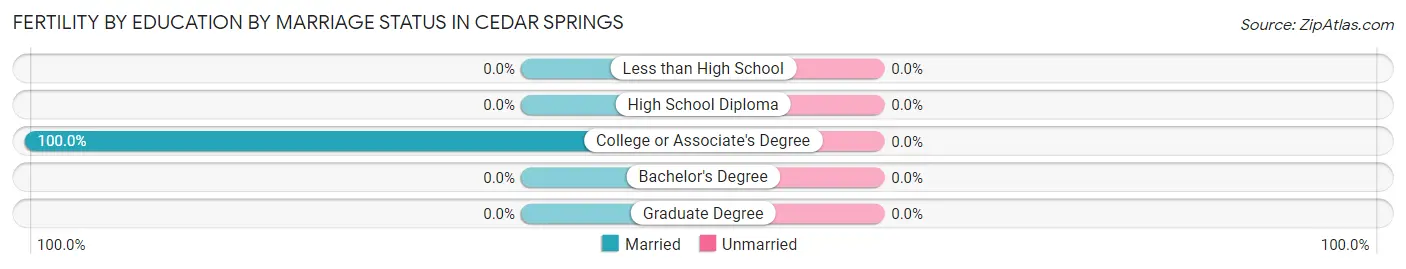
| Educational Attainment | Married | Unmarried |
| Less than High School | 0 (0.0%) | 0 (0.0%) |
| High School Diploma | 0 (0.0%) | 0 (0.0%) |
| College or Associate's Degree | 52 (100.0%) | 0 (0.0%) |
| Bachelor's Degree | 0 (0.0%) | 0 (0.0%) |
| Graduate Degree | 0 (0.0%) | 0 (0.0%) |
| Total | 52 (100.0%) | 0 (0.0%) |
Employment Characteristics in Cedar Springs
Employment by Class of Employer in Cedar Springs
Among the 1,773 employed individuals in Cedar Springs, private company employees (1,381 | 77.9%), not-for-profit organizations (154 | 8.7%), and self-employed (not incorporated) (81 | 4.6%) make up the most common classes of employment.
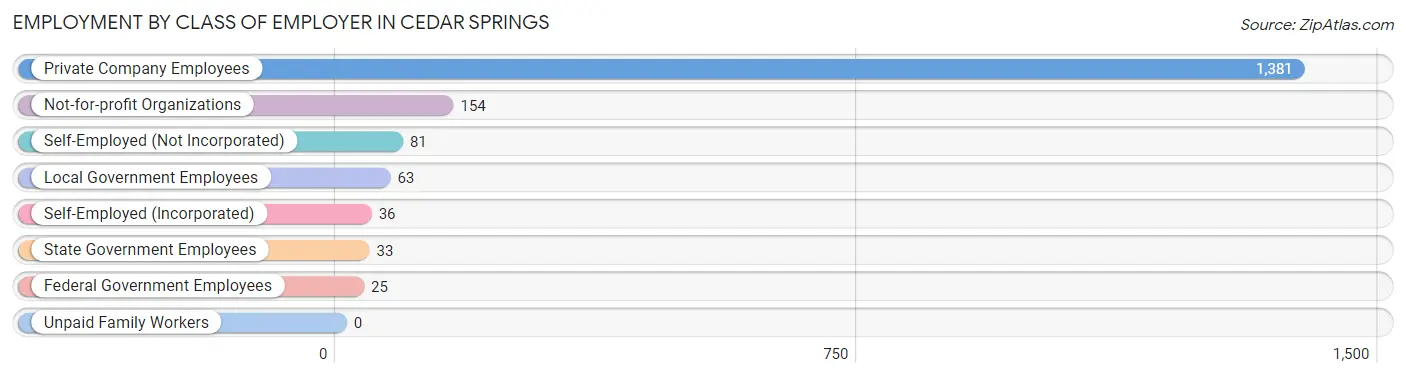
| Employer Class | # Employees | % Employees |
| Private Company Employees | 1,381 | 77.9% |
| Self-Employed (Incorporated) | 36 | 2.0% |
| Self-Employed (Not Incorporated) | 81 | 4.6% |
| Not-for-profit Organizations | 154 | 8.7% |
| Local Government Employees | 63 | 3.5% |
| State Government Employees | 33 | 1.9% |
| Federal Government Employees | 25 | 1.4% |
| Unpaid Family Workers | 0 | 0.0% |
| Total | 1,773 | 100.0% |
Employment Status by Age in Cedar Springs
According to the labor force statistics for Cedar Springs, out of the total population over 16 years of age (2,979), 64.5% or 1,921 individuals are in the labor force, with 7.1% or 136 of them unemployed. The age group with the highest labor force participation rate is 20 to 24 years, with 100.0% or 239 individuals in the labor force. Within the labor force, the 45 to 54 years age range has the highest percentage of unemployed individuals, with 13.1% or 64 of them being unemployed.
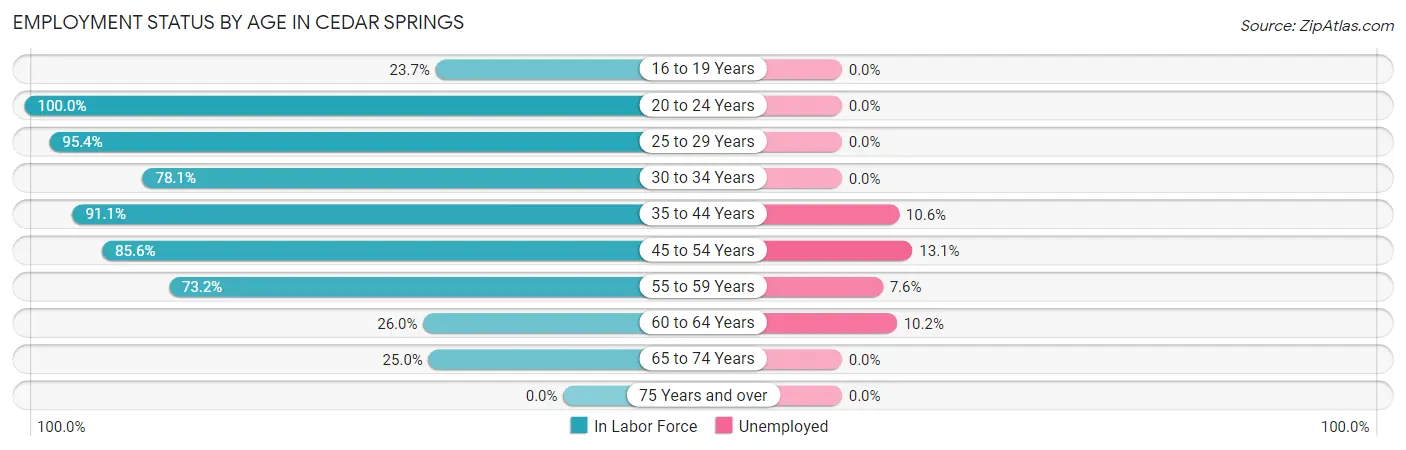
| Age Bracket | In Labor Force | Unemployed |
| 16 to 19 Years | 49 (23.7%) | 0 (0.0%) |
| 20 to 24 Years | 239 (100.0%) | 0 (0.0%) |
| 25 to 29 Years | 229 (95.4%) | 0 (0.0%) |
| 30 to 34 Years | 143 (78.1%) | 0 (0.0%) |
| 35 to 44 Years | 473 (91.1%) | 50 (10.6%) |
| 45 to 54 Years | 488 (85.6%) | 64 (13.1%) |
| 55 to 59 Years | 145 (73.2%) | 11 (7.6%) |
| 60 to 64 Years | 108 (26.0%) | 11 (10.2%) |
| 65 to 74 Years | 47 (25.0%) | 0 (0.0%) |
| 75 Years and over | 0 (0.0%) | 0 (0.0%) |
| Total | 1,921 (64.5%) | 136 (7.1%) |
Employment Status by Educational Attainment in Cedar Springs
According to labor force statistics for Cedar Springs, 74.6% of individuals (1,585) out of the total population between 25 and 64 years of age (2,125) are in the labor force, with 8.6% or 136 of them being unemployed. The group with the highest labor force participation rate are those with the educational attainment of bachelor's degree or higher, with 94.1% or 254 individuals in the labor force. Within the labor force, individuals with less than high school education have the highest percentage of unemployment, with 39.3% or 33 of them being unemployed.
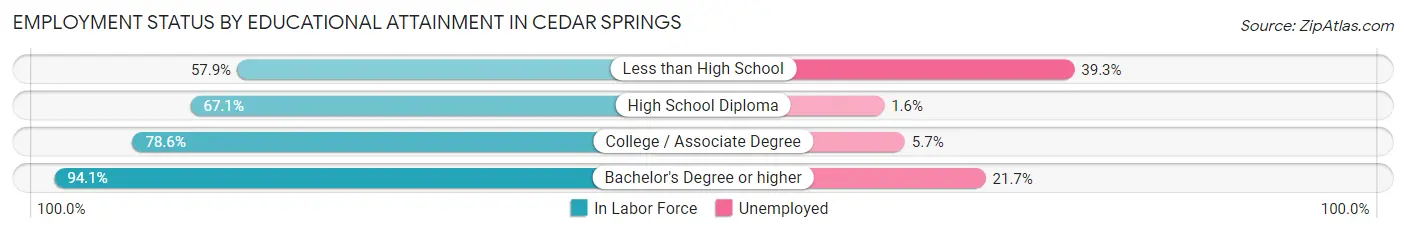
| Educational Attainment | In Labor Force | Unemployed |
| Less than High School | 84 (57.9%) | 57 (39.3%) |
| High School Diploma | 558 (67.1%) | 13 (1.6%) |
| College / Associate Degree | 690 (78.6%) | 50 (5.7%) |
| Bachelor's Degree or higher | 254 (94.1%) | 59 (21.7%) |
| Total | 1,585 (74.6%) | 183 (8.6%) |
Employment Occupations by Sex in Cedar Springs
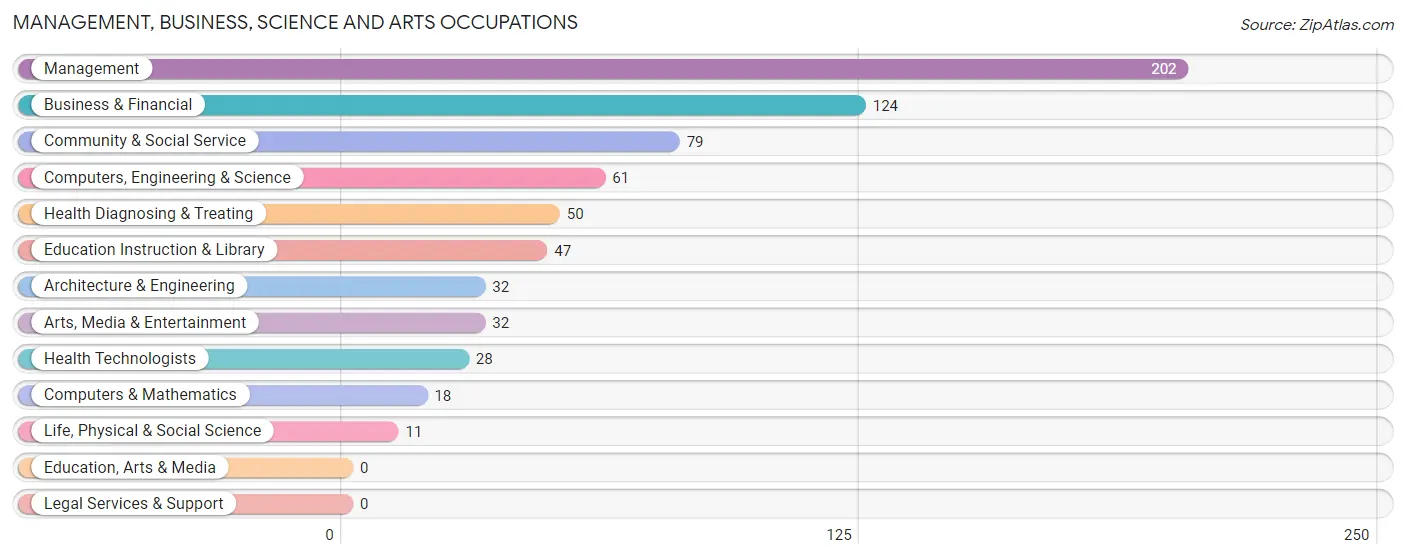
Management, Business, Science and Arts Occupations
The most common Management, Business, Science and Arts occupations in Cedar Springs are Management (202 | 11.3%), Business & Financial (124 | 7.0%), Community & Social Service (79 | 4.4%), Computers, Engineering & Science (61 | 3.4%), and Health Diagnosing & Treating (50 | 2.8%).
Management, Business, Science and Arts Occupations by Sex
Within the Management, Business, Science and Arts occupations in Cedar Springs, the most male-oriented occupations are Computers, Engineering & Science (100.0%), Computers & Mathematics (100.0%), and Architecture & Engineering (100.0%), while the most female-oriented occupations are Health Technologists (100.0%), Business & Financial (87.1%), and Health Diagnosing & Treating (82.0%).
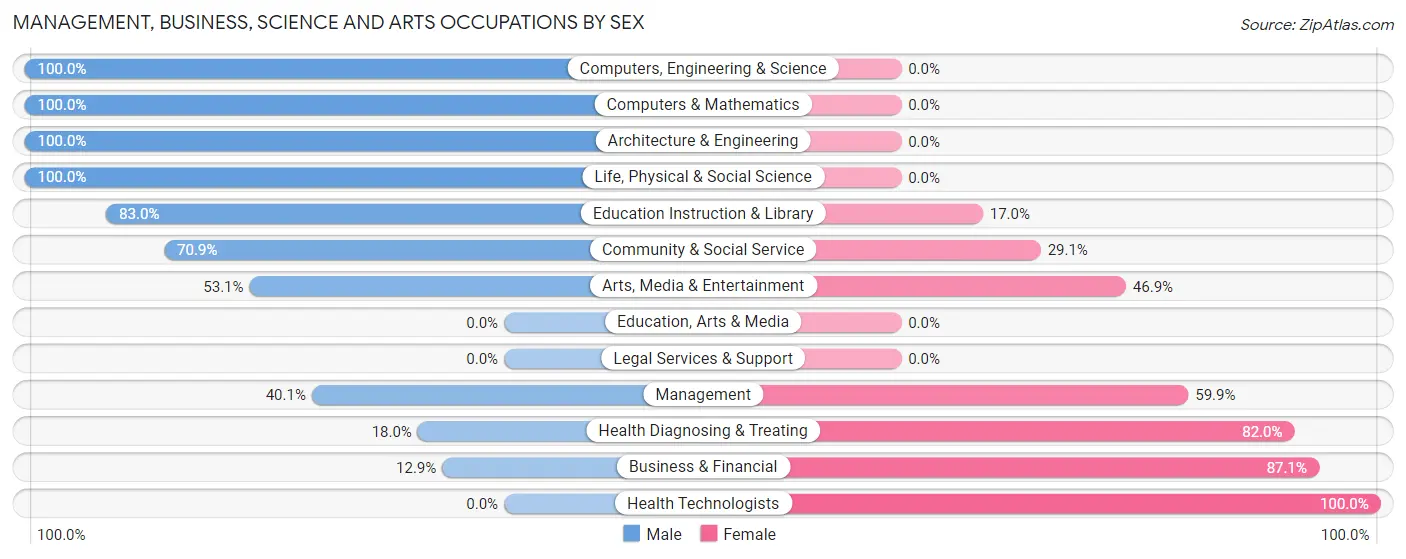
| Occupation | Male | Female |
| Management | 81 (40.1%) | 121 (59.9%) |
| Business & Financial | 16 (12.9%) | 108 (87.1%) |
| Computers, Engineering & Science | 61 (100.0%) | 0 (0.0%) |
| Computers & Mathematics | 18 (100.0%) | 0 (0.0%) |
| Architecture & Engineering | 32 (100.0%) | 0 (0.0%) |
| Life, Physical & Social Science | 11 (100.0%) | 0 (0.0%) |
| Community & Social Service | 56 (70.9%) | 23 (29.1%) |
| Education, Arts & Media | 0 (0.0%) | 0 (0.0%) |
| Legal Services & Support | 0 (0.0%) | 0 (0.0%) |
| Education Instruction & Library | 39 (83.0%) | 8 (17.0%) |
| Arts, Media & Entertainment | 17 (53.1%) | 15 (46.9%) |
| Health Diagnosing & Treating | 9 (18.0%) | 41 (82.0%) |
| Health Technologists | 0 (0.0%) | 28 (100.0%) |
| Total (Category) | 223 (43.2%) | 293 (56.8%) |
| Total (Overall) | 848 (47.5%) | 937 (52.5%) |
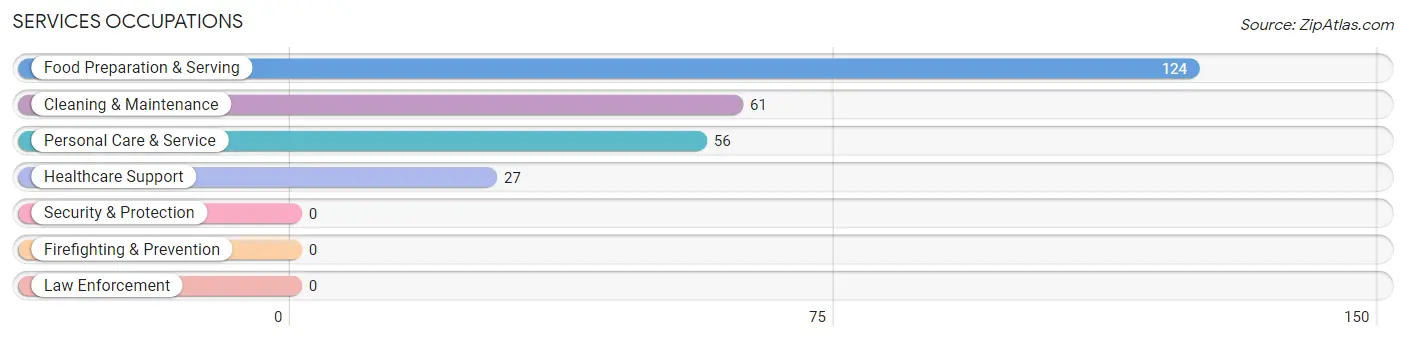
Services Occupations
The most common Services occupations in Cedar Springs are Food Preparation & Serving (124 | 7.0%), Cleaning & Maintenance (61 | 3.4%), Personal Care & Service (56 | 3.1%), and Healthcare Support (27 | 1.5%).
Services Occupations by Sex
Within the Services occupations in Cedar Springs, the most male-oriented occupations are Cleaning & Maintenance (47.5%), Food Preparation & Serving (40.3%), and Personal Care & Service (32.1%), while the most female-oriented occupations are Healthcare Support (100.0%), Personal Care & Service (67.9%), and Food Preparation & Serving (59.7%).
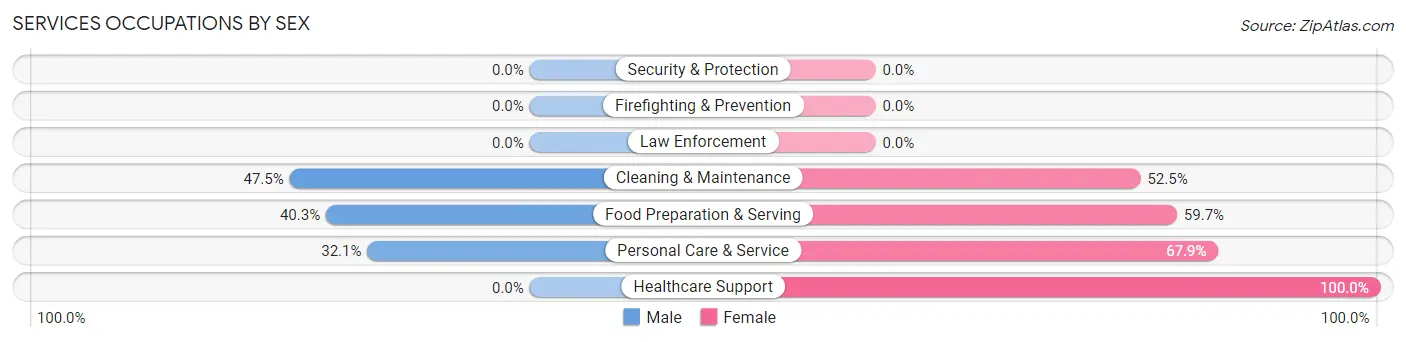
| Occupation | Male | Female |
| Healthcare Support | 0 (0.0%) | 27 (100.0%) |
| Security & Protection | 0 (0.0%) | 0 (0.0%) |
| Firefighting & Prevention | 0 (0.0%) | 0 (0.0%) |
| Law Enforcement | 0 (0.0%) | 0 (0.0%) |
| Food Preparation & Serving | 50 (40.3%) | 74 (59.7%) |
| Cleaning & Maintenance | 29 (47.5%) | 32 (52.5%) |
| Personal Care & Service | 18 (32.1%) | 38 (67.9%) |
| Total (Category) | 97 (36.2%) | 171 (63.8%) |
| Total (Overall) | 848 (47.5%) | 937 (52.5%) |
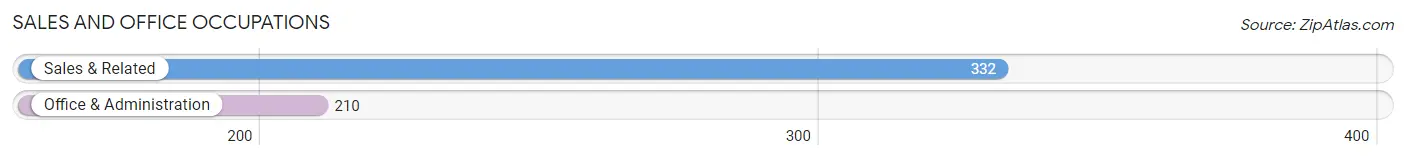
Sales and Office Occupations
The most common Sales and Office occupations in Cedar Springs are Sales & Related (332 | 18.6%), and Office & Administration (210 | 11.8%).
Sales and Office Occupations by Sex
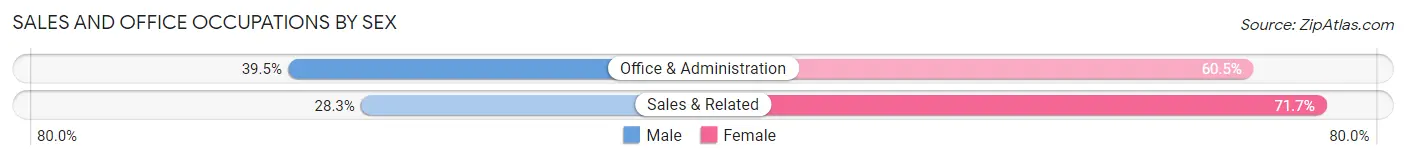
| Occupation | Male | Female |
| Sales & Related | 94 (28.3%) | 238 (71.7%) |
| Office & Administration | 83 (39.5%) | 127 (60.5%) |
| Total (Category) | 177 (32.7%) | 365 (67.3%) |
| Total (Overall) | 848 (47.5%) | 937 (52.5%) |
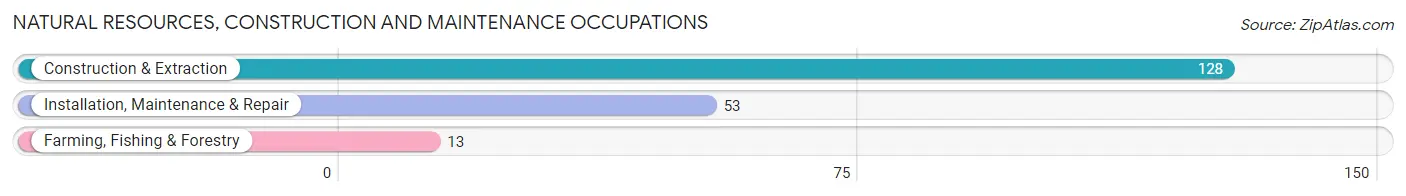
Natural Resources, Construction and Maintenance Occupations
The most common Natural Resources, Construction and Maintenance occupations in Cedar Springs are Construction & Extraction (128 | 7.2%), Installation, Maintenance & Repair (53 | 3.0%), and Farming, Fishing & Forestry (13 | 0.7%).
Natural Resources, Construction and Maintenance Occupations by Sex
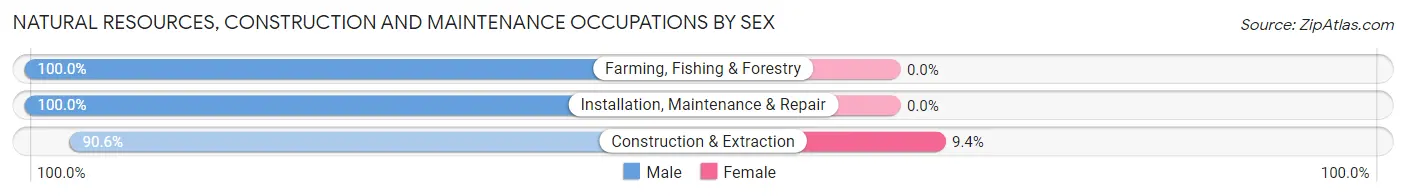
| Occupation | Male | Female |
| Farming, Fishing & Forestry | 13 (100.0%) | 0 (0.0%) |
| Construction & Extraction | 116 (90.6%) | 12 (9.4%) |
| Installation, Maintenance & Repair | 53 (100.0%) | 0 (0.0%) |
| Total (Category) | 182 (93.8%) | 12 (6.2%) |
| Total (Overall) | 848 (47.5%) | 937 (52.5%) |
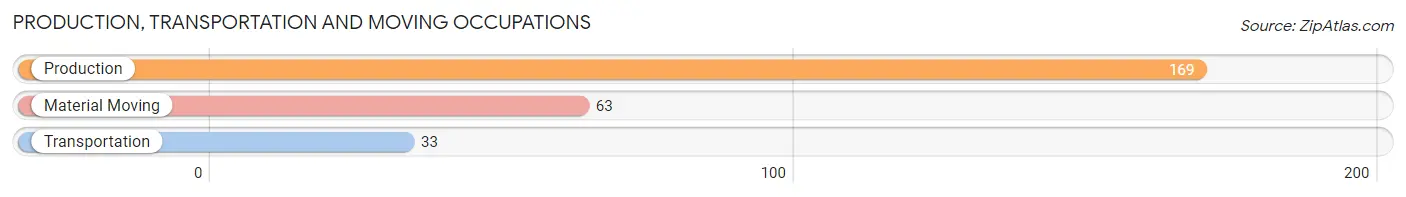
Production, Transportation and Moving Occupations
The most common Production, Transportation and Moving occupations in Cedar Springs are Production (169 | 9.5%), Material Moving (63 | 3.5%), and Transportation (33 | 1.8%).
Production, Transportation and Moving Occupations by Sex
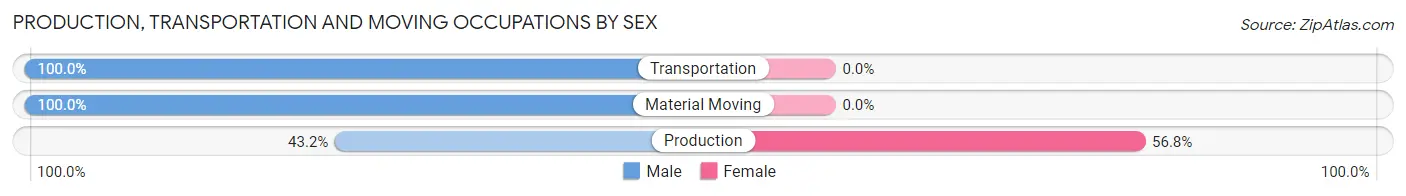
| Occupation | Male | Female |
| Production | 73 (43.2%) | 96 (56.8%) |
| Transportation | 33 (100.0%) | 0 (0.0%) |
| Material Moving | 63 (100.0%) | 0 (0.0%) |
| Total (Category) | 169 (63.8%) | 96 (36.2%) |
| Total (Overall) | 848 (47.5%) | 937 (52.5%) |
Employment Industries by Sex in Cedar Springs
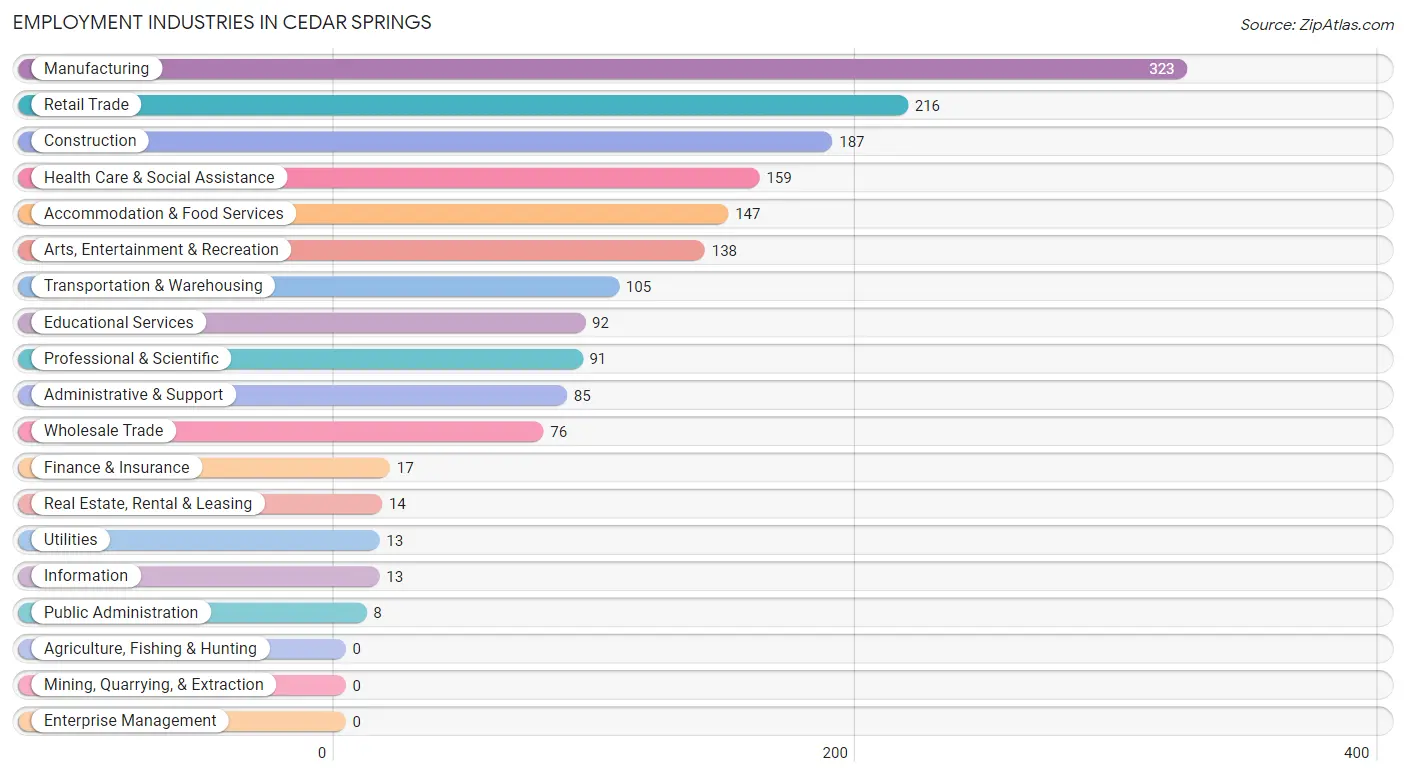
Employment Industries in Cedar Springs
The major employment industries in Cedar Springs include Manufacturing (323 | 18.1%), Retail Trade (216 | 12.1%), Construction (187 | 10.5%), Health Care & Social Assistance (159 | 8.9%), and Accommodation & Food Services (147 | 8.2%).
Employment Industries by Sex in Cedar Springs
The Cedar Springs industries that see more men than women are Utilities (100.0%), Educational Services (93.5%), and Administrative & Support (75.3%), whereas the industries that tend to have a higher number of women are Information (100.0%), Finance & Insurance (100.0%), and Real Estate, Rental & Leasing (100.0%).
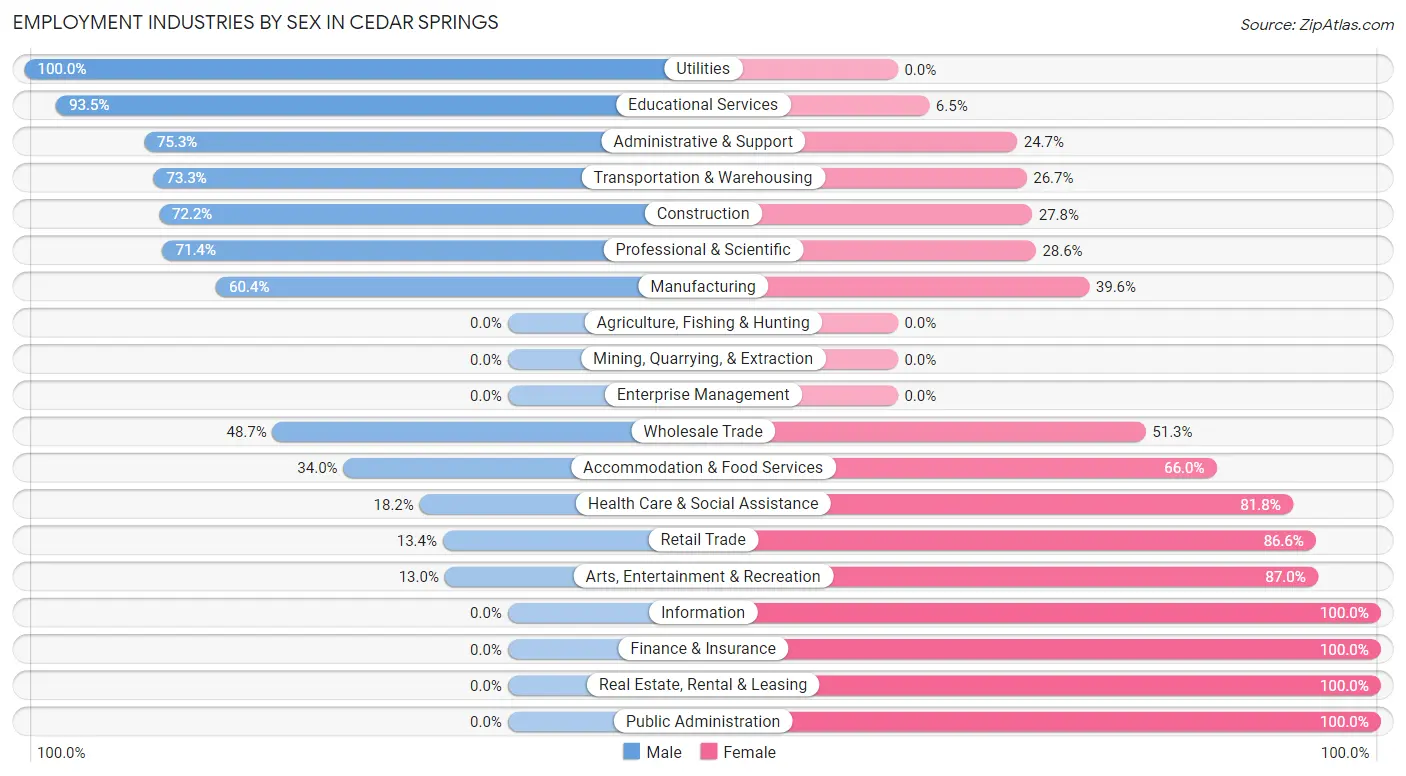
| Industry | Male | Female |
| Agriculture, Fishing & Hunting | 0 (0.0%) | 0 (0.0%) |
| Mining, Quarrying, & Extraction | 0 (0.0%) | 0 (0.0%) |
| Construction | 135 (72.2%) | 52 (27.8%) |
| Manufacturing | 195 (60.4%) | 128 (39.6%) |
| Wholesale Trade | 37 (48.7%) | 39 (51.3%) |
| Retail Trade | 29 (13.4%) | 187 (86.6%) |
| Transportation & Warehousing | 77 (73.3%) | 28 (26.7%) |
| Utilities | 13 (100.0%) | 0 (0.0%) |
| Information | 0 (0.0%) | 13 (100.0%) |
| Finance & Insurance | 0 (0.0%) | 17 (100.0%) |
| Real Estate, Rental & Leasing | 0 (0.0%) | 14 (100.0%) |
| Professional & Scientific | 65 (71.4%) | 26 (28.6%) |
| Enterprise Management | 0 (0.0%) | 0 (0.0%) |
| Administrative & Support | 64 (75.3%) | 21 (24.7%) |
| Educational Services | 86 (93.5%) | 6 (6.5%) |
| Health Care & Social Assistance | 29 (18.2%) | 130 (81.8%) |
| Arts, Entertainment & Recreation | 18 (13.0%) | 120 (87.0%) |
| Accommodation & Food Services | 50 (34.0%) | 97 (66.0%) |
| Public Administration | 0 (0.0%) | 8 (100.0%) |
| Total | 848 (47.5%) | 937 (52.5%) |
Education in Cedar Springs
School Enrollment in Cedar Springs
The most common levels of schooling among the 785 students in Cedar Springs are high school (220 | 28.0%), middle school (218 | 27.8%), and elementary school (164 | 20.9%).
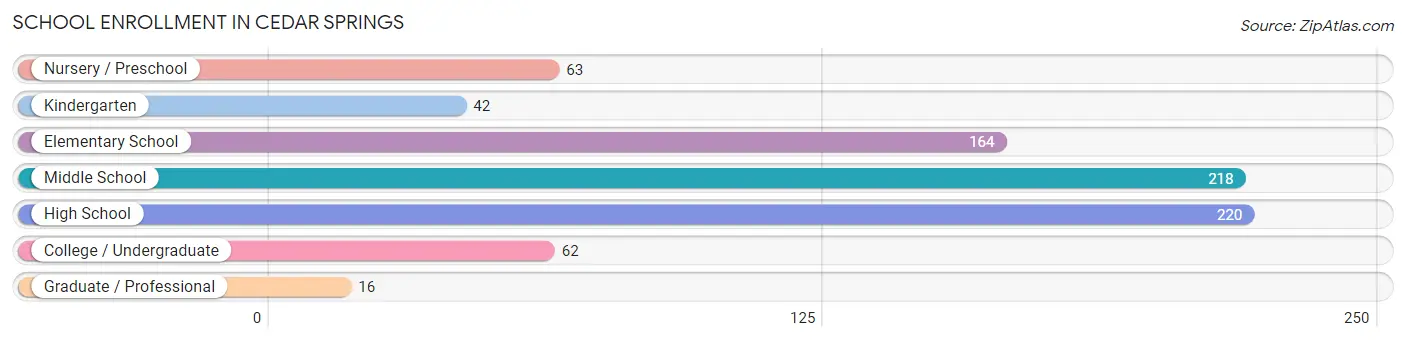
| School Level | # Students | % Students |
| Nursery / Preschool | 63 | 8.0% |
| Kindergarten | 42 | 5.3% |
| Elementary School | 164 | 20.9% |
| Middle School | 218 | 27.8% |
| High School | 220 | 28.0% |
| College / Undergraduate | 62 | 7.9% |
| Graduate / Professional | 16 | 2.0% |
| Total | 785 | 100.0% |
School Enrollment by Age by Funding Source in Cedar Springs
Out of a total of 785 students who are enrolled in schools in Cedar Springs, 67 (8.5%) attend a private institution, while the remaining 718 (91.5%) are enrolled in public schools. The age group of 35 years and over has the highest likelihood of being enrolled in private schools, with 12 (66.7% in the age bracket) enrolled. Conversely, the age group of 3 to 4 year olds has the lowest likelihood of being enrolled in a private school, with 52 (100.0% in the age bracket) attending a public institution.
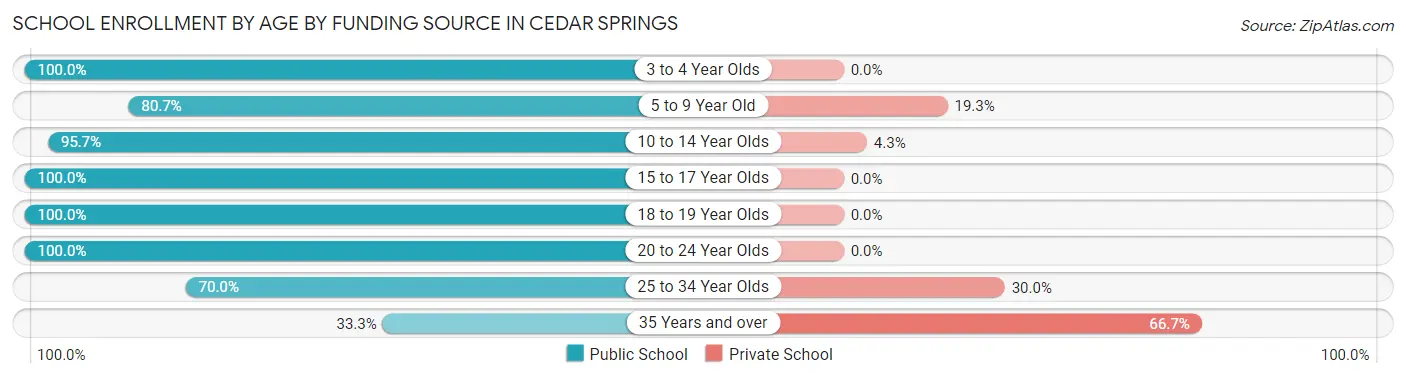
| Age Bracket | Public School | Private School |
| 3 to 4 Year Olds | 52 (100.0%) | 0 (0.0%) |
| 5 to 9 Year Old | 146 (80.7%) | 35 (19.3%) |
| 10 to 14 Year Olds | 243 (95.7%) | 11 (4.3%) |
| 15 to 17 Year Olds | 170 (100.0%) | 0 (0.0%) |
| 18 to 19 Year Olds | 64 (100.0%) | 0 (0.0%) |
| 20 to 24 Year Olds | 16 (100.0%) | 0 (0.0%) |
| 25 to 34 Year Olds | 21 (70.0%) | 9 (30.0%) |
| 35 Years and over | 6 (33.3%) | 12 (66.7%) |
| Total | 718 (91.5%) | 67 (8.5%) |
Educational Attainment by Field of Study in Cedar Springs
Business (121 | 38.7%), science & technology (35 | 11.2%), arts & humanities (35 | 11.2%), communications (32 | 10.2%), and social sciences (24 | 7.7%) are the most common fields of study among 313 individuals in Cedar Springs who have obtained a bachelor's degree or higher.
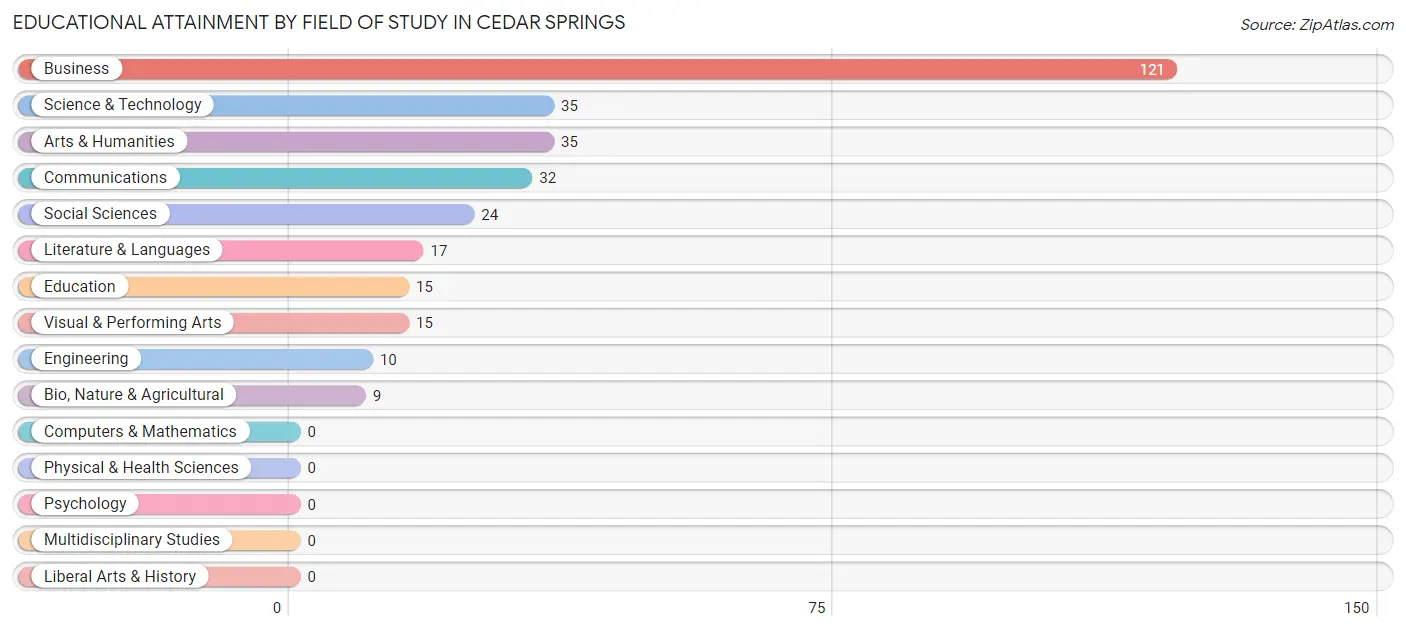
| Field of Study | # Graduates | % Graduates |
| Computers & Mathematics | 0 | 0.0% |
| Bio, Nature & Agricultural | 9 | 2.9% |
| Physical & Health Sciences | 0 | 0.0% |
| Psychology | 0 | 0.0% |
| Social Sciences | 24 | 7.7% |
| Engineering | 10 | 3.2% |
| Multidisciplinary Studies | 0 | 0.0% |
| Science & Technology | 35 | 11.2% |
| Business | 121 | 38.7% |
| Education | 15 | 4.8% |
| Literature & Languages | 17 | 5.4% |
| Liberal Arts & History | 0 | 0.0% |
| Visual & Performing Arts | 15 | 4.8% |
| Communications | 32 | 10.2% |
| Arts & Humanities | 35 | 11.2% |
| Total | 313 | 100.0% |
Transportation & Commute in Cedar Springs
Vehicle Availability by Sex in Cedar Springs
The most prevalent vehicle ownership categories in Cedar Springs are males with 2 vehicles (405, accounting for 47.8%) and females with 2 vehicles (498, making up 43.8%).
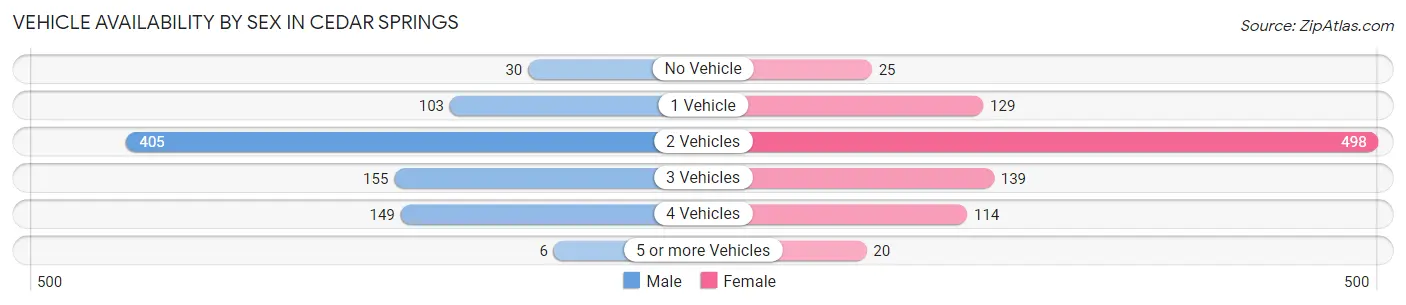
| Vehicles Available | Male | Female |
| No Vehicle | 30 (3.5%) | 25 (2.7%) |
| 1 Vehicle | 103 (12.1%) | 129 (14.0%) |
| 2 Vehicles | 405 (47.8%) | 498 (53.8%) |
| 3 Vehicles | 155 (18.3%) | 139 (15.0%) |
| 4 Vehicles | 149 (17.6%) | 114 (12.3%) |
| 5 or more Vehicles | 6 (0.7%) | 20 (2.2%) |
| Total | 848 (100.0%) | 925 (100.0%) |
Commute Time in Cedar Springs
The most frequently occuring commute durations in Cedar Springs are 25 to 29 minutes (265 commuters, 16.0%), 5 to 9 minutes (216 commuters, 13.1%), and 20 to 24 minutes (201 commuters, 12.2%).
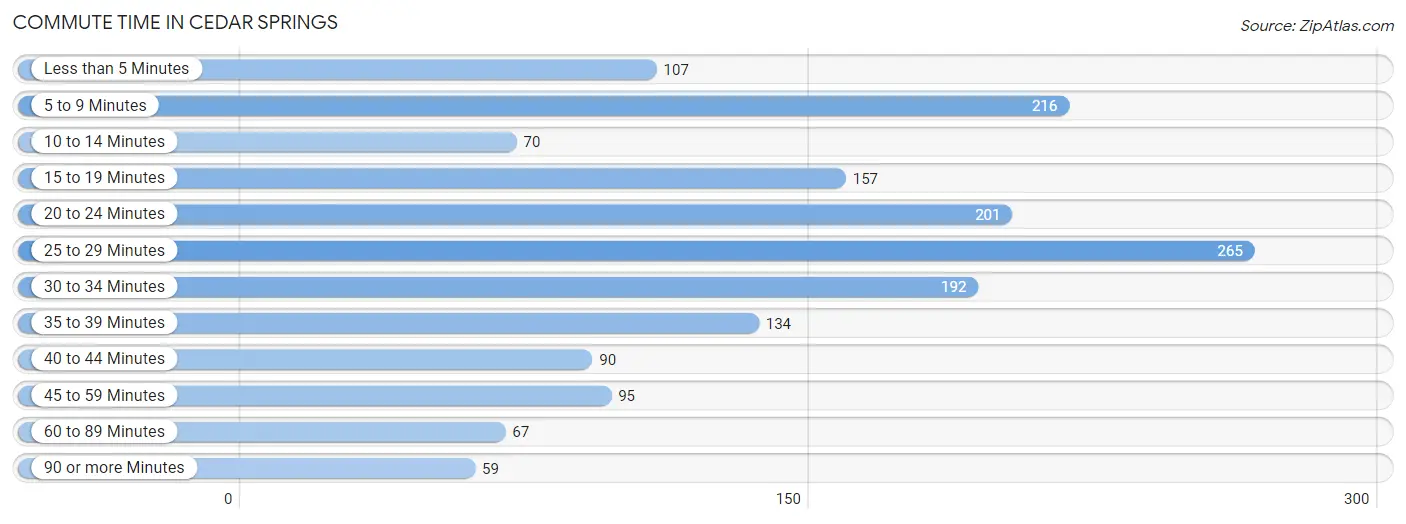
| Commute Time | # Commuters | % Commuters |
| Less than 5 Minutes | 107 | 6.5% |
| 5 to 9 Minutes | 216 | 13.1% |
| 10 to 14 Minutes | 70 | 4.2% |
| 15 to 19 Minutes | 157 | 9.5% |
| 20 to 24 Minutes | 201 | 12.2% |
| 25 to 29 Minutes | 265 | 16.0% |
| 30 to 34 Minutes | 192 | 11.6% |
| 35 to 39 Minutes | 134 | 8.1% |
| 40 to 44 Minutes | 90 | 5.4% |
| 45 to 59 Minutes | 95 | 5.8% |
| 60 to 89 Minutes | 67 | 4.1% |
| 90 or more Minutes | 59 | 3.6% |
Commute Time by Sex in Cedar Springs
The most common commute times in Cedar Springs are 20 to 24 minutes (135 commuters, 16.7%) for males and 25 to 29 minutes (149 commuters, 17.7%) for females.
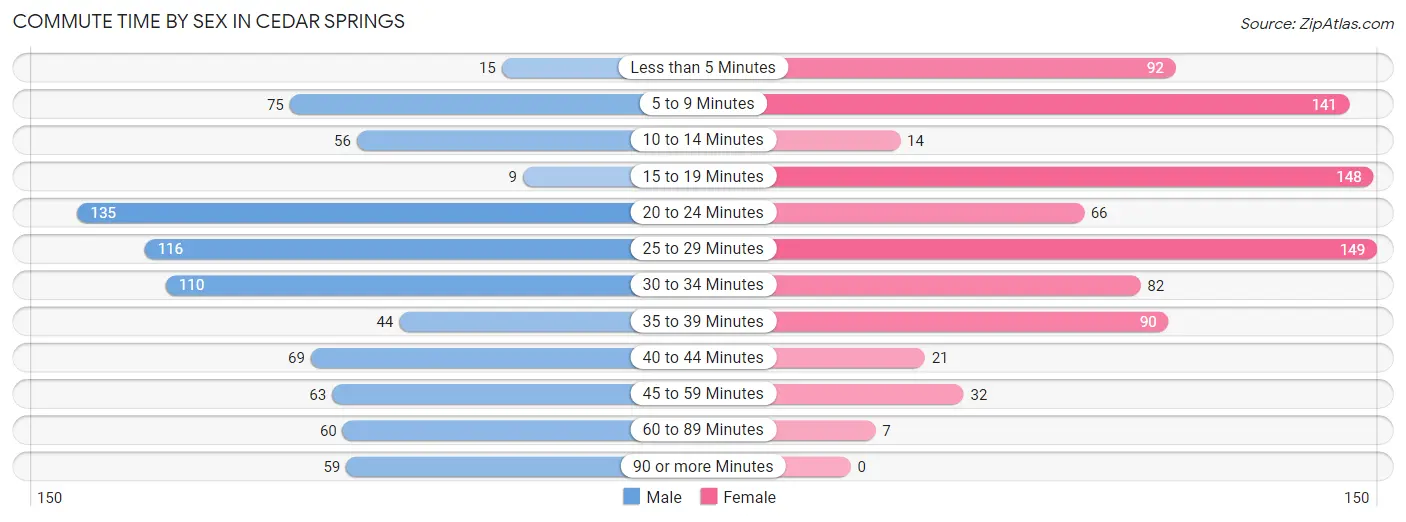
| Commute Time | Male | Female |
| Less than 5 Minutes | 15 (1.8%) | 92 (10.9%) |
| 5 to 9 Minutes | 75 (9.2%) | 141 (16.8%) |
| 10 to 14 Minutes | 56 (6.9%) | 14 (1.7%) |
| 15 to 19 Minutes | 9 (1.1%) | 148 (17.6%) |
| 20 to 24 Minutes | 135 (16.7%) | 66 (7.8%) |
| 25 to 29 Minutes | 116 (14.3%) | 149 (17.7%) |
| 30 to 34 Minutes | 110 (13.6%) | 82 (9.7%) |
| 35 to 39 Minutes | 44 (5.4%) | 90 (10.7%) |
| 40 to 44 Minutes | 69 (8.5%) | 21 (2.5%) |
| 45 to 59 Minutes | 63 (7.8%) | 32 (3.8%) |
| 60 to 89 Minutes | 60 (7.4%) | 7 (0.8%) |
| 90 or more Minutes | 59 (7.3%) | 0 (0.0%) |
Time of Departure to Work by Sex in Cedar Springs
The most frequent times of departure to work in Cedar Springs are 6:30 AM to 6:59 AM (171, 21.1%) for males and 7:00 AM to 7:29 AM (210, 24.9%) for females.
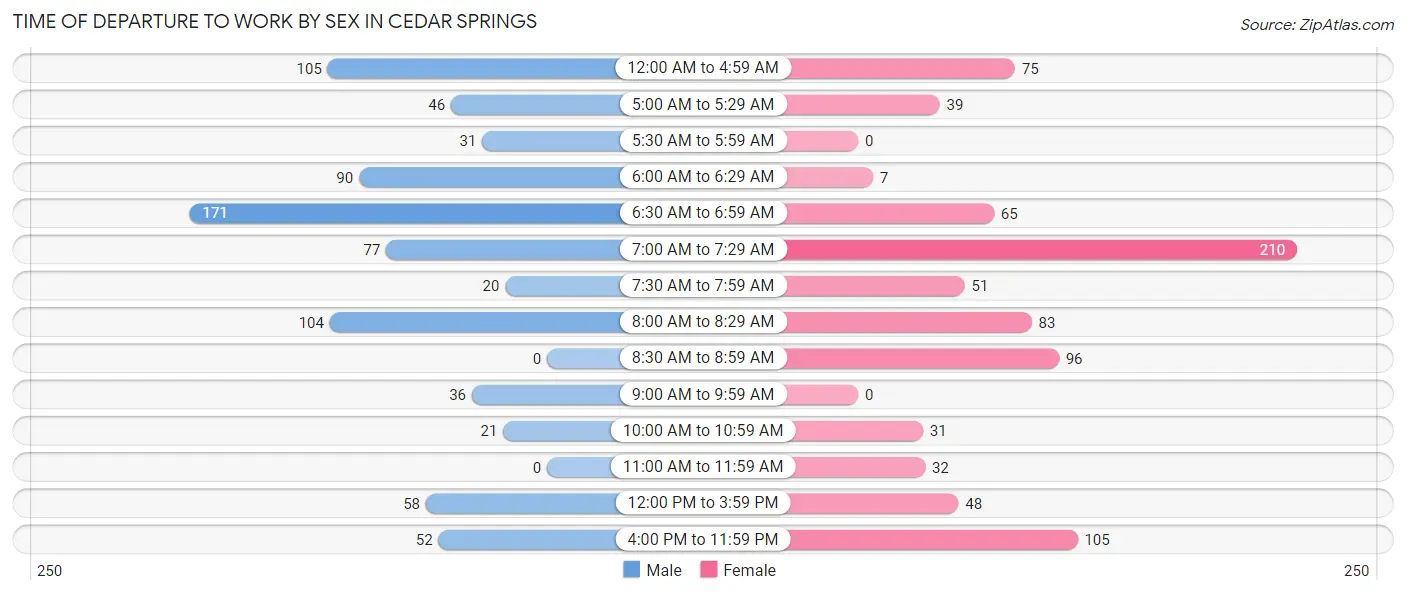
| Time of Departure | Male | Female |
| 12:00 AM to 4:59 AM | 105 (13.0%) | 75 (8.9%) |
| 5:00 AM to 5:29 AM | 46 (5.7%) | 39 (4.6%) |
| 5:30 AM to 5:59 AM | 31 (3.8%) | 0 (0.0%) |
| 6:00 AM to 6:29 AM | 90 (11.1%) | 7 (0.8%) |
| 6:30 AM to 6:59 AM | 171 (21.1%) | 65 (7.7%) |
| 7:00 AM to 7:29 AM | 77 (9.5%) | 210 (24.9%) |
| 7:30 AM to 7:59 AM | 20 (2.5%) | 51 (6.1%) |
| 8:00 AM to 8:29 AM | 104 (12.8%) | 83 (9.9%) |
| 8:30 AM to 8:59 AM | 0 (0.0%) | 96 (11.4%) |
| 9:00 AM to 9:59 AM | 36 (4.4%) | 0 (0.0%) |
| 10:00 AM to 10:59 AM | 21 (2.6%) | 31 (3.7%) |
| 11:00 AM to 11:59 AM | 0 (0.0%) | 32 (3.8%) |
| 12:00 PM to 3:59 PM | 58 (7.1%) | 48 (5.7%) |
| 4:00 PM to 11:59 PM | 52 (6.4%) | 105 (12.5%) |
| Total | 811 (100.0%) | 842 (100.0%) |
Housing Occupancy in Cedar Springs
Occupancy by Ownership in Cedar Springs
Of the total 1,537 dwellings in Cedar Springs, owner-occupied units account for 877 (57.1%), while renter-occupied units make up 660 (42.9%).
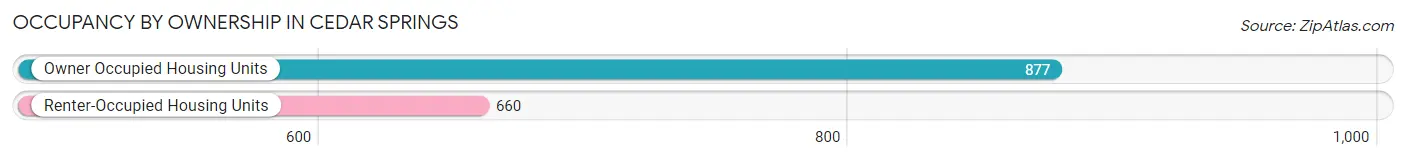
| Occupancy | # Housing Units | % Housing Units |
| Owner Occupied Housing Units | 877 | 57.1% |
| Renter-Occupied Housing Units | 660 | 42.9% |
| Total Occupied Housing Units | 1,537 | 100.0% |
Occupancy by Household Size in Cedar Springs
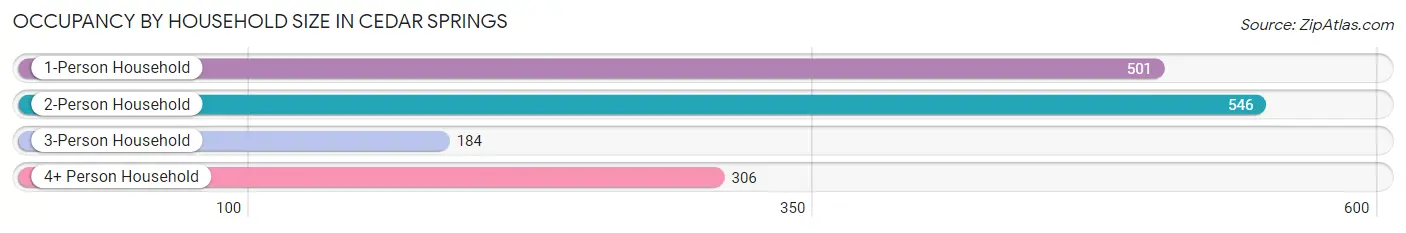
| Household Size | # Housing Units | % Housing Units |
| 1-Person Household | 501 | 32.6% |
| 2-Person Household | 546 | 35.5% |
| 3-Person Household | 184 | 12.0% |
| 4+ Person Household | 306 | 19.9% |
| Total Housing Units | 1,537 | 100.0% |
Occupancy by Ownership by Household Size in Cedar Springs
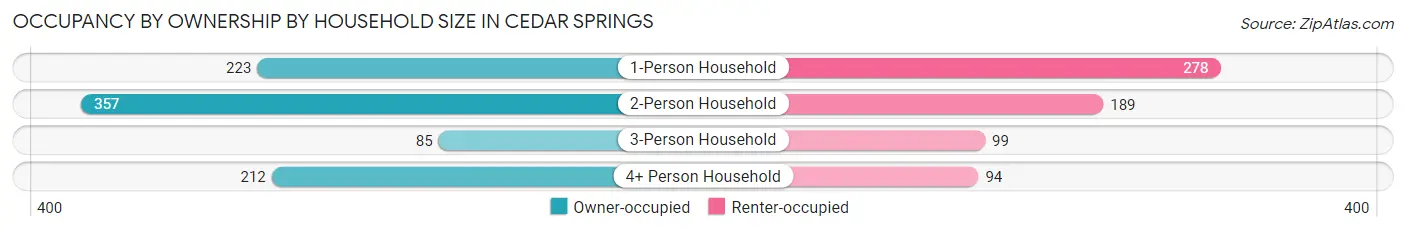
| Household Size | Owner-occupied | Renter-occupied |
| 1-Person Household | 223 (44.5%) | 278 (55.5%) |
| 2-Person Household | 357 (65.4%) | 189 (34.6%) |
| 3-Person Household | 85 (46.2%) | 99 (53.8%) |
| 4+ Person Household | 212 (69.3%) | 94 (30.7%) |
| Total Housing Units | 877 (57.1%) | 660 (42.9%) |
Occupancy by Educational Attainment in Cedar Springs
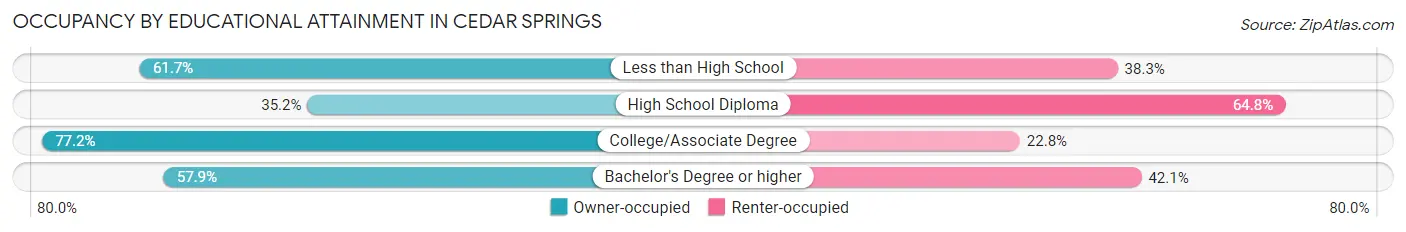
| Household Size | Owner-occupied | Renter-occupied |
| Less than High School | 87 (61.7%) | 54 (38.3%) |
| High School Diploma | 205 (35.2%) | 378 (64.8%) |
| College/Associate Degree | 457 (77.2%) | 135 (22.8%) |
| Bachelor's Degree or higher | 128 (57.9%) | 93 (42.1%) |
Occupancy by Age of Householder in Cedar Springs
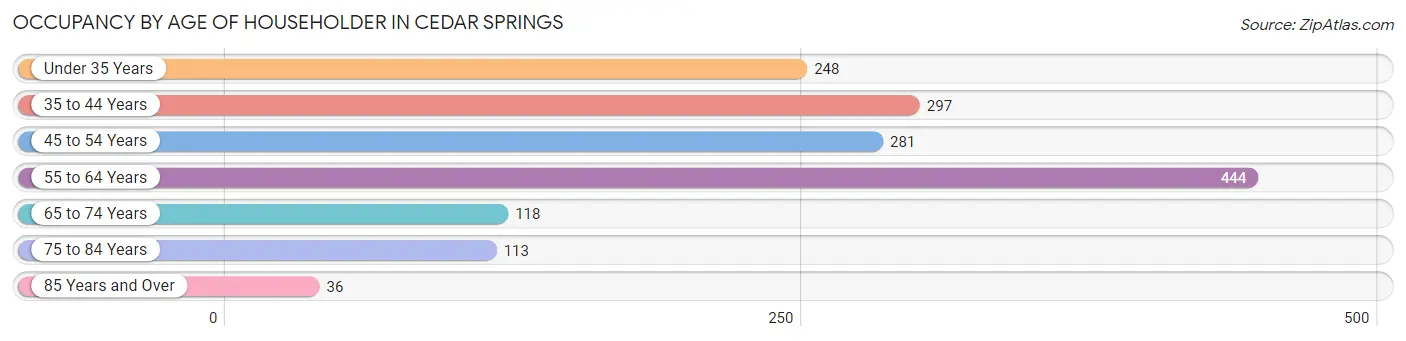
| Age Bracket | # Households | % Households |
| Under 35 Years | 248 | 16.1% |
| 35 to 44 Years | 297 | 19.3% |
| 45 to 54 Years | 281 | 18.3% |
| 55 to 64 Years | 444 | 28.9% |
| 65 to 74 Years | 118 | 7.7% |
| 75 to 84 Years | 113 | 7.3% |
| 85 Years and Over | 36 | 2.3% |
| Total | 1,537 | 100.0% |
Housing Finances in Cedar Springs
Median Income by Occupancy in Cedar Springs
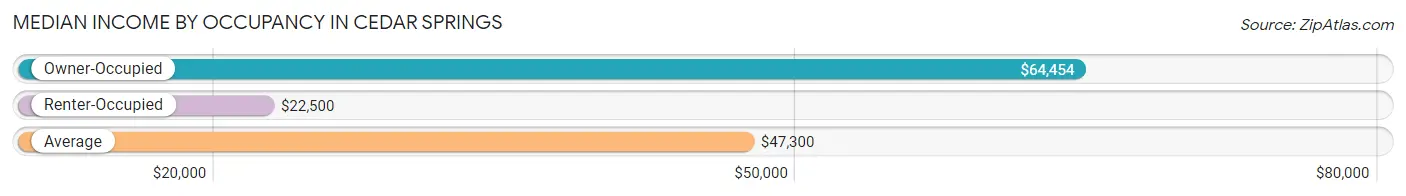
| Occupancy Type | # Households | Median Income |
| Owner-Occupied | 877 (57.1%) | $64,454 |
| Renter-Occupied | 660 (42.9%) | $22,500 |
| Average | 1,537 (100.0%) | $47,300 |
Occupancy by Householder Income Bracket in Cedar Springs
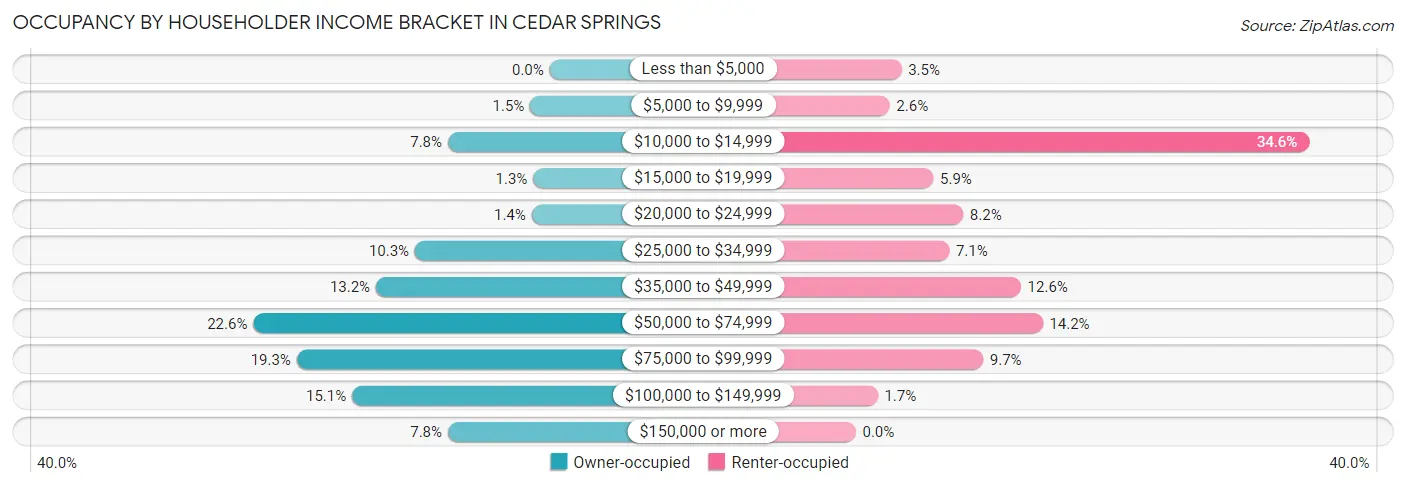
| Income Bracket | Owner-occupied | Renter-occupied |
| Less than $5,000 | 0 (0.0%) | 23 (3.5%) |
| $5,000 to $9,999 | 13 (1.5%) | 17 (2.6%) |
| $10,000 to $14,999 | 68 (7.7%) | 228 (34.5%) |
| $15,000 to $19,999 | 11 (1.3%) | 39 (5.9%) |
| $20,000 to $24,999 | 12 (1.4%) | 54 (8.2%) |
| $25,000 to $34,999 | 90 (10.3%) | 47 (7.1%) |
| $35,000 to $49,999 | 116 (13.2%) | 83 (12.6%) |
| $50,000 to $74,999 | 198 (22.6%) | 94 (14.2%) |
| $75,000 to $99,999 | 169 (19.3%) | 64 (9.7%) |
| $100,000 to $149,999 | 132 (15.0%) | 11 (1.7%) |
| $150,000 or more | 68 (7.7%) | 0 (0.0%) |
| Total | 877 (100.0%) | 660 (100.0%) |
Monthly Housing Cost Tiers in Cedar Springs
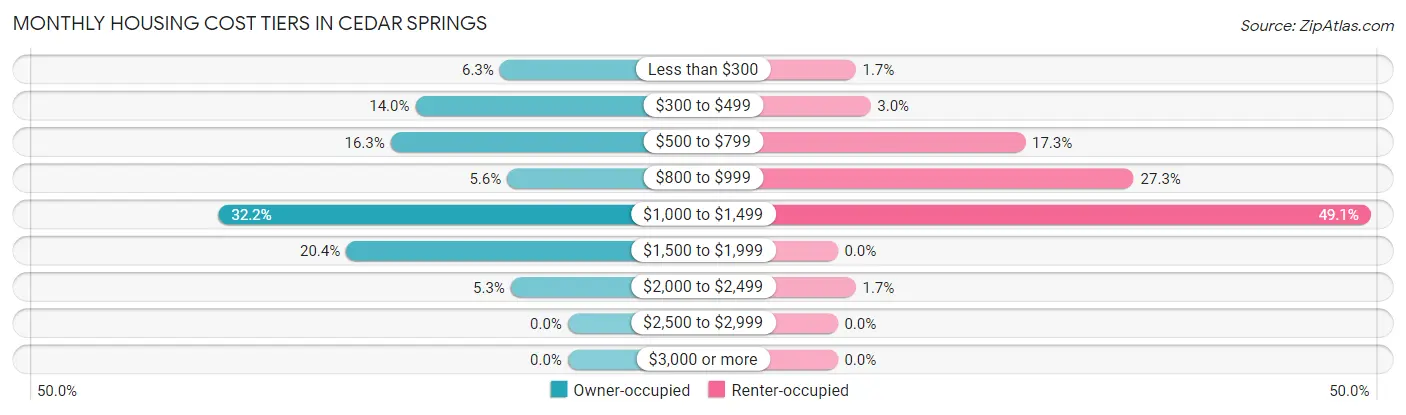
| Monthly Cost | Owner-occupied | Renter-occupied |
| Less than $300 | 55 (6.3%) | 11 (1.7%) |
| $300 to $499 | 123 (14.0%) | 20 (3.0%) |
| $500 to $799 | 143 (16.3%) | 114 (17.3%) |
| $800 to $999 | 49 (5.6%) | 180 (27.3%) |
| $1,000 to $1,499 | 282 (32.2%) | 324 (49.1%) |
| $1,500 to $1,999 | 179 (20.4%) | 0 (0.0%) |
| $2,000 to $2,499 | 46 (5.2%) | 11 (1.7%) |
| $2,500 to $2,999 | 0 (0.0%) | 0 (0.0%) |
| $3,000 or more | 0 (0.0%) | 0 (0.0%) |
| Total | 877 (100.0%) | 660 (100.0%) |
Physical Housing Characteristics in Cedar Springs
Housing Structures in Cedar Springs
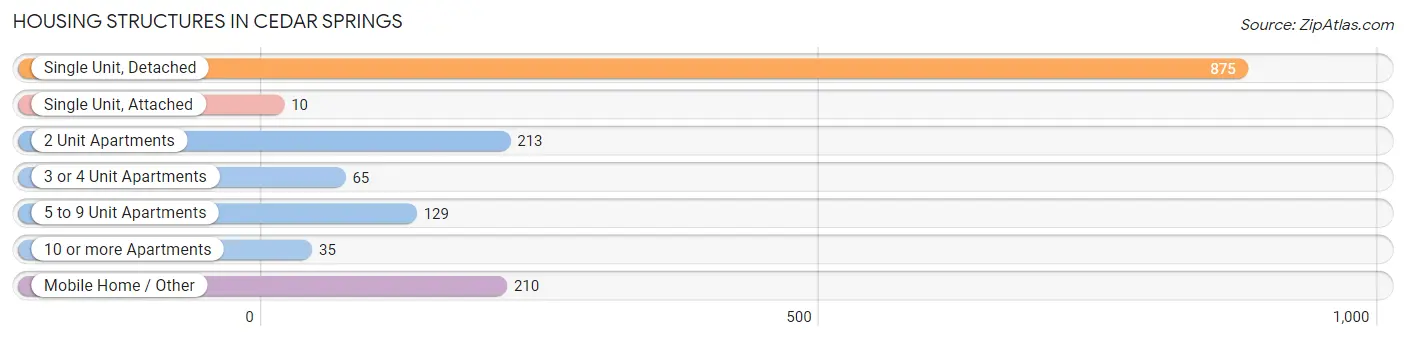
| Structure Type | # Housing Units | % Housing Units |
| Single Unit, Detached | 875 | 56.9% |
| Single Unit, Attached | 10 | 0.6% |
| 2 Unit Apartments | 213 | 13.9% |
| 3 or 4 Unit Apartments | 65 | 4.2% |
| 5 to 9 Unit Apartments | 129 | 8.4% |
| 10 or more Apartments | 35 | 2.3% |
| Mobile Home / Other | 210 | 13.7% |
| Total | 1,537 | 100.0% |
Housing Structures by Occupancy in Cedar Springs
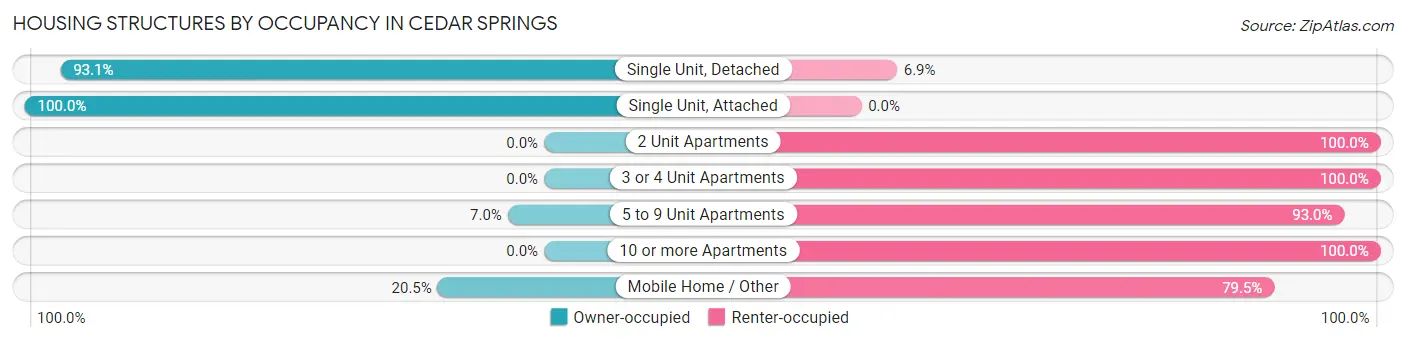
| Structure Type | Owner-occupied | Renter-occupied |
| Single Unit, Detached | 815 (93.1%) | 60 (6.9%) |
| Single Unit, Attached | 10 (100.0%) | 0 (0.0%) |
| 2 Unit Apartments | 0 (0.0%) | 213 (100.0%) |
| 3 or 4 Unit Apartments | 0 (0.0%) | 65 (100.0%) |
| 5 to 9 Unit Apartments | 9 (7.0%) | 120 (93.0%) |
| 10 or more Apartments | 0 (0.0%) | 35 (100.0%) |
| Mobile Home / Other | 43 (20.5%) | 167 (79.5%) |
| Total | 877 (57.1%) | 660 (42.9%) |
Housing Structures by Number of Rooms in Cedar Springs
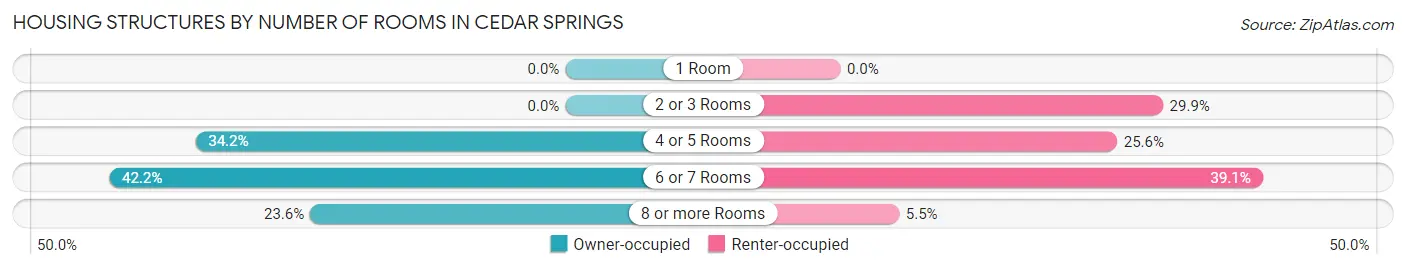
| Number of Rooms | Owner-occupied | Renter-occupied |
| 1 Room | 0 (0.0%) | 0 (0.0%) |
| 2 or 3 Rooms | 0 (0.0%) | 197 (29.8%) |
| 4 or 5 Rooms | 300 (34.2%) | 169 (25.6%) |
| 6 or 7 Rooms | 370 (42.2%) | 258 (39.1%) |
| 8 or more Rooms | 207 (23.6%) | 36 (5.4%) |
| Total | 877 (100.0%) | 660 (100.0%) |
Housing Structure by Heating Type in Cedar Springs
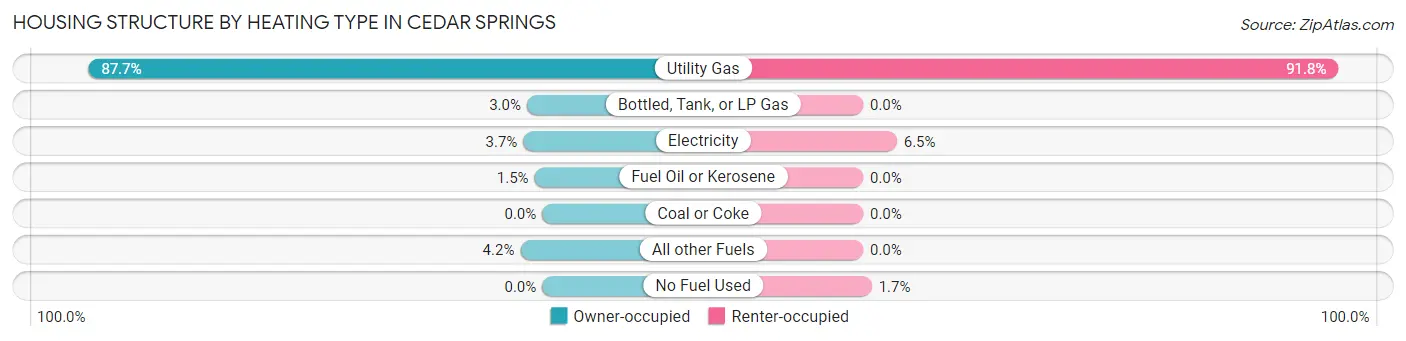
| Heating Type | Owner-occupied | Renter-occupied |
| Utility Gas | 769 (87.7%) | 606 (91.8%) |
| Bottled, Tank, or LP Gas | 26 (3.0%) | 0 (0.0%) |
| Electricity | 32 (3.6%) | 43 (6.5%) |
| Fuel Oil or Kerosene | 13 (1.5%) | 0 (0.0%) |
| Coal or Coke | 0 (0.0%) | 0 (0.0%) |
| All other Fuels | 37 (4.2%) | 0 (0.0%) |
| No Fuel Used | 0 (0.0%) | 11 (1.7%) |
| Total | 877 (100.0%) | 660 (100.0%) |
Household Vehicle Usage in Cedar Springs
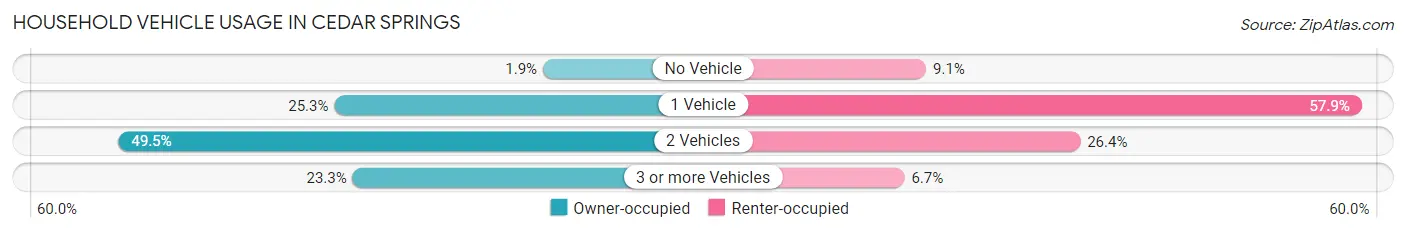
| Vehicles per Household | Owner-occupied | Renter-occupied |
| No Vehicle | 17 (1.9%) | 60 (9.1%) |
| 1 Vehicle | 222 (25.3%) | 382 (57.9%) |
| 2 Vehicles | 434 (49.5%) | 174 (26.4%) |
| 3 or more Vehicles | 204 (23.3%) | 44 (6.7%) |
| Total | 877 (100.0%) | 660 (100.0%) |
Real Estate & Mortgages in Cedar Springs
Real Estate and Mortgage Overview in Cedar Springs
| Characteristic | Without Mortgage | With Mortgage |
| Housing Units | 296 | 581 |
| Median Property Value | $113,000 | $206,700 |
| Median Household Income | $49,792 | $53 |
| Monthly Housing Costs | $464 | $0 |
| Real Estate Taxes | $2,116 | $9 |
Property Value by Mortgage Status in Cedar Springs
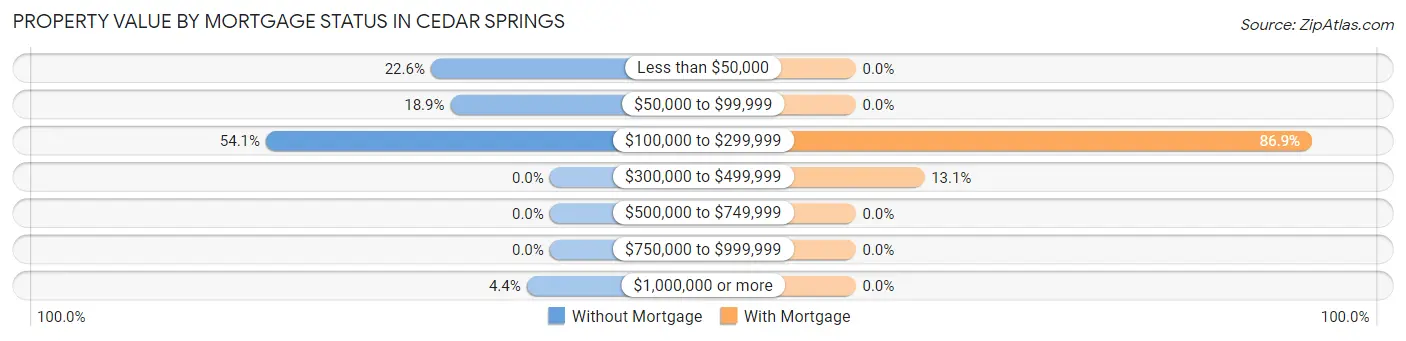
| Property Value | Without Mortgage | With Mortgage |
| Less than $50,000 | 67 (22.6%) | 0 (0.0%) |
| $50,000 to $99,999 | 56 (18.9%) | 0 (0.0%) |
| $100,000 to $299,999 | 160 (54.0%) | 505 (86.9%) |
| $300,000 to $499,999 | 0 (0.0%) | 76 (13.1%) |
| $500,000 to $749,999 | 0 (0.0%) | 0 (0.0%) |
| $750,000 to $999,999 | 0 (0.0%) | 0 (0.0%) |
| $1,000,000 or more | 13 (4.4%) | 0 (0.0%) |
| Total | 296 (100.0%) | 581 (100.0%) |
Household Income by Mortgage Status in Cedar Springs
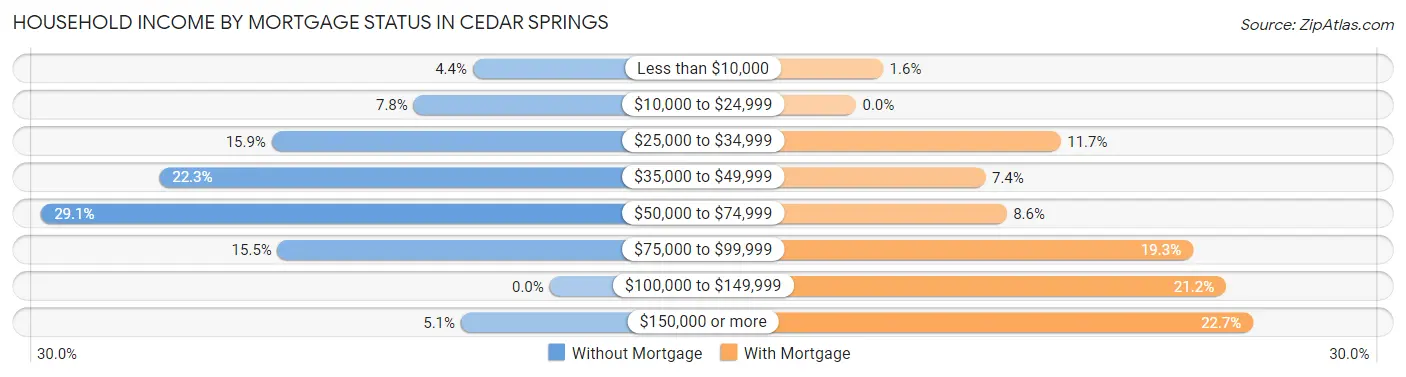
| Household Income | Without Mortgage | With Mortgage |
| Less than $10,000 | 13 (4.4%) | 9 (1.5%) |
| $10,000 to $24,999 | 23 (7.8%) | 0 (0.0%) |
| $25,000 to $34,999 | 47 (15.9%) | 68 (11.7%) |
| $35,000 to $49,999 | 66 (22.3%) | 43 (7.4%) |
| $50,000 to $74,999 | 86 (29.0%) | 50 (8.6%) |
| $75,000 to $99,999 | 46 (15.5%) | 112 (19.3%) |
| $100,000 to $149,999 | 0 (0.0%) | 123 (21.2%) |
| $150,000 or more | 15 (5.1%) | 132 (22.7%) |
| Total | 296 (100.0%) | 581 (100.0%) |
Property Value to Household Income Ratio in Cedar Springs
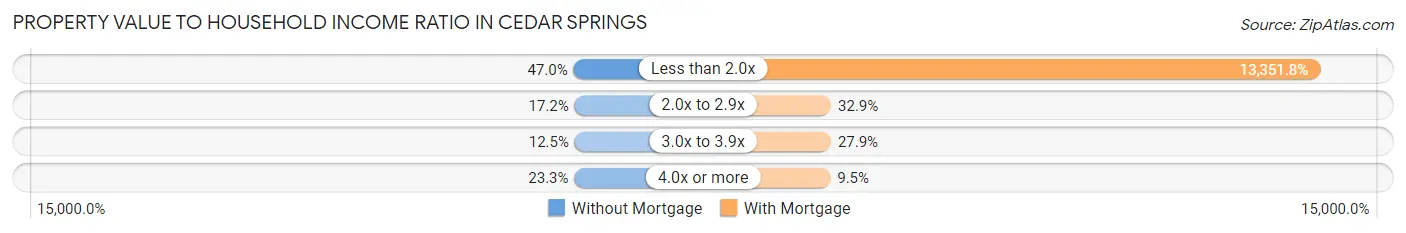
| Value-to-Income Ratio | Without Mortgage | With Mortgage |
| Less than 2.0x | 139 (47.0%) | 77,574 (13,351.8%) |
| 2.0x to 2.9x | 51 (17.2%) | 191 (32.9%) |
| 3.0x to 3.9x | 37 (12.5%) | 162 (27.9%) |
| 4.0x or more | 69 (23.3%) | 55 (9.5%) |
| Total | 296 (100.0%) | 581 (100.0%) |
Real Estate Taxes by Mortgage Status in Cedar Springs
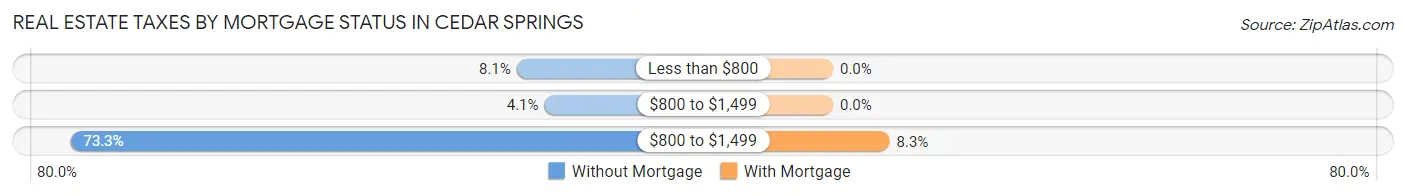
| Property Taxes | Without Mortgage | With Mortgage |
| Less than $800 | 24 (8.1%) | 0 (0.0%) |
| $800 to $1,499 | 12 (4.1%) | 0 (0.0%) |
| $800 to $1,499 | 217 (73.3%) | 48 (8.3%) |
| Total | 296 (100.0%) | 581 (100.0%) |
Health & Disability in Cedar Springs
Health Insurance Coverage by Age in Cedar Springs
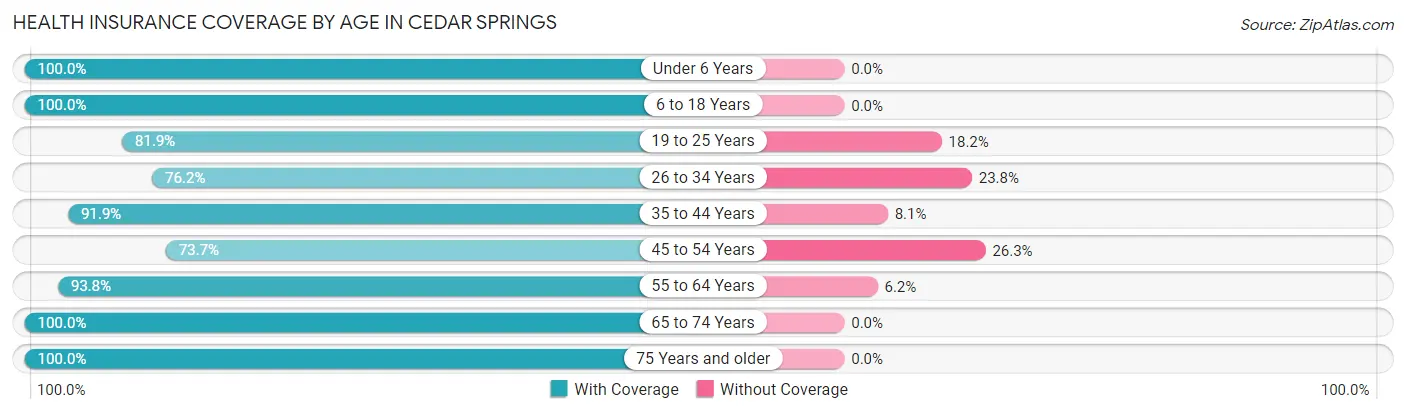
| Age Bracket | With Coverage | Without Coverage |
| Under 6 Years | 224 (100.0%) | 0 (0.0%) |
| 6 to 18 Years | 621 (100.0%) | 0 (0.0%) |
| 19 to 25 Years | 266 (81.9%) | 59 (18.1%) |
| 26 to 34 Years | 279 (76.2%) | 87 (23.8%) |
| 35 to 44 Years | 477 (91.9%) | 42 (8.1%) |
| 45 to 54 Years | 420 (73.7%) | 150 (26.3%) |
| 55 to 64 Years | 560 (93.8%) | 37 (6.2%) |
| 65 to 74 Years | 158 (100.0%) | 0 (0.0%) |
| 75 Years and older | 196 (100.0%) | 0 (0.0%) |
| Total | 3,201 (89.5%) | 375 (10.5%) |
Health Insurance Coverage by Citizenship Status in Cedar Springs
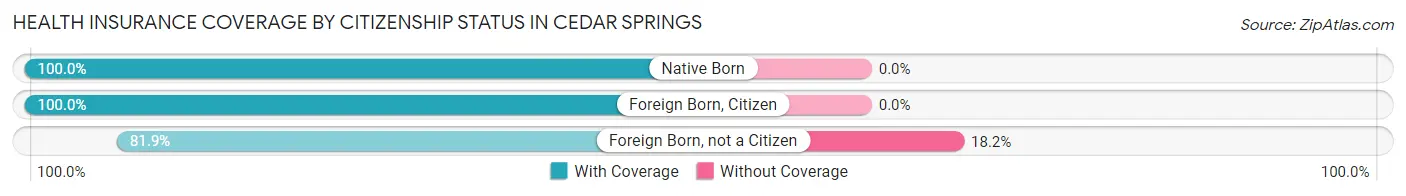
| Citizenship Status | With Coverage | Without Coverage |
| Native Born | 224 (100.0%) | 0 (0.0%) |
| Foreign Born, Citizen | 621 (100.0%) | 0 (0.0%) |
| Foreign Born, not a Citizen | 266 (81.9%) | 59 (18.1%) |
Health Insurance Coverage by Household Income in Cedar Springs
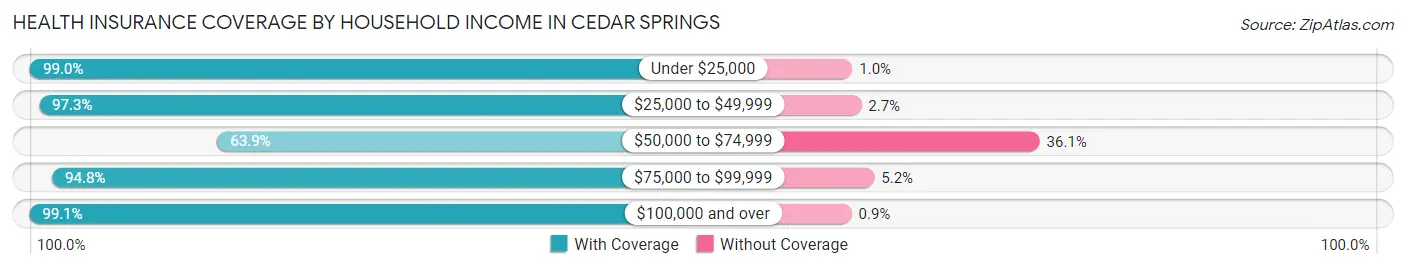
| Household Income | With Coverage | Without Coverage |
| Under $25,000 | 663 (99.0%) | 7 (1.0%) |
| $25,000 to $49,999 | 750 (97.3%) | 21 (2.7%) |
| $50,000 to $74,999 | 548 (63.9%) | 310 (36.1%) |
| $75,000 to $99,999 | 569 (94.8%) | 31 (5.2%) |
| $100,000 and over | 659 (99.1%) | 6 (0.9%) |
Public vs Private Health Insurance Coverage by Age in Cedar Springs
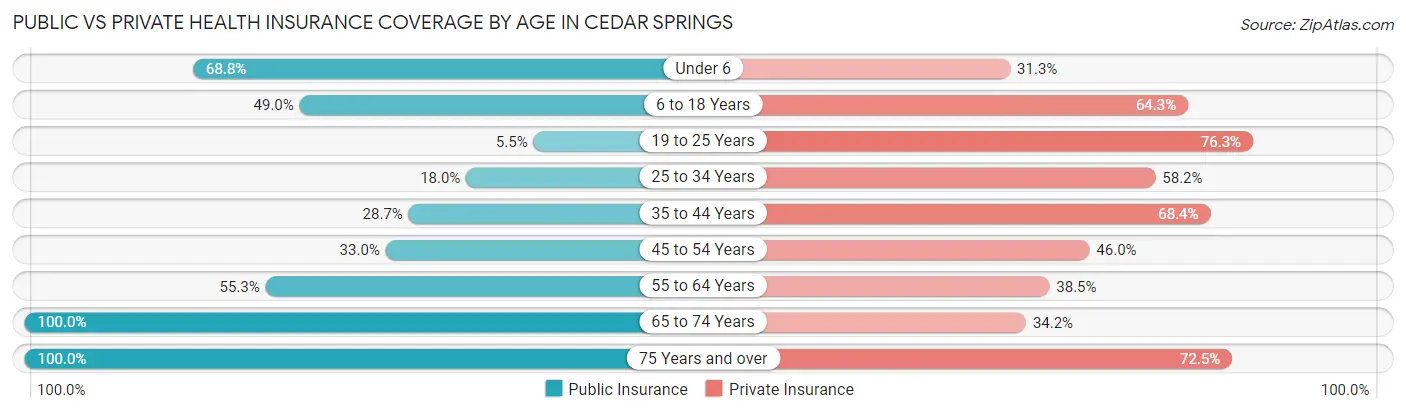
| Age Bracket | Public Insurance | Private Insurance |
| Under 6 | 154 (68.8%) | 70 (31.2%) |
| 6 to 18 Years | 304 (48.9%) | 399 (64.2%) |
| 19 to 25 Years | 18 (5.5%) | 248 (76.3%) |
| 25 to 34 Years | 66 (18.0%) | 213 (58.2%) |
| 35 to 44 Years | 149 (28.7%) | 355 (68.4%) |
| 45 to 54 Years | 188 (33.0%) | 262 (46.0%) |
| 55 to 64 Years | 330 (55.3%) | 230 (38.5%) |
| 65 to 74 Years | 158 (100.0%) | 54 (34.2%) |
| 75 Years and over | 196 (100.0%) | 142 (72.5%) |
| Total | 1,563 (43.7%) | 1,973 (55.2%) |
Disability Status by Sex by Age in Cedar Springs
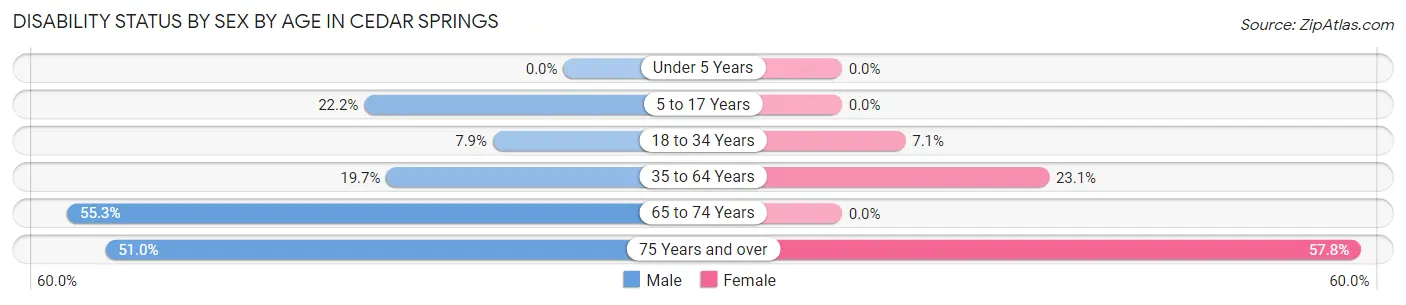
| Age Bracket | Male | Female |
| Under 5 Years | 0 (0.0%) | 0 (0.0%) |
| 5 to 17 Years | 57 (22.2%) | 0 (0.0%) |
| 18 to 34 Years | 27 (7.9%) | 27 (7.1%) |
| 35 to 64 Years | 141 (19.7%) | 224 (23.1%) |
| 65 to 74 Years | 42 (55.3%) | 0 (0.0%) |
| 75 Years and over | 25 (51.0%) | 85 (57.8%) |
Disability Class by Sex by Age in Cedar Springs
Disability Class: Hearing Difficulty
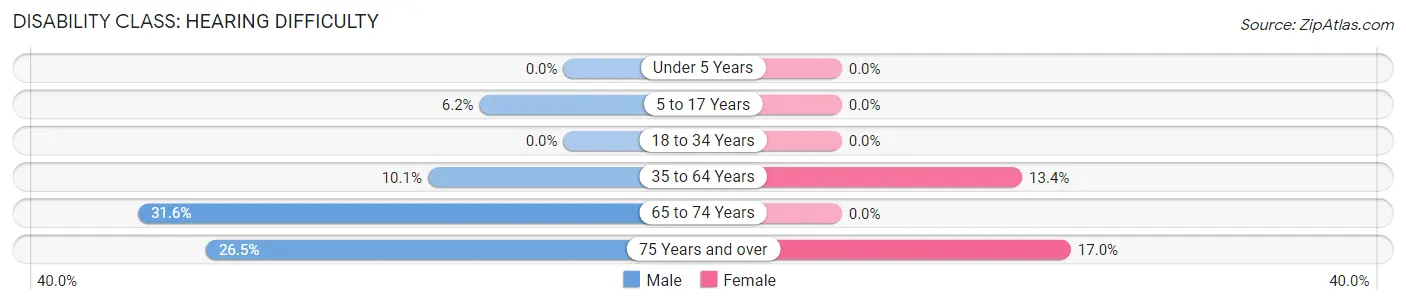
| Age Bracket | Male | Female |
| Under 5 Years | 0 (0.0%) | 0 (0.0%) |
| 5 to 17 Years | 16 (6.2%) | 0 (0.0%) |
| 18 to 34 Years | 0 (0.0%) | 0 (0.0%) |
| 35 to 64 Years | 72 (10.1%) | 130 (13.4%) |
| 65 to 74 Years | 24 (31.6%) | 0 (0.0%) |
| 75 Years and over | 13 (26.5%) | 25 (17.0%) |
Disability Class: Vision Difficulty
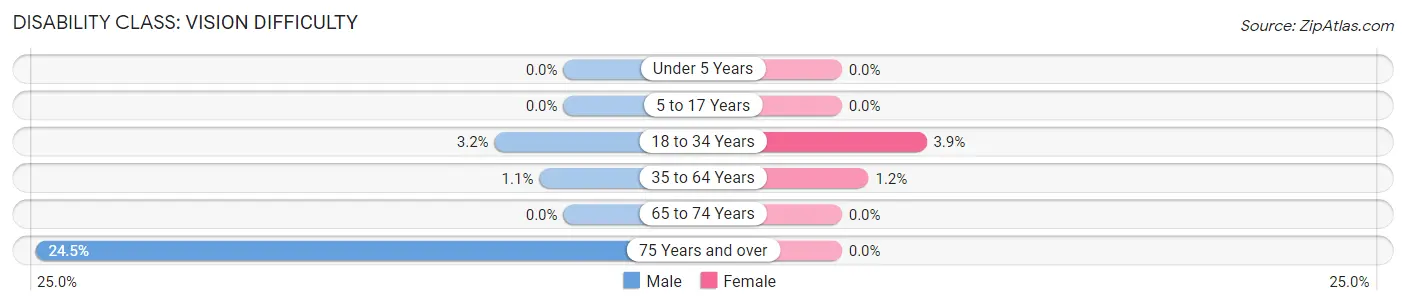
| Age Bracket | Male | Female |
| Under 5 Years | 0 (0.0%) | 0 (0.0%) |
| 5 to 17 Years | 0 (0.0%) | 0 (0.0%) |
| 18 to 34 Years | 11 (3.2%) | 15 (3.9%) |
| 35 to 64 Years | 8 (1.1%) | 12 (1.2%) |
| 65 to 74 Years | 0 (0.0%) | 0 (0.0%) |
| 75 Years and over | 12 (24.5%) | 0 (0.0%) |
Disability Class: Cognitive Difficulty
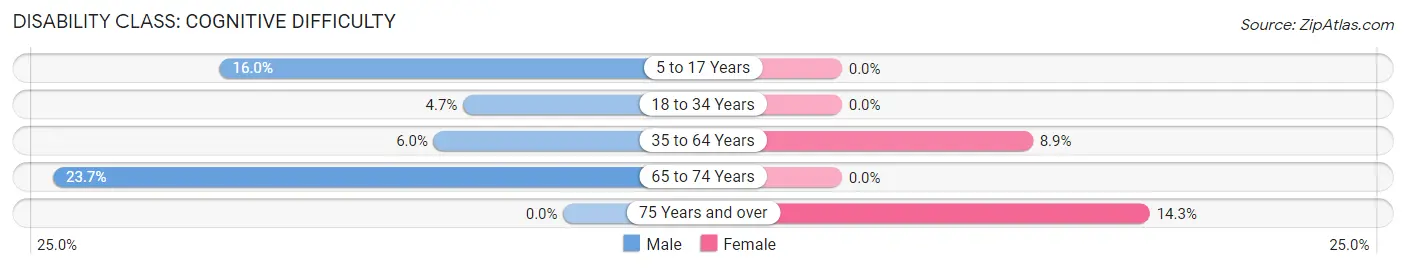
| Age Bracket | Male | Female |
| 5 to 17 Years | 41 (16.0%) | 0 (0.0%) |
| 18 to 34 Years | 16 (4.6%) | 0 (0.0%) |
| 35 to 64 Years | 43 (6.0%) | 86 (8.9%) |
| 65 to 74 Years | 18 (23.7%) | 0 (0.0%) |
| 75 Years and over | 0 (0.0%) | 21 (14.3%) |
Disability Class: Ambulatory Difficulty
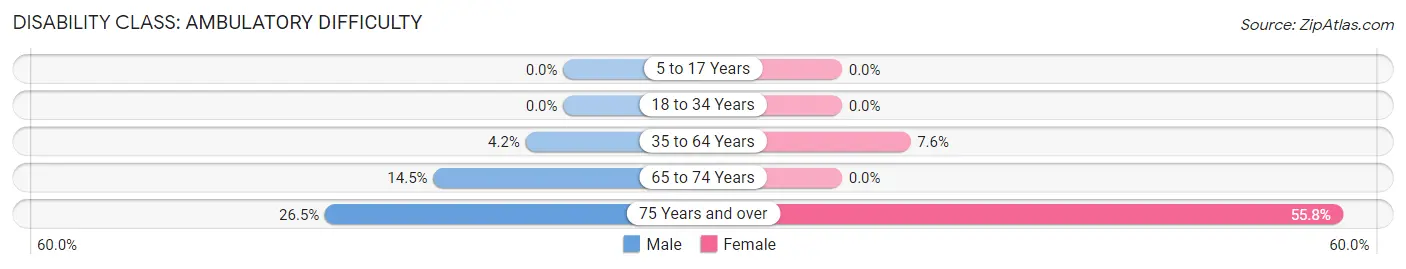
| Age Bracket | Male | Female |
| 5 to 17 Years | 0 (0.0%) | 0 (0.0%) |
| 18 to 34 Years | 0 (0.0%) | 0 (0.0%) |
| 35 to 64 Years | 30 (4.2%) | 74 (7.6%) |
| 65 to 74 Years | 11 (14.5%) | 0 (0.0%) |
| 75 Years and over | 13 (26.5%) | 82 (55.8%) |
Disability Class: Self-Care Difficulty
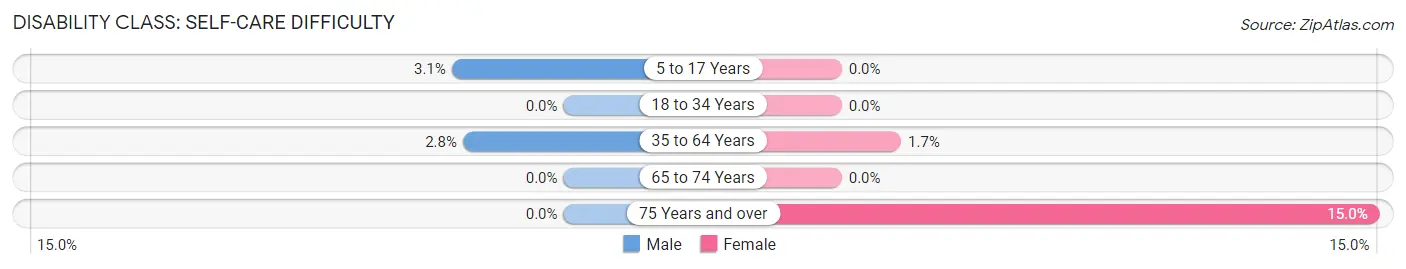
| Age Bracket | Male | Female |
| 5 to 17 Years | 8 (3.1%) | 0 (0.0%) |
| 18 to 34 Years | 0 (0.0%) | 0 (0.0%) |
| 35 to 64 Years | 20 (2.8%) | 16 (1.7%) |
| 65 to 74 Years | 0 (0.0%) | 0 (0.0%) |
| 75 Years and over | 0 (0.0%) | 22 (15.0%) |
Technology Access in Cedar Springs
Computing Device Access in Cedar Springs
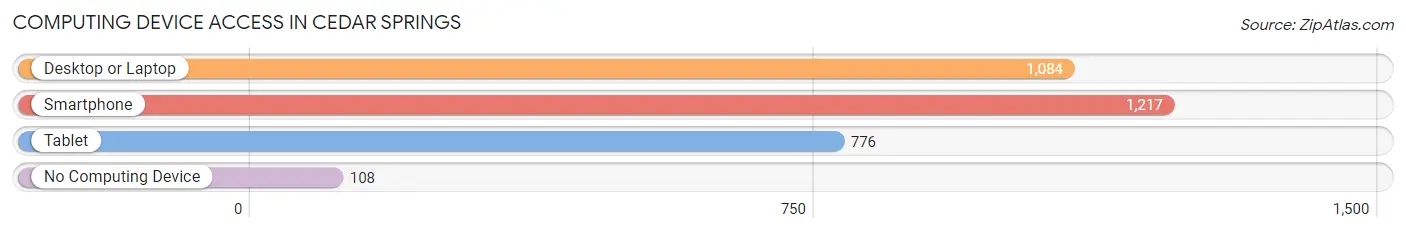
| Device Type | # Households | % Households |
| Desktop or Laptop | 1,084 | 70.5% |
| Smartphone | 1,217 | 79.2% |
| Tablet | 776 | 50.5% |
| No Computing Device | 108 | 7.0% |
| Total | 1,537 | 100.0% |
Internet Access in Cedar Springs
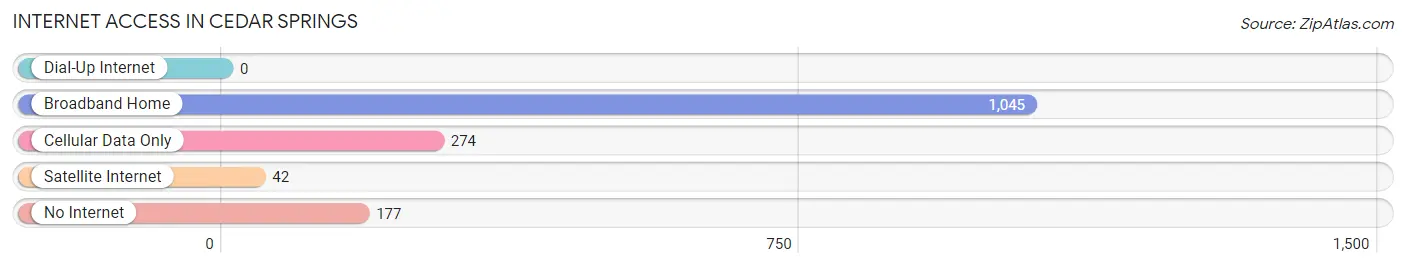
| Internet Type | # Households | % Households |
| Dial-Up Internet | 0 | 0.0% |
| Broadband Home | 1,045 | 68.0% |
| Cellular Data Only | 274 | 17.8% |
| Satellite Internet | 42 | 2.7% |
| No Internet | 177 | 11.5% |
| Total | 1,537 | 100.0% |
Cedar Springs Summary
Cedar Springs, Michigan is a small city located in Kent County, Michigan. It is situated about 15 miles north of Grand Rapids and is part of the Grand Rapids metropolitan area. The city has a population of approximately 4,000 people and is known for its small-town charm and rural atmosphere.
History
Cedar Springs was first settled in 1836 by a group of settlers from New York. The settlers named the area Cedar Springs after the abundance of cedar trees in the area. The first post office was established in 1837 and the village was officially incorporated in 1867.
In the late 19th century, Cedar Springs was a thriving agricultural community. The area was known for its production of apples, peaches, and other fruits. The town also had a number of sawmills and gristmills, which provided lumber and grain for the local economy.
In the early 20th century, Cedar Springs began to experience a period of growth and development. The town was connected to Grand Rapids by a trolley line in 1910, and the Cedar Springs State Bank was established in 1912. The town also had a number of stores, churches, and other businesses.
Geography
Cedar Springs is located in the southwestern corner of Kent County, Michigan. The city is situated on the banks of the Rogue River, which flows through the city. The city is surrounded by rural areas and is located about 15 miles north of Grand Rapids.
The city has a total area of 2.2 square miles, all of which is land. The city has a humid continental climate, with cold winters and warm summers. The average annual temperature is around 50 degrees Fahrenheit.
Economy
Cedar Springs is a small city with a limited economy. The city’s main industries are agriculture and tourism. The city is home to a number of farms, which produce apples, peaches, and other fruits. The city also has a number of small businesses, including restaurants, stores, and other services.
The city is also home to a number of tourist attractions, including the Cedar Springs Historical Museum and the Cedar Springs Brewing Company. The city also hosts a number of festivals and events throughout the year, including the Cedar Springs Summer Festival and the Cedar Springs Fall Festival.
Demographics
As of the 2010 census, the population of Cedar Springs was 4,039. The racial makeup of the city was 94.3% White, 1.2% African American, 0.3% Native American, 0.7% Asian, 0.1% Pacific Islander, 1.2% from other races, and 2.3% from two or more races. Hispanic or Latino of any race were 4.2% of the population.
The median household income in Cedar Springs was $45,938, and the median family income was $54,844. The per capita income for the city was $20,945. About 8.3% of families and 10.7% of the population were below the poverty line, including 14.2% of those under age 18 and 6.2% of those age 65 or over.
Common Questions
What is Per Capita Income in Cedar Springs?
Per Capita income in Cedar Springs is $25,042.
What is the Median Family Income in Cedar Springs?
Median Family Income in Cedar Springs is $63,504.
What is the Median Household income in Cedar Springs?
Median Household Income in Cedar Springs is $47,300.
What is Income or Wage Gap in Cedar Springs?
Income or Wage Gap in Cedar Springs is 44.4%.
Women in Cedar Springs earn 55.6 cents for every dollar earned by a man.
What is Inequality or Gini Index in Cedar Springs?
Inequality or Gini Index in Cedar Springs is 0.42.
What is the Total Population of Cedar Springs?
Total Population of Cedar Springs is 3,646.
What is the Total Male Population of Cedar Springs?
Total Male Population of Cedar Springs is 1,534.
What is the Total Female Population of Cedar Springs?
Total Female Population of Cedar Springs is 2,112.
What is the Ratio of Males per 100 Females in Cedar Springs?
There are 72.63 Males per 100 Females in Cedar Springs.
What is the Ratio of Females per 100 Males in Cedar Springs?
There are 137.68 Females per 100 Males in Cedar Springs.
What is the Median Population Age in Cedar Springs?
Median Population Age in Cedar Springs is 41.8 Years.
What is the Average Family Size in Cedar Springs
Average Family Size in Cedar Springs is 2.9 People.
What is the Average Household Size in Cedar Springs
Average Household Size in Cedar Springs is 2.3 People.
How Large is the Labor Force in Cedar Springs?
There are 1,921 People in the Labor Forcein in Cedar Springs.
What is the Percentage of People in the Labor Force in Cedar Springs?
64.5% of People are in the Labor Force in Cedar Springs.
What is the Unemployment Rate in Cedar Springs?
Unemployment Rate in Cedar Springs is 7.1%.