Zip Codes with the Highest Percentage of Families with Income Below $10,000 in Dearborn Heights, MI
RELATED REPORTS & OPTIONS
Family Income | $0-10k
Dearborn Heights
Compare Zip Codes
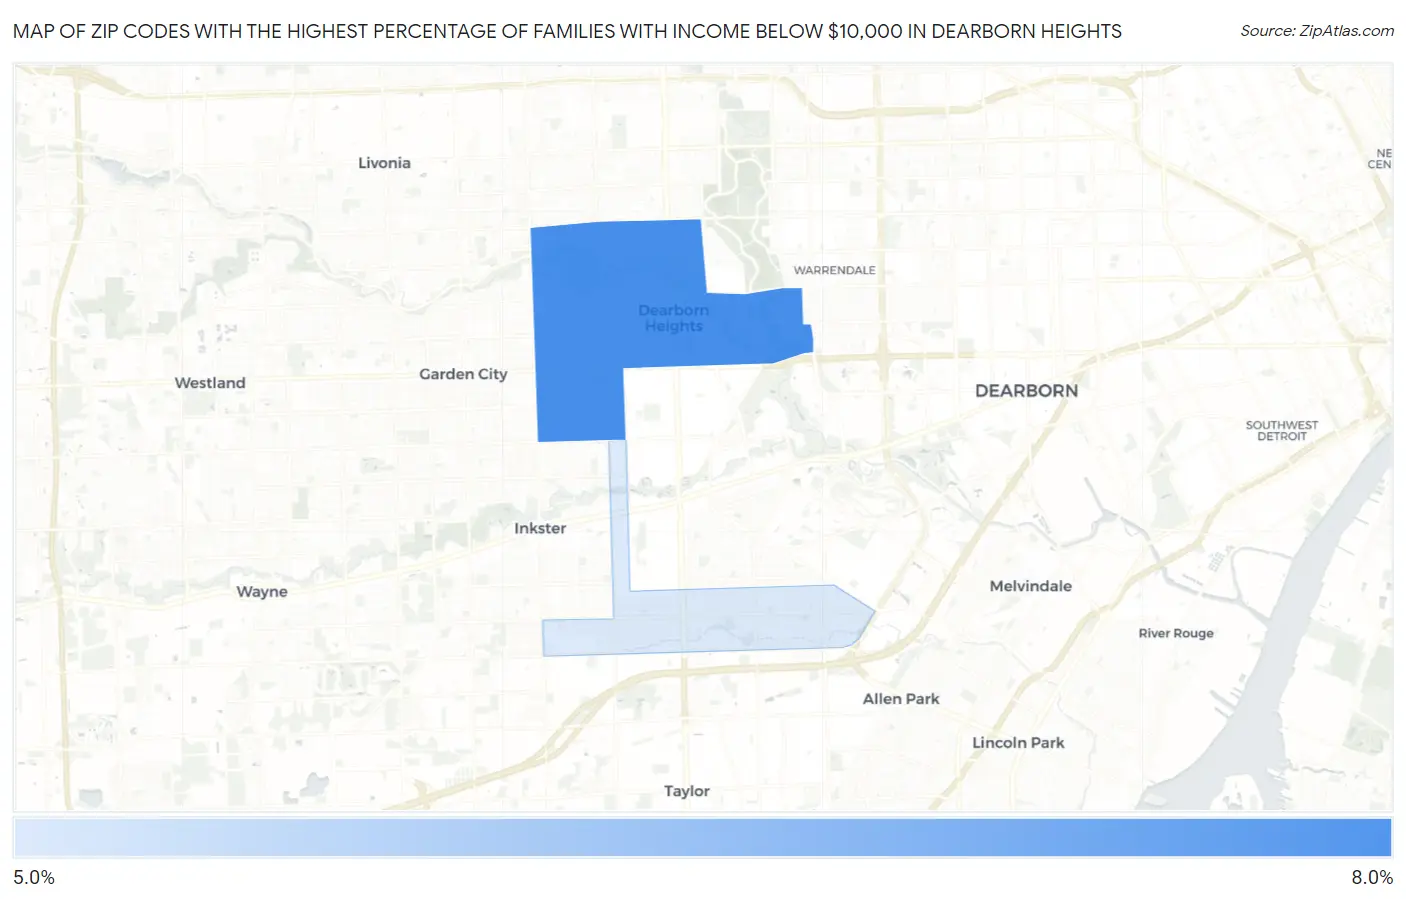
Map of Zip Codes with the Highest Percentage of Families with Income Below $10,000 in Dearborn Heights
6.0%
6.6%
Zip Codes with the Highest Percentage of Families with Income Below $10,000 in Dearborn Heights, MI
| Zip Code | Families with Income < $10k | vs State | vs National | |
| 1. | 48127 | 6.6% | 3.0%(+3.60)#87 | 3.1%(+3.50)#3,991 |
| 2. | 48125 | 6.0% | 3.0%(+3.00)#103 | 3.1%(+2.90)#4,650 |
1
Common Questions
What are the Top Zip Codes with the Highest Percentage of Families with Income Below $10,000 in Dearborn Heights, MI?
Top Zip Codes with the Highest Percentage of Families with Income Below $10,000 in Dearborn Heights, MI are:
What zip code has the Highest Percentage of Families with Income Below $10,000 in Dearborn Heights, MI?
48127 has the Highest Percentage of Families with Income Below $10,000 in Dearborn Heights, MI with 6.6%.
What is the Percentage of Families with Income Below $10,000 in Dearborn Heights, MI?
Percentage of Families with Income Below $10,000 in Dearborn Heights is 6.4%.
What is the Percentage of Families with Income Below $10,000 in Michigan?
Percentage of Families with Income Below $10,000 in Michigan is 3.0%.
What is the Percentage of Families with Income Below $10,000 in the United States?
Percentage of Families with Income Below $10,000 in the United States is 3.1%.