Hillsdale, MI Map & Demographics
Hillsdale Map
Hillsdale Overview
$22,339
PER CAPITA INCOME
$55,291
AVG FAMILY INCOME
$47,205
AVG HOUSEHOLD INCOME
39.2%
WAGE / INCOME GAP [ % ]
60.8¢/ $1
WAGE / INCOME GAP [ $ ]
0.41
INEQUALITY / GINI INDEX
8,005
TOTAL POPULATION
3,934
MALE POPULATION
4,071
FEMALE POPULATION
96.63
MALES / 100 FEMALES
103.48
FEMALES / 100 MALES
28.8
MEDIAN AGE
3.2
AVG FAMILY SIZE
2.4
AVG HOUSEHOLD SIZE
3,979
LABOR FORCE [ PEOPLE ]
60.2%
PERCENT IN LABOR FORCE
3.6%
UNEMPLOYMENT RATE
Hillsdale Zip Codes
Hillsdale Area Codes
Income in Hillsdale
Income Overview in Hillsdale
Per Capita Income in Hillsdale is $22,339, while median incomes of families and households are $55,291 and $47,205 respectively.
| Characteristic | Number | Measure |
| Per Capita Income | 8,005 | $22,339 |
| Median Family Income | 1,486 | $55,291 |
| Mean Family Income | 1,486 | $69,356 |
| Median Household Income | 2,720 | $47,205 |
| Mean Household Income | 2,720 | $60,005 |
| Income Deficit | 1,486 | $0 |
| Wage / Income Gap (%) | 8,005 | 39.19% |
| Wage / Income Gap ($) | 8,005 | 60.81¢ per $1 |
| Gini / Inequality Index | 8,005 | 0.41 |
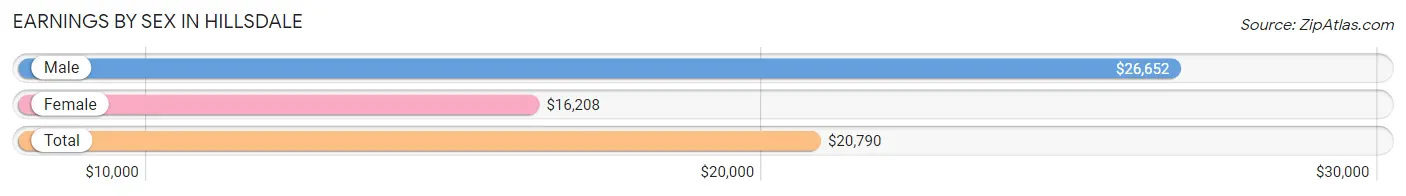
Earnings by Sex in Hillsdale
Average Earnings in Hillsdale are $20,790, $26,652 for men and $16,208 for women, a difference of 39.2%.
| Sex | Number | Average Earnings |
| Male | 2,187 (49.4%) | $26,652 |
| Female | 2,242 (50.6%) | $16,208 |
| Total | 4,429 (100.0%) | $20,790 |
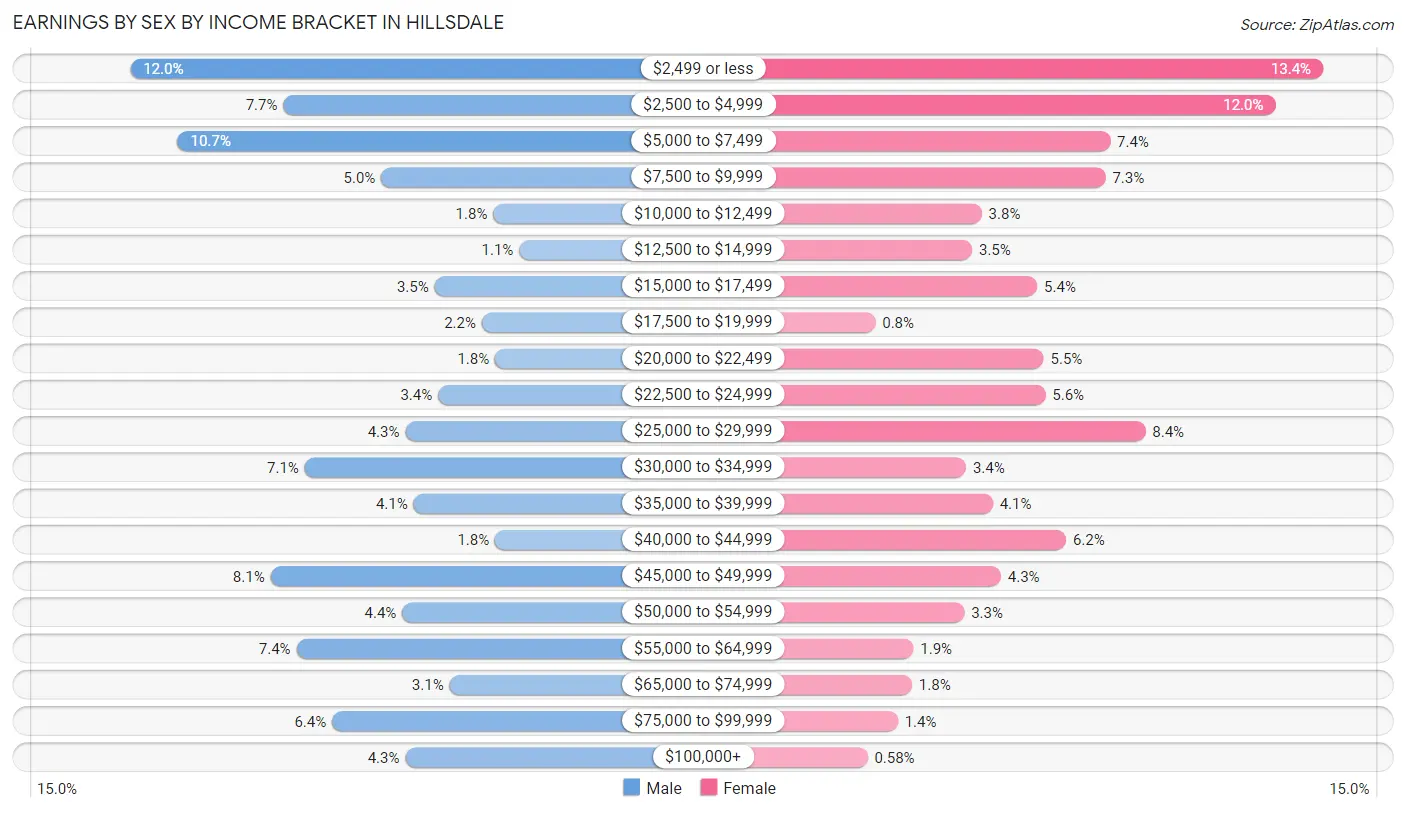
Earnings by Sex by Income Bracket in Hillsdale
The most common earnings brackets in Hillsdale are $2,499 or less for men (263 | 12.0%) and $2,499 or less for women (300 | 13.4%).
| Income | Male | Female |
| $2,499 or less | 263 (12.0%) | 300 (13.4%) |
| $2,500 to $4,999 | 169 (7.7%) | 270 (12.0%) |
| $5,000 to $7,499 | 234 (10.7%) | 166 (7.4%) |
| $7,500 to $9,999 | 109 (5.0%) | 163 (7.3%) |
| $10,000 to $12,499 | 40 (1.8%) | 85 (3.8%) |
| $12,500 to $14,999 | 24 (1.1%) | 79 (3.5%) |
| $15,000 to $17,499 | 76 (3.5%) | 120 (5.3%) |
| $17,500 to $19,999 | 47 (2.1%) | 18 (0.8%) |
| $20,000 to $22,499 | 39 (1.8%) | 124 (5.5%) |
| $22,500 to $24,999 | 74 (3.4%) | 125 (5.6%) |
| $25,000 to $29,999 | 94 (4.3%) | 188 (8.4%) |
| $30,000 to $34,999 | 156 (7.1%) | 75 (3.4%) |
| $35,000 to $39,999 | 89 (4.1%) | 92 (4.1%) |
| $40,000 to $44,999 | 39 (1.8%) | 138 (6.2%) |
| $45,000 to $49,999 | 177 (8.1%) | 97 (4.3%) |
| $50,000 to $54,999 | 96 (4.4%) | 74 (3.3%) |
| $55,000 to $64,999 | 161 (7.4%) | 42 (1.9%) |
| $65,000 to $74,999 | 67 (3.1%) | 41 (1.8%) |
| $75,000 to $99,999 | 139 (6.4%) | 32 (1.4%) |
| $100,000+ | 94 (4.3%) | 13 (0.6%) |
| Total | 2,187 (100.0%) | 2,242 (100.0%) |
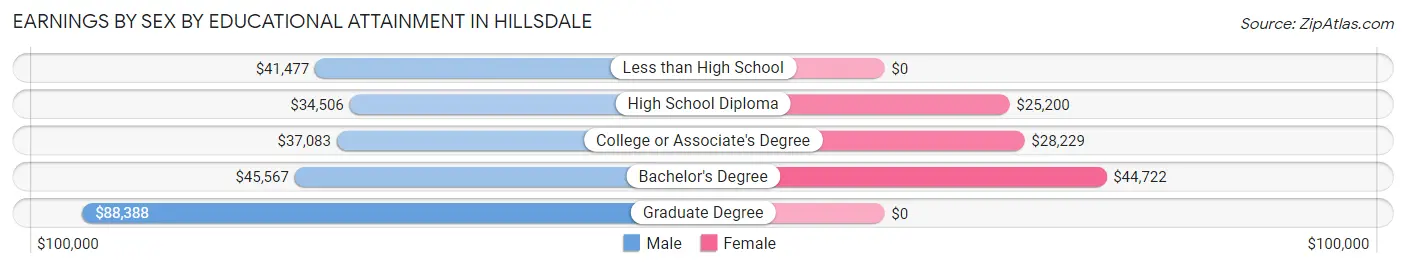
Earnings by Sex by Educational Attainment in Hillsdale
Average earnings in Hillsdale are $42,200 for men and $27,863 for women, a difference of 34.0%. Men with an educational attainment of graduate degree enjoy the highest average annual earnings of $88,388, while those with high school diploma education earn the least with $34,506. Women with an educational attainment of bachelor's degree earn the most with the average annual earnings of $44,722, while those with high school diploma education have the smallest earnings of $25,200.
| Educational Attainment | Male Income | Female Income |
| Less than High School | $41,477 | $0 |
| High School Diploma | $34,506 | $25,200 |
| College or Associate's Degree | $37,083 | $28,229 |
| Bachelor's Degree | $45,567 | $44,722 |
| Graduate Degree | $88,388 | $0 |
| Total | $42,200 | $27,863 |
Family Income in Hillsdale
Family Income Brackets in Hillsdale
According to the Hillsdale family income data, there are 351 families falling into the $50,000 to $74,999 income range, which is the most common income bracket and makes up 23.6% of all families. Conversely, the $10,000 to $14,999 income bracket is the least frequent group with only 7 families (0.5%) belonging to this category.
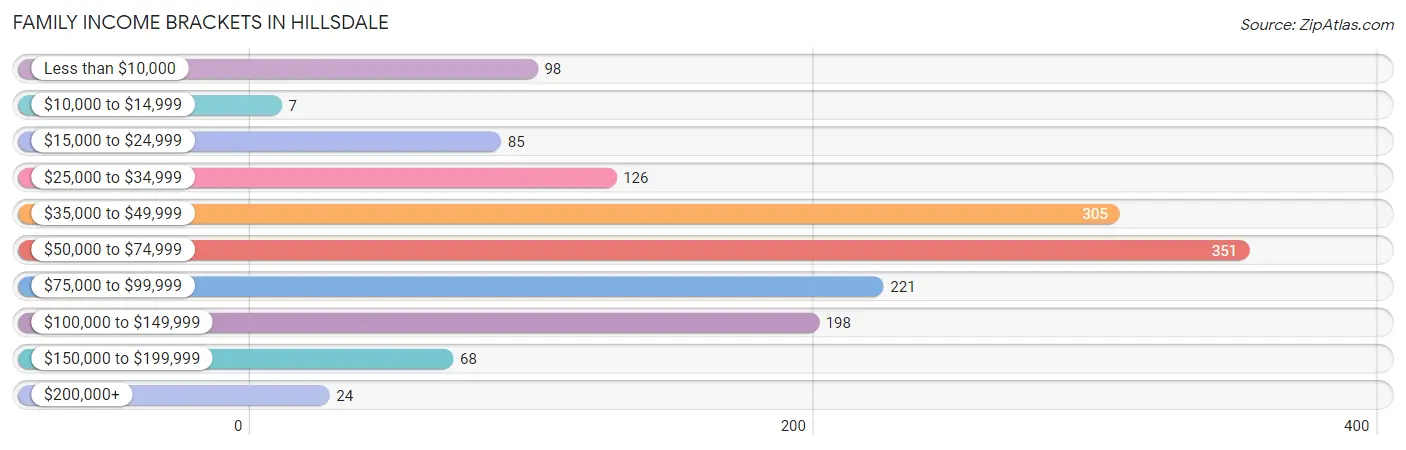
| Income Bracket | # Families | % Families |
| Less than $10,000 | 98 | 6.6% |
| $10,000 to $14,999 | 7 | 0.5% |
| $15,000 to $24,999 | 85 | 5.7% |
| $25,000 to $34,999 | 126 | 8.5% |
| $35,000 to $49,999 | 305 | 20.5% |
| $50,000 to $74,999 | 351 | 23.6% |
| $75,000 to $99,999 | 221 | 14.9% |
| $100,000 to $149,999 | 198 | 13.3% |
| $150,000 to $199,999 | 68 | 4.6% |
| $200,000+ | 24 | 1.6% |
Family Income by Famaliy Size in Hillsdale
6-person families (97 | 6.5%) account for the highest median family income in Hillsdale with $100,750 per family, while 2-person families (724 | 48.7%) have the highest median income of $27,312 per family member.
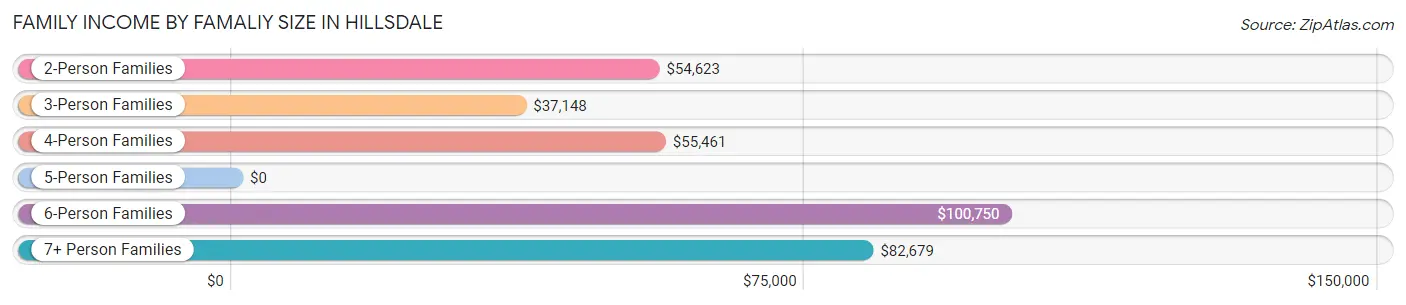
| Income Bracket | # Families | Median Income |
| 2-Person Families | 724 (48.7%) | $54,623 |
| 3-Person Families | 187 (12.6%) | $37,148 |
| 4-Person Families | 247 (16.6%) | $55,461 |
| 5-Person Families | 202 (13.6%) | $0 |
| 6-Person Families | 97 (6.5%) | $100,750 |
| 7+ Person Families | 29 (1.9%) | $82,679 |
| Total | 1,486 (100.0%) | $55,291 |
Family Income by Number of Earners in Hillsdale
The median family income in Hillsdale is $55,291, with families comprising 3+ earners (126) having the highest median family income of $125,278, while families with 1 earner (575) have the lowest median family income of $42,404, accounting for 8.5% and 38.7% of families, respectively.
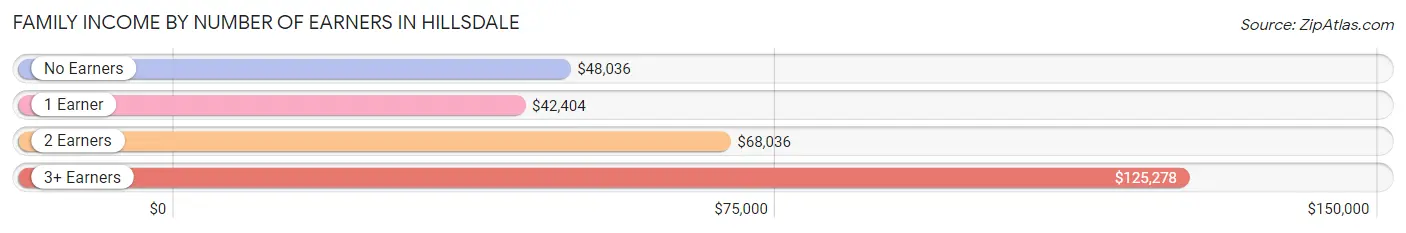
| Number of Earners | # Families | Median Income |
| No Earners | 207 (13.9%) | $48,036 |
| 1 Earner | 575 (38.7%) | $42,404 |
| 2 Earners | 578 (38.9%) | $68,036 |
| 3+ Earners | 126 (8.5%) | $125,278 |
| Total | 1,486 (100.0%) | $55,291 |
Household Income in Hillsdale
Household Income Brackets in Hillsdale
With 577 households falling in the category, the $35,000 to $49,999 income range is the most frequent in Hillsdale, accounting for 21.2% of all households. In contrast, only 44 households (1.6%) fall into the $200,000+ income bracket, making it the least populous group.
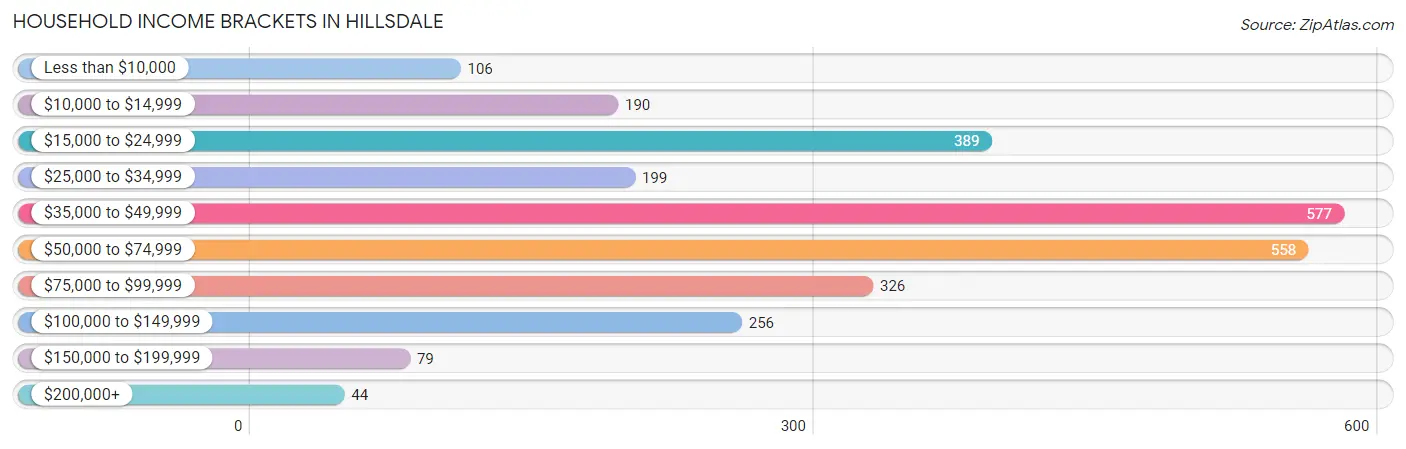
| Income Bracket | # Households | % Households |
| Less than $10,000 | 106 | 3.9% |
| $10,000 to $14,999 | 190 | 7.0% |
| $15,000 to $24,999 | 389 | 14.3% |
| $25,000 to $34,999 | 199 | 7.3% |
| $35,000 to $49,999 | 577 | 21.2% |
| $50,000 to $74,999 | 558 | 20.5% |
| $75,000 to $99,999 | 326 | 12.0% |
| $100,000 to $149,999 | 256 | 9.4% |
| $150,000 to $199,999 | 79 | 2.9% |
| $200,000+ | 44 | 1.6% |
Household Income by Householder Age in Hillsdale
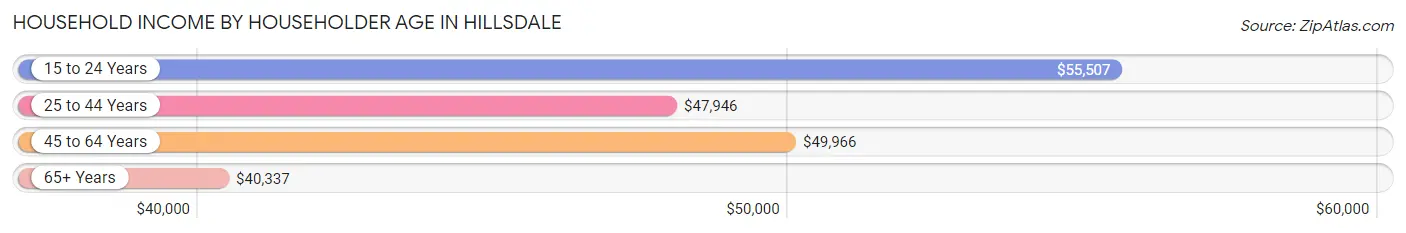
The median household income in Hillsdale is $47,205, with the highest median household income of $55,507 found in the 15 to 24 years age bracket for the primary householder. A total of 173 households (6.4%) fall into this category. Meanwhile, the 65+ years age bracket for the primary householder has the lowest median household income of $40,337, with 712 households (26.2%) in this group.
| Income Bracket | # Households | Median Income |
| 15 to 24 Years | 173 (6.4%) | $55,507 |
| 25 to 44 Years | 908 (33.4%) | $47,946 |
| 45 to 64 Years | 927 (34.1%) | $49,966 |
| 65+ Years | 712 (26.2%) | $40,337 |
| Total | 2,720 (100.0%) | $47,205 |
Poverty in Hillsdale
Income Below Poverty by Sex and Age in Hillsdale
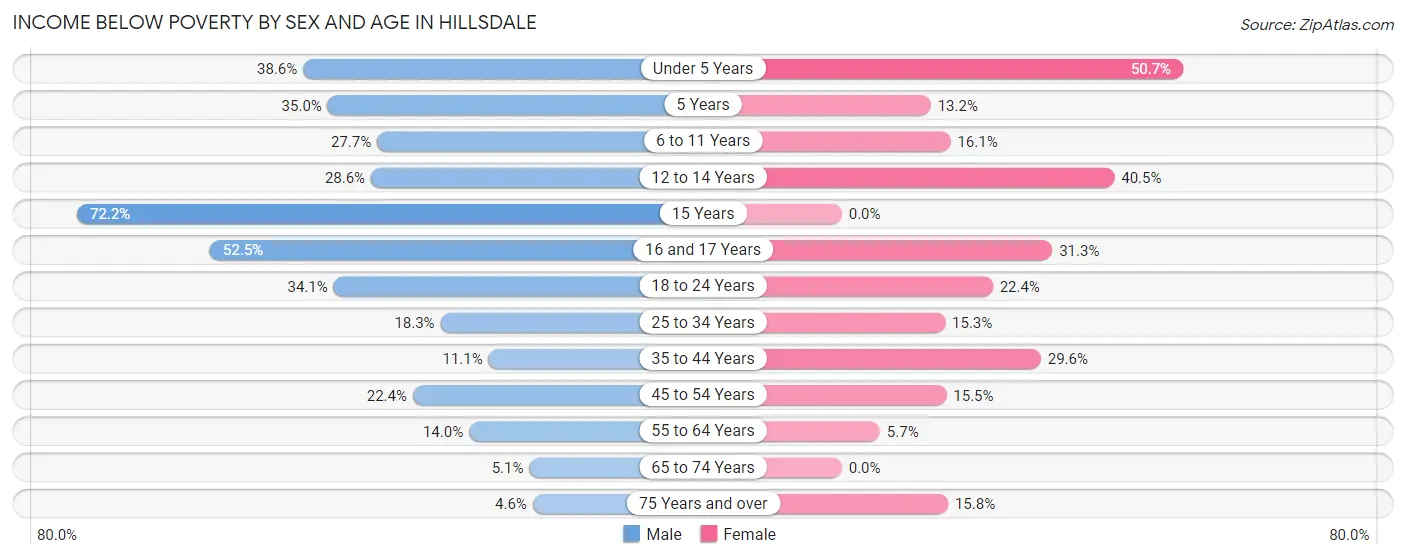
With 23.0% poverty level for males and 19.5% for females among the residents of Hillsdale, 15 year old males and under 5 year old females are the most vulnerable to poverty, with 52 males (72.2%) and 78 females (50.6%) in their respective age groups living below the poverty level.
| Age Bracket | Male | Female |
| Under 5 Years | 51 (38.6%) | 78 (50.6%) |
| 5 Years | 7 (35.0%) | 14 (13.2%) |
| 6 to 11 Years | 101 (27.7%) | 41 (16.1%) |
| 12 to 14 Years | 40 (28.6%) | 53 (40.5%) |
| 15 Years | 52 (72.2%) | 0 (0.0%) |
| 16 and 17 Years | 53 (52.5%) | 30 (31.2%) |
| 18 to 24 Years | 173 (34.1%) | 104 (22.4%) |
| 25 to 34 Years | 73 (18.2%) | 50 (15.3%) |
| 35 to 44 Years | 44 (11.1%) | 169 (29.5%) |
| 45 to 54 Years | 89 (22.4%) | 50 (15.5%) |
| 55 to 64 Years | 50 (14.0%) | 22 (5.7%) |
| 65 to 74 Years | 11 (5.1%) | 0 (0.0%) |
| 75 Years and over | 7 (4.5%) | 53 (15.8%) |
| Total | 751 (23.0%) | 664 (19.5%) |
Income Above Poverty by Sex and Age in Hillsdale
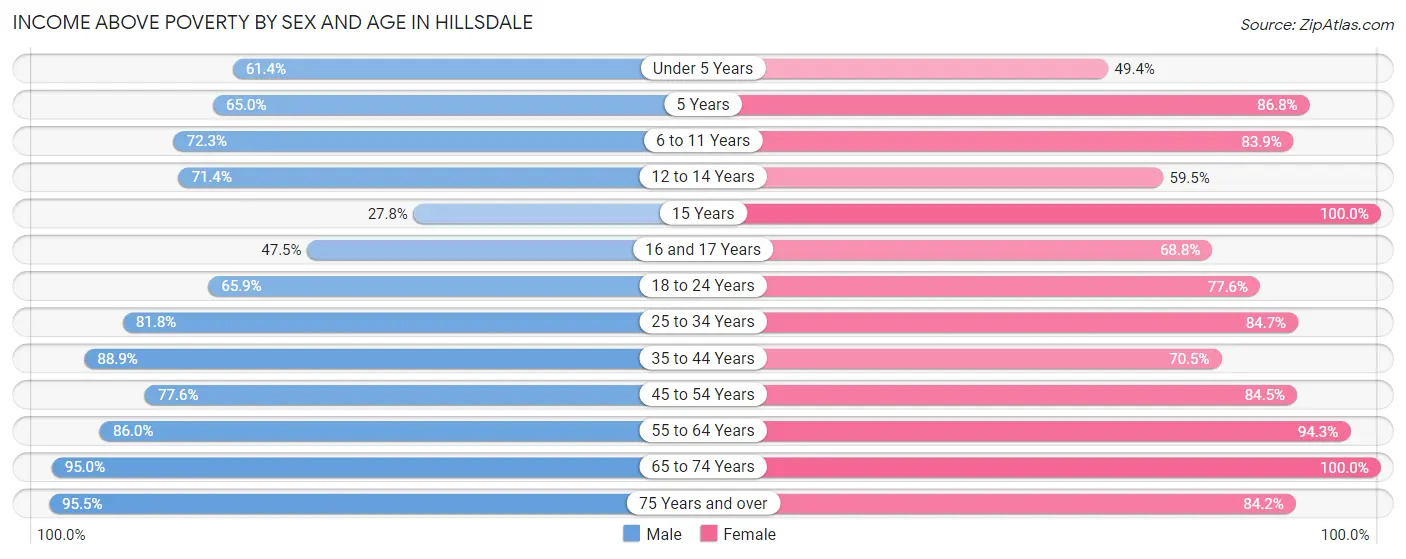
According to the poverty statistics in Hillsdale, males aged 75 years and over and females aged 15 years are the age groups that are most secure financially, with 95.5% of males and 100.0% of females in these age groups living above the poverty line.
| Age Bracket | Male | Female |
| Under 5 Years | 81 (61.4%) | 76 (49.3%) |
| 5 Years | 13 (65.0%) | 92 (86.8%) |
| 6 to 11 Years | 264 (72.3%) | 213 (83.9%) |
| 12 to 14 Years | 100 (71.4%) | 78 (59.5%) |
| 15 Years | 20 (27.8%) | 13 (100.0%) |
| 16 and 17 Years | 48 (47.5%) | 66 (68.8%) |
| 18 to 24 Years | 334 (65.9%) | 360 (77.6%) |
| 25 to 34 Years | 327 (81.8%) | 276 (84.7%) |
| 35 to 44 Years | 352 (88.9%) | 403 (70.5%) |
| 45 to 54 Years | 309 (77.6%) | 272 (84.5%) |
| 55 to 64 Years | 307 (86.0%) | 367 (94.3%) |
| 65 to 74 Years | 207 (95.0%) | 244 (100.0%) |
| 75 Years and over | 147 (95.5%) | 283 (84.2%) |
| Total | 2,509 (77.0%) | 2,743 (80.5%) |
Income Below Poverty Among Married-Couple Families in Hillsdale
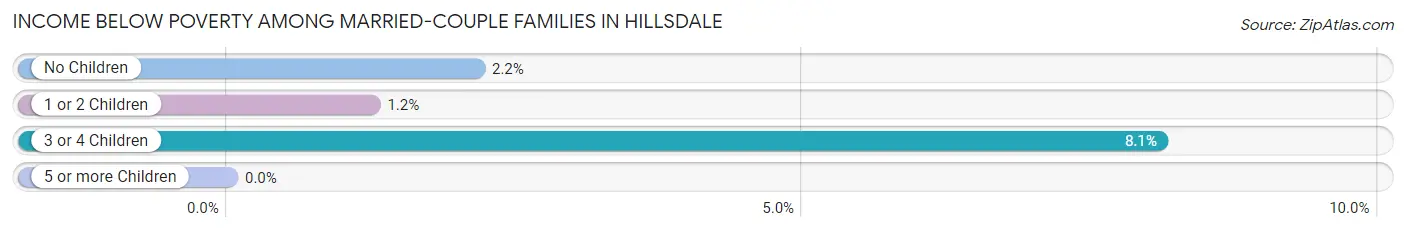
The poverty statistics for married-couple families in Hillsdale show that 3.1% or 32 of the total 1,021 families live below the poverty line. Families with 3 or 4 children have the highest poverty rate of 8.1%, comprising of 17 families. On the other hand, families with 5 or more children have the lowest poverty rate of 0.0%, which includes 0 families.
| Children | Above Poverty | Below Poverty |
| No Children | 547 (97.9%) | 12 (2.1%) |
| 1 or 2 Children | 239 (98.8%) | 3 (1.2%) |
| 3 or 4 Children | 193 (91.9%) | 17 (8.1%) |
| 5 or more Children | 10 (100.0%) | 0 (0.0%) |
| Total | 989 (96.9%) | 32 (3.1%) |
Income Below Poverty Among Single-Parent Households in Hillsdale
According to the poverty data in Hillsdale, 20.0% or 21 single-father households and 49.7% or 179 single-mother households are living below the poverty line. Among single-father households, those with 1 or 2 children have the highest poverty rate, with 21 households (35.6%) experiencing poverty. Likewise, among single-mother households, those with 3 or 4 children have the highest poverty rate, with 85 households (100.0%) falling below the poverty line.
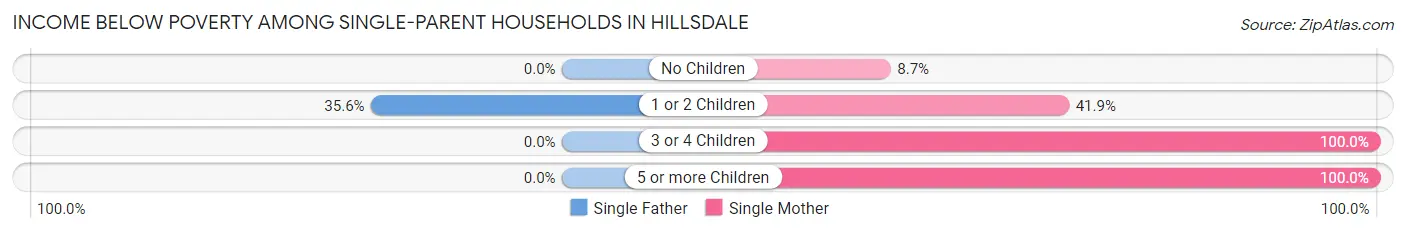
| Children | Single Father | Single Mother |
| No Children | 0 (0.0%) | 8 (8.7%) |
| 1 or 2 Children | 21 (35.6%) | 70 (41.9%) |
| 3 or 4 Children | 0 (0.0%) | 85 (100.0%) |
| 5 or more Children | 0 (0.0%) | 16 (100.0%) |
| Total | 21 (20.0%) | 179 (49.7%) |
Income Below Poverty Among Married-Couple vs Single-Parent Households in Hillsdale
The poverty data for Hillsdale shows that 32 of the married-couple family households (3.1%) and 200 of the single-parent households (43.0%) are living below the poverty level. Within the married-couple family households, those with 3 or 4 children have the highest poverty rate, with 17 households (8.1%) falling below the poverty line. Among the single-parent households, those with 3 or 4 children have the highest poverty rate, with 85 household (100.0%) living below poverty.
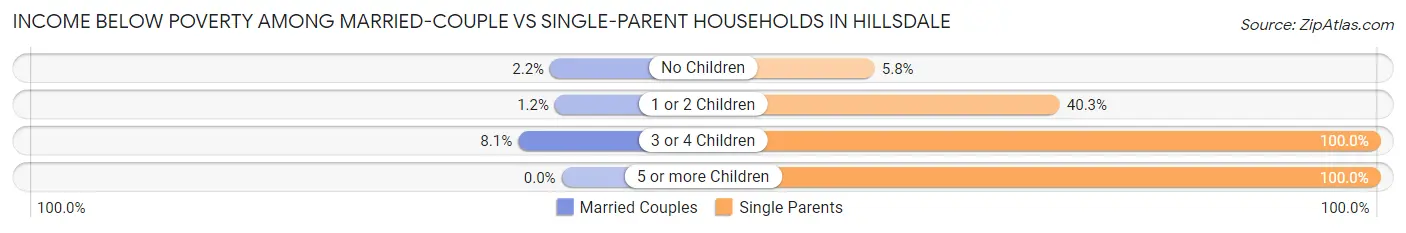
| Children | Married-Couple Families | Single-Parent Households |
| No Children | 12 (2.1%) | 8 (5.8%) |
| 1 or 2 Children | 3 (1.2%) | 91 (40.3%) |
| 3 or 4 Children | 17 (8.1%) | 85 (100.0%) |
| 5 or more Children | 0 (0.0%) | 16 (100.0%) |
| Total | 32 (3.1%) | 200 (43.0%) |
Race in Hillsdale
The most populous races in Hillsdale are White / Caucasian (7,277 | 90.9%), Two or more Races (386 | 4.8%), and Hispanic or Latino (306 | 3.8%).
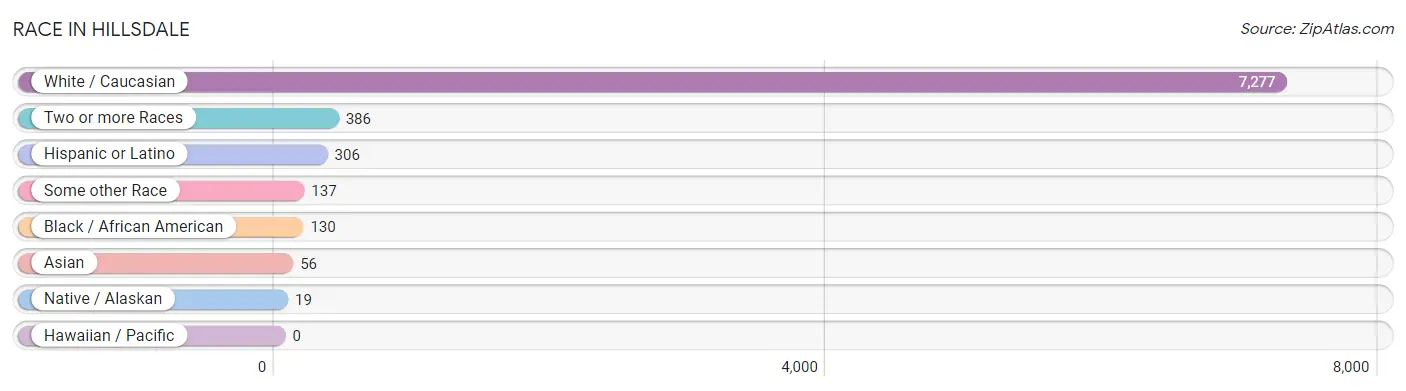
| Race | # Population | % Population |
| Asian | 56 | 0.7% |
| Black / African American | 130 | 1.6% |
| Hawaiian / Pacific | 0 | 0.0% |
| Hispanic or Latino | 306 | 3.8% |
| Native / Alaskan | 19 | 0.2% |
| White / Caucasian | 7,277 | 90.9% |
| Two or more Races | 386 | 4.8% |
| Some other Race | 137 | 1.7% |
| Total | 8,005 | 100.0% |
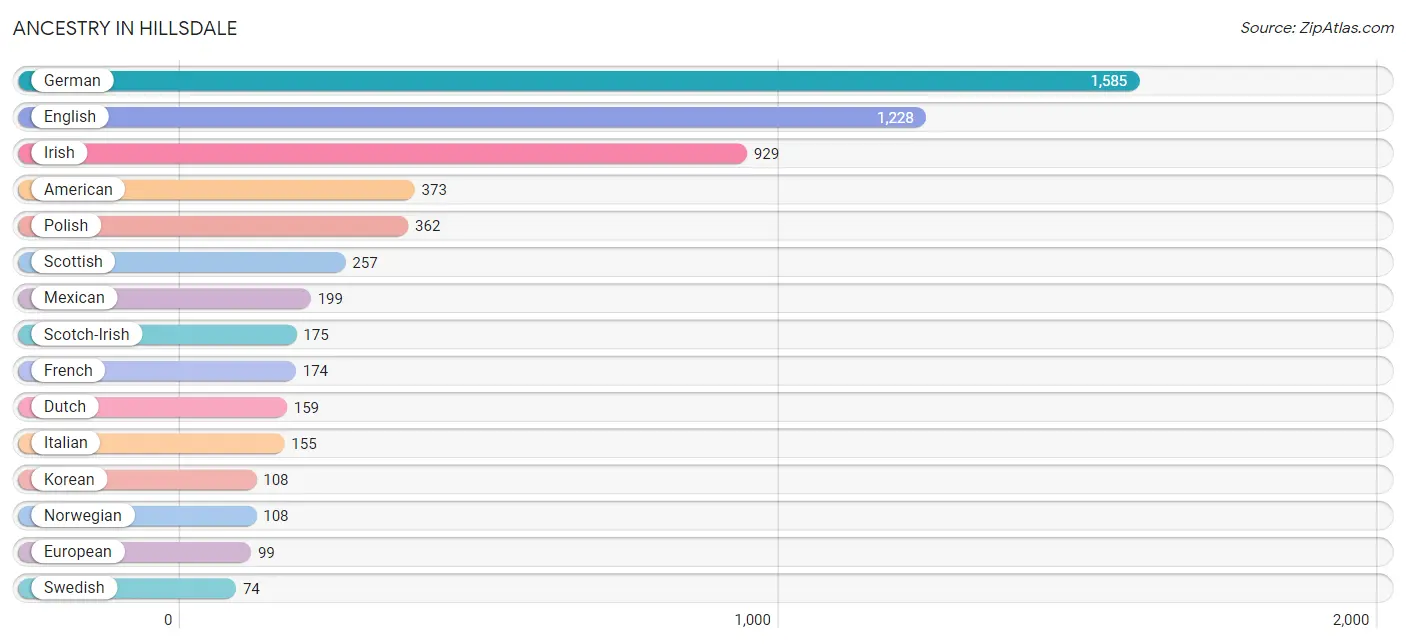
Ancestry in Hillsdale
The most populous ancestries reported in Hillsdale are German (1,585 | 19.8%), English (1,228 | 15.3%), Irish (929 | 11.6%), American (373 | 4.7%), and Polish (362 | 4.5%), together accounting for 55.9% of all Hillsdale residents.
| Ancestry | # Population | % Population |
| African | 12 | 0.2% |
| Albanian | 10 | 0.1% |
| American | 373 | 4.7% |
| Arab | 55 | 0.7% |
| Austrian | 29 | 0.4% |
| Belgian | 1 | 0.0% |
| Bhutanese | 8 | 0.1% |
| British | 30 | 0.4% |
| Burmese | 1 | 0.0% |
| Canadian | 30 | 0.4% |
| Cherokee | 34 | 0.4% |
| Croatian | 16 | 0.2% |
| Cuban | 65 | 0.8% |
| Czech | 22 | 0.3% |
| Danish | 36 | 0.4% |
| Dutch | 159 | 2.0% |
| Eastern European | 6 | 0.1% |
| English | 1,228 | 15.3% |
| European | 99 | 1.2% |
| Finnish | 8 | 0.1% |
| French | 174 | 2.2% |
| French Canadian | 51 | 0.6% |
| German | 1,585 | 19.8% |
| German Russian | 9 | 0.1% |
| Greek | 21 | 0.3% |
| Hungarian | 1 | 0.0% |
| Indian (Asian) | 73 | 0.9% |
| Irish | 929 | 11.6% |
| Iroquois | 29 | 0.4% |
| Israeli | 22 | 0.3% |
| Italian | 155 | 1.9% |
| Korean | 108 | 1.3% |
| Lebanese | 38 | 0.5% |
| Lithuanian | 48 | 0.6% |
| Macedonian | 1 | 0.0% |
| Maltese | 4 | 0.1% |
| Mexican | 199 | 2.5% |
| Mexican American Indian | 10 | 0.1% |
| Northern European | 3 | 0.0% |
| Norwegian | 108 | 1.3% |
| Pennsylvania German | 9 | 0.1% |
| Polish | 362 | 4.5% |
| Portuguese | 17 | 0.2% |
| Potawatomi | 32 | 0.4% |
| Puerto Rican | 34 | 0.4% |
| Romanian | 4 | 0.1% |
| Russian | 15 | 0.2% |
| Scandinavian | 60 | 0.7% |
| Scotch-Irish | 175 | 2.2% |
| Scottish | 257 | 3.2% |
| Slavic | 38 | 0.5% |
| Spanish | 1 | 0.0% |
| Sri Lankan | 25 | 0.3% |
| Subsaharan African | 12 | 0.2% |
| Swedish | 74 | 0.9% |
| Swiss | 64 | 0.8% |
| Thai | 3 | 0.0% |
| Ukrainian | 22 | 0.3% |
| Welsh | 20 | 0.3% | View All 59 Rows |
Immigrants in Hillsdale
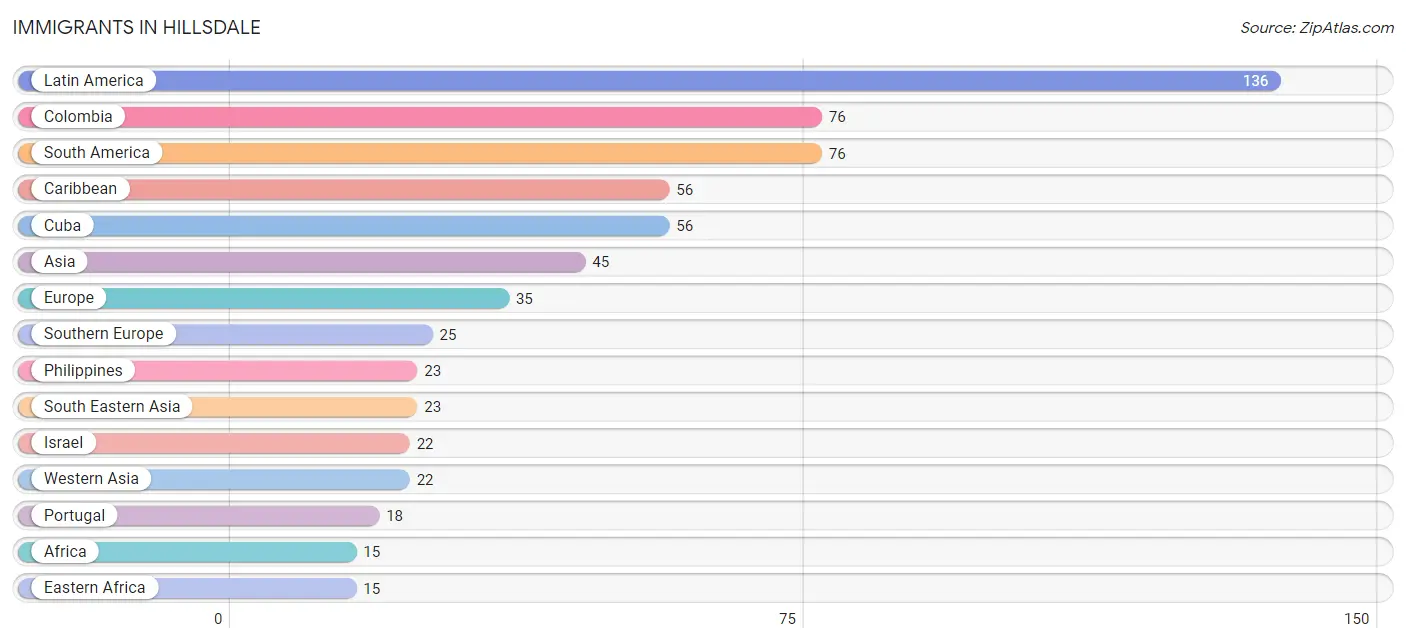
The most numerous immigrant groups reported in Hillsdale came from Latin America (136 | 1.7%), Colombia (76 | 0.9%), South America (76 | 0.9%), Caribbean (56 | 0.7%), and Cuba (56 | 0.7%), together accounting for 5.0% of all Hillsdale residents.
| Immigration Origin | # Population | % Population |
| Africa | 15 | 0.2% |
| Asia | 45 | 0.6% |
| Caribbean | 56 | 0.7% |
| Central America | 4 | 0.1% |
| Colombia | 76 | 0.9% |
| Cuba | 56 | 0.7% |
| Eastern Africa | 15 | 0.2% |
| England | 10 | 0.1% |
| Europe | 35 | 0.4% |
| Greece | 7 | 0.1% |
| Israel | 22 | 0.3% |
| Kenya | 15 | 0.2% |
| Latin America | 136 | 1.7% |
| Mexico | 4 | 0.1% |
| Northern Europe | 10 | 0.1% |
| Philippines | 23 | 0.3% |
| Portugal | 18 | 0.2% |
| South America | 76 | 0.9% |
| South Eastern Asia | 23 | 0.3% |
| Southern Europe | 25 | 0.3% |
| Western Asia | 22 | 0.3% | View All 21 Rows |
Sex and Age in Hillsdale
Sex and Age in Hillsdale
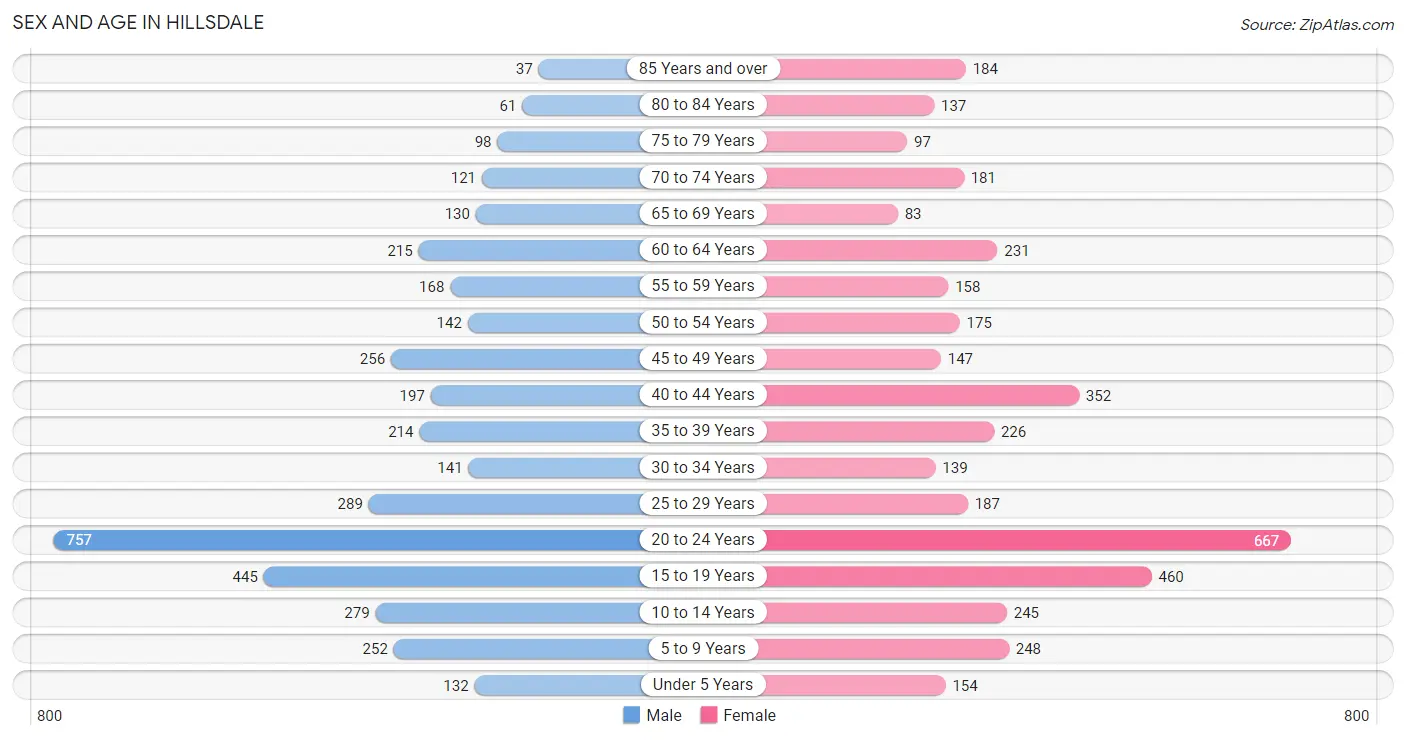
The most populous age groups in Hillsdale are 20 to 24 Years (757 | 19.2%) for men and 20 to 24 Years (667 | 16.4%) for women.
| Age Bracket | Male | Female |
| Under 5 Years | 132 (3.4%) | 154 (3.8%) |
| 5 to 9 Years | 252 (6.4%) | 248 (6.1%) |
| 10 to 14 Years | 279 (7.1%) | 245 (6.0%) |
| 15 to 19 Years | 445 (11.3%) | 460 (11.3%) |
| 20 to 24 Years | 757 (19.2%) | 667 (16.4%) |
| 25 to 29 Years | 289 (7.3%) | 187 (4.6%) |
| 30 to 34 Years | 141 (3.6%) | 139 (3.4%) |
| 35 to 39 Years | 214 (5.4%) | 226 (5.6%) |
| 40 to 44 Years | 197 (5.0%) | 352 (8.6%) |
| 45 to 49 Years | 256 (6.5%) | 147 (3.6%) |
| 50 to 54 Years | 142 (3.6%) | 175 (4.3%) |
| 55 to 59 Years | 168 (4.3%) | 158 (3.9%) |
| 60 to 64 Years | 215 (5.5%) | 231 (5.7%) |
| 65 to 69 Years | 130 (3.3%) | 83 (2.0%) |
| 70 to 74 Years | 121 (3.1%) | 181 (4.4%) |
| 75 to 79 Years | 98 (2.5%) | 97 (2.4%) |
| 80 to 84 Years | 61 (1.5%) | 137 (3.4%) |
| 85 Years and over | 37 (0.9%) | 184 (4.5%) |
| Total | 3,934 (100.0%) | 4,071 (100.0%) |
Families and Households in Hillsdale
Median Family Size in Hillsdale
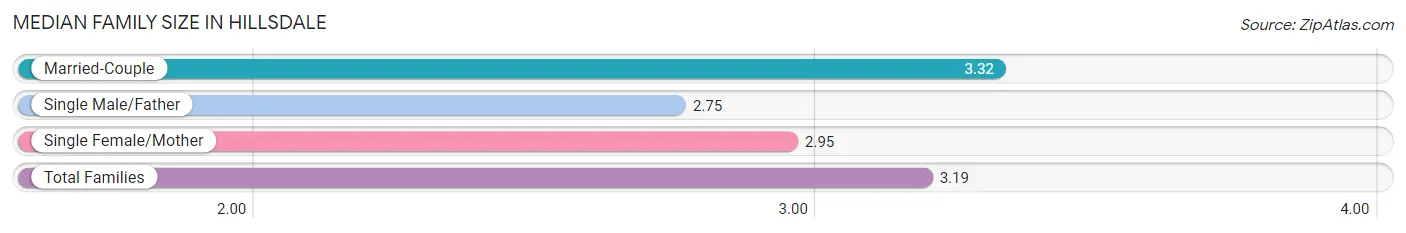
The median family size in Hillsdale is 3.19 persons per family, with married-couple families (1,021 | 68.7%) accounting for the largest median family size of 3.32 persons per family. On the other hand, single male/father families (105 | 7.1%) represent the smallest median family size with 2.75 persons per family.
| Family Type | # Families | Family Size |
| Married-Couple | 1,021 (68.7%) | 3.32 |
| Single Male/Father | 105 (7.1%) | 2.75 |
| Single Female/Mother | 360 (24.2%) | 2.95 |
| Total Families | 1,486 (100.0%) | 3.19 |
Median Household Size in Hillsdale
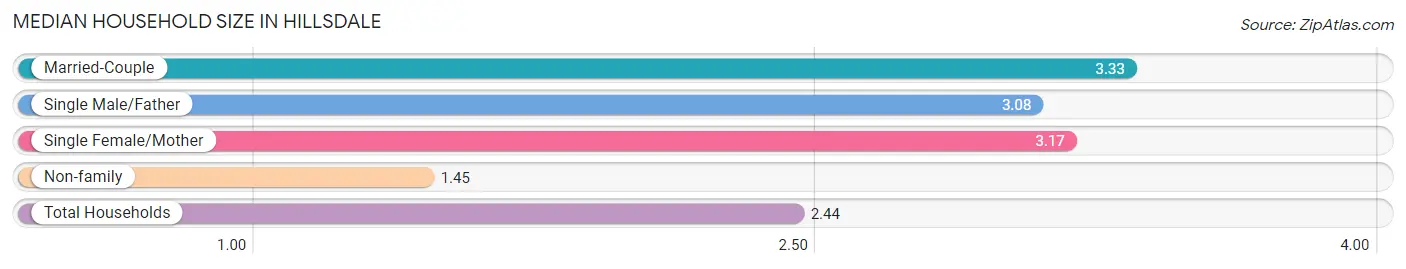
The median household size in Hillsdale is 2.44 persons per household, with married-couple households (1,021 | 37.5%) accounting for the largest median household size of 3.33 persons per household. non-family households (1,234 | 45.4%) represent the smallest median household size with 1.45 persons per household.
| Household Type | # Households | Household Size |
| Married-Couple | 1,021 (37.5%) | 3.33 |
| Single Male/Father | 105 (3.9%) | 3.08 |
| Single Female/Mother | 360 (13.2%) | 3.17 |
| Non-family | 1,234 (45.4%) | 1.45 |
| Total Households | 2,720 (100.0%) | 2.44 |
Household Size by Marriage Status in Hillsdale
Out of a total of 2,720 households in Hillsdale, 1,486 (54.6%) are family households, while 1,234 (45.4%) are nonfamily households. The most numerous type of family households are 2-person households, comprising 684, and the most common type of nonfamily households are 1-person households, comprising 948.
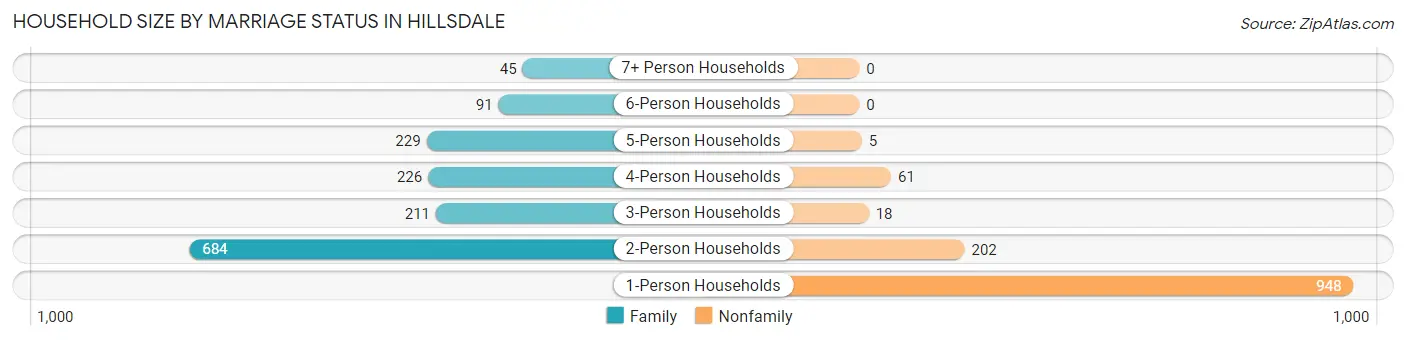
| Household Size | Family Households | Nonfamily Households |
| 1-Person Households | - | 948 (34.8%) |
| 2-Person Households | 684 (25.2%) | 202 (7.4%) |
| 3-Person Households | 211 (7.8%) | 18 (0.7%) |
| 4-Person Households | 226 (8.3%) | 61 (2.2%) |
| 5-Person Households | 229 (8.4%) | 5 (0.2%) |
| 6-Person Households | 91 (3.4%) | 0 (0.0%) |
| 7+ Person Households | 45 (1.7%) | 0 (0.0%) |
| Total | 1,486 (54.6%) | 1,234 (45.4%) |
Female Fertility in Hillsdale
Fertility by Age in Hillsdale
Average fertility rate in Hillsdale is 48.0 births per 1,000 women. Women in the age bracket of 35 to 50 years have the highest fertility rate with 84.0 births per 1,000 women. Women in the age bracket of 35 to 50 years acount for 58.5% of all women with births.
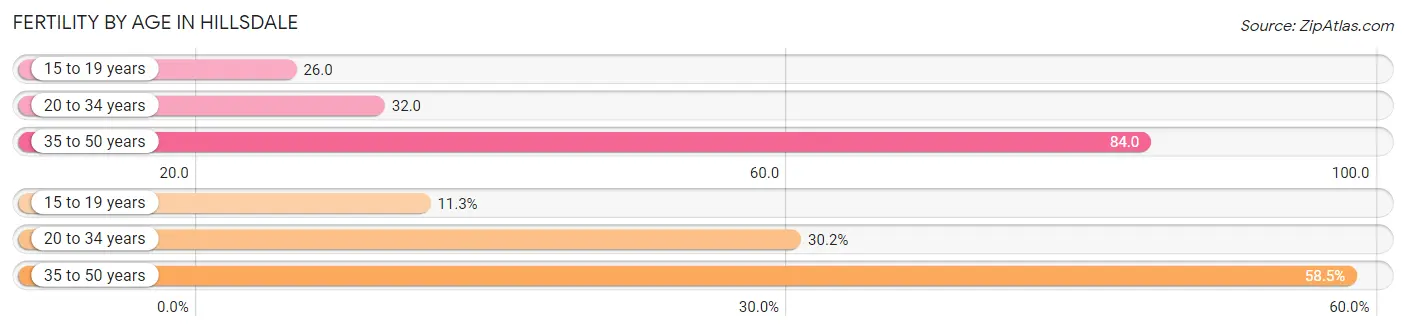
| Age Bracket | Women with Births | Births / 1,000 Women |
| 15 to 19 years | 12 (11.3%) | 26.0 |
| 20 to 34 years | 32 (30.2%) | 32.0 |
| 35 to 50 years | 62 (58.5%) | 84.0 |
| Total | 106 (100.0%) | 48.0 |
Fertility by Age by Marriage Status in Hillsdale
51.9% of women with births (106) in Hillsdale are married. The highest percentage of unmarried women with births falls into 15 to 19 years age bracket with 100.0% of them unmarried at the time of birth, while the lowest percentage of unmarried women with births belong to 20 to 34 years age bracket with 0.0% of them unmarried.
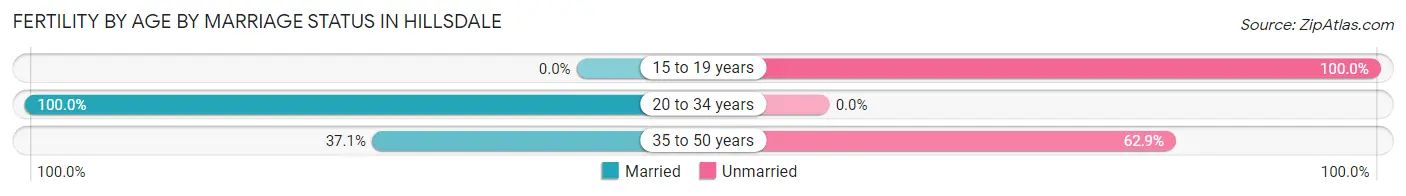
| Age Bracket | Married | Unmarried |
| 15 to 19 years | 0 (0.0%) | 12 (100.0%) |
| 20 to 34 years | 32 (100.0%) | 0 (0.0%) |
| 35 to 50 years | 23 (37.1%) | 39 (62.9%) |
| Total | 55 (51.9%) | 51 (48.1%) |
Fertility by Education in Hillsdale
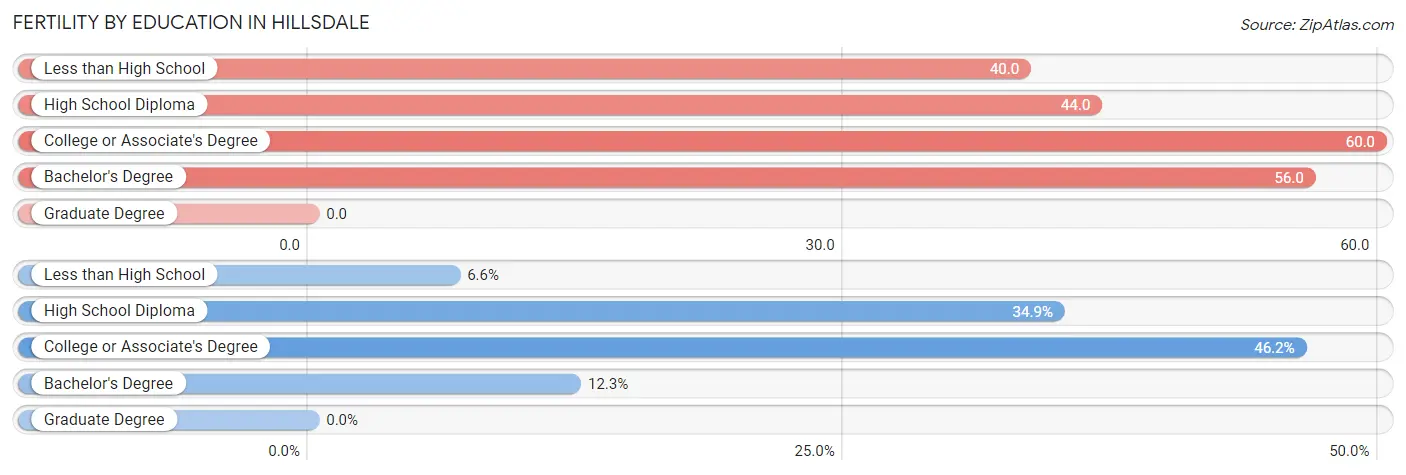
| Educational Attainment | Women with Births | Births / 1,000 Women |
| Less than High School | 7 (6.6%) | 40.0 |
| High School Diploma | 37 (34.9%) | 44.0 |
| College or Associate's Degree | 49 (46.2%) | 60.0 |
| Bachelor's Degree | 13 (12.3%) | 56.0 |
| Graduate Degree | 0 (0.0%) | 0.0 |
| Total | 106 (100.0%) | 48.0 |
Fertility by Education by Marriage Status in Hillsdale
48.1% of women with births in Hillsdale are unmarried. Women with the educational attainment of bachelor's degree are most likely to be married with 100.0% of them married at childbirth, while women with the educational attainment of less than high school are least likely to be married with 100.0% of them unmarried at childbirth.
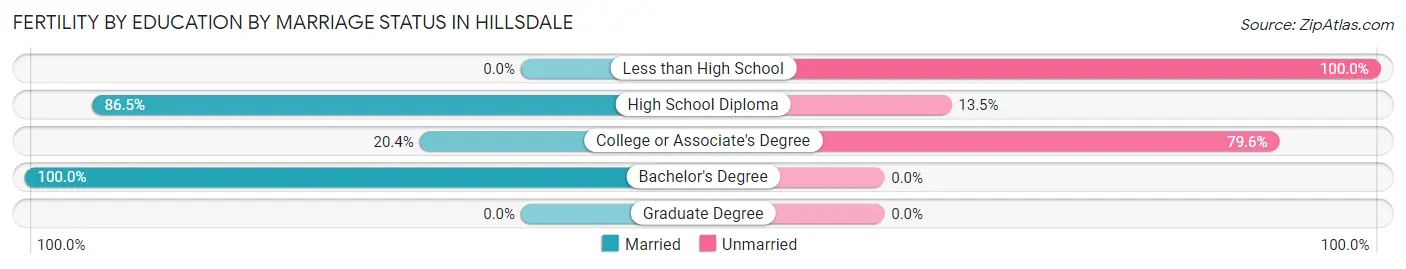
| Educational Attainment | Married | Unmarried |
| Less than High School | 0 (0.0%) | 7 (100.0%) |
| High School Diploma | 32 (86.5%) | 5 (13.5%) |
| College or Associate's Degree | 10 (20.4%) | 39 (79.6%) |
| Bachelor's Degree | 13 (100.0%) | 0 (0.0%) |
| Graduate Degree | 0 (0.0%) | 0 (0.0%) |
| Total | 55 (51.9%) | 51 (48.1%) |
Employment Characteristics in Hillsdale
Employment by Class of Employer in Hillsdale
Among the 3,698 employed individuals in Hillsdale, private company employees (2,447 | 66.2%), not-for-profit organizations (496 | 13.4%), and self-employed (not incorporated) (268 | 7.2%) make up the most common classes of employment.
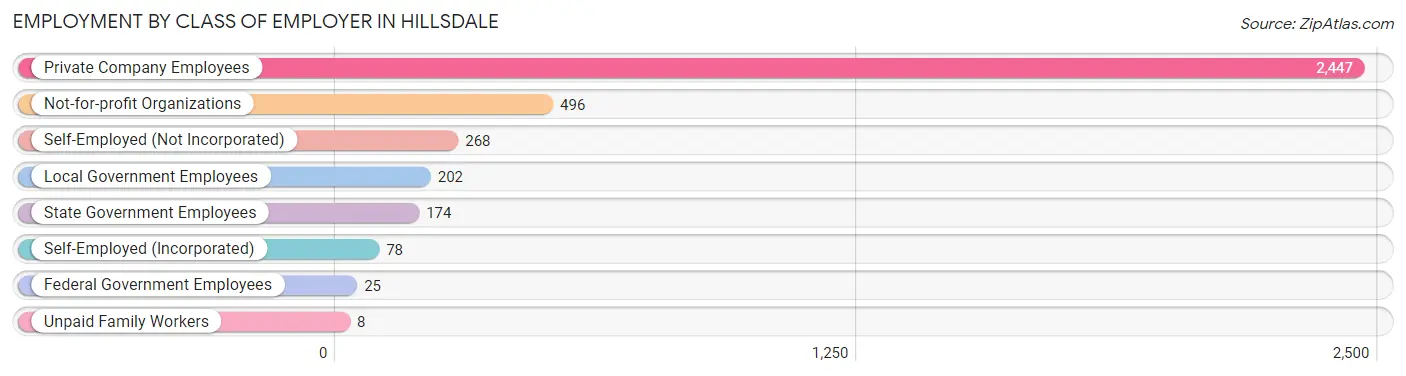
| Employer Class | # Employees | % Employees |
| Private Company Employees | 2,447 | 66.2% |
| Self-Employed (Incorporated) | 78 | 2.1% |
| Self-Employed (Not Incorporated) | 268 | 7.2% |
| Not-for-profit Organizations | 496 | 13.4% |
| Local Government Employees | 202 | 5.5% |
| State Government Employees | 174 | 4.7% |
| Federal Government Employees | 25 | 0.7% |
| Unpaid Family Workers | 8 | 0.2% |
| Total | 3,698 | 100.0% |
Employment Status by Age in Hillsdale
According to the labor force statistics for Hillsdale, out of the total population over 16 years of age (6,610), 60.2% or 3,979 individuals are in the labor force, with 3.6% or 143 of them unemployed. The age group with the highest labor force participation rate is 30 to 34 years, with 95.0% or 266 individuals in the labor force. Within the labor force, the 20 to 24 years age range has the highest percentage of unemployed individuals, with 6.0% or 73 of them being unemployed.
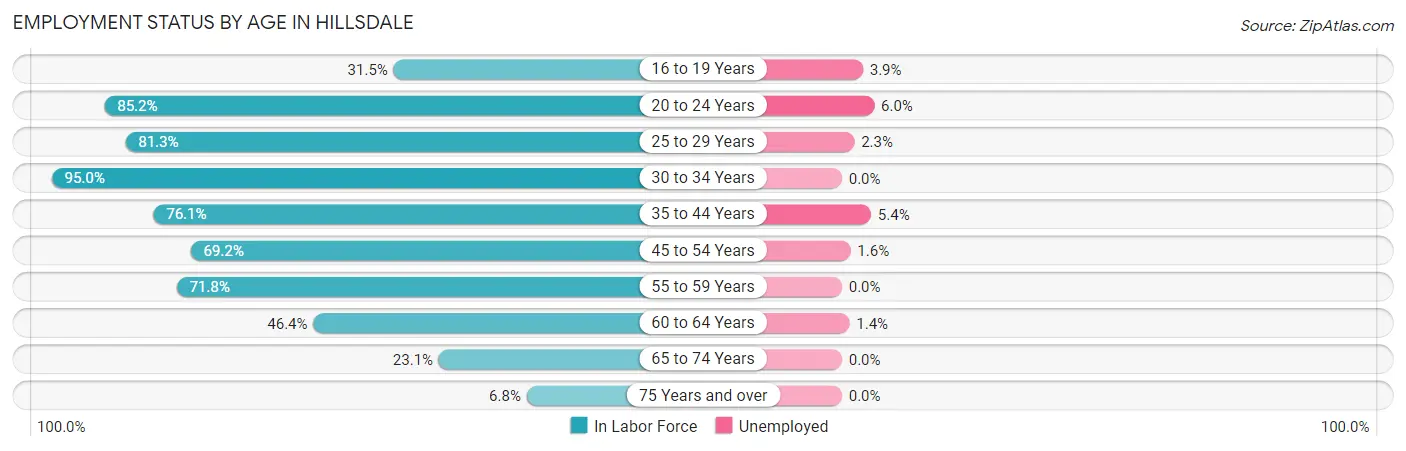
| Age Bracket | In Labor Force | Unemployed |
| 16 to 19 Years | 258 (31.5%) | 10 (3.9%) |
| 20 to 24 Years | 1,213 (85.2%) | 73 (6.0%) |
| 25 to 29 Years | 387 (81.3%) | 9 (2.3%) |
| 30 to 34 Years | 266 (95.0%) | 0 (0.0%) |
| 35 to 44 Years | 753 (76.1%) | 41 (5.4%) |
| 45 to 54 Years | 498 (69.2%) | 8 (1.6%) |
| 55 to 59 Years | 234 (71.8%) | 0 (0.0%) |
| 60 to 64 Years | 207 (46.4%) | 3 (1.4%) |
| 65 to 74 Years | 119 (23.1%) | 0 (0.0%) |
| 75 Years and over | 42 (6.8%) | 0 (0.0%) |
| Total | 3,979 (60.2%) | 143 (3.6%) |
Employment Status by Educational Attainment in Hillsdale
According to labor force statistics for Hillsdale, 72.4% of individuals (2,344) out of the total population between 25 and 64 years of age (3,237) are in the labor force, with 2.6% or 61 of them being unemployed. The group with the highest labor force participation rate are those with the educational attainment of college / associate degree, with 78.8% or 732 individuals in the labor force. Within the labor force, individuals with college / associate degree education have the highest percentage of unemployment, with 4.9% or 36 of them being unemployed.
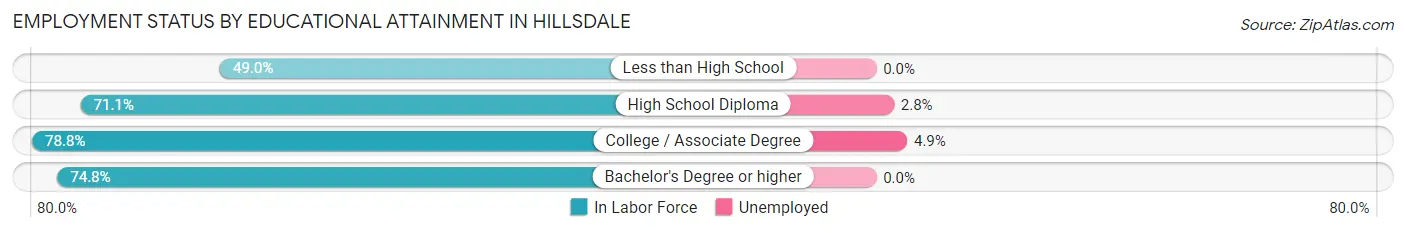
| Educational Attainment | In Labor Force | Unemployed |
| Less than High School | 127 (49.0%) | 0 (0.0%) |
| High School Diploma | 904 (71.1%) | 36 (2.8%) |
| College / Associate Degree | 732 (78.8%) | 46 (4.9%) |
| Bachelor's Degree or higher | 581 (74.8%) | 0 (0.0%) |
| Total | 2,344 (72.4%) | 84 (2.6%) |
Employment Occupations by Sex in Hillsdale
Management, Business, Science and Arts Occupations
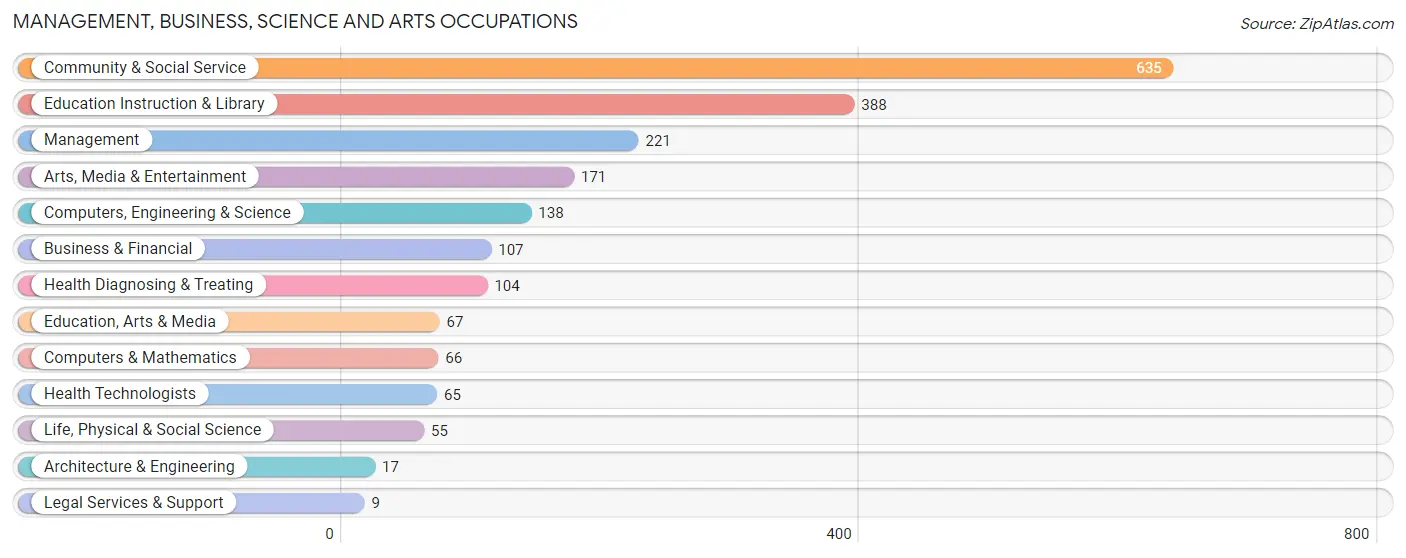
The most common Management, Business, Science and Arts occupations in Hillsdale are Community & Social Service (635 | 16.6%), Education Instruction & Library (388 | 10.1%), Management (221 | 5.8%), Arts, Media & Entertainment (171 | 4.5%), and Computers, Engineering & Science (138 | 3.6%).
Management, Business, Science and Arts Occupations by Sex
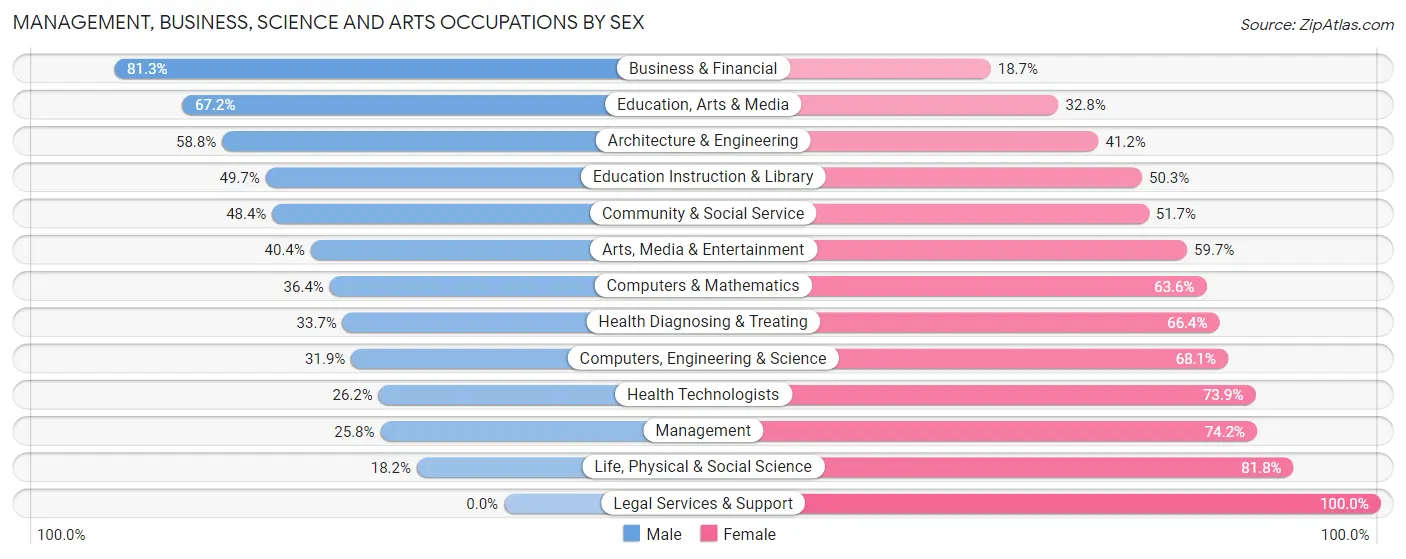
Within the Management, Business, Science and Arts occupations in Hillsdale, the most male-oriented occupations are Business & Financial (81.3%), Education, Arts & Media (67.2%), and Architecture & Engineering (58.8%), while the most female-oriented occupations are Legal Services & Support (100.0%), Life, Physical & Social Science (81.8%), and Management (74.2%).
| Occupation | Male | Female |
| Management | 57 (25.8%) | 164 (74.2%) |
| Business & Financial | 87 (81.3%) | 20 (18.7%) |
| Computers, Engineering & Science | 44 (31.9%) | 94 (68.1%) |
| Computers & Mathematics | 24 (36.4%) | 42 (63.6%) |
| Architecture & Engineering | 10 (58.8%) | 7 (41.2%) |
| Life, Physical & Social Science | 10 (18.2%) | 45 (81.8%) |
| Community & Social Service | 307 (48.3%) | 328 (51.6%) |
| Education, Arts & Media | 45 (67.2%) | 22 (32.8%) |
| Legal Services & Support | 0 (0.0%) | 9 (100.0%) |
| Education Instruction & Library | 193 (49.7%) | 195 (50.3%) |
| Arts, Media & Entertainment | 69 (40.4%) | 102 (59.7%) |
| Health Diagnosing & Treating | 35 (33.7%) | 69 (66.3%) |
| Health Technologists | 17 (26.2%) | 48 (73.9%) |
| Total (Category) | 530 (44.0%) | 675 (56.0%) |
| Total (Overall) | 1,897 (49.5%) | 1,933 (50.5%) |
Services Occupations
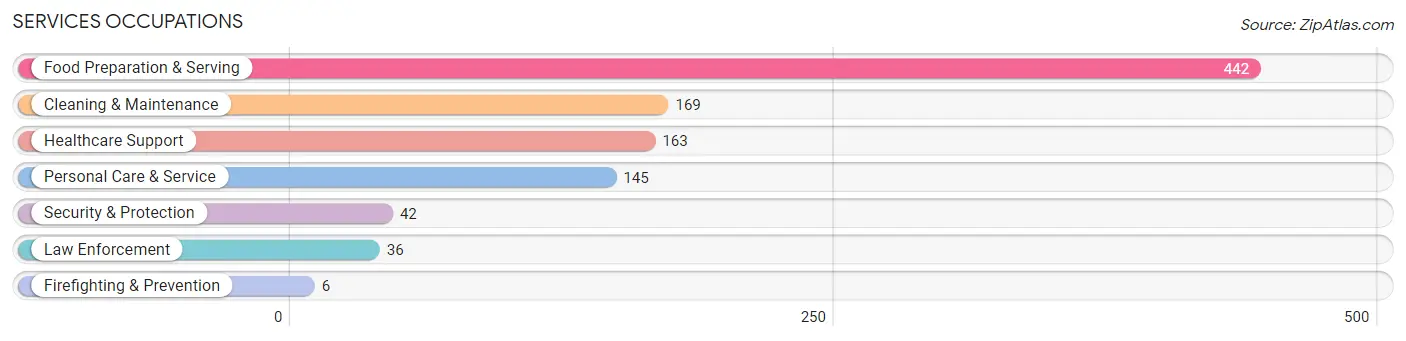
The most common Services occupations in Hillsdale are Food Preparation & Serving (442 | 11.5%), Cleaning & Maintenance (169 | 4.4%), Healthcare Support (163 | 4.3%), Personal Care & Service (145 | 3.8%), and Security & Protection (42 | 1.1%).
Services Occupations by Sex
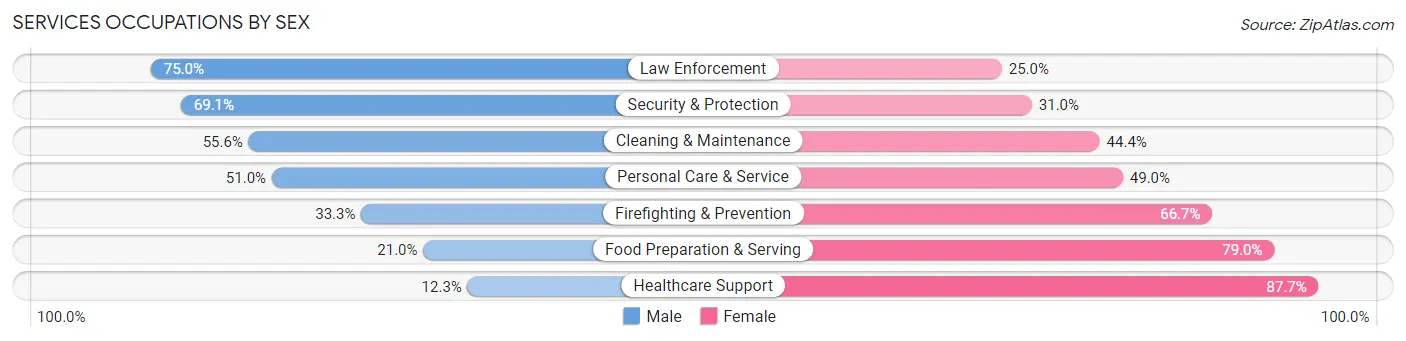
Within the Services occupations in Hillsdale, the most male-oriented occupations are Law Enforcement (75.0%), Security & Protection (69.1%), and Cleaning & Maintenance (55.6%), while the most female-oriented occupations are Healthcare Support (87.7%), Food Preparation & Serving (79.0%), and Firefighting & Prevention (66.7%).
| Occupation | Male | Female |
| Healthcare Support | 20 (12.3%) | 143 (87.7%) |
| Security & Protection | 29 (69.1%) | 13 (30.9%) |
| Firefighting & Prevention | 2 (33.3%) | 4 (66.7%) |
| Law Enforcement | 27 (75.0%) | 9 (25.0%) |
| Food Preparation & Serving | 93 (21.0%) | 349 (79.0%) |
| Cleaning & Maintenance | 94 (55.6%) | 75 (44.4%) |
| Personal Care & Service | 74 (51.0%) | 71 (49.0%) |
| Total (Category) | 310 (32.3%) | 651 (67.7%) |
| Total (Overall) | 1,897 (49.5%) | 1,933 (50.5%) |
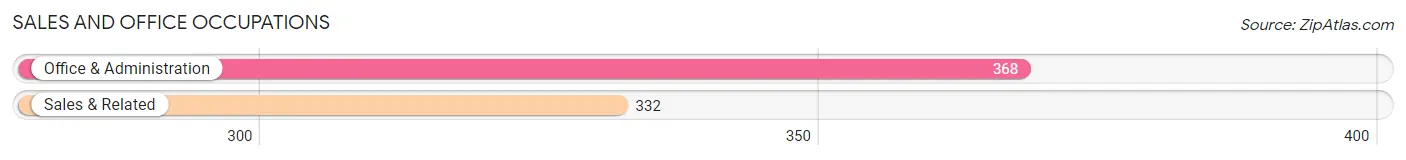
Sales and Office Occupations
The most common Sales and Office occupations in Hillsdale are Office & Administration (368 | 9.6%), and Sales & Related (332 | 8.7%).
Sales and Office Occupations by Sex
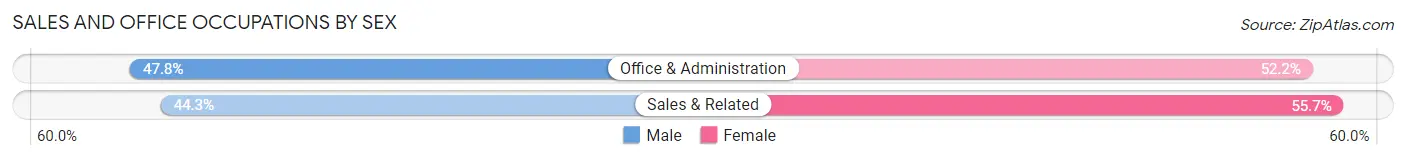
| Occupation | Male | Female |
| Sales & Related | 147 (44.3%) | 185 (55.7%) |
| Office & Administration | 176 (47.8%) | 192 (52.2%) |
| Total (Category) | 323 (46.1%) | 377 (53.9%) |
| Total (Overall) | 1,897 (49.5%) | 1,933 (50.5%) |
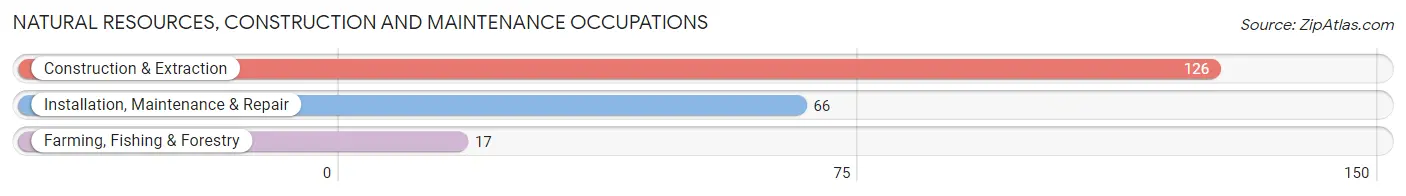
Natural Resources, Construction and Maintenance Occupations
The most common Natural Resources, Construction and Maintenance occupations in Hillsdale are Construction & Extraction (126 | 3.3%), Installation, Maintenance & Repair (66 | 1.7%), and Farming, Fishing & Forestry (17 | 0.4%).
Natural Resources, Construction and Maintenance Occupations by Sex
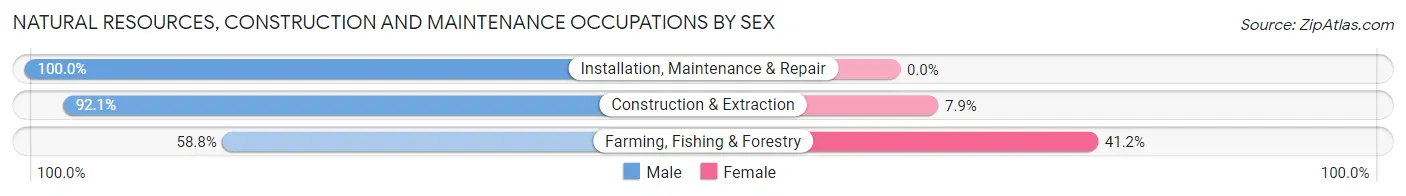
| Occupation | Male | Female |
| Farming, Fishing & Forestry | 10 (58.8%) | 7 (41.2%) |
| Construction & Extraction | 116 (92.1%) | 10 (7.9%) |
| Installation, Maintenance & Repair | 66 (100.0%) | 0 (0.0%) |
| Total (Category) | 192 (91.9%) | 17 (8.1%) |
| Total (Overall) | 1,897 (49.5%) | 1,933 (50.5%) |
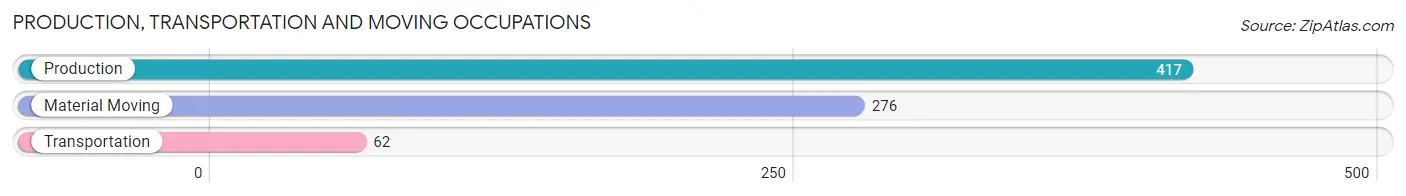
Production, Transportation and Moving Occupations
The most common Production, Transportation and Moving occupations in Hillsdale are Production (417 | 10.9%), Material Moving (276 | 7.2%), and Transportation (62 | 1.6%).
Production, Transportation and Moving Occupations by Sex
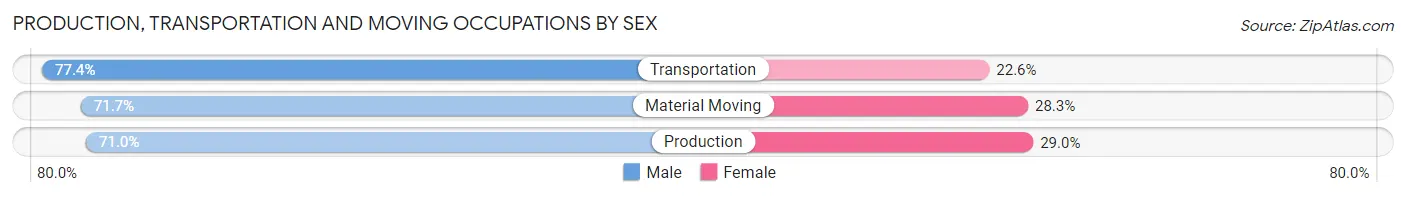
| Occupation | Male | Female |
| Production | 296 (71.0%) | 121 (29.0%) |
| Transportation | 48 (77.4%) | 14 (22.6%) |
| Material Moving | 198 (71.7%) | 78 (28.3%) |
| Total (Category) | 542 (71.8%) | 213 (28.2%) |
| Total (Overall) | 1,897 (49.5%) | 1,933 (50.5%) |
Employment Industries by Sex in Hillsdale
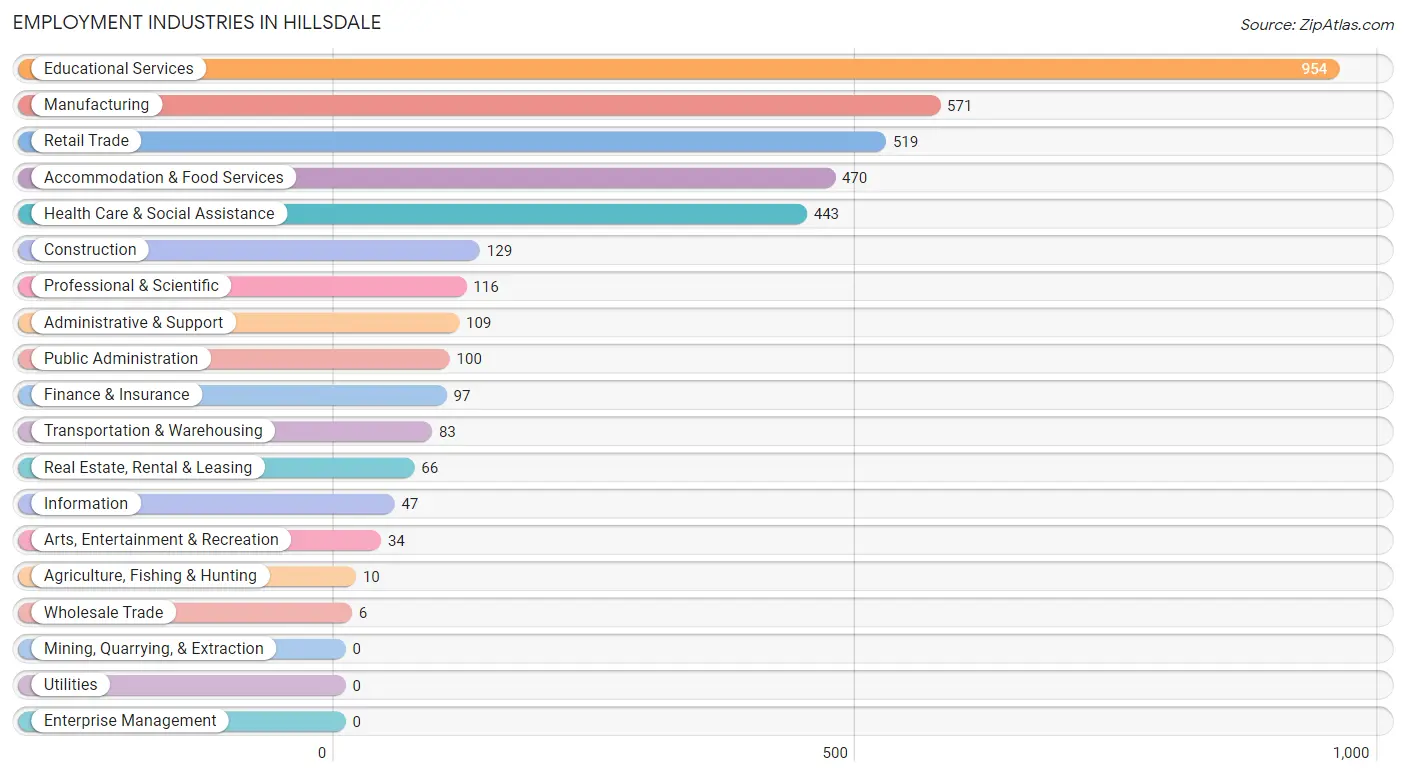
Employment Industries in Hillsdale
The major employment industries in Hillsdale include Educational Services (954 | 24.9%), Manufacturing (571 | 14.9%), Retail Trade (519 | 13.6%), Accommodation & Food Services (470 | 12.3%), and Health Care & Social Assistance (443 | 11.6%).
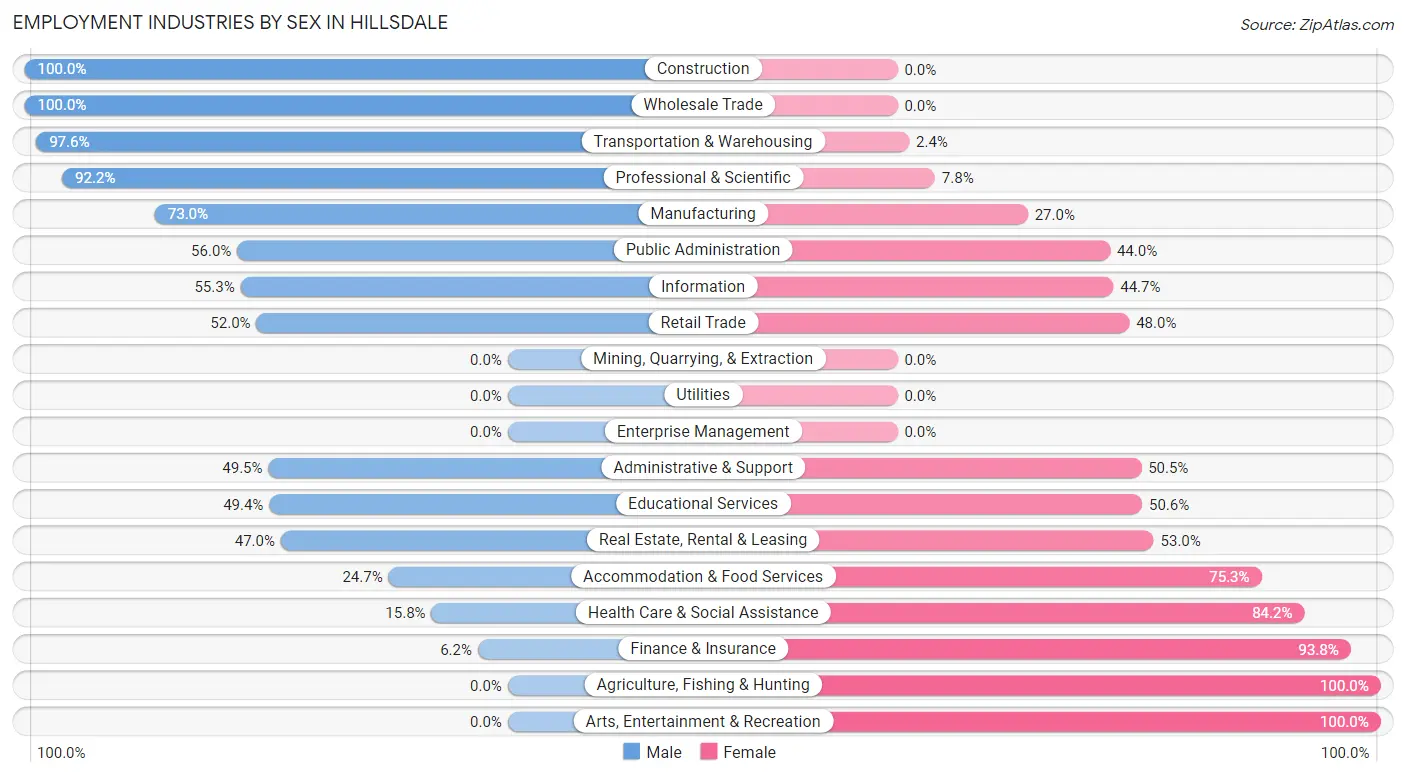
Employment Industries by Sex in Hillsdale
The Hillsdale industries that see more men than women are Construction (100.0%), Wholesale Trade (100.0%), and Transportation & Warehousing (97.6%), whereas the industries that tend to have a higher number of women are Agriculture, Fishing & Hunting (100.0%), Arts, Entertainment & Recreation (100.0%), and Finance & Insurance (93.8%).
| Industry | Male | Female |
| Agriculture, Fishing & Hunting | 0 (0.0%) | 10 (100.0%) |
| Mining, Quarrying, & Extraction | 0 (0.0%) | 0 (0.0%) |
| Construction | 129 (100.0%) | 0 (0.0%) |
| Manufacturing | 417 (73.0%) | 154 (27.0%) |
| Wholesale Trade | 6 (100.0%) | 0 (0.0%) |
| Retail Trade | 270 (52.0%) | 249 (48.0%) |
| Transportation & Warehousing | 81 (97.6%) | 2 (2.4%) |
| Utilities | 0 (0.0%) | 0 (0.0%) |
| Information | 26 (55.3%) | 21 (44.7%) |
| Finance & Insurance | 6 (6.2%) | 91 (93.8%) |
| Real Estate, Rental & Leasing | 31 (47.0%) | 35 (53.0%) |
| Professional & Scientific | 107 (92.2%) | 9 (7.8%) |
| Enterprise Management | 0 (0.0%) | 0 (0.0%) |
| Administrative & Support | 54 (49.5%) | 55 (50.5%) |
| Educational Services | 471 (49.4%) | 483 (50.6%) |
| Health Care & Social Assistance | 70 (15.8%) | 373 (84.2%) |
| Arts, Entertainment & Recreation | 0 (0.0%) | 34 (100.0%) |
| Accommodation & Food Services | 116 (24.7%) | 354 (75.3%) |
| Public Administration | 56 (56.0%) | 44 (44.0%) |
| Total | 1,897 (49.5%) | 1,933 (50.5%) |
Education in Hillsdale
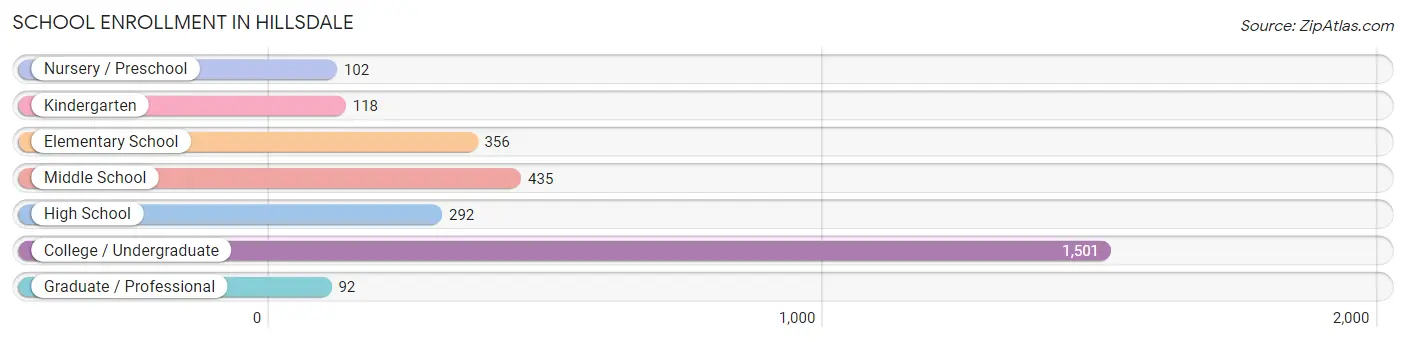
School Enrollment in Hillsdale
The most common levels of schooling among the 2,896 students in Hillsdale are college / undergraduate (1,501 | 51.8%), middle school (435 | 15.0%), and elementary school (356 | 12.3%).
| School Level | # Students | % Students |
| Nursery / Preschool | 102 | 3.5% |
| Kindergarten | 118 | 4.1% |
| Elementary School | 356 | 12.3% |
| Middle School | 435 | 15.0% |
| High School | 292 | 10.1% |
| College / Undergraduate | 1,501 | 51.8% |
| Graduate / Professional | 92 | 3.2% |
| Total | 2,896 | 100.0% |
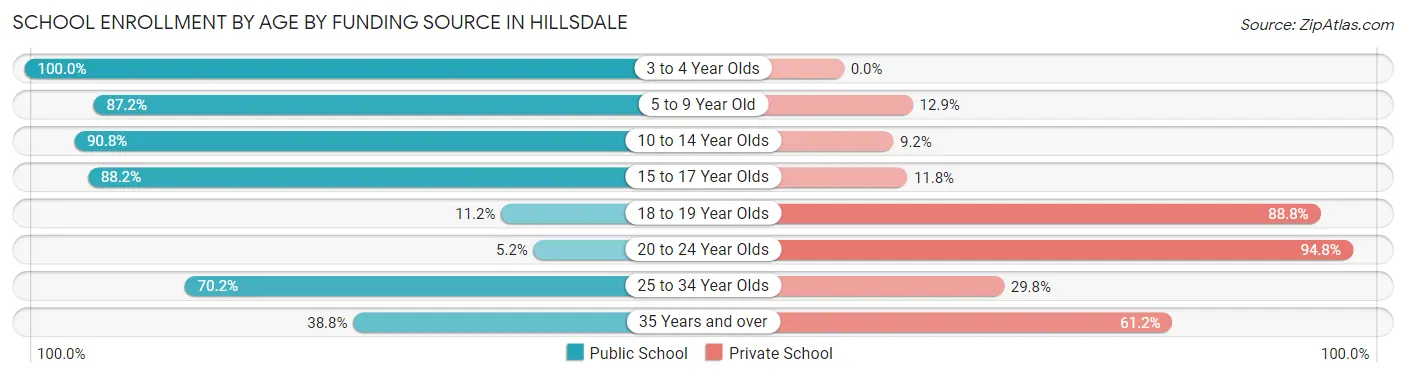
School Enrollment by Age by Funding Source in Hillsdale
Out of a total of 2,896 students who are enrolled in schools in Hillsdale, 1,587 (54.8%) attend a private institution, while the remaining 1,309 (45.2%) are enrolled in public schools. The age group of 20 to 24 year olds has the highest likelihood of being enrolled in private schools, with 898 (94.8% in the age bracket) enrolled. Conversely, the age group of 3 to 4 year olds has the lowest likelihood of being enrolled in a private school, with 67 (100.0% in the age bracket) attending a public institution.
| Age Bracket | Public School | Private School |
| 3 to 4 Year Olds | 67 (100.0%) | 0 (0.0%) |
| 5 to 9 Year Old | 400 (87.2%) | 59 (12.9%) |
| 10 to 14 Year Olds | 454 (90.8%) | 46 (9.2%) |
| 15 to 17 Year Olds | 217 (88.2%) | 29 (11.8%) |
| 18 to 19 Year Olds | 64 (11.2%) | 507 (88.8%) |
| 20 to 24 Year Olds | 49 (5.2%) | 898 (94.8%) |
| 25 to 34 Year Olds | 40 (70.2%) | 17 (29.8%) |
| 35 Years and over | 19 (38.8%) | 30 (61.2%) |
| Total | 1,309 (45.2%) | 1,587 (54.8%) |
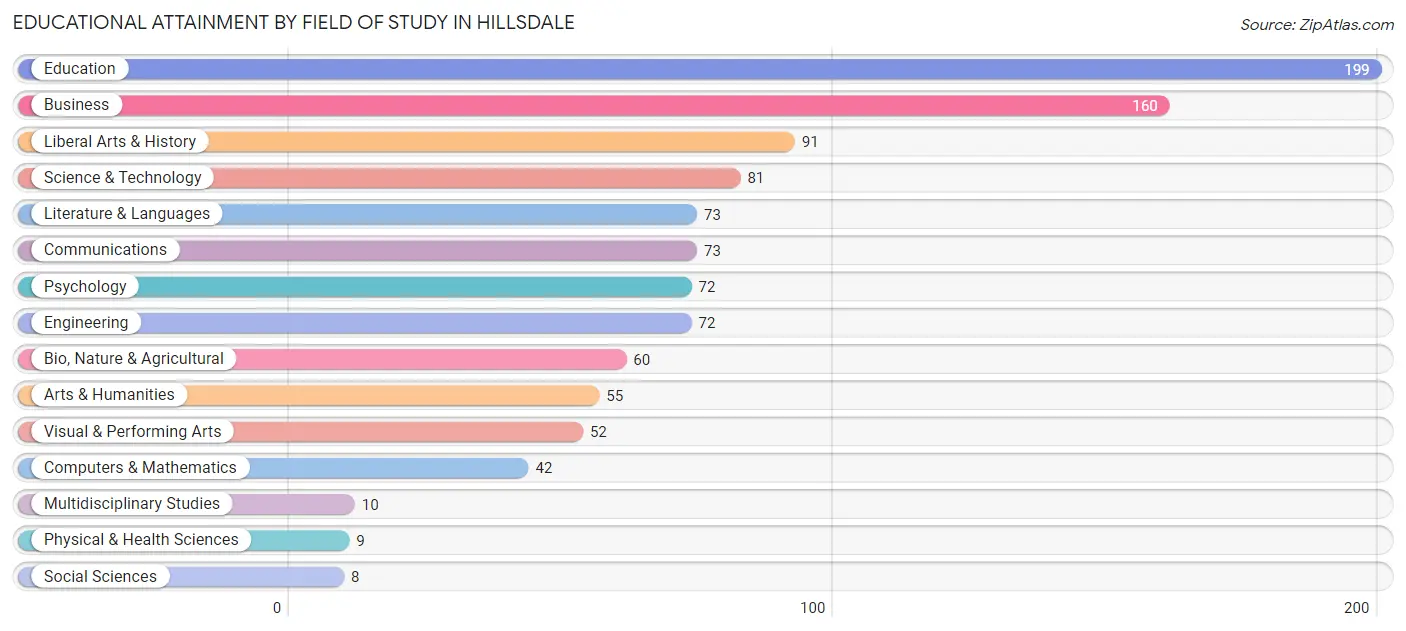
Educational Attainment by Field of Study in Hillsdale
Education (199 | 18.8%), business (160 | 15.1%), liberal arts & history (91 | 8.6%), science & technology (81 | 7.7%), and literature & languages (73 | 6.9%) are the most common fields of study among 1,057 individuals in Hillsdale who have obtained a bachelor's degree or higher.
| Field of Study | # Graduates | % Graduates |
| Computers & Mathematics | 42 | 4.0% |
| Bio, Nature & Agricultural | 60 | 5.7% |
| Physical & Health Sciences | 9 | 0.9% |
| Psychology | 72 | 6.8% |
| Social Sciences | 8 | 0.8% |
| Engineering | 72 | 6.8% |
| Multidisciplinary Studies | 10 | 0.9% |
| Science & Technology | 81 | 7.7% |
| Business | 160 | 15.1% |
| Education | 199 | 18.8% |
| Literature & Languages | 73 | 6.9% |
| Liberal Arts & History | 91 | 8.6% |
| Visual & Performing Arts | 52 | 4.9% |
| Communications | 73 | 6.9% |
| Arts & Humanities | 55 | 5.2% |
| Total | 1,057 | 100.0% |
Transportation & Commute in Hillsdale
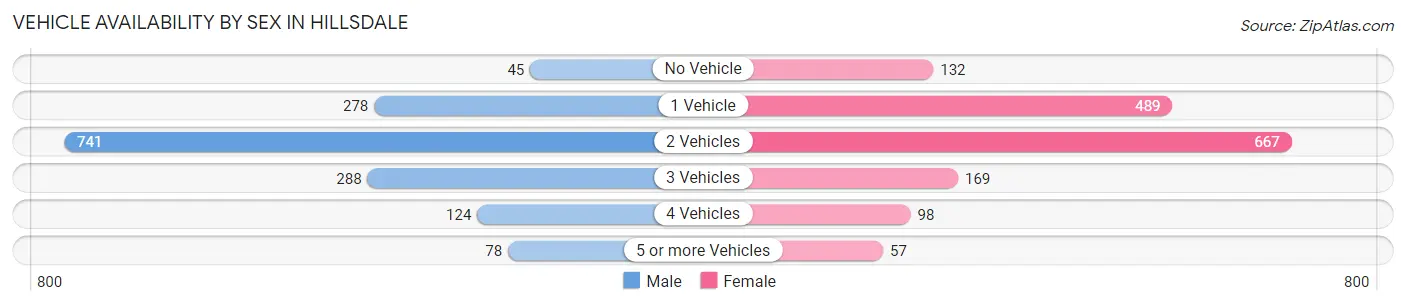
Vehicle Availability by Sex in Hillsdale
The most prevalent vehicle ownership categories in Hillsdale are males with 2 vehicles (741, accounting for 47.7%) and females with 2 vehicles (667, making up 46.0%).
| Vehicles Available | Male | Female |
| No Vehicle | 45 (2.9%) | 132 (8.2%) |
| 1 Vehicle | 278 (17.9%) | 489 (30.3%) |
| 2 Vehicles | 741 (47.7%) | 667 (41.4%) |
| 3 Vehicles | 288 (18.5%) | 169 (10.5%) |
| 4 Vehicles | 124 (8.0%) | 98 (6.1%) |
| 5 or more Vehicles | 78 (5.0%) | 57 (3.5%) |
| Total | 1,554 (100.0%) | 1,612 (100.0%) |
Commute Time in Hillsdale
The most frequently occuring commute durations in Hillsdale are 5 to 9 minutes (1,094 commuters, 32.1%), 10 to 14 minutes (607 commuters, 17.8%), and less than 5 minutes (447 commuters, 13.1%).
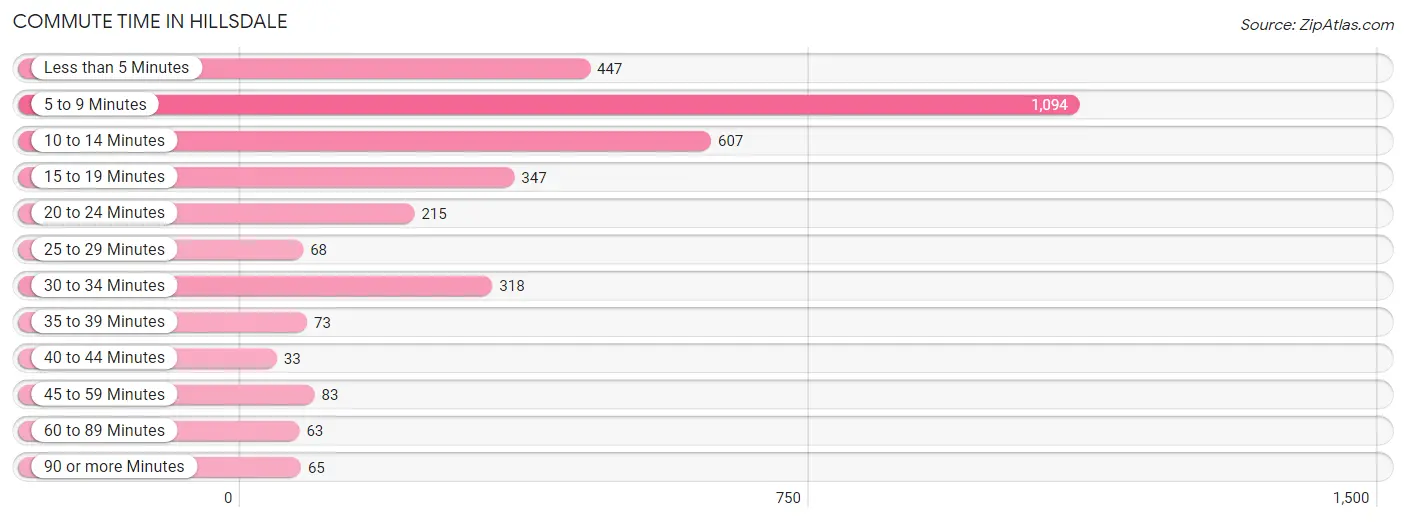
| Commute Time | # Commuters | % Commuters |
| Less than 5 Minutes | 447 | 13.1% |
| 5 to 9 Minutes | 1,094 | 32.1% |
| 10 to 14 Minutes | 607 | 17.8% |
| 15 to 19 Minutes | 347 | 10.2% |
| 20 to 24 Minutes | 215 | 6.3% |
| 25 to 29 Minutes | 68 | 2.0% |
| 30 to 34 Minutes | 318 | 9.3% |
| 35 to 39 Minutes | 73 | 2.1% |
| 40 to 44 Minutes | 33 | 1.0% |
| 45 to 59 Minutes | 83 | 2.4% |
| 60 to 89 Minutes | 63 | 1.8% |
| 90 or more Minutes | 65 | 1.9% |
Commute Time by Sex in Hillsdale
The most common commute times in Hillsdale are 5 to 9 minutes (563 commuters, 32.0%) for males and 5 to 9 minutes (531 commuters, 32.1%) for females.
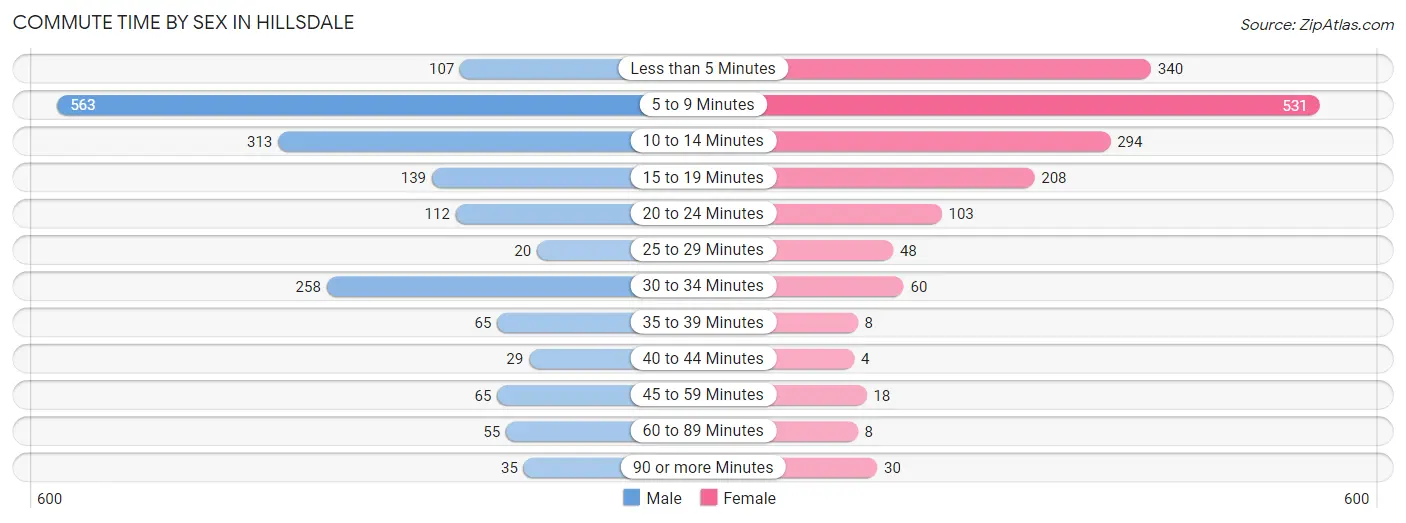
| Commute Time | Male | Female |
| Less than 5 Minutes | 107 (6.1%) | 340 (20.6%) |
| 5 to 9 Minutes | 563 (32.0%) | 531 (32.1%) |
| 10 to 14 Minutes | 313 (17.8%) | 294 (17.8%) |
| 15 to 19 Minutes | 139 (7.9%) | 208 (12.6%) |
| 20 to 24 Minutes | 112 (6.4%) | 103 (6.2%) |
| 25 to 29 Minutes | 20 (1.1%) | 48 (2.9%) |
| 30 to 34 Minutes | 258 (14.6%) | 60 (3.6%) |
| 35 to 39 Minutes | 65 (3.7%) | 8 (0.5%) |
| 40 to 44 Minutes | 29 (1.7%) | 4 (0.2%) |
| 45 to 59 Minutes | 65 (3.7%) | 18 (1.1%) |
| 60 to 89 Minutes | 55 (3.1%) | 8 (0.5%) |
| 90 or more Minutes | 35 (2.0%) | 30 (1.8%) |
Time of Departure to Work by Sex in Hillsdale
The most frequent times of departure to work in Hillsdale are 12:00 PM to 3:59 PM (449, 25.5%) for males and 7:30 AM to 7:59 AM (352, 21.3%) for females.
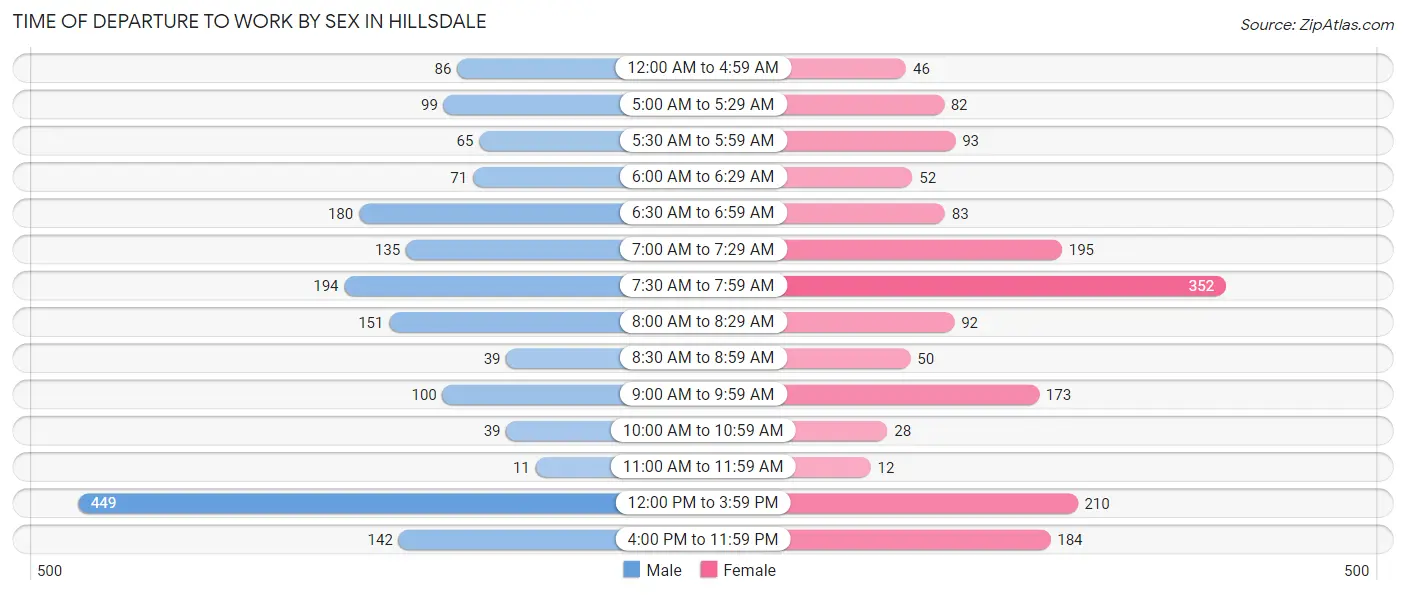
| Time of Departure | Male | Female |
| 12:00 AM to 4:59 AM | 86 (4.9%) | 46 (2.8%) |
| 5:00 AM to 5:29 AM | 99 (5.6%) | 82 (5.0%) |
| 5:30 AM to 5:59 AM | 65 (3.7%) | 93 (5.6%) |
| 6:00 AM to 6:29 AM | 71 (4.0%) | 52 (3.2%) |
| 6:30 AM to 6:59 AM | 180 (10.2%) | 83 (5.0%) |
| 7:00 AM to 7:29 AM | 135 (7.7%) | 195 (11.8%) |
| 7:30 AM to 7:59 AM | 194 (11.0%) | 352 (21.3%) |
| 8:00 AM to 8:29 AM | 151 (8.6%) | 92 (5.6%) |
| 8:30 AM to 8:59 AM | 39 (2.2%) | 50 (3.0%) |
| 9:00 AM to 9:59 AM | 100 (5.7%) | 173 (10.5%) |
| 10:00 AM to 10:59 AM | 39 (2.2%) | 28 (1.7%) |
| 11:00 AM to 11:59 AM | 11 (0.6%) | 12 (0.7%) |
| 12:00 PM to 3:59 PM | 449 (25.5%) | 210 (12.7%) |
| 4:00 PM to 11:59 PM | 142 (8.1%) | 184 (11.1%) |
| Total | 1,761 (100.0%) | 1,652 (100.0%) |
Housing Occupancy in Hillsdale
Occupancy by Ownership in Hillsdale
Of the total 2,720 dwellings in Hillsdale, owner-occupied units account for 1,395 (51.3%), while renter-occupied units make up 1,325 (48.7%).
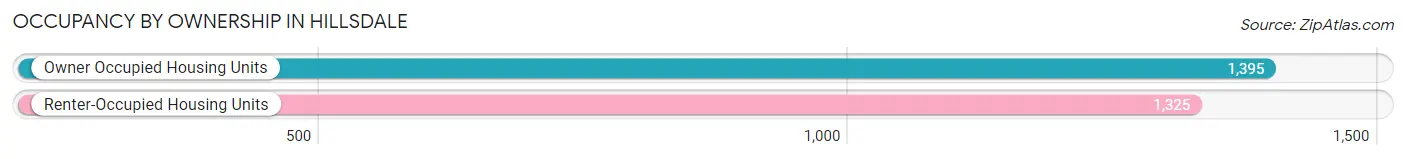
| Occupancy | # Housing Units | % Housing Units |
| Owner Occupied Housing Units | 1,395 | 51.3% |
| Renter-Occupied Housing Units | 1,325 | 48.7% |
| Total Occupied Housing Units | 2,720 | 100.0% |
Occupancy by Household Size in Hillsdale
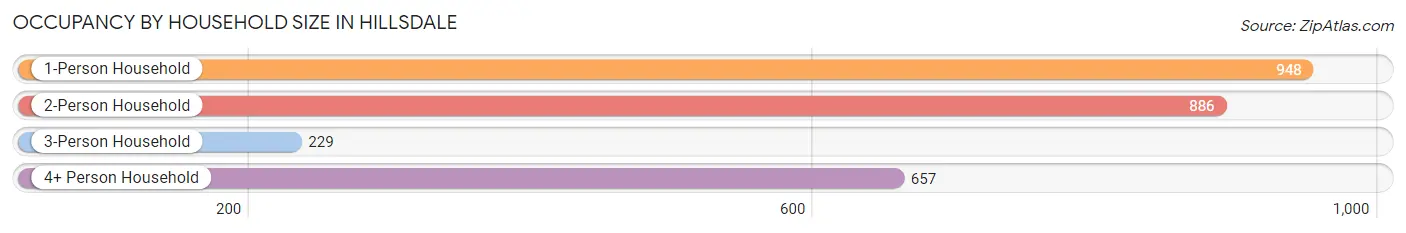
| Household Size | # Housing Units | % Housing Units |
| 1-Person Household | 948 | 34.8% |
| 2-Person Household | 886 | 32.6% |
| 3-Person Household | 229 | 8.4% |
| 4+ Person Household | 657 | 24.1% |
| Total Housing Units | 2,720 | 100.0% |
Occupancy by Ownership by Household Size in Hillsdale
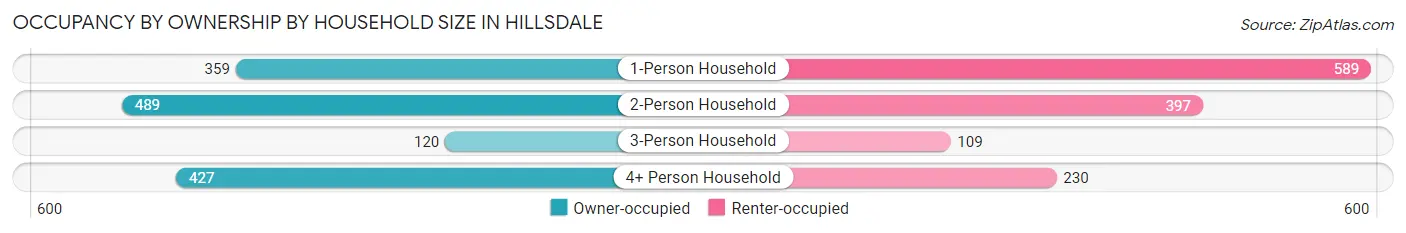
| Household Size | Owner-occupied | Renter-occupied |
| 1-Person Household | 359 (37.9%) | 589 (62.1%) |
| 2-Person Household | 489 (55.2%) | 397 (44.8%) |
| 3-Person Household | 120 (52.4%) | 109 (47.6%) |
| 4+ Person Household | 427 (65.0%) | 230 (35.0%) |
| Total Housing Units | 1,395 (51.3%) | 1,325 (48.7%) |
Occupancy by Educational Attainment in Hillsdale
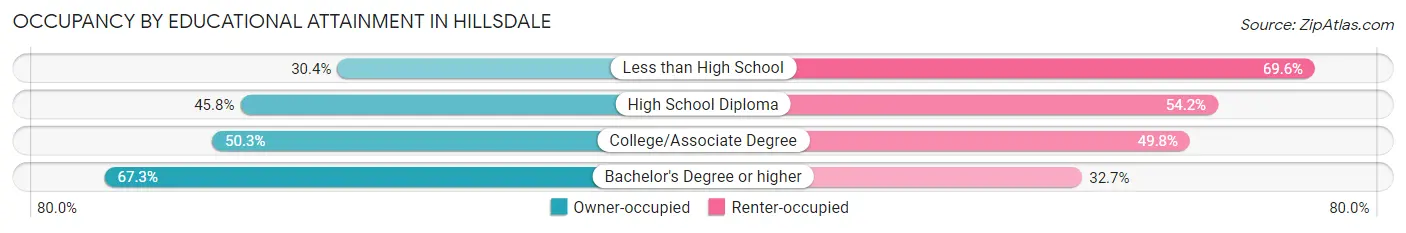
| Household Size | Owner-occupied | Renter-occupied |
| Less than High School | 66 (30.4%) | 151 (69.6%) |
| High School Diploma | 463 (45.8%) | 548 (54.2%) |
| College/Associate Degree | 407 (50.2%) | 403 (49.7%) |
| Bachelor's Degree or higher | 459 (67.3%) | 223 (32.7%) |
Occupancy by Age of Householder in Hillsdale
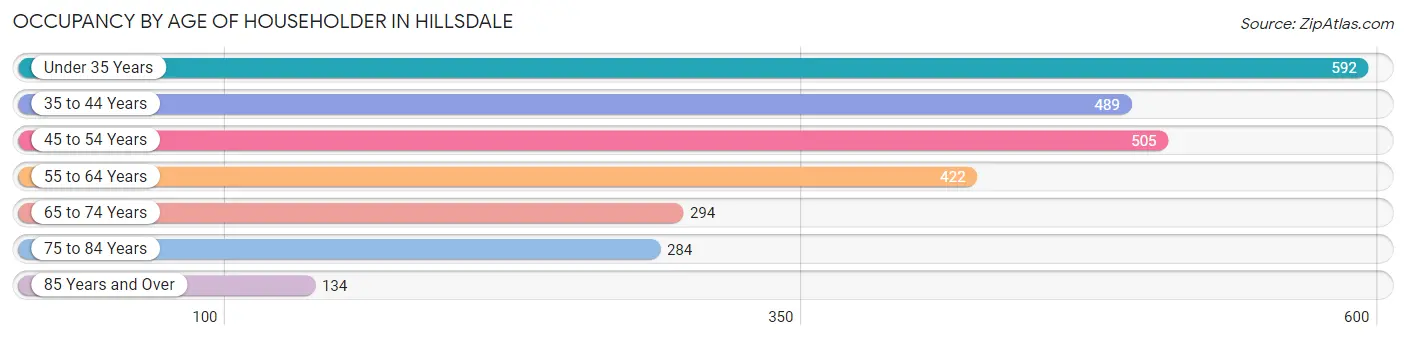
| Age Bracket | # Households | % Households |
| Under 35 Years | 592 | 21.8% |
| 35 to 44 Years | 489 | 18.0% |
| 45 to 54 Years | 505 | 18.6% |
| 55 to 64 Years | 422 | 15.5% |
| 65 to 74 Years | 294 | 10.8% |
| 75 to 84 Years | 284 | 10.4% |
| 85 Years and Over | 134 | 4.9% |
| Total | 2,720 | 100.0% |
Housing Finances in Hillsdale
Median Income by Occupancy in Hillsdale
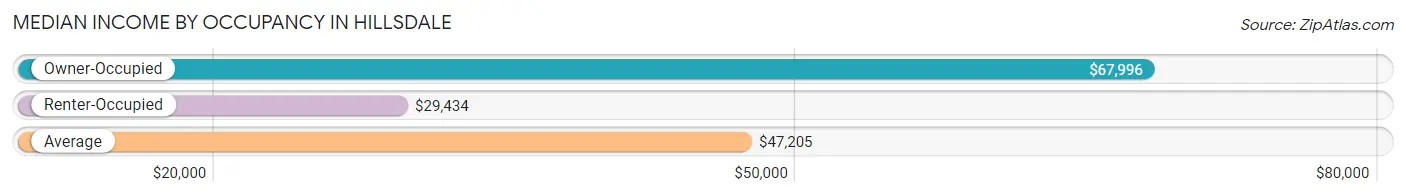
| Occupancy Type | # Households | Median Income |
| Owner-Occupied | 1,395 (51.3%) | $67,996 |
| Renter-Occupied | 1,325 (48.7%) | $29,434 |
| Average | 2,720 (100.0%) | $47,205 |
Occupancy by Householder Income Bracket in Hillsdale
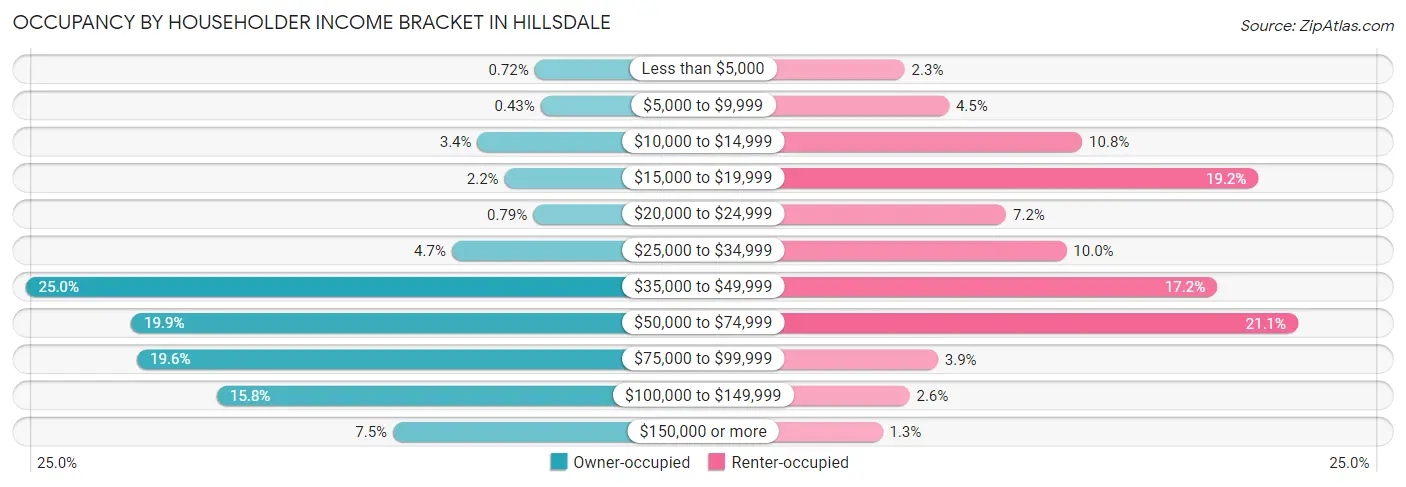
| Income Bracket | Owner-occupied | Renter-occupied |
| Less than $5,000 | 10 (0.7%) | 31 (2.3%) |
| $5,000 to $9,999 | 6 (0.4%) | 59 (4.4%) |
| $10,000 to $14,999 | 48 (3.4%) | 143 (10.8%) |
| $15,000 to $19,999 | 30 (2.1%) | 254 (19.2%) |
| $20,000 to $24,999 | 11 (0.8%) | 95 (7.2%) |
| $25,000 to $34,999 | 65 (4.7%) | 133 (10.0%) |
| $35,000 to $49,999 | 348 (24.9%) | 228 (17.2%) |
| $50,000 to $74,999 | 278 (19.9%) | 279 (21.1%) |
| $75,000 to $99,999 | 274 (19.6%) | 52 (3.9%) |
| $100,000 to $149,999 | 221 (15.8%) | 34 (2.6%) |
| $150,000 or more | 104 (7.5%) | 17 (1.3%) |
| Total | 1,395 (100.0%) | 1,325 (100.0%) |
Monthly Housing Cost Tiers in Hillsdale
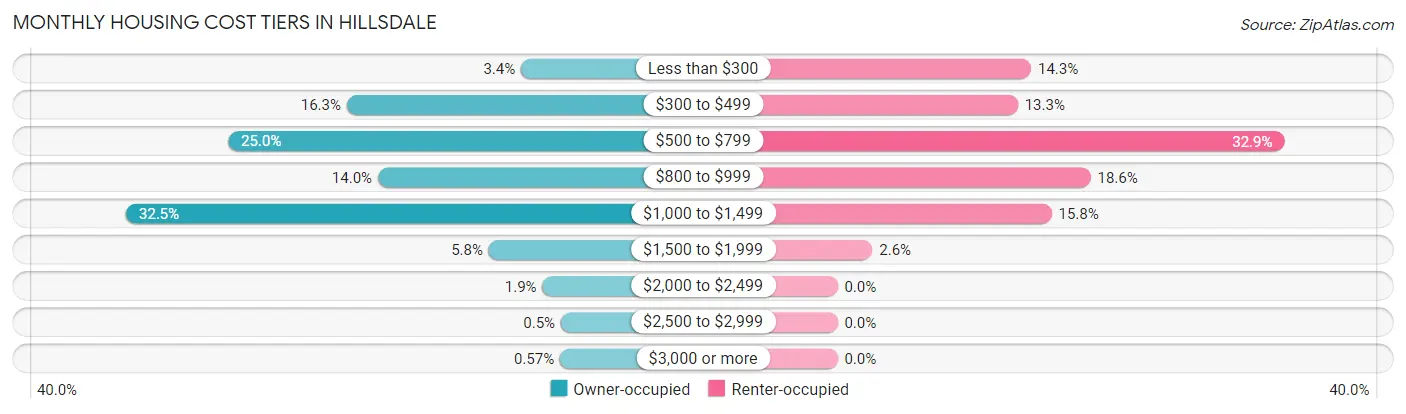
| Monthly Cost | Owner-occupied | Renter-occupied |
| Less than $300 | 48 (3.4%) | 189 (14.3%) |
| $300 to $499 | 227 (16.3%) | 176 (13.3%) |
| $500 to $799 | 349 (25.0%) | 436 (32.9%) |
| $800 to $999 | 195 (14.0%) | 247 (18.6%) |
| $1,000 to $1,499 | 454 (32.5%) | 209 (15.8%) |
| $1,500 to $1,999 | 81 (5.8%) | 34 (2.6%) |
| $2,000 to $2,499 | 26 (1.9%) | 0 (0.0%) |
| $2,500 to $2,999 | 7 (0.5%) | 0 (0.0%) |
| $3,000 or more | 8 (0.6%) | 0 (0.0%) |
| Total | 1,395 (100.0%) | 1,325 (100.0%) |
Physical Housing Characteristics in Hillsdale
Housing Structures in Hillsdale
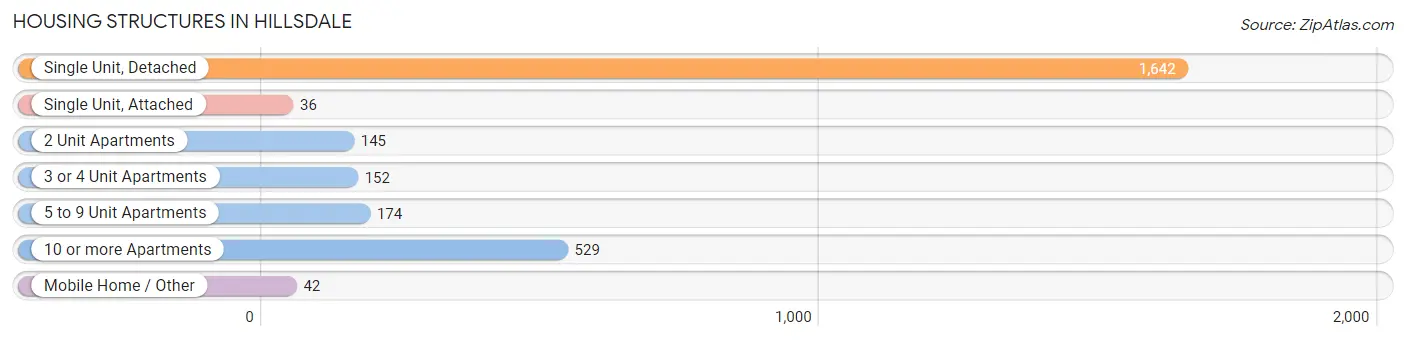
| Structure Type | # Housing Units | % Housing Units |
| Single Unit, Detached | 1,642 | 60.4% |
| Single Unit, Attached | 36 | 1.3% |
| 2 Unit Apartments | 145 | 5.3% |
| 3 or 4 Unit Apartments | 152 | 5.6% |
| 5 to 9 Unit Apartments | 174 | 6.4% |
| 10 or more Apartments | 529 | 19.5% |
| Mobile Home / Other | 42 | 1.5% |
| Total | 2,720 | 100.0% |
Housing Structures by Occupancy in Hillsdale
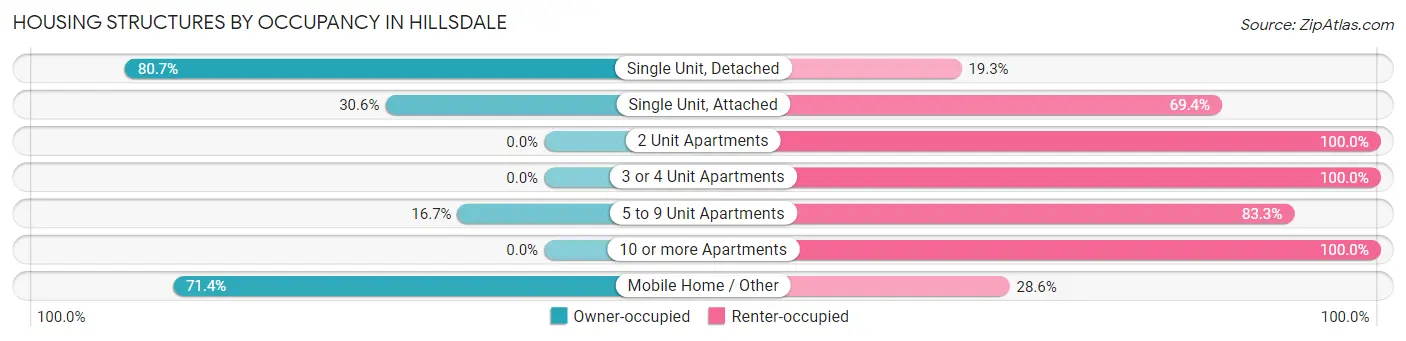
| Structure Type | Owner-occupied | Renter-occupied |
| Single Unit, Detached | 1,325 (80.7%) | 317 (19.3%) |
| Single Unit, Attached | 11 (30.6%) | 25 (69.4%) |
| 2 Unit Apartments | 0 (0.0%) | 145 (100.0%) |
| 3 or 4 Unit Apartments | 0 (0.0%) | 152 (100.0%) |
| 5 to 9 Unit Apartments | 29 (16.7%) | 145 (83.3%) |
| 10 or more Apartments | 0 (0.0%) | 529 (100.0%) |
| Mobile Home / Other | 30 (71.4%) | 12 (28.6%) |
| Total | 1,395 (51.3%) | 1,325 (48.7%) |
Housing Structures by Number of Rooms in Hillsdale
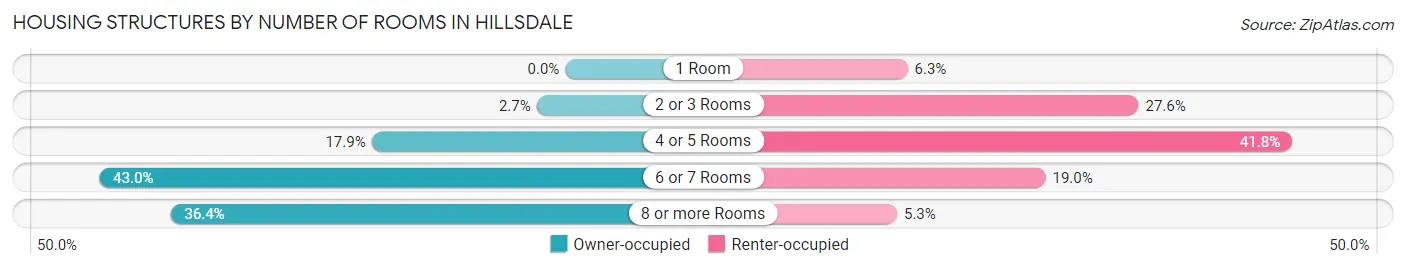
| Number of Rooms | Owner-occupied | Renter-occupied |
| 1 Room | 0 (0.0%) | 83 (6.3%) |
| 2 or 3 Rooms | 37 (2.6%) | 366 (27.6%) |
| 4 or 5 Rooms | 250 (17.9%) | 554 (41.8%) |
| 6 or 7 Rooms | 600 (43.0%) | 252 (19.0%) |
| 8 or more Rooms | 508 (36.4%) | 70 (5.3%) |
| Total | 1,395 (100.0%) | 1,325 (100.0%) |
Housing Structure by Heating Type in Hillsdale
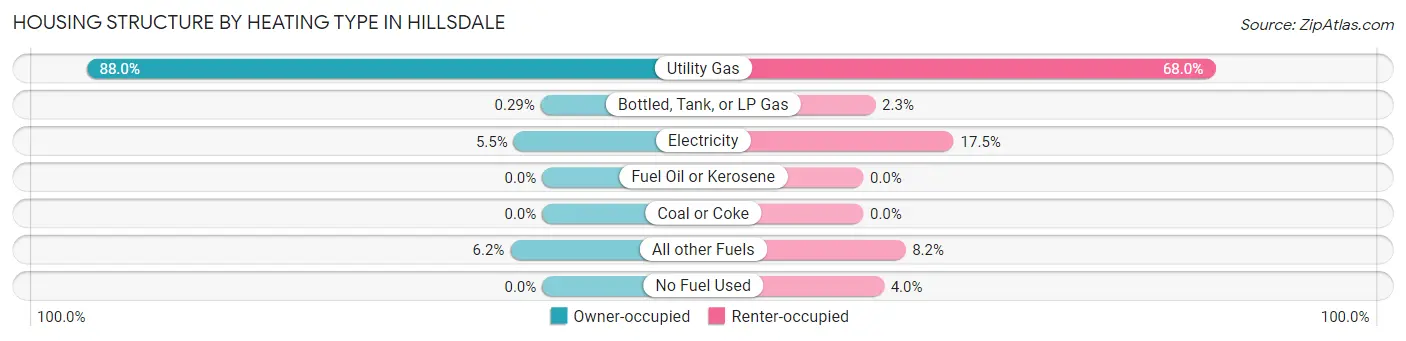
| Heating Type | Owner-occupied | Renter-occupied |
| Utility Gas | 1,228 (88.0%) | 901 (68.0%) |
| Bottled, Tank, or LP Gas | 4 (0.3%) | 31 (2.3%) |
| Electricity | 77 (5.5%) | 232 (17.5%) |
| Fuel Oil or Kerosene | 0 (0.0%) | 0 (0.0%) |
| Coal or Coke | 0 (0.0%) | 0 (0.0%) |
| All other Fuels | 86 (6.2%) | 108 (8.2%) |
| No Fuel Used | 0 (0.0%) | 53 (4.0%) |
| Total | 1,395 (100.0%) | 1,325 (100.0%) |
Household Vehicle Usage in Hillsdale
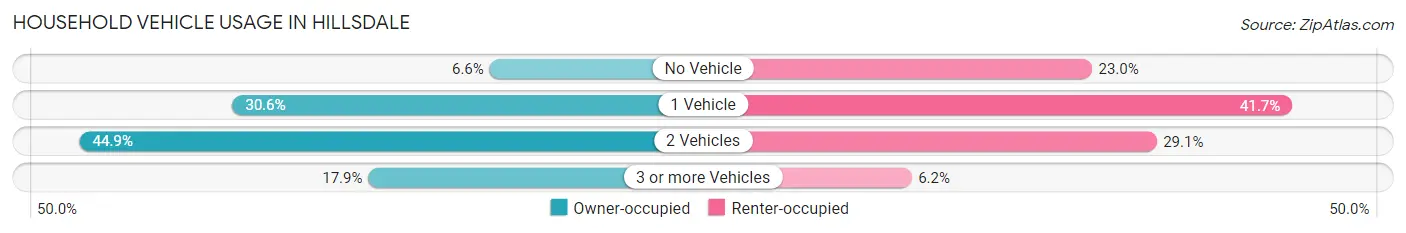
| Vehicles per Household | Owner-occupied | Renter-occupied |
| No Vehicle | 92 (6.6%) | 305 (23.0%) |
| 1 Vehicle | 427 (30.6%) | 553 (41.7%) |
| 2 Vehicles | 626 (44.9%) | 385 (29.1%) |
| 3 or more Vehicles | 250 (17.9%) | 82 (6.2%) |
| Total | 1,395 (100.0%) | 1,325 (100.0%) |
Real Estate & Mortgages in Hillsdale
Real Estate and Mortgage Overview in Hillsdale
| Characteristic | Without Mortgage | With Mortgage |
| Housing Units | 441 | 954 |
| Median Property Value | $134,400 | $113,100 |
| Median Household Income | $71,615 | $62 |
| Monthly Housing Costs | $462 | $8 |
| Real Estate Taxes | $1,746 | $60 |
Property Value by Mortgage Status in Hillsdale
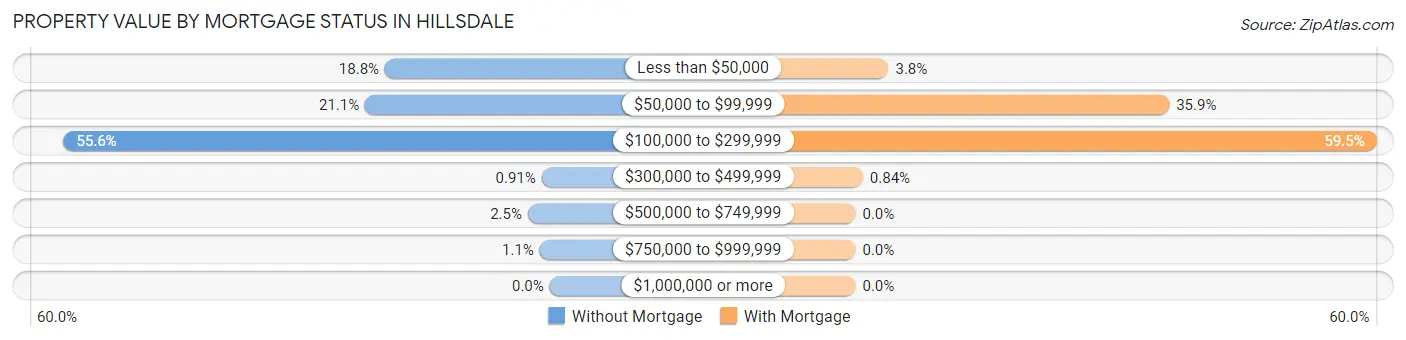
| Property Value | Without Mortgage | With Mortgage |
| Less than $50,000 | 83 (18.8%) | 36 (3.8%) |
| $50,000 to $99,999 | 93 (21.1%) | 342 (35.8%) |
| $100,000 to $299,999 | 245 (55.6%) | 568 (59.5%) |
| $300,000 to $499,999 | 4 (0.9%) | 8 (0.8%) |
| $500,000 to $749,999 | 11 (2.5%) | 0 (0.0%) |
| $750,000 to $999,999 | 5 (1.1%) | 0 (0.0%) |
| $1,000,000 or more | 0 (0.0%) | 0 (0.0%) |
| Total | 441 (100.0%) | 954 (100.0%) |
Household Income by Mortgage Status in Hillsdale
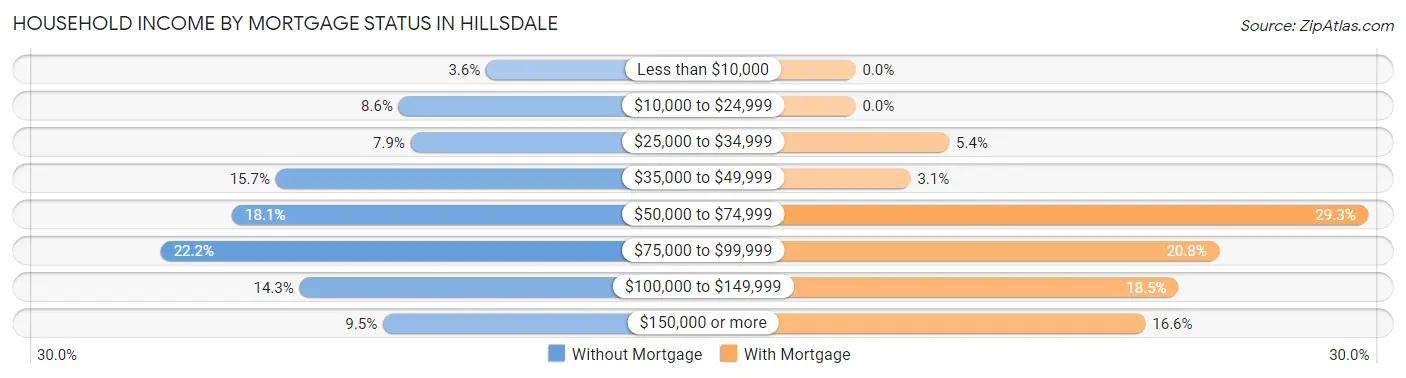
| Household Income | Without Mortgage | With Mortgage |
| Less than $10,000 | 16 (3.6%) | 0 (0.0%) |
| $10,000 to $24,999 | 38 (8.6%) | 0 (0.0%) |
| $25,000 to $34,999 | 35 (7.9%) | 51 (5.3%) |
| $35,000 to $49,999 | 69 (15.7%) | 30 (3.1%) |
| $50,000 to $74,999 | 80 (18.1%) | 279 (29.2%) |
| $75,000 to $99,999 | 98 (22.2%) | 198 (20.7%) |
| $100,000 to $149,999 | 63 (14.3%) | 176 (18.4%) |
| $150,000 or more | 42 (9.5%) | 158 (16.6%) |
| Total | 441 (100.0%) | 954 (100.0%) |
Property Value to Household Income Ratio in Hillsdale
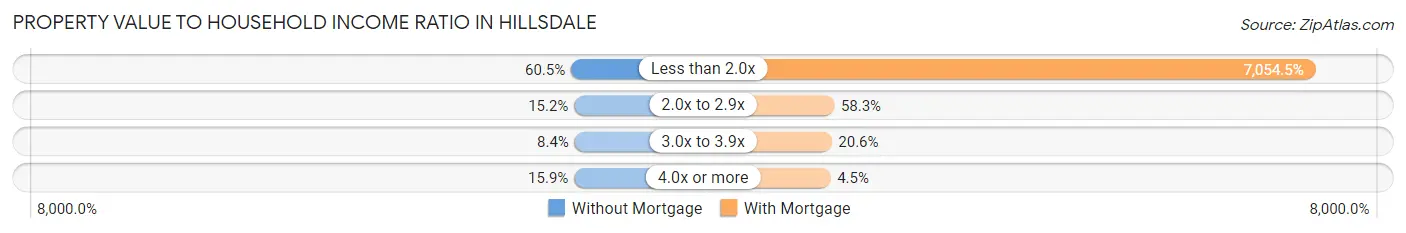
| Value-to-Income Ratio | Without Mortgage | With Mortgage |
| Less than 2.0x | 267 (60.5%) | 67,300 (7,054.5%) |
| 2.0x to 2.9x | 67 (15.2%) | 556 (58.3%) |
| 3.0x to 3.9x | 37 (8.4%) | 196 (20.5%) |
| 4.0x or more | 70 (15.9%) | 43 (4.5%) |
| Total | 441 (100.0%) | 954 (100.0%) |
Real Estate Taxes by Mortgage Status in Hillsdale
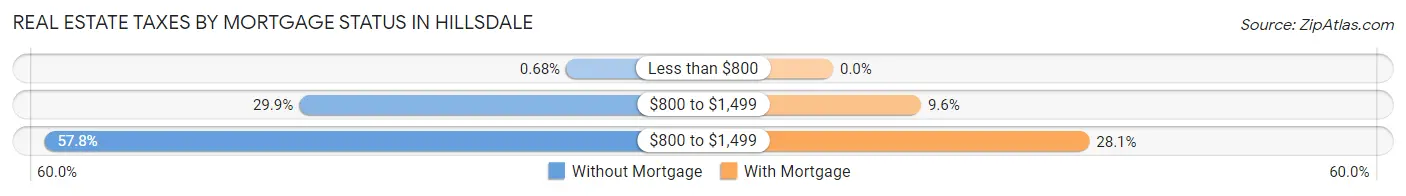
| Property Taxes | Without Mortgage | With Mortgage |
| Less than $800 | 3 (0.7%) | 0 (0.0%) |
| $800 to $1,499 | 132 (29.9%) | 92 (9.6%) |
| $800 to $1,499 | 255 (57.8%) | 268 (28.1%) |
| Total | 441 (100.0%) | 954 (100.0%) |
Health & Disability in Hillsdale
Health Insurance Coverage by Age in Hillsdale
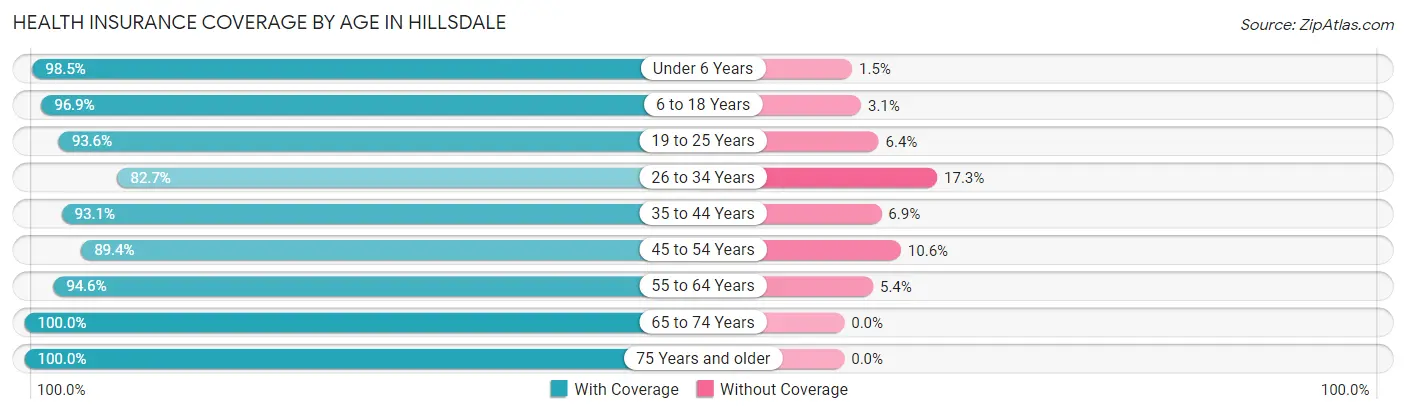
| Age Bracket | With Coverage | Without Coverage |
| Under 6 Years | 406 (98.5%) | 6 (1.5%) |
| 6 to 18 Years | 1,457 (96.9%) | 47 (3.1%) |
| 19 to 25 Years | 1,713 (93.6%) | 117 (6.4%) |
| 26 to 34 Years | 511 (82.7%) | 107 (17.3%) |
| 35 to 44 Years | 901 (93.1%) | 67 (6.9%) |
| 45 to 54 Years | 644 (89.4%) | 76 (10.6%) |
| 55 to 64 Years | 706 (94.6%) | 40 (5.4%) |
| 65 to 74 Years | 462 (100.0%) | 0 (0.0%) |
| 75 Years and older | 490 (100.0%) | 0 (0.0%) |
| Total | 7,290 (94.1%) | 460 (5.9%) |
Health Insurance Coverage by Citizenship Status in Hillsdale
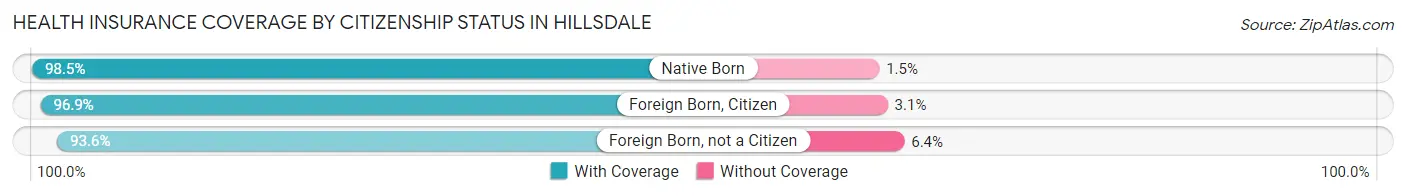
| Citizenship Status | With Coverage | Without Coverage |
| Native Born | 406 (98.5%) | 6 (1.5%) |
| Foreign Born, Citizen | 1,457 (96.9%) | 47 (3.1%) |
| Foreign Born, not a Citizen | 1,713 (93.6%) | 117 (6.4%) |
Health Insurance Coverage by Household Income in Hillsdale
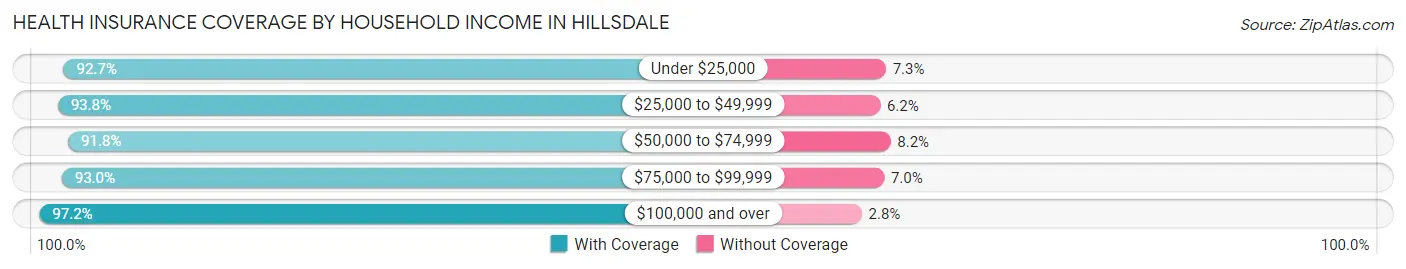
| Household Income | With Coverage | Without Coverage |
| Under $25,000 | 991 (92.7%) | 78 (7.3%) |
| $25,000 to $49,999 | 1,919 (93.8%) | 127 (6.2%) |
| $50,000 to $74,999 | 1,261 (91.8%) | 112 (8.2%) |
| $75,000 to $99,999 | 868 (93.0%) | 65 (7.0%) |
| $100,000 and over | 1,191 (97.2%) | 34 (2.8%) |
Public vs Private Health Insurance Coverage by Age in Hillsdale
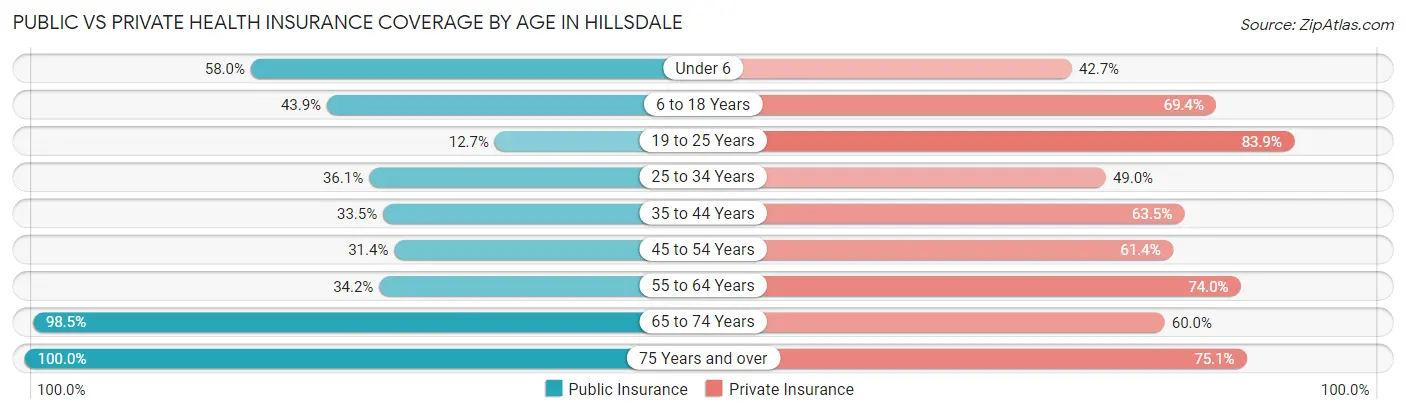
| Age Bracket | Public Insurance | Private Insurance |
| Under 6 | 239 (58.0%) | 176 (42.7%) |
| 6 to 18 Years | 660 (43.9%) | 1,044 (69.4%) |
| 19 to 25 Years | 233 (12.7%) | 1,535 (83.9%) |
| 25 to 34 Years | 223 (36.1%) | 303 (49.0%) |
| 35 to 44 Years | 324 (33.5%) | 615 (63.5%) |
| 45 to 54 Years | 226 (31.4%) | 442 (61.4%) |
| 55 to 64 Years | 255 (34.2%) | 552 (74.0%) |
| 65 to 74 Years | 455 (98.5%) | 277 (60.0%) |
| 75 Years and over | 490 (100.0%) | 368 (75.1%) |
| Total | 3,105 (40.1%) | 5,312 (68.5%) |
Disability Status by Sex by Age in Hillsdale
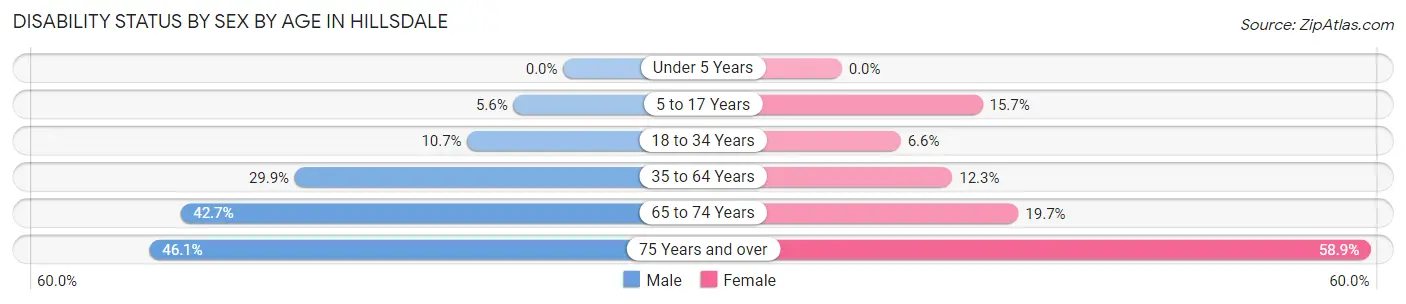
| Age Bracket | Male | Female |
| Under 5 Years | 0 (0.0%) | 0 (0.0%) |
| 5 to 17 Years | 39 (5.6%) | 94 (15.7%) |
| 18 to 34 Years | 153 (10.7%) | 88 (6.6%) |
| 35 to 64 Years | 344 (29.9%) | 158 (12.3%) |
| 65 to 74 Years | 93 (42.7%) | 48 (19.7%) |
| 75 Years and over | 71 (46.1%) | 198 (58.9%) |
Disability Class by Sex by Age in Hillsdale
Disability Class: Hearing Difficulty
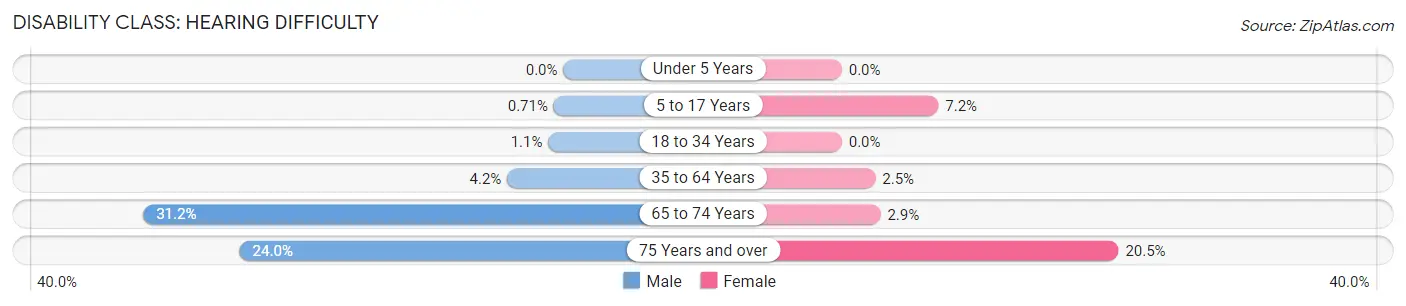
| Age Bracket | Male | Female |
| Under 5 Years | 0 (0.0%) | 0 (0.0%) |
| 5 to 17 Years | 5 (0.7%) | 43 (7.2%) |
| 18 to 34 Years | 16 (1.1%) | 0 (0.0%) |
| 35 to 64 Years | 48 (4.2%) | 32 (2.5%) |
| 65 to 74 Years | 68 (31.2%) | 7 (2.9%) |
| 75 Years and over | 37 (24.0%) | 69 (20.5%) |
Disability Class: Vision Difficulty
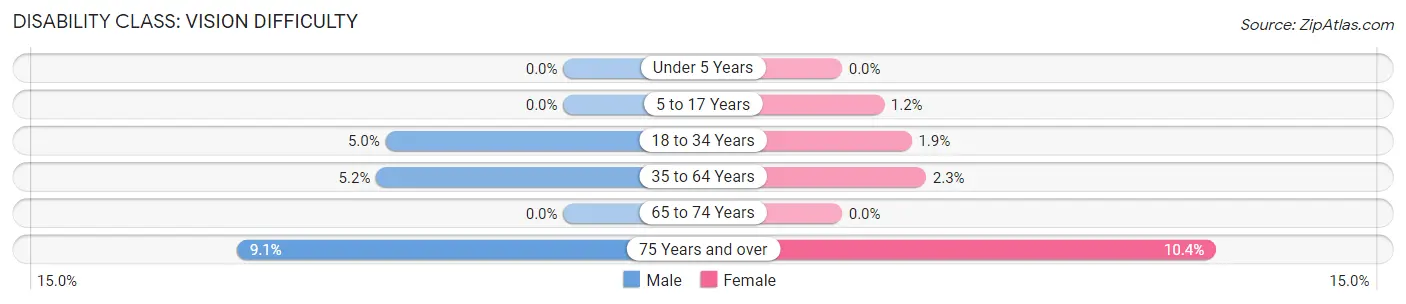
| Age Bracket | Male | Female |
| Under 5 Years | 0 (0.0%) | 0 (0.0%) |
| 5 to 17 Years | 0 (0.0%) | 7 (1.2%) |
| 18 to 34 Years | 71 (5.0%) | 26 (1.9%) |
| 35 to 64 Years | 60 (5.2%) | 30 (2.3%) |
| 65 to 74 Years | 0 (0.0%) | 0 (0.0%) |
| 75 Years and over | 14 (9.1%) | 35 (10.4%) |
Disability Class: Cognitive Difficulty
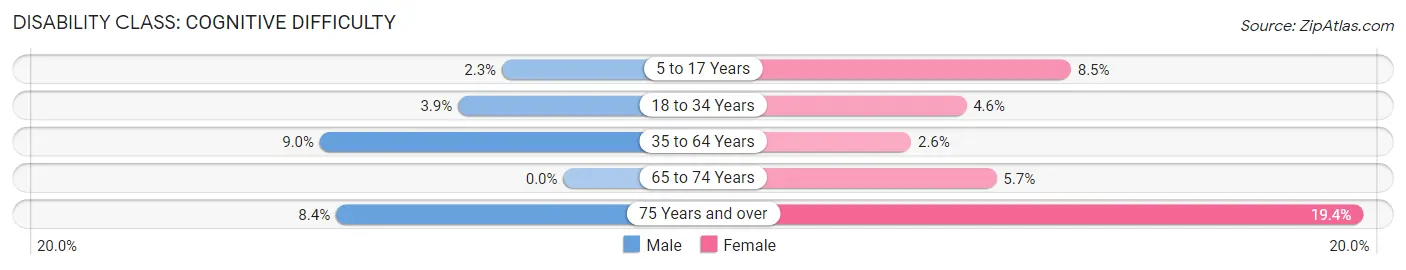
| Age Bracket | Male | Female |
| 5 to 17 Years | 16 (2.3%) | 51 (8.5%) |
| 18 to 34 Years | 56 (3.9%) | 62 (4.6%) |
| 35 to 64 Years | 104 (9.0%) | 33 (2.6%) |
| 65 to 74 Years | 0 (0.0%) | 14 (5.7%) |
| 75 Years and over | 13 (8.4%) | 65 (19.4%) |
Disability Class: Ambulatory Difficulty
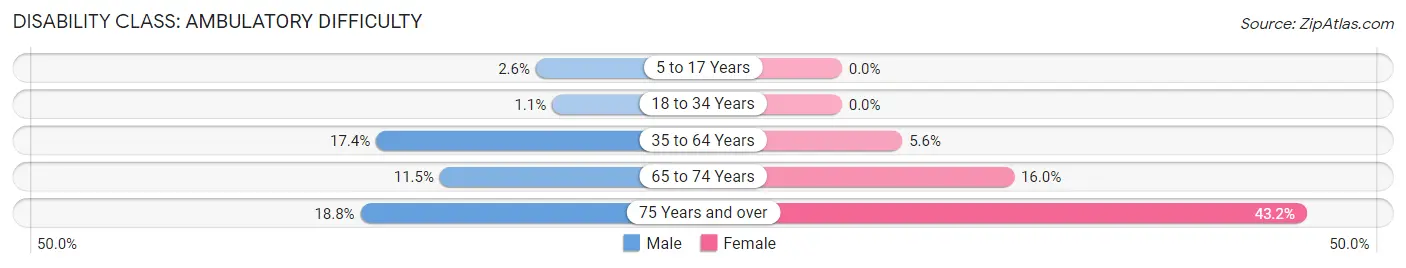
| Age Bracket | Male | Female |
| 5 to 17 Years | 18 (2.6%) | 0 (0.0%) |
| 18 to 34 Years | 15 (1.1%) | 0 (0.0%) |
| 35 to 64 Years | 200 (17.4%) | 72 (5.6%) |
| 65 to 74 Years | 25 (11.5%) | 39 (16.0%) |
| 75 Years and over | 29 (18.8%) | 145 (43.1%) |
Disability Class: Self-Care Difficulty
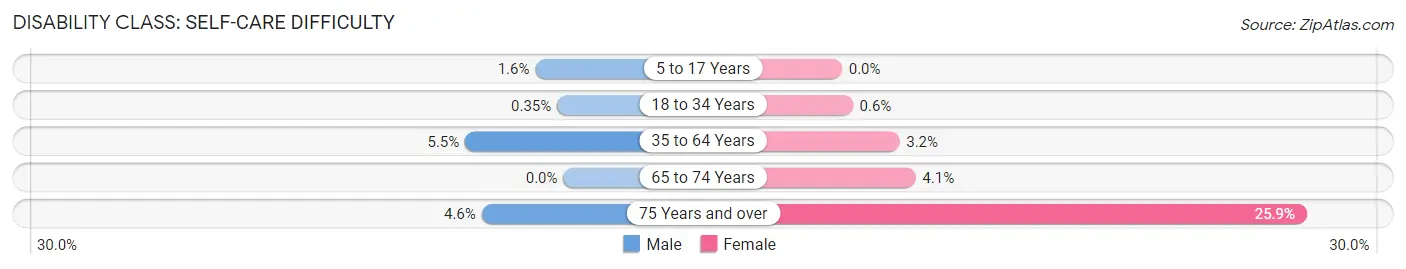
| Age Bracket | Male | Female |
| 5 to 17 Years | 11 (1.6%) | 0 (0.0%) |
| 18 to 34 Years | 5 (0.4%) | 8 (0.6%) |
| 35 to 64 Years | 63 (5.5%) | 41 (3.2%) |
| 65 to 74 Years | 0 (0.0%) | 10 (4.1%) |
| 75 Years and over | 7 (4.5%) | 87 (25.9%) |
Technology Access in Hillsdale
Computing Device Access in Hillsdale
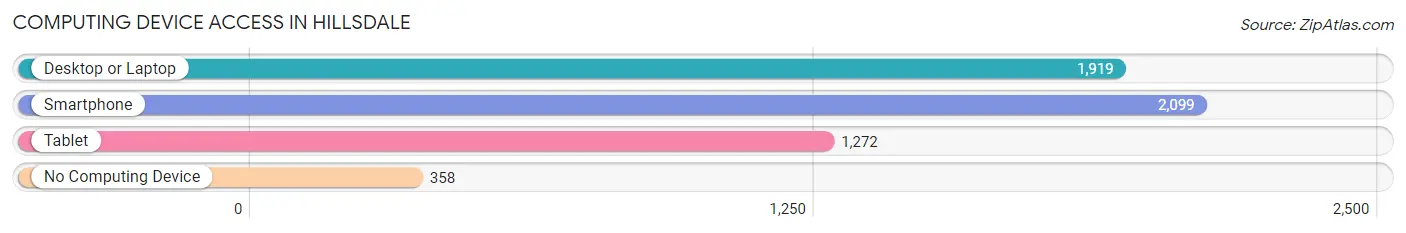
| Device Type | # Households | % Households |
| Desktop or Laptop | 1,919 | 70.6% |
| Smartphone | 2,099 | 77.2% |
| Tablet | 1,272 | 46.8% |
| No Computing Device | 358 | 13.2% |
| Total | 2,720 | 100.0% |
Internet Access in Hillsdale
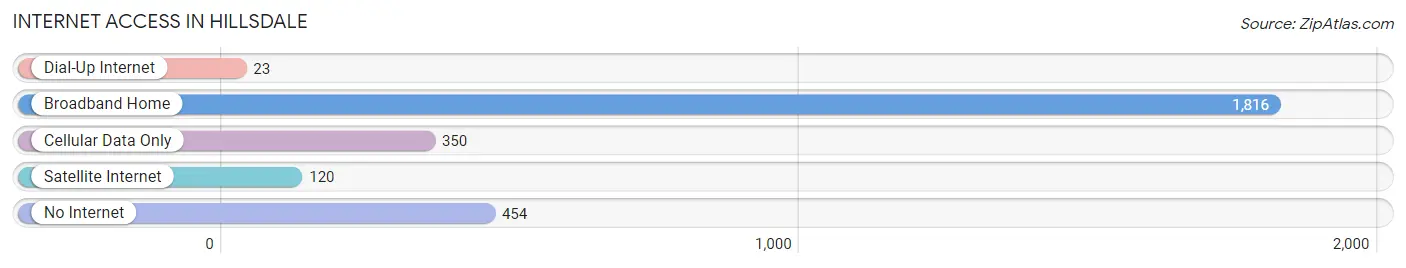
| Internet Type | # Households | % Households |
| Dial-Up Internet | 23 | 0.9% |
| Broadband Home | 1,816 | 66.8% |
| Cellular Data Only | 350 | 12.9% |
| Satellite Internet | 120 | 4.4% |
| No Internet | 454 | 16.7% |
| Total | 2,720 | 100.0% |
Hillsdale Summary
Hillsdale, Michigan is a small city located in the south-central part of the state, about an hour and a half from Detroit. It is the county seat of Hillsdale County and is home to a population of 8,305 people, according to the 2010 census. The city is situated on the banks of the St. Joseph River and is surrounded by rolling hills and farmland.
History
Hillsdale was first settled in 1835 by a group of settlers from New York. The city was named after the nearby hills and was incorporated in 1869. The city quickly grew and became a center of commerce and industry, with several factories and mills being built in the area. The city was also home to a number of educational institutions, including Hillsdale College, which was founded in 1844.
Geography
Hillsdale is located in south-central Michigan, about an hour and a half from Detroit. The city is situated on the banks of the St. Joseph River and is surrounded by rolling hills and farmland. The city has a total area of 4.2 square miles, of which 4.1 square miles is land and 0.1 square miles is water.
Economy
Hillsdale’s economy is largely based on agriculture and manufacturing. The city is home to several factories and mills, including Hillsdale Manufacturing Company, which produces furniture and other wood products. The city is also home to several retail stores, restaurants, and other businesses.
Demographics
According to the 2010 census, Hillsdale has a population of 8,305 people. The racial makeup of the city is 94.2% White, 1.7% African American, 0.3% Native American, 0.7% Asian, 0.1% Pacific Islander, 1.3% from other races, and 1.7% from two or more races. The median household income is $37,917 and the median family income is $45,945. The per capita income is $20,845.
Conclusion
Hillsdale, Michigan is a small city located in the south-central part of the state, about an hour and a half from Detroit. It is the county seat of Hillsdale County and is home to a population of 8,305 people, according to the 2010 census. The city is situated on the banks of the St. Joseph River and is surrounded by rolling hills and farmland. The city’s economy is largely based on agriculture and manufacturing, and it is home to several factories and mills, as well as retail stores, restaurants, and other businesses. The racial makeup of the city is 94.2% White, 1.7% African American, 0.3% Native American, 0.7% Asian, 0.1% Pacific Islander, 1.3% from other races, and 1.7% from two or more races. The median household income is $37,917 and the median family income is $45,945.
Common Questions
What is Per Capita Income in Hillsdale?
Per Capita income in Hillsdale is $22,339.
What is the Median Family Income in Hillsdale?
Median Family Income in Hillsdale is $55,291.
What is the Median Household income in Hillsdale?
Median Household Income in Hillsdale is $47,205.
What is Income or Wage Gap in Hillsdale?
Income or Wage Gap in Hillsdale is 39.2%.
Women in Hillsdale earn 60.8 cents for every dollar earned by a man.
What is Inequality or Gini Index in Hillsdale?
Inequality or Gini Index in Hillsdale is 0.41.
What is the Total Population of Hillsdale?
Total Population of Hillsdale is 8,005.
What is the Total Male Population of Hillsdale?
Total Male Population of Hillsdale is 3,934.
What is the Total Female Population of Hillsdale?
Total Female Population of Hillsdale is 4,071.
What is the Ratio of Males per 100 Females in Hillsdale?
There are 96.63 Males per 100 Females in Hillsdale.
What is the Ratio of Females per 100 Males in Hillsdale?
There are 103.48 Females per 100 Males in Hillsdale.
What is the Median Population Age in Hillsdale?
Median Population Age in Hillsdale is 28.8 Years.
What is the Average Family Size in Hillsdale
Average Family Size in Hillsdale is 3.2 People.
What is the Average Household Size in Hillsdale
Average Household Size in Hillsdale is 2.4 People.
How Large is the Labor Force in Hillsdale?
There are 3,979 People in the Labor Forcein in Hillsdale.
What is the Percentage of People in the Labor Force in Hillsdale?
60.2% of People are in the Labor Force in Hillsdale.
What is the Unemployment Rate in Hillsdale?
Unemployment Rate in Hillsdale is 3.6%.